
Submitted:
02 August 2023
Posted:
04 August 2023
You are already at the latest version
Abstract
How to improve plant tolerance and yield under salt stress is critical for ensuring sufficient food supply since plant survival and agricultural productivity are both affected by salinity. Some evidence has showed that beneficial microorganisms have a high ability to improve plant salt tolerance and increase crop yield. But few studies were involved in effects of halotolerant yeasts on plants under salt stress. In this present research, Meyerozyma guilliermondii, a halotolerant yeast, was inoculated with tomato plants followed by salt treatment of four different NaCl concentrations (0, 100, 200, and 300 mM). Our results showed that inoculation of M. guilliermondii increased the chlorophyll biosynthesis and photosynthetic machinery effectiveness under salt stress, contributing to biomass accumulation. Under salt treatment of 300 mM NaCl, the yeast inoculation significantly increased ascorbate concentrations in leaves, yet showed no effects on levels of glutathione and proline. Antioxidant enzymes were affected differently by the yeast inoculation. It was found that the yeast inoculation increased superoxide dismutase (SOD), catalase (CAT), and peroxidase (POD) activities under 300, 100, and 200 mM NaCl, respectively. Total soluble sugar levels increased in inoculated tomato plant leaves; however, there were no significant differences between different NaCl concentrations. Under 300 mM NaCl, the yeast inoculation significantly decreased H2O2 levels and reduced malondialdehyde levels. All together, our results showed that halotolerant yeast M. guilliermondii inoculation might be a strong candidate for regulating tomato growth under salt stress by increasing ability to scavenge reactive oxygen species and chlorophyll intactness, and by strengthening photosynthetic machinery.
Keywords:
salt stress
; photosynthesis
; antioxidant enzymes
; ROS scavenging
; Meyerozyma guilliermondii
1. Introduction
Saline soils are widely distributed all around the world. It has been assessed that salinity influences about 20% of irrigated land (~ 45 million ha) and ~ 2.1% (~ 32 million ha) of dryland agricultural worldwide [1], and that more than 50% of the cultivated land would be salinized by the year 2050 [2]. Thus, soil salinization has become a significant menace to agricultural activity and ecosystems worldwide [3,4,5]. Soil salinization has been proven to have a deleterious impact on plant physiology, including ion toxicity, physiological drought, oxidative stress, and nutrient insufficiency [6,7]. A large amount of salt in the soil leads to the lower osmotic potential of the root-soil interface than that of the plant root cell interface, which will make it difficult for the plant to absorb water and eventually lead to physiological drought [8,9,10]. In such case, plants close stomata to reduce transpiration; however, this reduces the diffusion of CO2 into leaf tissues as well. Salt stress also causes oxidative stress through the production of reactive oxygen species (ROS) [3]. When ROS accumulates in large amounts, these radicals lead to the peroxidation of bio-membrane lipids, DNA breakage, protein degradation [11]. Therefore, cell activity is affected, thus inhibiting plant growth and development. High soil salinity also leads to a reduction in total chlorophyll concentrations and the degradation of chloroplast structure by minimizing grana [12]. The photosynthetic electron transport rates are also altered by salt stress [13]. Net photosynthetic rates and biomass accumulationare both reduced due to all these changes [14]. Therefore, the agricultural practice should consider limiting the damage caused by salt stress and increasing net photosynthetic rates and biomass accumulation.
Many beneficial microorganisms may increase the tolerance of their host plants tolerance to salt stress, such as arbuscular mycorrhizal fungi [12,15,16,17], ectomycorrhizal fungi [18,19,20], root endophytic fungi [21], dark septate endophytic fungi [22,23,24], and plant growth-promoting rhizobacteria [25,26,27]. These beneficial microorganisms are crucial for reducing salt stress damage and enhancing biomass accumulation and crop yield. Some yeast species, acting as endophytic fungi, show functions similar to these beneficial microorganisms. For instance, Yarrowia lipolytica produced secondary metabolites (e.g., high concentrations of indole-3-acetic acid, indole-3-acetamide, phenols, and flavonoids) to ameliorate the negative impacts of salt stress and promoted maize growth [28,29]. Saccharomyces cerevisiae enhanced the oxidative defense system of Linum usitatissimum seedlings and maintained plasma membrane integrity under salt stress [30]. The transgenic tomato (Lycopersicon esculentum Mill.) with the HAL1 gene from S. cerevisiae also showed increased growth by maintaining significantly high ratios of K+/Na+ [31]. All findings suggest that yeast species may improve plant tolerance to salt stress through several pathways.
Yeasts have evolved conserved physiological adaptation mechanisms involved in complex responses at the molecular level to cope with various environmental stress and are highly adaptive [32]. Some of them are halophilic, such as Meyerozyma caribbica [28,29,33] and Meyerozyma guilliermondii (henceforth Megu) [34,35]. Their wide distribution confers remarkable functions in ecosystems. Megu played crucial roles, such as biocontrol of postharvest fruit rot [36,37,38,39], degradation of pollutants [35], biodiesel feedstock potential [40], production of xylitol [41] and silver/silver chloride nanoparticles [42], and bioremediation of heavy metal (loids) [43,44]. As noted, Megu has a wide range of uses in biotechnological, agricultural, and ecological field [45]; hence, it might be used as a model microorganism in plant-microbe interaction research [46]. The draft genome sequence of Megu also improves related studies [47,48]. However, as a root endophytic fungus with the halophilic trait, it remains unclear whether Megu promotes plant tolerance and growth under salt stress, just as its compeer M. caribbica [28,29]. In this study, the effects of Megu inoculation on tomato (Lycopersicon esculentum Mill.), a model plant for studying the salt tolerance mechanism of plants, were studied under salt stress. Our aim was (1) to evaluate the effects of the inoculation on the growth and salt tolerance of tomato plants; (2) to investigate the physiological processes through which plant-microbe interaction promotes salt tolerance; (3) to establish Megu as a good candidate in agricultural practice against salt stress.
2. Materials and Methods
2.1. Yeast and Plant Culture
Meyerozyma guilliermondii BNCC337334 (ATCC 6260) was purchased from Beina Lianchuang Institute of Biotechnology, Beijing. Megu was cultured in YM solid medium (yeast extract 5 g, malt extract 3 g, glucose 10 g, peptone 5 g, agar 20 g in distilled water 1 L, pH 6.0-6.4) for 72 h at 25℃. Viable blocks were selected to culture in YM liquid medium (without agar) in a constant temperature shaker (150 r • min-1 for 72 h at 25℃). The seeds of tomato (Lycopersicon esculentum cv. “Sunrise”) were purchased from Guanhe Seed Company, Shouguang, Shandong province, China. The seeds were sterilized in an ethanol solution (75%) for 2 min, followed by sodium hypochlorite solution (NaClO, 0.75%active chlorine) for 15 min, then were washed several times with sterile distilled water. These sterilized tomato seeds were sowed in sterilized cultivation substance bought from Jinrun Biotechnological Co. Ltd., Shandong province, China, in plastic pots (16 cm in height, 25 cm in diameter), and were cultured in the greenhouse with 16 h light/8 h dark (PPFD 300–400 μmol • m-2 • s-1), relative humidity of 85%, and 25/20℃ (day/night). After germination, the seedlings with two true leaves were selected (2 seedlings per pot). These seedlings were watered according to the moisture of the cultivation substance. 25 d after germination, tomato seedlings were inoculated with the hyphal suspension solution (10 g • L-1) of cultured Megu (10 ml per pot). 30 d after germination, tomato plants were treated with 0, 100, 200, and 300 mM NaCl. The treatments were divided into eight groups: (1) -Megu + 0 mM NaCl; (2) -Megu + 100 mM NaCl; (3) -Megu + 200 mM NaCl; (4) -Megu + 300 mM NaCl; (5) +Megu + 0 mM NaCl; (6) +Megu + 100 mM NaCl; (7) +Megu + 200 mM NaCl; (8) +Megu + 300 mM NaCl. Ten pots were used for each treatment (a total of 80 pots). Thirty days after inoculation, roots of tomato plants inoculated with Megu suspension solution were examined by micrography. The remaining tomato plants continued to be cultured until they produced fruits.
2.2. Harvesting
Whole tomato plants were removed from soil at 90 d of growth and then washed with tap water. Plants were divided into above- and below-ground parts at root-shoot joints. Fresh weight of shoot, roots, and fruits were recorded. Leaves were immersed in liquid nitrogen and then stored at -80℃ for further analysis.
2.3. Experimental Methods
2.3.1. Chlorophyll Concentrations and Fluorescence Determination
On 85 d of growth, five pots were randomly selected from each treatment. Three leaves with the same age per pot were selected for chlorophyll fluorescence measurement using a pulse-amplitude-modulated fluorometer (Junior-PAM, Walz, Germany), with a PAR of 190 μmol•m-2•s-1. Chlorophyll concentrations of the leaves of the same age were determined as described by Lichtenthaler and Wellburn [49].
2.3.2. Fungal Growth and Root Infection under Different NaCl Concentrations
Megu was cultured in YM solid medium containing 0, 100, 200, and 300 mM at 25℃ for 24 and 48 h. The developmental photos of Megu were captured using a digital camera at 24 and 48 h. The photos were then analyzed with the software ImageJ (https://imagej.nih.gov/ij) and the fungal areas were obtained. Megu infection in tomato roots exposed to different NaCl concentrations was investigated under a microscope by the method of Vahabi et al. [50].
2.3.3. Determination of Ascorbate and Glutathione Concentrations
Ascorbic acid concentrations were determined using the spectrophotometric method [51]. About 1 g of fresh leaves of the plants was placed in a mortar, 4 ml of oxalic acid–EDTA extracting solution was added, followed by 1 ml of orthophosphoric acid and 1 ml of 5% tetraoxosulphate (vi) acid. 2 ml of ammonium molybdate was added to the resulting mixture, followed by 3 ml of deionized water. Leaves were ground to homogenate. The homogenate was centrifuged for 10 min at 4°C (5000 rpm). The absorbance of the supernatant was measured at 760 nm. The concentrations of the ascorbic acid in the samples were then calculated from a standard curve.
0.5 of fresh tomato leaves was mixed with three mL extraction buffer containing 1 mM EDTA in 5% metaphosphoric acid in a cooled mortar and then was ground to ho-mogenate with a pestle. The homogenate was centrifuged at 11,500 × g for 12 min at 4°C. Aliquots (0.2 mL) of supernatant were neutralized with 0.3 mL phosphate buffer (0.5 M, pH 7.0) followed by reduction of the oxidized fraction with 0.1 M dithiothreitol. For as-saying GSH, 0.2 mL supernatant was neutralized. Proper oxidation and reduction of GSH were confirmed in the presence of GR observed for 1 min at 412 nm to determine total GSH content [52].
2.3.4. Soluble Sugar and PROTEIN determination
2.3.5. Determination of Antioxidant Enzyme Activities
0.5 g of leaves was weighed into a cooled mortar, liquid nitrogen was added, and the leaves was ground quickly with extraction buffer, and centrifuged at 4℃ at 12,000 rpm. Superoxide dismutase (SOD) activity was measured following the method of Beau-champand Fridovich by monitoring the photoreduction of nitroblue tetrazolium at 560 nm [55]. One unit of the enzyme was determined as the amount of enzyme reducing 50% of the substrate. The enzyme activity is expressed as unit • g-1 FW. Catalase (CAT) activity was measured based on the reduction of H2O2, according to the method of Velikova et al. [56], by monitoring the decrease in the absorbance at 240 nm for 1 min. Peroxidase (POD) activity was measured according to the method of Lin and Kao [57].
2.3.6. Determination of H2O2, Proline, and MDA Concentrations
To estimate H2O2, leaves were mixed with phosphate buffer (pH 6.5) and ground to homogenate. The homogenate was centrifuged for 10 min under 4℃ at 12,000 rpm. Later the supernatant and reaction mixture (0.1% TiCl4 in 20% H2SO4 (v/v)) was mixed at a 1:3 ratio and left at room temperature for 10 min. Prior to determination of the absorbance of the colored supernatant at 410 nm, the mixture was again centrifuged at 11,500 × g for 12 min. H2O2 concentrations were calculated using the extinction coefficient of 0.28 μM-1•cm-1 and expressed as nmol•g-1 FW [58].
Free proline concentrations were determined according to the method described by Bates et al. [59]. About 0.5 g of leaves was ground into a fine powder in liquid nitrogen and then homogenized in 2 mL of 3% aqueous sulfosalicylic acid. After centrifugation, 0.3 mL of supernatant was mixed with 0.3 mL cold acetic acid and 0.3 mL of acid ninhydrin solution and then boiled in a water bath for 1 h. After cooling in an ice bath, the mixture was mixed with 0.6 mL toluene and vortexed for 1 min. The chromophore-containing toluene was separated from the aqueous phase, and its absorbance was measured at 520 nm against toluene. The proline concentration was determined based on the standard curve of proline and calculated as µg • g-1 FW.
Malondialdehyde (MDA) was determined according to Heath and Packer [60]. Fresh leaves (0.2 g) were homogenized with 5 mL 0.1 % (m/v) trichloroacetic acid (TCA). The homogenate was centrifuged at 10,000 g for 5 min at 25℃. 4 mL of TCA (20 %) containing 0.5 % (m/v) thiobarbituric acid (TBA) was added to 1 mL of supernatant. The mixture was heated at 95℃ for 30 min and then quickly cooled on ice. The mixture was centrifuged at 10,000 g for 10 min at 25℃. The absorbance of the supernatant was measured at 532 nm. The value for nonspecific absorption at 600 nm was subtracted. The amount of MDA-TBA complex was calculated from the extinction coefficient of 155 mM-1 • cm-1.
2.4. Statistical Analysis
Statistical analyses of the data were carried out using SPSS 17.0 (IBM, Chicago, IL, USA). Datawith three repetitions were subjected to to analysis of variance (ANOVA) and compared by the least significant difference (LSD) at p < 0.05. The relationships among all items were analyzed by Pearson correlation.
3. Results
3.1. Yeast Growth and Infection under Different NaCl Concentrations
Megu was incubated in YM solid media containing 0, 100, 200, and 300 mM NaCl at 25℃ for 24 and 48 h, and their growths were recorded (Figure 1 and Figure S1). When cultured in YM solid medium for 24 hours, Megu growth reduced as NaCl concentrations increased (Figure 1). However, when incubation continued up to 48 h, Megu growth showed the highest performance under 100 mM NaCl (Figure 1 and Figure S1). Megu was able to infect tomato roots at concentrations of 0, 100, 200, and 300 mM NaCl, with the maximum infection rate occurring at 100 mM (Figure 2).
3.2. Megu Effects on Chlorophyll Concentrations and Fluorescence Parameters in Tomato Plants under Salt Stress
The concentrations of Chl a, Chl b, and total chlorophyll were higher in Megu-inoculated tomato plants than those in plants without Megu inoculation under higher NaCl concentrations (200 and 300 mM), however, no significant differences occurred between them (Table 1, p > 0.05). Similarly, concentrations of carotenoids were higher in Megu-inoculated plants than those in plants without Megu inoculation under 300 mM NaCl (Table 1).
The actual photochemical quantum yield Y(II) and electron transport rate (ETR) in Megu-inoculated plants were significantly higher under higher salinity (200 and 300 mM NaCl), compared with plants without Megu inoculation (Table 2, p < 0.05). Under NaCl concentrations of 0-200 mM, the photochemical quenching (qP) was significantly higher in tomato plants inoculated with Megu, compared with plants without Megu inoculation (Table 2, p < 0.05). However, under 300 mM NaCl, there was no significant difference in qP between plants with and without Megu inoculation (Table 2, p > 0.05). qL in tomato plants inoculated with Megu showed significantly higher levels under all the NaCl treatments, compared to the non-inoculated plants (Table 2, p < 0.05). Under higher salinity (200 and 300 mM NaCl), the quantum yield of nonregulated energy dissipation Y(NO), was significantly lower in inoculated plants, compared to the no inoculated plants (Table 2, p < 0.05). The fluorescence parameter, Fv/Fm, was significantly higher in inoculated tomato plants under higher salinity (200 and 300 mM NaCl), compared with the non-inoculated plants (Table 2, p < 0.05).
3.3. Effects of Megu Inoculation on Biomass Accumulation in Tomato Plants under Salt Stress
Under normal conditions (i.e., 0 mM NaCl), inoculation of Megu significantly in-creased root fresh weight of tomato plants, by 42.27%, compared to the tomato plants without inoculation (Figure 3A and Figure S2, p < 0.05). Megu inoculation increased root fresh weight, by 26.24%, 46.91%, and 64.80% under 100, 200, and 300 mM NaCl, respectively. However, no significant changes occurred between inoculated and non-inoculated tomato plants under corresponding NaCl concentrations (Figure 3A, p > 0.05). Similar results were observed for the shoot and fruit fresh weights (Figure 3B,C, and Figure S3). Shoot biomass increased by 20.72%, 25.81%, and 42.81%, and fruit biomass increased by 43.65%, 82.68%, and 42.88% under 100, 200, and 300 mM NaCl, respectively.
3.4. Megu Inoculation Regulated Levels of Antioxidants and Osmolytes in Tomat Plants under Salt Stress
No significant differences were observed from 0 to 200 mM NaCl in ascorbate concentrations between inoculated and non-inoculated tomato plants (Figure 4A, p > 0.05). However, under 300 mM NaCl, ascorbate was significantly higher in inoculated tomato plants, compared with no inoculation (Figure 4A, p < 0.05). Regardless of inoculation, salt stress significantly increased glutathione concentrations, compared with those under 0 mM NaCl (Figure 4B, p < 0.05), however, no significant changes in glutathione concentrations occurred between inoculated and non-inoculated tomato plants under salt stress (Figure 4B, p > 0.05). Salt stress significantly increased proline levels in both inoculated and non-inoculated plants, compared with plants under 0 mM NaCl (Figure 4C, p < 0.05), however, proline levels showed no significant changes between inoculated and non-inoculated plants under corresponding NaCl concentrations (Figure 4C, p > 0.05).
3.5. Megu Increased Antioxidant Enzyme Activities in Tomato Plants under Salt Stress
Megu inoculation increased SOD activities under salt stress, however, only under 300 mM NaCl, Megu-inoculated tomato plants showed significantly higher SOD activity than that of non-inoculated tomato plants (Figure 5A, p < 0.05). CAT activities showed the highest value in inoculated tomato plants under 100 mM NaCl, significantly higher than those under other salt treatments (Figure 5B, p < 0.05). However, CAT activities showed no significant changes under higher salinity (200 and 300 mM) between inoculated and non-inoculated plants (Figure 5B, p > 0.05). Under 200 mM NaCl, POD activity in inoculated tomato plants was significantly higher than that of non-inoculated tomato plants (Figure 5C, p < 0.05), however, no significant changes occurred between inoculated and non-inoculated plants under the other NaCl concentrations (i.e., 0, 100, and 300 mM NaCl) (Figure 5C, p > 0.05).
3.6. Inoculation Effects on Soluble Sugar and Protein Levels in Tomato Plants under Salt Stress
Salt stress induced increase in soluble sugar concentrations, however, Megu inoculation did not lead to significant changes in soluble sugar concentrations under salt stress (Figure 6A, p > 0.05). Under all the NaCl concentrations, no significant changes in soluble proteins were found between inoculated and non-inoculated tomato plants, comparing the corresponding NaCl concentrations (Figure 6B, p > 0.05).
3.7. Effects of Megu Inoculation on H2O2 and MDA in Tomato Plants under Salt Stress
Under lower NaCl concentrations (i.e., 0, 100, 200 mM NaCl), H2O2 levels showed no significant changes between inoculated and non-inoculated tomato plants (Figure 7A, p > 0.05). However, under 300 mM NaCl, H2O2 level was significantly lower in inoculated plants than that in non-inoculated plants (Figure 7A, p < 0.05). MDA levels were lower in Megu inoculation than no-inoculation under all the NaCl concentrations, however, no significant changes occurred between inoculated and non-inoculated plants under all the NaCl concentrations (Figure 7B, p >0.05).
4. Discussion
4.1. Megu Inoculation Regulated ROS Scavenging in Tomato Plants under Salt Stress
Reactive oxygen species (ROS) have strong oxidizing power and can cause cell membrane damage, irreversible metabolic disorders, and eventually cell death. Environmental stresses cause a great amount of ROS in plants, including salt stress [25,61,62]. Under normal growth conditions, plants maintain a dynamic balance between formation and scavenging of ROS. However, when excessive ROS occurs under environmental stresses, the dynamic balance is disrupted, and ROS levels increase, leading to oxidative damage to plant cells [63] Antioxidants and antioxidant enzymes function in scavenging ROS and maintaining ROS homeostasis in plants under salt stress. In the present study, Megu inoculation significantly increased the ascorbate levels in leaves of tomato plants under 300 mM NaCl (Figure 4A). Reduced ascorbate is considered the most powerful ROS scavenger. It acts as electron donors in non-enzymatic ROS scavenging reactions and participates in the enzymatic reactions (such as ascorbate peroxidase) [11]. Under 300 mM NaCl, increased ascorbate levels caused by Megu inoculation was possibly helpful for ROS scavenging. As for another antioxidant glutathione, Megu inoculation showed no effect on the glutathione levels in the leaves of tomato plants under all the four NaCl treatments (Figure 4B), suggesting that the inoculation was not directly involved in glutathione biosynthesis or reduction reactions from oxidated form.
Beyond being an osmoprotectant, proline is also considered a potent nonenzymatic antioxidant in plants [11]. Under NaCl treatments, proline levels increased under treatments of NaCl concentrations; however, inoculation of Megu did not promote proline biosynthesis (Figure 4C), suggesting that inoculation did not increase salt tolerance via triggering proline biosynthesis. Carotenoids are also listed among strong antioxidants [11]. We found that the levels of carotenoids in the leaves of inoculated tomato plants showed no significant differences from those in non-inoculated plants (Table 1), suggesting that Megu inoculation induced no effects on carotenoid biosynthesis under salt stress.
SOD activities significantly increased under salt stress, compared to control (0 mM NaCl), and showed no significant differences between inoculated and non-inoculated tomato plants under lower NaCl concentrations (i.e., 100 and 200 mM, Figure 5A); how-ever, under 300 mM NaCl, Megu inoculation triggered SOD activities significantly (Figure 5A), suggesting that the inoculation promotes SOD under heavy salt stress. Similarly, under higher NaCl concentrations, the inoculation increased CAT and POD activity, but the significant effect was observed under heavy salt stress (200 and 300 mM NaCl, Figure 5B,C). The findings indicate that Megu inoculation increased antioxidant enzyme activities under heavy salt stress. Under 300 mM NaCl, H2O2 levels were significantly lower in the leaves of inoculated tomato plants, compared with non-inoculated plants (Figure 7A), suggesting that increase in levels of the antioxidants and activities of the antioxidant enzymes resulted in a reduction in H2O2 levels under heavy salt stress (300 mM NaCl). Under salt stress, the Megu inoculation also resulted in a reduction in MDA levels (Figure 7B). These data indicate that Megu inoculation increased resistance against oxidative stress during salt stress.
4.2. Effect of Megu Inoculation on Osmoregulation of Plants under Salt Stress
Plants maintain their normal physiological activities by maintaining cell turgor pressure. As a result, under salt stress, plants accumulate more osmolytes, such as free proline, soluble carbohydrates, and soluble proteins, to balance the osmotic potential, [64,65]. Proline levels in the leaves of inoculated tomato plants were nearly equivalent to those in non-inoculated tomato plants (Figure 4C), suggesting that Megu inoculation had no effect on proline biosynthesis and accumulation, thus the inoculation cannot improve osmoregulation via proline biosynthesis. Verma et al. [66] reported that MYC2, a bHLH transcription factor, represses the expression of the P5CS1 gene, which encodes delta1-pyrroline-5-carboxylate synthase1, one of the core enzymes in the proline biosynthesis, thus negatively regulating proline biosynthesis in plant cells. Based on the results [65], it can be speculated that Megu inoculationmight not regulate the MYC2 protein activity and upstream mitogen-activated protein kinase (MAPK) cascade. In addition, some members of the genus Trichoderma, such as T. harzianum, T. virens, and T. atroviride, increased proline biosynthesis in salt- stressed plants [67,68]. Compared with these root endophytic fungi, Megu shows a weak role/minor function in promoting proline biosynthesis.
Total soluble sugar levels significantly increased in inoculated and non-inoculated tomato plants under salt stress, compared to tomato plants not exposed to NaCl (Figure 6A). This result was consistent with earlier researches [65,69,70]. However, under lower NaCl concentrations (100 and 200 mM), levels of soluble sugars in Megu-inoculated tomato plants were almost equal to those in non-inoculated plants (Figure 6A). Under higher NaCl concentration (300 mM), levels of soluble in Megu-inoculated tomato plants was higher than that in non-inoculated plants (Figure 6A), suggesting that Megu inoculation played role in improving biosynthesis of soluble sugars under heavy salt stress. A similar case occurred in levels of total soluble proteins (Figure 6B). Altogether, Megu inoculation might improve salt tolerance of tomato plants under heavy salt stress via regulating osmolyte biosynthesis. In fact, expression of genes involved in biosynthesis of osmolytes should be investigated in future and elucidate the mechanisms that Megu inoculation regulates their biosynthesis.
4.3. Effects of Megu Inoculation on Growth of Tomato Plants under Salt Stress
Salt stress finally affects plant growth and development. Based on our data, the inoculation of Megu increased the fresh weight of roots, shoots, and fruits of tomato plants under salt stress (Figure 3, Figure S2, and Figure S3). Increased biomass accumulation might be related to photosynthetic activities. Some studies showed that symbiosis between root endophytic fungi and plants improve plant growth and biomass accumulation under environmental stresses, such as heavy metal stress [71,72] and drought stress [73]. Under drought stress, inoculation of endophytic fungi led to increased net photosynthesis, compared to endophyte-free plants [73]. Increased net photosynthesis should be related to increased levels of photosynthetic pigments and chlorophyll florescence parameters. Under heavy metal stress, inoculation of the root endophytic fungus, Piriformospora indica, increased levels of Chl a and Chl b and fluorescence parameters (Fv/Fm and ETR) [71]. In our study, Megu inoculation also increased levels of Chl a and Chl b under heavy salt stress (200 and 300 mM NaCl) (Table 1), meanwhile the inoculation also increased levels of chlorophyll fluorescence parameters (Y(II), ETR, qP, and Fv/Fm) under 200 and 300 mM NaCl (Table 2). Thus, our results are consistent with those from Shababivand et al [71]. Improvement of photosynthetic pigments and chlorophyll fluorescence parameters caused by inoculation of endophytic fungi helps increase in net photosynthesis and biomass accumulation (Figure 3, [74]).
Conclusions: inoculation of the halotolerant yeast M. guilliermondii improved salt tolerance of tomato plants via increasing ROS scavenging and accumulation of osmolytes and promoted growth via strengthening photosynthetic machinery.
Supplementary Materials
The following supporting information can be downloaded at the website of this paper posted on Preprints.org. Figure S1. The growth of M. guilliermondii (Megu) under different NaCl concentrations for 24 and 48 h; Figure S2. The photos showing root growth of un-inoculated and inoculated tomato plants with Megu under different NaCl concentrations; Figure S3. The photos showing growth of non-inoculated and Megu inoculated tomato plants subjected to different NaCl concentrations.
Author Contributions
Conceptualization, Jinwang Qu and Chu Wu; Formal analysis, Yun Wang; Investigation, Jianglan Liu; Methodology, Jinwang Qu; Project administration, Liping Liu; Resources, Liping Liu; Supervision, Chu Wu; Validation, Yun Wang; Writing – original draft, Jianglan Liu; Writing – review & editing, Jinwang Qu and Chu Wu. All authors have read and agreed to the published version of the manuscript.
Funding
This work was supported by National Natural Science Foundation of China (Grant number 31870378); Fujian University Key Laboratory for Plant-Microbe Interaction (Grant number PMI2018KF2).
Conflicts of Interest
The authors declare no conflict of interest.
References
- FAO. Available online: http://www.fao.org/soils-portal/soil-management/management-of-some-problem-soils/salt-afected-soils/more-information-on-salt-afected-soils/en/ (accessed on 8 August 2019).
- Jamil, A.; Riaz, S.; Ashraf, M.; Foolad, M.R. Gene expression profiling of plants under salt stress. Crit. Rev. Plant Sci. 2011, 30, 435–458. [Google Scholar] [CrossRef]
- Wang, S.; Hu, Y.; Sun, H.; Shi, X.; Pan, H.; Chen, Y. Effects of salt stress on growth and root development of two oak seedlings. Acta Ecol. Sin. 2014, 34, 1021–1029. [Google Scholar] [CrossRef]
- Zhang, X.; Shi, Z.; Tian, Y.; Zhou, Q.; Cai, J.; Dai, T.; Cao, W.; Pu, H.; Jiang, D. Salt stress increases content and size of glutenin macropolymers in wheat grain. Food Chem. 2016, 197, 516–521. [Google Scholar] [CrossRef] [PubMed]
- Chatterjee, P.; Kanagendran, A.; Samaddar, S.; Pazouki, L.; Sa, T.-M.; Niinemets, Ü. Inoculation of Brevibacterium linens RS16 in Oryza sativa genotypes enhanced salinity resistance: Impacts on photosynthetic traits and foliar volatile emissions. Sci. Total Environ. 2018, 645, 721–732. [Google Scholar] [CrossRef] [PubMed]
- Gupta, B.; Huang, B. Mechanism of salinity tolerance in plants: Physiological, biochemical, and molecular characterization. Int. J. Genom. 2014, 2014, 701596. [Google Scholar] [CrossRef]
- Arif, Y.; Singh, P.; Siddiqui, H.; Bajguz, A.; Hayat, S. Salinity induced physiological and biochemical changes in plants: An omic approach towards salt stress tolerance. Plant Physiol. Biochem. 2020, 156, 64–77. [Google Scholar] [CrossRef]
- Zhu, J.K. Salt and drought stress signal transduction in plants. Annu. Rev. Plant Biol. 2002, 53, 247–273. [Google Scholar] [CrossRef]
- Shrivastava, P.; Kumar, R. Soil salinity: A serious environmental issue and plant growth promoting bacteria as one of the tools for its alleviation. Saudi J. Biol. Sci. 2015, 22, 123–131. [Google Scholar] [CrossRef]
- Capula-Rodríguez, R.; Valdez-Aguilar, L.A.; Cartmill, D.L.; Cartmill, A.D.; Alia-Tejacal, I. Supplementary calcium and potassium improve the response of tomato (Solanum lycopersicum L.) to simultaneous alkalinity, salinity, and boron stress. Commun. Soil Sci. Plant Anal. 2016, 47, 505–511. [Google Scholar] [CrossRef]
- Gill, S.S.; Tuteja, N. Reactive oxygen species and antioxidant machinery in abiotic stress tolerance in crop plants. Plant Physiol. Biochem. 2010, 48, 909–930. [Google Scholar] [CrossRef]
- Wang, Y.; Wang, M.; Li, Y.; Wu, A.; Huang, J. Effects of arbuscular mycorrhizal fungi on growth and nitrogen uptake of Chrysanthemum morifolium under salt stress. PLoS ONE 2018, 13, e0196408. [Google Scholar] [CrossRef] [PubMed]
- Çiçek, N.; Oukarroum, A.; Strasser, R.J.; Schansker, G. Salt stress effects on the photosynthetic electron transport chain in two chickpea lines differing in their salt stress tolerance. Photosynth. Res. 2018, 136, 291–301. [Google Scholar] [CrossRef] [PubMed]
- Methenni, K.; Abdallah, M.B.; Nouairi, I.; Smaoui, A.; Ammar, w.B.; Zarrouk, M.; Youssef, N.B. Salicylic acid and calcium pretreatments alleviate the toxic effect of salinity in the Oueslati olive variety. Sci. Hortic. 2018, 233, 349–358. [Google Scholar] [CrossRef]
- Chandrasekaran, M.; Chanratana, M.; Kim, K.; Seshadri, S.; Sa, T. Impact of arbuscular mycorrhizal fungi on photosynthesis, water status, and gas exchange of plants under salt stress–a meta-analysis. Front. Plant Sci. 2019, 10. [Google Scholar] [CrossRef] [PubMed]
- Tisarum, R.; Theerawitaya, C.; Samphumphuang, T.; Polispitak, K.; Thongpoem, P.; Singh, H.P.; Cha-um, S. Alleviation of salt stress in upland rice (Oryza sativa L. ssp. indica cv. Leum Pua) using arbuscular mycorrhizal fungi inoculation. Front. Plant Sci. [CrossRef]
- Liang, B.B.; Wang, W.J.; Fan, X.X.; Kurakov, A.V.; Liu, Y.F.; Song, F.Q.; Chang, W. Arbuscular mycorrhizal fungi can ameli-orate salt stress in Elaeagnus angustifolia by improving leaf photosynthetic function and ultrastructure. Plant Biol. 2021, 23, 232–241. [Google Scholar] [CrossRef]
- Guerrero-Galán, C.; Calvo-Polanco, M.; Zimmermann, S.D. Ectomycorrhizal symbiosis helps plants to challenge salt stress conditions. Mycorrhiza 2019, 29, 291–301. [Google Scholar] [CrossRef]
- Sa, G.; Yao, J.; Deng, C.; Liu, J.; Zhang, Y.; Zhu, Z.; Zhang, Y.; Ma, X.; Zhao, R.; Lin, S.; et al. Amelioration of nitrate uptake under salt stress by ectomycorrhiza with and without a Hartig net. New Phytol. 2019, 222, 1951–1964. [Google Scholar] [CrossRef]
- Zwiazek, J.J.; Equiza, M.A.; Karst, J.; Senorans, J.; Wartenbe, M.; Calvo-Polanco, M. Role of urban ectomycorrhizal fungi in improving the tolerance of lodgepole pine (Pinus contorta) seedlings to salt stress. Mycorrhiza 2019, 29, 303–312. [Google Scholar] [CrossRef]
- Durmus, N.; Yesilyurt, A.M.; Pehlivan, N.; Karaoglu, S.A. Salt stress resilience potential of a fungal inoculant isolated from tea cultivation area in maize. Biologia 2017, 72, 619–627. [Google Scholar] [CrossRef]
- Kord, H.; Fakheri, B.; Ghabooli, M.; Solouki, M.; Emamjomeh, A.; Khatabi, B.; Sepehri, M.; Salekdeh, G.H.; Ghaffari, M.R. Salinity-associated microRNAs and their potential roles in mediating salt tolerance in rice colonized by the endophytic root fungus Piriformospora indica. Funct. Integr. Genom. 2019, 19, 659–672. [Google Scholar] [CrossRef]
- Farias, G.C.; Nunes, K.G.; Soares, M.A.; de Siqueira, K.A.; Lima, W.C.; Neves, A.L.R.; de Lacerda, C.F.; Filho, E.G. Dark sep-tate endophytic fungi mitigate the effects of salt stress on cowpea plants. Braz. J. Microbiol. 2020, 51, 243–253. [Google Scholar] [CrossRef] [PubMed]
- Bouzouina, M.; Kouadria, R.; Lotmani, B. Fungal endophytes alleviate salt stress in wheat in terms of growth, ion homeostasis and osmoregulation. J. Appl. Microbiol. 2021, 130, 913–925. [Google Scholar] [CrossRef] [PubMed]
- He, F.; Niu, M.-X.; Feng, C.-H.; Li, H.-G.; Su, Y.; Su, W.-L.; Pang, H.; Yang, Y.; Yu, X.; Wang, H.-L.; et al. PeSTZ1 confers salt stress tolerance by scavenging the accumulation of ROS through regulating the expression of PeZAT12 and PeAPX2 in Populus. Tree Physiol. 2020, 40, 1292–1311. [Google Scholar] [CrossRef] [PubMed]
- Alkowni, R.; Jodeh, S.; Hamed, R.; Samhan, S.; Daraghmeh, H. The impact of Pseudomonas putida UW3 and UW4 strains on photosynthetic activities of selected field crops under saline conditions. Int. J. Phytoremed. 2019, 21, 944–952. [Google Scholar] [CrossRef]
- Saghafi, D.; Delangiz, N.; Lajayer, B.A.; Ghorbanpour, M. An overview on improvement of crop productivity in saline soils by halotolerant and halophilic PGPRs. 3 Biotech 2019, 9, 261. [Google Scholar] [CrossRef]
- Gul Jan, F.; Hamayun, M.; Hussain, A.; Iqbal, A.; Jan, G.; Khan, S.A.; Khan, H.; Lee, I.-J. A promising growth promoting Meyerozyma caribbica from Solanum xanthocarpum alleviated stress in maize plants. Biosci. Rep. 2019, 39. [Google Scholar] [CrossRef]
- Gul Jan, F.; Hamayun, M.; Hussain, A.; Jan, G.; Iqbal, A.; Khan, A.; Lee, I.-J. An endophytic isolate of the fungus Yarrowia lipo-lytica produces metabolites that ameliorate the negative impact of salt stress on the physiology of maize. BMC Microbiol. 2019, 19, 3. [Google Scholar] [CrossRef]
- Emam, M. Efficiency of yeast in enhancement of the oxidative defense system in salt-stressed flax seedlings. Acta Biol. Hung. 2013, 64, 118–130. [Google Scholar] [CrossRef]
- Gisbert, C.; Rus, A.M.; Bolarín, M.C.; López-Coronado, J.M.; Arrillaga, I.; Montesinos, C.; Caro, M.; Serrano, R.; Moreno, V. The yeast HAL1 gene improves salt tolerance of transgenic tomato. Plant Physiol. 2000, 123, 393–402. [Google Scholar] [CrossRef]
- Singh, K.K.; Norton, R.S. Metabolic changes induced during adaptation of Saccharomyces cerevisiae to a water stress. Arch. Microbiol. 1991, 156, 38–42. [Google Scholar] [CrossRef]
- Kim, J.-S.; Baek, J.-H.; Park, N.-H.; Kim, C. Complete genome sequence of halophilic yeast Meyerozyma caribbica MG20W isolated from rhizosphere soil. Genome Announc. 2015, 3, e00127–00115. [Google Scholar] [CrossRef] [PubMed]
- Yang, H.-l.; Liao, Y.-y.; Zhang, J.; Wang, X.-l. Comparative transcriptome analysis of salt tolerance mechanism of Meyerozyma guilliermondii W2 under NaCl stress. 3 Biotech 2019, 9, 286. [Google Scholar] [CrossRef] [PubMed]
- Serra, I.; Capusoni, C.; Molinari, F.; Musso, L.; Pellegrino, L.; Compagno, C. Marine microorganisms for biocatalysis: Selective hydrolysis of nitriles with a salt-resistant strain of Meyerozyma guilliermondii. Mar. Biotechnol. 2019, 21, 229–239. [Google Scholar] [CrossRef] [PubMed]
- Yan, Y.; Zhang, X.; Zheng, X.; Apaliya, M.T.; Yang, Q.; Zhao, L.; Gu, X.; Zhang, H. Control of postharvest blue mold decay in pears by Meyerozyma guilliermondii and it’s effects on the protein expression profile of pears. Postharvest Biol. Technol. 2018, 136, 124–131. [Google Scholar] [CrossRef]
- Agirman, B.; Erten, H. Biocontrol ability and action mechanisms of Aureobasidium pullulans GE17 and Meyerozyma guilliermon-dii KL3 against Penicillium digitatum DSM2750 and Penicillium expansum DSM62841 causing postharvest diseases. Yeast 2020, 37, 437–448. [Google Scholar] [CrossRef]
- Sun, C.; Huang, Y.; Lian, S.; Saleem, M.; Li, B.; Wang, C. Improving the biocontrol efficacy of Meyerozyma guilliermondii Y-1 with melatonin against postharvest gray mold in apple fruit. Postharvest Biol. Technol. 2021, 171, 111351. [Google Scholar] [CrossRef]
- Huang, Y.; Sun, C.; Guan, X.; Lian, S.; Li, B.; Wang, C. Biocontrol efficiency of Meyerozyma guilliermondii Y-1 against apple postharvest decay caused by Botryosphaeria dothidea and the possible mechanisms of action. Int. J. Food Microbiol. 2021, 338, 108957. [Google Scholar] [CrossRef]
- Ramírez-Castrillón, M.; Jaramillo-Garcia, V.P.; Rosa, P.D.; Landell, M.F.; Vu, D.; Fabricio, M.F.; Ayub, M.A.Z.; Robert, V.; Henriques, J.A.P.; Valente, P. The oleaginous yeast Meyerozyma guilliermondii BI281A as a new potential biodiesel feedstock: Selection and lipid production optimization. Front. Microbiol. 2017, 8. [Google Scholar] [CrossRef]
- Atzmüller, D.; Ullmann, N.; Zwirzitz, A. Identification of genes involved in xylose metabolism of Meyerozyma guilliermondii and their genetic engineering for increased xylitol production. AMB Express 2020, 10, 78. [Google Scholar] [CrossRef]
- Alamri, S.A.M.; Hashem, M.; Nafady, N.A.; Sayed, M.A.; Alshehri, A.M.; El-Shaboury, G.A. Controllable biogenic synthesis of intracellular silver/silver chloride nanoparticles by Meyerozyma guilliermondii KX008616. J. Microbiol. Biotechnol. 2018, 28, 917–930. [Google Scholar] [CrossRef]
- Amorim, S.S.; Ruas, F.A.D.; Barboza, N.R.; de Oliveira Neves, V.G.; Leão, V.A.; Guerra-Sá, R. Manganese (Mn2+) tolerance and biosorption by Meyerozyma guilliermondii and Meyerozyma caribbica strains. J. Environ. Chem. Eng. 2018, 6, 4538–4545. [Google Scholar] [CrossRef]
- Ruas, F.A.D.; Barboza, N.R.; Castro-Borges, W.; Guerra-Sá, R. Manganese alters expression of proteins involved in the oxida-tive stress of Meyerozyma guilliermondii. J. Proteom. 2019, 196, 173–188. [Google Scholar] [CrossRef] [PubMed]
- Yan, W.; Gao, H.; Qian, X.; Jiang, Y.; Zhou, J.; Dong, W.; Xin, F.; Zhang, W.; Jiang, M. Biotechnological applications of the non-conventional yeast Meyerozyma guilliermondii. Biotechnol. Adv. 2021, 46, 107674. [Google Scholar] [CrossRef] [PubMed]
- Bertini, E.V.; Leguina, A.C.d.V.; Castellanos, L.I.; Nieto Peñalver, C.G. Endophytic microorganisms Agrobacterium tumefaciens 6N2 and Meyerozyma guilliermondii 6N serve as models for the study of microbial interactions in colony biofilms. Rev. Argent. Microbiol. 2019, 51, 286–287. [Google Scholar] [CrossRef]
- Yan, W.; Zhang, S.; Wu, M.; Zhang, W.; Zhou, J.; Dong, W.; Qian, X.; Jiang, M.; Xin, F. The draft genome sequence of Meyero-zyma guilliermondii strain YLG18, a yeast capable of producing and tolerating high concentration of 2-phenylethanol. 3 Biotech 2019, 9, 441. [Google Scholar] [CrossRef]
- Valsalan, R.; Mathew, D. Draft genome of Meyerozyma guilliermondii strain vka1: A yeast strain with composting potential. J. Genet. Eng. Biotechnol. 2020, 18, 54. [Google Scholar] [CrossRef]
- Lichtenthaler, H.K.; Wellburn, A.R. Determination of carotenoids and chlorophylls a and b of leaf extracts in different solvents. Biochem. Soc. Trans. [CrossRef]
- Vahabi, K.; Johnson, J.M.; Drzewiecki, C.; Oelmüller, R. Fungal staining tools to study the interaction between the beneficial endophyte Piriformospora indica with Arabidopsis thaliana roots. J. Endocyt. Cell Res. 2011, 21, 77–88. [Google Scholar]
- Bajaj, K.L.; Kaur, G. Spectrophotometric determination of L-ascorbic acid in vegetables and fruits. Analyst, 1981, 106: 117-120. [CrossRef]
- Griffiths, O.W. Determination of glutathione and glutathione disulphide using glutathione reductase and 2-vinylpyridine. Anal. Biochem. 1980, 106, 207–212. [Google Scholar] [CrossRef]
- Dreywood, R. Qualitative test for carbohydrate material. Ind. Eng. Chem. Anal. Ed. 1946, 18, 499–499. [Google Scholar] [CrossRef]
- Bradford, M.M. A rapid and sensitive method for the quantitation of microgram quantities of protein utilizing the principle of protein-dye binding. Anal. Biochem. 1976, 72, 248–254. [Google Scholar] [CrossRef]
- Beauchamp, C.; Fridovich, I. Superoxide dismutase: Improved assays and an assay applicable to acrylamide gels. Anal. Bio-Chem. 1971, 44, 276–287. [Google Scholar] [CrossRef] [PubMed]
- Velikova, V.; Yordanov, I.; Edreva, A. Oxidative stress and some antioxidant systems in acid rain-treated bean plants: Protective role of exogenous polyamines. Plant Sci. 2000, 151, 59–66. [Google Scholar] [CrossRef]
- Lin, C.C.; Kao, C.H. NaCl induced changes in ionically bound peroxidase activity in roots of rice seedlings. Plant Soil 1999, 216, 147. [Google Scholar] [CrossRef]
- Masud, A.; Karim, M.; Bhuyan, M.H.M.; Mahmud, J.A.; Nahar, K.; Fujita, M.; Hasanuzzaman, M. Potassium-induced regula-tion of cellular antioxidant defense and improvement of physiological processes in wheat under water deficit condition. Phyton 2021, 90. [Google Scholar] [CrossRef]
- Bates, L.S.; Waldren, R.P.; Teare, I.D. Rapid determination of free proline for water-stress studies. Plant Soil 1973, 39, 205–207. [Google Scholar] [CrossRef]
- Heath, R.L.; Packer, L. Photoperoxidation in isolated chloroplasts: I. Kinet. Stoichiom. Fat. Acid Peroxidation. Arch. Biochem. Biophys. 1968, 125, 189–198. [Google Scholar] [CrossRef]
- Sun, Y.; Liang, W.; Cheng, H.; Wang, H.; Lv, D.; Wang, W.; Liang, M.; Miao, C. NADPH Oxidase-derived ROS promote mito-chondrial alkalization under salt stress in Arabidopsis root cells. Plant Signal. Behav. 2021, 16, 1856546. [Google Scholar] [CrossRef]
- Cheng, X.; He, Q.; Tang, S.; Wang, H.; Zhang, X.; Lv, M.; Liu, H.; Gao, Q.; Zhou, Y.; Wang, Q.; et al. The miR172/IDS1 signal-ing module confers salt tolerance through maintaining ROS homeostasis in cereal crops. New Phytol. 2021, 230, 1017–1033. [Google Scholar] [CrossRef]
- Suzuki, K.; Costa, A.; Nakayama, H.; Katsuhara, M.; Shinmyo, A.; Horie, T. OsHKT2;2/1-mediated Na+ influx over K+ uptake in roots potentially increases toxic Na+ accumulation in a salt-tolerant landrace of rice Nona Bokra upon salinity stress. J. Plant Res. 2016, 129, 67–77. [Google Scholar] [CrossRef]
- Veeranagamallaiah, G.; Chandraobulreddy, P.; Jyothsnakumari, G.; Sudhakar, C. Glutamine synthetase expression and pyrroline-5-carboxylate reductase activity influence proline accumulation in two cultivars of foxtail millet (Setaria italica L.) with differential salt sensitivity. Environ. Exp. Bot. 2007, 60, 239–244. [Google Scholar] [CrossRef]
- Galvan-Ampudia, C.S.; Testerink, C. Salt stress signals shape the plant root. Curr. Opin. Plant Biol. 2011, 14, 296–302. [Google Scholar] [CrossRef]
- Verma, D.; Jalmi, S.K.; Bhagat, P.K.; Verma, N.; Sinha, A.K. A bHLH transcription factor, MYC2, imparts salt intolerance by regulating proline biosynthesis in Arabidopsis. FEBS J. 2020, 287, 2560–2576. [Google Scholar] [CrossRef] [PubMed]
- Contreras-Cornejo, H.A.; Macías-Rodríguez, L.; Alfaro-Cuevas, R.; López-Bucio, J. Trichoderma spp. improve growth of Arabidopsis seedlings under salt stress through enhanced root development, osmolite production, and Na+ elimination through root exudates. Mol. Plant-Microbe Interact. 2014, 27, 503–514. [Google Scholar] [CrossRef] [PubMed]
- Zhang, F.; Wang, Y.; Liu, C.; Chen, F.; Ge, H.; Tian, F.; Yang, T.; Ma, K.; Zhang, Y. Trichoderma harzianum mitigates salt stress in cucumber via multiple responses. Ecotoxicol. Environ. Saf. 2019, 170, 436–445. [Google Scholar] [CrossRef] [PubMed]
- Bai, J.; Liu, J.; Zhang, N.; Sa, R.; Jiang, L. Effect of salt stress on antioxidant enzymes, soluble sugar and yield of oat. Adv. J. Food Sci. Technol. 2013, 5, 303–309. [Google Scholar] [CrossRef]
- Boriboonkaset, T.; Theerawitaya, C.; Yamada, N.; Pichakum, A.; Supaibulwatana, K.; Cha-um, S.; Takabe, T.; Kirdmanee, C. Regulation of some carbohydrate metabolism-related genes, starch and soluble sugar contents, photosynthetic activities and yield attributes of two contrasting rice genotypes subjected to salt stress. Protoplasma 2013, 250, 1157–1167. [Google Scholar] [CrossRef]
- Shahabivand, S.; Parvaneh, A.; Aliloo, A.A. Root endophytic fungus Piriformospora indica affected growth, cadmium partition-ing and chlorophyll fluorescence of sunflower under cadmium toxicity. Ecotoxicol. Environ. Saf. 2017, 145, 496–502. [Google Scholar] [CrossRef]
- Ważny, R.; Rozpądek, P.; Domka, A.; Jędrzejczyk, R.J.; Nosek, M.; Hubalewska-Mazgaj, M.; Lichtscheidl, I.; Kidd, P.; Turnau, K. The effect of endophytic fungi on growth and nickel accumulation in Noccaea hyperaccumulators. Sci. Total Environ. 2021, 768, 144666. [Google Scholar] [CrossRef]
- Manzur, M.E.; Garello, F.A.; Omacini, M.; Schnyder, H.; Sutka, M.R.; García-Parisi, P.A. Endophytic fungi and drought toler-ance: Ecophysiological adjustment in shoot and root of an annual mesophytic host grass. Funct. Plant Biol. 2022, 49, 272–282. [Google Scholar] [CrossRef]
- Wu, C.; Wei, Q.; Deng, J.; Zhang, W. Changes in gas exchange, root growth, and biomass accumulation of Platycladus orientalis seedlings colonized by Serendipita indica. J. For. Res. 2019, 30, 1199–1207. [Google Scholar] [CrossRef]
Figure 1.
The growth of Megu under different NaCl concentrations. Megu was cultured in YM solid mediums containing 0, 100, 200, and 300 mM NaCl. The growth photos of the yeast were taken using a digital camera at 24 and 48 h. The photos were analyzed with the software ImageJ (https://imagej.nih.gov/ij) to obtain growth areas. Data were shown as mean ± SD. Data of the same day with different lowercases were significantly different (n=15, p < 0.05, LSD).
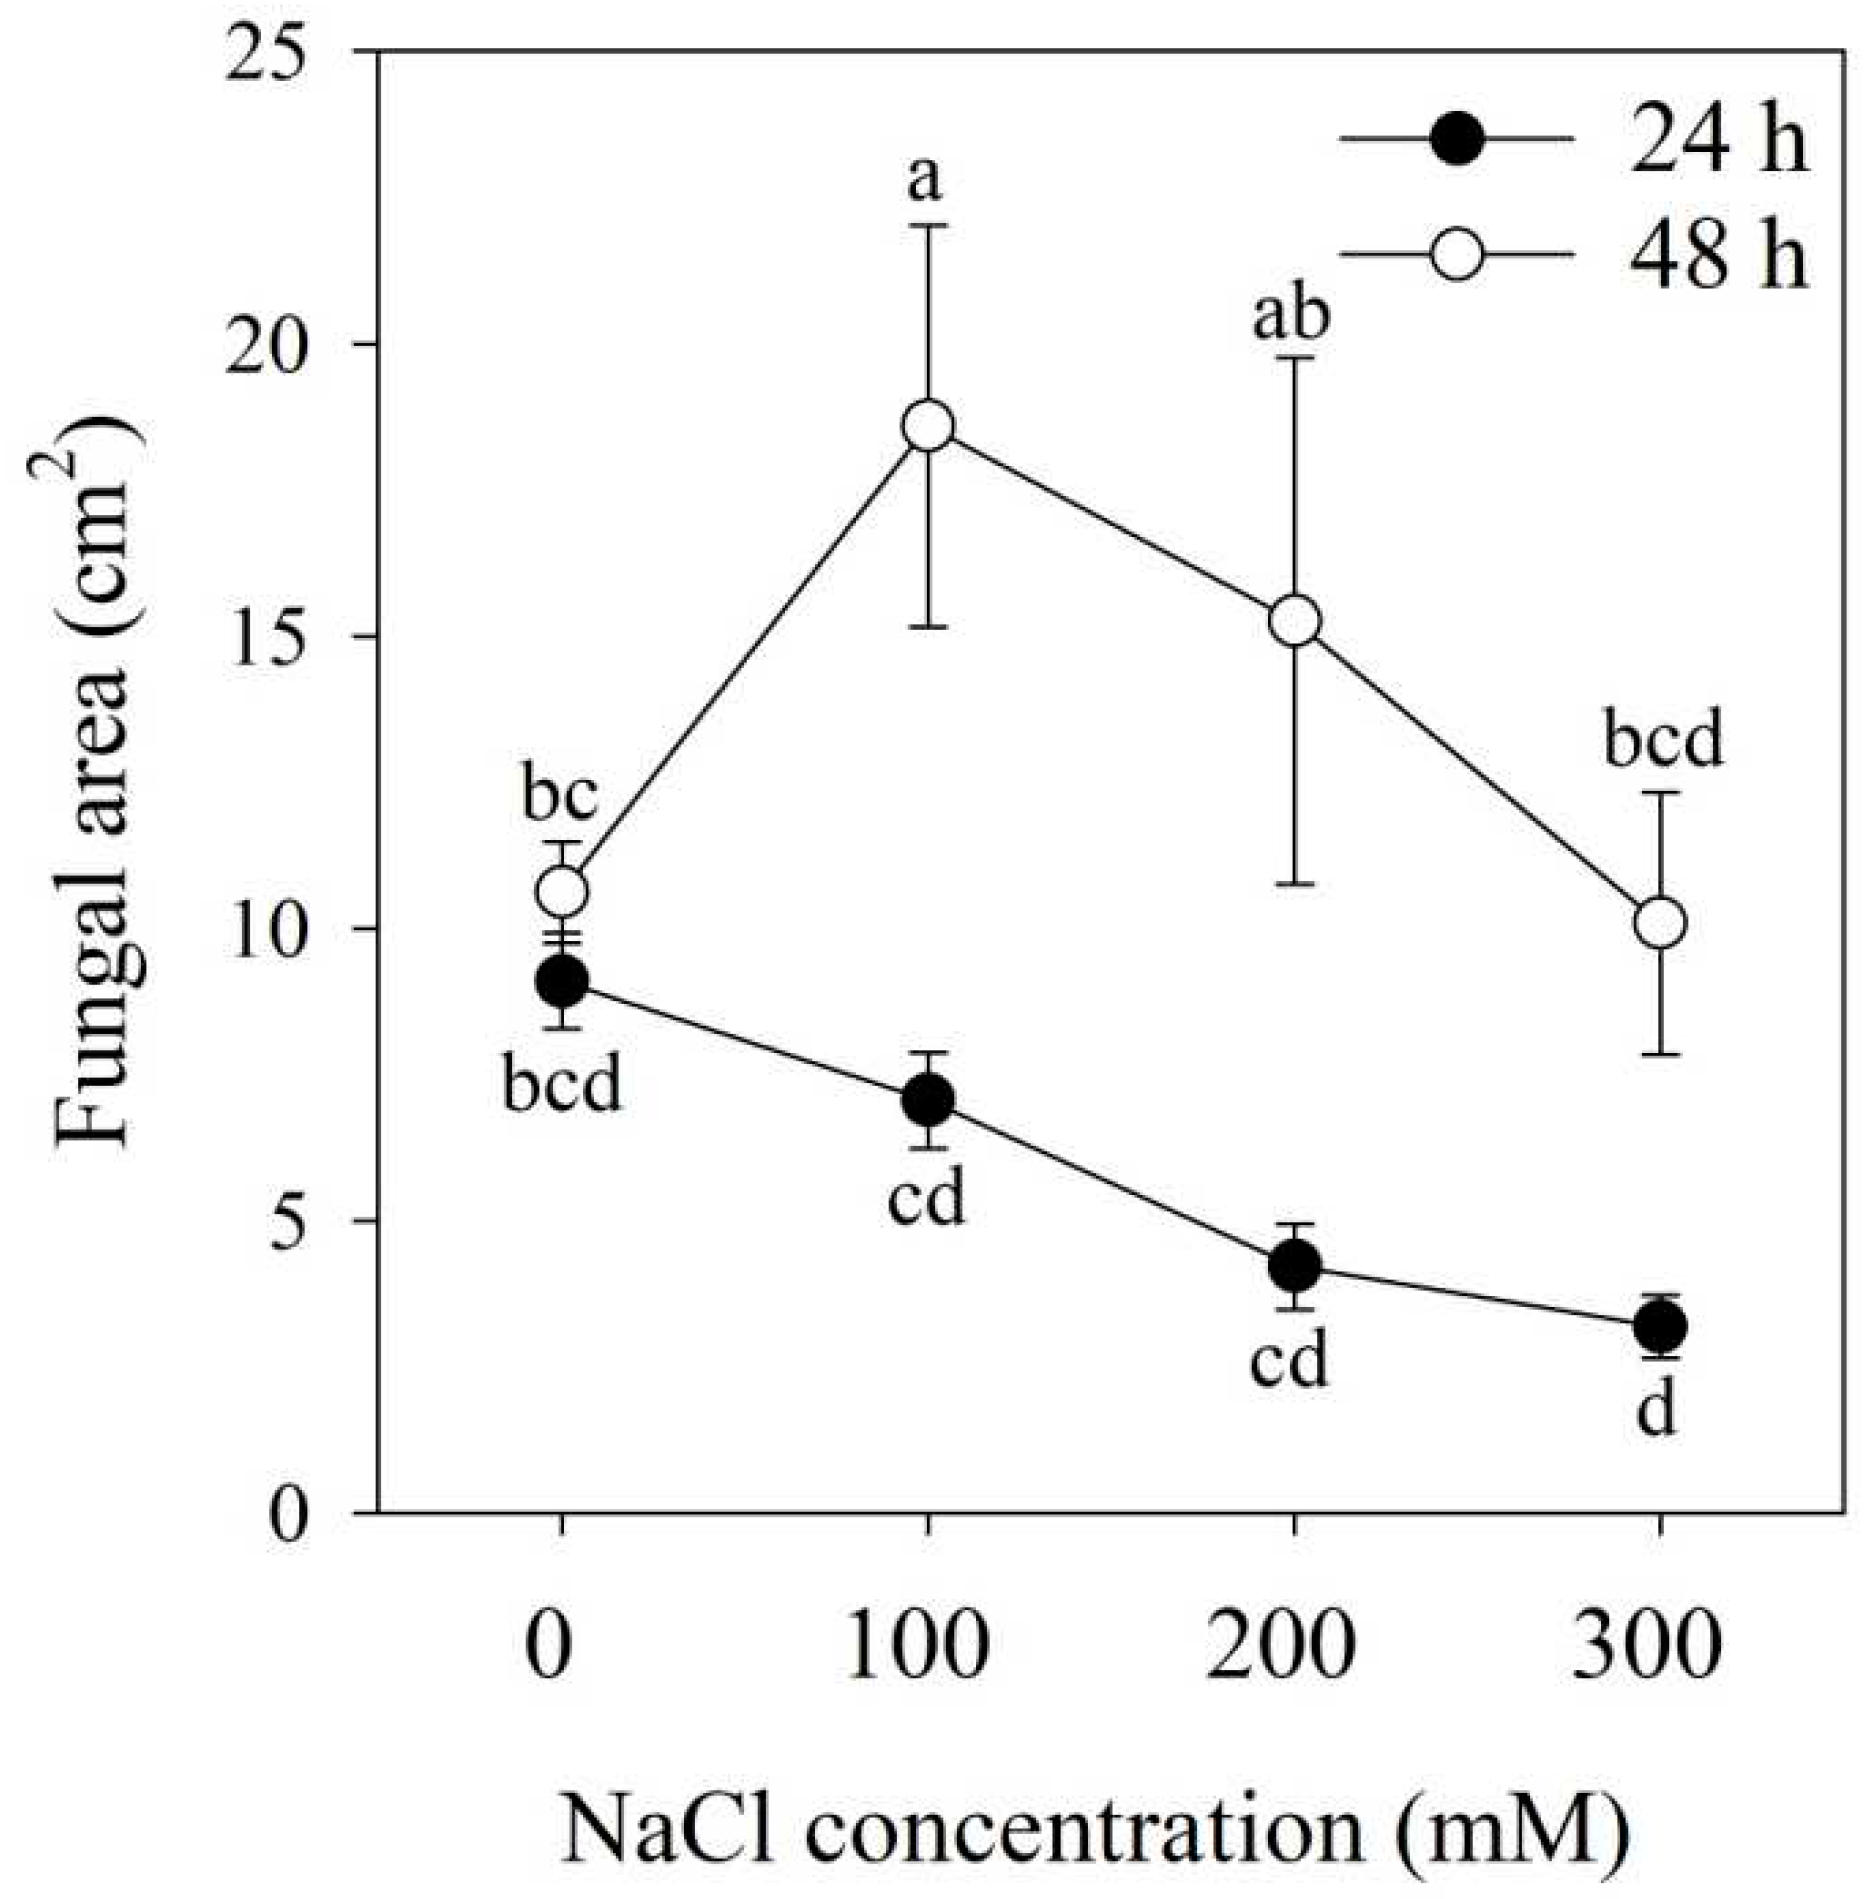
Figure 2.
The infection ofMegu in roots of tomato plants under different NaCl concentrations. (A) 0 mM NaCl, bar = 10 μm; (B) 100 mM NaCl, bar = 100 μm; (C) 200 mM NaCl, bar = 100 μm; (D) 300 mM NaCl, bar = 10 μm. Blue arrows indicate Megu hypha on the root surface of tomato plants, and white arrows indicate spores of Megu.
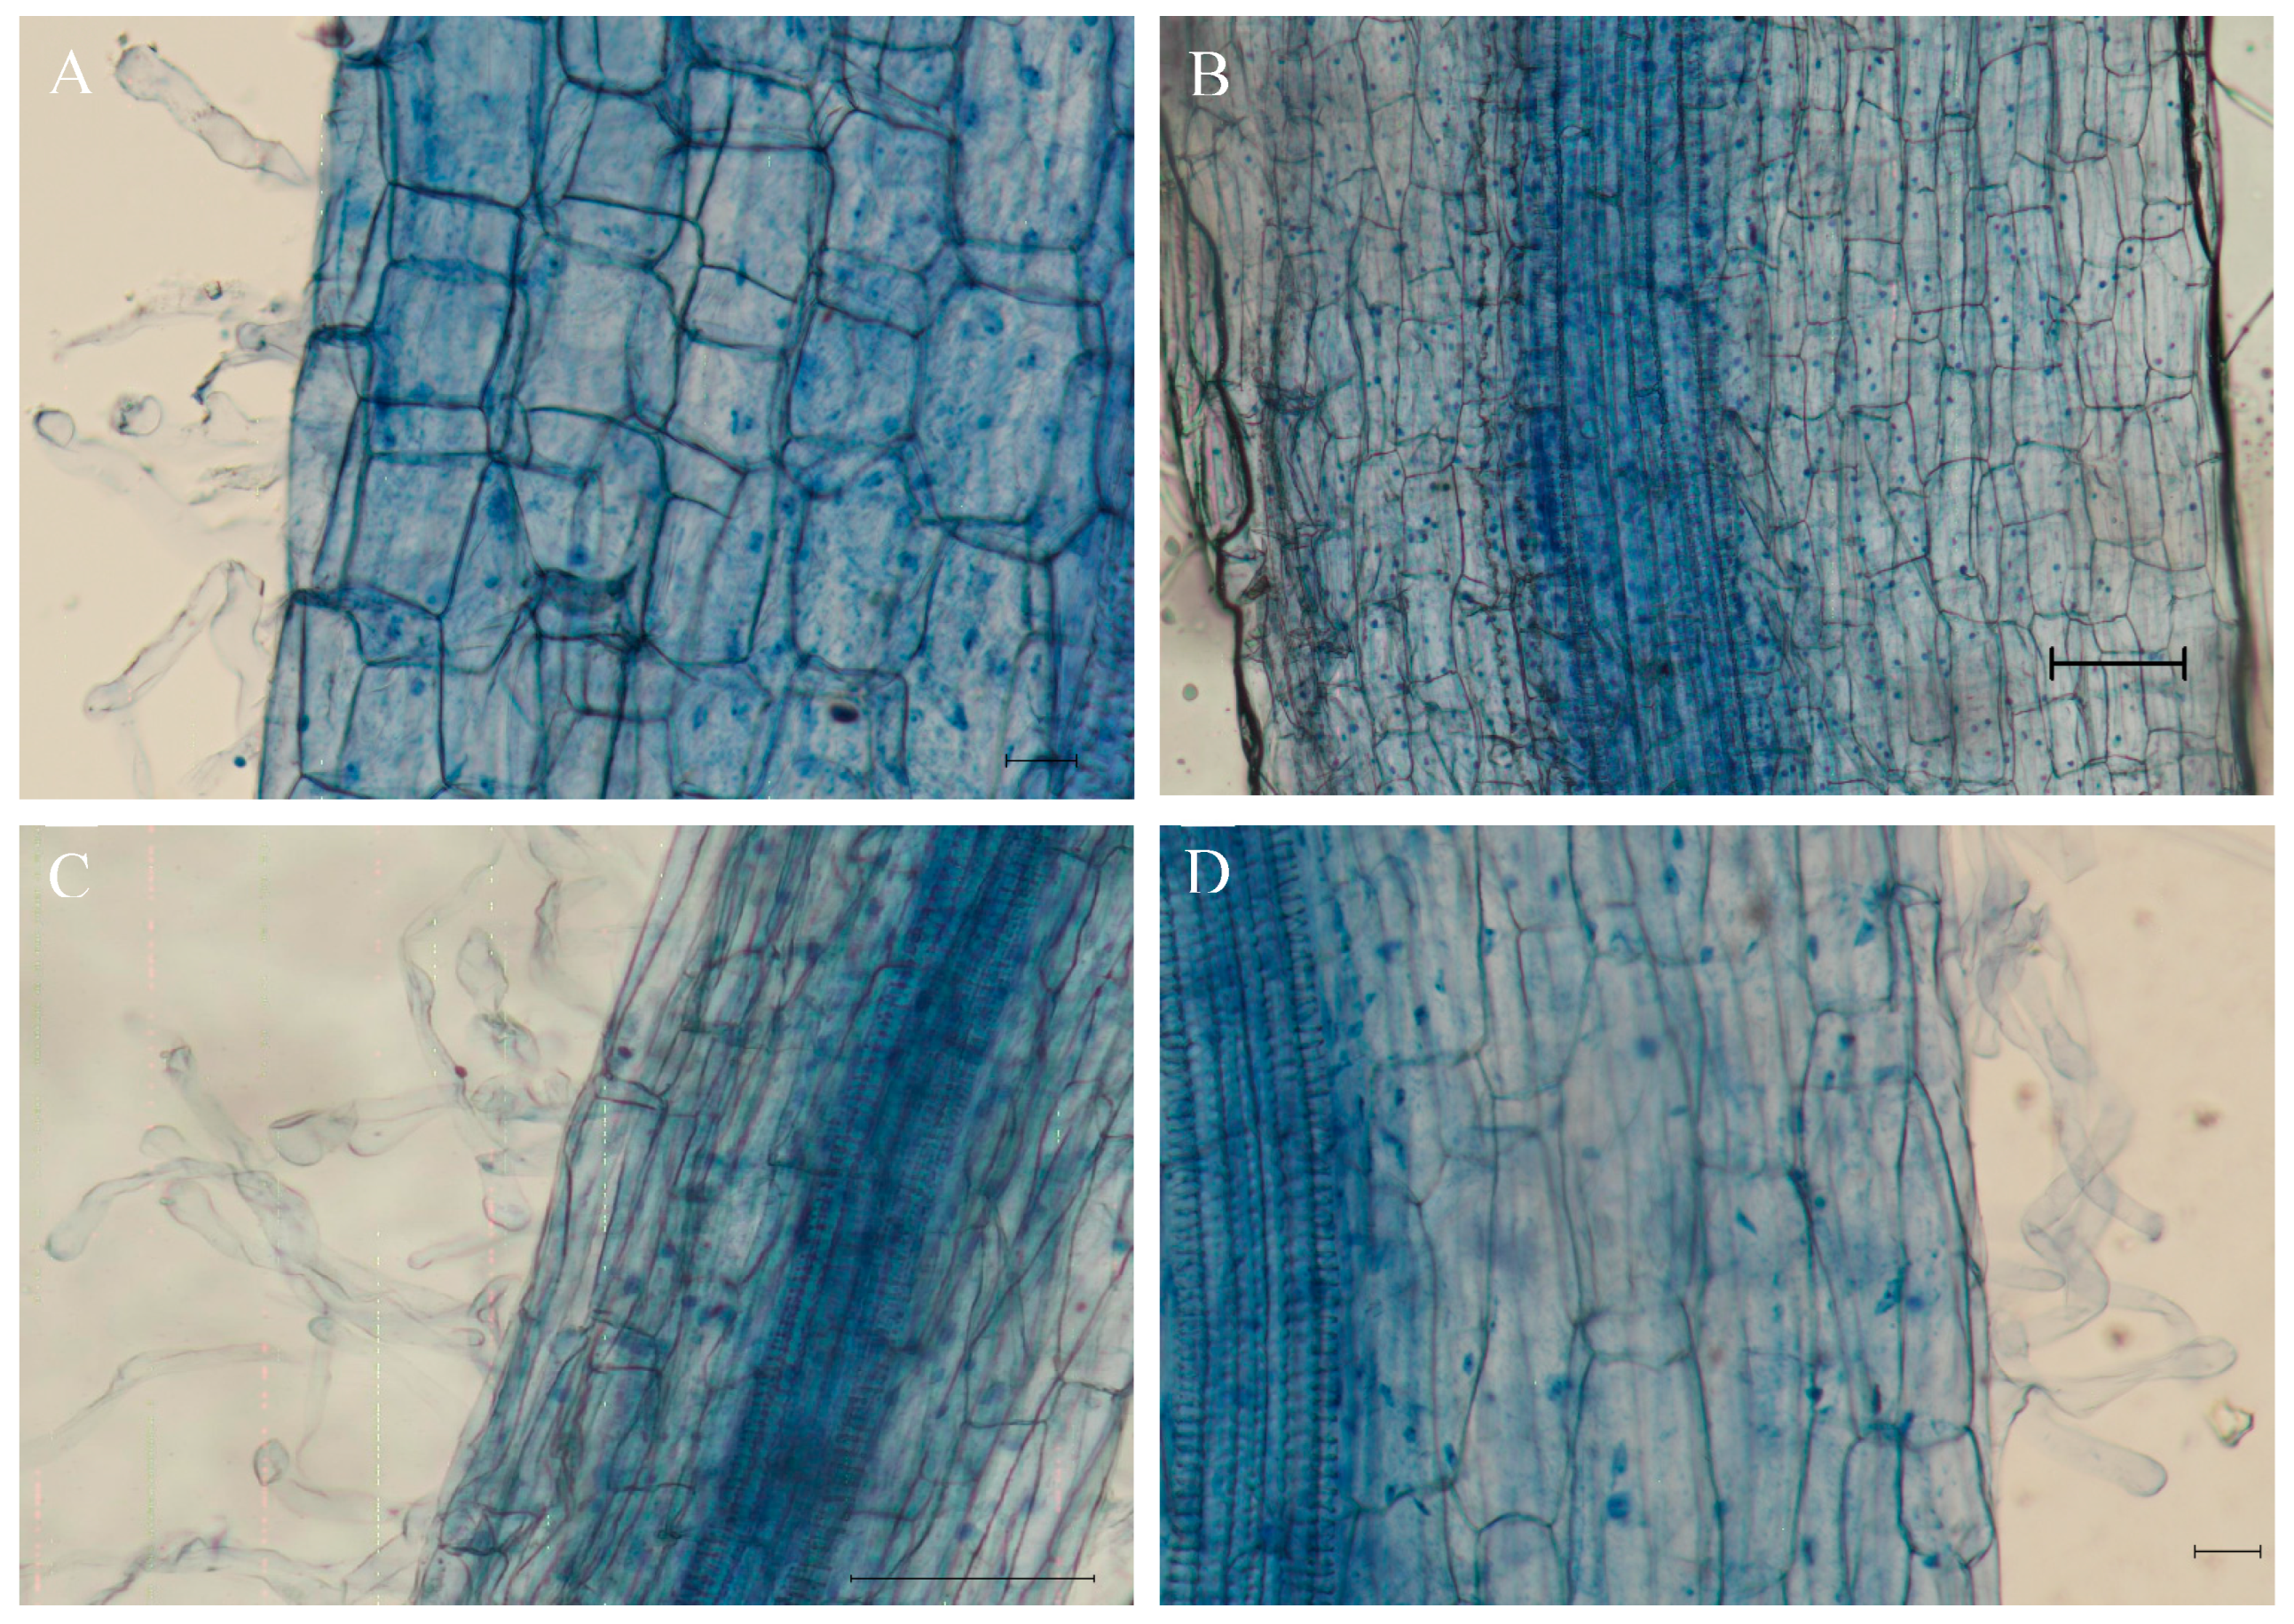
Figure 3.
The effects of Megu inoculation on fresh weight of tomato plants under different NaCl concentrations. (A) Root fresh weight; (B) Shoot fresh weight; (C) Fruit fresh weight. Data were shown as mean ± SD. Data of the same parameter with different lowercases were significantly different (n=15, p < 0.05, LSD).
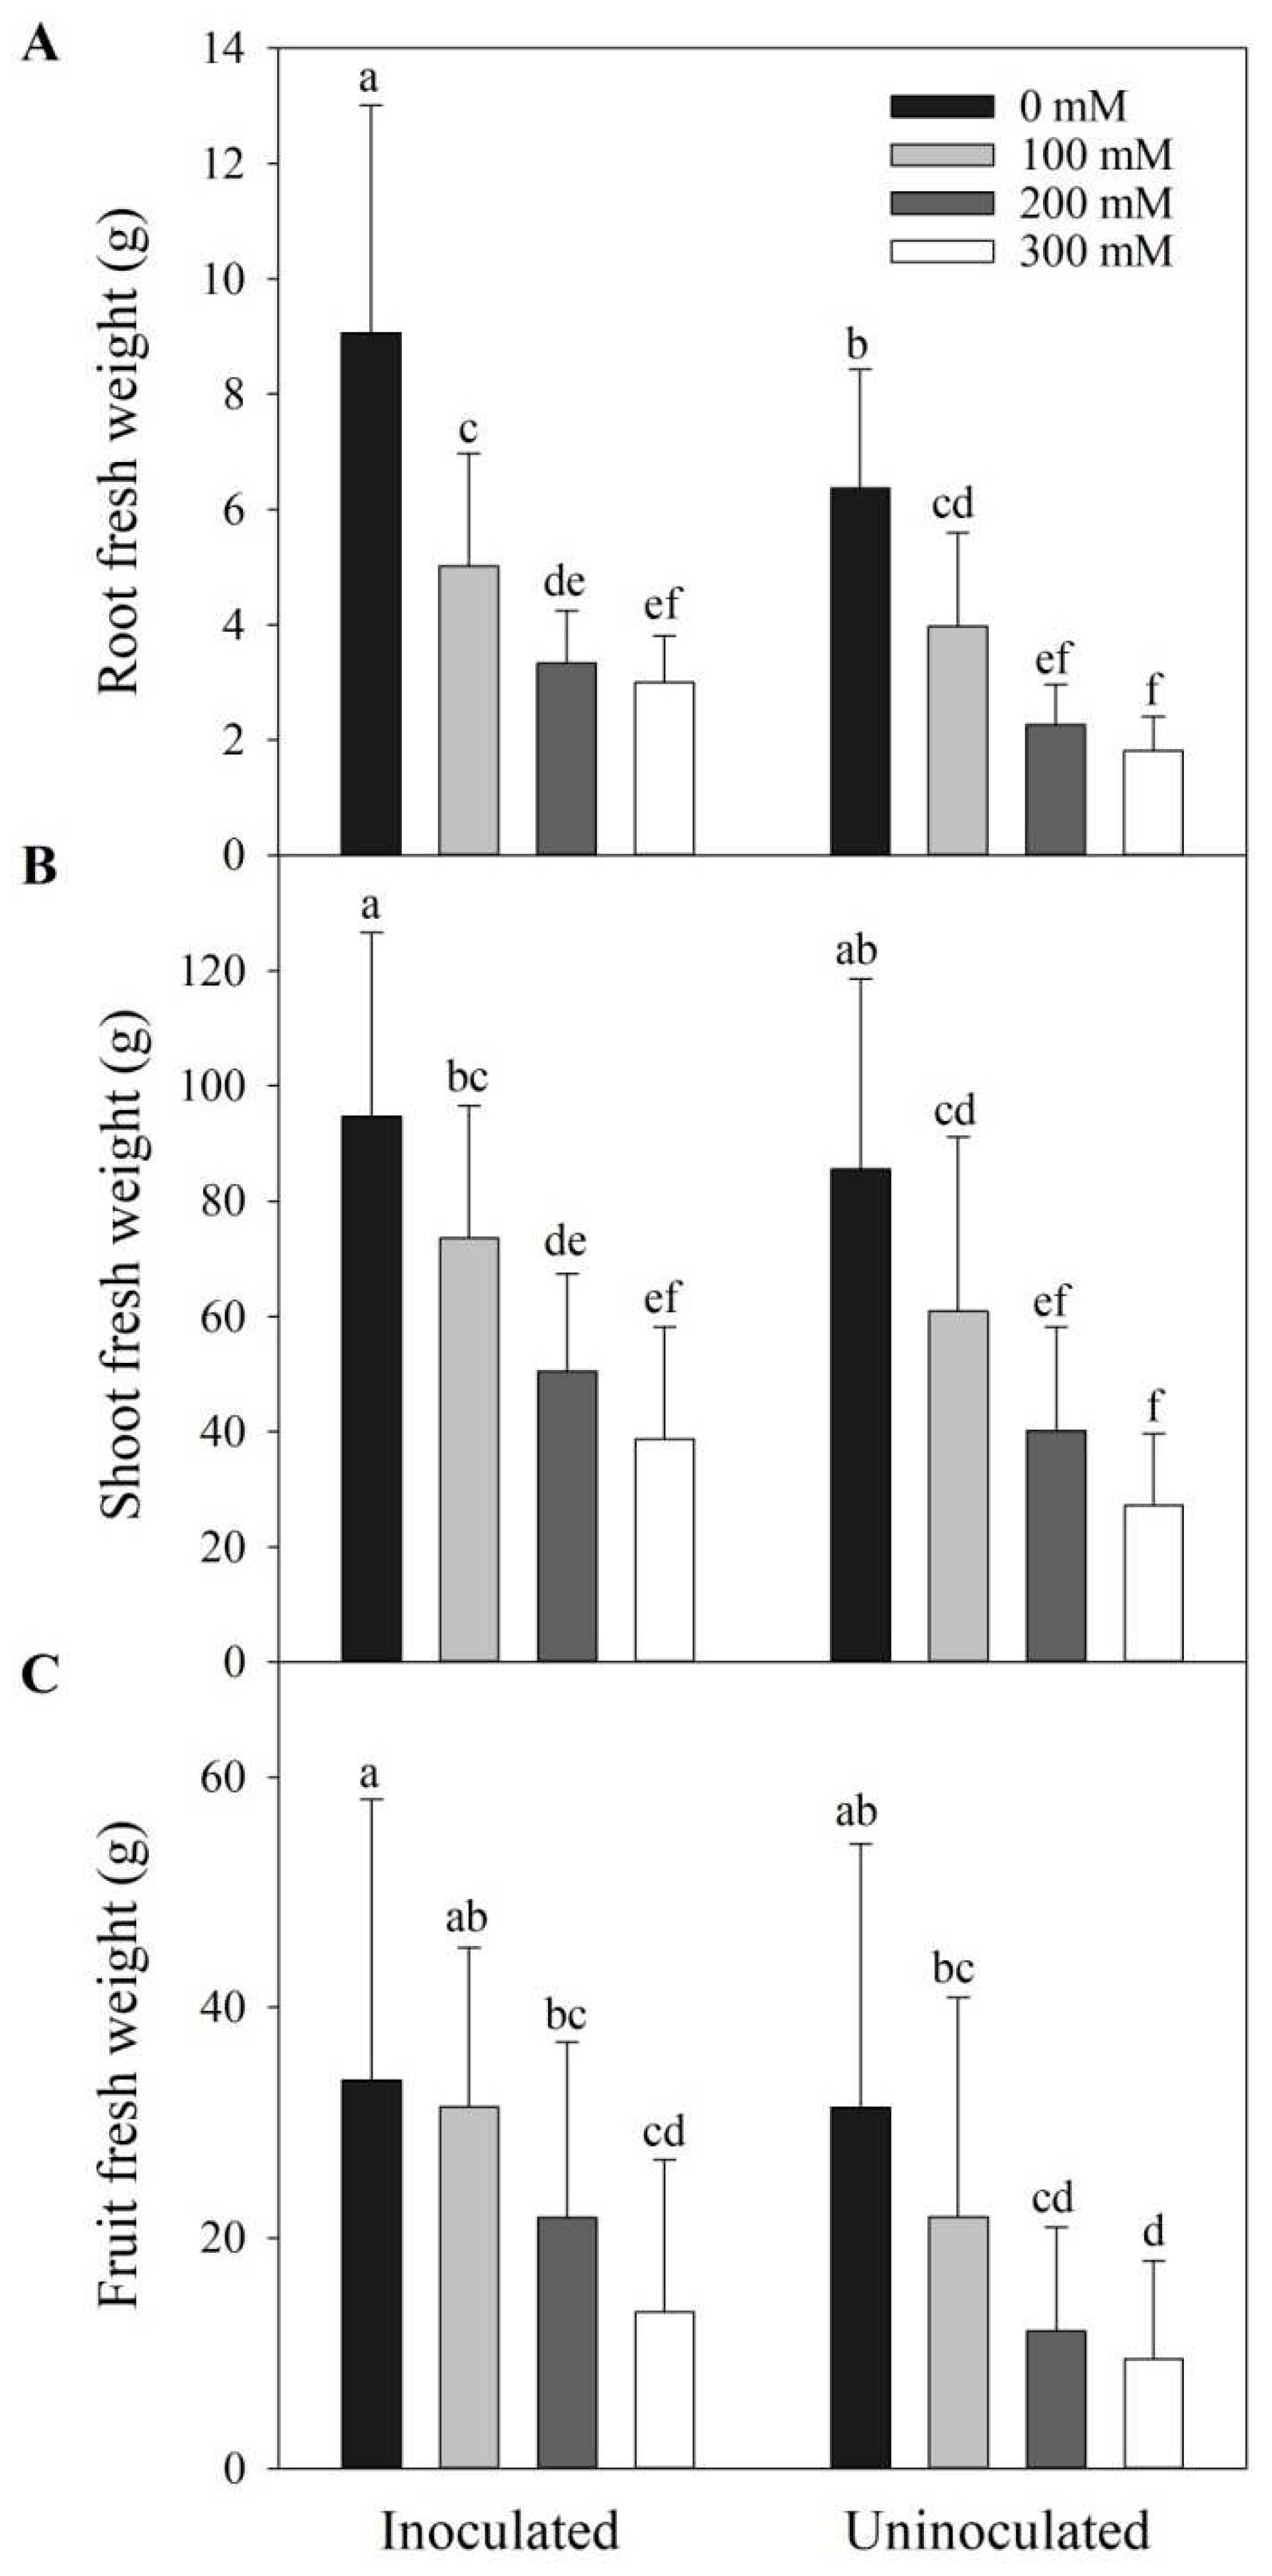
Figure 4.
The effects of Megu inoculation on concentrations of ascorbate (AsA, A), glutathione (GSH, B), and proline (C) in the leaves of tomato plants under different NaCl concentrations. Data were shown as mean ± SD. Data the same parameter with different lowercases were significantly different (n=3, p < 0.05, LSD).
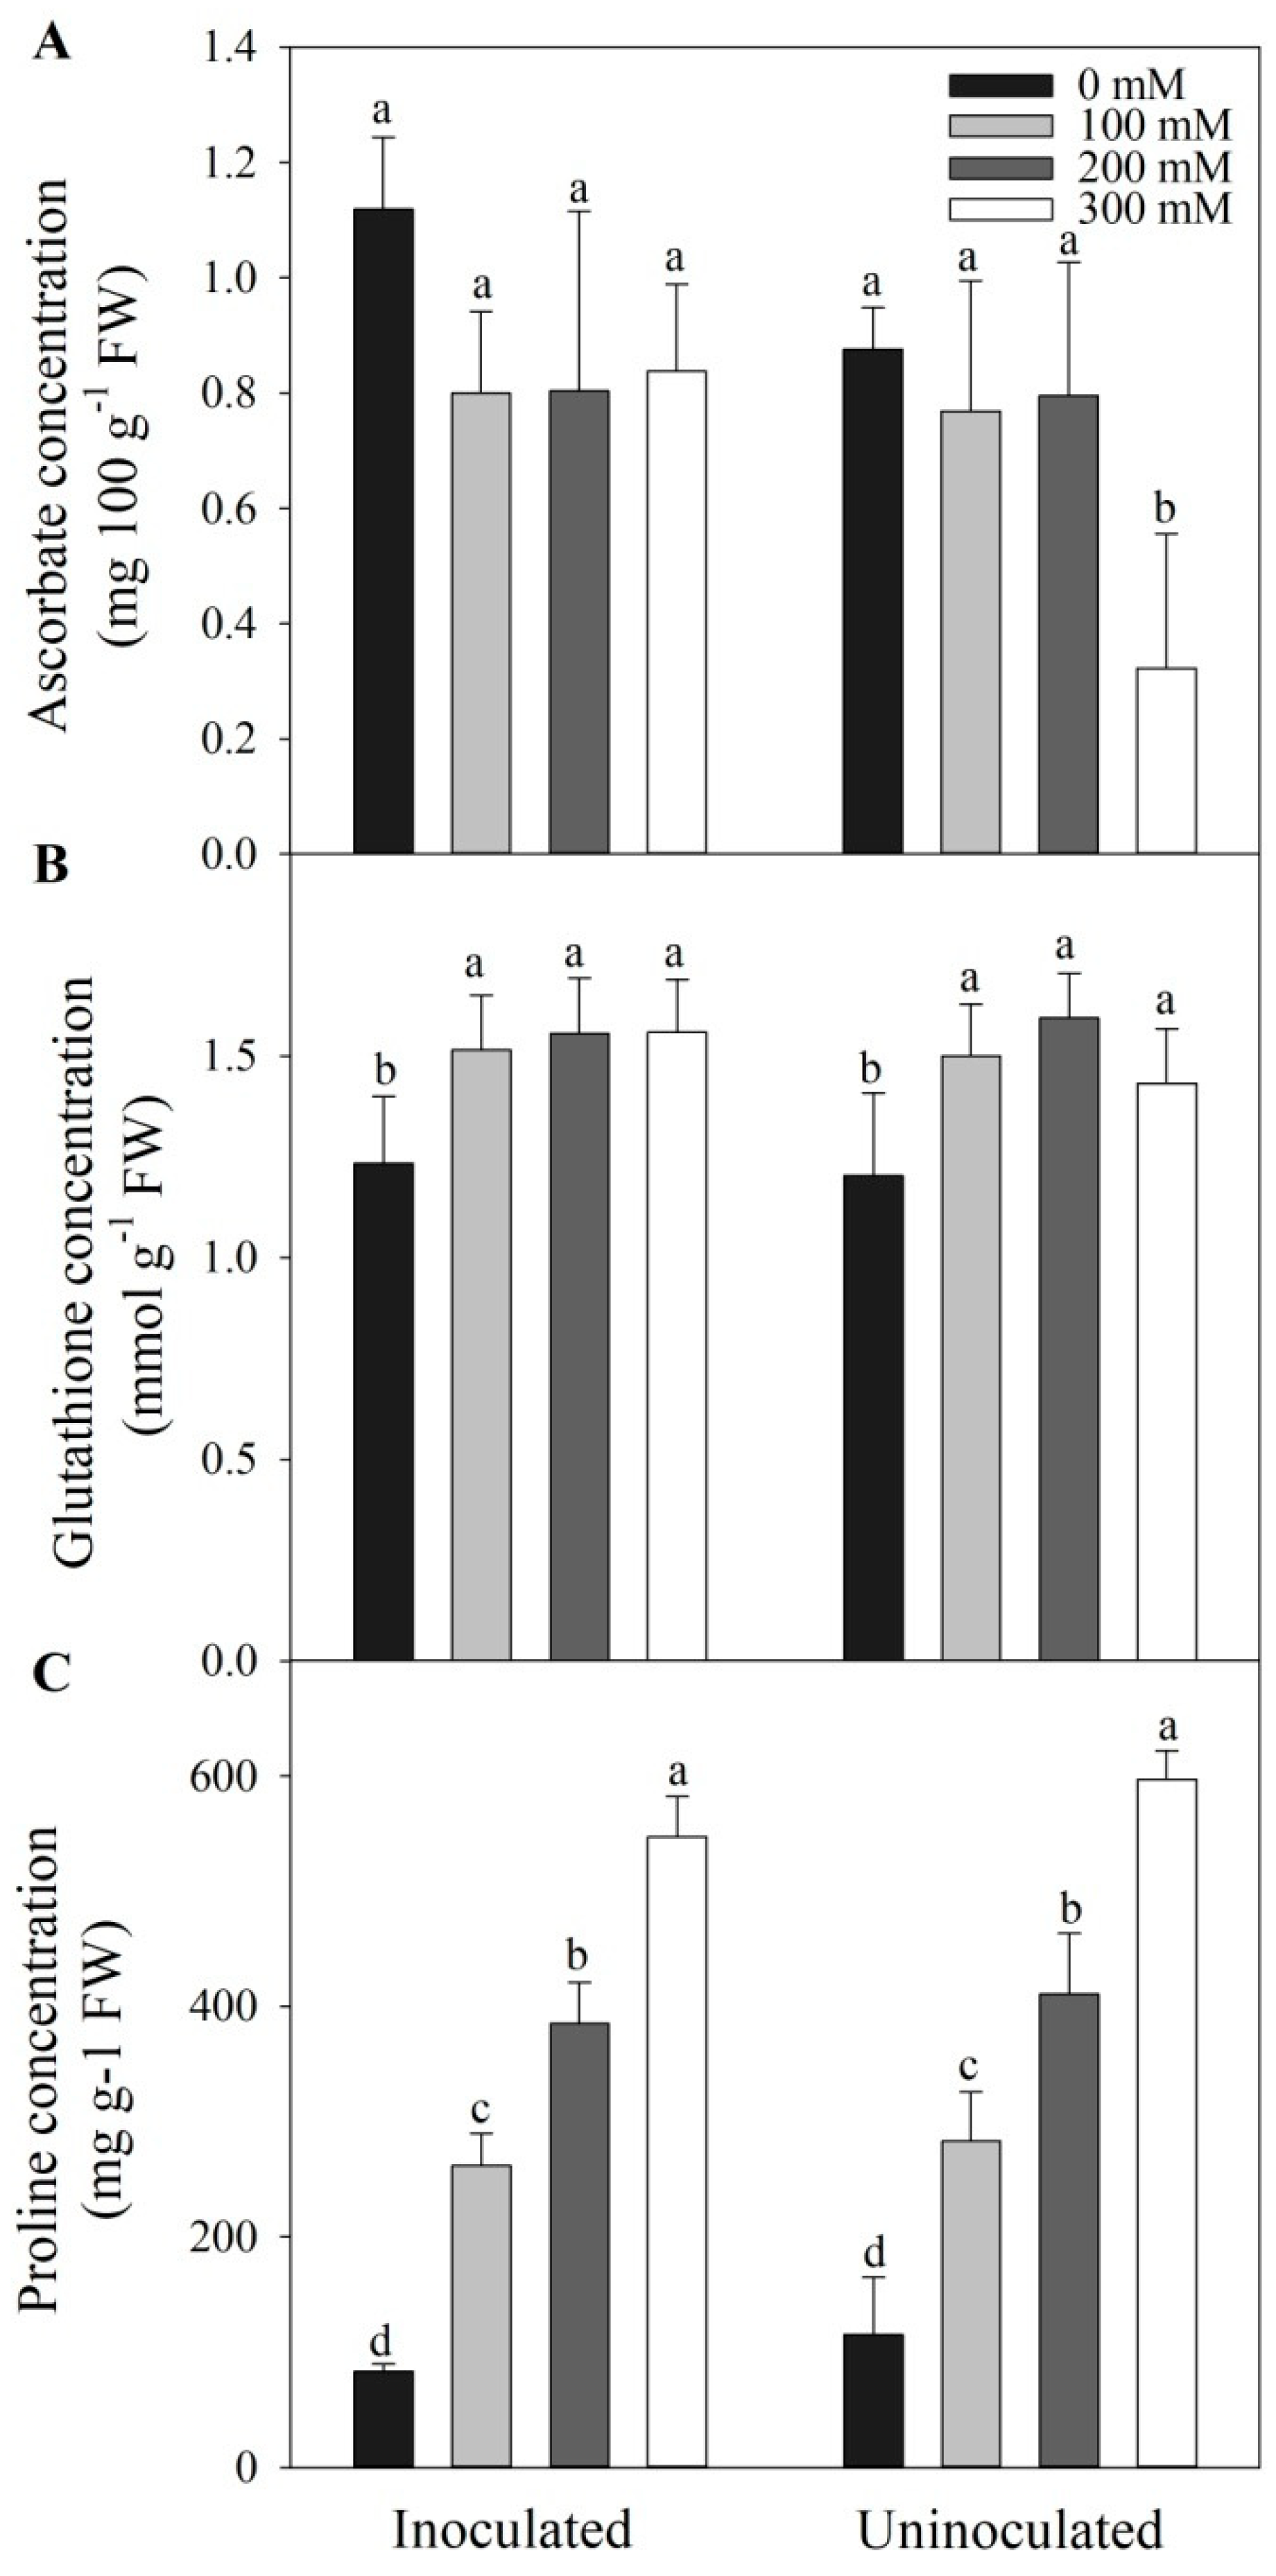
Figure 5.
The effects of Megu inoculation on activities of superoxide dismutases (SOD, A), catalases (CAT, B), and peroxidases (POD, C) in the leaves of tomato plants under different NaCl concentrations. Data were shown as mean ± SD. Data of the same parameter with different lowercases were significantly different (n=3, p < 0.05, LSD).
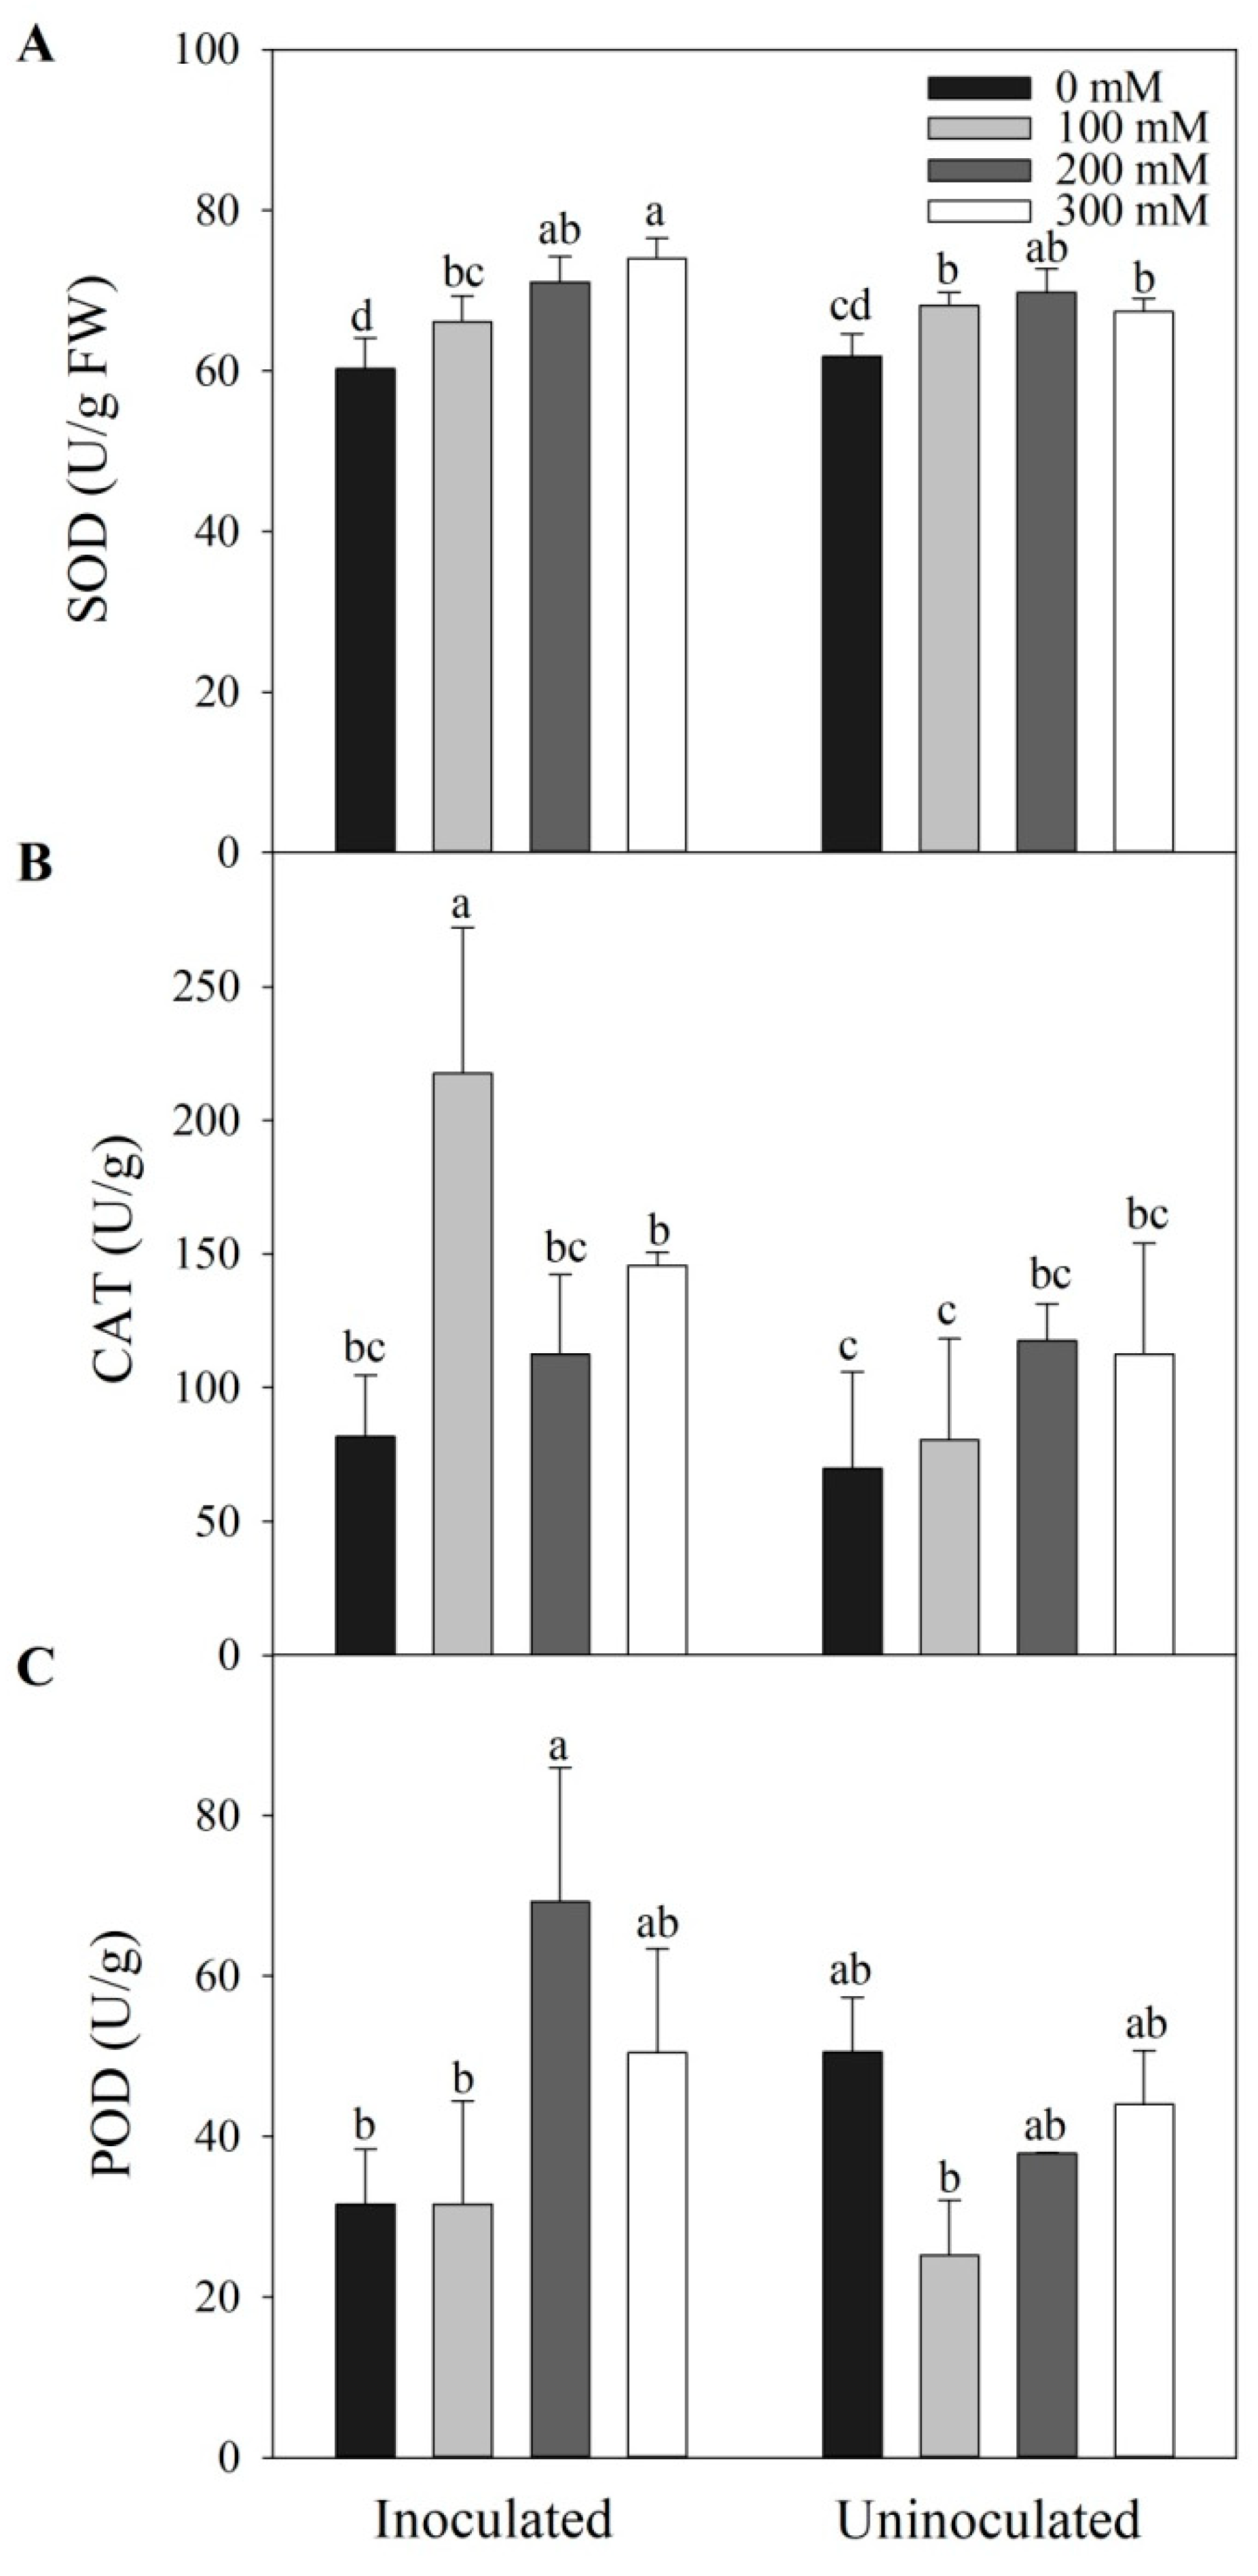
Figure 6.
The effects of Megu inoculation on concentrations of total soluble sugars (A) and total soluble proteins (B) in the leaves of tomato plants under different NaCl concentrations. Data were shown as mean ± SD. Data of the same parameter with different lowercases were significantly different (n=3, p < 0.05, LSD).
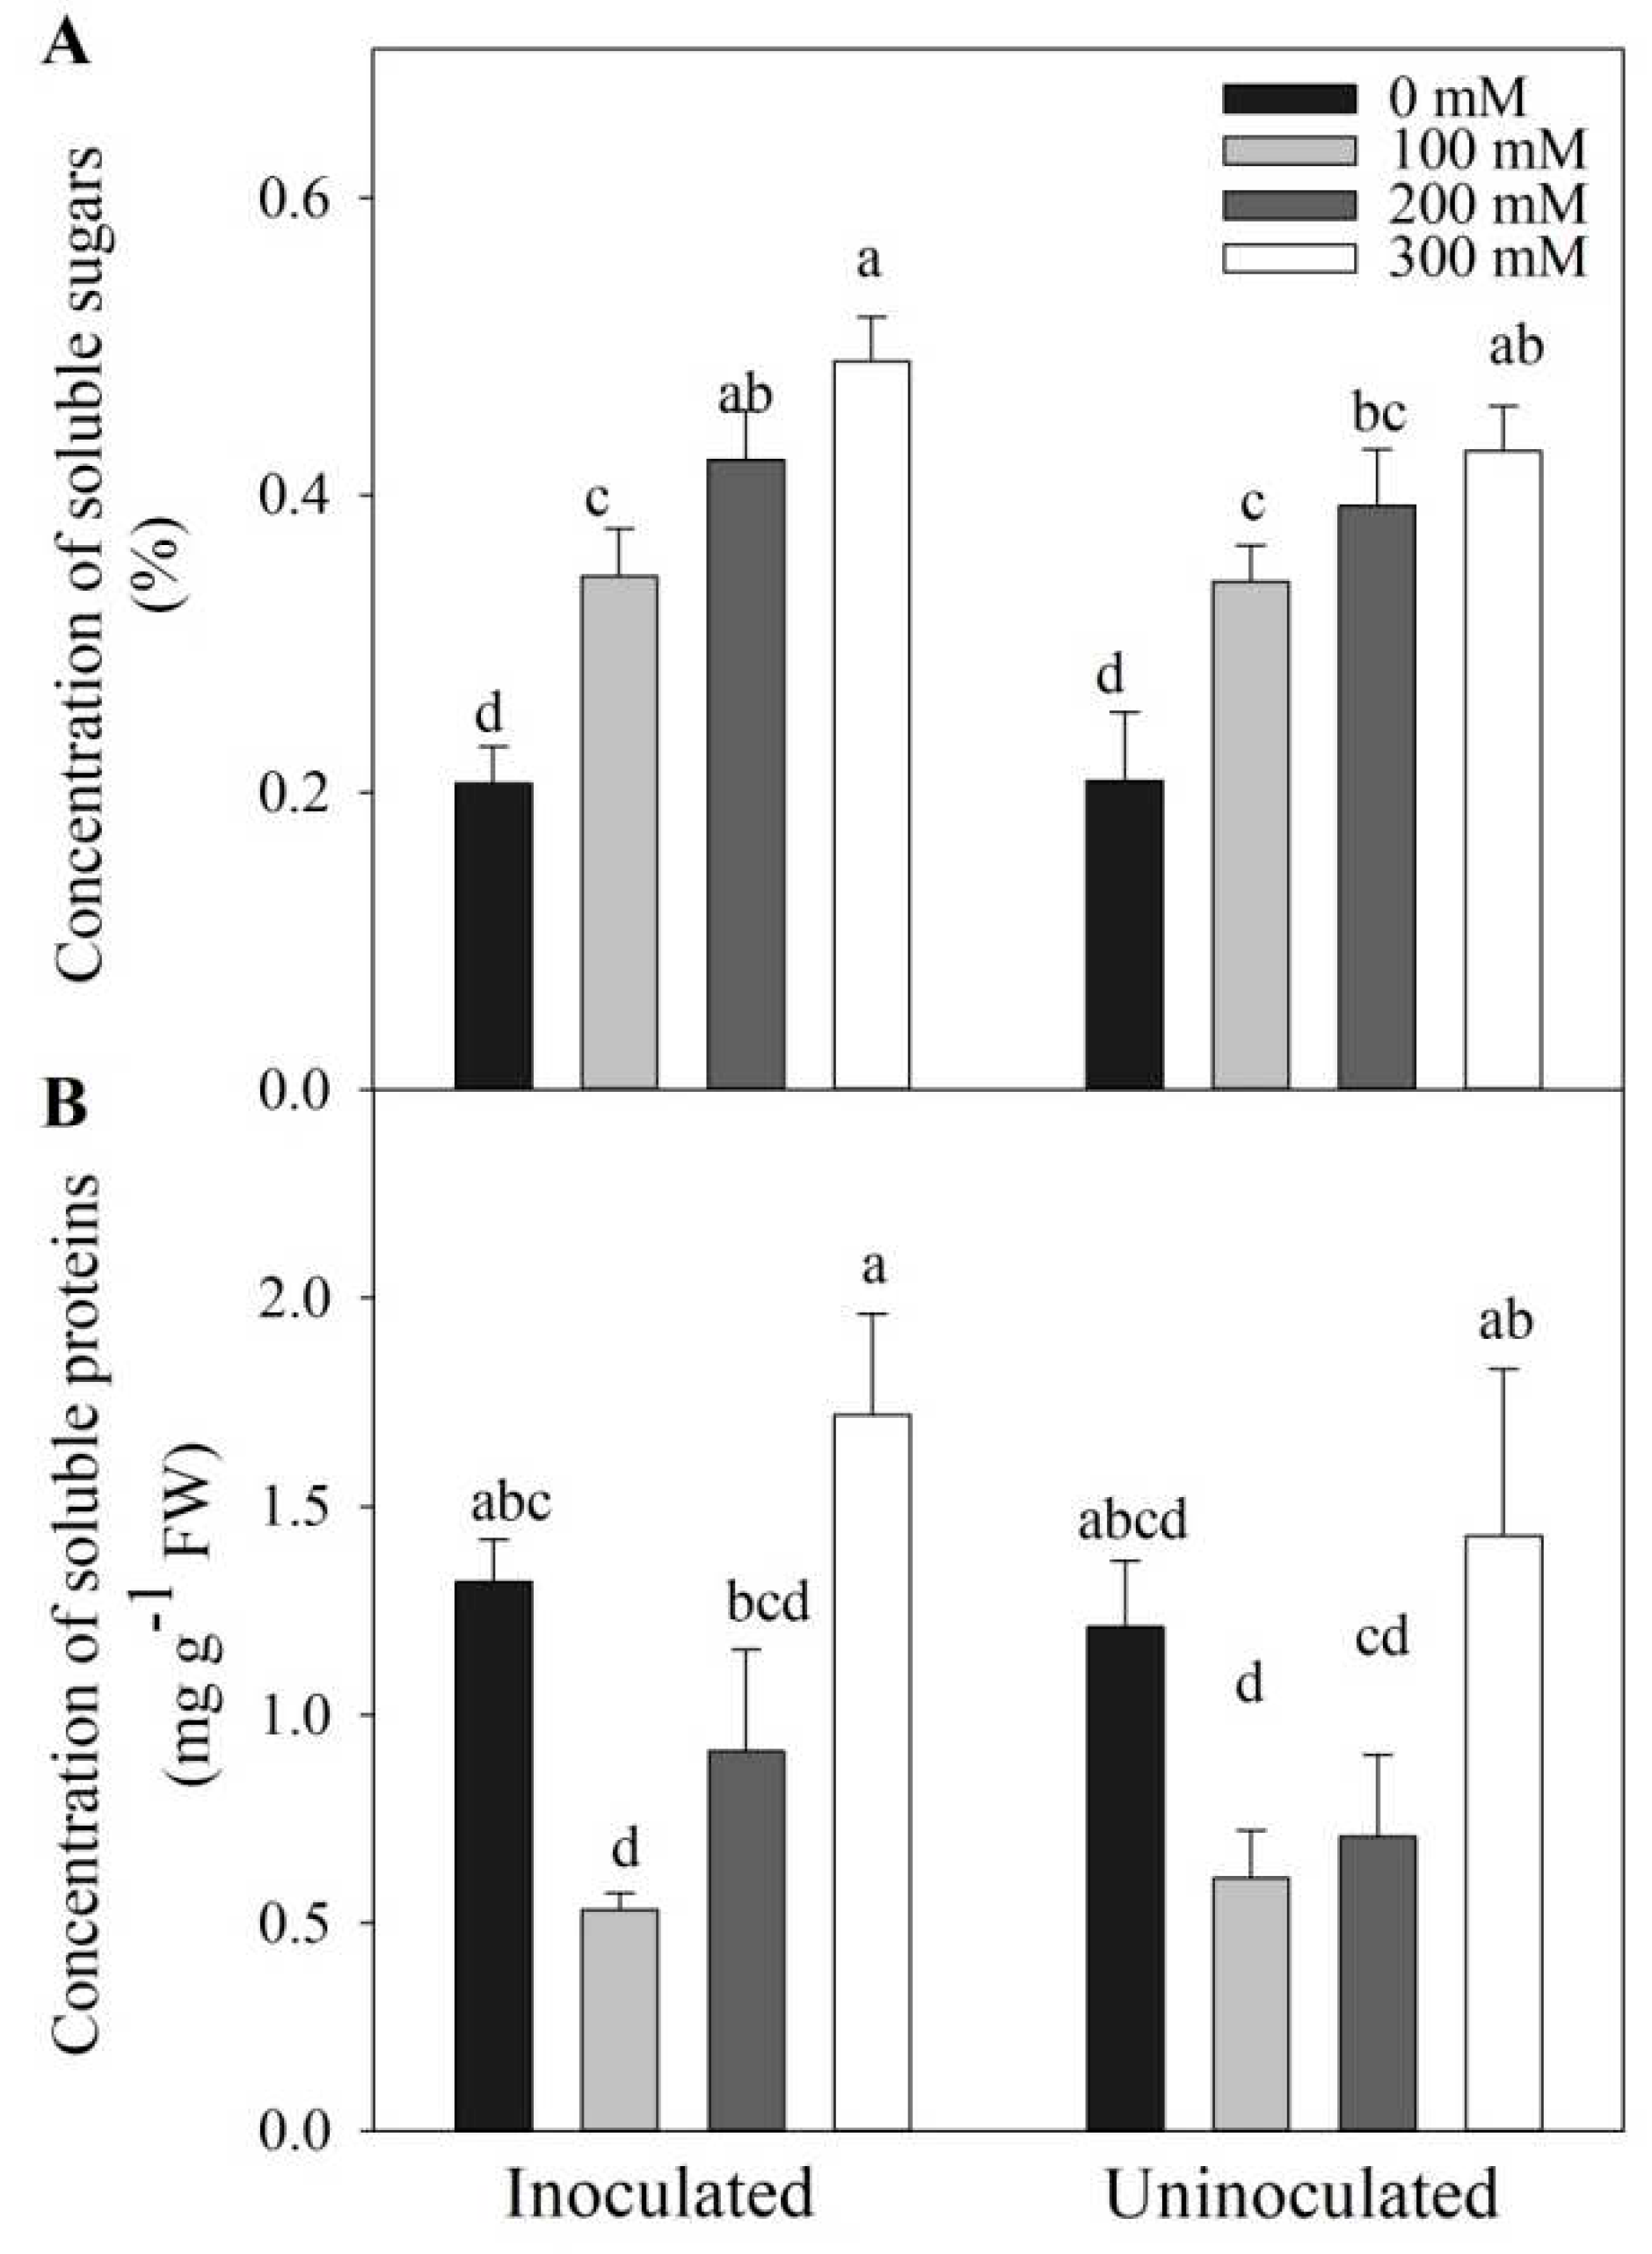
Figure 7.
The effects of Megu inoculation on concentrations of H2O2 (A) and MDA (B) in the leaves of tomato plants under different NaCl concentrations. Data were shown as mean ± SD. Data of the same parameter with different lowercases were significantly different (n=3, p < 0.05, LSD).
Figure 7.
The effects of Megu inoculation on concentrations of H2O2 (A) and MDA (B) in the leaves of tomato plants under different NaCl concentrations. Data were shown as mean ± SD. Data of the same parameter with different lowercases were significantly different (n=3, p < 0.05, LSD).
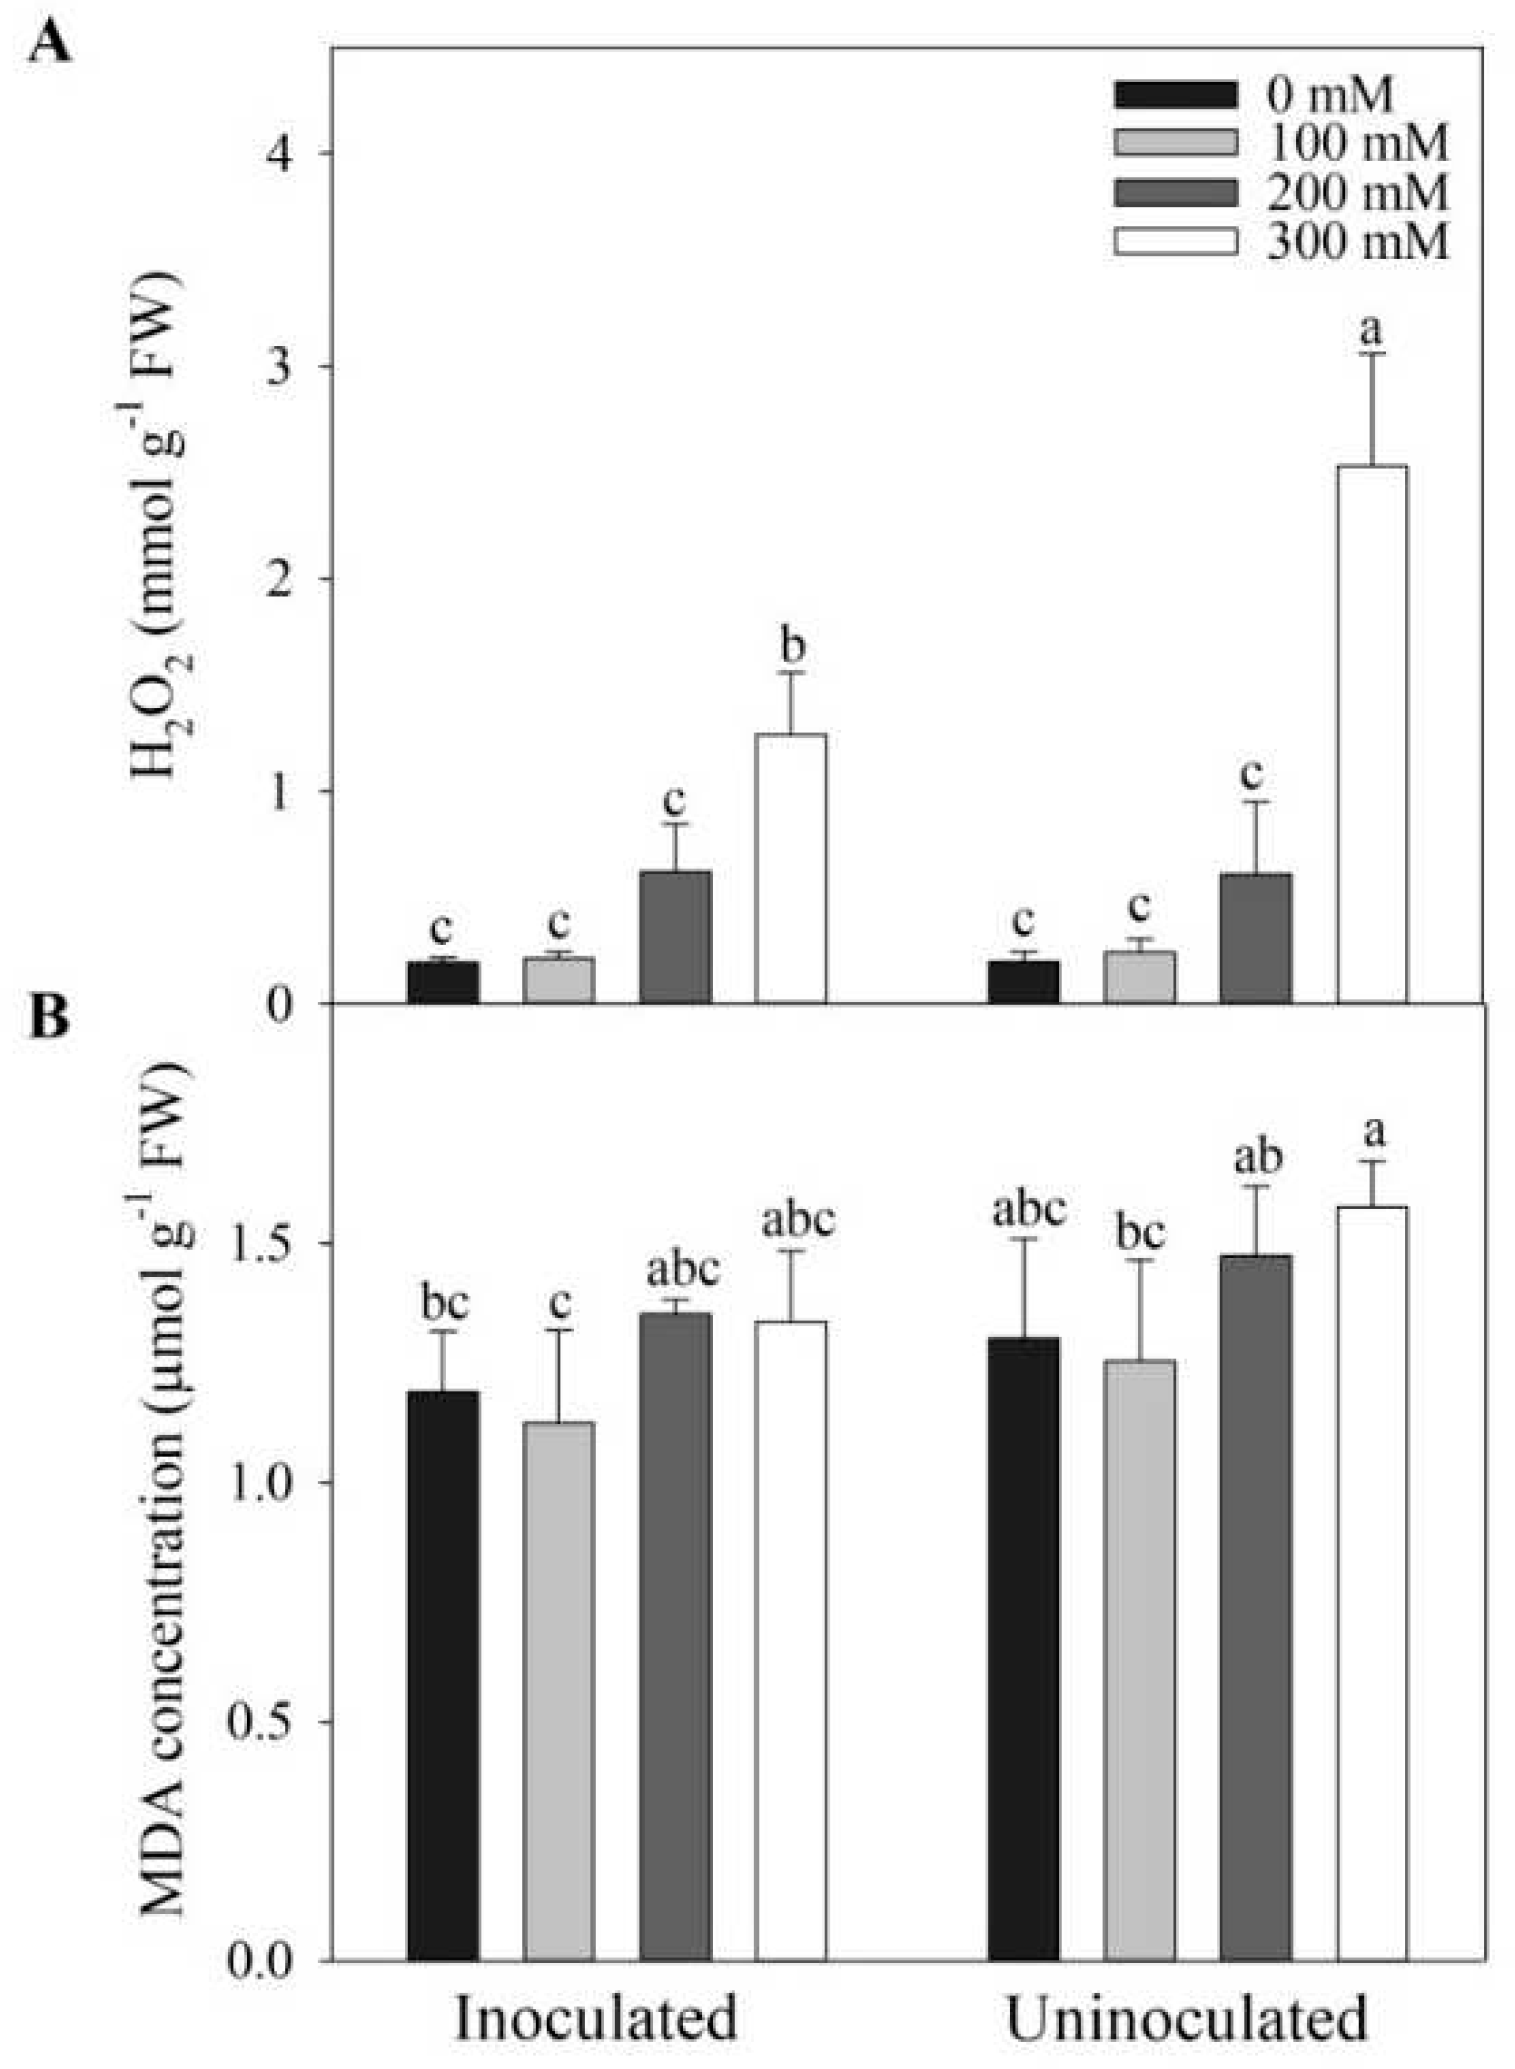

Table 1.
The effects of M. guilliermondii (Megu) inoculation on concentrations of photosynthetic pigments of tomato plants under different NaCl concentrations.
Table 1.
The effects of M. guilliermondii (Megu) inoculation on concentrations of photosynthetic pigments of tomato plants under different NaCl concentrations.
| Pigment level (mg/g FW) | NaCl concentrations (mM) | ||||
|---|---|---|---|---|---|
| 0 | 100 | 200 | 300 | ||
| Chl a | N | 17.29 a | 18.58a | 18.06a | 16.41ab |
| Y | 17.92 a | 14.16 b | 18.98a | 18.05 a | |
| Chl b | N | 7.31abc | 8.95a | 7.94 ab | 7.09bc |
| Y | 7.54ab | 5.74c | 8.51 ab | 7.97 ab | |
| Carotenoids | N | 2.89ab | 2.84ab | 3.10a | 2.83 ab |
| Y | 3.08 a | 2.52 b | 3.02 a | 2.92 ab | |
| Total Chl | N Y |
24.60 a 25.46 a |
27.53a 19.90b |
26.00 a 27.49 a |
23.51 ab 26.01a |
Note: N indicates non-inoculated; Y indicates inoculated plants. Each value represents the mean of three replicates of each treatment. For each biochemical parameter, data with different lowercases show significant difference (n=3, P< 0.05, LSD).
Table 2.
The effects of Megu inoculation on fluorescence parameters of tomato plants under different NaCl concentrations.
Table 2.
The effects of Megu inoculation on fluorescence parameters of tomato plants under different NaCl concentrations.
| Fluorescence parameter | NaCl concentrations (mM) | |||||
|---|---|---|---|---|---|---|
| 0 | 100 | 200 | 300 | |||
| Y(II) | N | 0.56 e | 0.61 b | 0.58 d | 0.58 d | |
| Y | 0.59 c | 0.58 d | 0.61 b | 0.62 a | ||
| ETR | N | 29.51 g | 31.88 c | 30.51 d | 30.30 de | |
| Y | 30.19 e | 29.79 f | 32.15 b | 32.71 a | ||
| qP | N | 0.90 g | 0.95 d | 0.91 f | 0.93 c | |
| Y | 0.93 e | 1.00 a | 0.98 b | 0.96 c | ||
| qL | N | 0.78 f | 0.86 d | 0.79 f | 0.84 e | |
| Y | 0.85 de | 1.01 a | 0.94 b | 0.90 c | ||
| Y(NO) | N | 0.42 a | 0.37 c | 0.40 b | 0.40 b | |
| Y | 0.41a | 0.40 b | 0.37 c | 0.36 d | ||
| Fv/Fm | N | 0.62 c | 0.63 b | 0.62 c | 0.62 c | |
| Y | 0.60d | 0.60 d | 0.64 a | 0.64 a | ||
Note: N indicates n on-inoculated; Y indicates inoculated plants. Each value represents the mean of three replicates of each treatment. For each fluorescence parameter, data with different lowercases show significant difference (n=25~30, p < 0.05, LSD).
Disclaimer/Publisher’s Note: The statements, opinions and data contained in all publications are solely those of the individual author(s) and contributor(s) and not of MDPI and/or the editor(s). MDPI and/or the editor(s) disclaim responsibility for any injury to people or property resulting from any ideas, methods, instructions or products referred to in the content. |
© 2023 by the authors. Licensee MDPI, Basel, Switzerland. This article is an open access article distributed under the terms and conditions of the Creative Commons Attribution (CC BY) license (http://creativecommons.org/licenses/by/4.0/).
Copyright: This open access article is published under a Creative Commons CC BY 4.0 license, which permit the free download, distribution, and reuse, provided that the author and preprint are cited in any reuse.


