
Submitted:
01 August 2023
Posted:
03 August 2023
You are already at the latest version
Abstract
This trial was carried out to find out the effects of the parent flocks and the hatching time of broiler chickens on the production traits and bacteriota development of animals. Two times 730 hatching eggs were collected from two different parent flocks with age of 22-23 and 65-66 weeks. In the hatchery both groups were divided into two subgroups, when the day-old chickens were separated according to their hatching time. A feeding trial was carried out afterwards, using the 4 treatments in 6 replicate floor pens, feeding commercial starter, grower, and finisher diets, that contained all the nutrients according to the breeder’s recommendations. The day-old chickens of the parent older flock and those hatched later were heavier and this advantage of the birds remained until end of the production period. The different age and origin of parent flocks failed to modify the microbiological parameters of the chicken’s ceca. However, the hatching time significantly influenced the different bacteriota diversity indices. The late hatched chickens showed higher Bacteroidetes and Actinobacteria and lower Firmicutes abundances at day 11. These treatments resulted differences in the main families, Ruminococcaceae, Lactobacillaceae, Bacteroidaceae. These differences could not be found at day 39.
Keywords:
broiler chickens
; parent flock age
; hatching time
; production traits
; bacteriota composition
; ceca
1. Introduction
It is well known that the stability of the intestinal flora greatly contributes to the efficient use of nutrients in farm animals. The initial contact with the hen greatly contributes to the development of the intestinal flora [1]. This relationship with the hens is missing during intensive production systems in the hatcheries. Therefore, the establishment of intestinal flora for example in broiler chickens is more accidental and influenced by several environmental factors [1,2,3]. Another important issue that can modify the vitality and the production potential of the chickens is the length of hatching window. This means that the chicks in the hatchery do not hatch at the same time. While some animals spend only a short time in the brooder, other chicks can spend even 20-24 hours without access to feed and water. Our hypothesis was, that beside the differences in the physiological and metabolic status of the early and late hatched chickens, the time spent in the brooder means also more time for the early hatched animals to be colonized with the spore-forming bacteria on the eggshell surface. Little is known about this effect on the early development of the intestinal microbiota [4,5].
It is well known that the weight of the eggs and the also the weight of the day-old chickens increase with the age of the parent stock [6]. Chicks of the older old hens are heavier and exhibit significantly higher growth rate than the chicks from the younger flocks [7,8]. During the development of the chicken embryo, it has been estimated that more than 90% of the total energy requirement is derived from yolk lipids [9]. According to the results of Hamidu et al. [10] the breed and age of the parent stock influence the daily embryonic metabolism, which is almost exclusively fuelled by lipids. It is also well known that the older broiler breeder hens produce eggs with higher total pore number than the young ones. Changes in eggshell structure also modify the conductance of oxygen and carbon dioxide across the eggshell [11,12,13]. However, it is not known whether this eggshell characteristic could have an influence on the development of the intestinal microbiota in the embryo or day-old chicken.
The aim of this study was to investigate the effects of the age of the parent stock and the hatching time on the performance parameters and cecal microbiota composition of broiler chickens.
2. Materials and Methods
2.1. Egg collection and Hatching
Eggs were collected from a 22-23 and a 65–66-week-old flock from different farms. 730 eggs were collected per farm and transported in air-conditioned trucks to the hatchery (Gallus Ltd., Devecser, Hungary). The eggs were disinfected with formalin fumigation, with paraformaldehyde at a concentration of 7g/m3. The hatching was started on the seventh day after laying, in Petersime Bio Streamer 24S type pre-hatching machines. The temperature, relative humidity, CO2 content of the air and the rotation of the eggs were automatically performed by the hatching machine according to the standard hatching protocol. On day 18, infertile, dead, damaged, and rotten eggs were selected with candling. All the fertile eggs were than vaccinated against infectious bronchitis (Cevac Bron 120 L, Ceva-Phylaxia, Budapest), Newcastle disease (Cevac Vitapest) and infectious bursal disease (IBD) (Cevac Transmune) with an automatic equipment (Embrex Inovoject, Zoetis Inc., New York, USA). After inoculation, the machine automatically moved the eggs to brooding trays. The environmental parameters of the brooders were controlled also automatically according to the normal hatching protocol. On the 21st day, the hatching time was examined. The 280 chicks that hatched from the eggs first (early hatched) and those 280 hatched at the end of the hatching period (late hatched) were collected separately for each parent flock.
2.2. Animal Experiment and Treatments
A floor pen trial was conducted at the experimental farm of the Institute of Physiology and Nutrition, Hungarian University of Agriculture and Life Sciences (Georgikon Campus, Keszthely, Hungary). The animal experiment was approved by the Institutional Ethics Committee (Animal Welfare Committee, Georgikon Campus, Hungarian University of Agriculture and Life Sciences) under the license number MÁB-5/2022. All husbandry and euthanasia procedures were carried out in accordance with the Hungarian Government Decree 40/2013 and in full consideration of animal welfare ethics.
From the total 280 chickens of each parent flock and hatching time group 144 birds were selected with similar live weight and transported to the experimental farm. The total of 576 chickens were allocated into four treatment groups with 6 replicate floor pens of 24 chickens per pen. The following treatments and abbreviations were used: young parent stock and early hatched chickens (YE); young parent stock and late hatched chickens (YL); old parent stock and early hatched chickens (OE); old parent stock and late hatched chickens (OL).
During the experiment, computer-controlled housing and climate conditions were maintained according to the breeder’s recommendations. Feed and water were available ad libitum throughout the whole experiment. Corn – soybean-based diets were fed in all groups. The nutrient content of the diets met the requirements of Ross 308 broiler chickens [14]. Three phases were used during fattening. The starter diets (0–10 days) were fed in mash; the grower (11–24 days) and finisher feeds (25–39 days) in pelleted form. The composition and nutrient content of the diets is shown in Table 1.
2.3. Measurements and Sample Collection
During the 39-day-long fattening period, the body weight (BW) of all animals was measured at day 0 and at the end of each feeding phase. Feed intake (FI), body weight gain (BWG), and feed conversion ratio (FCR) were calculated on pen basis for each phase and for the entire period. On days 11 and 39, 2 chickens per pen were selected randomly, slaughtered, and digesta samples collected. Cecum chymus samples were collected from the left sac. The luminal contents were homogenized with sterile cell spreaders and about 2 g sample was taken into a sterile container. All samples were immediately snap-frozen and stored at −80 °C until analysis. Before DNA extraction, the samples of two birds of the same pen were pooled.
2.4. DNA Extraction, 16S rRNA Gene Amplification and Illumina MiSeq Sequencing
The extraction of the bacterial DNA was carried out using the AquaGenomic Kit (MoBiTec GmbH, Göttingen, Germany) and further purified using KAPA PureBeads (Roche. Basel. Switzerland) according to the manufacturer’s protocols. The genomic DNA was investigated using a Qubit 3.0 Fluorometer with a Qubit dsDNA HS Assay Kit (Thermo Fisher Scientific Inc., Waltham, MA, USA). Bacterial DNA was amplified with tagged primers covering the V3–V4 region of the bacterial 16S rRNA gene [19]. Polymerase chain reactions (PCR) and DNA purifications were performed according to Illumina’s demonstrated protocol (Illumina Inc., 2013). PCR product libraries were defined and qualified using High Sensitivity D1000 ScreenTape on TapeStation 2200 instrument (Agilent Technologies, Santa Clara, CA, USA). Equimolar concentrations of libraries were pooled and sequenced on an Illumina MiSeq platform using a MiSeq Reagent Kit v3 (600 cycle; Illumina Inc., San Diego, CA, USA) 300-bp read length paired-end protocol. Raw sequence data of 16S rRNA metagenomics analysis were deposited in the National Center for Biotechnology Information (NCBI) Sequence Read Archive, under the BioProject identifier PRJNA996958.
2.5. Bioinformatics and Statistical Analyses
Bacteria were identified by the analysis of the V3–V4 region of the 16S rRNA gene using Illumina MiSeq platform. Sequences were analysed using Quantitative Insights Into Microbial Ecology 2 (QIIME2), version 2020.2 software package [15]. Sequences were filtered based on quality scores and the presence of ambiguous base calls using the quality-filter q-score options. Representative sequences were found using a 16S reference as a positive filter, as implemented in the deblur denoise-16S method. Sequences were clustered into Operational Taxonomic Units (OTUs) using vsearch algorithm open-reference clustering, based on a 97% similarity to the SILVA reference database [16]. Alpha diversity metrics (Chao1, Shannon, and Simpson) and beta diversity metrics (Bray–Curtis dissimilarity) were estimated using Qiime2-diversity and Microbiomanalyst online software after samples were rarefied to 1000 sequences per sample [17]. To examine the differences in the microbial community structure between samples, SPSS software was used. To verify the significance of bacterial community, an analysis of similarities (ANOSIM) and calculations were performed with 999 permutations.
The results of hatchability were evaluated using the Fisher exact test of the R Statistic programme [18]. The production traits and microbiota composition data were evaluated using the two-way analysis of variance of the SPSS statistical software, version 23.0 (IBM Corp. Released 2015), using the hatching time and the age of the parent flocks as main factors. The microbial composition at different taxonomical levels were compared using two-way ANOVA test with Benjamini–Hochberg false discovery rate correction (FDR p-value). Statistical significance was defined as FDR p < 0.05, whereas FDR p-value between 0.05 and 0.10 was considered as a trend.
3. Results
3.1. Hatchability
The age of the parent flock did not influence the percentage of fertile eggs, damaged eggs or rotten eggs. However, the egg hatchability of the younger parent flock was significantly higher (Table 2).
3.2. Production traits of birds
Both the hatching time and the age of the parent flock resulted significant differences in the hatching weight of the chickens. The hatching weight of the chickens of the older parent flock and those hatched later was significantly higher (Table 3.). The advantage of the day-old chickens, descended from the older parent stock remained until the end of the fattening period, and resulted significantly higher growth rate and better feed conversion ratio. The differences in the production traits between the early and late hatched chickens were less, but the cumulative weight gain of the late hatched chickens was also significantly higher.
3.3. Microbiota analyses
In this study from all 48 samples, a total of 799.166 good-quality 16S rRNA reads were available for analysis after quality filtering. The average sequence numbers were 16.649 (min: 3136; max: 24402) respectively. These sequences were assigned to 701 OTUs at 97% similarity using the open approach.
3.3.1. Alpha and beta diversity
The Shannon, and Simpson diversity indices demonstrated that the microbiota of early hatched birds was more diverse than that of the late hatched chickens at day 11. (Table 4). No such differences in the alpha diversity have been found at day 39. (Table 5).
Alpha diversity indices were compared using two-way ANOVA, using the hatching time (early, late) and the age of parents (young, old) as main factors. The differences were considered significant at a level of p ≤ 0.05.

Table 5.
Alpha diversity indices of the cecum chymus at day 39.
| Parent flock age | p-values | ||||||
|---|---|---|---|---|---|---|---|
| Hatching time | Young parent | Old parent | Average (Hatching time) | Hatching time | Parent flock age | Interaction | |
| Chao 1 | Early | 380.614 | 367.537 | 374.076 | 0.100 | 0.951 | 0.438 |
| Late | 335.548 | 350.850 | 344.474 | ||||
| Average (Age) | 360.130 | 358.552 | |||||
| Shannon | Early | 4.318 | 4.189 | 4.254 | 0.800 | 0.889 | 0.429 |
| Late | 4.174 | 4.264 | 4.382 | ||||
| Average (Age) | 4.252 | 4.229 | |||||
| Simpson | Early | 0.958 | 0.951 | 0.954 | 0.741 | 0.667 | 0.295 |
| Late | 0.941 | 0.960 | 0.966 | ||||
| Average (Age) | 0.951 | 0.955 | |||||
Alpha diversity indices were compared using two-way ANOVA, using the hatching time (early, late) and the age of parents (young, old) as main factors. The differences were considered significant at a level of p ≤ 0.05.
Beta-diversity based on principal coordinate analysis (PCoA) ordination using Bray–Curtis dissimilarity matrix showed a significantly different (PERMANOVA R-squared = 0.087 p = 0.004) bacterial community structure between the chickens of the two hatching times (Figure 1A) at 11 day of age. This difference was not showable at the age of 39 days (R-squared = 0.056 p = 0.18; Figure 1B). No significant differences due to parent flock age at day 11, (R-squared = 0.051 p = 0.239; Figure 1C) or day 39 (R-squared = 0.034 p = 0.643; Figure 1D) was revealed.
3.3.2. Taxonomic Composition of Cecal Microbiota at Phylum Level
At day 11 six, while at day 39 eight phyla were identified in the cecal contents of the birds (Table 6 and Table 7.). At both time points, Firmicutes was the major dominant phylum in the cecum followed the Bacteroidetes and Tenericutes. Minor phyla were Proteobacteria, Cyanobacteria and Actinobacteria. At 39 days Epsilonbacteraeota and Euryarchaeota appeared in a small proportion. The age of the parent flocks failed to influence the bacteriota composition of the ceca at phylum level. On the other hand, at day 11 the time of hatching affected the abundances of 3 phyla significantly (Table 6). Firmicutes was present at a higher abundance in the early-hatched birds, (88.488%–77.39%; p = 0.048), while the phyla Bacteroidetes (7.982%–20.108%; p = 0.056) and Actinobacteria (0.086%–0.053%; p = 0.089) in the late-hatched animals. These differences disappeared at day 39 (Table 7).
3.3.3. Taxonomic Composition of Cecal Contents at Family Level
The detailed treatment effects are shown in Table S1-2. Both main factors, failed to result significant differences in the ratio of the bacterial families. However, similarly to the changes in phylum level, as a tendency, hatching time resulted differences in the ratio of the main families. The families above 1% abundance, as affected by the hatching time is shown on the taxa bar plot (Figure 2). There were four major family (Ruminococcaceae, Lachnospiraceae, Bacteroidaceae and Lactobacillaceae) and ten minor families above 1%. As the taxa bar plot shows, the family abundance pattern of the early and late hatched chickens is different. At this age, in the ceca of the early hatched chickens the abundance of Ruminococcaceae and Lactobacillaceae was 7% and 4.6% higher, while that of Bacteroidaceae 12.2% lower than in the 39-day old animals. Family Lachnospiraceae was not influenced by the hatching time. In accordance with the diversity and phylum results, the differences between the families disappeared at day 39.
4. Discussion
According to the literature data there are differences in the hatchability of the eggs between the young and old parent flocks [19,20,21,22]. In the study of Roque et al. [21,21] hatchability and viability (hatchability of fertile eggs) were lower in the younger, 27–31-week-old flock due to the increased early and late embryonic mortalities. This is consistent with those can be found in the breeders’ management manual [14]. In our case the fertility and the embryonic death rate was not worse in the younger flock and the hatchability was even higher. Similarly, to our results Abudabos et al. [22] found higher mid-term dead embryos from older hens. Egg storage before hatching could also be a factor, which depresses egg albumen Haugh units (HU) and chick quality [20]. This effect is greater in old, 45-week-old breeding hens. Of course, these results are affected by several environmental and nutritional factors, also including the exact age of the flocks.
It is also well known that the breeder’s age influences the weight of the egg and the day-old chicken [7,8,23] and this body weight effect can be persisting until slaughter [24]. Our experiment proves these results and confirms, that broiler chickens have limited compensatory potential due to their almost continues feed intake and the short fattening period.
After the chick hatches and the remaining yolk complex is withdrawn into the abdominal cavity, the lipid assimilation and metabolism of the yolk continues and is sufficient to adequately maintain the chick for several days after hatching [9]. The time of hatching resulted in our trial significantly higher hatching weight for birds hatched later. The reason behind this may be the weight loss of “early” hatched chicks and the greater depletion of their glycogen stores [25]. In addition, the late hatched chickens are more mature in development at hatch [5]. There are plenty results available on the effects of feed and water deprivation on the metabolism and viability of young broiler chickens [26,27,28] The novelty of our result is that no artificial deprivations were used, but only the effects of the hatching window during a normal hatchery practice were measured. Similarly, to the parent flock age effect, the hatching time also affected the final body weight of the animals which was significant, 122 g higher final body weight in this trial. Beside the higher growth potential of the late hatched chickens, the higher variance in the day-old weight results also increase the live weight variance of the flocks later, that impairs feed conversion.
Our aim was also to find out if the different parent flocks or the hatching time of the chickens can modify the early development of the cecal microbiota. The potential impact of the parent flocks could be either the different eggshell structure or the differences in the environmental and farm conditions and this way the vertical microbiota transfer from the hens to the egg [29,30].
We could not find significant differences in the diversity indices and microbiota composition between the chickens of the two parent flocks at any time interval. Since the diets of the two flocks were identical, it means, that the bacteriota transfer via the eggs is determined mainly by genetic factors or the feed. The effects of the other farm conditions are low, probably since the bacteria cannot get through the eggshell and most of the bacteria are killed during the disinfection in the hatcheries [31].
On the other hand, hatching time caused several significant changes in the cecal bacteriota in this trial. The time interval between hatch and first feeding affects the development and function of intestinal tract [32]. The development of the intestinal tract consists of the increase of the total length and weight of the intestine, as well as the length and area of the intestinal villi [4]. The immune and thermoregulatory system of poultry, undergo significant physiological changes too. The lipids of egg yolk are the primarily source of energy during the early post hatch period [33,34]. Several factors influence the residual yolk weight at hatch, especially egg size and incubation temperature, while the breeder hens’ age affects the nutrient composition of the residual yolk [34]. The transport from the yolk sac into the intestine was observed up to 72 h after hatching [35]. In addition, it was also described that the yolk utilisation was more rapid in fed than in fasted birds suggesting that the transport of yolk through the intestine could be increased by the greater intestinal activity found in fed chicks. It is known that in the first days after hatching the deprivation of feed slows down the gut development, as reflected by lower gut weight, shorter length, lower enzyme activity, altered villi and crypt cell density, and lower crypt depth and height in the short and long term [5].
In mammals, it has been proven that microbes exist in different regions of the placenta and that microbial DNA can be transferred horizontally from mother to foetus through the placenta [30,36]. In addition, however, the structure and succession of the gut microbiota is influenced by many factors, such as the method of delivery, the birth environment, and dietary habits [37,38]. In the case of birds, the eggshell forms a barrier to microbial transfer to the embryo, but also provides an important protection against environmental pathogens [39]. In hatcheries, the newly hatched chicks have only limited contact with the hen’s microbiota [2]. This is mainly restricted to the transfer of microbes to their offspring during the egg formation process [40]. This is important, because the host’s microbes can prevent the infections, increase hatchability and can be beneficial in the early bacteriota development [41,42].
Several studies reported that the delay in access to feed may affect the microbiota development. A huge increase in microorganisms occurs in the chicken’s intestine after the first ingestion of feed [31,43,44]. According to our results the early hatched birds which were longer without feed, had more diverse caecal microbiota than the late hatched birds. The reason for this difference is not known. One explanation could be, that the early hatched chickens had more contacts with eggs in the brooder baskets and can be colonized with some spore forming bacteria that survive the disinfection in the hatchery. Disinfection reduces the bacterial load on eggshell surface from more than 104 cfu to about 103 cfu [45]. On the eggs, the dominating phyla are Firmicutes, Actinobacteria, Fusobacteria, and Tenericutes. After the fumigation process in the hatchery the ratio of Firmicutes decrease, that of Actinobacteria increase and as new phyla, Proteobacteria, Bacteroidetes and Cyanobacteria are present [45]. Disinfection results more divers egg surface bacteriota composition on lower taxonomic levels. We could not prove this hypothesis, since no changes in the spore-forming bacterial groups have been found due to the differences in the hatching time. Usually, early feed access increases the bacterial diversity in the intestine [31], but we could not find results specifically on the hatching time induced changes.
In our study, a higher abundance of Bacteroidetes, Actinobacteria and lower abundance of Firmicutes was found in the late-hatched chickens. Actinobacteria is one of the four main phyla of the cecal microbiota, and although its abundance is low, the bacteria of this phylum playing important role in maintaining the intestinal homeostasis, since they can use a wide variety of complex polysaccharides [46,47]. Several studies proved the importance of the Bacteroidetes and Firmicutes ratio in the different gut segments [48,49,50]. The frequency of the Bacteroidetes phylum is very variable (10-57%) in birds of slaughter age. An important difference between the two phyla is that while members of Firmicutes express fucose isomerase, members of Bacteroidetes express xylose isomerase [48] Members of Bacteroidetes are present mostly in the distal intestine, where they participate in supplying the host with energy obtained from feed through the fermentation of otherwise indigestible polysaccharides [51]. They are also important participants of the cross-feeding mechanisms, providing substrates for lactic acid producing bacteria and can provide extra energy if fibrous duets are fed [46,52,53]. In addition, the secretion of antimicrobial peptides is also a characteristic feature of members of the phylum, which also supports the positive ecological function of Bacteroidetes [49,54]. Furthermore, representatives of Bacteroidetes also produce propionate, resulting in a beneficial balance between maintaining homeostasis and producing sufficient energy from available nutrients [48]. In the case of the late-hatched birds, the higher frequency of Bacteroidetes and Actinobacteria phyla may be because the early-hatched animals longer only the nutrients of the yolk sac. It mostly contains mostly fats and protein, and only low amounts of carbohydrates [27]. However, the late-hatched birds got access to digestible and indigestible carbohydrates containing feed sooner, which could promote the colonization of Bacteroidetes in the caeca. Li et al. [55] found the opposite, when the 24- and 28-hour long feed deprivation resulted significantly higher Bacteroidetes and Actinobacteria abundances. However, the results are not fully comparable, because of the differences in the treatments.
In the first few days the dominance of the Firmicutes phylum is more beneficial since many of its members are butyrate producers. The production of butyrate in the young chicken’s ceca is important because of the high demand for butyrate of the intensive growth of intestinal cells and to exclude the members of the first colonizer potential pathogens, for example Clostridia and Enterobacteriacea [51,56,57].
Although at family level the differences between the early and late hatched chicken’s microbiota were not significant, the abundance of families Lactobacillaceae and Ruminococcaceae belonging to the Firmicutes phylum decreased, while that of family Bacteroidaceae increased in the late-hatched chickens. Members of the Lactobacillaceae family produce lactic acid, which is the main substrate for several members of the Ruminococcaceae family using lactate as a substrate to produce butyrate and caproic acid [58]. Because this cross-feeding mechanism the close correlation between Lactobacillaceae and Ruminococcaceae is therefore not surprising. The other main butyrate producing family, Lachnospiraceae was not influenced by the treatments. In contrast the members of the Bacteroidaceae family to contain several genes encoding cellulose and complex polysaccharides-degrading enzymes [54,59,60] and produce beside propionate and butyrate different oligosaccharides [49,61].
5. Conclusions
The fertility of hatching eggs between the 22-23- and 65–66-week-old breeding hens was not different, but the hatchability of eggs was in the case of the younger flock more favourable. As expected, the age of parent flocks and the differences in the egg weights resulted significant differences in the weight of the day-old chickens. In this trial this advantage remained until the end of the fattening. The differences in the age and origin of the parent stock had no influence on the bacteriota diversity and composition of cecal contents. The weight of the late hatched chickens was significantly higher than that of the early hatched group. Similarly, to the parent flock effect, it resulted also significantly better cumulative weight gain of the late hatched animals. Hatching time also modified the development of the caecal bacteriota. At day 11, the early and late hatched chicks showed significantly different diversity indices. Probably due to the earlier access of feed carbohydrates, the ceca of the late hatched chickens contained more Bacteroidetes and Actinobacteria and less Firmicutes than the early hatched birds. The differences exist also at lower taxonomic levels. In the main phyla, Firmicutes and Bacteroidetes, families of Ruminococcaceae, Lactobacillaceae and Bacteroidaceae were mostly affected by the treatments.
Supplementary Materials
The following supporting information can be downloaded at the website of this paper posted on Preprints.org. Table S1: The effect of hatching time and parent age on the caecal microbiota composition at the family level at 11 days of age. Table S2: The effect of hatching time and parent age on the caecal microbiota composition at the family level at 39 days of age.
Author Contributions
Conceptualization, K.D., L.P. and N.S.; methodology, V.F. and L.M; validation, K.D., N.S. and V.F.; formal analysis, N.S.; investigation, N.S., V.F., L.P., K.S., G.Cs., B.K., K.G.T.; resources, K.D.; data curation, N.S.; writing—original draft preparation, N.S.; writing—review and editing, K.D.; visualization, N.S.; supervision, K.D.; project administration, K.D.; funding acquisition, K.D. All authors have read and agreed to the published version of the manuscript.
Funding
This research received no external funding
Institutional Review Board Statement
The animal experiment was approved by the Institutional Ethics Committee (Animal Welfare Committee, Georgikon Campus, Hungarian University of Agri-culture and Life Sciences) under the license number MÁB-5/2022.
Informed Consent Statement
Not applicable.
Data Availability Statement
All data generated or analysed during this study are included in this published article (and its supplementary information files). Raw sequence data of 16S rRNA meta-genomics analysis are deposited in the National Center for Biotechnology Information (NCBI) Se-quence Read Archive under the BioProject identifier PRJNA996958.
Acknowledgments
This work was supported by the ÚNKP-22-4-1 New National Excellence Program of The Ministry for Culture and Innovation from the Source of the National Research, Development and Innovation Fund.
Conflicts of Interest
All authors declare no conflict of interest.
References
- Rychlik, I. Composition and Function of Chicken Gut Microbiota. Animals (Basel) 2020, 10. [CrossRef]
- Pedroso, A.A.; Batal, A.B.; Lee, M.D. Effect of in Ovo Administration of an Adult-Derived Microbiota on Establishment of the Intestinal Microbiome in Chickens. Am J Vet Res 2016, 77, 514–526. [CrossRef]
- Volf, J.; Crhanova, M.; Karasova, D.; Faldynova, M.; Kubasova, T.; Seidlerova, Z.; Sebkova, A.; Zeman, M.; Juricova, H.; Matiasovicova, J.; et al. Eggshell and Feed Microbiota Do Not Represent Major Sources of Gut Anaerobes for Chickens in Commercial Production. Microorganisms 2021, 9, 1480. [CrossRef]
- Uni, Z.; Noy, Y.; Sklan, D. Posthatch Development of Small Intestinal Function in the Poult. Poult Sci 1999, 78, 215–222. [CrossRef]
- Lamot, D.M.; van de Linde, I.B.; Molenaar, R.; van der Pol, C.W.; Wijtten, P.J.A.; Kemp, B.; van den Brand, H. Effects of Moment of Hatch and Feed Access on Chicken Development. Poult Sci 2014, 93, 2604–2614. [CrossRef]
- Iqbal, J.; Khan, S.H.; Mukhtar, N.; Ahmed, T.; Pasha, R.A. Effects of Egg Size (Weight) and Age on Hatching Performance and Chick Quality of Broiler Breeder. J Appl Anim Res 2016, 44, 54–64. [CrossRef]
- Sinclair, R.W.; Robinson, F.E.; Hardin, R.T. The Effects of Parent Age and Posthatch Treatment on Broiler Performance. Poult Sci 1990, 69, 526–534. [CrossRef]
- Shanawany, M.M. Inter-relationship between Egg Weight, Parental Age and Embryonic Development. Br Poult Sci 1984, 25, 449–455. [CrossRef]
- Noble, R.; Cocchi, M. Lipid Metabolism and the Neonatal Chicken. Prog Lipid Res 1990, 29, 107–140.
- Hamidu, J.A.; Fasenko, G.M.; Feddes, J.J.R.; O’Dea, E.E.; Ouellette, C.A.; Wineland, M.J.; Christensen, V.L. The Effect of Broiler Breeder Genetic Strain and Parent Flock Age on Eggshell Conductance and Embryonic Metabolism. Poult Sci 2007, 86, 2420–2432. [CrossRef]
- Shanawany, M.M. Inter-Relationship between Egg Weight, Parental Age and Embryonic Development. Br Poult Sci 1984, 25, 449–455.
- Christensen, V.L.; Havenstein, G.B.; Davis, G.S. Egg Characteristics, Carbohydrate Metabolism and Thyroid Hormones in the Late Chickembryos from Different Genetic Lines. Poult Sci 1995, 74, 551–562. [CrossRef]
- Shcherbatov, V.I.; Sidorenko, L.I.; Koshchaev, A.G.; Vorokov, V.K.; Skvortsova, L.N. Chicken Hatching Syncronization for Artificial Incubation. Journal of Pharmaceutical Sciences and Research 2018, 10, 148-151.
- Aviagen Roos Broiler Management Handbook; Huntsville, USA, 2018.
- Bolyen, E.; Rideout, J.R.; Dillon, M.R.; Bokulich, N.A.; Abnet, C.C.; Al-Ghalith, G.A.; Alexander, H.; Alm, E.J.; Arumugam, M.; Asnicar, F.; et al. Reproducible, Interactive, Scalable and Extensible Microbiome Data Science Using QIIME 2. Nat Biotechnol 2019, 37, 852–857. [CrossRef]
- Quast, C.; Pruesse, E.; Yilmaz, P.; Gerken, J.; Schweer, T.; Yarza, P.; Peplies, J.; Glöckner, F.O. The SILVA Ribosomal RNA Gene Database Project: Improved Data Processing and Web-Based Tools. Nucleic Acids Res 2013, 41, D590–D596. [CrossRef]
- Lu, Y.; Zhou, G.; Ewald, J.; Pang, Z.; Shiri, T.; Xia, J. MicrobiomeAnalyst 2.0: Comprehensive Statistical, Functional and Integrative Analysis of Microbiome Data. Nucleic Acids Res 2023. [CrossRef]
- R Core Team R: A Language and Environment for Statistical Computing 2023.
- Yassin, H.; Velthuis, A.G.J.; Boerjan, M.; van Riel, J.; Huirne, R.B.M. Field Study on Broiler Eggs Hatchability. Poult Sci 2008, 87, 2408–2417. [CrossRef]
- Tona, K.; Onagbesan, O.; De Ketelaere, B.; Decuypere, E.; Bruggeman, V. Effects of Age of Broiler Breeders and Egg Storage on Egg Quality, Hatchability, Chick Quality, Chick Weight, and Chick Posthatch Growth to Forty-Two Days. Journal of Applied Poultry Research 2004, 13, 10–18. [CrossRef]
- Roque, L.; Soares, M.C. Effects of Eggshell Quality and Broiler Breeder Age on Hatchability. Poult Sci 1994, 73, 1838–1845. [CrossRef]
- Abudabos, A. The Effect of Broiler Breeder Strain and Parent Flock Age on Hatchability and Fertile Hatchability. International Journal of Poultry Science 2010, 9, 231–235. [CrossRef]
- Noble, R.C.; Lonsdale, F.; Connor, K.; Brown, D. Changes in the Lipid Metabolism of the Chick Embryo with Parental Age. Poult Sci 1986, 65, 409–416. [CrossRef]
- Jacobs, L.; Delezie, E.; Duchateau, L.; Goethals, K.; Ampe, B.; Lambrecht, E.; Gellynck, X.; Tuyttens, F.A.M. Effect of Post-Hatch Transportation Duration and Parental Age on Broiler Chicken Quality, Welfare, and Productivity. Poult Sci 2016, 95, 1973–1979. [CrossRef]
- Willemsen, H.; Debonne, M.; Swennen, Q.; Everaert, N.; Careghi, C.; Han, H.; Bruggeman, V.; Tona, K.; Decuypere, E. Delay in Feed Access and Spread of Hatch: Importance of Early Nutrition. Worlds Poult Sci J 2010, 66, 177–188. [CrossRef]
- Juul-Madsen, H.R.; Su, G.; Sørensen, P. Influence of Early or Late Start of First Feeding on Growth and Immune Phenotype of Broilers. Br Poult Sci 2004, 45, 210–222. [CrossRef]
- Pál, L.; Dublecz, K.; Husvéth, F.; Kulcsár, M. Early Nutrition Affects Plasma Corticosterone of Broiler Chicks. In Proceedings of the Proceedings of the 19th European Symposium on Poultry Nutrition European Federation of Branches of the WPSA; 2013; p. 22.
- Pál, L.; Nagy, Sz.; Kulcsár, M. Corticosterone Response of One-Day-Old Broiler Chicks to Deprivation of Feed and Water. GEORGIKON FOR AGRICULTURE 2013, 17, 69–83.
- Shehata, A.M.; Paswan, V.K.; Attia, Y.A.; Abdel-Moneim, A.M.E.; Abougabal, M.S.; Sharaf, M.; Elmazoudy, R.; Alghafari, W.T.; Osman, M.A.; Farag, M.R.; et al. Managing Gut Microbiota Through In Ovo Nutrition Influences Early-Life Programming in Broiler Chickens. Animals 2021, 11, 3491. [CrossRef]
- Stout, M.J.; Conlon, B.; Landeau, M.; Lee, I.; Bower, C.; Zhao, Q.; Roehl, K.A.; Nelson, D.M.; Macones, G.A.; Mysorekar, I.U. Identification of Intracellular Bacteria in the Basal Plate of the Human Placenta in Term and Preterm Gestations. Am J Obstet Gynecol 2013, 208, 226.e1-226.e7. [CrossRef]
- Proszkowiec-Weglarz, M.; Miska, K.B.; Ellestad, L.E.; Schreier, L.L.; Kahl, S.; Darwish, N.; Campos, P.; Shao, J. Delayed Access to Feed Early Post-Hatch Affects the Development and Maturation of Gastrointestinal Tract Microbiota in Broiler Chickens. BMC Microbiol 2022, 22, 206. [CrossRef]
- Noy, Y.; Sklan, D. Nutrient Use in Chicks During the First Week Posthatch. Poult Sci 2002, 81, 391–399. [CrossRef]
- Sato, M.; Tachibana, T.; Furuse, M. Heat Production and Lipid Metabolism in Broiler and Layer Chickens during Embryonic Development. Comp Biochem Physiol A Mol Integr Physiol 2006, 143, 382–388. [CrossRef]
- van der Wagt, I.; de Jong, I.C.; Mitchell, M.A.; Molenaar, R.; van den Brand, H. A Review on Yolk Sac Utilization in Poultry. Poult Sci 2020, 99, 2162–2175. [CrossRef]
- Noy, Y.; Uni, Z.; Sklan, D. Routes of Yolk Utilization in the Newly hatched Chick. Br Poult Sci 1996, 37, 987–996. [CrossRef]
- Aagaard, K.; Ma, J.; Antony, K.M.; Ganu, R.; Petrosino, J.; Versalovic, J. The Placenta Harbors a Unique Microbiome. Sci Transl Med 2014, 6. [CrossRef]
- Dominguez-Bello, M.G.; Costello, E.K.; Contreras, M.; Magris, M.; Hidalgo, G.; Fierer, N.; Knight, R. Delivery Mode Shapes the Acquisition and Structure of the Initial Microbiota across Multiple Body Habitats in Newborns. Proc Natl Acad Sci U S A 2010, 107, 11971–11975. [CrossRef]
- Bäckhed, F.; Roswall, J.; Peng, Y.; Feng, Q.; Jia, H.; Kovatcheva-Datchary, P.; Li, Y.; Xia, Y.; Xie, H.; Zhong, H.; et al. Dynamics and Stabilization of the Human Gut Microbiome during the First Year of Life. Cell Host Microbe 2015, 17, 690–703. [CrossRef]
- Cook, M.I.; Beissinger, S.R.; Toranzos, G.A.; Rodriguez, R.A.; Arendt, W.J. Trans-Shell Infection by Pathogenic Micro-Organisms Reduces the Shelf Life of Non-Incubated Bird’s Eggs: A Constraint on the Onset of Incubation? Proc Biol Sci 2003, 270, 2233–2240. [CrossRef]
- Ding, P.; Liu, H.; Tong, Y.; He, X.; Yin, X.; Yin, Y.; Zhang, H.; Song, Z. Developmental Change of Yolk Microbiota and Its Role on Early Colonization of Intestinal Microbiota in Chicken Embryo. Animals 2021, 12, 16. [CrossRef]
- Sarmiento-Ramírez, J.M.; van der Voort, M.; Raaijmakers, J.M.; Diéguez-Uribeondo, J. Unravelling the Microbiome of Eggs of the Endangered Sea Turtle Eretmochelys Imbricata Identifies Bacteria with Activity against the Emerging Pathogen Fusarium Falciforme. PLoS One 2014, 9, e95206. [CrossRef]
- Bunker, M.E.; Elliott, G.; Heyer-Gray, H.; Martin, M.O.; Arnold, A.E.; Weiss, S.L. Vertically Transmitted Microbiome Protects Eggs from Fungal Infection and Egg Failure. Anim Microbiome 2021, 3, 43. [CrossRef]
- Ballou, A.L.; Ali, R.A.; Mendoza, M.A.; Ellis, J.C.; Hassan, H.M.; Croom, W.J.; Koci, M.D. Development of the Chick Microbiome: How Early Exposure Influences Future Microbial Diversity. Front Vet Sci 2016, 3, 20. [CrossRef]
- de Jong, I.C.; Schokker, D.; Gunnink, H.; van Wijhe, M.; Rebel, J.M.J. Early Life Environment Affects Behavior, Welfare, Gut Microbiome Composition, and Diversity in Broiler Chickens. Front Vet Sci 2022, 9. [CrossRef]
- Olsen, R.; Kudirkiene, E.; Thøfner, I.; Pors, S.; Karlskov-Mortensen, P.; Li, L.; Papasolomontos, S.; Angastiniotou, C.; Christensen, J. Impact of Egg Disinfection of Hatching Eggs on the Eggshell Microbiome and Bacterial Load. Poult Sci 2017, 96, 3901–3911. [CrossRef]
- Lacombe-Harvey, M.-È.; Brzezinski, R.; Beaulieu, C. Chitinolytic Functions in Actinobacteria: Ecology, Enzymes, and Evolution. Appl Microbiol Biotechnol 2018, 102, 7219–7230. [CrossRef]
- Binda, C.; Lopetuso, L.R.; Rizzatti, G.; Gibiino, G.; Cennamo, V.; Gasbarrini, A. Actinobacteria: A Relevant Minority for the Maintenance of Gut Homeostasis. Digestive and Liver Disease 2018, 50, 421–428. [CrossRef]
- Polansky, O.; Sekelova, Z.; Faldynova, M.; Sebkova, A.; Sisak, F.; Rychlik, I. Important Metabolic Pathways and Biological Processes Expressed by Chicken Cecal Microbiota. Appl Environ Microbiol 2016, 82, 1569–1576. [CrossRef]
- Molnár, A.; Such, N.; Farkas, V.; Pál, L.; Menyhárt, L.; Wágner, L.; Husvéth, F.; Dublecz, K. Effects of Wheat Bran and Clostridium Butyricum Supplementation on Cecal Microbiota, Short-Chain Fatty Acid Concentration, PH and Histomorphometry in Broiler Chickens. Animals 2020, 10, 2230. [CrossRef]
- Sakaridis, I.; Ellis, R.J.; Cawthraw, S.A.; van Vliet, A.H.M.; Stekel, D.J.; Penell, J.; Chambers, M.; La Ragione, R.M.; Cook, A.J. Investigating the Association Between the Caecal Microbiomes of Broilers and Campylobacter Burden. Front Microbiol 2018, 9. [CrossRef]
- Ducatelle, R.; Goossens, E.; Eeckhaut, V.; Van Immerseel, F. Poultry Gut Health and Beyond. Animal Nutrition 2023, 13, 240–248. [CrossRef]
- Johnson, E.L.; Heaver, S.L.; Walters, W.A.; Ley, R.E. Microbiome and Metabolic Disease: Revisiting the Bacterial Phylum Bacteroidetes. J Mol Med 2017, 95, 1–8. [CrossRef]
- Alexander, C.; Swanson, K.S.; Fahey, G.C.; Garleb, K.A. Perspective: Physiologic Importance of Short-Chain Fatty Acids from Nondigestible Carbohydrate Fermentation. Advances in Nutrition 2019, 10, 576–589. [CrossRef]
- Tan, H.; Zhai, Q.; Chen, W. Investigations of Bacteroides Spp. towards next-Generation Probiotics. Food Research International 2019, 116, 637–644. [CrossRef]
- Li, D.L.; Wang, J.S.; Liu, L.J.; Li, K.; Xu, Y.B.; Ding, X.Q.; Wang, Y.Y.; Zhang, Y.F.; Xie, L.Y.; Liang, S.; et al. Effects of Early Post-Hatch Feeding on the Growth Performance, Hormone Secretion, Intestinal Morphology, and Intestinal Microbiota Structure in Broilers. Poult Sci 2022, 101, 102133. [CrossRef]
- Van Immerseel, F.; Vermeulen, K.; Ornust, L.; Eckhaut, V.; Ducatelle, R. Nutritional Modulation of Microbial Signals in the Distal Intestinal and How They Can Affect Broiler Health. In Proceedings of the 21st European Symposium on Poultry Nutrition; Salou/Vila-Seca, Spain, 2017.
- Vermeulen, K.; Verspreet, J.; Courtin, C.M.; Haesebrouck, F.; Baeyen, S.; Haegeman, A.; Ducatelle, R.; Van Immerseel, F. Reducedparticle-Size Wheat Bran Is Efficiently Colonized by a Lactic Acid-Producing Community and Reduces Levels of Enterobacteriaceae in the Cecal Microbiota of Broilers. Appl Environ Microbiol 2018, 84, 1343–1361. [CrossRef]
- Lu, S.; Jin, H.; Wang, Y.; Tao, Y. Genome-Wide Transcriptomic Analysis of n-Caproic Acid Production in Ruminococcaceae Bacterium CPB6 with Lactate Supplementation. J Microbiol Biotechnol 2021, 31, 1533–1544. [CrossRef]
- Hamaker, B.R.; Tuncil, Y.E. A Perspective on the Complexity of Dietary Fiber Structures and Their Potential Effect on the Gut Microbiota. J Mol Biol 2014, 426, 3838–3850. [CrossRef]
- De Filippo, C.; Cavalieri, D.; Di Paola, M.; Ramazzotti, M.; Poullet, J.B.; Massart, S.; Collini, S.; Pieraccini, G.; Lionetti, P. Impact of Diet in Shaping Gut Microbiota Revealed by a Comparative Study in Children from Europe and Rural Africa. Proceedings of the National Academy of Sciences 2010, 107, 14691–14696. [CrossRef]
- De Maesschalck, C.; Eeckhaut, V.; Maertens, L.; De Lange, L.; Marchal, L.; Daube, G.; Dewulf, J.; Haesebrouck, F.; Ducatelle, R.; Taminau, B.; et al. Amorphous Cellulose Feed Supplement Alters the Broiler Caecal Microbiome. Poult Sci 2019, 98, 3811–3817. [CrossRef]
Figure 1.
Principal coordinate analysis (PCoA) based on Bray–Curtis dissimilarity matrix on sampling sites: (A) Hatching time effect at day 11; (B) Hatching time effect at day 39; (C) Parent age effect at day 11; (D) Parent age effect at day 39. The percentage of variation explained by each PCoA is indicated on the axes with Bray–Curtis dissimilarity. To verify the significance of bacterial community permutational analysis of variance (PERMANOVA) calculations were performed. The differences were considered significant at a level of p ≤ 0.05.
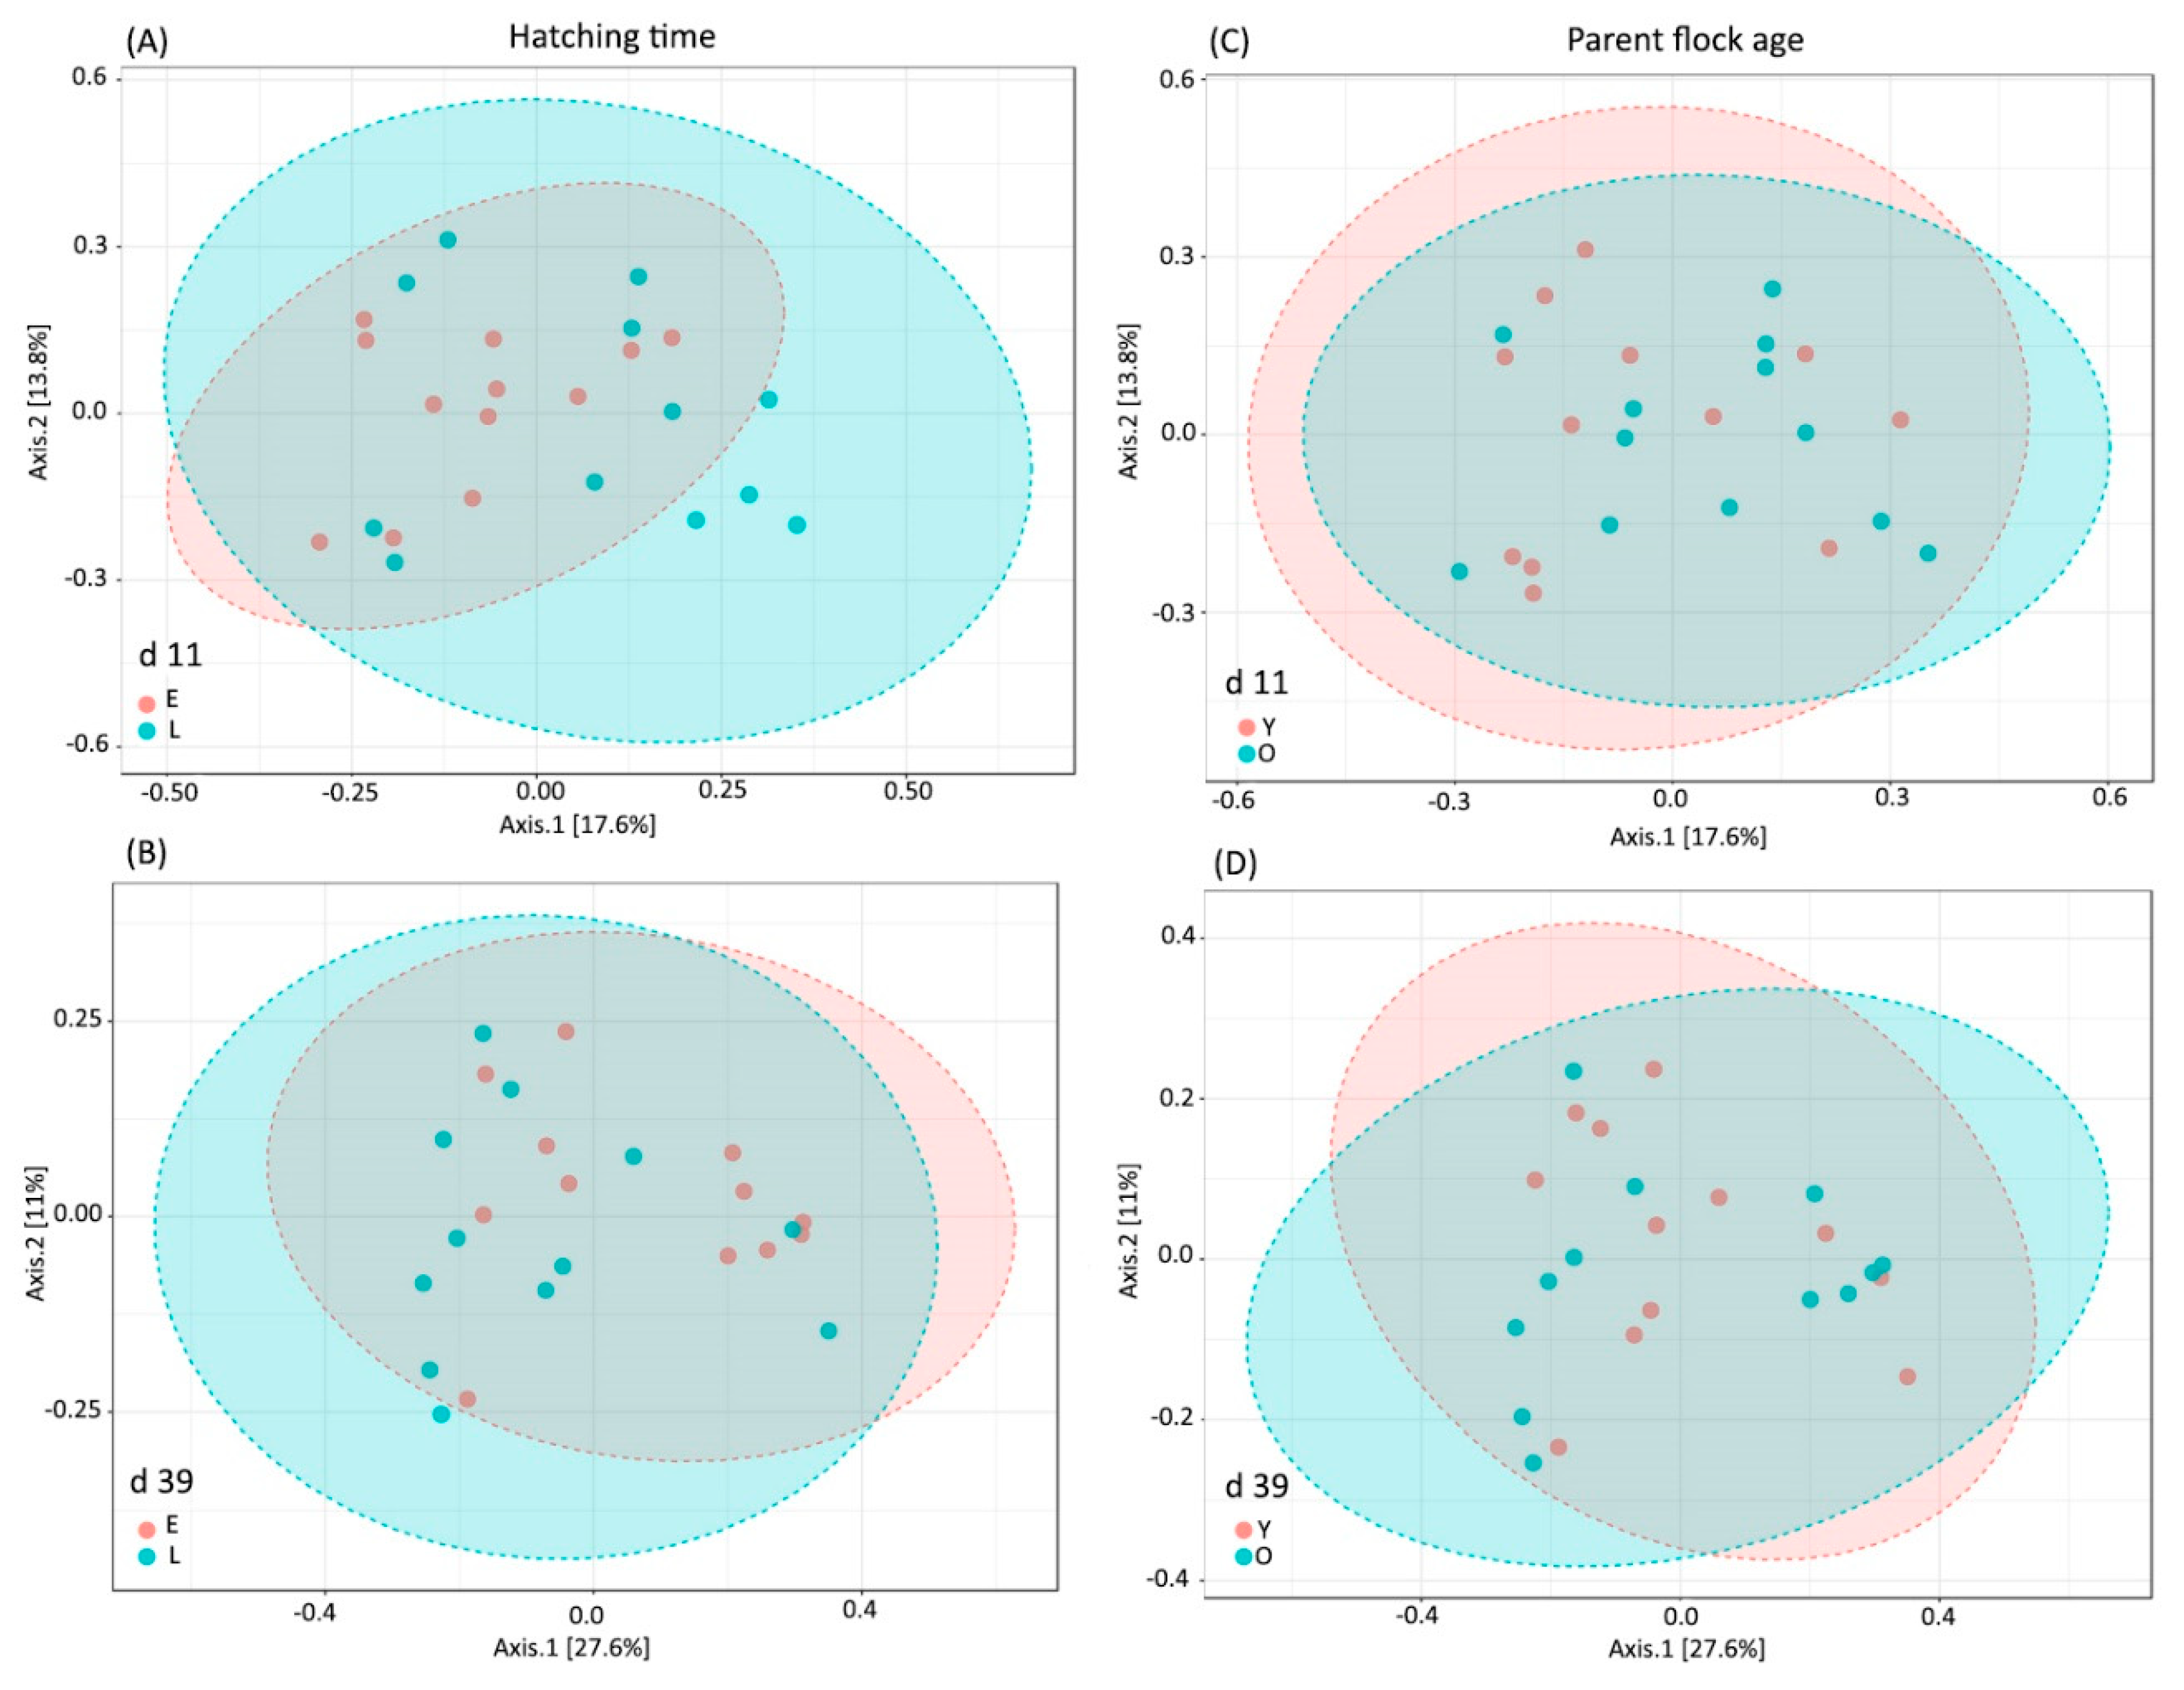
Figure 2.
The effect of hatching time on the cecal microbiota composition at family level.
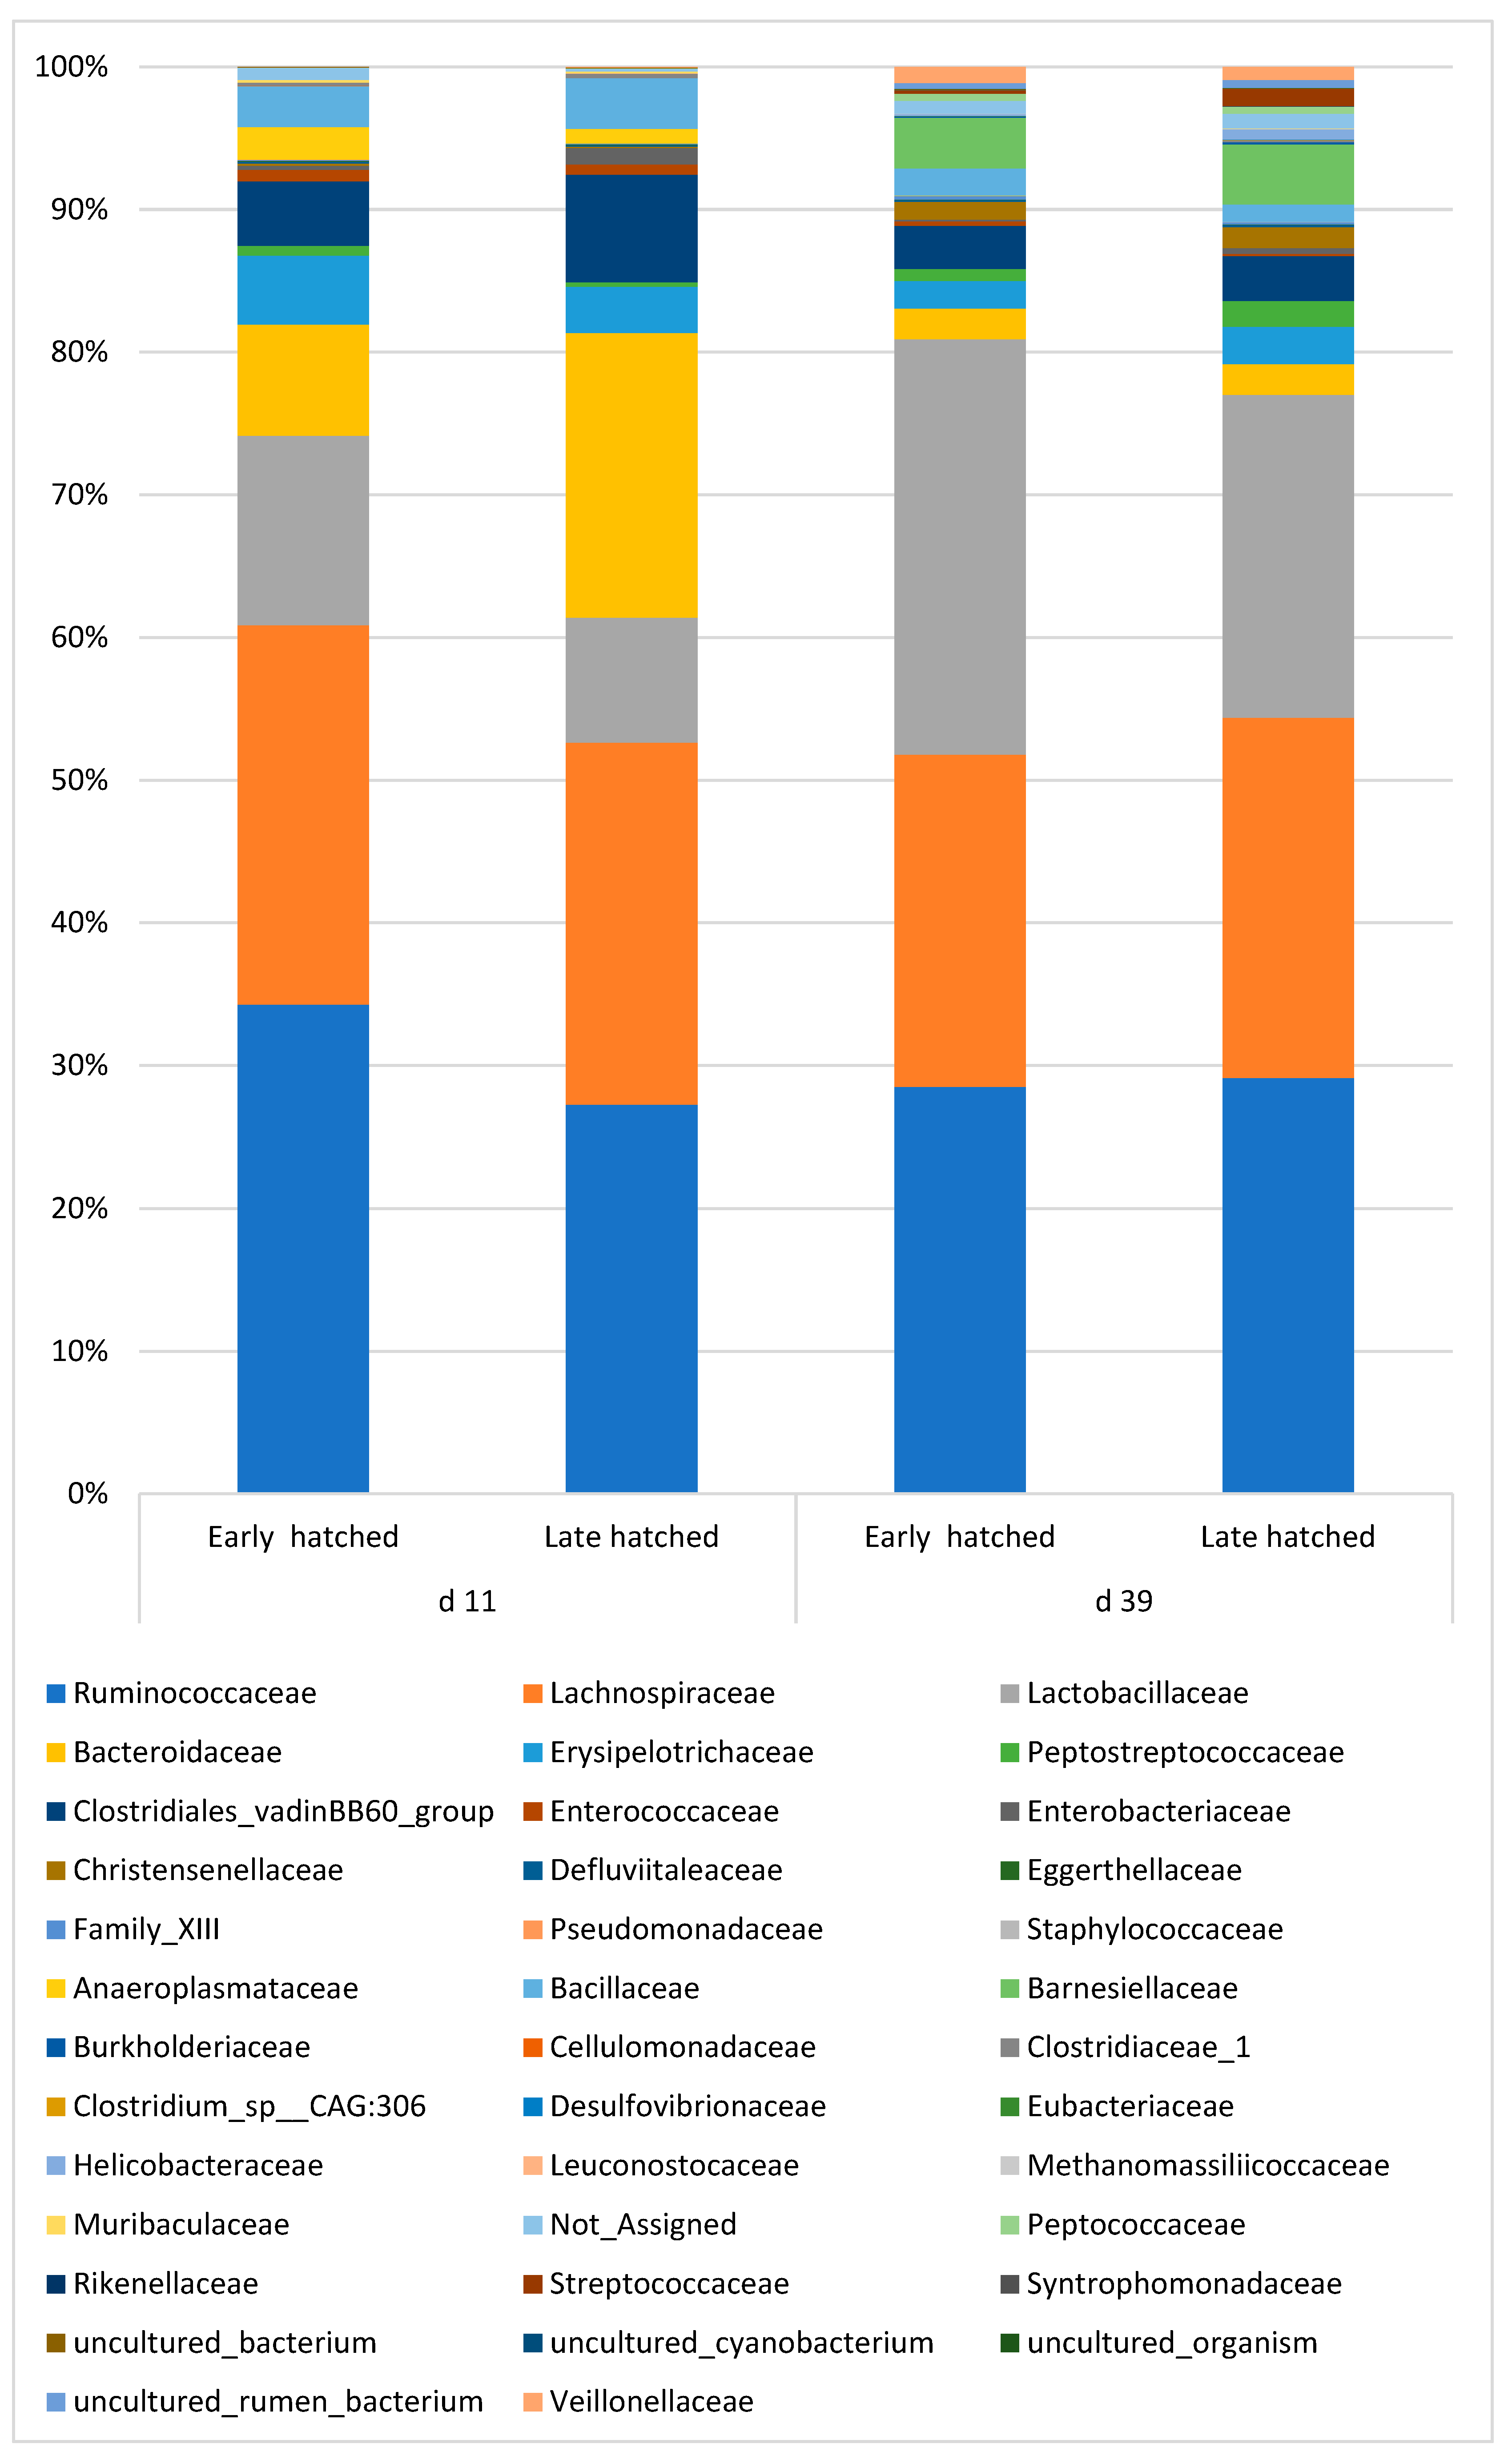
Table 1.
The composition and analysed nutrient content and of experimental diets (g/kg as fed).
| Composition of the diets | Starter | Grower | Finisher |
| Corn | 391.3 | 424.8 | 479.4 |
| Wheat | 100.0 | 100.0 | 100.0 |
| Extracted soybean meal | 407.0 | 374.0 | 321.0 |
| Sunflower oil | 51.0 | 60.0 | 64.0 |
| Limestone | 16.5 | 13.9 | 12.0 |
| MCP | 13.2 | 11.0 | 8.9 |
| L-Lysine | 4.1 | 2.7 | 2.1 |
| DL-Methionine | 4.0 | 3.2 | 2.9 |
| L-Threonine | 1.4 | 0.8 | 0.6 |
| L-Isoleucine | 0.3 | 0.1 | 0.1 |
| L-Arginine | 0.3 | 0 | 0 |
| L-Valine | 1.0 | 0.6 | 0.6 |
| NaCl | 3.0 | 3.0 | 3.0 |
| NaHCO3 | 1.0 | 1.0 | 1.0 |
| Premix1 | 5.0 | 4.0 | 4.0 |
| Xylanase 2 | 0.2 | 0.2 | 0.2 |
| Phytase 3 | 0.1 | 0.1 | 0.1 |
| Coccidiostat 4 | 0.6 | 0.5 | 0 |
| Sum | 1000 | 1000 | 1000 |
| Measured nutrient contents | |||
| AMEn (MJ/kg) | 12.48 | 12.42 | 13.16 |
| Crude protein | 22.3 | 19.2 | 18.6 |
| Crude fat | 7.0 | 8.0 | 8.4 |
| Crude fibre | 4.2 | 4.1 | 4.1 |
| Ca | 1.04 | 0.94 | 0.88 |
| P (total) | 0.63 | 0.61 | 0.53 |
1Premix was supplied by UBM Ltd. (Pilisvörösvár, Hungary). The active ingredients in the premix were as follows (per kg of diet): retinyl acetate – 5.0 mg, cholecalciferol – 130 μg, dl-alpha-tocopherol-acetate – 91 mg, menadione – 2.2 mg, thiamin – 4.5 mg, riboflavin – 10.5 mg, pyridoxin HCL – 7.5 mg, cyanocobalamin – 80 μg, niacin – 41.5 mg, pantothenic acid – 15 mg, folic acid – 1.3 mg, biotin – 150 μg, betaine – 670 mg, Ronozyme® NP – 150 mg, monensin-Na – 110 mg (only grower), narasin – 50 mg (only starter), nicarbazin – 50 mg (only starter), antioxidant – 25 mg, Zn (as ZnSO4·H2O) – 125 mg, Cu (as CuSO4·5H2O) – 20 mg, Fe (as FeSO4·H2O) – 75 mg, Mn (as MnO) – 125 mg, I (as KI) – 1.35 mg, Se (as Na2SeO3) – 270 μg; 2 NSP digesting enzymes, beta 1-4, endo-xylanase enzyme - Econase XT, AB Vista, Marlborough, Wiltshire, SN8 4AN; 3 Quantum Blue (Panadditív Kft. 2040 Budaörs); 4 Maxiban, Elanco Clinton Laboratories, USA.
Table 2.
The effect of the parent flock’s age on the different hatchability parameters.
| Fertile eggs (%) | Damaged eggs (%) | Rotten eggs (%) | Hatched from fertile eggs (%) | Hatched of all eggs (%) | |
|---|---|---|---|---|---|
| Old parents | 95.6 | 0.56 | 5.83 | 93.8b | 89.2b |
| Young parents | 97.5 | 0.14 | 4.44 | 95.4a | 92.9a |
| SEM* | 1.58 | 0.29 | 2.17 | 2.33 | 3.30 |
| p-vales | 0.168 | 0.374 | 0.236 | 0.047 | 0.016 |
SEM – standard error of mean.
Table 3.
Effect of treatments on the body weight, feed intake, the feed conversion ratio and weight gain of broiler chickens.
Table 3.
Effect of treatments on the body weight, feed intake, the feed conversion ratio and weight gain of broiler chickens.
| Parent flock age | Young | Old | Parent flock age | Hatching time | SEM | p-values | |||||||
| Hatching time | Early | Late | Early | Late | Young | Old | Early | Late | Parent flock age | Hatch-ing time | Interaction | ||
| Body weight (g) | d 0 | 35.2 | 36.9 | 47.7 | 49.7 | 36.4b | 48.3a | 41.7b | 42.9a | 1.254 | 0.000 | 0.000 | 0.826 |
| d 10 | 230.2 | 228.1 | 310.2 | 302.9 | 229.1b | 306.5a | 270.2 | 267.8 | 8.546 | 0.000 | 0.439 | 0.668 | |
| d 24 | 1112.9 | 1150.3 | 1362.5 | 1397.2 | 1131.6b | 1379.8a | 1237.7 | 1273.7 | 27.449 | 0.000 | 0.057 | 0.943 | |
| d 39 | 2513.9 | 2581.5 | 2808.5 | 2984.9 | 2547.7b | 2896.7a | 2661.2b | 2783.2a | 42.587 | 0.000 | 0.004 | 0.156 | |
| Feed intake (g/day) | starter | 286.2 | 289.8 | 303.6 | 316.0 | 288.0b | 309.8a | 294.9 | 302.9 | 3.488 | 0.001 | 0.145 | 0.413 |
| grower | 1137.7 | 1153.2 | 1320.5 | 1317.5 | 1145.4b | 1319.0a | 1229.1 | 1235.3 | 24.079 | 0.000 | 0.857 | 0.788 | |
| finisher | 2162.3 | 2147.9 | 2332.8 | 2362.9 | 2155.1b | 2297.9a | 2197.5 | 2255.4 | 30.024 | 0.012 | 0.279 | 0.179 | |
| sum | 3586.3 | 3590.9 | 3857 | 3996.5 | 3588.6b | 3926.8a | 3721.6 | 3793.7 | 51.528 | 0.000 | 0.364 | 0.395 | |
| Gain weight | starter | 194.9 | 194.5 | 262.7 | 262.0 | 194.7b | 262.4a | 228.8 | 228.3 | 7.417 | 0.000 | 0.375 | 0.738 |
| grower | 895.4 | 918.7 | 1052 | 1099.3 | 907.0b | 1075.6a | 973.7b | 1009.0a | 19.335 | 0.213 | 0.209 | 0.420 | |
| finisher | 1387.6 | 1447.5 | 1456.5 | 1574.5 | 1417.6b | 1515.5a | 1422.1b | 1511.0a | 17.933 | 0.873 | 0.084 | 0.456 | |
| cumulative | 2478.5 | 2560.8 | 2771.3 | 2936.0 | 2519.4b | 2853.6a | 2624.7b | 2748.4a | 41.021 | 0.028 | 0.082 | 0.678 | |
| FCR (g/g) | starter | 1.47 | 1.49 | 1.16 | 1.20 | 1.48a | 1.18b | 1.31 | 1.35 | 0.036 | 0.000 | 0.919 | 0.980 |
| grower | 1.32 | 1.24 | 1.29 | 1.24 | 1.26 | 1.22 | 1.26 | 1.22 | 0.015 | 0.000 | 0.030 | 0.468 | |
| finisher | 1.60 | 1.50 | 1.57 | 1.54 | 1.52 | 1.51 | 1.54 | 1.49 | 0.015 | 0.001 | 0.001 | 0.226 | |
| cumulative | 1.49 | 1.40 | 1.41 | 1.39 | 1.42a | 1.37b | 1.41 | 1.38 | 0.012 | 0.000 | 0.003 | 0.289 | |
SEM – standard error of mean.
Table 4.
Alpha diversity indices of the cecum chymus at day 11.
| Parent flock age | p-values | ||||||
|---|---|---|---|---|---|---|---|
| Hatching time | Young parent | Old parent | Average (Hatching time) | Hatching time | Parent flock age | Interaction | |
| Chao 1 | Early | 175.952 | 193.232 | 184.592 | 0.481 | 0.814 | 0.406 |
| Late | 178.026 | 168.328 | 173.177 | ||||
| Average (Age) | 176.989 | 180.780 | |||||
| Shannon | Early | 3.720 | 3.862 | 3.791 | 0.018 | 0.708 | 0.187 |
| Late | 3.546 | 3.295 | 3.420 | ||||
| Average (Age) | 3.633 | 3.578 | |||||
| Simpson | Early | 0.951 | 0.955 | 0.953 | 0.011 | 0.483 | 0.354 |
| Late | 0.918 | 0.889 | 0.904 | ||||
| Average (Age) | 0.935 | 0.922 | |||||
Table 6.
The effect of hatching time and the age of parent flocks on the cecal microbiota composition at the phylum level, at 11 days of age.
Table 6.
The effect of hatching time and the age of parent flocks on the cecal microbiota composition at the phylum level, at 11 days of age.
| Phylum (%) | Parent flock age | FDR p-values | |||||
|---|---|---|---|---|---|---|---|
| Hatching time | Young patent | Old parent | Average (Hatching time) | Hatching time | Parent flock Age | Interaction | |
| Firmicutes | Early | 84.830 | 92.146 | 88.488 | 0.048 | 0.290 | |
| Late | 83.304 | 71.476 | 77.390 | ||||
| Average (Age) | 84.067 | 81.811 | 0.625 | ||||
| Bacteroidetes | Early | 9.917 | 6.047 | 7.982 | 0.056 | 0.170 | |
| Late | 12.458 | 27.759 | 20.108 | ||||
| Average (Age) | 11.188 | 16.903 | 0.290 | ||||
| Proteobacteria | Early | 0.161 | 0.429 | 0.295 | 0.104 | 0.122 | |
| Late | 1.932 | 0.400 | 1.166 | ||||
| Average (Age) | 1.046 | 0.415 | 0.269 | ||||
| Actinobacteria | Early | 0.077 | 0.096 | 0.086 | 0.089 | 0.913 | |
| Late | 0.042 | 0.063 | 0.053 | ||||
| Average (Age) | 0.059 | 0.080 | 0.250 | ||||
| Cyanobacteria | Early | 1.513 | 0.085 | 0.799 | 0.187 | 0.313 | |
| Late | 0.171 | 0.000 | 0.086 | ||||
| Average (Age) | 0.842 | 0.043 | 0.342 | ||||
| Tenericutes | Early | 3.502 | 1.198 | 2.350 | 0.157 | 0.896 | |
| Late | 2.093 | 0.302 | 1.197 | ||||
| Average (Age) | 2.798 | 0.750 | 0.100 | ||||
Table 7.
The effect of hatching time and the age of parent flocks on the cecal microbiota composition at the phylum level, at 39 days of age.
Table 7.
The effect of hatching time and the age of parent flocks on the cecal microbiota composition at the phylum level, at 39 days of age.
| Phylum (%) | Parent flock age | FDR p-values | |||||
|---|---|---|---|---|---|---|---|
| Hatching time | Young patent | Old parent | Average (Hatching time) | Hatching time | Parent flock age | Interaction | |
| Firmicutes | Early | 91.905 | 93.253 | 92.579 | 0.596 | 1.483 | |
| Late | 91.120 | 90.007 | 91.630 | ||||
| Average (Age) | 91.513 | 91.630 | 1.064 | ||||
| Bacteroidetes | Early | 6.626 | 5.036 | 5.831 | 0.471 | 1.186 | |
| Late | 6.684 | 6.648 | 6.666 | ||||
| Average (Age) | 6.655 | 5.842 | 1.132 | ||||
| Proteobacteria | Early | 0.257 | 0.201 | 0.229 | 0.303 | 0.872 | |
| Late | 0.553 | 0.591 | 0.572 | ||||
| Average (Age) | 0.405 | 0.396 | 0.952 | ||||
| Actinobacteria | Early | 0.028 | 0.032 | 0.030 | 0.533 | 1.385 | |
| Late | 0.024 | 0.072 | 0.048 | ||||
| Average (Age) | 0.026 | 0.052 | 0.844 | ||||
| Cyanobacteria | Early | 0.638 | 1.160 | 0.899 | 0.545 | 0.955 | |
| Late | 0.927 | 1.490 | 1.209 | ||||
| Average (Age) | 0.783 | 1.325 | 0.622 | ||||
| Tenericutes | Early | 0.279 | 0.290 | 0.284 | 0.485 | 0.937 | |
| Late | 0.232 | 0.181 | 0.206 | ||||
| Average (Age) | 0.255 | 0.235 | 1.167 | ||||
| Epsilonbacteraeota | Early | 0.248 | 0.000 | 0.124 | 0.468 | 0.943 | |
| Late | 0.437 | 0.987 | 0.712 | ||||
| Average (Age) | 0.343 | 0.493 | 1.046 | ||||
| Euryarchaeota | Early | 0.014 | 0.024 | 0.019 | 0.988 | 0.855 | |
| Late | 0.019 | 0.020 | 0.019 | ||||
| Average (Age) | 0.017 | 0.022 | 1.185 | ||||
Disclaimer/Publisher’s Note: The statements, opinions and data contained in all publications are solely those of the individual author(s) and contributor(s) and not of MDPI and/or the editor(s). MDPI and/or the editor(s) disclaim responsibility for any injury to people or property resulting from any ideas, methods, instructions or products referred to in the content. |
© 2023 by the authors. Licensee MDPI, Basel, Switzerland. This article is an open access article distributed under the terms and conditions of the Creative Commons Attribution (CC BY) license (http://creativecommons.org/licenses/by/4.0/).
Copyright: This open access article is published under a Creative Commons CC BY 4.0 license, which permit the free download, distribution, and reuse, provided that the author and preprint are cited in any reuse.


