Submitted:
01 August 2023
Posted:
02 August 2023
You are already at the latest version
Abstract
Over the past decade, plasma waste treatment has become a more prominent technology due to increasing problems with waste disposal and realizing opportunities to generate valuable co-products. Plasma waste treatment extensively uses atmospheric pressure (RF) inductive coupled plasma (ICP) torches. In situ Optical Emission Spectroscopy (OES) is used to evaluate the developed RF ICP torch for Municipal Solid Waste (MSW) treatment and ascertain the plasma parameters to understand the physical mechanism involved. The argon plasma jet's electron temperature and plasma density outside the torch chamber are calculated using the Boltzmann plot and Stark broadening at different gas flow rates, and RF power. The expected electron temperature and plasma density behaviour were observed at a low gas flow rate. The electron temperature decreases with the RF power from 8089 K to 6097 K as demand for increasing the plasma density. An energy loss mechanism was revealed while raising the gas flow rate, as the electron temperature increases with RF power from 5750 K to 6221 K, and the plasma density decreases. This behaviour is due to the anomalous skin effect. Detecting and avoiding this phenomenon is essential as it negatively affects torch energy efficiency and waste treatment.
Keywords:
RF ICP torch
; Optical Emission Spectroscopy (OES)
; Boltzmann plot
; Stark broadening
I. Introduction
Municipal Solid Waste (MSW) is urban solid waste that results from human activities and contains food, paper, plastic, glass, and inorganic materials [1,2]. Solid wastes, including plastic, constitute a significant fraction of waste in the environment. The world generates 2.01 billion tons of MSW annually, which is expected to increase to 3.40 billion by 2050 [3]. About 40% of the waste is solid plastic waste. Recent statistics show that about 8 million tons of plastic waste produced worldwide end up in the ocean and pollute the sea, damaging the marine ecosystem [4]. Besides, the MSW plastic waste management is unsustainable and negatively impacts the Earths ecosystems; since 1950, only 10% of plastic solid waste has been recycled [5]. In addition, at least 33% is a conservative estimate and not managed in an environmentally friendly manner. Landfilling and incineration are still the most common global MSW management practice, and it adversely causes massive land consumption and methane release. Proper management and recycling of large amounts of plastic, paper, and solid waste are necessary to reduce its environmental burdens and minimize risks to human health [6,7].
The utilization of MSW for conversion into energy and valuable recycled products currently faces various challenges, such as the heterogeneous nature of the waste, significant moisture content, and low calorific value, making it industrially undesirable [8,9,10]. Although an appreciable amount of research in the field has been carried out on converting MSW into energy, there is still a lack of comprehensive and efficient conversion methods found in literature. Conventional conversion technologies of waste-to-energy (WTE) include biological (such as fermentation, anaerobic digestion, etc.) and thermochemical processes (such as incineration, pyrolysis, hydrothermal oxidation, and gasification) [11,12]. These technologies have several advantages, like biogas for energy production and considerable volume reduction [13]. Traditional incineration of plastics produces Greenhouse Gases (GGs) and other toxic chemicals like dioxins and polychlorinated biphenyls as components like nitrogen, hydrogen sulphide, and oxygen embedded in the wastes released into the atmosphere [14,15]. In addition, the heterogeneous nature of most solid wastes makes energy recovery, product yields, and quality control quite challenging [16].
One of the proposed solutions to the above-described problems of traditional waste treatment methods is to use plasma-based thermal treatment methods for MSW, mainly plastic and paper waste. With the improvement in air emission control systems and strict environmental regulatory rules, more research on efficient thermal plasma-based MSW conversion to WTE is gaining more attention. The baseline method is to combust it in a controlled environment and take the gas out by filtration. The plasma-based thermal treatment process can be categorized into three procedures: (1) combustion in single or multistage in the presence of oxygen to create heat energy; (2) pyrolysis of the waste in the absence of oxygen to produce liquid synthetic fuels and char; and (3) gasification in the absence or with limited oxygen to produce synthetic gas. Plasma waste treatment widely uses atmospheric pressure RF ICP torches because they produce a plasma jet with temperatures as high as 8000 K, require no cooling system, and have no electrode corrosion. However, RF ICP torches have a lower efficiency than other torches and still require development and study [17]. Therefore, examining plasma properties, such as plasma density and electron temperature, is essential for developing and improving a plasma torch. OSE is a non-intrusive and powerful tool to investigate plasma properties and gives rich information about energy states. Plasma temperature (Te), species density, plasma composition, and ionization state can be calculated and determined from the OES measurements. Numerous studies using the OES method to examine the plasma jet's characteristics have recently been conducted [18,19,20,21]. Despite significant research and advancements in this field, a more profound comprehension of a plasma jet's characteristics is still required. This is important for investigations into a newly developed plasma torch with a unique configuration that aims to enhance and optimize performance. The consequences of plasma processing will be significantly influenced by these characteristics, which are connected to the underlying physical processes of the plasma sources.
An innovative RF ICP plasma torch that creates a highly stable and long-lasting atmospheric argon plasma jet has been developed to treat MSW in this research. By capturing and examining the argon plasma spectra outside the plasma chamber, the OES approach is used to investigate the fundamental properties of the plasma source. The electron number densities are calculated from the Stark broadening of ArI lines, whilst the Boltzmann plot technique is used to calculate the excitation temperatures of the plasma jet.
II. Experimental setup
The RF ICP plasma torch consists of a gas flow distributor head for 3 different gas flow lines: carrier gas, central gas, and sheath gas. There are two quartz tubes for introducing the gases to the torch. Both tubes starting with the torch head and the inner tube, have a height of 9.5 cm, and the outer tube has a height of 18 cm. The carrier gas is introduced to the torch through an injector at the center of the torch head into the inner tube, which can be used for direct waste insertion through the torch itself. The central gas is the forming plasma gas (argon) and is also introduced into the inner tube. Sheath gas is introduced near the inner wall of the outer tube. Sheath gas is used to help stabilize, and most importantly, it protects the inner tube as a cooling medium. The outer quartz tube is a 2.5 mm thick, 18 cm long plasma confinement tube surrounded by a 7-turn, water-cooled copper coil. RF power was supplied to the coil by an advanced energy generator (Model RFX3000), having a maximum power output of 1.1 kW and a nominal operating frequency of 13.56 MHz. To ignite plasma inside the quartz tube, dc electrical spark is used at the start of the RF coil inside the tube. Pure argon gas was used as plasma gas in the experiments. The Optical emission spectra were collected using Ocean Insight Flame-S-ER1-SE spectrometer through an optical fiber at a wavelength region of 450-950 nm with an integration time of the emission was 1 msec. A representation of the experimental setup with the RF ICP plasma torch is presented in Figure 1.
III. Result and discussion
Ar discharge emissions were measured at various gas flow rates (2 and 4 L/min) and RF power (440, 550, 660, 770, 880, and 990 W). Figure 2 (a, b) shows the emissions of the Ar discharge recorded at atmospheric pressure in the wavelength range 400–950 nm, flow rates of 2 and 4 L/min, and RF power of 440 W, respectively.
All the Ar lines detected in the emissions belong to (ArI) and are concentrated in the 696–851 nm wavelength range. Table 1 shows the wavelengths, excitation energy for the upper excited level (Ek), transition probability (Aik), and statistical weight (gk) for the upper excited level taken from NIST for every line that appeared. Due to their higher mobility relative to ions and ability to follow the electric field, electrons in RF plasma discharge oversee the ionization and excitation processes [22,23]. Figure 3 (a, b) displays the variation of the intensity of ArI lines with the RF power at gas flow rates of 2 and 4 L/min, respectively. We observe from Figure 3a that the intensity of all ArI lines increases with the power, while at 4 L/min (see Figure 3b), the intensity of the lines decreases with the power.
A. Excitation temperature
Boltzmann plot was used to determine the effective electron temperature (Teff) for the plasma produced from our RF torch using the following equation:
Where λki, Aki, Ek, and gk are wavelength, transition probability, excitation energy, and statistical weight of the upper state, respectively, kB is the Boltzmann constant, and C is a constant. By plotting the left-hand side of Eq. 1 on the vertical axis and Ek on the horizontal axis, the Teff can be derived from the inverse of the slope of the linear fitted line. The Boltzmann plot is an efficient method for determining Teff in atmospheric plasma torches; since it does not require a standard source for calibration, and the accuracy increases with the energy range of the emitted lines used in the calculations [19,24,25]. All lines in Table 1 are well isolated and unabsorbed and were chosen to implement the Boltzmann plot, and all spectral parameters are in Eq. 1 per line taken from NIST. Figure 4 (a, b) shows the Boltzmann plot at flow rates of 2 and 4 L/min and power 440 W; respectively, the error is generated from the uncertainty in the determination of transition probability (Aki) of the ArI lines [25]. Figure 5 (a, b) represents the variation of the electron temperature Teff calculated from the Boltzmann plot with the power at flow rates of 2 and 4 L/min, respectively. The electron temperature decreases with the RF power at a gas flow rate of 2 L/min (see Fig. 5a) due to the two-step ionization, which requires a lower electron temperature while increasing the electron density to produce the necessary ionization rate [26,27]. By comparison, at a flow rate of 4 L/min (see Fig. 5b), the electron temperature increases with the discharge power. The inverse behaviour of the electron temperature at 4 L/min is due to the anomalous skin effect [27]. Only a few electrons significantly contribute to the current density in the anomalous skin effect. These are "glancing" electrons, which spend a significant portion of the field period inside the skin layer after being reflected at modest angles from the plasma barrier. The remaining electrons leave the epidermal layer too quickly to contribute much to the current [28].
The RF ICP torch is operated in the nonpropagating regime. The driving RF field only displays a skin effect by penetrating the plasma within a skin layer width (δ) near the antenna [29]. The surface of the plasma is where the induced electric current and radio frequency field are concentrated. Due to the higher mobility of electrons compared to ions, only electrons are responsible for energy transfer and ionization. The electrons gain energy from the electric field in the skin layer and transfer this energy to the gas atoms to generate more charges and increase the energy conversion rate of the material. Reducing the charge density reduces the efficiency of the torch during the treating process. The charges can be lost by diffusing the energetic electrons to the reactor walls or creating only excited atoms. One solution developed to reduce electron loss through the chamber wall is to provide an axially high flow of Ar gas to form a cooled barrier gas that separates the plasma from the walls. Vortex flow has the same effect as axially high flow [30]. At 4 L/min, another energy loss mechanism was detected due to the anomalous skin effect. Most of the electrons with sufficient energy did not contribute to the ionization of the atoms to increase the current density, therefore, the charge density decreases, as does the energy efficiency of the torch. Anomalous skin is an uncontrollable phenomenon that we only can detect and try to avoid.
B. Electron density
Plasma density (ne) is an essential parameter for measuring the energy transfer efficiency in the torch and determining the ionization equilibrium state. Methods of calculating electron density can be divided into electrical diagnostics and optical diagnostics. Computing the electron density by the Langmuir probe (single, double, and triple probes), which represents the electric diagnostic, is inaccurate in atmospheric pressure, where the plasma is under high collision conditions [31]. The Stark broadening method is one of the widely used optical diagnostics methods to calculate electron density [19,31,32]. It is more affordable, informal, and inexpensive than Thomson scattering or laser heterodyne interferometry techniques, and its accuracy is high in the range of plasma density of 1016 cm-1 [31]. The broadening of the spectra line (FWHM)) is a convolution of the Lorentzian profile (Stark, Van der Waals, and Resonance broadening) and Gaussian profile (Doppler and instrumental boarding):
In our experiment conditions (pressure and Te ~10000 K), both Resonance broadening and Van Deer Wales broadening are negligible [25,31]. The Gaussian profile is represented by the following equation:
Where is the instrumental broadening and is Doppler broadening
Doppler broadening is given by:
Where o,, and are the wavelength, the gas temperature, and the mass of the emitter, respectively.
By using a Voigt function for deconvolution, we can calculate the Stark broadening from Eq. 2, and the electron density can be calculated using the empirical formula [31]:
In this investigation, one isolated ArI line (738.3 nm) with precisely determined values of the broadening parameter is employed. By fitting the experimental data with the Voigt function using Origin software, as can be seen in Figure 6 (a-f), the FWHM () of this line is obtained. Doppler broadening= 0.008nm was calculated from Eq. 4 at ~10,000 K, and the Instrumental broadening = 0.66 nm was measured by using a diode-pumped solid-state laser line (660 nm). From Eq. 5, we calculated the plasma density. Table 2 shows,, and plasma density (ne) at different RF power and flow rates.
Figure 7 shows the variation of the plasma density with the RF power. We observed that at a gas flow rate of 2 L/min, the plasma density increases with power, while at a gas flow rate of 4 L/min, the variation in plasma density is inverse, as the plasma density decreases with the RF power. These results confirm the results obtained from the electron temperature measurements, where at a gas flow rate of 4 L/min, most of the electrons with the effective temperature did not contribute to the discharge; because of this, the plasma density decreased with the power.
IV. Conclusion
This work aimed to optically characterize a developed atmospheric RF ICP torch to treat MSW to understand the physical phenomena inside the plasma discharge and evaluate the performance of the torch. The electron temperature calculations using the Boltzmann plot for almost all the appeared argon lines in the emission confirm the formation of an energy loss mechanism that occurs in low-pressure RF ICP discharge, the anomalous skin effect. The anomalous skin effect causes a decrease in the current density due to the non-contribution of most of the energetic electrons in the discharge, which causes a decrease in the torch efficiency. The density calculations using the Stark broadening agree with the electron temperature measurements and allow us to strongly recommend the Ar line (738.3 nm) as a line with convenient Stark broadening parameters needed in plasma spectroscopy.
References
- H. E.-D. M. Saleh and H. E.-D. M. Saleh. Municipal Solid Waste Management. 2019. [CrossRef]
- Zhu, Y.; Zhang, Y.; Luo, D.; Chong, Z.; Li, E.; Kong, X. A review of municipal solid waste in China: characteristics, compositions, influential factors and treatment technologies. Environ. Dev. Sustain. 2020, 23, 6603–6622. [Google Scholar] [CrossRef]
- “Trends in Solid Waste Management.”. Available online: https://datatopics.worldbank.org/what-a-waste/trends_in_solid_waste_management.html (accessed on 6 February 2023).
- New Science paper calculates magnitude of plastic waste going into the ocean - UGA Today.” https://news.uga.edu/new-science-paper-magnitude-plastic-waste-going-into-ocean-0215/ (accessed on 6 February 2023).
- A Nwachukwu, M.; Ronald, M.; Feng, H. Global capacity, potentials and trends of solid waste research and management. Waste Manag. Res. J. a Sustain. Circ. Econ. 2017, 35, 923–934. [Google Scholar] [CrossRef] [PubMed]
- Yang, H.; Ma, M.; Thompson, J.R.; Flower, R.J. Waste management, informal recycling, environmental pollution and public health. J. Epidemiology Community Heal. 2017, 72, 237–243. [Google Scholar] [CrossRef] [PubMed]
- P. Alam, K. A.-I. J. of Sustainable, and undefined 2013, “Impact of solid waste on health and the environment,” intelligentjo.com, Accessed: Feb. 06, 2023. [Online]. Available: https://intelligentjo.com/images/Papers/general/waste/IMPACT-OF-SOLID-WASTE-ON-HEALTH-AND-THE-ENVIRONMENT.pdf.
- Das, S.; Lee, S.-H.; Kumar, P.; Kim, K.-H.; Lee, S.S.; Bhattacharya, S.S. Solid waste management: Scope and the challenge of sustainability. J. Clean. Prod. 2019, 228, 658–678. [Google Scholar] [CrossRef]
- Ali, J.; Rasheed, T.; Afreen, M.; Anwar, M.T.; Nawaz, Z.; Anwar, H.; Rizwan, K. Modalities for conversion of waste to energy — Challenges and perspectives. Sci. Total. Environ. 2020, 727, 138610. [Google Scholar] [CrossRef]
- Moustakas, K.; Loizidou, M.; Rehan, M.; Nizami, A. A review of recent developments in renewable and sustainable energy systems: Key challenges and future perspective. Renew. Sustain. Energy Rev. 2020, 119, 109418. [Google Scholar] [CrossRef]
- Z. Rahman, G. Ishtiaq, and A. Amanat, “Assessment of Solid Waste Management and Sustainability Practices in District Swat, Pakistan,” PSM Microbiology, vol. 6, no. 3, pp. 66–80, Sep. 2021, Accessed: Feb. 06, 2023. [Online]. Available: https://journals.psmpublishers.org/index.php/microbiol/article/view/587.
- Ghosal, D.; Kaur, R.; A Jadhav, D. Utilization and Management of Waste Derived Material for Sustainable Energy Production: A mini review. Acad. Lett. 2021. [Google Scholar] [CrossRef]
- Rasheed, T.; Anwar, M.T.; Ahmad, N.; Sher, F.; Khan, S.U.-D.; Ahmad, A.; Khan, R.; Wazeer, I. Valorisation and emerging perspective of biomass based waste-to-energy technologies and their socio-environmental impact: A review. J. Environ. Manag. 2021, 287, 112257. [Google Scholar] [CrossRef]
- Qureshi, M.S.; Oasmaa, A.; Pihkola, H.; Deviatkin, I.; Tenhunen, A.; Mannila, J.; Minkkinen, H.; Pohjakallio, M.; Laine-Ylijoki, J. Pyrolysis of plastic waste: Opportunities and challenges. J. Anal. Appl. Pyrolysis 2020, 152, 104804. [Google Scholar] [CrossRef]
- Lui, J.; Chen, W.-H.; Tsang, D.C.; You, S. A critical review on the principles, applications, and challenges of waste-to-hydrogen technologies. Renew. Sustain. Energy Rev. 2020, 134, 110365. [Google Scholar] [CrossRef]
- Singh, M.; Salaudeen, S.A.; Gilroyed, B.H.; Al-Salem, S.M.; Dutta, A. A review on co-pyrolysis of biomass with plastics and tires: recent progress, catalyst development, and scaling up potential. Biomass- Convers. Biorefinery 2021, 1–25. [Google Scholar] [CrossRef]
- Kaushal, R. Rohit; Dhaka, A.K. A comprehensive review of the application of plasma gasification technology in circumventing the medical waste in a post-COVID-19 scenario. Biomass- Convers. Biorefinery 2022, 1–16. [Google Scholar] [CrossRef]
- Zhang, H.; Yuan, F.; Chen, Q. Optical Emission Spectroscopy Diagnostics of Atmospheric Pressure Radio Frequency Ar-H2 Inductively Coupled Thermal Plasma. IEEE Trans. Plasma Sci. 2020, 48, 3621–3628. [Google Scholar] [CrossRef]
- Tu, X.; Chéron, B.G.; Yan, J.H.; Cen, K.F. Electrical and spectroscopic diagnostic of an atmospheric double arc argon plasma jet. Plasma Sources Sci. Technol. 2007, 16, 803–812. [Google Scholar] [CrossRef]
- Nikiforov, A.Y.; Leys, C.; A Gonzalez, M.; Walsh, J.L. Electron density measurement in atmospheric pressure plasma jets: Stark broadening of hydrogenated and non-hydrogenated lines. Plasma Sources Sci. Technol. 2015, 24. [Google Scholar] [CrossRef]
- Chen, C.; Fu, W.; Zhang, C.; Lu, D.; Han, M.; Yan, Y. Langmuir Probe Diagnostics with Optical Emission Spectrometry (OES) for Coaxial Line Microwave Plasma. Appl. Sci. 2020, 10, 8117. [Google Scholar] [CrossRef]
- Aldeeb, M.A.; Morgan, N.; Abouelsayed, A.; Amin, K.M.; Hassaballa, S. Electrical and Optical Characterization of Acetylene RF CCP for Synthesis of Different Forms of Hydrogenated Amorphous Carbon Films. Plasma Chem. Plasma Process. 2019, 40, 387–406. [Google Scholar] [CrossRef]
- Y. P. Raizer, M. N. Shneider, and N. A. Yatsenko, “Radio-Frequency capacitive discharges,” Radio-Frequency Capacitive Discharges, pp. 1–304, Dec. 2017. [CrossRef]
- Abbass, Q.; Ahmed, N.; Ahmed, R.; Baig, M.A. A Comparative Study of Calibration Free Methods for the Elemental Analysis by Laser Induced Breakdown Spectroscopy. Plasma Chem. Plasma Process. 2016, 36, 1287–1299. [Google Scholar] [CrossRef]
- Ohno, N.; Razzak, M.A.; Ukai, H.; Takamura, S.; Uesugi, Y. Validity of Electron Temperature Measurement by Using Boltzmann Plot Method in Radio Frequency Inductive Discharge in the Atmospheric Pressure Range. Plasma Fusion Res. 2006, 1, 028–028. [Google Scholar] [CrossRef]
- A Godyak, V.; Piejak, R.B.; Alexandrovich, B.M. Electron energy distribution function measurements and plasma parameters in inductively coupled argon plasma. Plasma Sources Sci. Technol. 2002, 11, 525–543. [Google Scholar] [CrossRef]
- A Godyak, V. Electrical and plasma parameters of ICP with high coupling efficiency. Plasma Sources Sci. Technol. 2011, 20. [Google Scholar] [CrossRef]
- I Kolobov, V.; Economou, D.J. The anomalous skin effect in gas discharge plasmas. Plasma Sources Sci. Technol. 1997, 6, R1–R17. [Google Scholar] [CrossRef]
- Godyak, V.A.; Kolobov, V.I. Effect of Collisionless Heating on Electron Energy Distribution in an Inductively Coupled Plasma. Phys. Rev. Lett. 1998, 81, 369–372. [Google Scholar] [CrossRef]
- Boulos, M.I.; Fauchais, P.L.; Pfender, E. The Plasma State. 2016, 1–53. [Google Scholar] [CrossRef]
- Nikiforov, A.Y.; Leys, C.; A Gonzalez, M.; Walsh, J.L. Electron density measurement in atmospheric pressure plasma jets: Stark broadening of hydrogenated and non-hydrogenated lines. Plasma Sources Sci. Technol. 2015, 24. [Google Scholar] [CrossRef]
- Lari, E.S.; Askari, H.R.; Meftah, M.T.; Shariat, M. Calculation of electron density and temperature of plasmas by using new Stark broadening formula of helium lines. Phys. Plasmas 2019, 26. [Google Scholar] [CrossRef]
Figure 1.
Experimental setup of the Ar spectrum measurements.
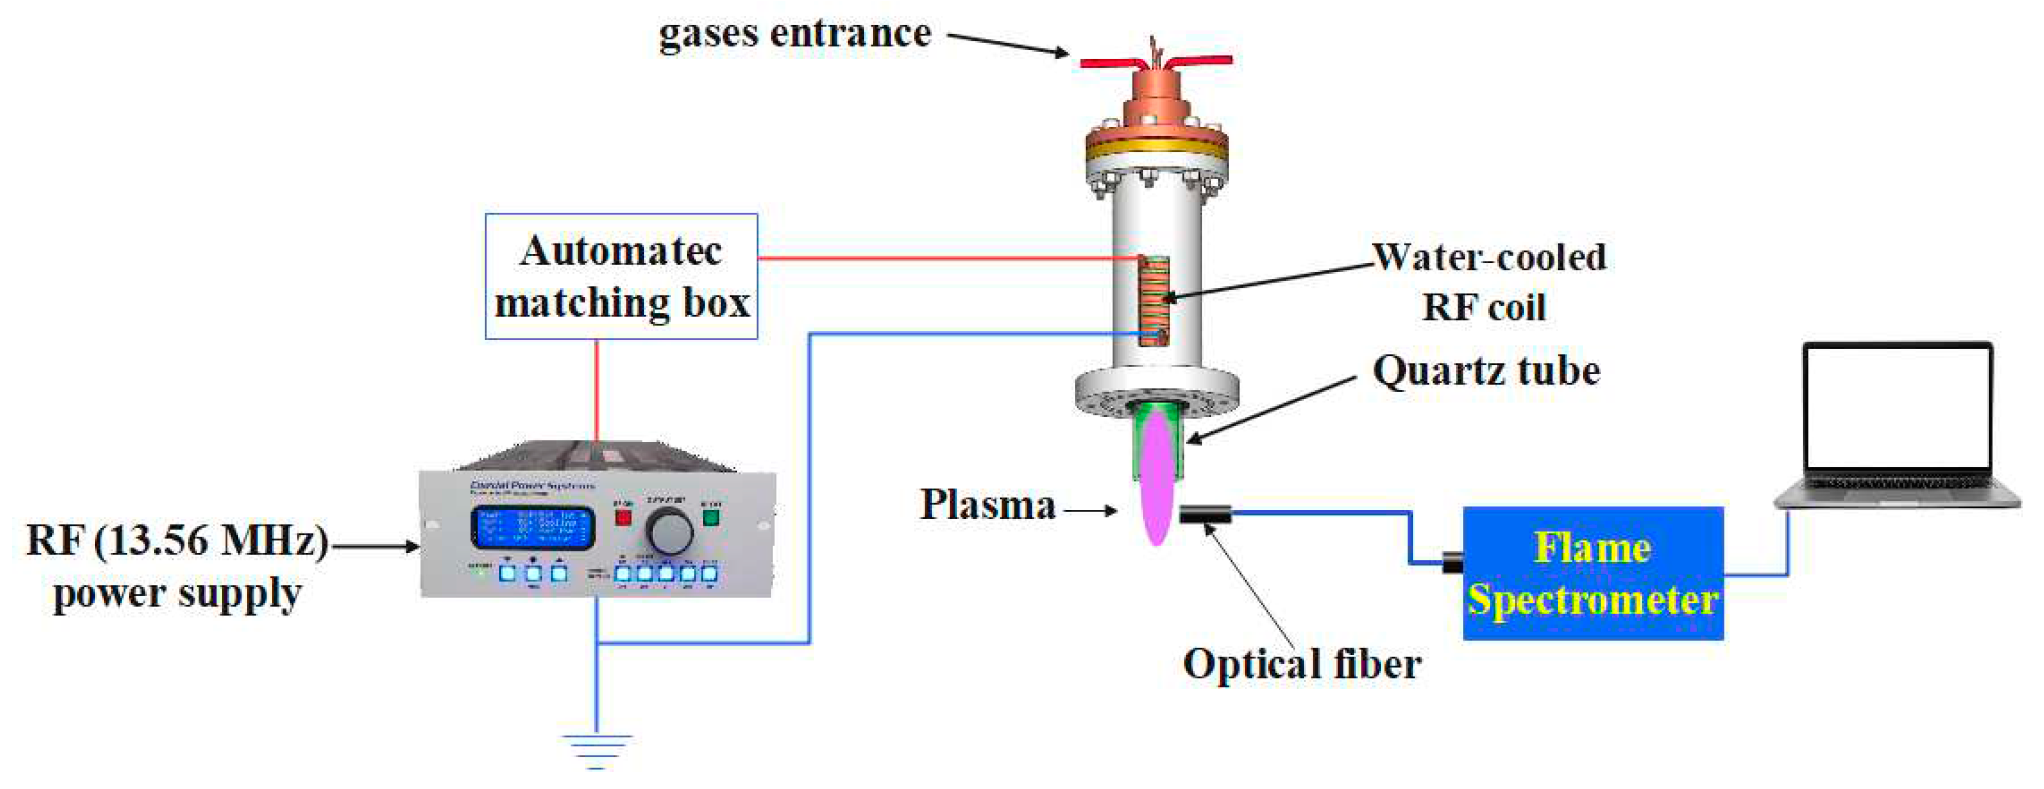
Figure 2.
(a, b) Argon emission spectra at flow rates 2 L/min and 4 L/min at RF discharge power 440 W, respectively.
Figure 2.
(a, b) Argon emission spectra at flow rates 2 L/min and 4 L/min at RF discharge power 440 W, respectively.
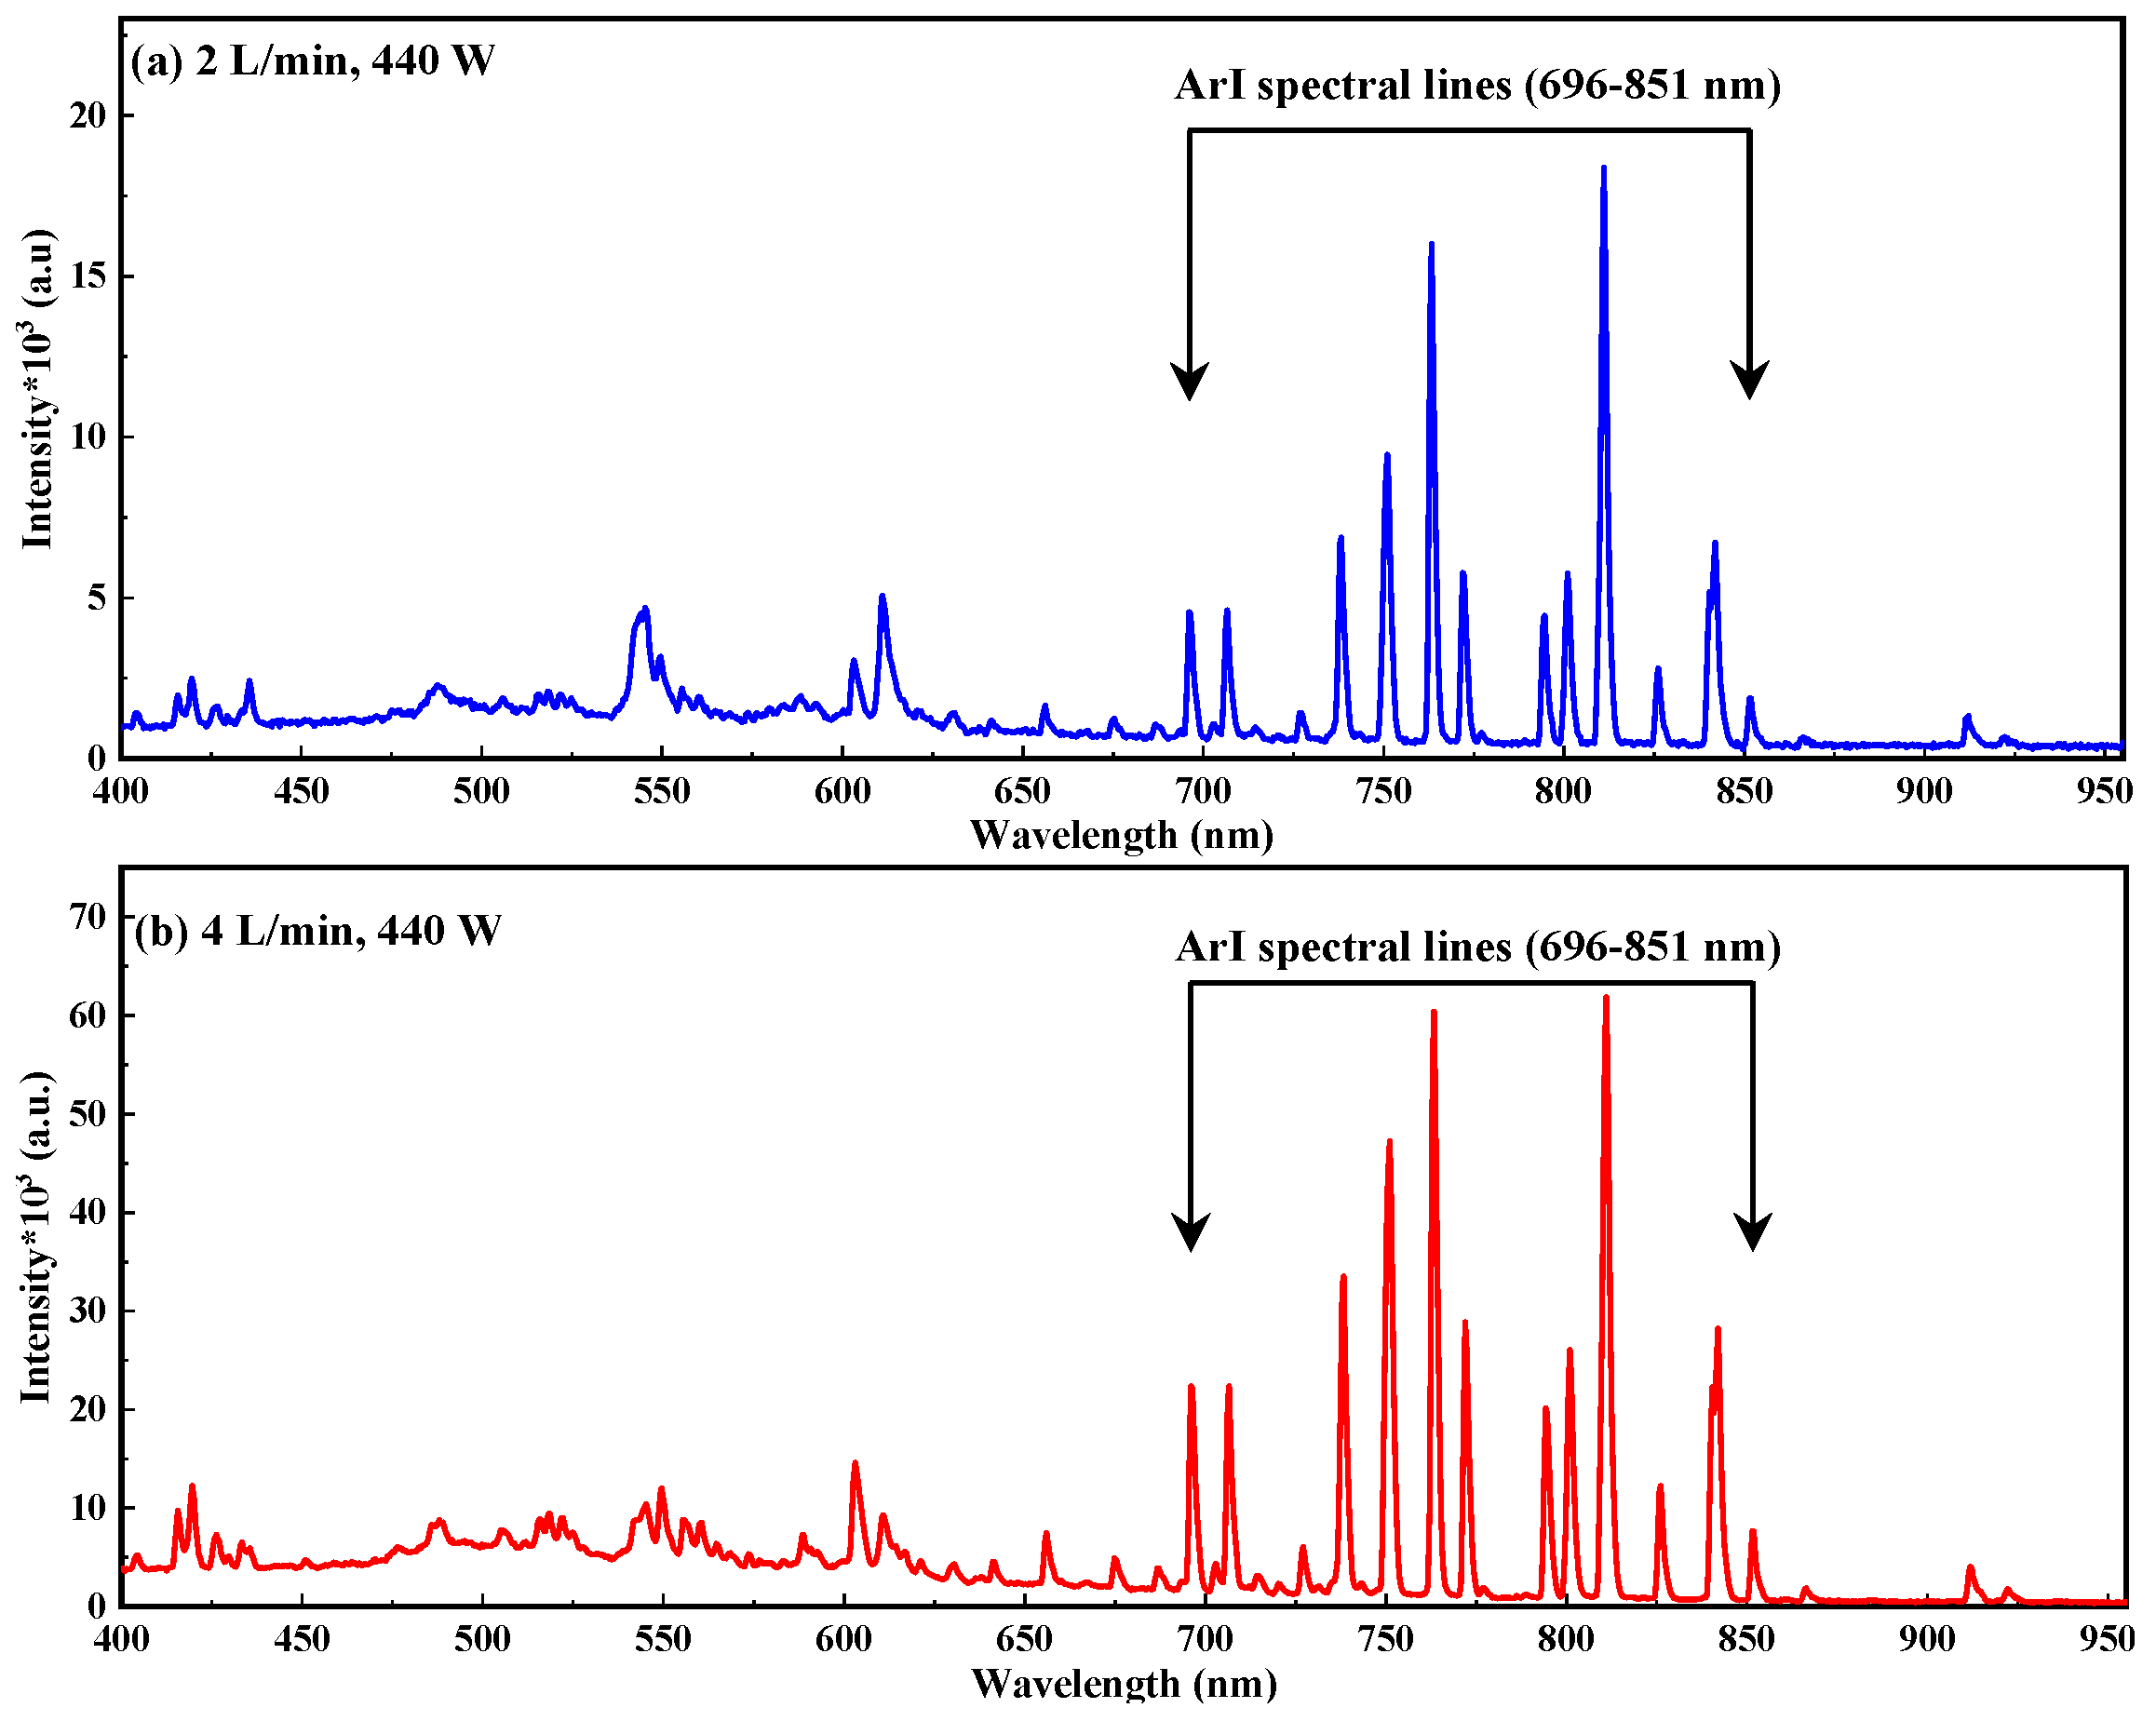
Figure 3.
(a, b): ArI lines intensity variation with the RF power at flow rates of 2 and 4 L/min, respectively.
Figure 3.
(a, b): ArI lines intensity variation with the RF power at flow rates of 2 and 4 L/min, respectively.
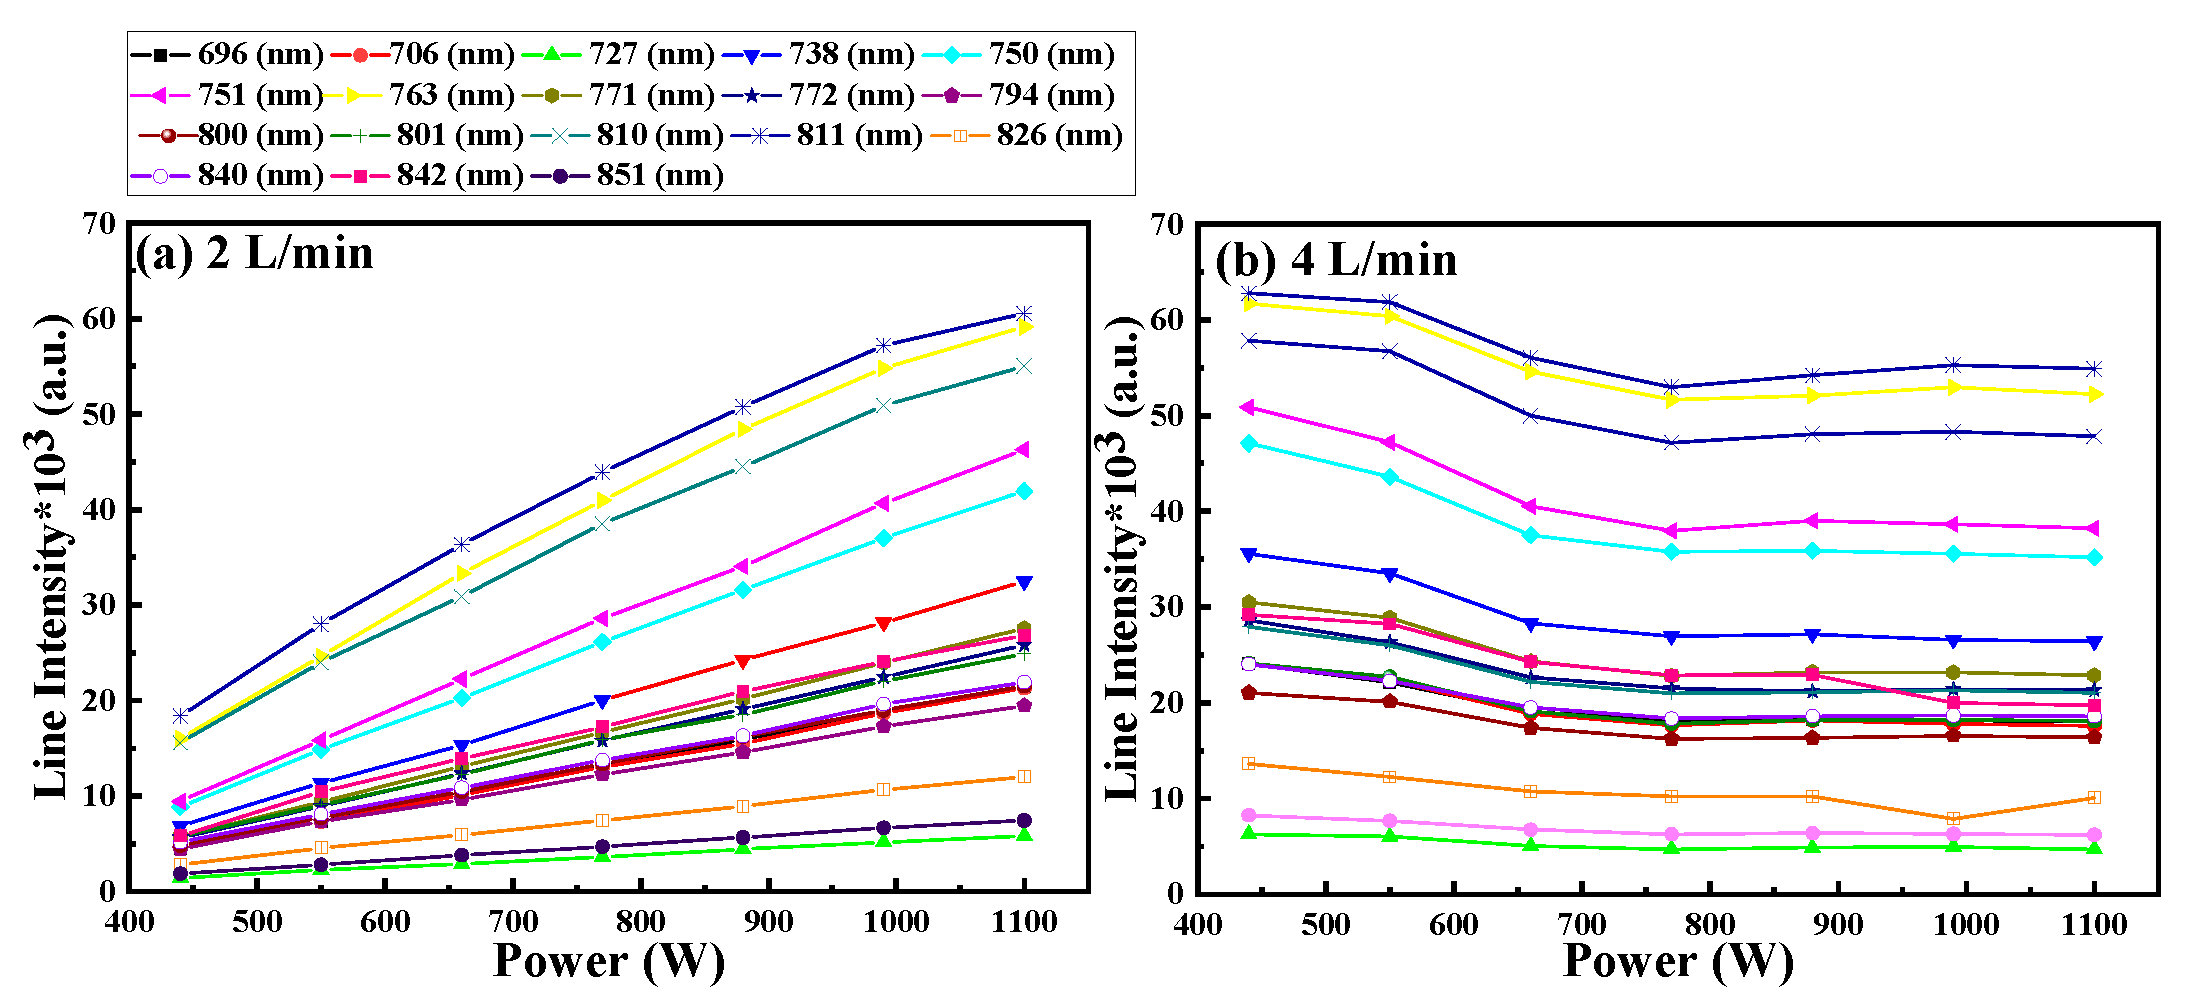
Figure 4.
(a, b): Boltzmann plot for emission lines at flow rates 2 L/min and 4 L/min at RF power 440 W, respectively.
Figure 4.
(a, b): Boltzmann plot for emission lines at flow rates 2 L/min and 4 L/min at RF power 440 W, respectively.
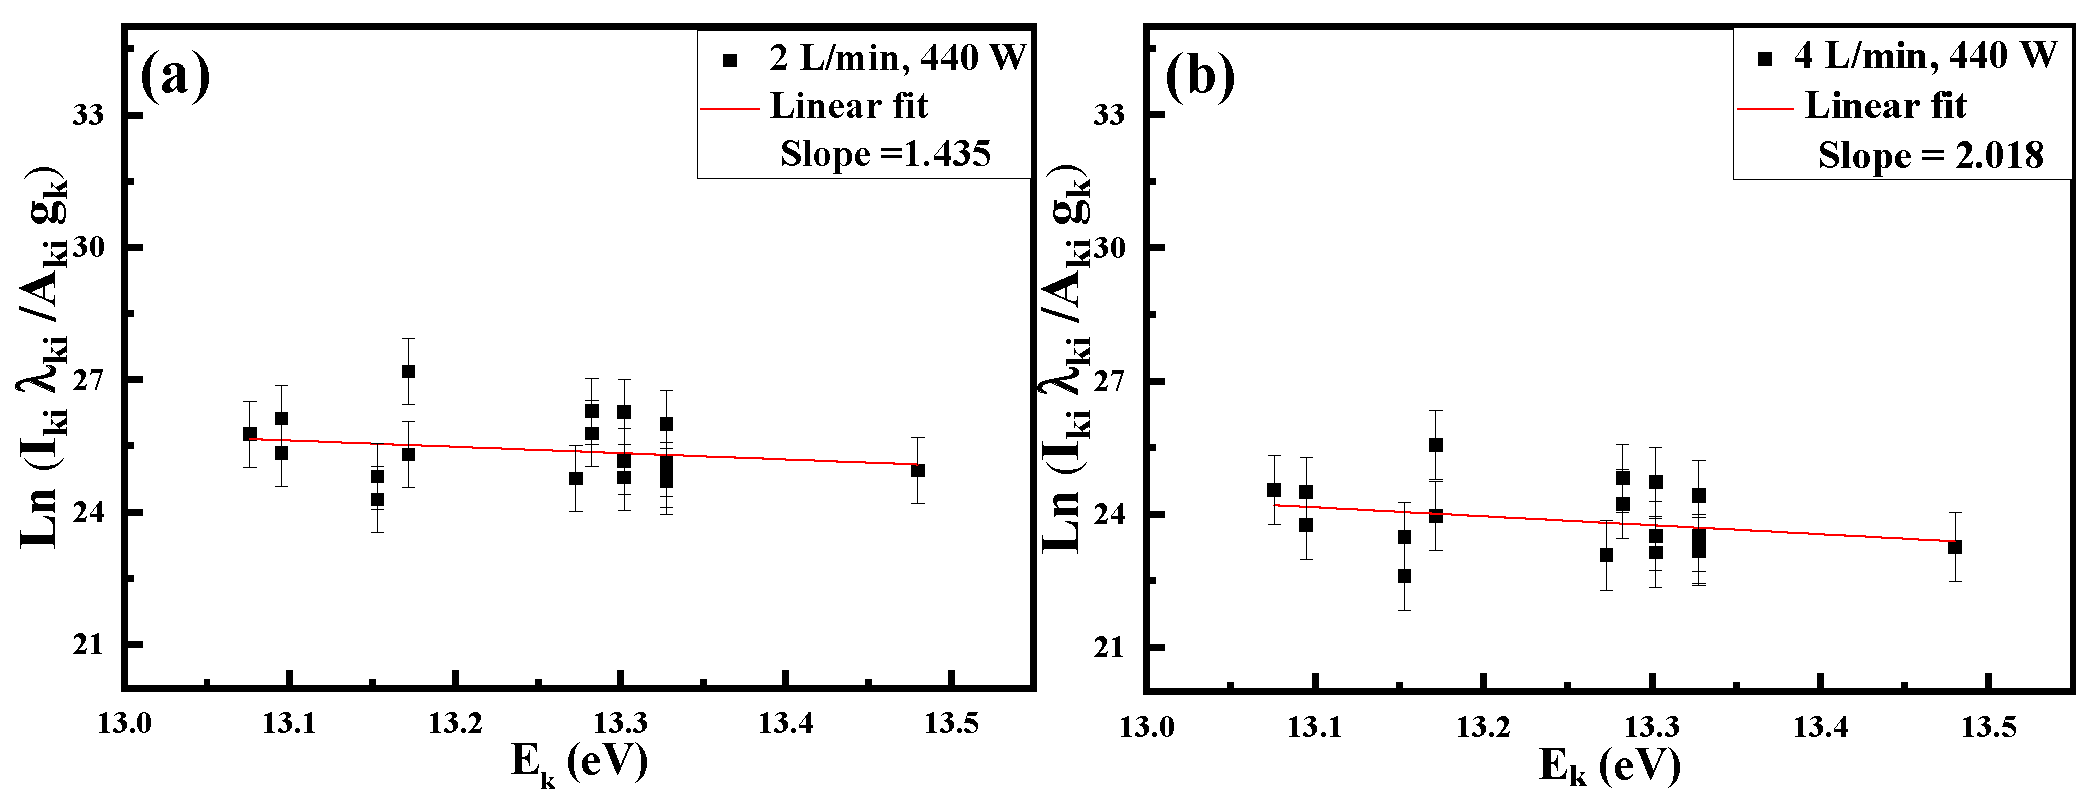
Figure 5.
(a, b): Electron temperature variation with RF power at flow rates 2 and 4 L/min, respectively.
Figure 5.
(a, b): Electron temperature variation with RF power at flow rates 2 and 4 L/min, respectively.
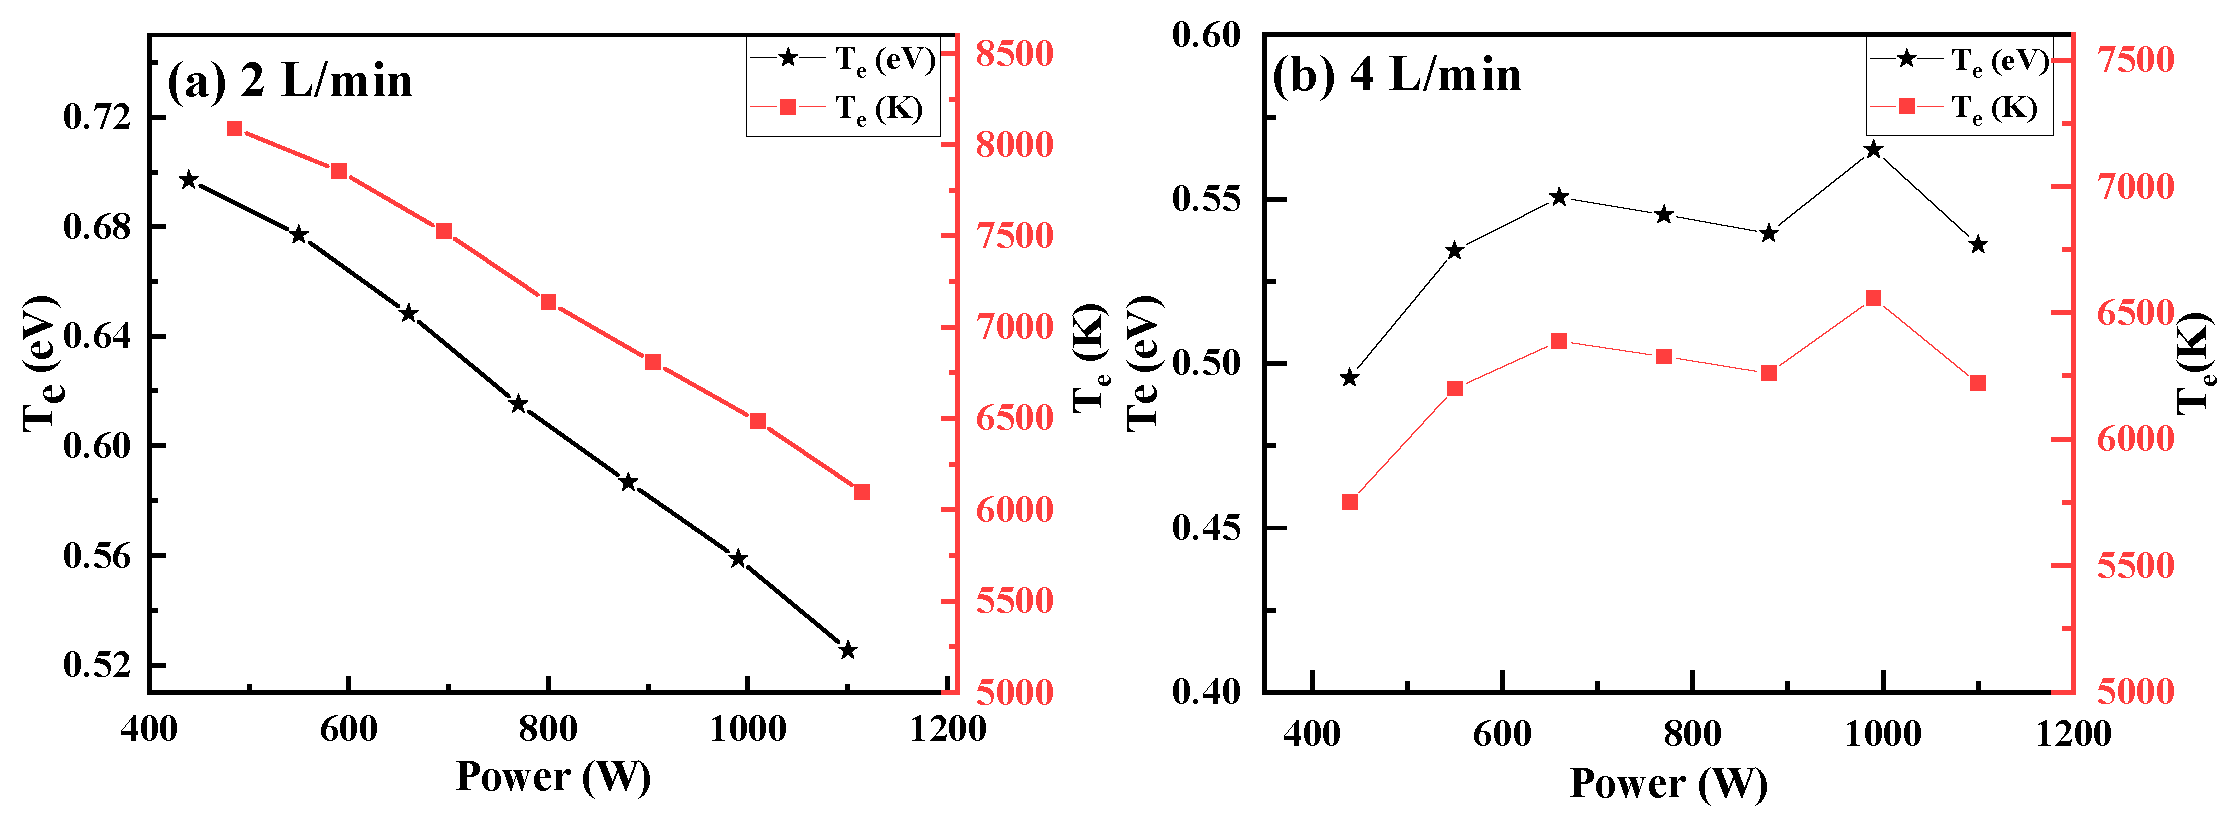
Figure 6.
(a, c, e) Ar I (738.3 nm) line fitted with Voigt function at flow rate 2 L/min, respectively, (b, d, f) Ar I (738.3 nm) line fitted with Voigt function at flow rate 4 L/min, respectively.
Figure 6.
(a, c, e) Ar I (738.3 nm) line fitted with Voigt function at flow rate 2 L/min, respectively, (b, d, f) Ar I (738.3 nm) line fitted with Voigt function at flow rate 4 L/min, respectively.
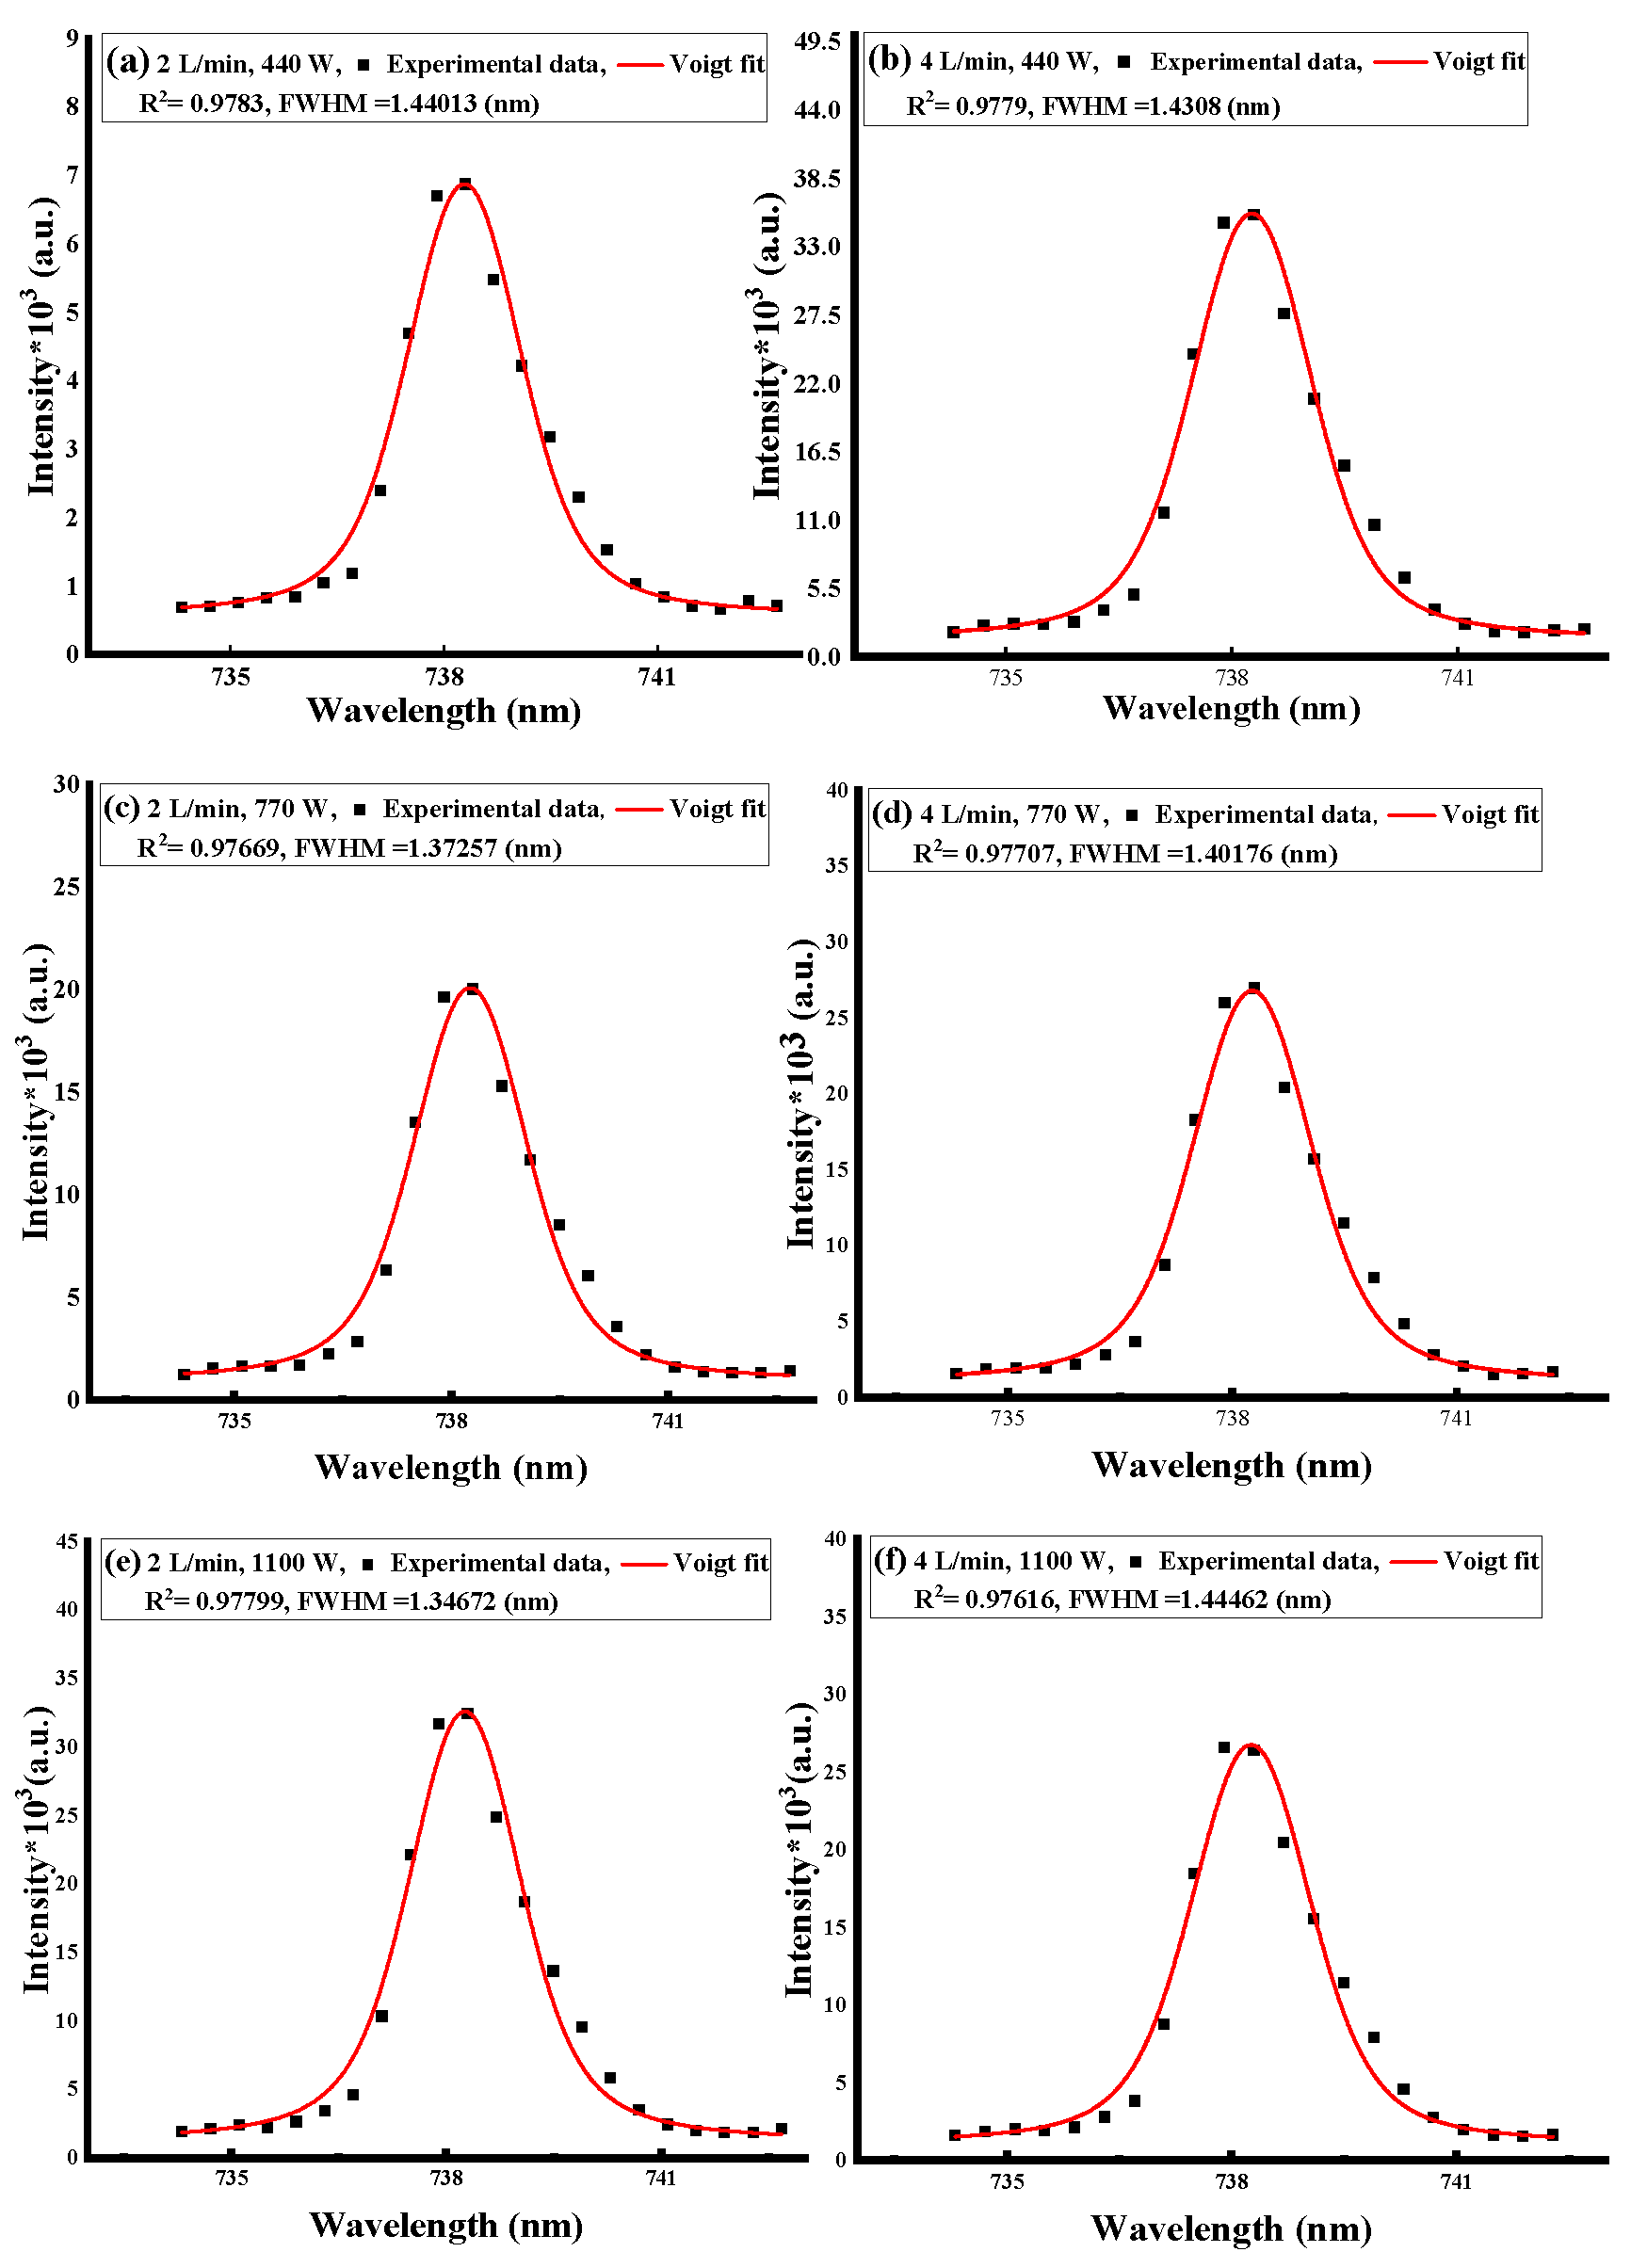
Figure 7.
Variation of the plasma density (ne) with RF power at two different Ar flow rates 2 and 4 L/min.
Figure 7.
Variation of the plasma density (ne) with RF power at two different Ar flow rates 2 and 4 L/min.
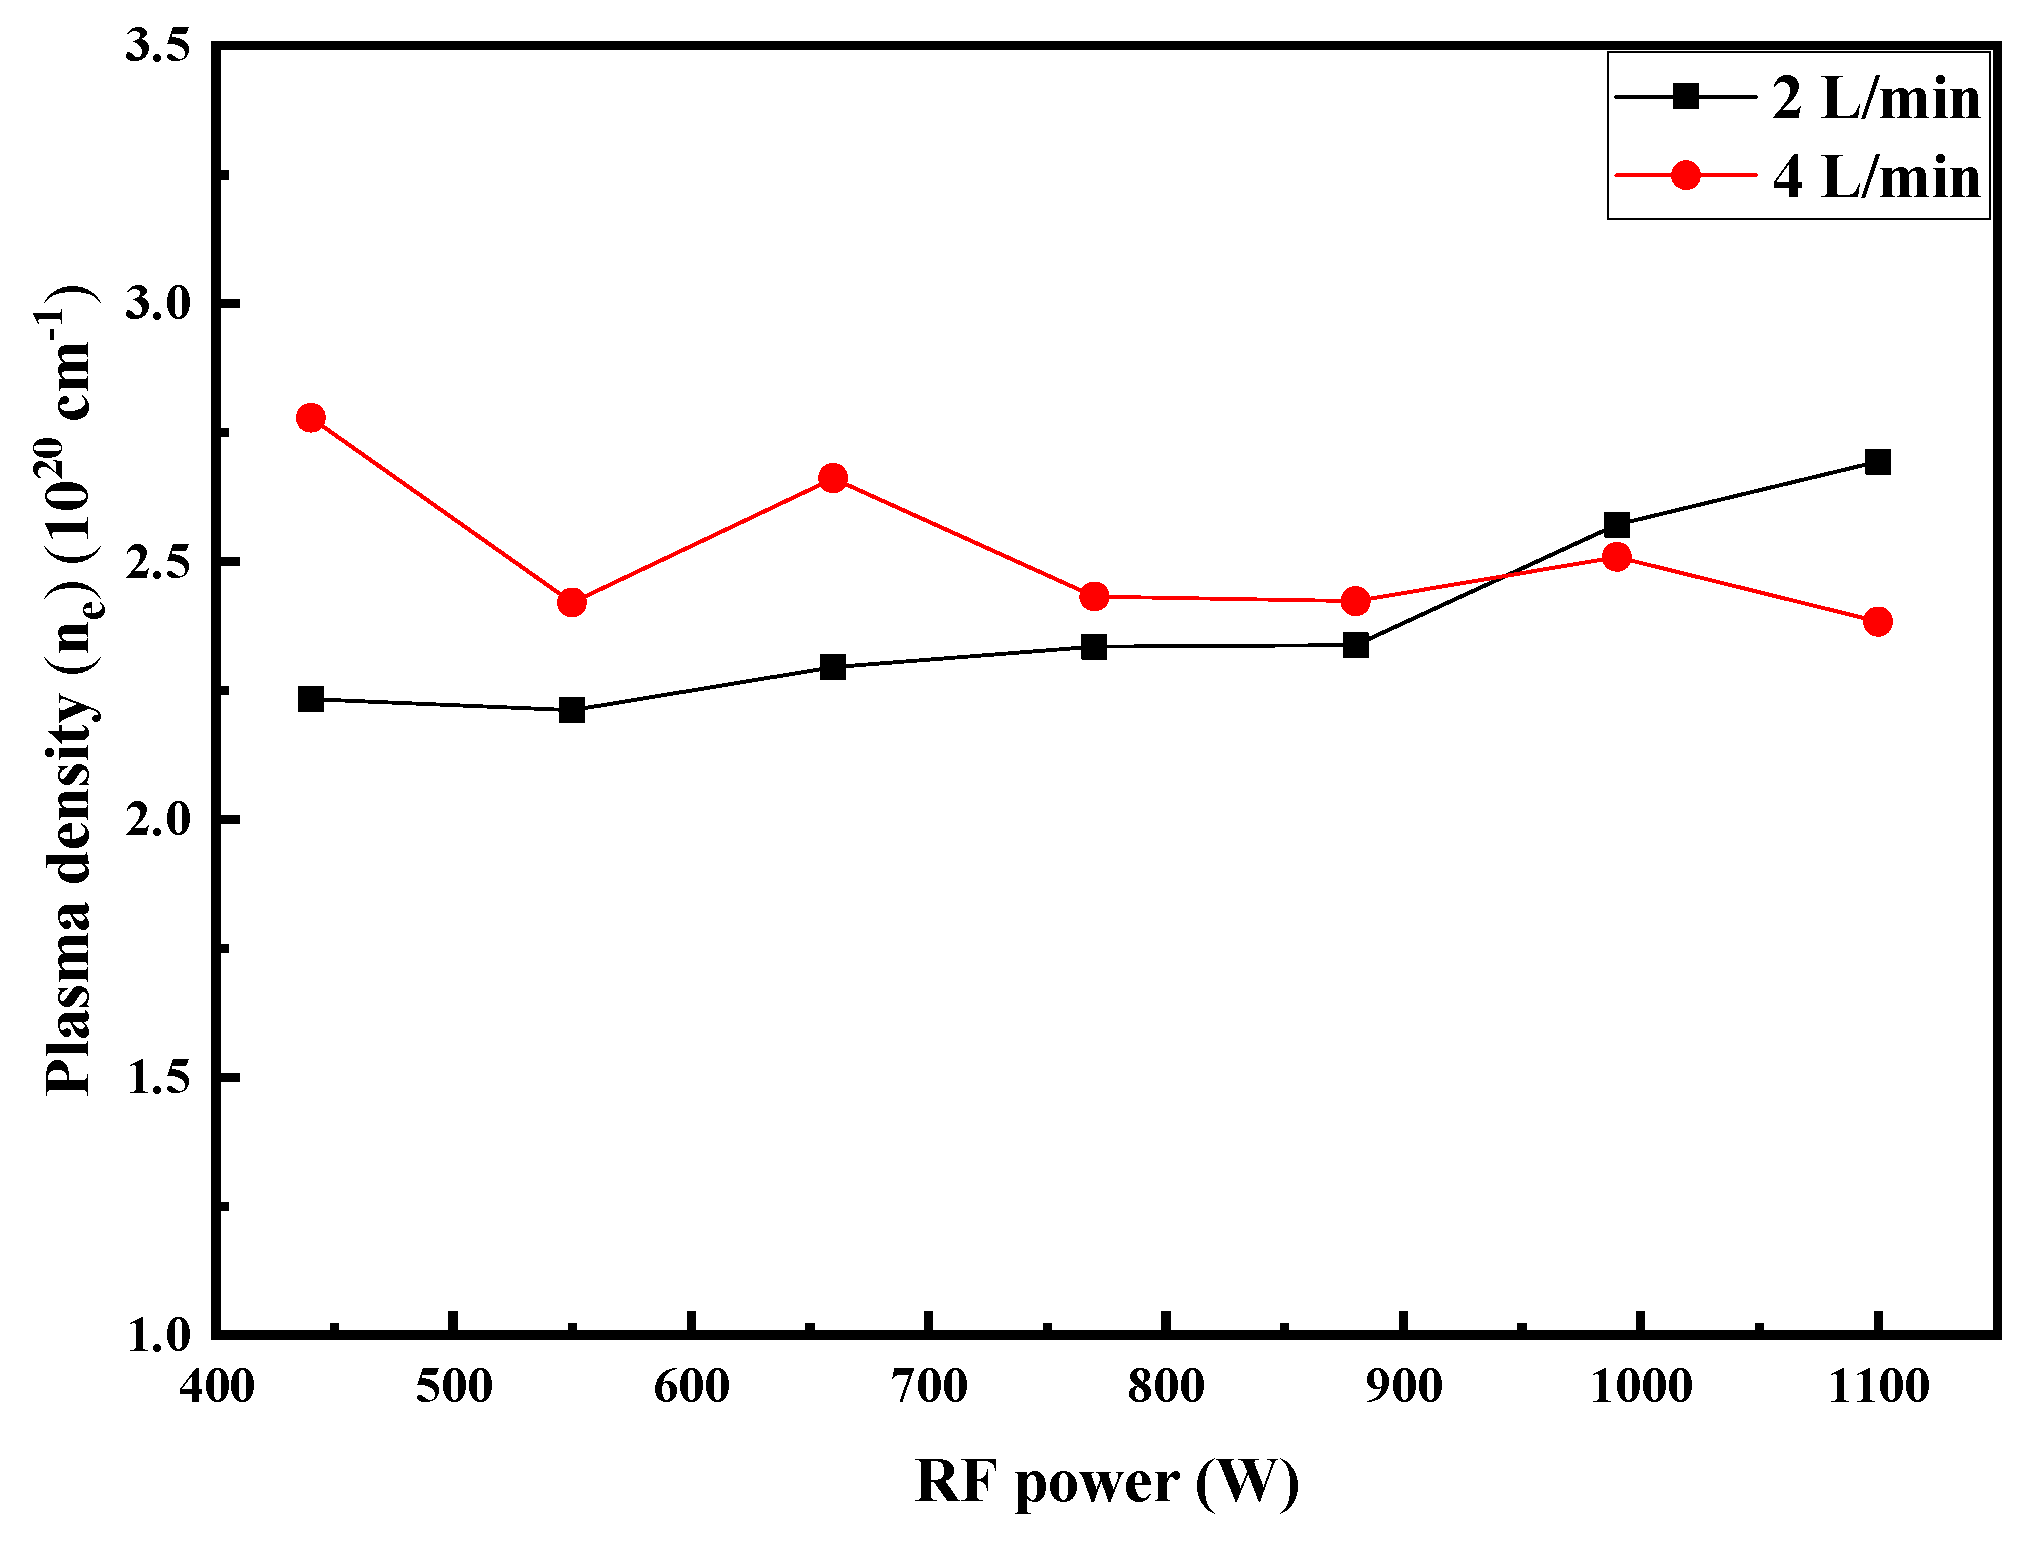

Table 1.
The wavelength, excitation energy, transition probability, and statistical weight for the appeared lines in the range of 696-851 nm.
Table 1.
The wavelength, excitation energy, transition probability, and statistical weight for the appeared lines in the range of 696-851 nm.
| Species | Wavelength (nm) | Ek (eV) | Aik (106 S-1) | gk |
|---|---|---|---|---|
| ArI | 696 | 13.328 | 6.40 | 3 |
| ArI | 706 | 13.302 | 3.80 | 5 |
| ArI | 727 | 13.328 | 1.83 | 3 |
| ArI | 738 | 13.302 | 8.50 | 5 |
| ArI | 750 | 13.479 | 45 | 1 |
| ArI | 751 | 13.273 | 40 | 1 |
| ArI | 763 | 13.172 | 24 | 5 |
| ArI | 771 | 13.153 | 5.20 | 3 |
| ArI | 772 | 13.328 | 11.7 | 3 |
| ArI | 794 | 13.283 | 18.6 | 3 |
| ArI | 800 | 13.172 | 49 | 5 |
| ArI | 801 | 13.095 | 9.30 | 5 |
| ArI | 810 | 13.153 | 25 | 3 |
| ArI | 811 | 13.076 | 33 | 7 |
| ArI | 826 | 13.328 | 15.3 | 3 |
| ArI | 840 | 13.302 | 22.3 | 5 |
| ArI | 842 | 13.095 | 21.5 | 5 |
| ArI | 851 | 13.283 | 13.9 | 3 |
Table 2.
of the Ar line 738.3 nm,, and plasma density (ne).
| 2 L/min | 4 L/min | ||||||
|---|---|---|---|---|---|---|---|
| Power (W) |
(nm) |
(nm) | ne (1020 cm -1) |
Power (W) | (nm) | ne (1020 cm-1) |
|
| 440 | 1.431 | 1.126 | 2.231 | 440 | 1.440 | 1.138 | 2.778 |
| 550 | 1.406 | 1.096 | 2.211 | 550 | 1.358 | 1.037 | 2.421 |
| 660 | 1.415 | 1.108 | 2.295 | 660 | 1.461 | 1.162 | 2.661 |
| 770 | 1.402 | 1.091 | 2.335 | 770 | 1.372 | 1.055 | 2.432 |
| 880 | 1.377 | 1.061 | 2.338 | 880 | 1.363 | 1.044 | 2.423 |
| 990 | 1.436 | 1.133 | 2.571 | 990 | 1.419 | 1.113 | 2.508 |
| 1100 | 1.445 | 1.143 | 2.693 | 1100 | 1.346 | 1.023 | 2.384 |
Disclaimer/Publisher’s Note: The statements, opinions and data contained in all publications are solely those of the individual author(s) and contributor(s) and not of MDPI and/or the editor(s). MDPI and/or the editor(s) disclaim responsibility for any injury to people or property resulting from any ideas, methods, instructions or products referred to in the content. |
© 2023 by the authors. Licensee MDPI, Basel, Switzerland. This article is an open access article distributed under the terms and conditions of the Creative Commons Attribution (CC BY) license (http://creativecommons.org/licenses/by/4.0/).
Copyright: This open access article is published under a Creative Commons CC BY 4.0 license, which permit the free download, distribution, and reuse, provided that the author and preprint are cited in any reuse.


