
Submitted:
31 July 2023
Posted:
02 August 2023
You are already at the latest version
Abstract
A partial least squares (PLS) quantitative chemometric method based on the analysis of the MID-FTIR spectrum of polymer inclusion membranes (PIMs) used for the extraction of Cr(VI) from aqueous media is developed. The system previously optimized considering the variables membrane composition, extraction time, and pH, is characterized in terms of its adsorption isotherm, distribution coefficient, extraction percent and enrichment factor. A Langmuir type adsorption behavior with KL = 21.99 L/mg, qmax = 0.242 mmol/g and 0<RL<1, indicates that metal adsorption is favorable. The characterization of the extraction reaction is performed as well showing an 1:1 Cr(VI):Aliquat 336 ratio, in agreement with solvent extraction data. The principal component analysis (PCA) of the PIMs revels a complex pattern, which is satisfactorily simplified and related to Cr(VI) concentrations through the use of a variable selection method (iPLS) in which bands in the ranges 3451–3500 cm-1 and 3751–3800 cm-1 are chosen. The final PLS model including the 100 wavelengths selected by iPLS and 10 latent variables shows excellent parameter values with RMSEC: 3.73115, RMSECV: 6.82685, Bias: -1.91847e-13, CV Bias: 0.185947, R2 Cal: 0.98145, R2 CV: 0.940902, recovery%: 104.02 ± 4.12 (=0.05), sensitivity%: 0.001547 ppb, γ: 3.8 ppb, γ- 1: 0.6 ppb-1, selectivity: 0.0155, linear range: 5.8–100 ppb, LD: 1.9 ppb, and LQ: 5.8 ppb. The developed PIM sensor is easy to implement as it requires few manipulations and reduced number of chemical compounds in comparison to other similar reported systems.
Keywords:
chromium(VI)
; polymer inclusion membrane
; optode
; FTIR
; quantitative analysis
1. Introduction
Due to the extensive and rapid development, environmental pollution has increased to alarming levels nearby industrialized areas, which are generally contaminated with heavy metals. Among many others, hexavalent chromium, Cr(VI), is one of the most serious concerns, as there is credible evidence that through water medium it is a major contributor to the global burden of cancer in humans [1]. Chromium compounds are mainly used in industrial activities, such as corrosion control, oxidation process, leather tanning, electroplating, metallurgy, cement, textile dyeing, papermaking, inks, paints and pigments, and photographic industry [2]. Due to this wide use, there are locations where chromium compounds have been released to the environment via leakage, poor storage, or improper industrial disposal practices, so that chromium pollution of waters and groundwaters represents a serious environmental concern. The USEPA regulates total chromium in drinking water and has set a Maximum Contaminant Level (MCL) of 0.1 mg/dm3 [3]. The World Health Organization (WHO) guideline is 0.05 mg/dm3 for total chromium [4]. Although this reference value has been questioned, as a practical measure it has been retained as a provisional guideline value until additional information becomes available and chromium can be re-evaluated [4]. Chromium discharge limits in water are regulated on a national scale and often vary depending on the different type of industry or receiving water body (marine water, lake, river, sewer system) [5]. The maximum discharge limit to the aquatic environment in EU is 1 and 5 mg/L for Cr(VI) and Crtotal, respectively [6].
There are currently several technologies for remediation [5] and detection [7] of Cr(VI) from aqueous samples. As this species is usually present at low concentration levels, it is measured by atomic absorption and emission methods, providing high precision and sensitivity measurements. The selection of these techniques will depend largely on the sensitivity, reproducibility, detection and quantification limits and simplicity of the method. However, environmental scientists are increasingly in need of measurement closer to the sample, in situations outside the laboratory, which restricts the use of such analytical techniques. Alternatively, UV/VIS, FTIR, Raman and NIR portable spectrometers [8, 9] are available to meet the growing need driven by the general trend in analytical instrumentation toward smaller size, improved reliability, and greater ease of operation. In such context, the use of ion-selective optodes (ISOs), ionophore-based optical chemical sensors, represents an excellent alternative for the portable determination of ions [10]. In this regard several systems for Cr(VI) monitoring using optical sensors has been developed over the last years [11-14].
On the other hand, besides being used for the removal and transport of metals [15, 16], polymer inclusion membranes (PIMs) have also been employed for the detection of many chemical species [17]. These membranes are composed of a polymeric matrix which serves as support of an encapsulated extractant (carrier) that is responsible for binding with the target analyte at the source solution/membrane interface and transporting it across the membrane, which can contain a plasticizer to improve mobility. In the case of Cr(IV), Aliquat 336 (methyltrioctylammonium chloride) has proved to be an effective and selective extractant in solvent extraction (SX) [18, 19], supported liquid membranes (SLM) [20], solvent-impregnated resins (SIR) [21, 22] and PIM [20, 23-29] systems.
In a previous work, the capabilities of a PIM sensor to perform cadmium(II) determination in aqueous solutions by in situ visible (VIS) and Mid- Fourier transform infrared spectroscopy (MID-FTIR) analyses of the polymeric films using a partial least squares (PLS) chemometric approach was demonstrated [30]. One major advantage of the developed MID-FTIR-PLS PIM-based method was that it did not require the presence in the membrane of a chemical reagent with special properties, either a chromophore species that can complex the metal ion, i.e., acting as ionophore [14, 31], or a mixture of an ionophore and a chromophore in the same PIM [32], or a fluorescent reagent [33]. However, to extend the potentiality of the methodology to low analyte concentration ranges, a careful selection of the dielectric nature of the medium and the dipole moment of the bond associated with IR vibrations of the extracted complex was suggested [30], so that an increase in the band intensities could be achieved, i.e., an augment in the magnitude of the analytical signal, improving the detection capabilities of these sensors.
At this point, taking advantage of the high dielectric constant values observed in PIMs with Aliquat 336 plasticized with 2-nitrophenyl octyl ether (NPOE) [34] and the excellent transport properties of Aliquat 336 for Cr(VI) in PIMs [20, 23-29], in this work, such membranes were employed for MID-FTIR-PLS analysis of Cr(VI) from aqueous media. Once the system has been characterized and optimized, the calibration performance and the figures of merit (FOM) of the method were determined to show the potentiality of the proposed methodology.
2. Materials and Methods
2.1. Reagents and Apparatus
PIMs were prepared using cellulose triacetate (CTA, Honeywell Fluka, Charlotte, N.C., USA) as polymer support, 2-nitrophenyl octyl ether (NPOE, ≥99.0% Honeywell Fluka) as plasticizer, Aliquat 336 (methyltrioctylammonium chloride, Sigma-Aldrich, Chem. Co., St. Louis,MO, USA) as extracting agent and dichloromethane (Merck, Kenilworth, N.J., USA) as casting solvent. Working Cr(VI) solutions were prepared by dissolving the corresponding amounts of (NH4)2Cr2O7 (Sigma-Aldrich) in deionized water. A 1000 mg/dm3 Sigma-Aldrich AAS standard solution (Sigma-Aldrich, 1 g/dm3 Cr in 2% nitric acid, prepared with high purity (NH4)2Cr2O7, HNO3 and water) was diluted using deionized water for the preparation of the standards for FAAS determinations. Tris (hydroxymethyl)aminomethane (TRIS, 99.8% Sigma-Aldrich), sodium acetate (99% Sigma-Aldrich), acetic acid (99.7% Sigma- Aldrich), hydrochloric acid (37% Sigma-Aldrich) and 2-(N-morpholino) ethanesulfonic acid (MES, 99.5% Sigma-Aldrich) were employed to assess the effect of pH on chromium extraction.
A model 75Wrist ActionTM shaker (Burrell Scientific Inc, Pittsburgh, Pa., USA) with 10 speeds and a Metrohm 620 pH-meter (Herisau, Switzerland) were used. A 3100-flame atomic absorption spectrometer (Perkin Elmer Waltham, Mass., USA) and a Spectrum GX IR spectrometer (Perkin Elmer) were employed to measure metal ion contents and to obtain the IR spectra, respectively. A Fowler IP54 micrometer (Fowler High Precision, Newton, Mass., USA) was used for measuring PIM thicknesses.
2.2. Preparation of PIMs
Membranes were prepared dissolving 30 mg of CTA, 75 mg of NPOE, and 30 mg of Aliquat 336 in 10 mL of CH2Cl2. This mixture was stirred for 1 hour in a 50 mL beaker and then the solvent was allowed to evaporate for 24 hours. After this time, the membranes were detached from the beakers and their diameter and thickness were measured with a Fowler IP54 micrometer. An average weight of (135.86 ±2.05) mg, an average thickness of (95 ±15) µm and an average diameter of (3.00 ±0.02) cm were determined (n=54). The PIM thickness is almost double as that previously reported in a similar sensor [30] to enhance detectability of the analyte.
2.3 Liquid-solid extraction
The obtained membranes were placed in a 50 cm3 polypropylene falcon tube together with 30 cm3 of Cr(VI) solutions at different concentrations. Stirring was performed for 20 min, taking 1 cm3 aliquots every 2 min. At the end, the membranes were removed from the aqueous phase and the aliquots brought to a volume of 2 cm3 to be able to measure their concentration by FAAS. Experiments were performed on a duplicate basis with an average RSD of 5%.
2.4 Metal quantification
The absorbances corresponding to the samples and standards were measured by FAAS according to the conditions established by the manufacturer (354.7 nm wavelength (λ), 7 nm slit, with an air-acetylene flame, from 0 to 7 ppm, using a hollow cathode lamp, and sensitivity check of 5 ppm).
2.5 Measuring infrared spectra
The IR spectra were obtained by the direct analysis of the PIMs in the transmission mode for the quantitative analysis of chromium in the mid-infrared region. The PIM was mounted in the transmission accessory of the equipment after sandwiching the membrane between two Petri dishes to avoid wrinkles and movement. The spectrum of each sample was acquired in the 400 cm-1 – 5000 cm-1 region in triplicate with 30 scans per measurement.
2.6 Development of the chemometric model
The multivariate calibration method was built from the information provided by the IR spectra of the PIMs. with a set of 54 samples covering 27 different concentrations each by duplicate with an interval ranging from 1.92x10⁻⁷ to 1.92x10⁻⁶ mol/dm3 (10 – 100 ppb). The spectral range used for quantitative analysis initially was 400 cm-1 – 5000 cm-1, so that the experimental matrix consisted of 54 rows corresponding to the samples and 4601 wavelengths. Further cross validation was performed in the calibration set using venetian blinds with 3 data splits and 2 samples per blind (thickness). A test set consisting of 10 samples acquired as the calibration test, but independently, had dimensions of 10 x 4601. Metal concentrations given along the work refer to the initial concentrations of the metal in solution. Data processing consisted of baseline correction (automatic weighted least squares, order one) and mean-centering. The PLS-Toolbox 9.0 software (Eigenvector Research, Inc. Wenatchee, WA) was employed for all chemometric analyses. An in-house made MATHLAB (Natick, Apple Hill Campus, MA) program was used for the evaluation of the FOM.
3. Results and Discussion
3.1 PIM composition
The composition of the PIMs used in this work was that reported by Kozlowski [20], substituting the plasticizer o-nitrophenyl pentyl ether for NPOE. With this membrane composition, the extraction experiments carried out at pH 6 in a 0.01 mol/dm3 MES buffer solution for 2 hours with an initial metal concentration of 1.35x10⁻⁴ mol/dm3 (7 ppm) showed 90.2% extraction of the metal. Consequently, due to the high extraction percentage, it was decided to keep such proportions of polymer (22.2% ± 0.7) w/w%, plasticizer (54.4 ± 1.3) w/w% and extractant (23.4 ± 1.5) w/w%.
3.2 Optimization of the extraction time
The extraction time necessary to reach the equilibrium was determined with a solution of 1.35x10⁻⁴ mol/dm3 Cr(VI), taking aliquots each 10 min for a total of 50 min. As observed in Figure 1 the concentration of the metal in the medium decreases until it reaches equilibrium, while the concentration of chromium in the membrane increases. From the graph it is determined that the time required for the extraction reaction to reach equilibrium was 10 min. Consequently, further extraction experiments were carried out for 20 min of agitation at pH 6 with 0.01 mol/dm3 MES buffer to obtain the maximum extraction percentages.
3.3. Influence of pH
Knowing the time required to bring the extraction reaction to its equilibrium state, the influence of pH variations on metal extraction was studied. A concentration of 6.73x10⁻⁴ mol/dm3 (35 ppm) was used in the pH range 4 to 9. In the experiments carried out at pH 4 and 5, an 0.01 mol/dm3 acetate/ acetic acid buffer solution was used. For pH 6 and 7 an 0.01 mol/dm3 MES buffer was employed, and finally for pH 8 and 9 an 0.01 mol/dm3 TRIS buffer was used. From Figure 2 it can be observed that chromium extraction decreases as the pH increases, in such a form that at pH 9 the extraction is less than 20%; however, at pH 4 the extraction exceeds 80%. This behavior is mainly due to the change of metal speciation (from HCrO4- to CrO42-) with increasing pH of the solution. This result is consistent with that previously observed for Aliquat 336 in liquid-liquid extraction [35]. Even though the highest percentage of extraction was carried out at low pH values, further experiments were carried out at pH 6 because natural waters register a pH range between 5.5 and 8. However it is clear from the graph that pH values in the 4–7 interval can also be used with a allowable reduction in E%.
3.4. Influence of the initial metal concentration
3.4.1. Adsorption isotherm
Under the extraction conditions established as mentioned, the effect of the initial metal concentration was studied. This study was performed using initial metal concentrations from 1.35x10⁻⁴ mol/dm3 (7 ppm) to 1.93x10⁻³ mol/dm3 (100 ppm). From Figure 3 it is seen that the extraction with high initial metal concentrations is less effective than the extraction with low metal concentrations, i.e., the lower the initial metal concentration the more effective the extraction.
It is known that there is a quantity of metal that, when extracted, may saturate the active sites of the membrane, preventing it from continuing extracting the metal ion, meaning that the adsorption capacities depend on the different initial concentrations. In general, an adsorption isotherm is a curve that describes the phenomenon that governs the mobility of a substance from an aqueous medium to a solid phase at constant temperature. Commonly, the mathematical correlation of this phenomenon is expressed graphically using the loading of the analyte in the solid phase (qe) as a function of the residual equilibrium concentration in the aqueous phase (Ce) [36]. Over the years, a wide variety of adsorption isotherm models have been developed to explain the kinetics, thermodynamics, and potential of this phenomenon [37]. The adsorption isotherm for the Cr(VI)/PIM is show in Figure 4A. From it a Langmuir type behavior is inferred. This model assumes monolayer analyte adsorption that occurs on localized sites that are equivalent without considering steric hindrance or adjacent interactions between adsorbed molecules [38], and it is described by the following equation:
Where Ce is the solute concentration at equilibrium, qe is the amount of solute adsorbed at equilibrium, qmax is the maximum loading capacity, and KL the Langmuir's constant. The previous equation can be linearized as:
So that when plotting Ce / qe as a function of Ce, qmax and KL can be obtained from the abscissa and the slope of the line, respectively. Another parameter associated with the Langmuir adsorption model is the separation factor (RL) defined by:
which indicates whether the nature of the adsorption is favorable or not (favorable (0<RL <1), linear (RL =1), unfavorable (RL >1) or irreversible (RL=0)).
The linearized form of the adsorption isotherm is shown in Figure 4B. A determination coefficient of 0.999 indicates a good fit of the data to the Langmuir-type model. The parameters of the model are KL = 21.99 L/mg, and qmax = 0.242mmol/g. Table 1 provides the RL values at the different initial concentrations. From it 0<RL<1, which indicates that metal adsorption is favorable for this system.
3.4.2. Distribution quotient
The distribution quotient (D) is defined as the ratio of the sum of the concentrations of all the chemical forms of the compound in the aqueous phase and in the organic phase according to:
Where the bar stands for the membrane phase. Figure 5A shows D as a function of the initial concentration of chromium from 1.35x10⁻⁴ to 1.93x10⁻³ mol/dm3. At low metal concentrations D is c.a.10,000 units, which indicates a great affinity of the metal towards the membrane; on the other hand, a decay in its value at high concentrations is indicative of lower affinity, probably due to the saturation of the active sites, i. e, the extraction will be more effective at low metal concentrations.
3.4.3. Extraction percent
The extraction percentages, E%, defined as
for the D values is presented in Figure 5B. At concentrations lower than 5x10⁻⁴ mol/dm3, E% is quantitatively high, with a value of 97.31% and remains practically constant for the first 4 points. On the other hand, at higher concentrations, it decays, because of the occupation of the available sites on the membrane surface. From the point of view of quantitative analysis, using the PIM as a preconcentration method, initial concentrations lower than 5.5 x 10⁻⁴ mol/dm3 will be preferred to have constant extraction percentages, independent of the initial Cr(VI) content.
3.4.4 Enrichment factor
The enrichment factor is a parameter that indicates how many times the metal is more concentrated in the membrane than in solution, and is defined by:
E was evaluated within the range 1.35x10⁻⁴ – 1.95x10⁻⁴ mol/dm3 (Figure 6). From the slope of the graph E≈18. However, clearly the graph shows two trends according to the concentration range below and above 6 x 10⁻⁴ mol/dm3 (Figure 6). Dividing the values according to this point, the highest enrichment factor is obtained at low concentrations, with E≈33 where the extraction percentage is constant and practically independent of the initial chromium concentration. On the other hand, the enrichment factor at high concentrations corresponds to E≈15, with the extraction percentage depending on the initial chromium concentration. This observation highlights over the need to work in the lower range of concentrations to obtain better results, since the higher the metal is loaded in the PIM the more sensitive the analytical method.
3.5 Determination of the extraction equilibrium
For this determination, the concentration of Aliquat 336 in the membrane was varied, keeping the amount of CTA and NPOE constant. The mass values of the Aliquat 336 used were 1.5, 5.1, 9, 11.1, 12, 15, 22.5 and 30 mg. According to Kebiche-Senhadji [23] the extraction occurs by the following reaction:
Where stands for the extractant and for the extracted species in the PIM phase. The extraction constant, Kext, is defined by:
Considering the definition of D, Kext can be rewritten as follows:
Taking logarithms to both sides of the equation and rearranging:
The graph of Figure 7 shows logD as a function of the unreacted log[Aliquat 336]; a linear relationship with a determination coefficient of 0.9902 was obtained. The slope value of 1.16 indicates that the Cr(VI):Aliquat 336 ratio is 1:1, so that the final extraction reaction becomes:
This result is consistent with that reported in the literature, where the same stoichiometry was observed in SX [39].
3.6. Chemometric analyses
To meet the chromium determination requirements in aqueous media [3-4, 6] further experiments were performed at a lower concentration range (10–100 ppb) where, according to the previous discussions, the PIM system will perform the best.
3.6.1. PCA
The samples score plot of the PCA analysis are shown in Figure 8A and B. A 5-component model accounted for 95.38 % of the variance in the X-block with 82.5% accounted exclusively for PC1. The RMSEC and RMSECV values were 0.10036 and 0.126592, respectively. A distinctive V-shape pattern observed in structured dependent data was identified in the plot PC1 vs PC2 (Figure 8A). In gene population studies, PCA plots often appear triangular due to the underlying genetic population structure and the way genetic variation is distributed across individuals, as individuals with similar genetic ancestry tend to cluster together, at the three corners of the triangle, which represent different groups of individuals with unique genetic backgrounds [40, 41]. This pattern occurs also in chemistry mixture problems with the three vertices being samples that contain a single component each, the samples falling on a line between two vertices being binary mixtures of the three analytes, and the remaining points being ternary mixtures of the three analytes [42]. A similar behavior has also been observed in optodes with 1-(2-pyridylazo)-2-naphthol as chromophore where the proportions of the analytes (Cu(II), Zn(II), and Pb(II)) were systematically varied giving rise to mixtures of colors in the PIM [43]. However, in the present case, the pattern seems to be more complex as observed when analyzing the contribution of the first three PCs (Figure 8B), where a progressive change in the spectra apparently not related to the concentration of the analyte is observed. Although a complete understanding of factors giving rise to the observed shape is outside the present work, it can be related to dependent structured modifications in the PIM medium, as the polar nature of water molecules adsorbed can induce local electric dipoles resulting in an increase in the effective polarizability of the material, affecting the penetration depth of the evanescent wave into the sample.
3.6.2. Selection of the spectral wavelength range
Preliminary full-spectrum PLS modeling did not give satisfactory results, as a 10 latent variable model gave RMSEC: 8.41851, RMSECV: 36.9153, Bias: 2.84217e-14, CV Bias: 0.208479, R2 Cal: 0.905564, R2 CV: 0.000624484, clearly showing model overfitting. This result is somehow expected from the previous PCA analysis where no evident trend with Cr(VI) concentrations was observed. Furthermore, no improvement was observed by changing the preprocessing method or the number of latent variables. However, a high improvement was attained when some regions of the spectra were discarded from the calculations, so that the forward interval PLS algorithm (iPLS), a variable selection method, was implemented. iPLS selects a subset of variables which will give superior prediction compared to using all the variables in the data set. It does a sequential, exhaustive search for the best variable or combination of variables [44]. Figure 9 shows the obtained results. It was observed that when wavelengths in the 3050 – 3890 cm-1 region were considered (in red color in Figure 9) the best predictions were attained, with a minimum RMSECV value when bands in the ranges 3451–3500 cm-1 and 3751–3800 cm-1 were chosen (in green color in Figure 9).
The extraction mechanism of Cr(VI) with Aliquat 336 involves ion-pair formation. Aliquat 336, being a cationic extractant, can form an ion-pair with the hydrogen chromate ion through electrostatic interactions. The broad band in the FTIR spectra with the maximum located near 3500 cm-1 can be attributed both to hydroxyl stretching in CTA [45] and to stretching vibrations of adsorbed water in Aliquat 336 [22,28,45,46]. Fontàs et al. have found that modifications in the surface composition of water equilibrated Aliquat 336-PIMs may be associated with the solubilization of the extractant in the water solution, which, therefore, may affect the reactivity of the membrane’s surface, but not the bulk properties of the membrane itself [47]. Such Aliquat 336 solubilized molecules may form micelles at the PIM [34], containing hydrated nonpolar cavities, such that the Me3N+ headgroup in Aliquat 336 and the HCrO4− anion probably form solvent-separated ion pairs at the micelle surface [48]. This explains why this IR region perform the best in the developed method and can also be the reason for a similar behavior, in which changes in such band range can be noticed after the adsorption of Cr(VI) in an Aliquat 336 Dowex 1x8 impregnated resin [49] and the band shifting in the -OH stretching region reported for a CTA/1,5-diphenylcarbazide /Aliquat 336 optode [14].
3.6.3. PLS modeling
Hence, the final PLS model included the 100 wavelengths selected by iPLS and 10 latent variables according to the RMSEC and RMSECV values obtained using the calibration and cross-validation results. In Table 2 the percents of variance accounted for the different latent variables are shown. With the 10 latent variables the variance capture by the model in the X-block reaches 99.99 % while that in the y-block (Cr(VI) concentrations), 97.17 %.
A summary of this final model is graphically presented in Figure 10 A-D. No important outliers were detected in the data (Figure 10A,B) and the first two latent variables accounted for 99.24 % of variance in the X-block with almost all data being inside the Hotelling T2 ellipse (Figure 10D). Interestingly, the score plot did not shown this time the complex pattern previously observed in PCA analysis, indicating an efficient removal of variance not related to Cr(VI) concentrations variation. The parity plot, i.e., measured vs. predicted concentrations (Figure 10C) showed excellent parameter values with RMSEC: 3.73115, RMSECV: 6.82685, Bias: -1.91847e-13, CV Bias: 0.185947, R2 Cal: 0.98145, R2 CV: 0.940902.
3.7. Model validation and application
3.7.1. Figures of merit (FOM) [50-52]
When an analytical method is proposed, it is necessary to investigate whether it will perform adequately under the conditions where it will be further applied. This procedure is referred as the validation of the method, and it is performed through the determination of the FOM. These are very important parameters in characterizing, comparing, and developing new multivariate methods. Many of these figures are closely related to the net analyte signal (NAS) concept, as presented by Lorber [53] and defined by:
where xi is a sample spectrum after preprocessing and b is a column vector of the PLS regression coefficients. The concept of NAS arises naturally in multivariate calibration from the fact that a predicted sample spectrum can have various contributions from all the sample components. Therefore, it is logical to decompose the spectrum into two orthogonal parts: a part that can be exclusively assigned to the analyte of interest (NAS) and the remaining part that contains the contribution, possibly variable, of other components. This decomposition is carried out by the regression algorithms in such a way that the NAS is proportional to the concentration of the analyte of interest. Since the NAS is the only part of the spectrum that is used for prediction, no information is lost by transforming the NAS vector into a scalar. The natural choice is to take the Euclidean norm, i.e., its length, so that the scalar NAS is obtained as r* = ||r*||, where r is an arbitrary vector. Using the NAS, a multivariate calibration model can be represented on a pseudo-univariate plot, being this representation exact, not approximate.
3.7.1.1. Accuracy (RMSE)
This parameter indicates the closeness of the relationship between the reference value and that found by the model. In multivariate calibration, it is usually expressed as the root mean square error of calibration (RMSEC), root mean square error of cross-validation (RMSECV), and root mean square error of prediction (RMSEP), according to the following equation:
where and are the estimated value of the model and the reference value of the sample i, respectively, and n is the number of samples. The estimated value varied according to what is measured, the calibration (RMSEC), cross-validation (RMSECV) or the test (RMSEP) results.
3.7.1.2. Selectivity (sel)
This indicates the part of the total signal that is not lost due to spectral overlapping and can be defined in the multivariate context through the NAS calculation:
where stands for the norm of the sensitivity coefficients of the spectra containing the analyte k at unit concentration, and for that corresponding to its NAS.
3.7.1.3. Sensitivity (sen)
Sensitivity measures the changes in the response, as a function of the concentration of a particular analyte, and is given by the following equation:
However, it can also be calculated without the use of NAS theory according to the equation:
A more useful FOM is the analytical sensitivity (γ), which is defined, by analogy with univariate calibration, as the ratio between sen and the instrumental noise (δx). The inverse of γ (γ- 1) provides an estimation of the minimum concentration difference that is discernible by the analytical method considering the random experimental noise as the only source of error, regardless of the specific technique employed [54].
3.7.1.4. Limit of Detection (LD)
Following the IUPAC recommendations, LD can be defined as the minimum detectable value of the net signal for which the false negative (β) and false positive (α) probabilities are 0.05. LD can be calculated analogously, as for univariate calibration, according to the equation:
3.7.1.5. Limit of Quantitation (LQ)
Quantizability is generally expressed in terms of the signal or analyte concentration value that will produce estimates having a specified relative standard deviation, usually 10% RSD. Following the same assumptions described above, the quantification limit in the multivariate calibration can be calculated by:
The calculated FOM of the PLS model are given in Table 3. The absence of systematic errors in accuracy determination was verified with an F-test over the parity plot during cross-validation (Figure 10C). In the absence of errors, it is expected that the slope obtained from this graph is equal to 1 (β1 =1) and the abscissa is 0 (β0 =0) (null hypothesis). The alternative hypothesis states that at least one of these parameters is different from the expected value.
This simultaneous null hypothesis can be tested from [30, 53]:
where:
β0 = 0
β1 =1
b0 = observed abscissa
b1 = observed slope
and The obtained F-value is then compared to an F distribution reference value with 2 and n-2 degrees of freedom at the chosen significance level.
From Figure 10C b0 = 4.22147, b1 = 0.924373, =54.4814, n=54 and Se = 5.916 giving F=3.32. As this value is smaller than the tabulated F 0.05 2, 52 =3.96, the hypothesis of β1 =1, β0 =0 is accepted, i.e., no systematic bias is present.
The model presents a sensitivity value of 0.0015%, indicating that it is capable of distinguishing samples with concentration differences of 0.6 ppb. The selectivity value indicates that 1.5% of the information on the analyte contained in the sample is orthogonal to the interference space. In other words, the selectivity indicates that about 98.5% of the interfering analytical signals were removed during the NAS calculation. This result is expected due to the low concentration range of the analyte in relation to the other PIM components, making that only slightly changes in the PIM spectra were related to Cr(VI) concentration variation. However, even such low variability was effectively accounted by the PLS algorithm. On the other hand the well-probed chemical selectivity of Aliquat 336 for Cr(VI) over Co(II), Cd(II), Pb(II), Ni(II), Cu(II), Zn(II), and Fe(II) [23, 27, 28, 55] favors the testing of the PIM on real samples.
Table 4 compares the results of the developed sensor to those reported in the literature for Cr(VI) analysis with similar systems. Similar FOM with other Cr(VI) optical quantitation methods were found. However, as most of the works reported in Table 4 rely on the use 1,5-diphenylcarbazide as chromophore, they are limited to work at low pH values, where the highest absorbance values are attained [13, 14], being then those methods not suitable for in situ-analysis of water samples. In comparison to some of them, the developed PIM sensor is in many cases much easy to implement as it requires few manipulations and reduced number of chemical compounds.
3.7.2. Application
The developed PLS method was applied to each of the test samples and the t-value for the comparison between the measured (reference) and predicted (found) concentrations calculated. The results are shown in Table 5. As the obtained p-value > 0.05, there was not significant differences between both quantities at the 95% confidence level. As the RMSEP value given in the same Table is close to the RMSEC and RMSECV values, model overfitting was prevented. An average recovery of 104.02 ± 4.12 (α=0.05) was obtained.
4. Conclusions
Using infrared spectroscopy and multivariate statistical analysis, an MID-FTIR-PLS PIM-based sensor for the quantitative determination of Cr(VI) from aqueous medium was developed with satisfactory results. Optimized conditions for the system consisted of (22.2 ± 0.7) w/w%, CTA, (54.4 ± 1.3) w/w % NPOE and (23.4 ± 1.5) w/w % Aliquat 336, pH 6 and 10 min of extraction time, although pH values in the range 4–7 could also be used. It was observed that chromium extraction decreases as the pH increases, in such a form that at pH 9 the extraction is less than 20%; however, at pH 4 the extraction exceeds 80%; this behavior being mainly due to the change of metal speciation (from HCrO4- to CrO42- ) with increasing pH of the solution. Cr(VI) adsorption followed a Langmuir-type isotherm with KL= 21.99 L/mg, qmax= 0.242mmol/g and 0<RL<1. At low metal concentrations D is c.a.10,000 units, which indicates a great affinity of the metal towards the membrane; on the other hand, a decay in its value at high concentrations is indicative of lower affinity, as observed as well in the E% profile. The highest enrichment factor was obtained at low analyte concentrations, with E≈33, where the extraction percentage is practically constant. On the other hand, the enrichment factor at high concentrations corresponds to E≈15. Characterization of the extraction reaction indicated a 1:1 Cr(VI):Aliquat 336 ratio. The PCA analysis of the PIMs reveled a complex pattern, which was satisfactorily simplified and related to Cr(VI) concentrations through the use of a variable selection method (iPLS) in which bands in the ranges 3451–3500 cm-1 and 3751–3800 cm-1 were chosen. The final PLS model including the 100 wavelengths selected by iPLS and 10 latent variables shows excellent FOM values with RMSEC: 3.73115, RMSECV: 6.82685, Bias: -1.91847e-13, CV Bias: 0.185947, R2 Cal: 0.98145, R2 CV: 0.940902, recovery%: 104.02 ± 4.12 (α=0.05), sensitivity%: 0.001547 ppb, γ: 3.8 ppb, γ-1: 0.6 ppb-1, selectivity: 0.0155, linear range: 5.8–100 ppb, LD: 1.9 ppb, and LQ: 5.8 ppb. The absence of bias in accuracy determination was verified with an F-test over the parity plot during cross-validation. An average RMSEP of 3.3229 was obtained, which was close to the RMSEC and RMSECV values, demonstrating no model overfitting. The developed PIM sensor is suitable for in situ analysis of aqueous samples, and easy to implement as it requires few manipulations and reduced number of chemical compounds in comparison to other similar reported systems.
Author Contributions
Conceptualization, A.M.d.l.P. and E.R.d.S.M.; methodology, A.M.d.l.P.; formal analysis, A.M.d.l.P and E.R.d.S.M..; investigation, A.M.d.l.P.; resources, E.R.d.S.M.; writing—original draft preparation, A.M.d.l.P.; writing—review and editing, E.R.d.S.M and J.d.G.; supervision, E.R.d.S.M and J.d.G.; project administration, E.R.d.S.M.; funding acquisition, E.R.d.S.M and J.d.G. All authors have read and agreed to the published version of the manuscript.
Funding
This research was funded by CONACYT (project 2011CB167148) and DGAPA-UNAM (project PAPIIT IN229219).
Data Availability Statement
The data that support the findings of this study are available upon reasonable request.
Acknowledgments
Q. Nadia Marcela Munguía Acevedo and Q.F.B. María Guadalupe Espejel Maya are thanked for their help in technical services. A.M.d.l.P. acknowledges CONACYT for his MsSc scholarship and the Consejo Mexiquense de Ciencia y Tecnología for the financial support provided through its scholarship-thesis program.
Conflicts of Interest
The authors declare no conflict of interest.
Abbreviations
| Aliquat 336 | Methyltrioctylammonium chloride |
| Cal | Calibration |
| CTA | Cellulose triacetate |
| CV | Cross-validation |
| D | Distribution coefficient |
| E | Enrichment factor |
| E% | Extraction percentage |
| FAAS | Flame atomic absorption spectroscopy |
| FOM | Figures of merit |
| FTIR | Fourier-transform infrared spectroscopy |
| iPLS | Interval PLS |
| IR | Infrared spectroscopy |
| ISOs | Ion-selective optodes |
| Kext | Extraction constant |
| LD | Limit of detection |
| LQ | Limit of quantitation |
| MES | 2-(N-morpholino) ethanesulfonic acid |
| MID-FTIR | Mid Fourier transform infrared spectroscopy |
| NAS | Net analyte signal |
| NPOE | 2-nitrophenyl octyl ether |
| PCA | Principal component analysis |
| PIM(s) | Polymer inclusion membrane(s) |
| PLS | Partial least squares |
| R2 | Determination coefficient |
| RMSEC | Root mean square error of calibration |
| RMSECV | Root mean square error of cross-validation |
| RMSEP | Root mean square error of prediction |
| RSD | Relative standard deviation |
| sel | Selectivity |
| sen | Sensitivity |
| SIR | Solvent-impregnated resins |
| SLM | Supported liquid membranes |
| SX | Solvent extraction |
| TRIS | Tris(hydroxymethyl)aminomethane |
| VIS | Visible spectroscopy |
References
- Georgaki, M.-N.; Charalambous, M.; Kazakis, N.; Talias, M.A.; Georgakis, C.; Papamitsou, T.; Mytiglaki, C. Chromium in Water and Carcinogenic Human Health Risk. Environments 2023, 10, 33. [Google Scholar] [CrossRef]
- Bhattacharya, M.; Dutta, S.K.; Sikder, J.; Mandal, M.K. Computational and experimental study of chromium (VI) removal in direct contact membrane distillation. J. Membr. Sci. 2014, 450, 447–456. [Google Scholar] [CrossRef]
- Chromium in Drinking Water. United States Environmental Protection Agency (EPA). Available online: https://www.epa.gov/sdwa/chromium-drinking-water (accessed on 13 June 2023).
- Chromium in Drinking-water. World Health Organization. Available online: https://cdn.who.int/media/docs/default-source/wash-documents/wash-chemicals/chromium.pdf?sfvrsn=37abd598_6 (accessed on 13 June 2023).
- Tumolo, M.; Ancona, V.; De Paola, D.; Losacco, D.; Campanale, C.; Massarelli, C.; Uricchio, V.T. Chromium Pollution in European Water, Sources, Health Risk, and Remediation Strategies: An Overview. Int. J. Environ. Res. Public Health 2020, 17, 5438. [Google Scholar] [CrossRef] [PubMed]
- Vaiopoulou, E.; Gikas, P. Regulations for chromium emissions to the aquatic environment in Europe and elsewhere. Chemosphere 2020, 254, 126876. [Google Scholar] [CrossRef] [PubMed]
- Parks, J.L.; McNeill, L.; Frey, M.; Eaton, A.D.; Haghani, A.; Ramirez, L.; Edwards, M. Determination of total chromium in environmental water samples. Water Res. 2004, 38, 2827–2838. [Google Scholar] [CrossRef] [PubMed]
- Capitán-Vallvey, L.F.; Palma, A.J. Recent developments in handheld and portable optosensing—A review. Anal. Chim. Acta 2011, 696, 27–46. [Google Scholar] [CrossRef]
- Vandenabeele, P.; Castro, K.; Hargreaves, M.; Moens, L.; Madariaga, J.M.; Edwards, H.G.M. Comparative study of mobile Raman instrumentation for art analysis. Anal. Chim. Acta 2007, 588, 108–116. [Google Scholar] [CrossRef]
- Du, X.; Xie, X. Ion-Selective optodes: Alternative approaches for simplified fabrication and signaling. Sens. Actuators B Chem. 2021, 335, 129368. [Google Scholar] [CrossRef]
- Scindia, Y.M.; Pandey, A.K.; Reddy, A.V.R.; Manohar, S.B. Chemically selective membrane optode for Cr(VI) determination in aqueous samples. Anal. Chim. Acta 2004, 515, 311–321. [Google Scholar] [CrossRef]
- Carrington, N.A.; Thomas, G.H.; Rodman, D.L.; Beach, D.B.; Xue, Z.-L. Optical determination of Cr(VI) using regenerable, functionalized sol-gel monoliths. Anal. Chim. Acta. 2007, 581, 232–240. [Google Scholar] [CrossRef]
- Castilleja-Rivera, W.L.; Hinojosa-Reyes, L.; Guzmán-Mar, J.L.; Hernández-Ramírez, A.; Ruíz-Ruíz, E.; Cerda, V. Sensitive determination of chromium(VI)in paint samples using a membrane optode coupled to a multisyringe flow injection system. Talanta 2012, 99, 730–736. [Google Scholar] [CrossRef]
- Munandar, R. A Cellulose Triacetate-Based Optode Membrane for Cr(VI) Detection in Water: Fabrication and Characterization. Undergraduate Thesis, . IPB University. Bogor, Indonesia, 2022. [Google Scholar]
- Keskin, B.; Zeytuncu-Gökoğlu, B.; Koyuncu, I. Polymer inclusion membrane applications for transport of metal ions: A critical review. Chemosphere 2021, 279, 130604. [Google Scholar] [CrossRef]
- Ulewicz, M. Polymer Membranes in Separation Process. Membranes 2021, 11, 831. [Google Scholar] [CrossRef] [PubMed]
- Almeida, M.I.G.S.; Cattrall, R.W.; Kolev, S.D. Polymer inclusion membranes (PIMs) in chemical analysis—A review. Anal. Chim. Acta 2017, 987, 1–14. [Google Scholar] [CrossRef] [PubMed]
- Salazar, E.; Ortiz, M.I.; Urtiaga, A.M.; Irabien, J.A. Equilibrium and Kinetics of Cr(V1) Extraction with Aliquat 336. Ind. Eng. Chem. Res. 1992, 31, 1516–1522. [Google Scholar] [CrossRef]
- Senol, A. , Amine extraction of chromium(VI) from aqueous acidic solutions. Sep. Purif. Technol. 2004, 36, 63–75. [Google Scholar] [CrossRef]
- Kozlowski, C.; Walkowiak, W. Applicability of liquid membranes in chromium(VI) transport with amines as ion carriers. J. Membr. Sci. 2005, 266, 143–150. [Google Scholar] [CrossRef]
- Kabaya, N.; Arda, M.; Saha, B.; Streat, M. Removal of Cr(VI) by solvent impregnated resins (SIR) containing aliquat 336. React. Funct.l Polym. 2003, 54, 103–115. [Google Scholar] [CrossRef]
- Wojcik, G.; Hubicki, Z.; Ryczkowski, J. Investigations of Chromium(III) and (VI) Ions Sorption on SIR by using Photoacoustic and DRS Methods. Acta Phys. Pol. A, 2009, 116, 432–434. Available online: http://przyrbwn.icm.edu.pl/APP/PDF/116/a116z344.pdf (accessed on 20 July 2023). [CrossRef]
- Kebiche-Senhadji, O.; Tingry, S.; Seta, P.; Benamor, M. Selective extraction of Cr(VI) over metallic species by polymer inclusion membrane (PIM) using anion (Aliquat 336) as carrier. Desalination 2010, 258, 59–65. [Google Scholar] [CrossRef]
- Gherasim, C.V.; Bourceanu, G. Removal of chromium(VI) from aqueous solutions using a polyvinyl-chloride inclusion membrane: Experimental study and modelling. Chem. Eng. J. 2013, 220, 24–34. [Google Scholar] [CrossRef]
- Kagaya, S.; Maeno, T.; Ito, K.; Gemmei-Ide, M.; Cattrall, R.W.; Kolev, S.D. Improvement of chromium(VI) extraction from acidic solutions using a poly(vinyl chloride)-based polymer inclusion membrane with Aliquat 336 as the carrier. Anal. Sci. 2017, 33, 643–646. [Google Scholar] [CrossRef] [PubMed]
- Semghouni, H.; Bey, S.; Figoli, A.; Criscuoli, A.; Russo, F.; Mohamed, B.; Drioli, E. Chromium(VI) Removal by Polyvinyl Chloride(PVC)/Aliquat-336 Polymeric Inclusion Membranes in a Multiframe Flat Sheet Membrane Module. Appl. Sci. 2019, 9, 2994. [Google Scholar] [CrossRef]
- Sellami, F.; Kebiche-Senhadji, O.; Marais, S.; Couvrat, N.; Fatyeyeva, K. Polymer inclusion membranes based on CTA/PBAT blend containing Aliquat 336 as extractant for removal of Cr(VI): Efficiency, stability and selectivity. React. Funct. Polym. 2019, 139, 120–132. [Google Scholar] [CrossRef]
- Sellami, F.; Kebiche-Senhadji, O.; Marais, S.; Colasse, L.; Fatyeyeva, K. Enhanced removal of Cr(VI) by polymer inclusion membrane based on poly(vinylidene fluoride) and Aliquat 336. Sep. Purif. Technol. 2020, 248, 117038. [Google Scholar] [CrossRef]
- Bahrami, S.; Reza Yaftian, M.; Najvak, P.; Dolatyari, L.; Shayani-Jam, H.; Kolev, S.D. PVDF-HFP based polymer inclusion membranes containing Cyphos® IL 101 and Aliquat® 336 for the removal of Cr(VI) from sulfate solutions. Sep. Purif. Technol. 2020, 250, 117251. [Google Scholar] [CrossRef]
- González-Albarrán, R.; de Gyves, J.; Rodríguez de San Miguel, E. Determination of Cadmium (II) in Aqueous Solutions by In Situ MID-FTIR-PLS Analysis Using a Polymer Inclusion Membrane-Based Sensor: First Considerations. Molecules 2020, 25, 3436. [Google Scholar] [CrossRef]
- Mohd Suah, F.B.; Ahmad, M.; Heng, L.Y. A novel polymer inclusion membrane based optode for sensitive determination of Al3+. Spectrochim. Acta A 2015, 144, 81–87. [Google Scholar] [CrossRef]
- Ngarisan, N.I.; Zanariah, C.W.; Ngah, C.W.; Ahmad, M.; Kuswandi, B. Optimization of polymer inclusion membranes (PIMs) preparation for immobilization of Chrome Azurol S for optical sensing of aluminum (III). Sens. Actuator B Chem. 2014, 203, 465–470. [Google Scholar] [CrossRef]
- Mohd Suah, F.B.; Ahmad, M.; Heng, L.Y. Highly sensitive fluorescence optode for aluminium(III) based on non-plasticized polymer inclusion membrane. Sens. Actuators B Chem. 2014, 201, 490–495. [Google Scholar] [CrossRef]
- O’Rourke, M.; Duffy, N.; De Marco, R.; Potter, I. Electrochemical Impedance Spectroscopy—A Simple Method for the Characterization of Polymer Inclusion Membranes Containing Aliquat 336. Membranes 2011, 1, 132–148. [Google Scholar] [CrossRef] [PubMed]
- Senol, A. Amine extraction of chromium(VI) from aqueous acidic solutions. Sep. Purif. Technol. 2004, 36, 63–75. [Google Scholar] [CrossRef]
- Ncibi, M.C. Applicability of some statistical tools to predict optimum adsorption isotherm after linear and non-linear regression analysis. J. Hazard. Mater. 2008, 153, 207–212. [Google Scholar] [CrossRef]
- Malek, A.; Farooq, S. Comparison of isotherms models for hydrocarbon adsorption on activated carbon. AIChE J 1996, 42, 3191–3201. [Google Scholar] [CrossRef]
- Foo, K.Y.; Hameed, B.H. Insights into the modeling of adsorption isotherm systems. Chem. Eng. J. 2010, 156, 2–10. [Google Scholar] [CrossRef]
- Senol, A. Extractive removal of Cr(VI) from aqueous acidic media by aliquat 336/xylene system: Optimization and modelling of equilibrium. Indian J. Chem. Technol. 2017, 24, 269–283. Available online: https://nopr.niscpr.res.in/handle/123456789/41862 (accessed on 20 July 2023).
- Bulbul, O.; Filoglu, G.; Zorlu, T.; Altuncul, H.; Freire-Aradas, A.; Söchtig, J.; Ruiz, Y.; Klintschar, M.; Triki-Fendri, S.; Rebai, A.; Phillips, C.; Lareu, M.V.; Carracedo, Á.; Schneider, P.M. Inference of biogeographical ancestry across central regions of Eurasia. Int. J. Legal Med. 2015. [Google Scholar] [CrossRef] [PubMed]
- Tay, G.K.; Henschel, A.; Daw Elbait, G.; Al Safar, H.S. Genetic Diversity and Low Stratification of the Population of the United Arab Emirates. Front. Genet. 2020, 11, 608. [Google Scholar] [CrossRef]
- El Haddad, J.; de Miollis, F.; Bou Sleiman, J.; Canioni, L.; Mounaix, P.; Bousquet, B. Chemometrics applied to quantitative analysis of ternary mixtures by Terahertz spectroscopy. Anal. Chem. 2014, 86, 4927–4933. [Google Scholar] [CrossRef]
- Mancilla-Rico, A.J. , Rodríguez de San Miguel, E. Simultaneous determination of Cu(II), Zn(II), and Pb(II) from aqueous solutions using a polymer inclusion membrane (PIM) based-sensor with 1-(2- pyridylazo)-2-naphthol (PAN) as chromophore and chemometric methods. Front. Anal. Sci. 2022, 2, 971352. [Google Scholar] [CrossRef]
- Nørgaard, L.; Saudland, A.; Wagner, J.; Nielsen, J.P.; Munck, L.; Engelsen, S.B. Interval Partial Least-Squares Regression (iPLS): A Comparative Chemometric Study with an Example from Near-Infrared Spectroscopy. App. Spectrosc. 2000, 54, 413–19. [Google Scholar] [CrossRef]
- Nunes, S.; Ramacciotti, F.; Neves, A.; Angelin, E.M.; Ramos, A.M.; Roldão, E.; Wallaszkovits, N.; Armijo, A.A.; Melo, M.J. A diagnostic tool for assessing the conservation condition of cellulose nitrate and acetate in heritage collections: quantifying the degree of substitution by infrared spectroscopy. Herit. Sci. 2020, 8, 33. [Google Scholar] [CrossRef]
- Naz, G.; Othaman, Z.; Shamsuddin, M.; Ghoshal, S.K. Aliquat 336 stabilized multi-faceted gold nanoparticles with minimal ligand density. App. Surf. Sci. 2016, 363, 74–82. [Google Scholar] [CrossRef]
- Fontàs, C.; Vera, R.; Anticó, E.; Martínez de Yuso, M. d. V.; Rodríguez-Castellón, E.; Benavente, J. New Insights on the Effects of Water on Polymer Inclusion Membranes Containing Aliquat 336 Derivatives as Carriers. Membranes 2022, 12, 192. [Google Scholar] [CrossRef] [PubMed]
- van der Vegt, N.F.A.; Haldrup, K.; Roke, S.; Zheng, J.; Lund, M.; Bakker, H.J. Water-Mediated Ion Pairing: Occurrence and Relevance. Chem. Rev. 2016, 116, 13–7626. [Google Scholar] [CrossRef]
- Kalidhasan, S.; Santhana, A.; Kumar, K.; Rajesh, V.; Rajesha, N. An efficient ultrasound assisted approach for the impregnation of room temperature ionic liquid onto Dowex 1×8 resin matrix and its application toward the enhanced adsorption of chromium (VI). J. Hazard. Mater 2012, 213– 214, 249–257. [Google Scholar] [CrossRef]
- Olivieri, A.C.; Faber, N.M.; Ferré, J.; Boqué, R.; Kalivas, J.H.; Mark, H. Uncertainty estimation and figures of merit for multivariate calibration (IUPAC Technical Report). Pure Appl. Chem. 2006, 78, 633–661. [Google Scholar] [CrossRef]
- Braga, J.W.B.; Trevizan, L.C.; Nunes, L.C.; Rufini, I.A.; Santos Jr, D.; Krug, F.J. Comparison of univariate and multivariate calibration for the determination of micronutrients in pellets of plant materials by laser induced breakdown spectrometry. Spectrochim. Acta B 2010, 65, 66–74. [Google Scholar] [CrossRef]
- de Carvalho Rocha, W.F.; Nogueira, R.; Vaz, B.G. Validation of model of multivariate calibration: An application to the determination of biodiesel blend levels in diesel by near-infrared spectroscopy. J. Chemometr. 2012, 26, 456–461. [Google Scholar] [CrossRef]
- Lorber, A. Error propagation and figures of merit for quantification by solving matrix equations. Anal. Chem. 1986, 58, 1167–1172. [Google Scholar] [CrossRef]
- Ferreira, M.H.; Braga, J.W.B.; Sena, M.M. Development and validation of a chemometric method for direct determination of hydrochlorothiazide in pharmaceutical samples by diffuse reflectance near infrared spectroscopy. Microchem. J. 2013, 109, 158–164. [Google Scholar] [CrossRef]
- Gherasim, C.V.; Bourceanu, G.; Olariu, R.J.; Arsene, C. A novel polymer inclusion membrane applied in chromium (VI) separation from aqueous solutions. J. Hazard. Mater. 2011, 197, 244–253. [Google Scholar] [CrossRef] [PubMed]
- Sreevani, I.; Reddy, P.R.; V. Reddy, K. Rapid and Simple Spectrophotometric Determination of Traces of Chromium (VI) in Wastewater Samples and in Soil samples by using 2-Hydroxy, 3-Methoxy Benzaldehyde Thiosemicarbazone (HMBATSC). IOSR J. App. Phys. 2013, 3, 40–45. [Google Scholar] [CrossRef]
- Lace, A.; Ryan, D.; Bowkett, M.; Cleary, J. Chromium Monitoring in Water by Colorimetry Using Optimised 1,5-Diphenylcarbazide Method. Int. J. Environ. Res. Public Health. 2019, 16, 1803. [Google Scholar] [CrossRef]
- Revanasiddappa, H.D.; Kiran Kumar, T.N. Spectrophotometric Determination of Trace Amounts of Chromium with Citrazinic Acid. J. Anal. Chem. 2001, 56, 1084–1088. [Google Scholar] [CrossRef]
- Sun, X.; Li, B.; Qi, A.; Tian, C.; Han, J.; Shi, Y.; Lin, B.; Chen, L. Improved assessment of accuracy and performance using a rotational paper-based device for multiplexed detection of heavy metals. Talanta 2018, 178, 426–431. [Google Scholar] [CrossRef] [PubMed]
Figure 1.
Cr(VI) extraction profile as a function of time (pH 6 in a 0.01 mol/dm3 MES buffer solution, [Cr(VI)]0 = 1.35x10⁻⁴ mol/dm3.
Figure 1.
Cr(VI) extraction profile as a function of time (pH 6 in a 0.01 mol/dm3 MES buffer solution, [Cr(VI)]0 = 1.35x10⁻⁴ mol/dm3.
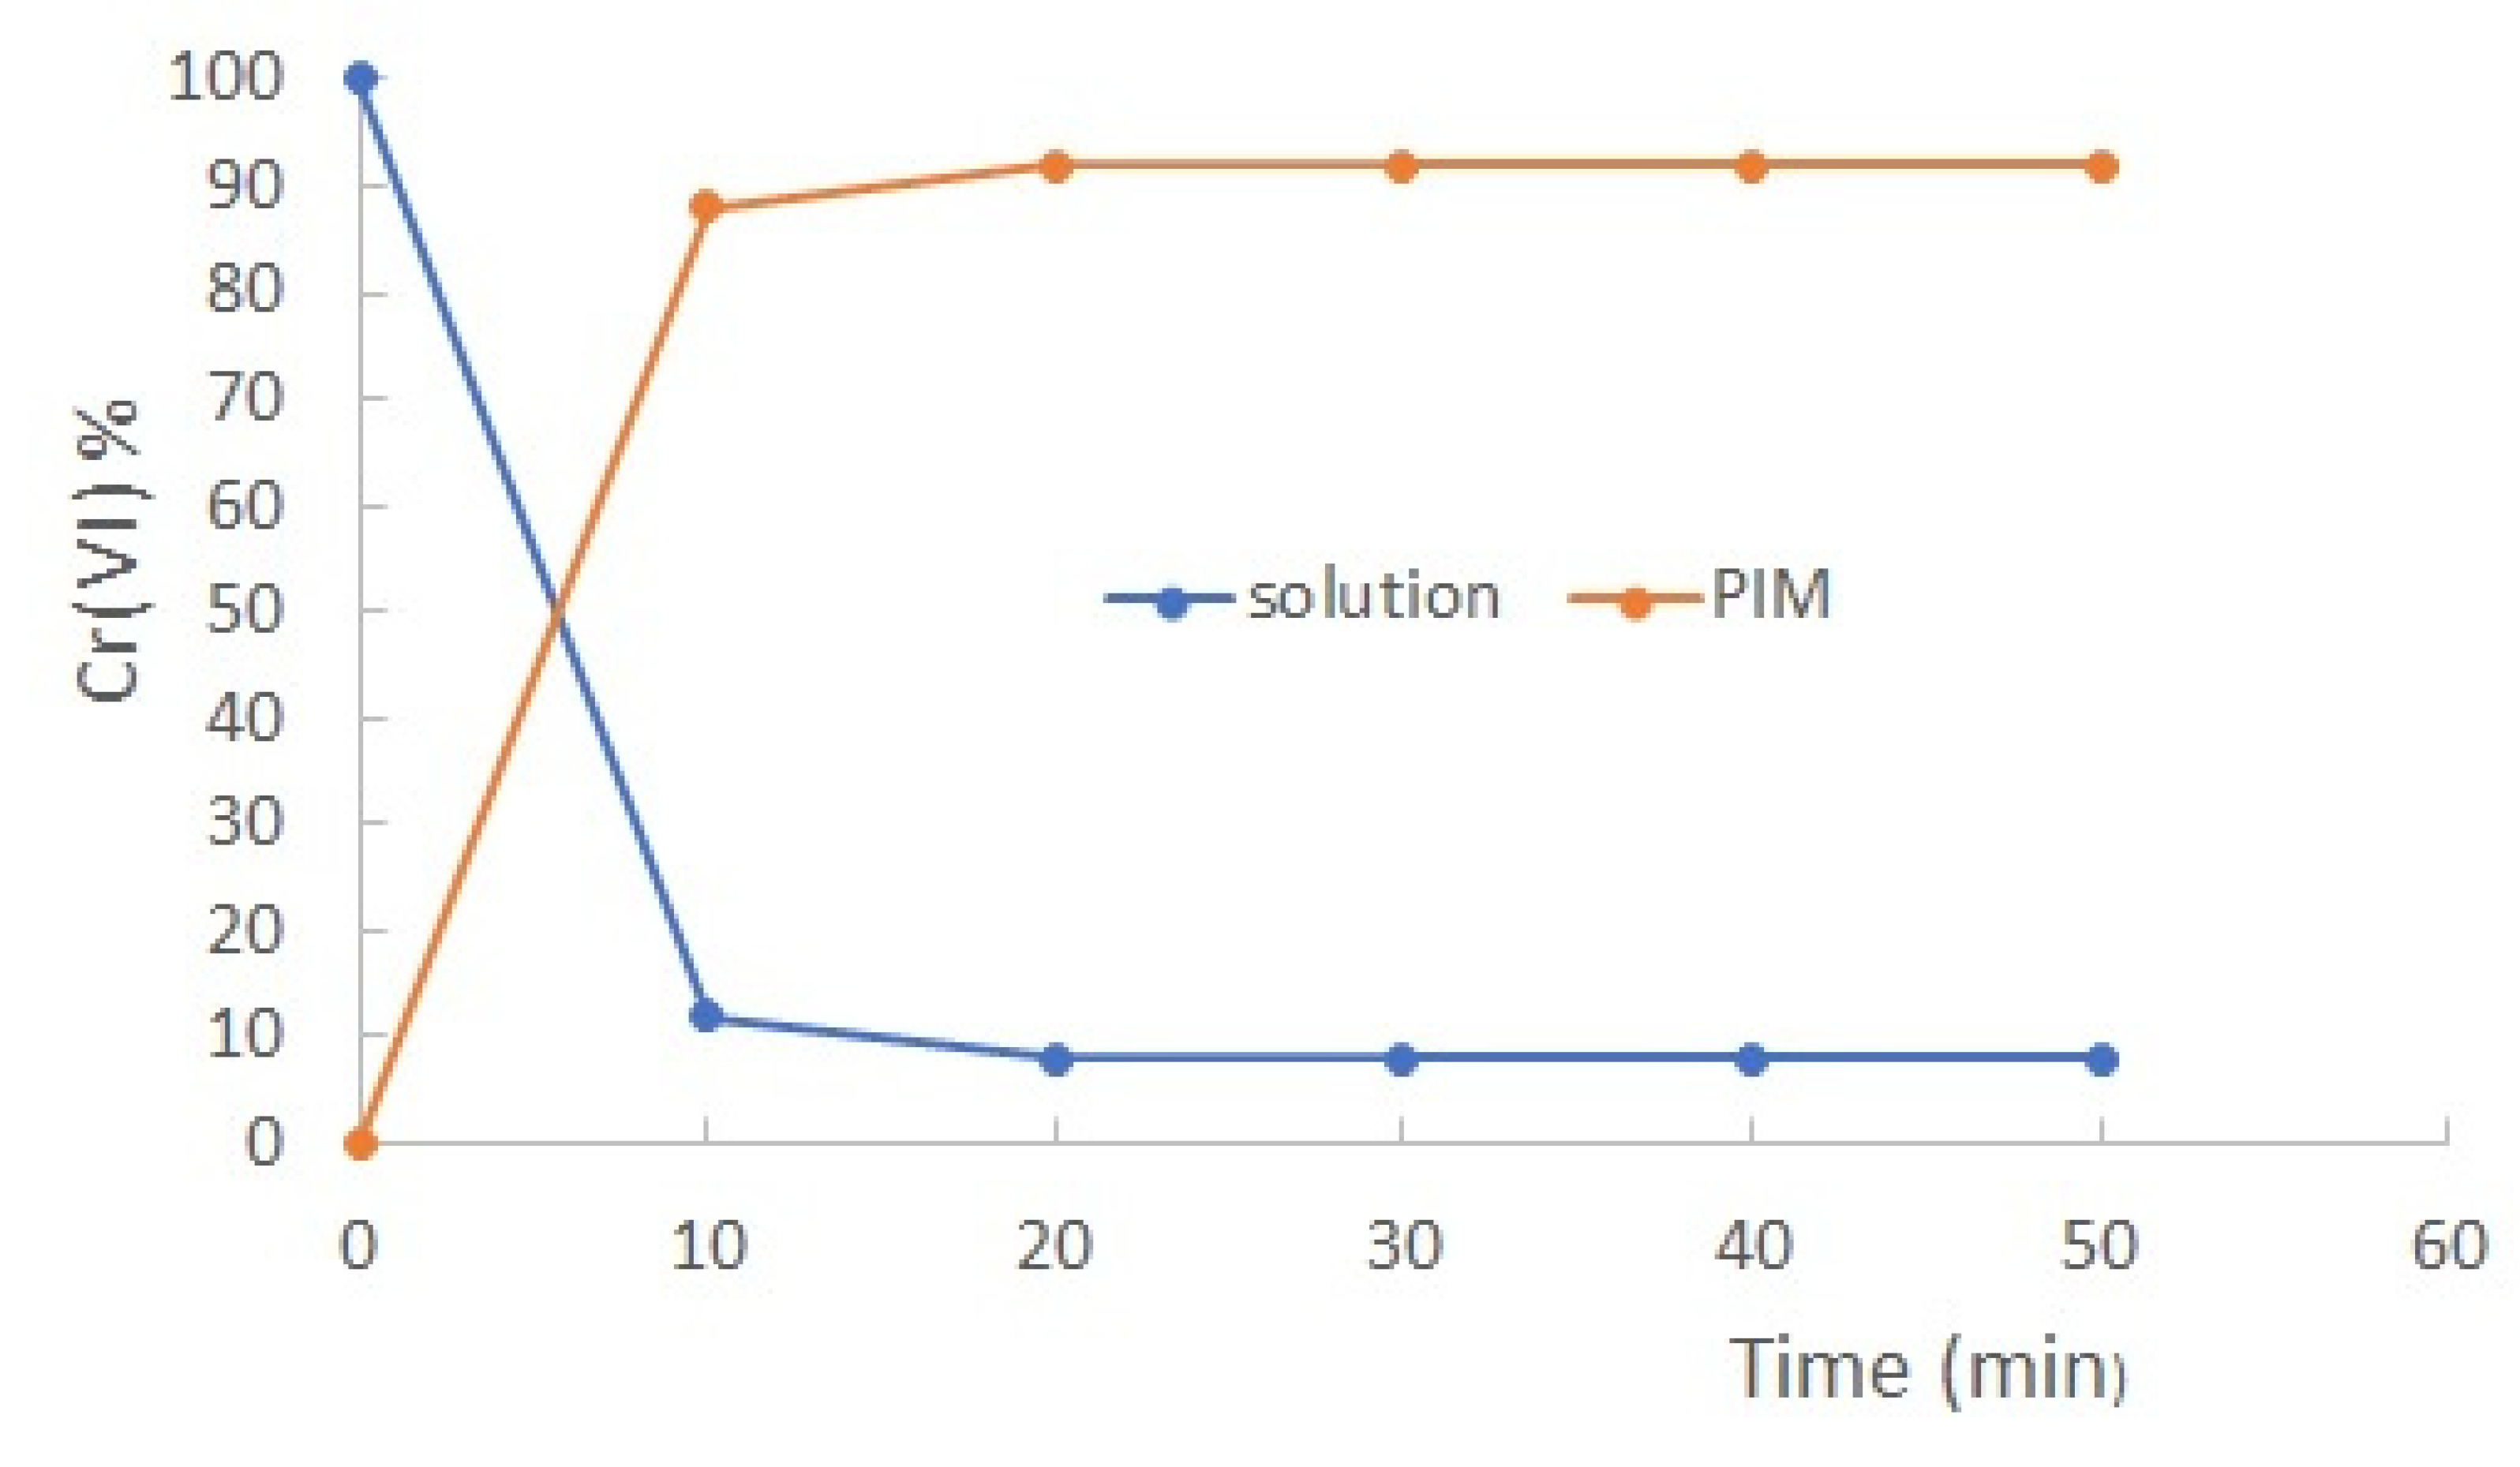
Figure 2.
Cr(VI) extraction profile as a function of pH of the aqueous sample. [Cr(VI)]0 = 6.73x10⁻⁴ mol/dm3.
Figure 2.
Cr(VI) extraction profile as a function of pH of the aqueous sample. [Cr(VI)]0 = 6.73x10⁻⁴ mol/dm3.
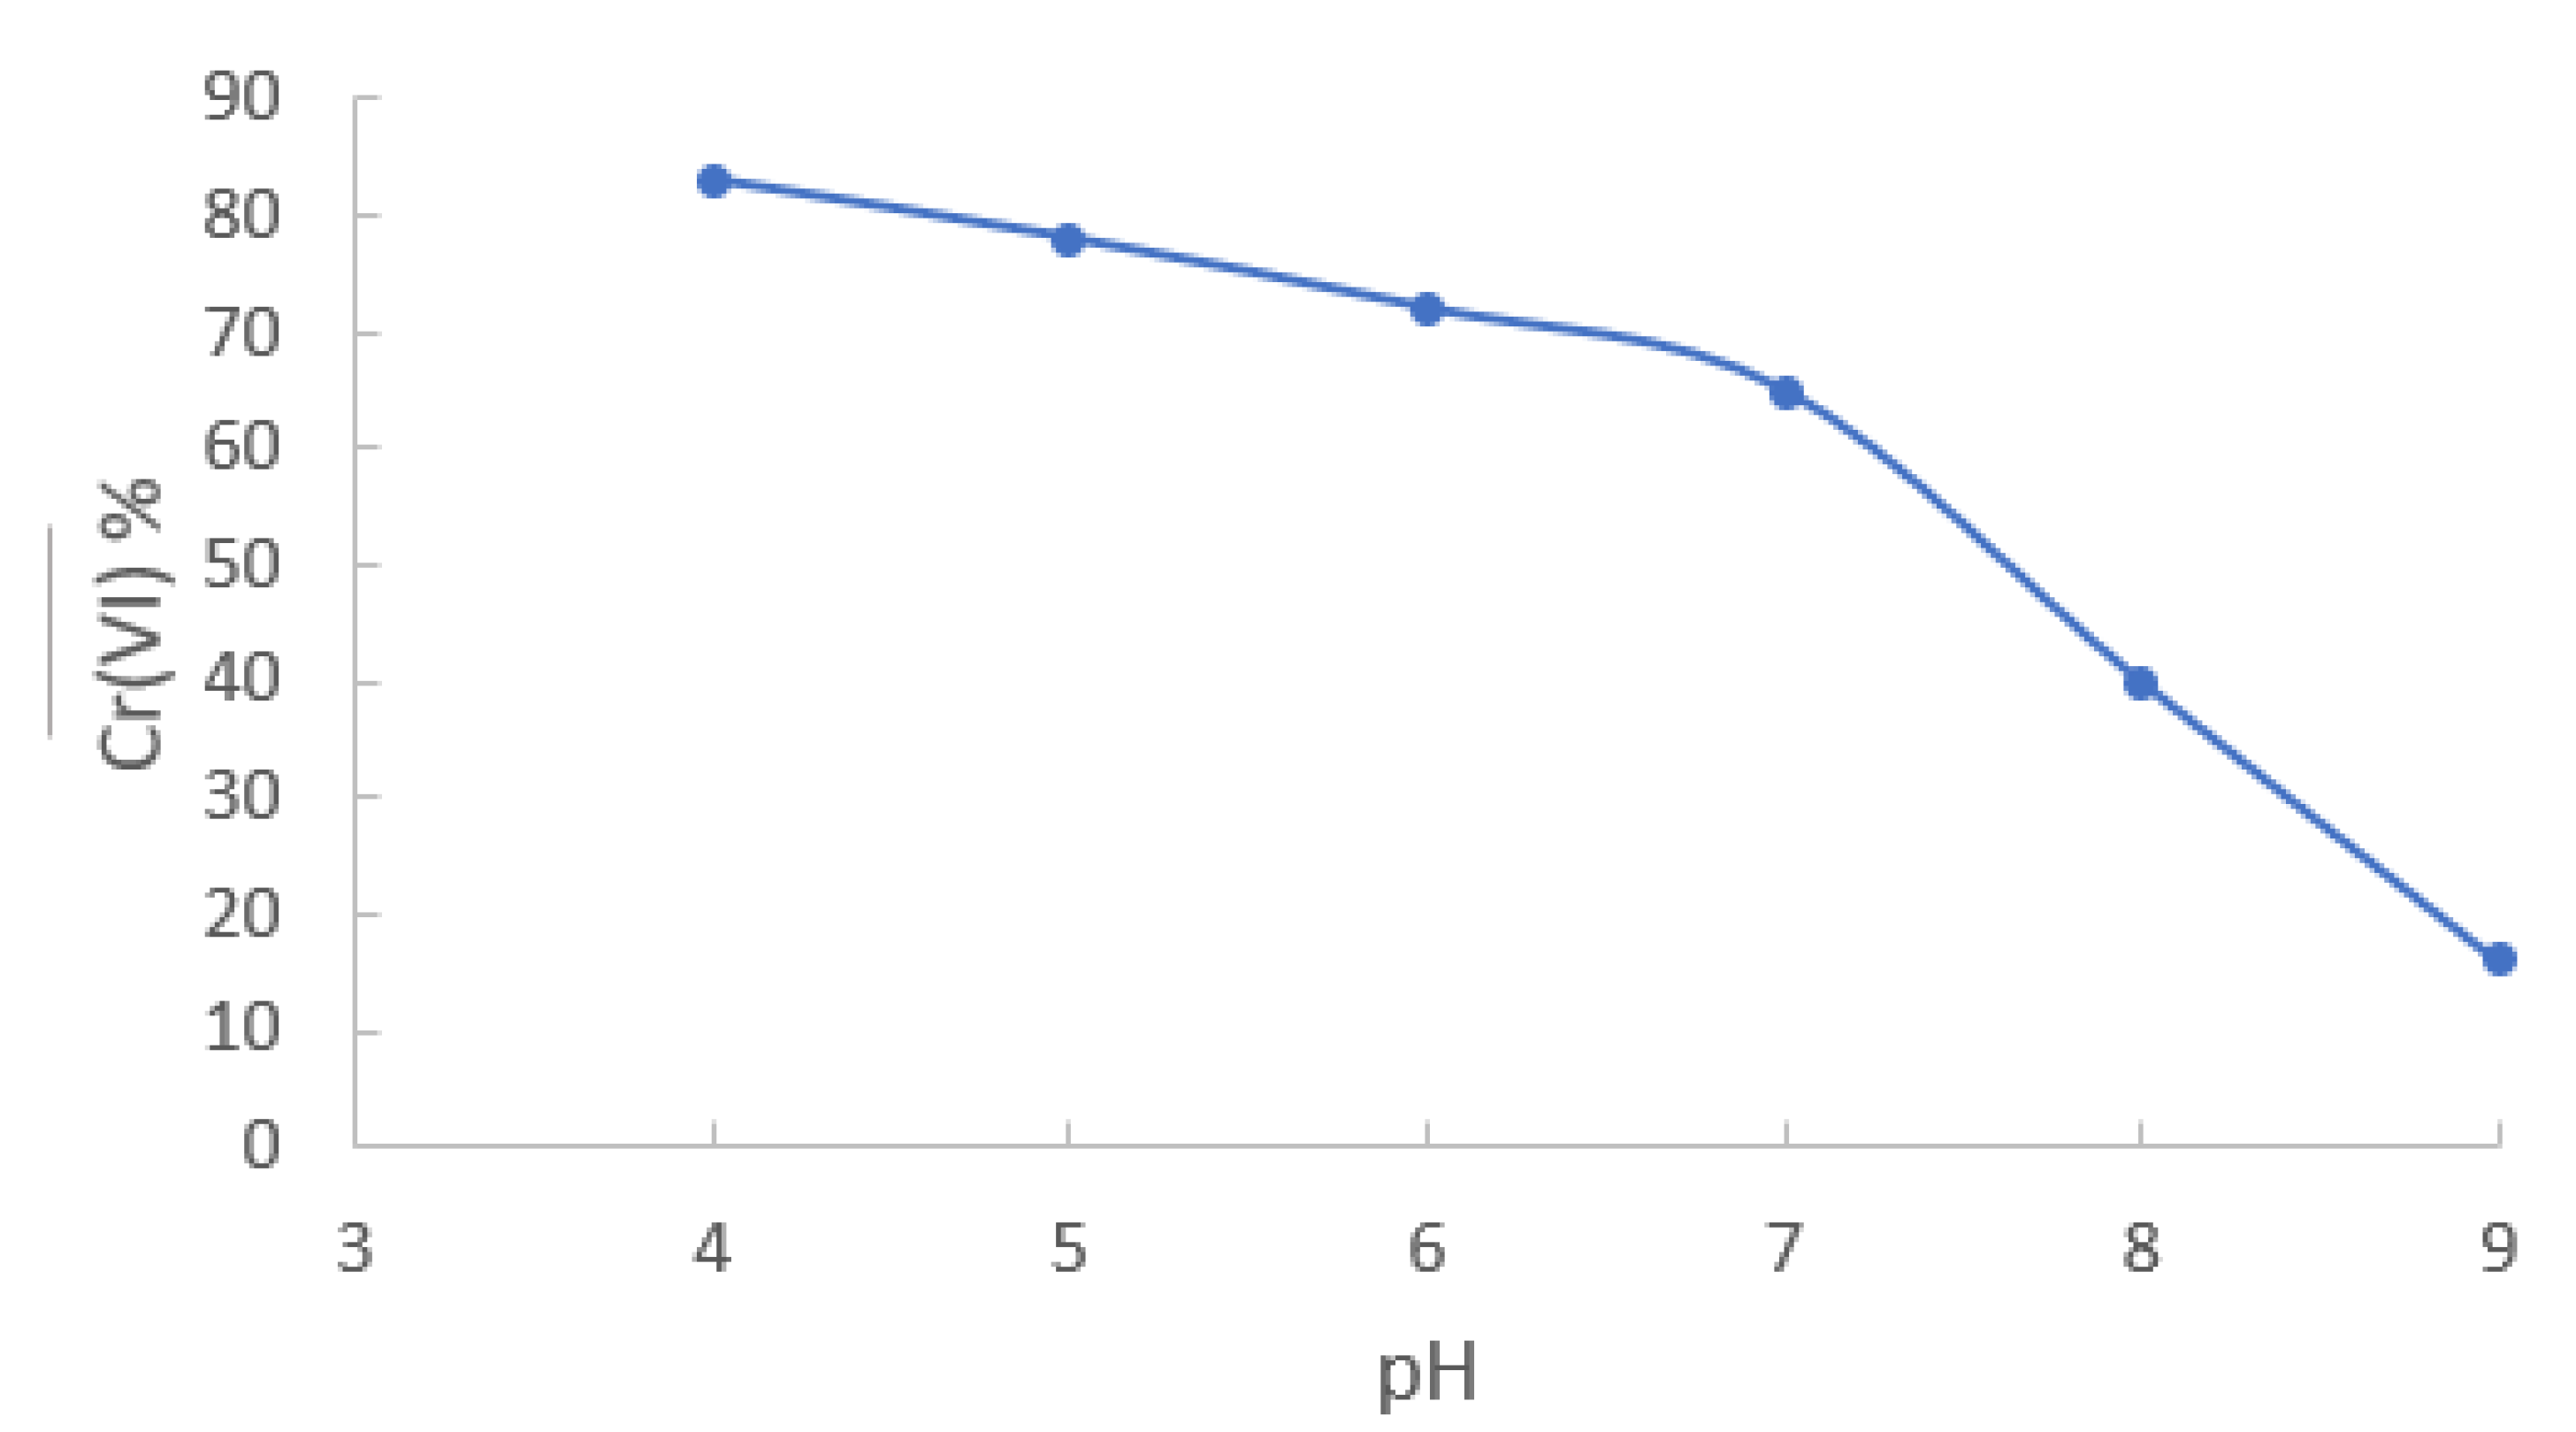
Figure 3.
Cr(VI) extraction profile for different initial concentrations of metal at pH 6.
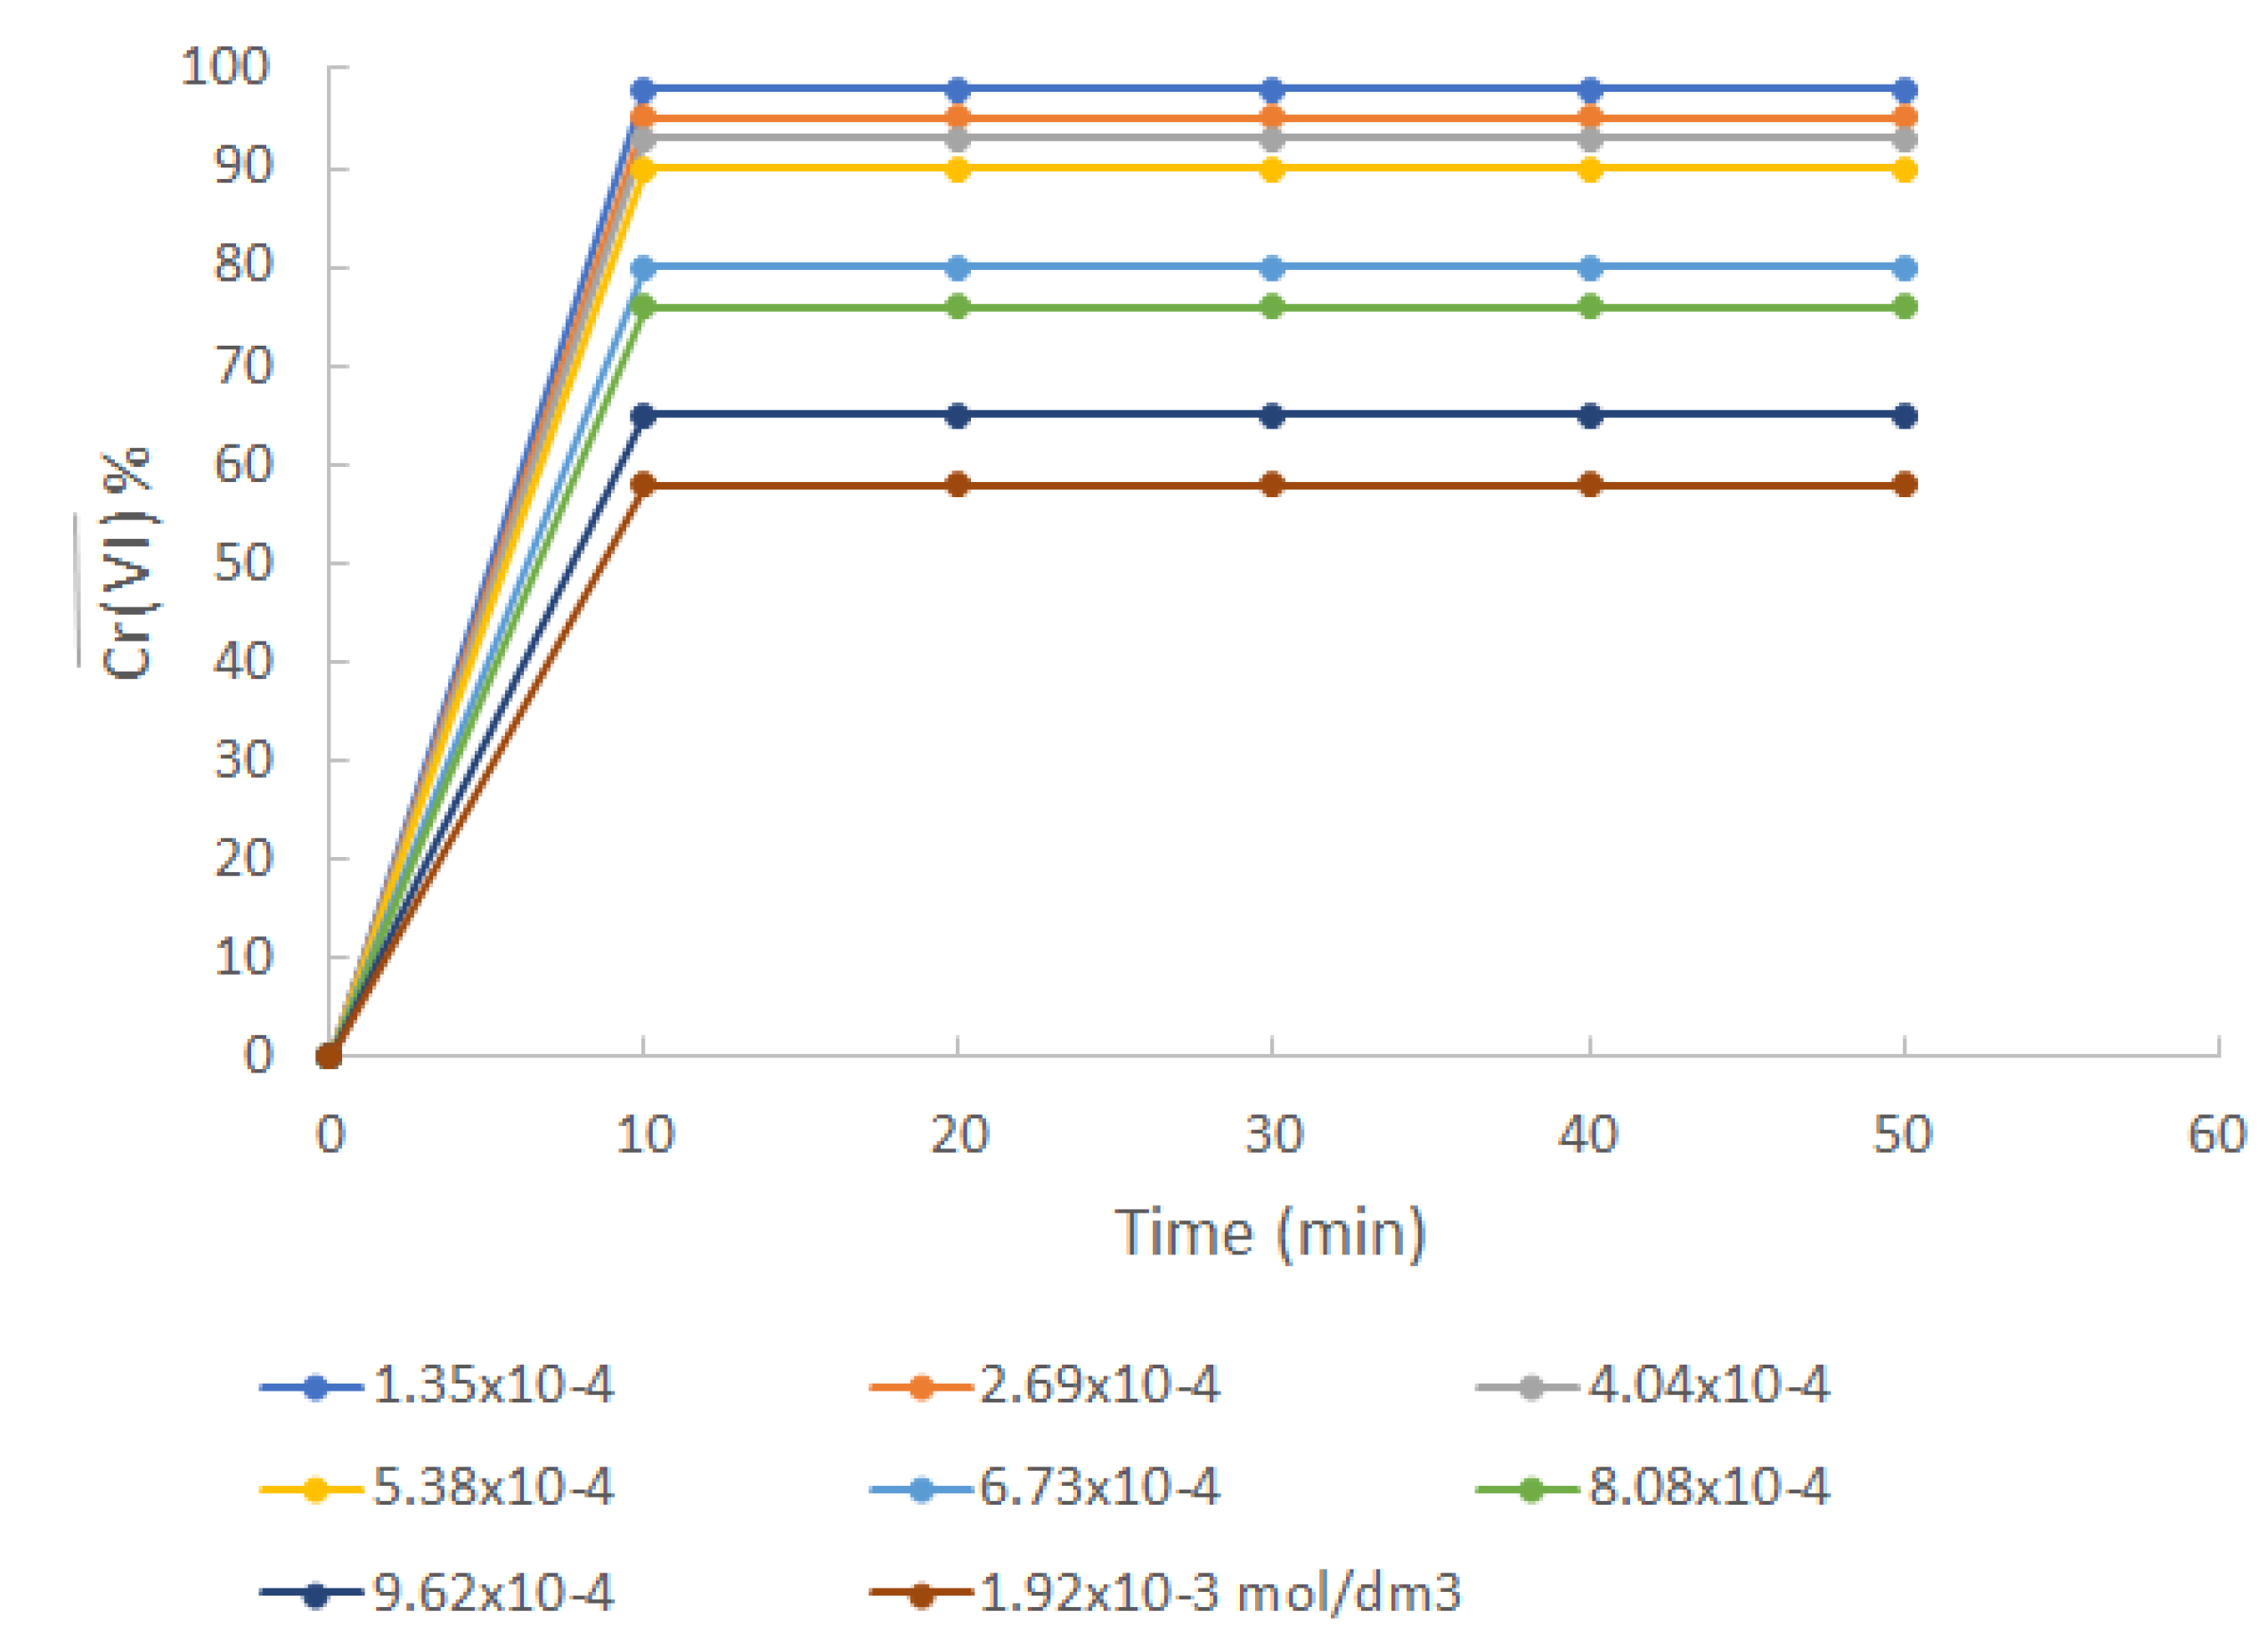
Figure 4.
(A) Cr(VI) adsorption isotherm at pH 6. (B) Linearized form of the Cr(VI) Langmuir adsorption isotherm.
Figure 4.
(A) Cr(VI) adsorption isotherm at pH 6. (B) Linearized form of the Cr(VI) Langmuir adsorption isotherm.
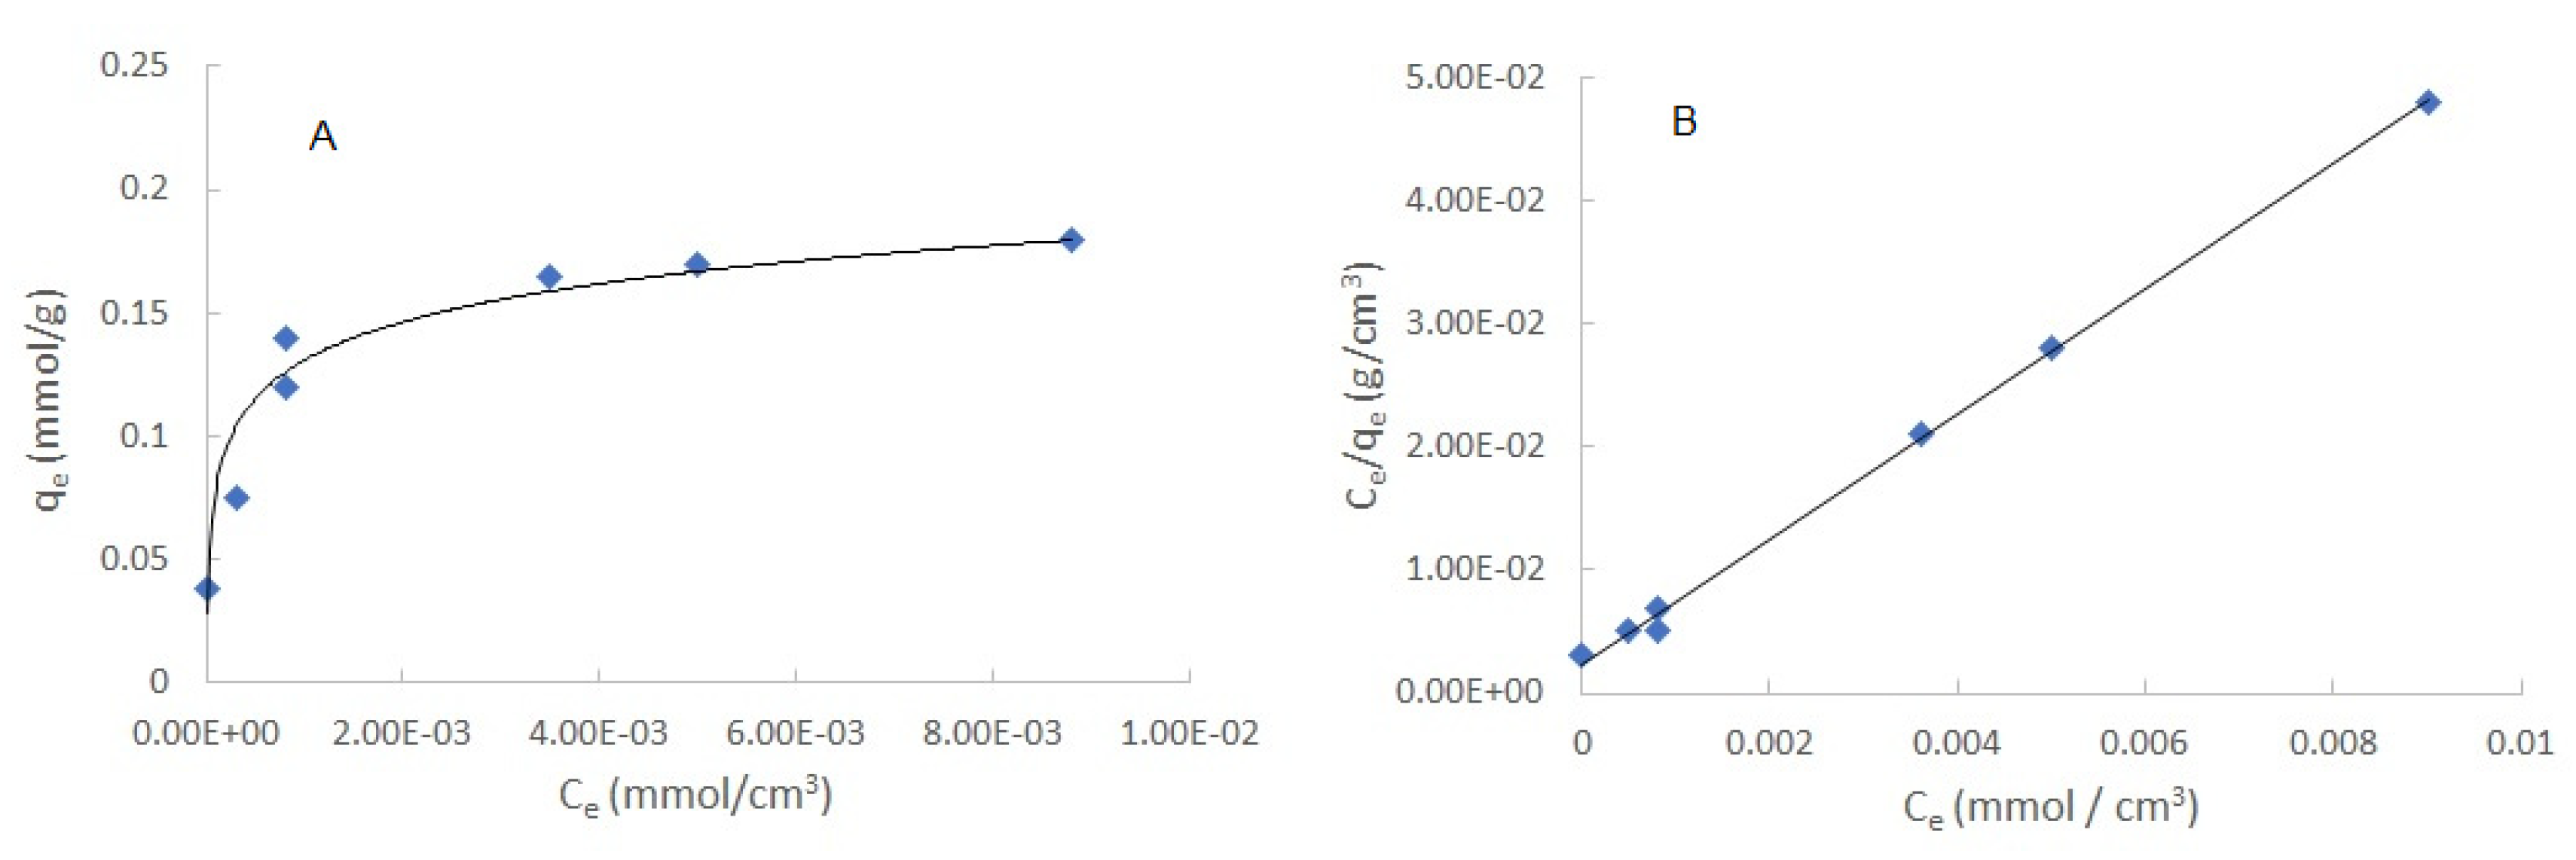
Figure 5.
Variation of the distribution quotient of Cr(VI) (A) and the extraction percentage (B) as a function of the initial concentration of the metal.
Figure 5.
Variation of the distribution quotient of Cr(VI) (A) and the extraction percentage (B) as a function of the initial concentration of the metal.
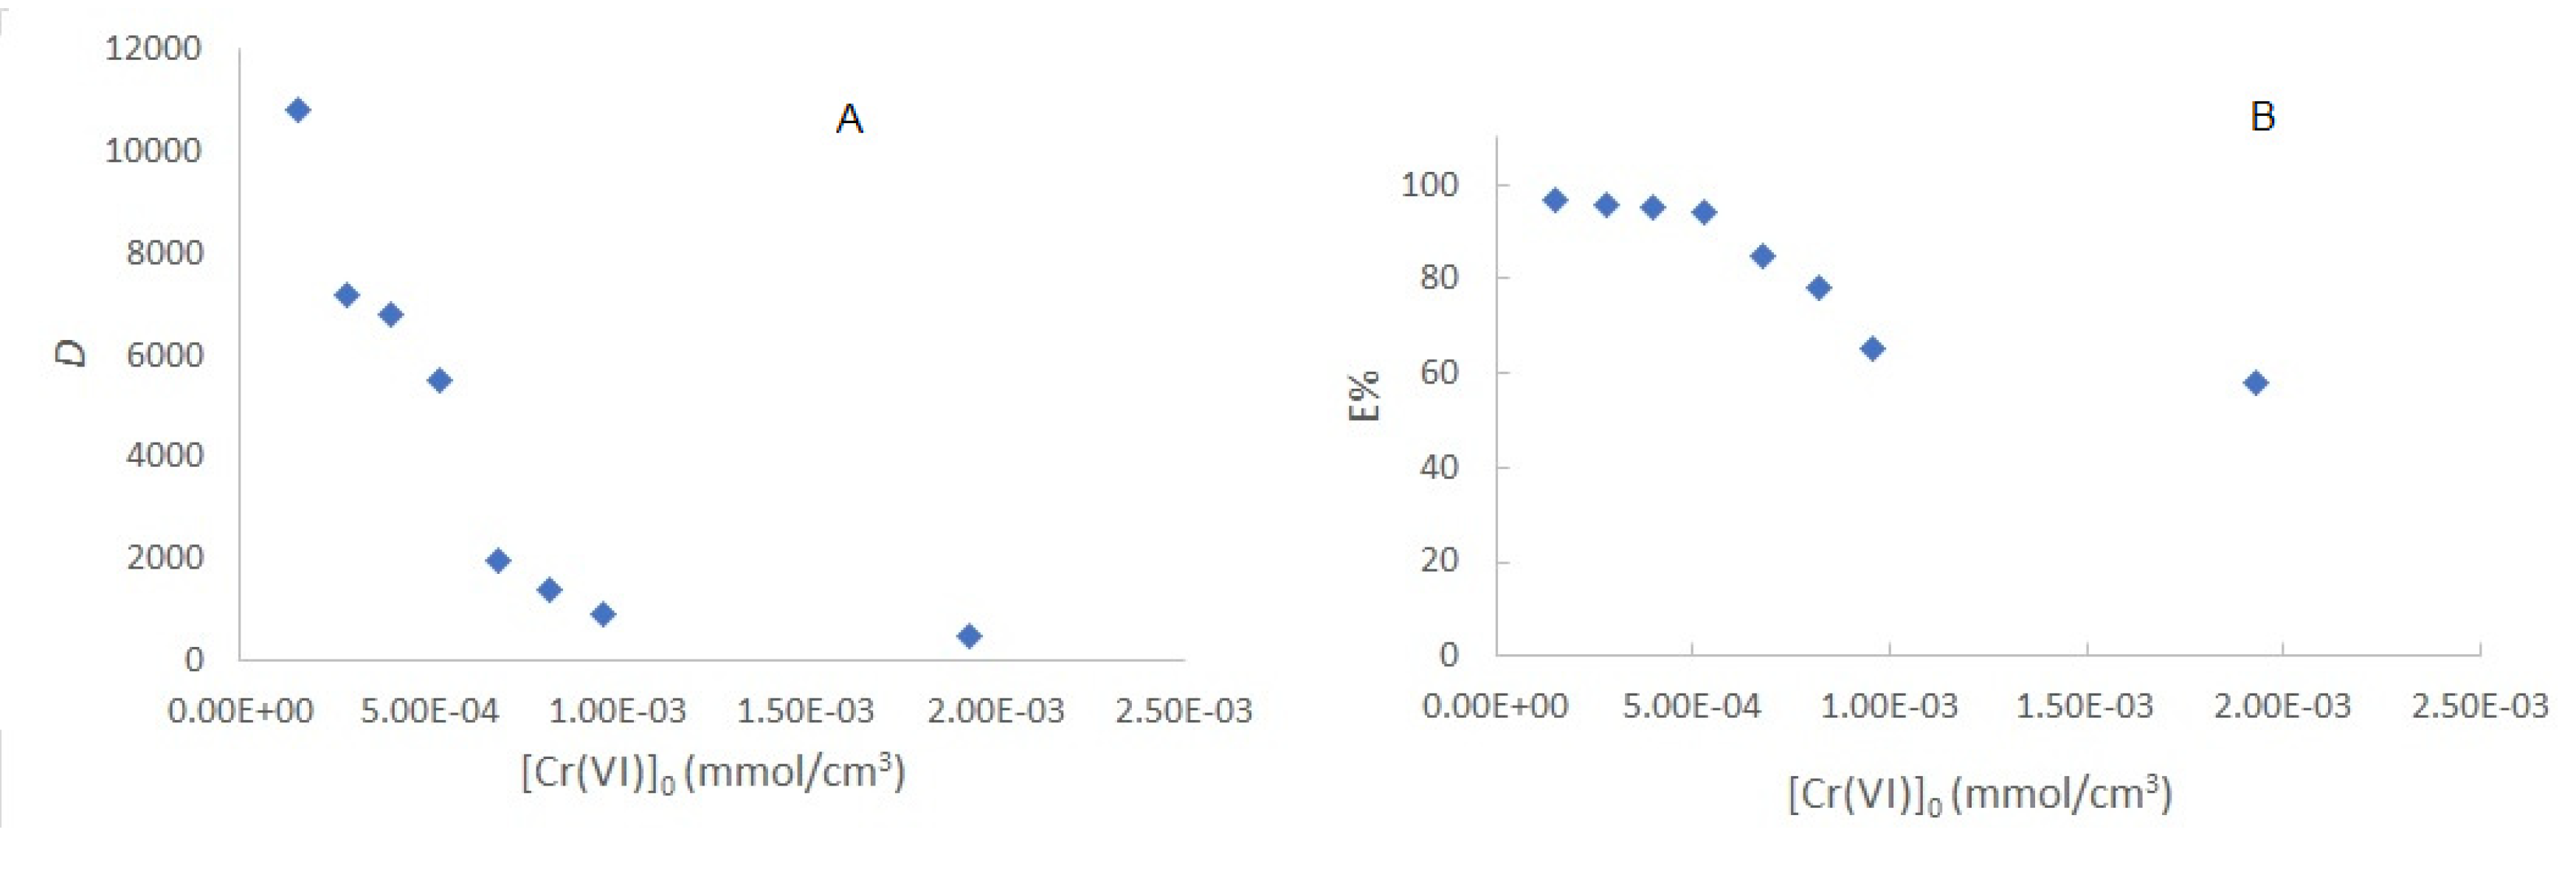
Figure 6.
Determination of the enrichment factor, E, at different initial Cr(VI) concentrations considering: all points (black dotted line, slope = 18.39), first 4 points at low concentrations (red line, slope = 33.30), last four points at high concentrations (green line, slope = 15.09).
Figure 6.
Determination of the enrichment factor, E, at different initial Cr(VI) concentrations considering: all points (black dotted line, slope = 18.39), first 4 points at low concentrations (red line, slope = 33.30), last four points at high concentrations (green line, slope = 15.09).
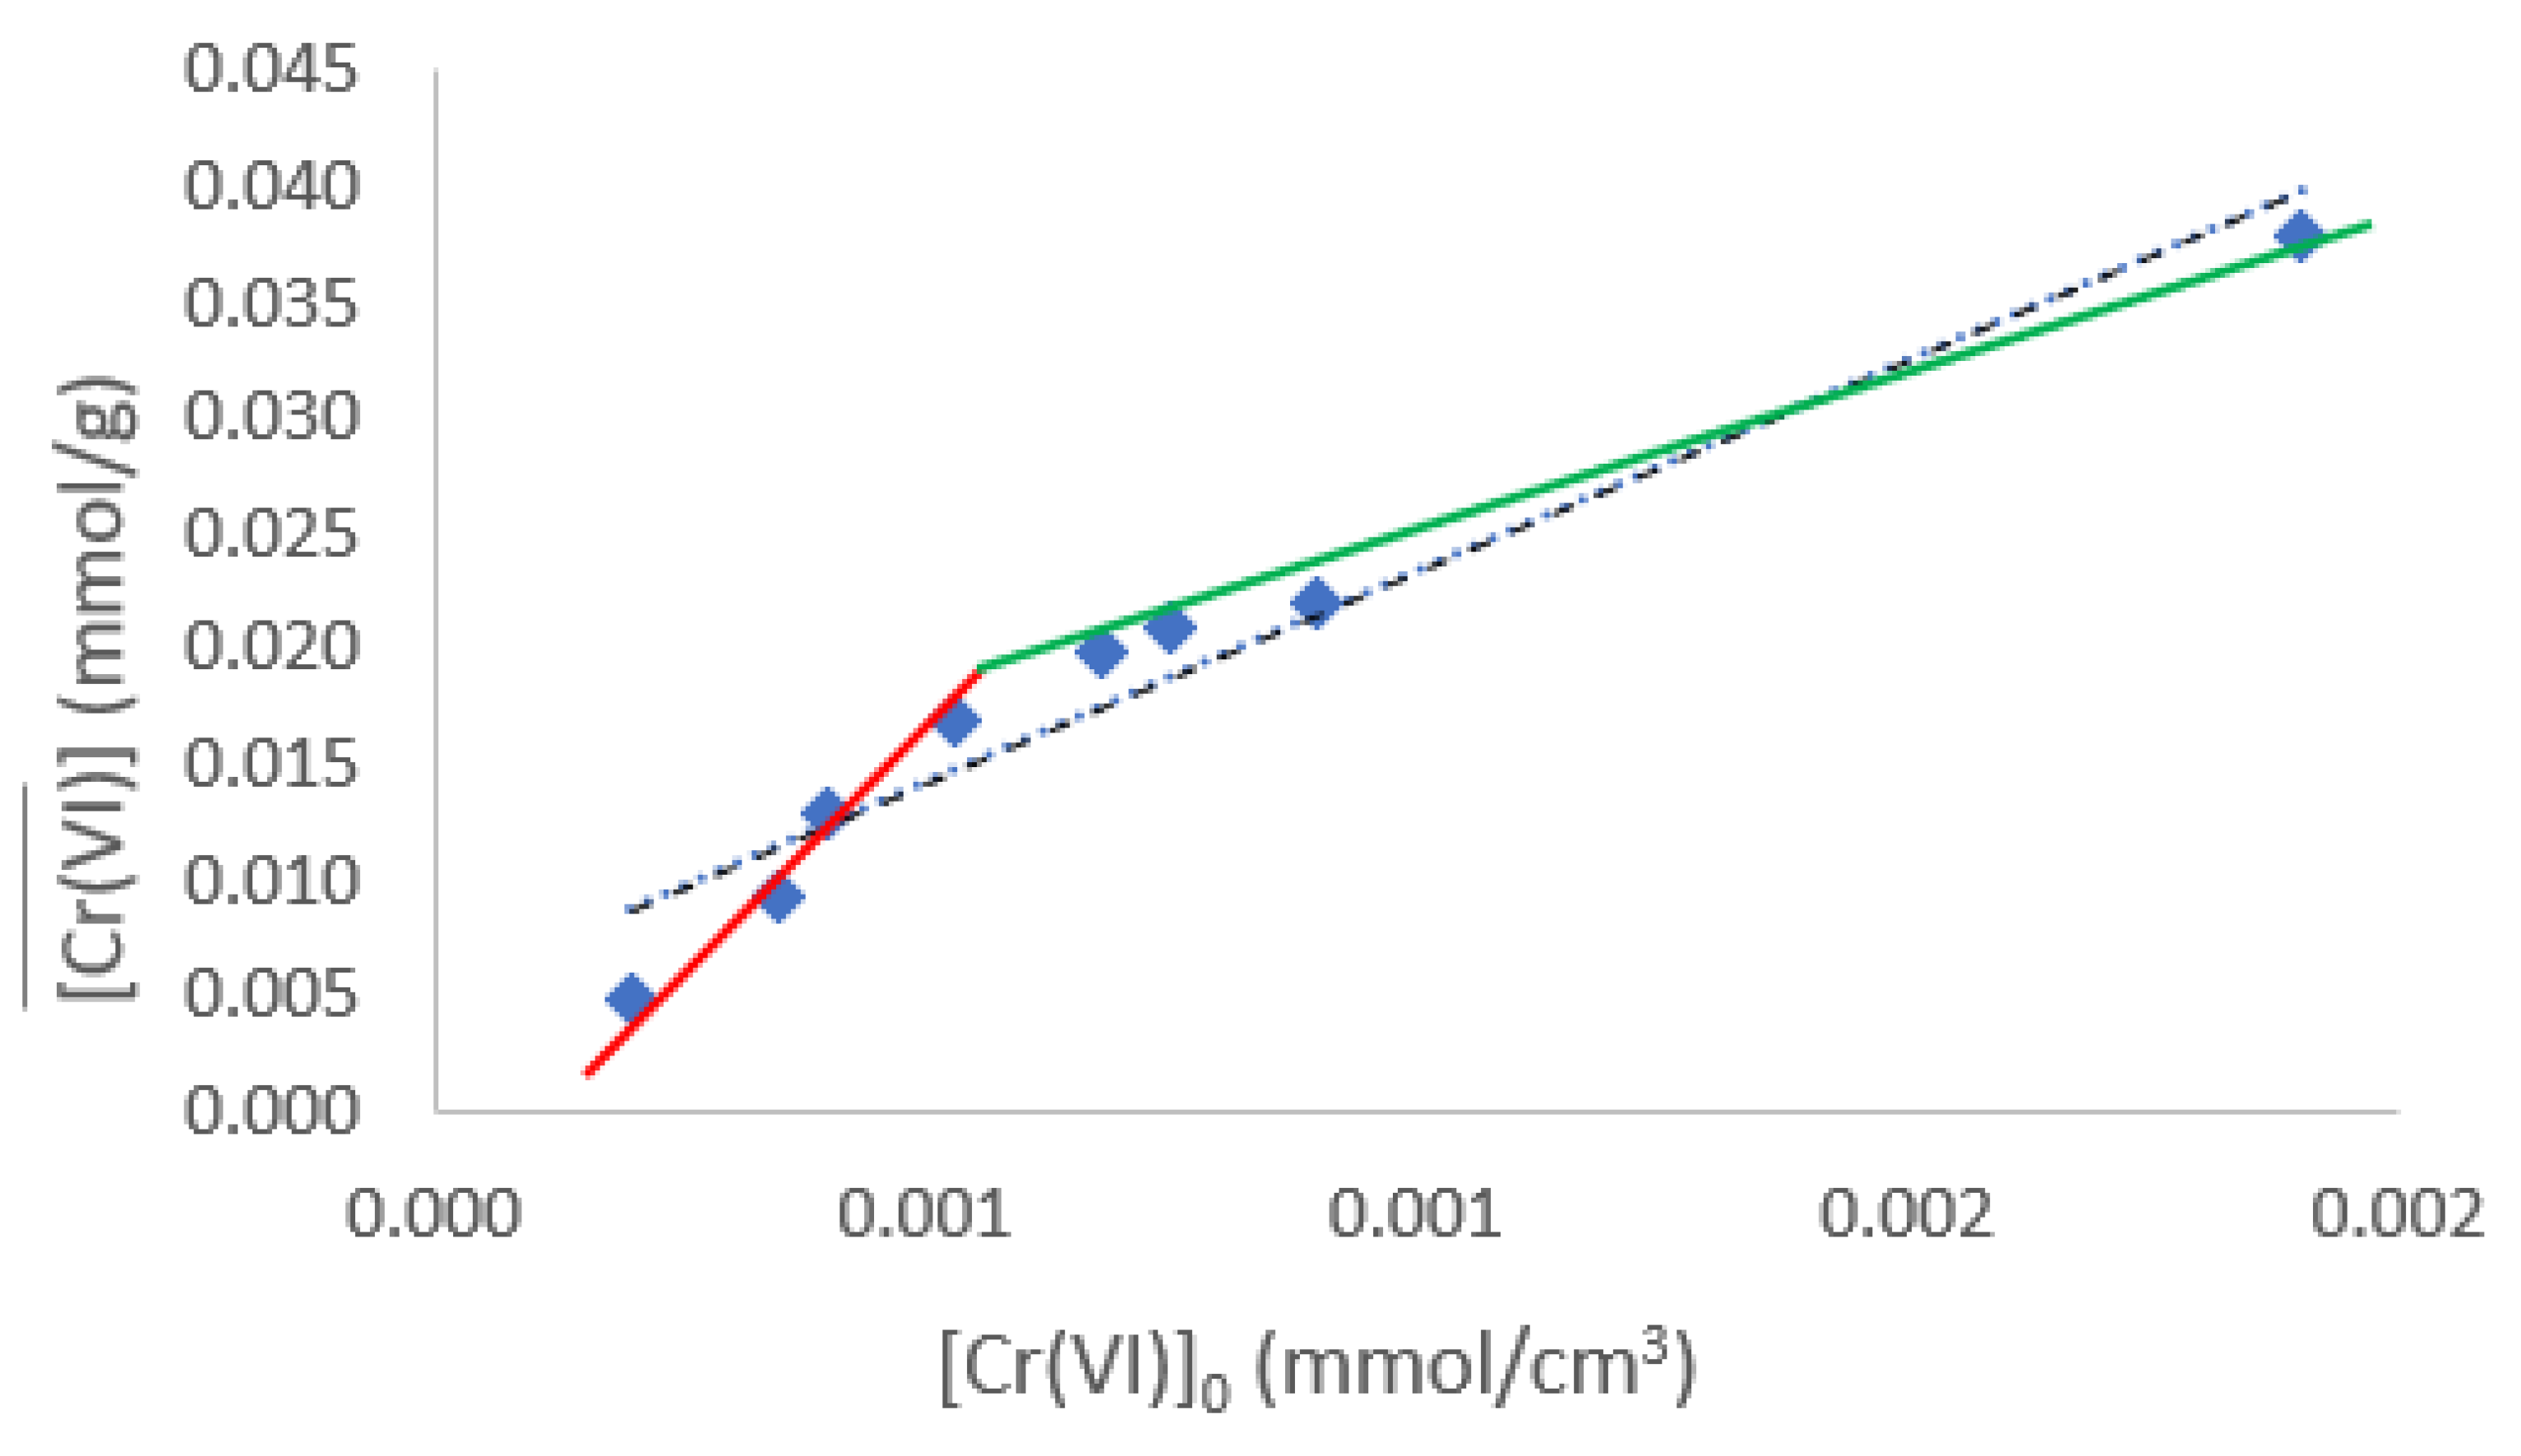
Figure 7.
Determination of the stoichiometric ratio of the extracted Aliquat 336–Cr(VI) complex.
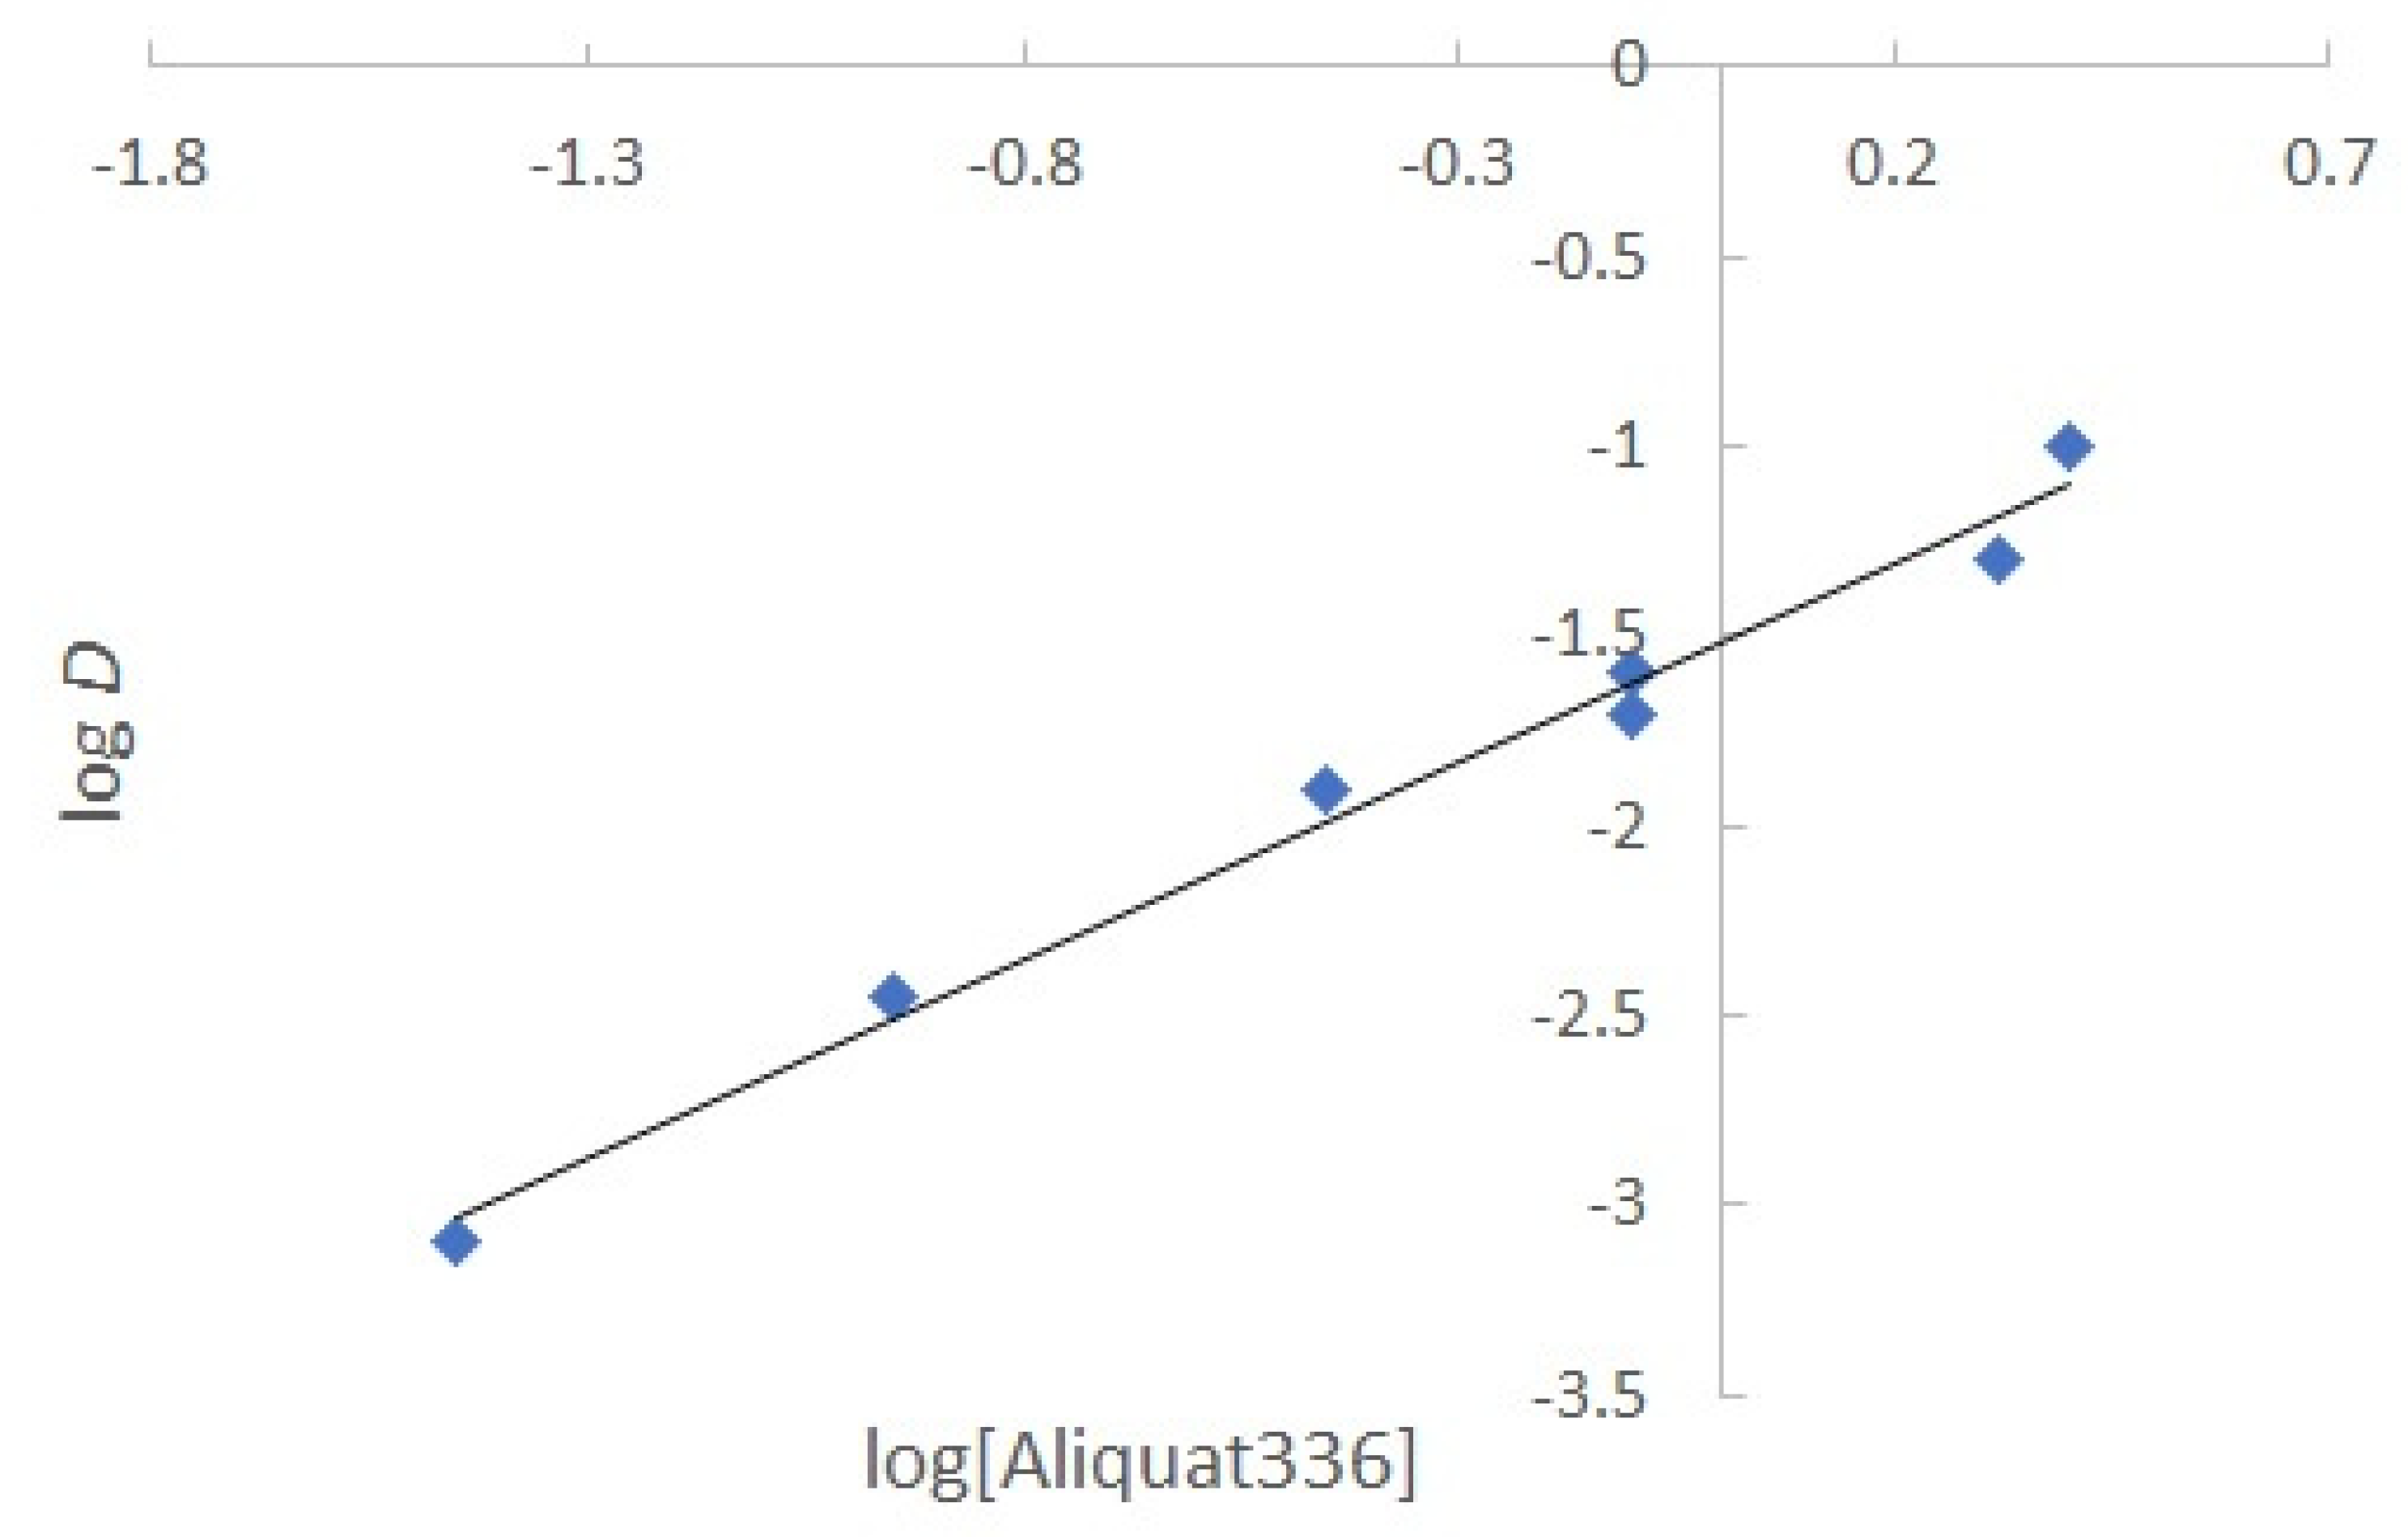
Figure 8.
Score plot of the PCA analysis. The points are colored according to the initial Cr(VI) concentrations in aqueous solution. (A) PC1 vs PC2, (B) PC1 vs PC2 vs PC3.
Figure 8.
Score plot of the PCA analysis. The points are colored according to the initial Cr(VI) concentrations in aqueous solution. (A) PC1 vs PC2, (B) PC1 vs PC2 vs PC3.
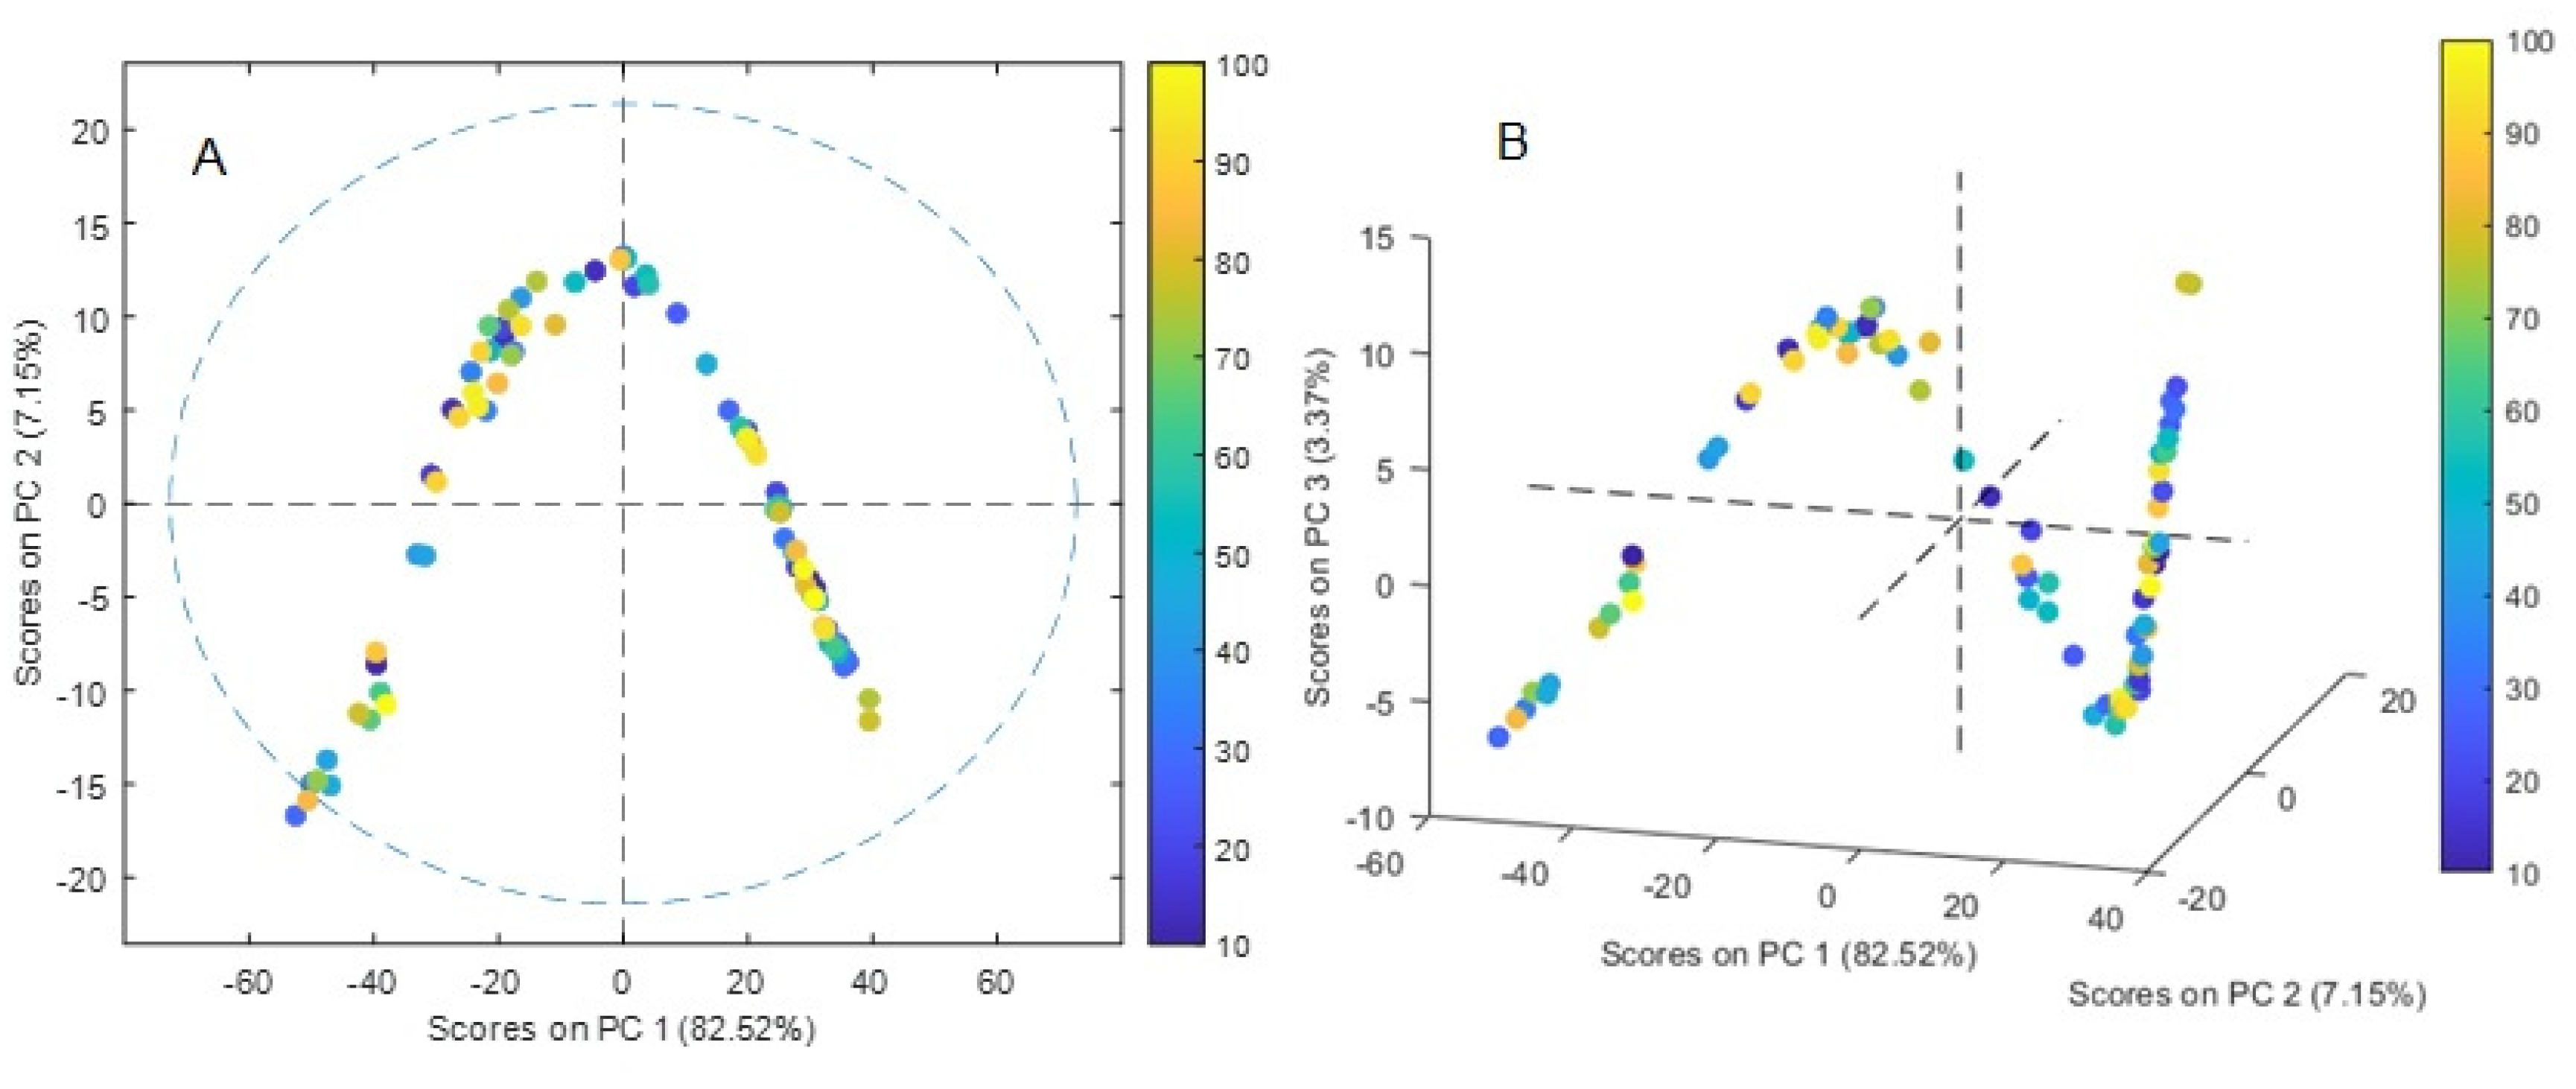
Figure 9.
Forward iPLS results showing the regions where minimum values of RMSECV were attained (red) and the optimal ones (green).
Figure 9.
Forward iPLS results showing the regions where minimum values of RMSECV were attained (red) and the optimal ones (green).
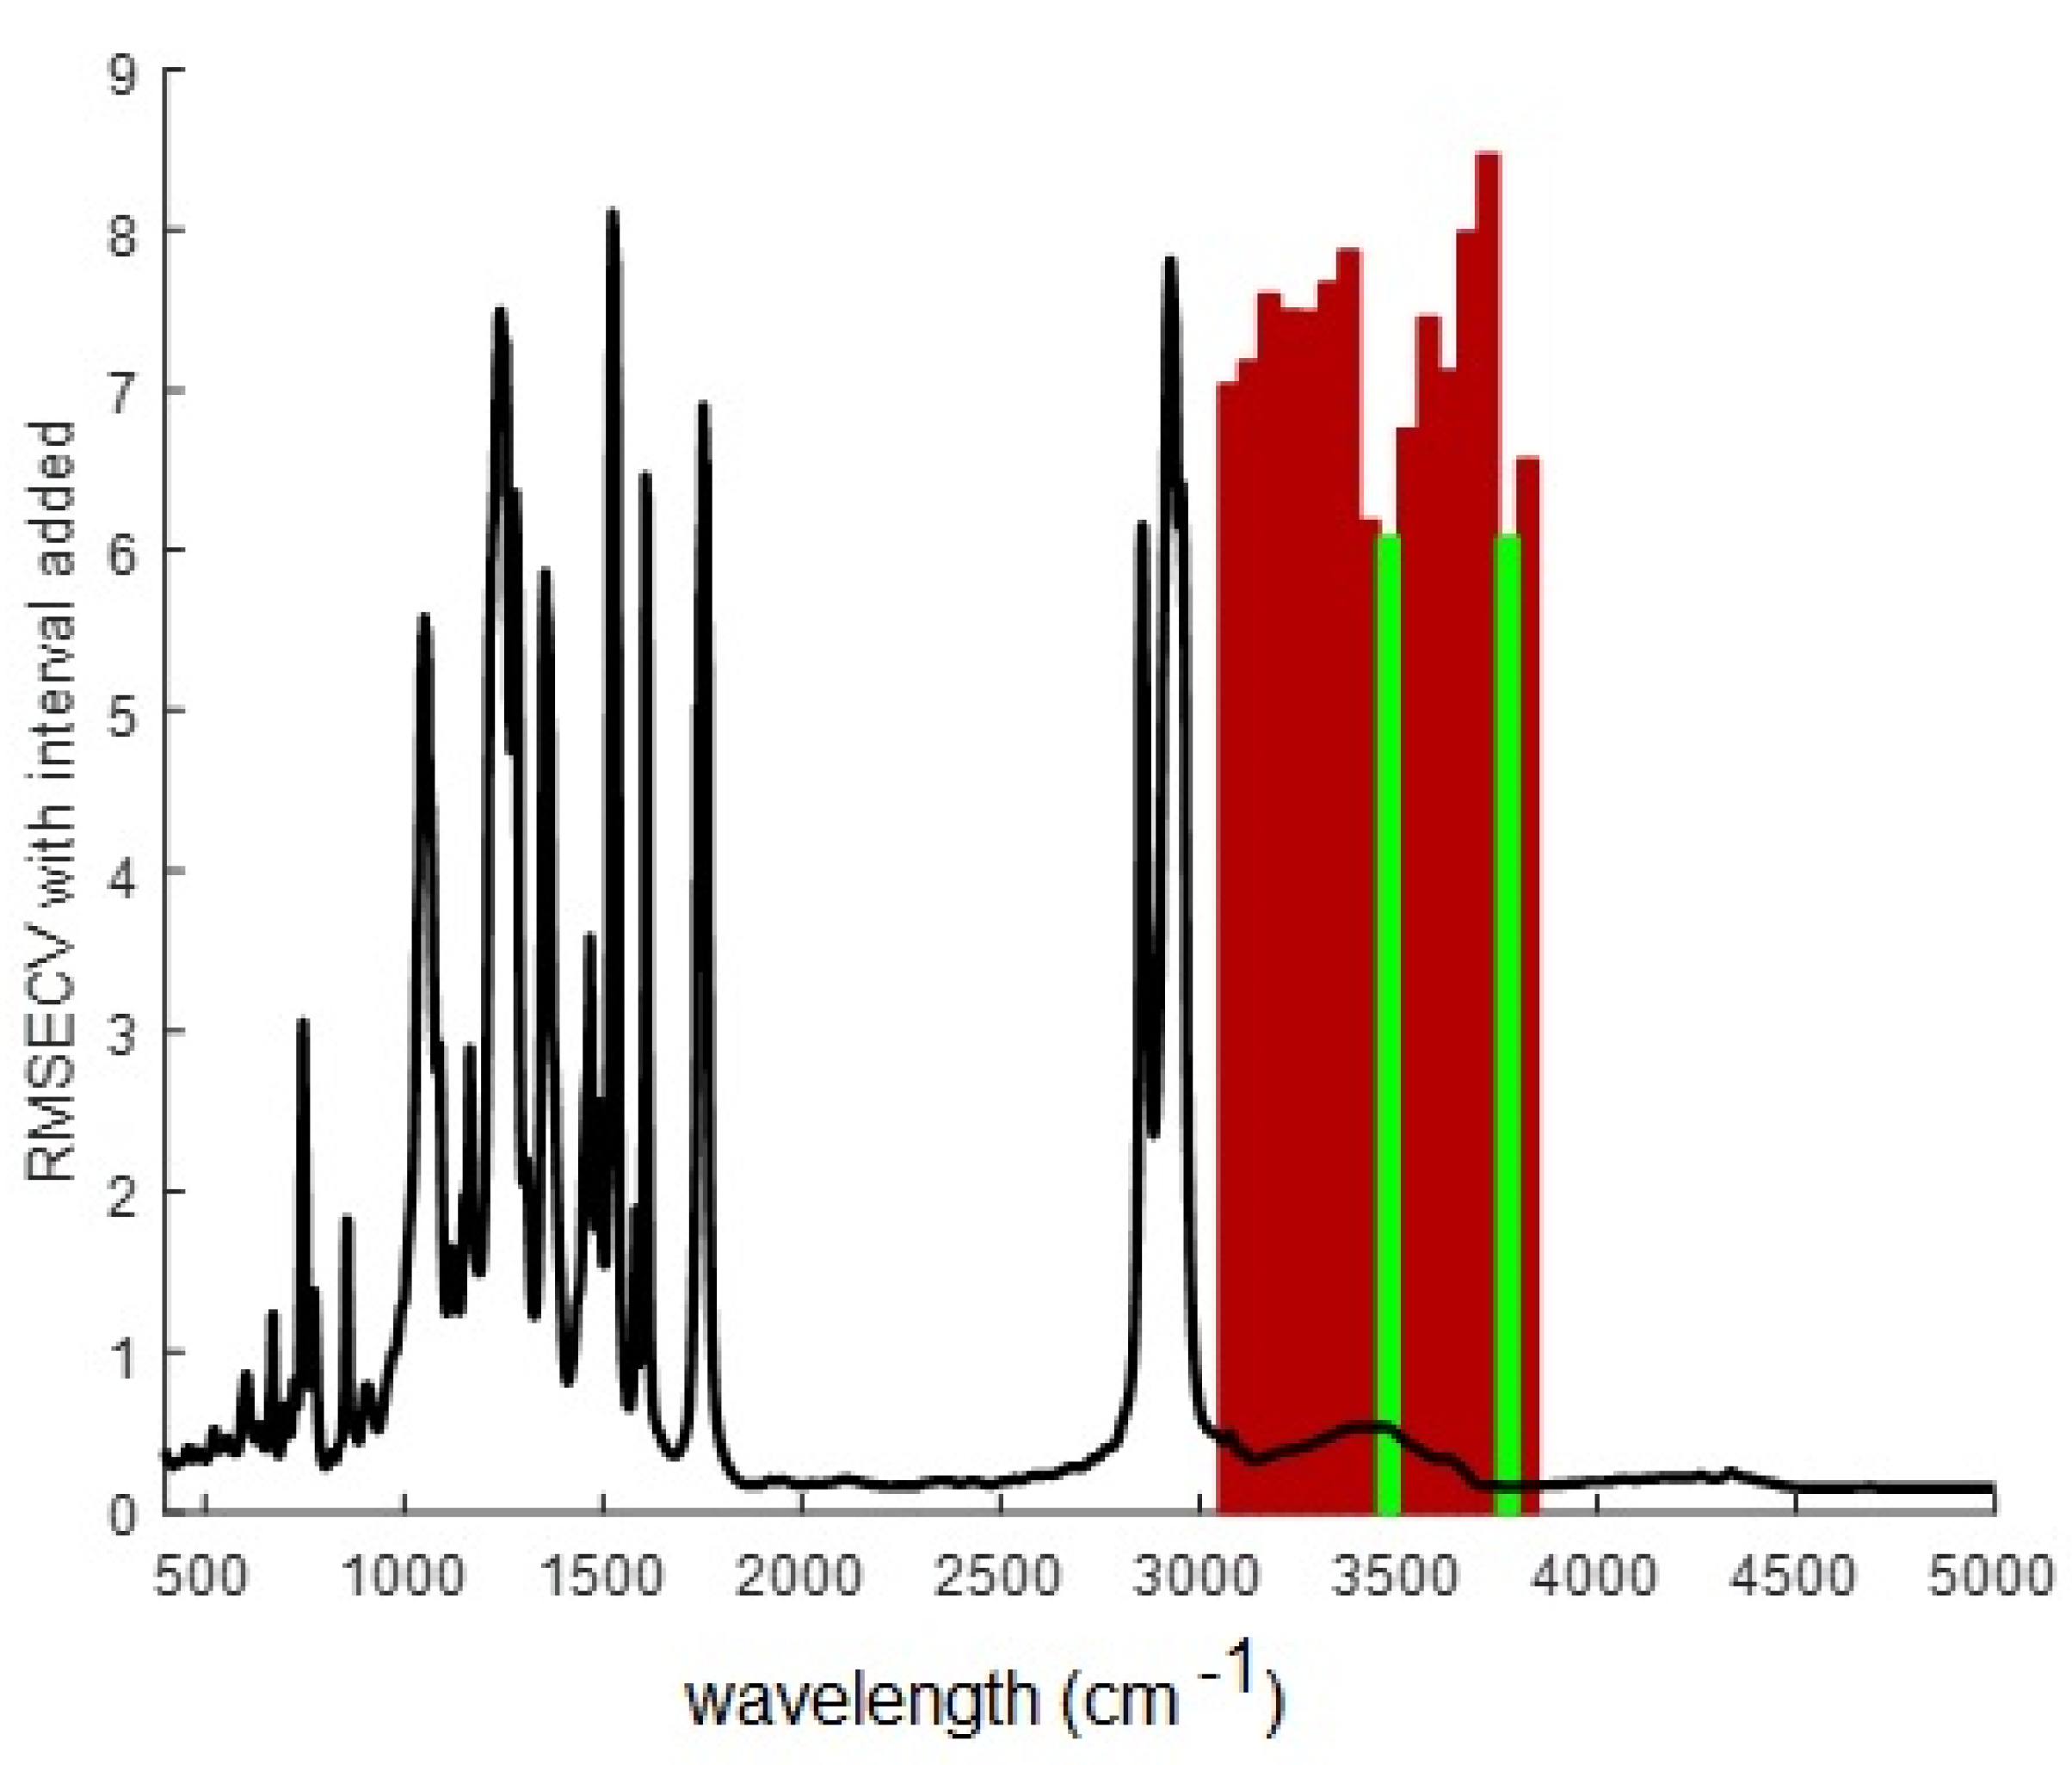
Figure 10.
Summary of the results of the final PLS regression model. (A and B) outliers plot, (C) parity plot, (D) plot of the first two latent variables showing the Hotelling T2 elipse.
Figure 10.
Summary of the results of the final PLS regression model. (A and B) outliers plot, (C) parity plot, (D) plot of the first two latent variables showing the Hotelling T2 elipse.
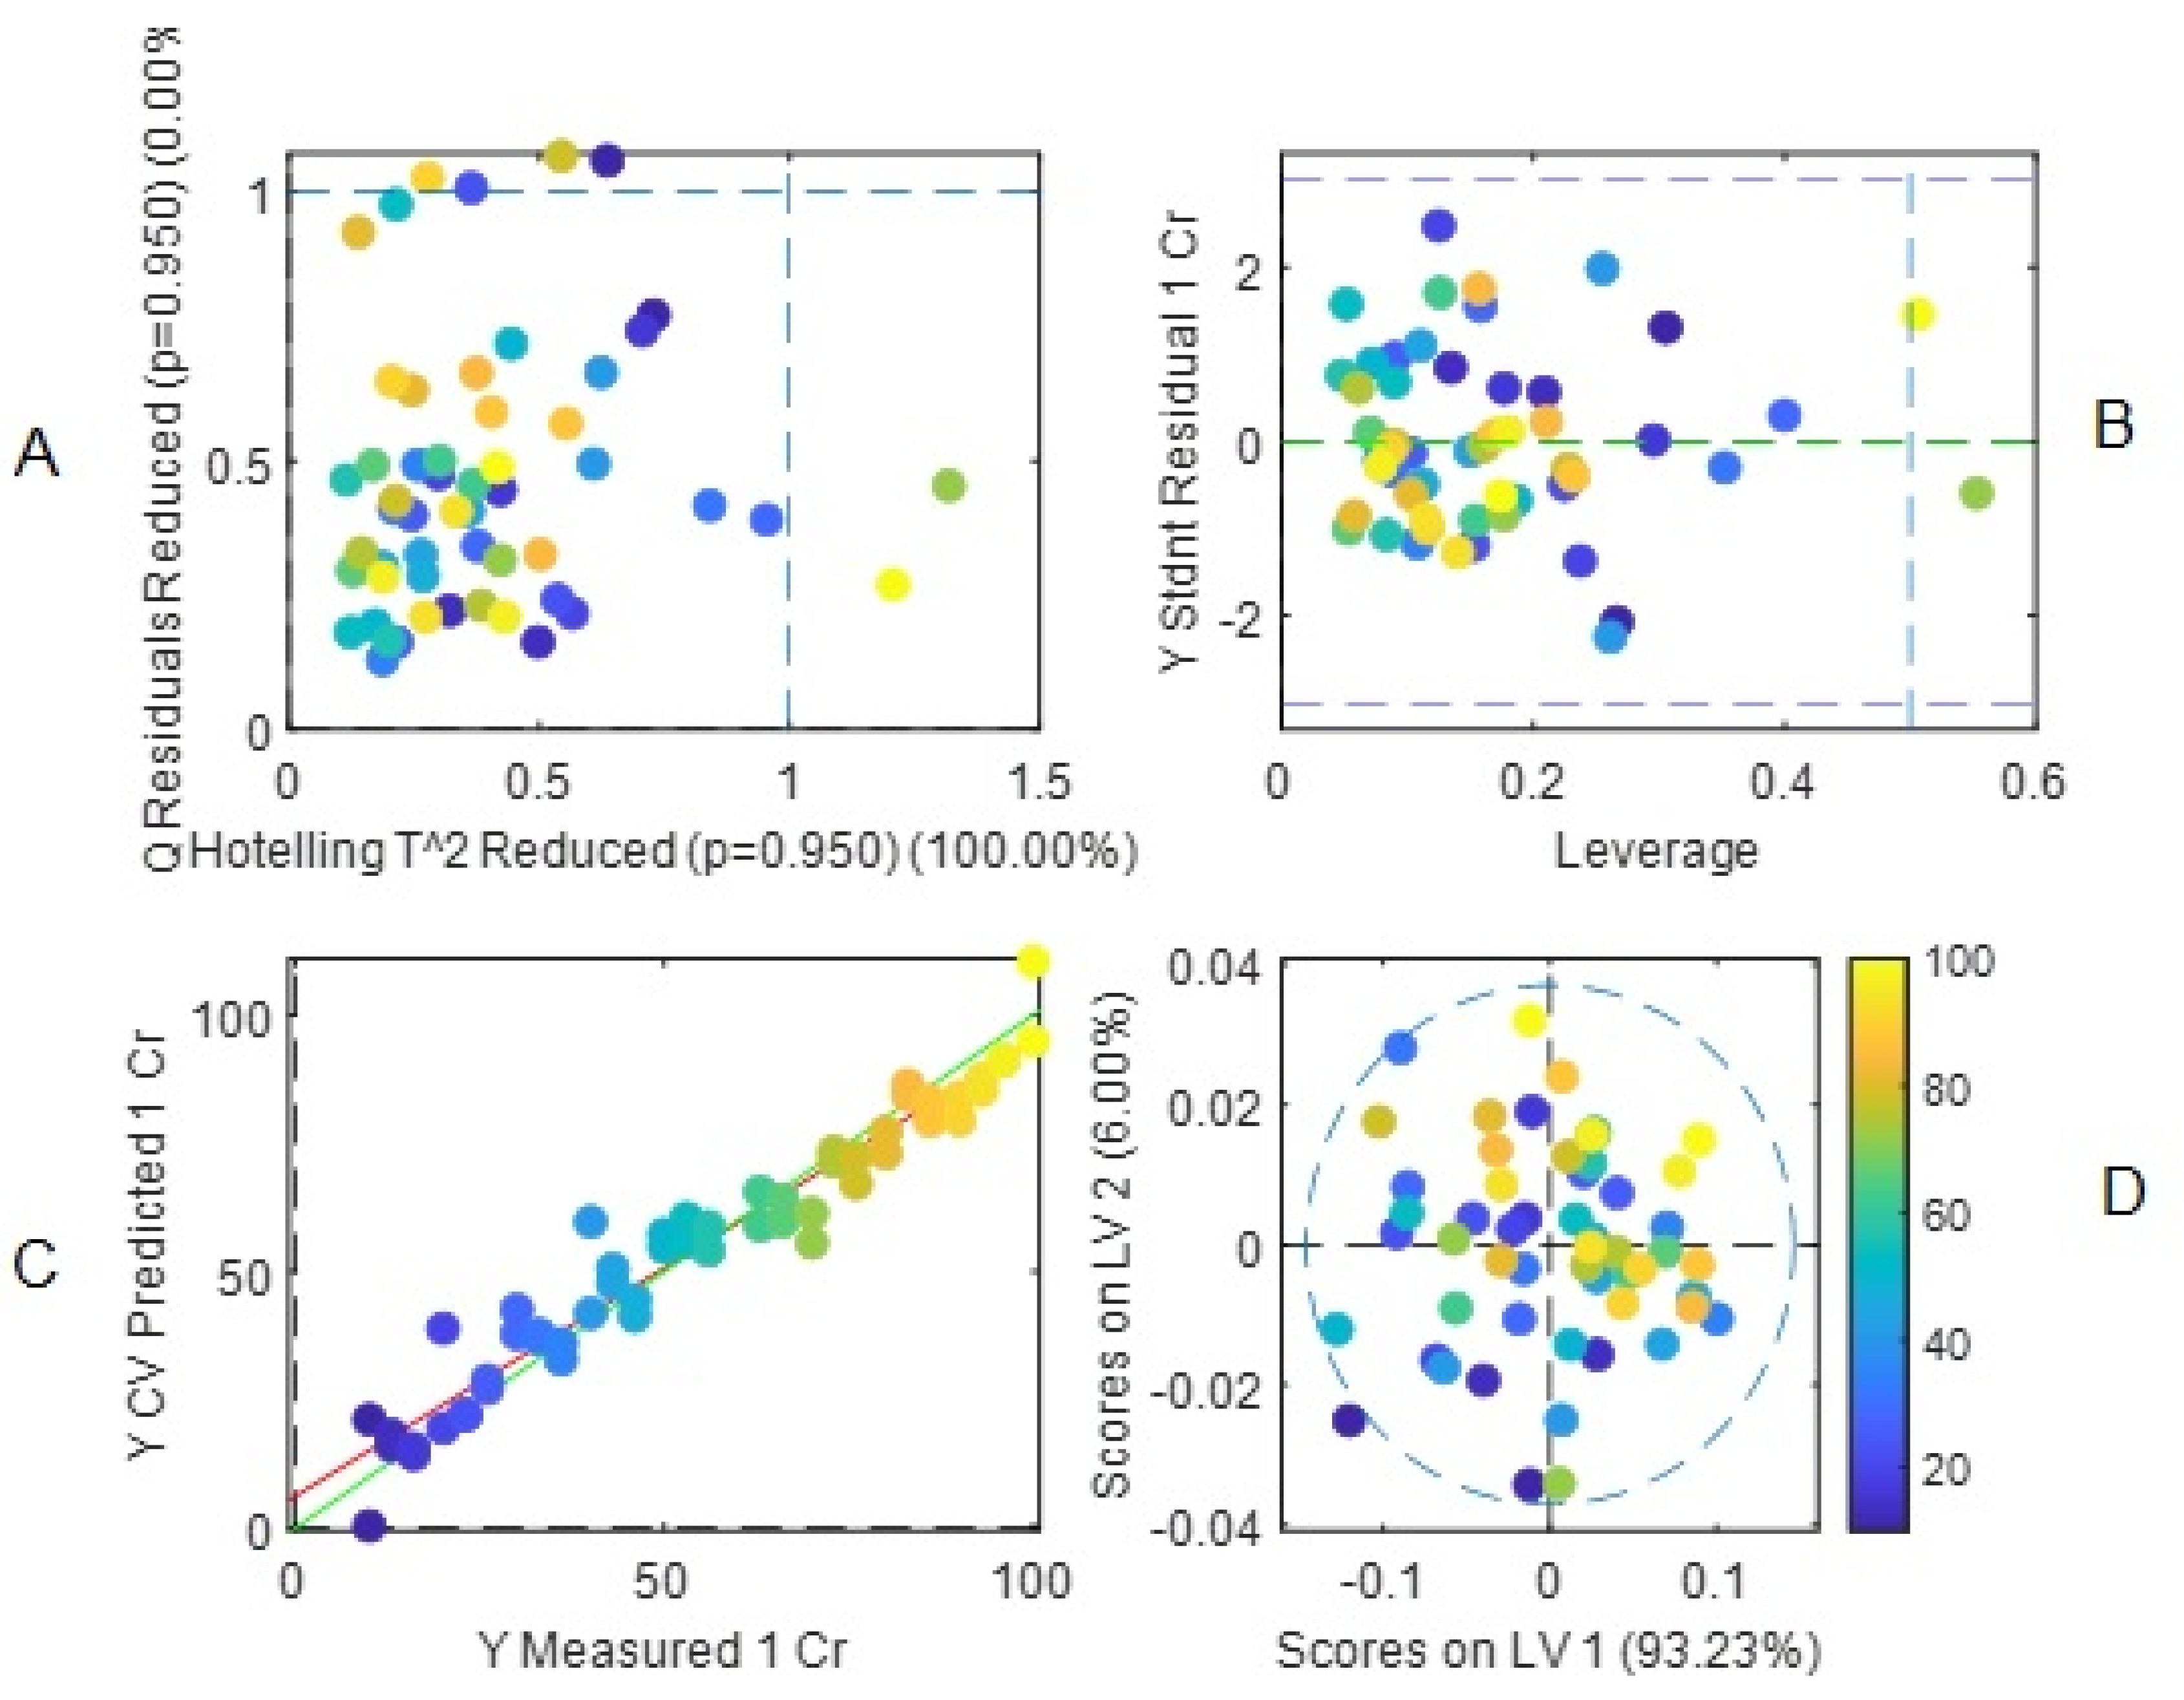

Table 1.
Values of the RL parameter of the Langmuir model at different initial Cr(VI) concentrations.
Table 1.
Values of the RL parameter of the Langmuir model at different initial Cr(VI) concentrations.
| (mg/dm3) | RL |
|---|---|
| 6.81 | 0.0064 |
| 14.53 | 0.0031 |
| 20.65 | 0.0021 |
| 27.10 | 0.0016 |
| 36.74 | 0.0012 |
| 40.73 | 0.0010 |
| 48.70 | 0.0009 |
Table 2.
Percent of variance captured by the PLS Regression Model.
| X-Block | y-Block | |||
|---|---|---|---|---|
| Component | This component | Total | This component | Total |
| 1 | 93.23 | 93.23 | 10.71 | 10.71 |
| 2 | 6.00 | 99.24 | 14.71 | 25.41 |
| 3 | 0.48 | 99.72 | 51.55 | 76.96 |
| 4 | 0.23 | 99.95 | 7.35 | 84.31 |
| 5 | 0.03 | 99.98 | 3.30 | 87.62 |
| 6 | 0.01 | 99.99 | 7.49 | 95.10 |
| 7 | 0.00 | 99.99 | 2.07 | 97.17 |
Table 3.
Analytical figures of merit for the final PLS regression model.
| FOM | Results | |
|---|---|---|
| Accuracy | RMSEC | 3.73115 |
| RMSECV | 6.82685 | |
| RMSEP | 3.3229 | |
| Bias | -1.91847e-13 (Cal) | |
| 0.185947 (CV) | ||
| R2 | 0.98145 (Cal) | |
| 0.940902 (CV) | ||
| Recovery% | 104.02 ± 4.12* (Test) | |
| sen | 0.00001547 ppb | |
| γ | 3.8 ppb | |
| γ-1 | 0.6 ppb-1 | |
| sel | 0.0155 | |
| Linear range | 5.8–100 ppb | |
| LD | 1.9 ppb | |
| LQ | 5.8 ppb |
*95% confidence level.
Table 4.
Comparison of some representative works for Cr(VI) quantitation reported in the literature.
Table 4.
Comparison of some representative works for Cr(VI) quantitation reported in the literature.
| Detection method | Carrier/chorophore | Linear range | pH | LD | LQ | Reference |
|---|---|---|---|---|---|---|
| Colorimetry | 2-hydroxy, 3-methoxy benzaldehyde thiosemicarbazone | 0.260–2.60 μg/mL | 6 | 0.014 μg/mL | 0.041 μg/mL | [56] |
| Colorimetry | 1,5-diphenylcarbazide | 0.03–3 mg·L−1 | 2.2 | 0.023 mg·L−1 | 0.076 mg·L−1 | [57] |
| Colorimetry | diazonium salt and citrazinic acid | 2–15 μg | Alkaline medium | 0.04 μg/mL | [58] | |
| Rotational microfluidic paper-based device | 1,5-diphenylcarbazide | 0.5–10 mg/L | Very acid | 0.18 mg/L | [59] | |
| Sol-gel monoliths | pyridine-functionalized sol-gel monoliths and diphenylcarbazide | 1 | about 10 ppb | [12] | ||
| Optode | aliquat 336 and 1,5-diphenylcarbazide | 0.5–10 μg | 3 | 0.28 μg | [11] | |
| Optode | 1,5-diphenylcarbazide | 2.4–1000 μg L−1 | 1 | 0.7 μg L−1 | 2.4 μg L−1 | [13] |
| Optode | aliquat 336 and 1,5-diphenylcarbazide | 0.02–0.40 ppm | 3 | 0.0055 ppm | 0.0165 ppm | [14] |
| FTIR optode | aliquat 336 | 5.8–100 ppb | 6 | 1.9 ppb | 5.8 ppb | This work |
Table 5.
Results of the analysis of the test samples by the final PLS regression model.
| Sample | Measured (ppb) | Predicted (ppb) | Recovery% | RMSEP | p-value |
|---|---|---|---|---|---|
| Test 1 | 13 | 13.99 | 107.66 | ||
| Test 2 | 20 | 23.57 | 117.86 | ||
| Test 3 | 36 | 37.25 | 103.47 | ||
| Test 4 | 40 | 42.32 | 105.81 | ||
| Test 5 | 63 | 63.23 | 100.37 | ||
| Test 6 | 73 | 75.85 | 103.90 | ||
| Test 7 | 80 | 77.89 | 97.48 | ||
| Test 8 | 86 | 89.07 | 103.57 | ||
| Test 9 | 90 | 90.90 | 101.01 | ||
| Test 10 | 100 | 99.00 | 99.00 | ||
| Average | 104.01 | ||||
| 3.3229 | 0.0611 |
Disclaimer/Publisher’s Note: The statements, opinions and data contained in all publications are solely those of the individual author(s) and contributor(s) and not of MDPI and/or the editor(s). MDPI and/or the editor(s) disclaim responsibility for any injury to people or property resulting from any ideas, methods, instructions or products referred to in the content. |
© 2023 by the authors. Licensee MDPI, Basel, Switzerland. This article is an open access article distributed under the terms and conditions of the Creative Commons Attribution (CC BY) license (http://creativecommons.org/licenses/by/4.0/).
Copyright: This open access article is published under a Creative Commons CC BY 4.0 license, which permit the free download, distribution, and reuse, provided that the author and preprint are cited in any reuse.


