Submitted:
31 July 2023
Posted:
01 August 2023
You are already at the latest version
Abstract
D-Glucaric acid is an important bio-based building block of polymers and is a high value-added chemical that can be used in a variety of applications. In the present study, the Udh target genes from Pseudomonas putida and Pseudomonas syringae were used together to construct the expression vector pETDuet-2×Udh. The transformants of BL21(DE3) with vector pETDuet-2×Udh was applied to produce glucaric acid from glucuronic acid. After optimization of induction conditions, the highest Udh expression were achieved when 0.4 mmol L-1 isopropyl-β-d–thiogalactoside (IPTG) was added to cell cultures at an OD600 value of 0.6 followed by culture at 26℃ for 6 hours. The production of glucaric acid substantially reached 5.24 ± 0.015 g L-1 in fed-batch cultures in a 30 L tank. In the present study, a new system for glucaric acid production was established, which was more economic and friendly to environment.
Keywords:
Urinate dehydrogenases
; pETDuet-2×Ud
; D-Glucaric acid
; Glucuronic acid
; SDS-PAGE
1. Introduction
Glucuronic acid is formed by oxidizing the C-6 hydroxyl group of glucose to a carboxylic group[1]. In aqueous solution, glucuronic acid and glucuronolactone usually convert to each other to reach an equilibrium state, while glucuronic acid is more stable in the form of furan rings. Glucuronic acid exists in many substances, such as chondroitin, heparin, oligosaccharides, etc. The main physiological effects of glucuronic acid are: unconjugated bilirubin (also known as indirect bilirubin) combines with glucuronic acid to produce conjugated bilirubin (also known as direct bilirubin), which has a high solubility in the blood and is generally excreted from the body through the biliary tract, but can also enter the blood with absorption of the small intestine and excrete toxic substances through the urinary function of the kidney [2]. At the same time, it can be combined with various harmful substances in the liver, so as to play a detoxification effect.
D-Glucaric acid is a promising glucose derivative, which widely exist in fruits, vegetables and different tissues of mammals. D-Glucaric acid is known as “top value-added chemicals from biomass”[3], because it is widely used in different fields, such as being used as an important bio-based building block for making nylons, plastics and other synthetic polymers[4]. Researchers believe that glucaric acid can improve the autoimmune mechanism[5], help prevent cancer[6], regulate cholesterol levels in the body[7], and regulate the ability of lipoprotein metabolism[8].
In recent years, researchers have focused on the industrial production of gluconic acid. Gluconic acid on the market is produced by the non-selective oxidation of glucose and is used in the food, pharmaceutical and paper industries[9]. This chemically catalyzed process is expensive, non-selective, low percent conversion, and low yield[10]. Furthermore, this method can produce toxic byproducts during nitric acid oxidation[11]. Therefore, it is necessary to develop environmentally friendly and efficient production manner of glucuronic acid[12]. D-glucaric acid biosynthesis with recombinant microorganism is a promising choice compared to the chemical conversion process[13].
D-glucaric acid can be synthesized from glucuronic acid in mammalian and plant cells, which needs more than 10 conversion steps. Consequently, with the increasing market demand for gluconic acid, the efficient conversion of gluconic acid by recombinant E. coli has received more and more attention for the past several years. Moon et al. constructed a novel synthetic pathway for the production of glucuronic acid and glucaric acid from glucose in E. coli co-expressing the genes myo-inositol-1-phosphate synthase (Inol) from Saccharomyces cerevisiae, myo-inositol oxygenase (MIOX) from mouse and uronate dehydrogenase from Pseudomonas syringae to produce glucaric acid from glucose[14]. Liu et al. used inositol as a substrate to successfully construct a glucaric acid synthesis pathway in Pichia pastoris . Qu et al. co-expressed the genes cscB, cscA, cscK, ino1, miox, udh, and suhB in E. coli BL21 (DE3) to produced glucaric acid from sucrose[15]. However, the activity of MIOX was rate-limiting, leading to the poor accumulation of myo-inositol, which affects the final glucaric acid content in the respective biosynthesis system[16]. The above researchers indeed succeeded in obtaining glucaric acid, but the metabolic route was too long, and it was difficult to obtain a high glucaric acid production level. Glucuronic acid has been able to be industrialized on a large scale. Fei et al. produced glucuronic acid by microbial fermentation, and the yield reached 106 g·L-1. Therefore, direct conversion of glucuronic acid to glucuronic acid is a good choice[17]. Using Brenda enzyme databases (https://www.brenda-enzymes.org/), it was known that uronic acid dehydrogenase (Udh, EC 1.1.1.203) catalyzes the dehydrogenation of uronic acid to aldose-lactone[18], which forms glucaric acid when aldose-lactone is hydrolyzed, with NAD+ as cofactor (Figure 1). Herein, metabolic engineering of E. coli to synthesize glucaric acid from glucuronic acid as the sole precursor. With pETDuet-1 as vector, co-expression of the Udh from Pseudomonas syringae DC3000 (GenBank: EU377538.1) and Udh from Pseudomonas putida KT2440 (GenBank: LT799039.1) in E. coli BL21 (DE3). Co-expression strategy was applied to improve the biosynthesis level of glucaric acid.
In this study, the Udh gene from Pseudomonas putida KT2440 and the Udh gene from Pseudomonas syringae DC3000 were connected to the vector pETDuet-1. Recombinant bacteria BL21/pETDuet-Ppudh, recombinant bacteria BL21/pETDuet-Psudh and recombinant bacteria BL21/pETDuet-2×Udh were successfully constructed, and the recombinant bacteria were purified of protein and the target product was detected. Moreover, the yield of gluconic acid was increased by optimizing the culture conditions and induction conditions.
The innovative points of this paper are as follows:
(1) Determination of the assay method for determining the content of glucosinolates in the fermentation broth, and research on the stability of the assay method.
(2) The conditions of carbon source in the fermentation medium, pH of culture initiation, inoculum amount, and induction intensity were optimized to produce glucosinolates with high yield. The recombinant bacteria were also supplemented and fermented in a 30 L fermenter according to the optimized conditions in shake flasks.
(3) The permeability of the cell membrane of the high-yielding recombinant bacteria was changed by physical and chemical methods. The physical method used cell freezing and thawing and ultrasonication to change the permeability of the cell membrane, and optimized conditions such as buffer system, buffer system pH, and so on. The chemical method used Cetyltrimethylamine bromide (CTAB) surfactant and toluene organic reagent to change the cell permeability, and optimized the concentration of permeabilizer CTAB and toluene.
2. Materials and methods
2.1. Plasmids, strains and the culture medium
E. coli DH5α was the cloning host for plasmid preparation and vector construction. E. coli BL21 (DE3) was selected being the expression host. Having the capacity of coexpressing two target genes, expression vector pETDuet-1 (EMD Biosciences, Novagen) was used for harboring the candidate udh genes. LB medium (0.5% yeast extract, 1% tryptone and 1% NaCl) was prepared for bacteria cultivation. The modified basal salts medium (BSM) , composed of 2% yeast extract, 2.5% glucose, 0.25% KH2PO4, 0.35% (NH4)2SO4, 0.055% MgSO4·7H2O, 0.000008% FeSO4·6H2O, was adopted for bacteria fermentation and glucaric acid biosynthesis study. Ampicillin sodium (final concentration, 100 μg·mL-1) were added to the culture broth for selection of transformants and plasmid maintenance.
2.2. Reagents and chemicals
Gluaric acid and glucuronic acid (Sigma-Aldrich, Beijing, China), Affi-Gel boronate media (Bio-Rad, Beijing, China), Ampicillin sodium and isopropyl-β-d-thiogalactoside (IPTG) (TaKaRa, Dalian, China), mercaptoethanol, imidazole, boric acid and other chemicals were bought from Aladdin (Shanghai, China).
2.3. Construction of the expression vector pETDuet-2×Udh
Udh genes, from Pseudomonas putida (GenBank: LT799039.1), and Psudh, from Pseudomonas syringae (GenBank: EU377538.1), were synthesized by Shanjing Biotech Corporation (Shanghai, China) and incorporated into pETDuet-1 vector after codon optimization (http://www.jcat.de/Result.jsp) according to the codon preference of E. coli. The synthesized Ppudh and Psudh coding sequences were introduced into the express vector pETDuet-1 at the SalI/NotI sites and NdeI/XholI sites respectively to get the expression vector pETDuet-2×Udh. There is a His-tag in the C terminal of the Udh gene that is used for protein separation using Ni2+-chelating affinity chromatography. The correctness of recombinant pETDuet-2×Udh vector was verified by restriction enzyme digestion and agrose electrophoresis. The sequence validity of Ppudh and Psudh genes was checked by DNA sequencing.
2.4. Expression of the Udh genes in E. coli BL21
The expression vector pETDuet-2×Udh were transformed into E. coli BL21 (DE3). The fresh colony was cultured at 37 ℃ with 1 mmol IPTG in LB medium supplemented with 100 μg· mL-1 ampicillin when OD600 value reached 0.6, followed by growth for another 18 h at 32 ℃.
The BL21 cells from a 1 mL aliquot culture were collected by centrifugation at 12000 rpm for 5 min and discarded the supernatant. Add 250 μL 1×PBS (140 mmol NaCl, 2.7 mmol KCl, 10 mmol Na2HPO4, 1.8 mmol KH2PO4, pH 7.0) buffer and 250 μL 2×loading buffer (120 mmol Tris-HCl pH 6.8, 20% glycerol, 4% SDS, 3% mercaptoethanol, 0.02% bromophenol blue) to resuspended pellet. The mixed sample was boiled in a water bath (100 ℃) for 25 min and centrifuged at 12000 rpm for 5 min at 4 ℃[19]. Adding 15 μL supernatant from each sample into SDS-12% polyacrylamide gels then started to electrophoresis in 1×Tris-glycine buffer. Polyacrylamide gels were stained with coomassie brilliant blue R250, which made the stained protein bands were visualized.
2.5. Purification of recombinant urinate dehydrogenase proteins
His-tagged proteins can be purified by immobilized metal ion affinity chromatography (IMAC) [20]. Cells were harvested by centrifugation at 12000 rpm for 10 min. Cells resuspended in PBS buffer were disrupted via 10 cycles of sonication (3 s of sonication, 4 s of cooling in ice) using an ultrasonic cell disrupter. The mixture was then centrifuged at 12000 rpm for 10 min at 4 ℃ and stating buffer was added (25 mmol Tris-HCl, 10 mmol imidazole, and 100 mmol NaCl, pH 7.5) to supernatant. The Ni-NTA column was equilibrated with 2 column volumes of ddH2O and stating buffer. The treated supernatant was loaded into the empty column at a flow rate of 1.0 mL·min-1, and then washed with two column volumes of different concentrations stating buffer. Subsequently, the column was eluted with the 500 mmol imidazole and staling buffer and preserved in ethanol. The fraction solutions were analyzed SDS-PAGE electrophoresis.
2.6. Optimization of recombinant protein expression conditions
The effects of temperature, IPTG concentration, induction time and OD600 on the recombinant E. coli BL21(DE3)-pETDuet-2×Udh protein of protein expression was evaluated under the assay conditions at various temperature values ranging from 24 ℃ to 32 ℃, different induction time from 6 h to 22 h, IPTG concentration ranging from 0.1 mmol to 1.0 mmol and OD600 0.6 to 2.5.
The induction culture liquid was centrifuged at 12000 rpm for 10 min, and precooled 25 mmol PBS was used to resuspended precipitation. And then ultrasonic breaks the cells (3 s of sonication, 4 s of cooling in ice) until the bacteria turns from white to transparent and not sticky. The ultrasonic broken bacterial, liquid was centrifuged (4 ℃, 12000 rpm, 15 min) and the supernatant and precipitation were collected respectively. Next, take 1 mL of supernatant and precipitation solution respectively, add 1 mL of 2×loading buffer, and boil for 10 min. After centrifugation, it was used for SDS-PAGE analysis.
2.7. Biosynthesis of glucaric acid from glucuronic acid with recombinant BL21 harboring the expression vector pETDuet-2×Udh
A fresh colony of E. coli BL21 was cultured overnight in Luria-Bertani (LB) broth supplemented with ampicillin (100 μg·mL-1) at 37 ℃, being oscillated at 200 rpm. Then the overnight culture was inoculated into 250 ml mineral medium in a 1 L flask with 10 g L-1 glucuronic acid (as the substrate) and 100 μg mL-1 Ampicillin, 1% (v/v) of the culture when the OD600 value reached 0.6, IPTG was added to the culture at a final concentration of 0.4 mmol at 26 ℃, being oscillated at 200 rpm. To confirm glucaric acid production as a product of glucuronic acid bioconversion, fermentation liquor was sampled and analyzed by HPLC and MS.
2.8. MS and HPLC analysis of the reaction product
The culture supernatant was pretreated with a boric acid affinity gel to remove interfering substances. Affi-Gel boronate gel is broronate-derivatized polyacrylamide gel with an affinity for adjacent cis hydroxyl (cis-diol) groups[21]. It binds to cis-diol molecules on gluconic acid to remove other interfering substances. Fermentation liquor centrifugation at 12000 rpm for 5 min. Affi-gel and 1 mol·L-1 potassium phosphate buffer solution were added to the supernatant, which was washed with 80 mmol·L-1 potassium phosphate-20 mmol·L-1 boric acid buffer (pH 7.0) to remove the interference substances. Then, supernatant was eluted with 0.1 mol·L-1 HCl and adjusted pH with 1 mol·L-1 NaOH to neutral. Finally, supernatant was filtered by 0.22 um filter membrane for mass spectrometry and liquid phase analysis. The HPLC separation was performed using an Aminex HPX-87H column (300×7.8 mm, Bio-Rad Laboratories, Hercules, CA USA)[22]. The mobile phase was 5 mmol·L-1 dilute sulfuric acid. The flow rate was 0.5 mL·min-1, the elution was isogradient. The column temperature was 55 ℃. The injection volume was 10 μL. The detector was ultraviolet detector and the detection wavelength was 210 nm. MS was performed by scanning the m/z range from 100 to 1000 at 10 s/scan in both negative and positive ion detection mode. Deionized water was used as the mobile phase at a flow rate of 0.3 mL·min-1, at 30 ℃.
2.9. Preliminary fermentation of recombinant BL21 for glucaric acid biosynthesis in a 30 L tank
Seed culture was prepared in 500 mL baffled shake flasks containing 50 mL of LB medium at 36.5 ℃ with an oscillation rate of 220 rpm and OD600 reached 5.0. A 1% (v/v) inoculum of seed culture was transferred to a 30 L fermenter (Zhenjiang East Biotech Equipment & Technology Co. Zhenjiang, Jiangsu, China) with an initial 15 L fermentation medium. The modified basal salts medium which contains 5 g·L-1 yeast extract, 30 g·L-1 glucose, 2.5 g·L-1 KH2PO4, 8 g·L-1 (NH4)2SO4, 0.55 g·L-1 MgSO4·7H2O, 0.08 mg·L-1 FeSO4·6H2O was used as fermentation medium and ampicillin (100 μg·mL-1) were used for cell selection and maintenance. At the beginning of fermentation, the reactor temperature was controlled at 32 ℃ for rapid cell growth. When the residual glucose concentration was about 10 g·L-1, 700 g·L-1 glucose fed-batch feeding was started at a constant feeding rate of 50 mL·h-1. IPTG was added to the culture at a final concentration of 0.5 mmol when OD600 reached 30. Glucuronic acid (30 g·L-1) was added at a rate of 50 mL·h-1 when the temperature was reduced to 28 ℃.The reaction stopped when glucose was consumed slowly and ammonium hydroxide was not needed to maintain the pH concentration. The concentrations of glucuronic acid were assayed by spectrophotometer every several hours. During the fermentation, the culture pH was controlled at 6.8~7.2, with the automatic addition of 30% ammonium hydroxide while agitation speed, dissolved oxygen and tank pressure was maintained at 750 rpm, 30% and 0.05 MPa respectively.
3. Results
3.1. Screening results of recombinant bacteria
Figure 2A is the growth diagram of blank BL21 bacteria with ampicillin added, B is the growth diagram of transformed BL21 recombinant bacteria with ampicillin added. As can be seen from Figure 2, the transformed bacteria grew in the medium containing ampicillin resistance, indicating that the plasmid was successfully transferred into BL21 bacteria. The next step in the experiment can be carried out.
3.2. Growth curve of recombinant Escherichia coli
It can be seen from Figure 3 that the light absorption value of recombinant bacteria at 600 nm reaches the maximum at about 18 h, and then slightly decreases and tends to be stable in general. It can be seen that the recombinant bacteria were in a stable growth stage at 18 h, and the concentration of bacterial liquid reached the highest at this time.
3.3. Comparative analysis of the conversion ability of different large intestine hosts to produce glucose dicarboxylic acid
As can be seen from Figure 4, gluconic acid can be detected in the fermentation fluid of recombinant strains BL21/pETDuet-Ppudh, BL21/pETDuet-Psudh and BL21/pETDuet-2×Udh, indicating that glucuronic acid dehydrogenase is correctly folded and expressed in E. coli BL21. As can be seen from the Figure 4, the content of gluconic acid tends to be stable around 20 h after fermentation, and the content of gluconic acid in the fermentation broth of recombinant bacterium BL21/pETDuet-Ppudh is 0.16 g·L-1. The content of gluconic acid in the fermentation broth of recombinant bacterium BL21/pETDuet-Psudh was 0.20 g·L-1, and that of recombinant bacterium BL21/pETDuet-2×Udh was 0.34 g·L-1. Therefore, recombinant strain BL21/pETDuet-2×Udh was selected as the starting strain to produce gluconic acid.
3.4. Analysis of the expression of recombinant protein
To confirm the induced expression of Udhs protein in E. coli, target proteins were separated by SDS-PAGE gels (Figure 5). Empty vector Petdute-1 was introduced into Escherichia coli without Udh gene as control. The expressed proteins had a MW of 34 kDa with high expression in the transformed cells, which was concordant with expected molecular weight of the two expressed proteins with 6×His tag (the native Ppudh and Psudh had 268 AA with a speculated MW of 29.3 kDa and 275 AA with a speculated MW of 30.6 kDa respectively).
3.5. Purification and induction conditions of Udhs expression construct
After the sample was combined with the resin, different concentrations imidazole elution buffer was used to elute Udh from the column. The flow-through of different concentrations were collected, and the protein was quantified with coomassie bright blue (G250) to determine the OD595 absorbance and selected eluent with higher value for SDS-PAGE (Figure 2b). Lane3 was eluted with 100 mmol imidazole, indicating that the target protein was successfully expressed in E. coli BL21.
Protein expression can be divided into extracellular protein and intracellular protein. The soluble expression conditions such as induction temperature, induction time and IPTG concentration can improve the contents of extracellular protein and inclusion body protein (Figure 6). As shown in Figure 6b, when the induction temperature was 26 ℃, Udh expression was the highest in both soluble protein and inclusion body protein. According to Figure 6c, the expression of Udh in both soluble protein and inclusion body protein was the highest when the induction time was 6 h. When the induction time was OD600=0.6, Udh expression in both soluble protein and inclusion body protein was the highest. As can be seen from Figure 6c, when the concentration of IPTG inducer was 0.4 mmol, Udh expression was the highest in both soluble protein and inclusion body protein. As can be seen from Figure 6d, Udh expression is the highest in both soluble protein and inclusion body protein when medium OD600 is 0.6 and IPTG inducer is added. The optimal induction conditions were as follows: 0.4 mmol IPTG was added into the cell culture medium with OD600 value of 0.6 and induced at 26 ℃ for 6 h.
3.6. Production analysis of glucaric acid
MS was performed to analyze the exact molecular weight of the products (Figure 7a,b). The result showed that glucaric acid was characterized by its masses (m/z=209) and peaks of samples corresponded to masses of the glucaric acid standard. This further demonstrated that the recombinant E. coli BL21(DE3)-pETDuet-2×Udh strain was successfully constructed to produce glucuronic acid and glucuronic acid as substrate.
High performance liquid chromatography (HPLC) is a common method for the determination of glucosinolates. method for the determination of glucosinolates, which is characterized by simple sample handling, accurate quantification, and good results in the determination of glucosinolates. It is characterized by simple sample handling and accurate quantification. In our findings, HPLC was performed to analyze the production of glucaric acid (Figure 7c,d). Peak time of gluconic acid is 9.077 min, peaks time of samples is 9.080 min. The result showed that peaks of samples corresponded to time of the glucaric acid standard. This method can be used for accurate quantitative analysis of products.
The results of previous studies showed that the peak times of gluconic acid and glucosinolates were similar under the separation conditions of the HPLC method, and they showed one peak on the chromatogram. Therefore, the HPLC method was not able to separate them completely, and thus, they could not be quantified and analyzed accurately.
3.7. Production of glucaric acid with 30 L tank fermentation strategy
High performance liquid chromatography (HPLC) is a common method for the determination of glucosinolates, which is characterized by easy sample handling and accurate quantification. Ion chromatography detection is a new means of detecting glucosinolates. The separation principle is that the detected substances are separated by a column carrying opposite charges, and then detected by an electrochemical detector or conductivity detector through the intensity of the electrical signal. The method has the advantages of simplicity, rapidity, high sensitivity and accurate results, and has a greater advantage in the detection of organic acids. Analyzing the by-products of glucose nitrate oxidation by ion chromatography, the separation of some gluconic acid derivatives such as gluconic acid, glucosinolates and glucuronic acid, which are difficult to be separated by HPLC method, was greatly improved.
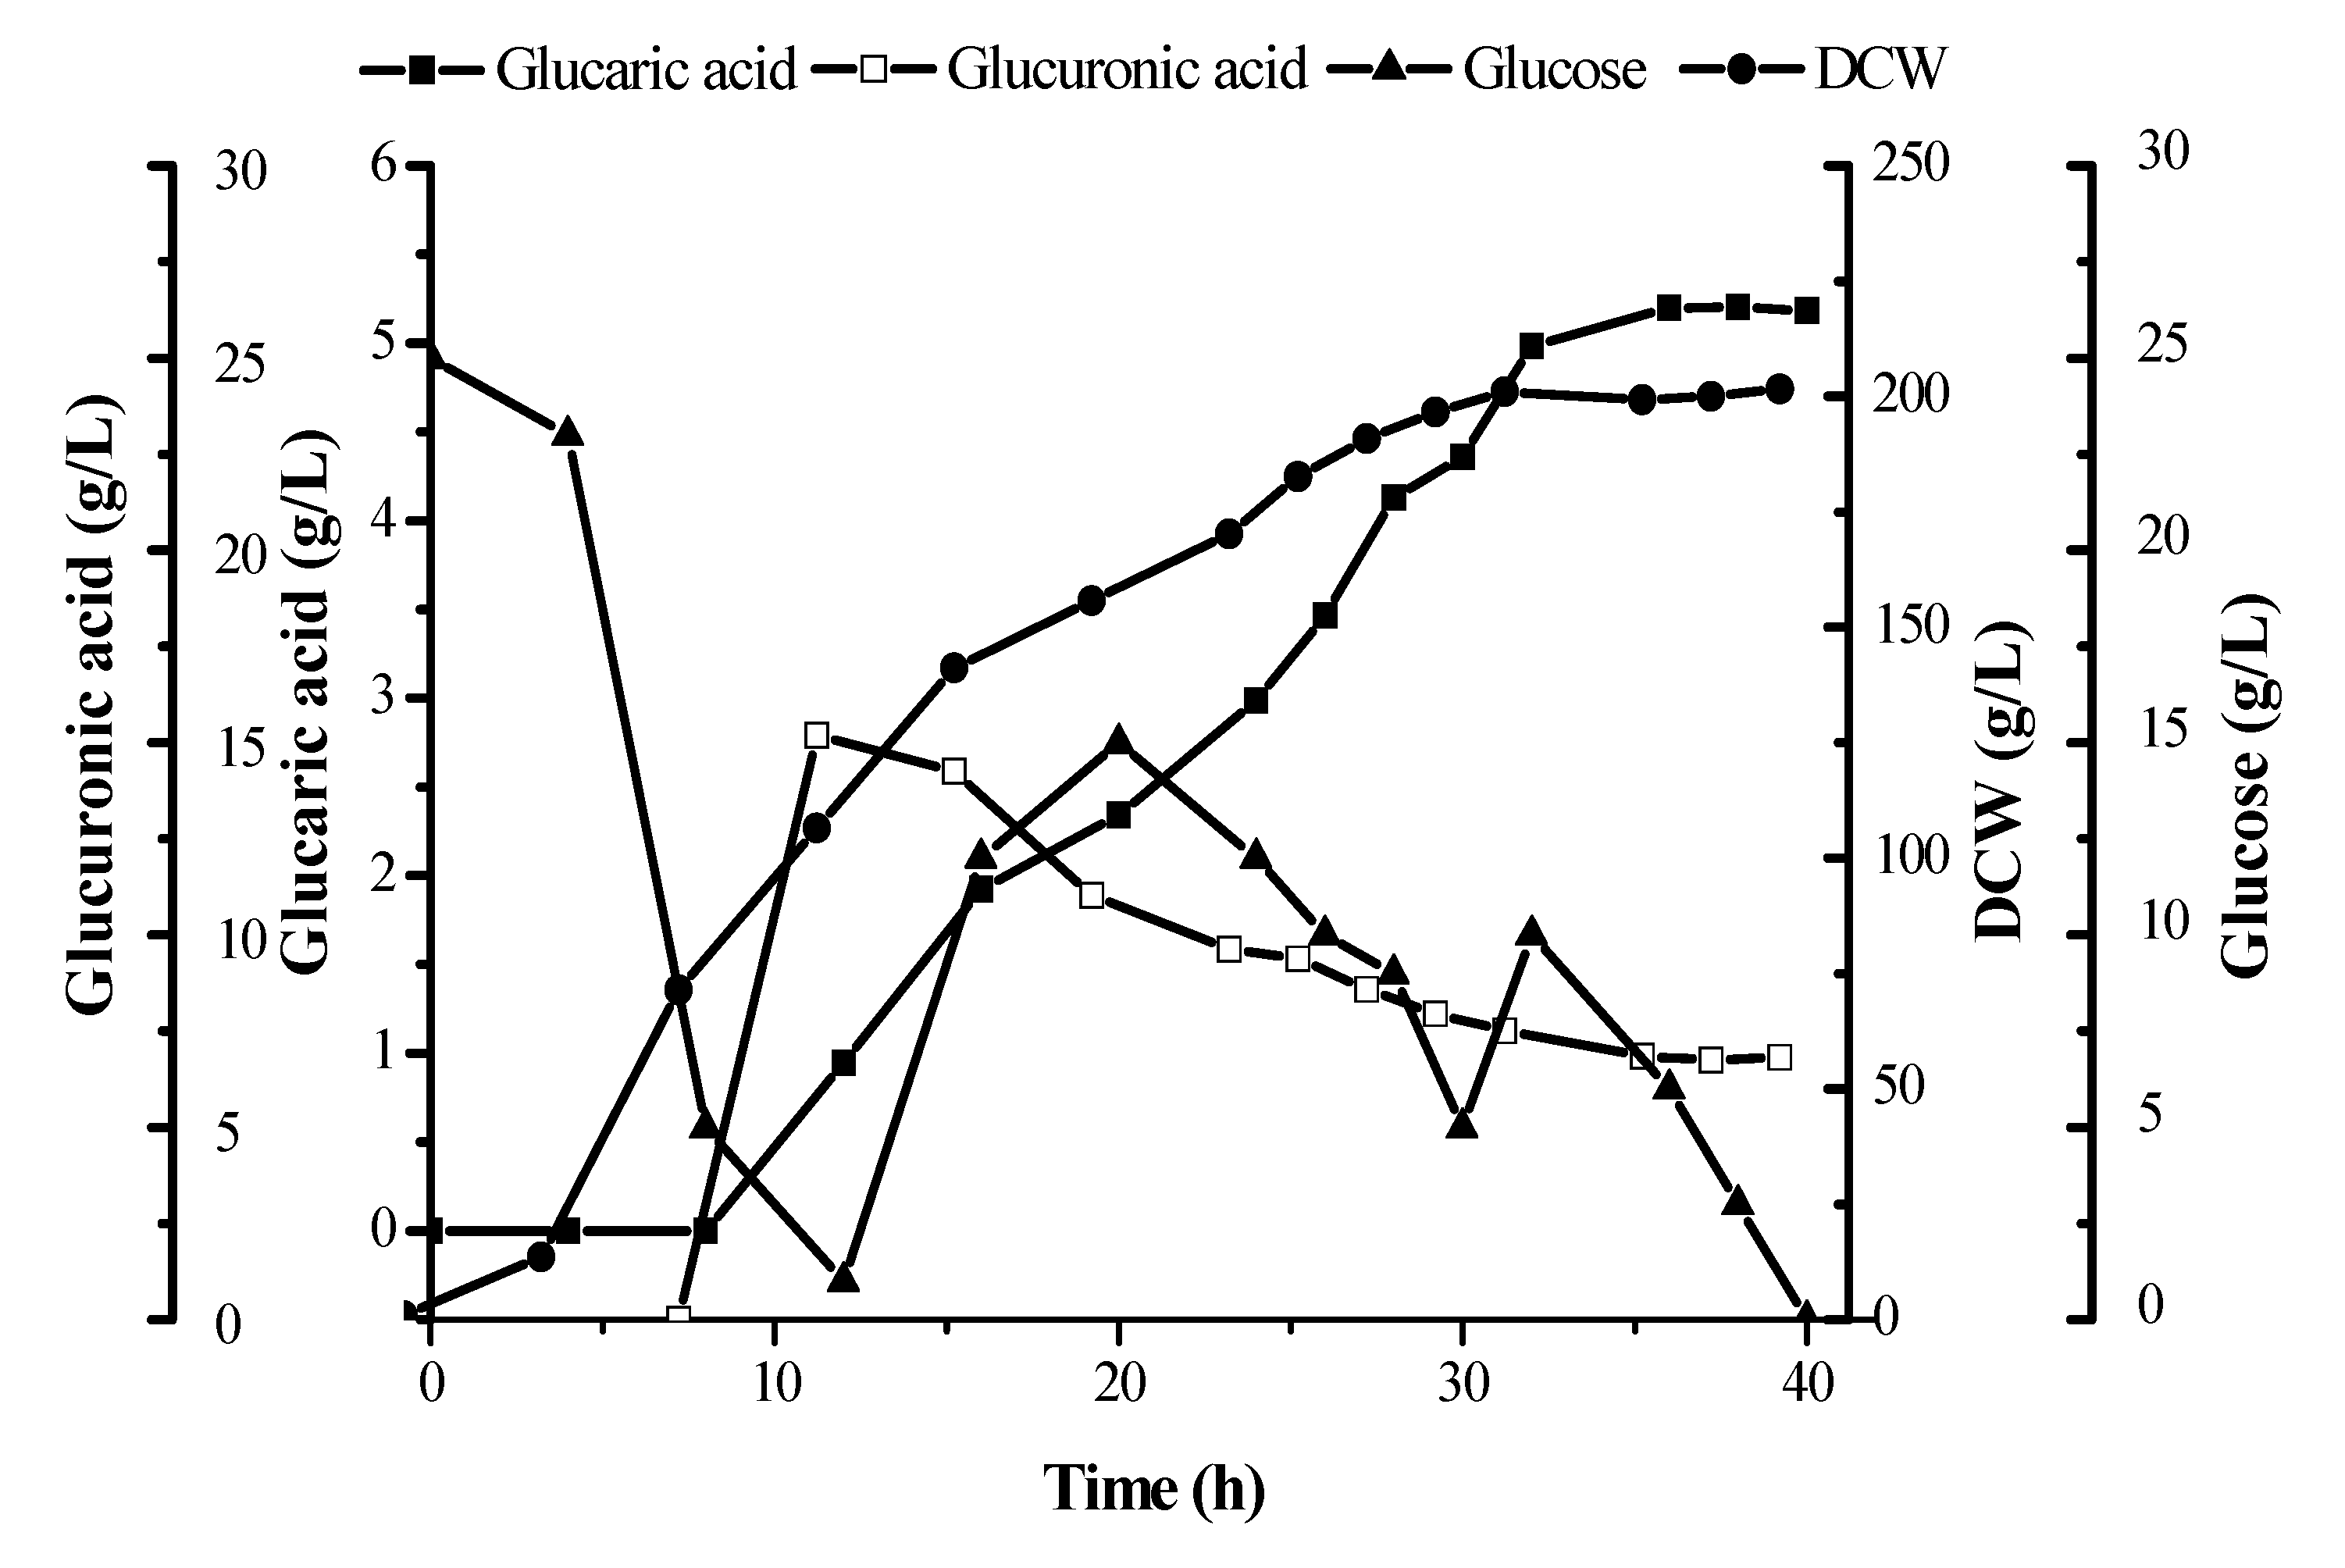
In this paper, the linear relationship between the five kinds of different concentrations of glucaric acid standard solution and the peak area was obtained. The resulting linear equation was found to by Y=0.0685X+0.0126 (Y stands for glucaric acid concentration, unit: mg L-1; X stands for peak area) related coefficient R²=0.999. Based on this, the yield of the BL21(DE3)-pETDuet-2×Udh strain glucaric acid was determined to be (5.24±0.015) g·L-1 (Figure 8).
The synthesis of glucosinolates by microbial fermentation has many advantages over traditional chemical methods, such as being more environmentally friendly and greater potential for low-cost production. The synthesis of glucosinolates by all-biological methods reported so far has been carried out mainly in Escherichia coli and some fung.
4. Conclusions
In conclusion, the Udh genes from Pseudomonas putida and Pseudomonas syringae were expressed in a recombinant E. coli with a MW of 34 kDa. Systematic optimization of the expression conditions to obtain maximum expression, qualitative and quantitative detection of the products were carried out by MS and HPLC. Finally, the production of glucaric acid substantially reached 5.24±0.015 g·L-1 in fed-batch cultures in a 30 L tank and the fermentation reaction time of recombinant E. coli to produce glucaric acid up to 5 g·L-1 was about 40 h, which was shorter than that of other microorganisms. Therefore, this pathway has potential industrial application value for microbial fermentation of glucaric acid. In the further study, conditions of fed batch fermentation need to be optimized for better glucaric acid production.
Based on the results of this paper and those of published papers,future research can be improved in the following aspects:
Replacement of safe strains. In this experiment, glucuronide dehydrogenase was constructed and expressed in E. coli, but E. coli was not regarded as a safe strain by GRAS and limited its application in the production of food-grade chemicals. Therefore, safe microbial strains can be considered for glucuronic acid production.
Multifactorial analysis of the method of cell membrane permeabilization. Combine the permeabilization methods to improve the production of glucosinolates to increase the permeability of cell membrane as much as possible without breaking the integrity of the cells in the conversation, so as to further improve the production of glucosinolates.
Addition of nicotinamide to the culture medium. The production of glucosinolate requires NAD+ cofactors, and nicotinamide is a precursor for synthesizing NAD+, which is the most direct way to replenish NAD+. Compared to other precursors, nicotinamide bypasses the nicotinamide phosphoribosyltransferase (NAMPT) restriction enzyme, and is able to replenish NAD+ rapidly, and the addition of nicotinamide to the fermentation broth has the potential to increase the content of glucosinolate.
Author Contributions
Conceptualization, Xinchao Yang; methodology, Linlin Niu; project administration, Chunjiang Ye; software, Yuanxiu Wang; validation, Yuehui Liu; formal analysis, Fang Wang; investigation, Naxin Sun; writing—original draft preparation, Linlin Niu; writing—review and editing, Xinchao Yang. All authors have read and agreed to the published version of the manuscript.
Funding
This research was funded by Doctor's fund of University of Jinan, grant number: XBS2020.
Data Availability Statement
Data is unavailable due to privacy or ethical restrictions.
Acknowledgments
This study was financially supported by the following projects: Shandong postdoctoral innovation project.
Conflicts of interest
The authors declare no conflict of interest.
References
- Smith T, Denton T, Zhang J. Synthesis and characterization of higher molecular weight stereorandom poly (d-glucaramides) from 1:1 alkylenediammonium d-glucaric acid[C]. 234th ACS National Meeting, Boston, M A, United States.
- Liu Y, Gong X, Wang C. Production of glucaric acid from myoinositol in engineered Pichia pastoris[J]. Enzyme and Microbial Technology, 2016, 34, 8–16.
- Chen N, Wang J, Zhao Y. Metabolic engineering of Saccharomyces cerevisiae for efficient production of glucaric acid at high titer[J]. Applied Biochemistry and Biotechnology. 2018, 17, 67.
- Bauer F, Coenen L, Hansen T. Technological innovation systems for biorefineries: a review of the literature[J]. Biofuels Bioproducts & Biorefining. 2017, 11, 534–548.
- Dwivedi C, Heck WJ, Downie AA. Effect of calcium glucarate on beta-glucuronidase activity and glucarate content of certain vegetables and fruits[J]. Biochemical medicine and metabolic biology. 1990, 43, 83–92.
- Ho KJ. A large-scale purification of beta-glucuronidase from human liver by immunoaffinity chromatography[J]. Biotechnology & Applied Biochemistry. 2011, 14, 296–305.
- Moon TS, Yoon SH, Ching MJTM. Enzymatic assay of d-glucuronate using uronate dehydrogenase[J]. Analytical Biochemistry 2009, 392, 183–185.
- Singh J, Gupta KP. Induction of apoptosis by calcium D-glucarate in 7,12-dimethyl benz [a] anthracene-exposed mouse skin[J]. Journal of Environ Pathol Toxicol Oncol 2007, 26, 63–73.
- Su HH, Guo ZW, Wu XL. Efficient bioconversion of sucrose to high-value-added glucaric acid by In vitro metabolic engineering[J]. ChemSusChem. 2019, 12, 2278–2285.
- Tae Seok M, Sang-Hwal Y, Lanza AM. Production of glucaric acid from a synthetic pathway in recombinant Escherichia coli [J]. Applied & Environmental Microbiology. 2009, 75, 589.
- Shiue E, Prather KLJ. Improving d-glucaric acid production from myo -inositol in E. coli by increasing MIOX stability and myo -inositol transport[J]. Metabolic engineering. 2014, 22, 22–31.
- Chung H, Yang JE, Ha JY. Bio-based production of monomers and polymers by metabolically engineered microorganisms[J]. Current Opinion in Biotechnology. 2015, 36, 73–84.
- Chen Y, Nielsen J. Biobased organic acids production by metabolically engineered microorganisms[J]. Current Opinion in Biotechnology. 2016, 37, 165–172.
- Liu Y, Gong X, Wang C. Production of glucaric acid from myo -inositol in engineered Pichia pastoris[J]. Enzyme & Microbial Technology 2016, 91, 8–16.
- Qu YN, Yan HJ, Guo Q. Biosynthesis of d-glucaric acid from sucrose with routed carbon distribution in metabolically engineered Escherichia coli[J]. Metabolic engineering. 2018, 47, 393–400.
- Gupta A, Hicks MA, Manchester SP. Porting the synthetic D-glucaric acid pathway from Escherichia coli to saccharomyces cerevisiae[J]. Biotechnology Journal. 2016, 11, 1201–1208.
- Teng F, You R, Hu M. Production of d-glucuronic acid from myo-inositol using Escherichia coli whole-cell biocatalyst overexpressing a novel myo-inositol oxygenase from thermothelomyces thermophile[J]. Enzyme and microbial technology. 2019, 127, 70–74.
- Li Y, Xue Y, Cao Z. Characterization of a uronate dehydrogenase from thermobispora bispora for production of glucaric acid from hemicellulose substrate[J]. World journal of microbiology & biotechnology. 2018, 34, 102.
- Janarthini R, Wang X, Chen L. A tobacco-derived thymosin beta4 concatemer promotes cell proliferation and wound healing in mice[J]. Biomed Research International. 2016, 6, 1–8.
- Rubiyana Y, Santoso A, Batubara I. Comparison of immobilized metal affinity chromatography Ni-NTA and Co-TALON for the purification of recombinant human erythropoietin[J]. Makara Journal of Science . 2015, 19, 137.
- Yang Y, Mitri K, Zhang C. Promiscuity of host cell proteins in the purification of histidine tagged recombinant xylanase a by IMAC procedures: a case study with a Ni(2+)-tacn-based IMAC system[J]. Protein expression and purification. 2019, 162, 51–61.
- Poon R, Villeneuve DC, Chu I. HPLC determination of d-glucaric acid in human urine. Journal of analytical toxicology[J]. Journal of Analytical Toxicology. 1993, 17, 146–150.
Figure 1.
Biosynthesis of glucaric acid from glucuronic acid catalyzed by uronate dehydrogenases.
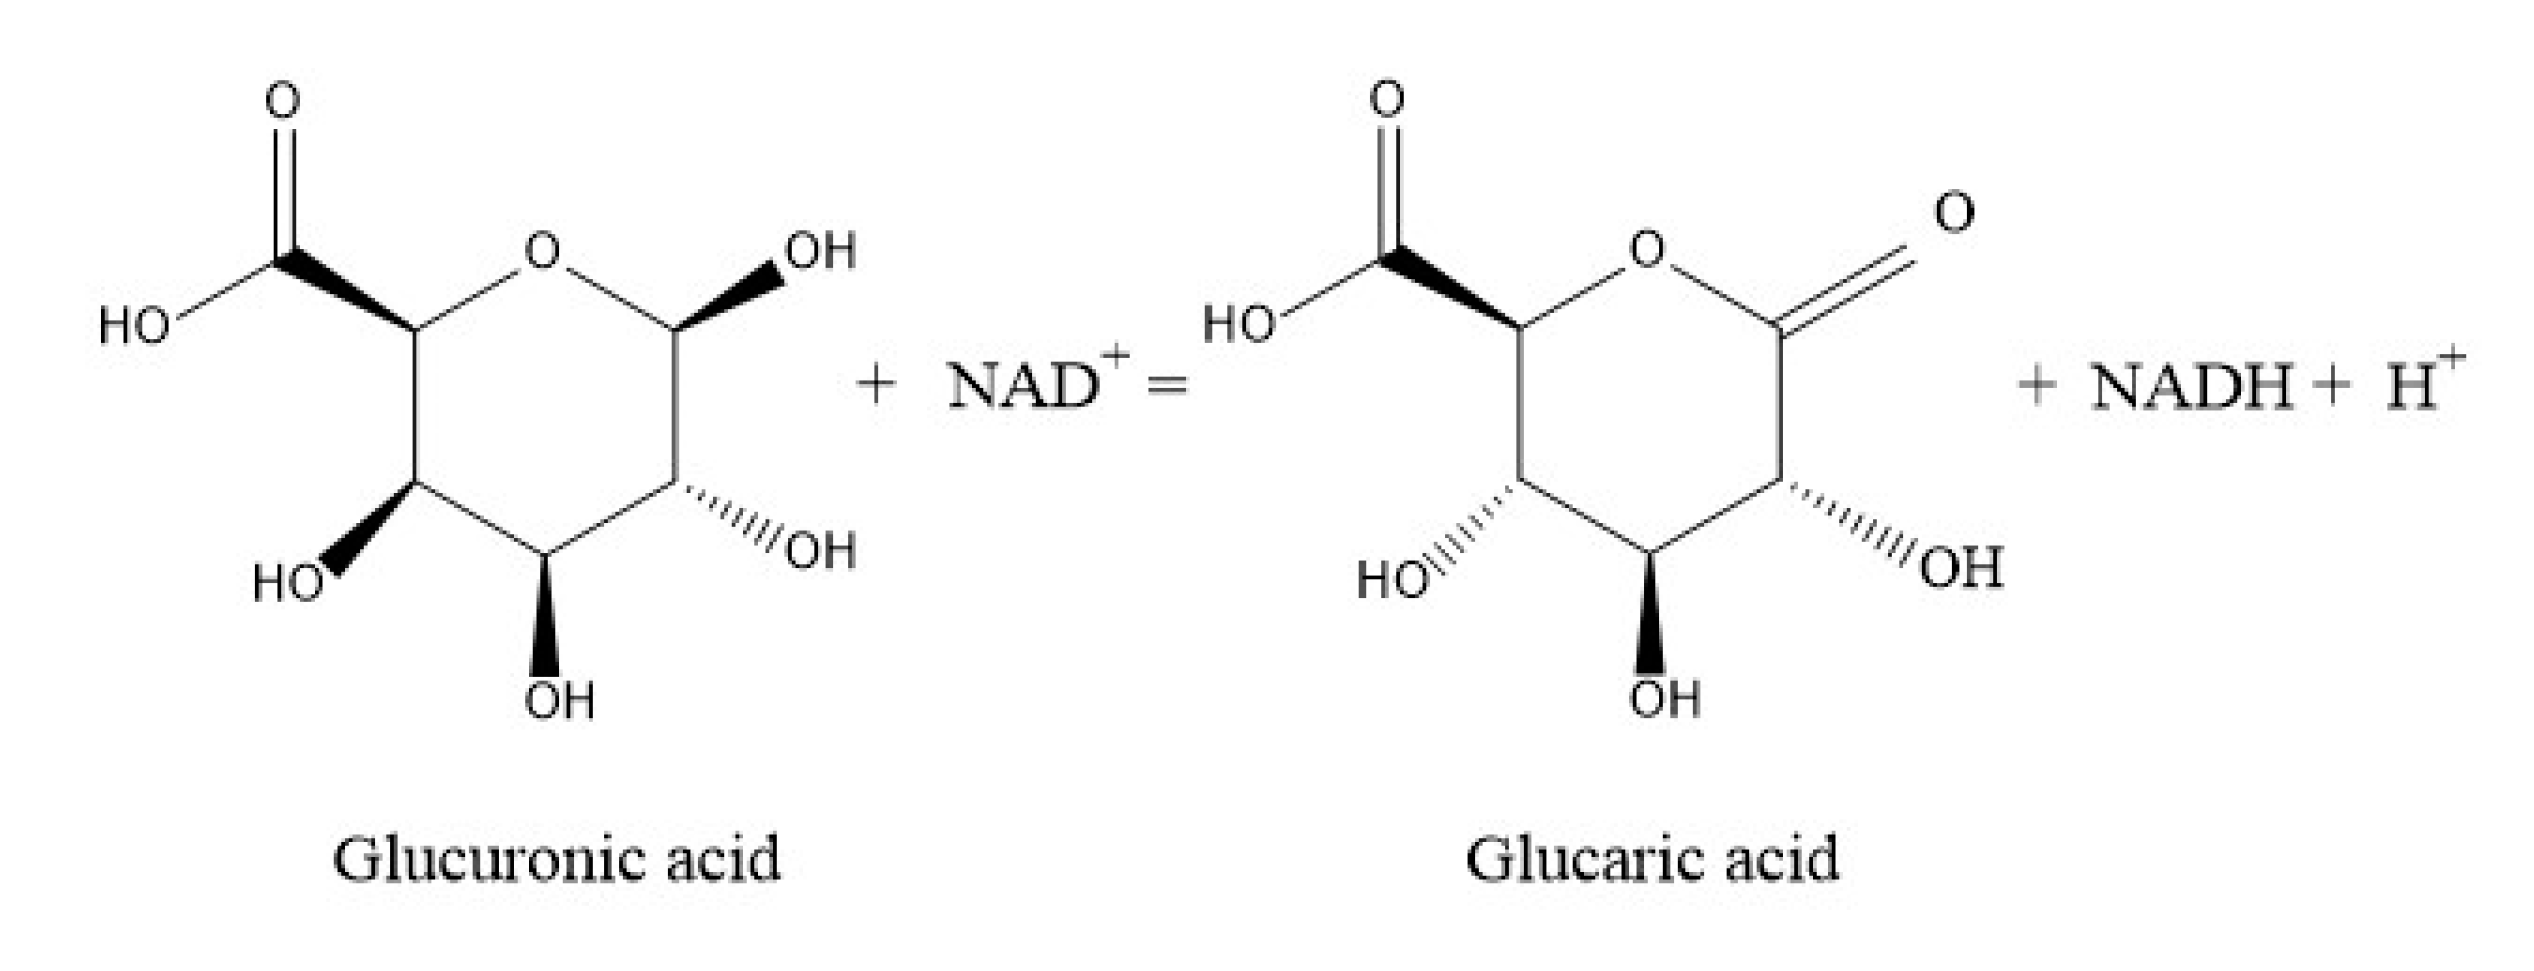
Figure 2.
(A): the growth diagram of blank BL21 bacteria with ampicillin added, (B): the growth diagram of transformed BL21 recombinant bacteria with ampicillin added.
Figure 2.
(A): the growth diagram of blank BL21 bacteria with ampicillin added, (B): the growth diagram of transformed BL21 recombinant bacteria with ampicillin added.
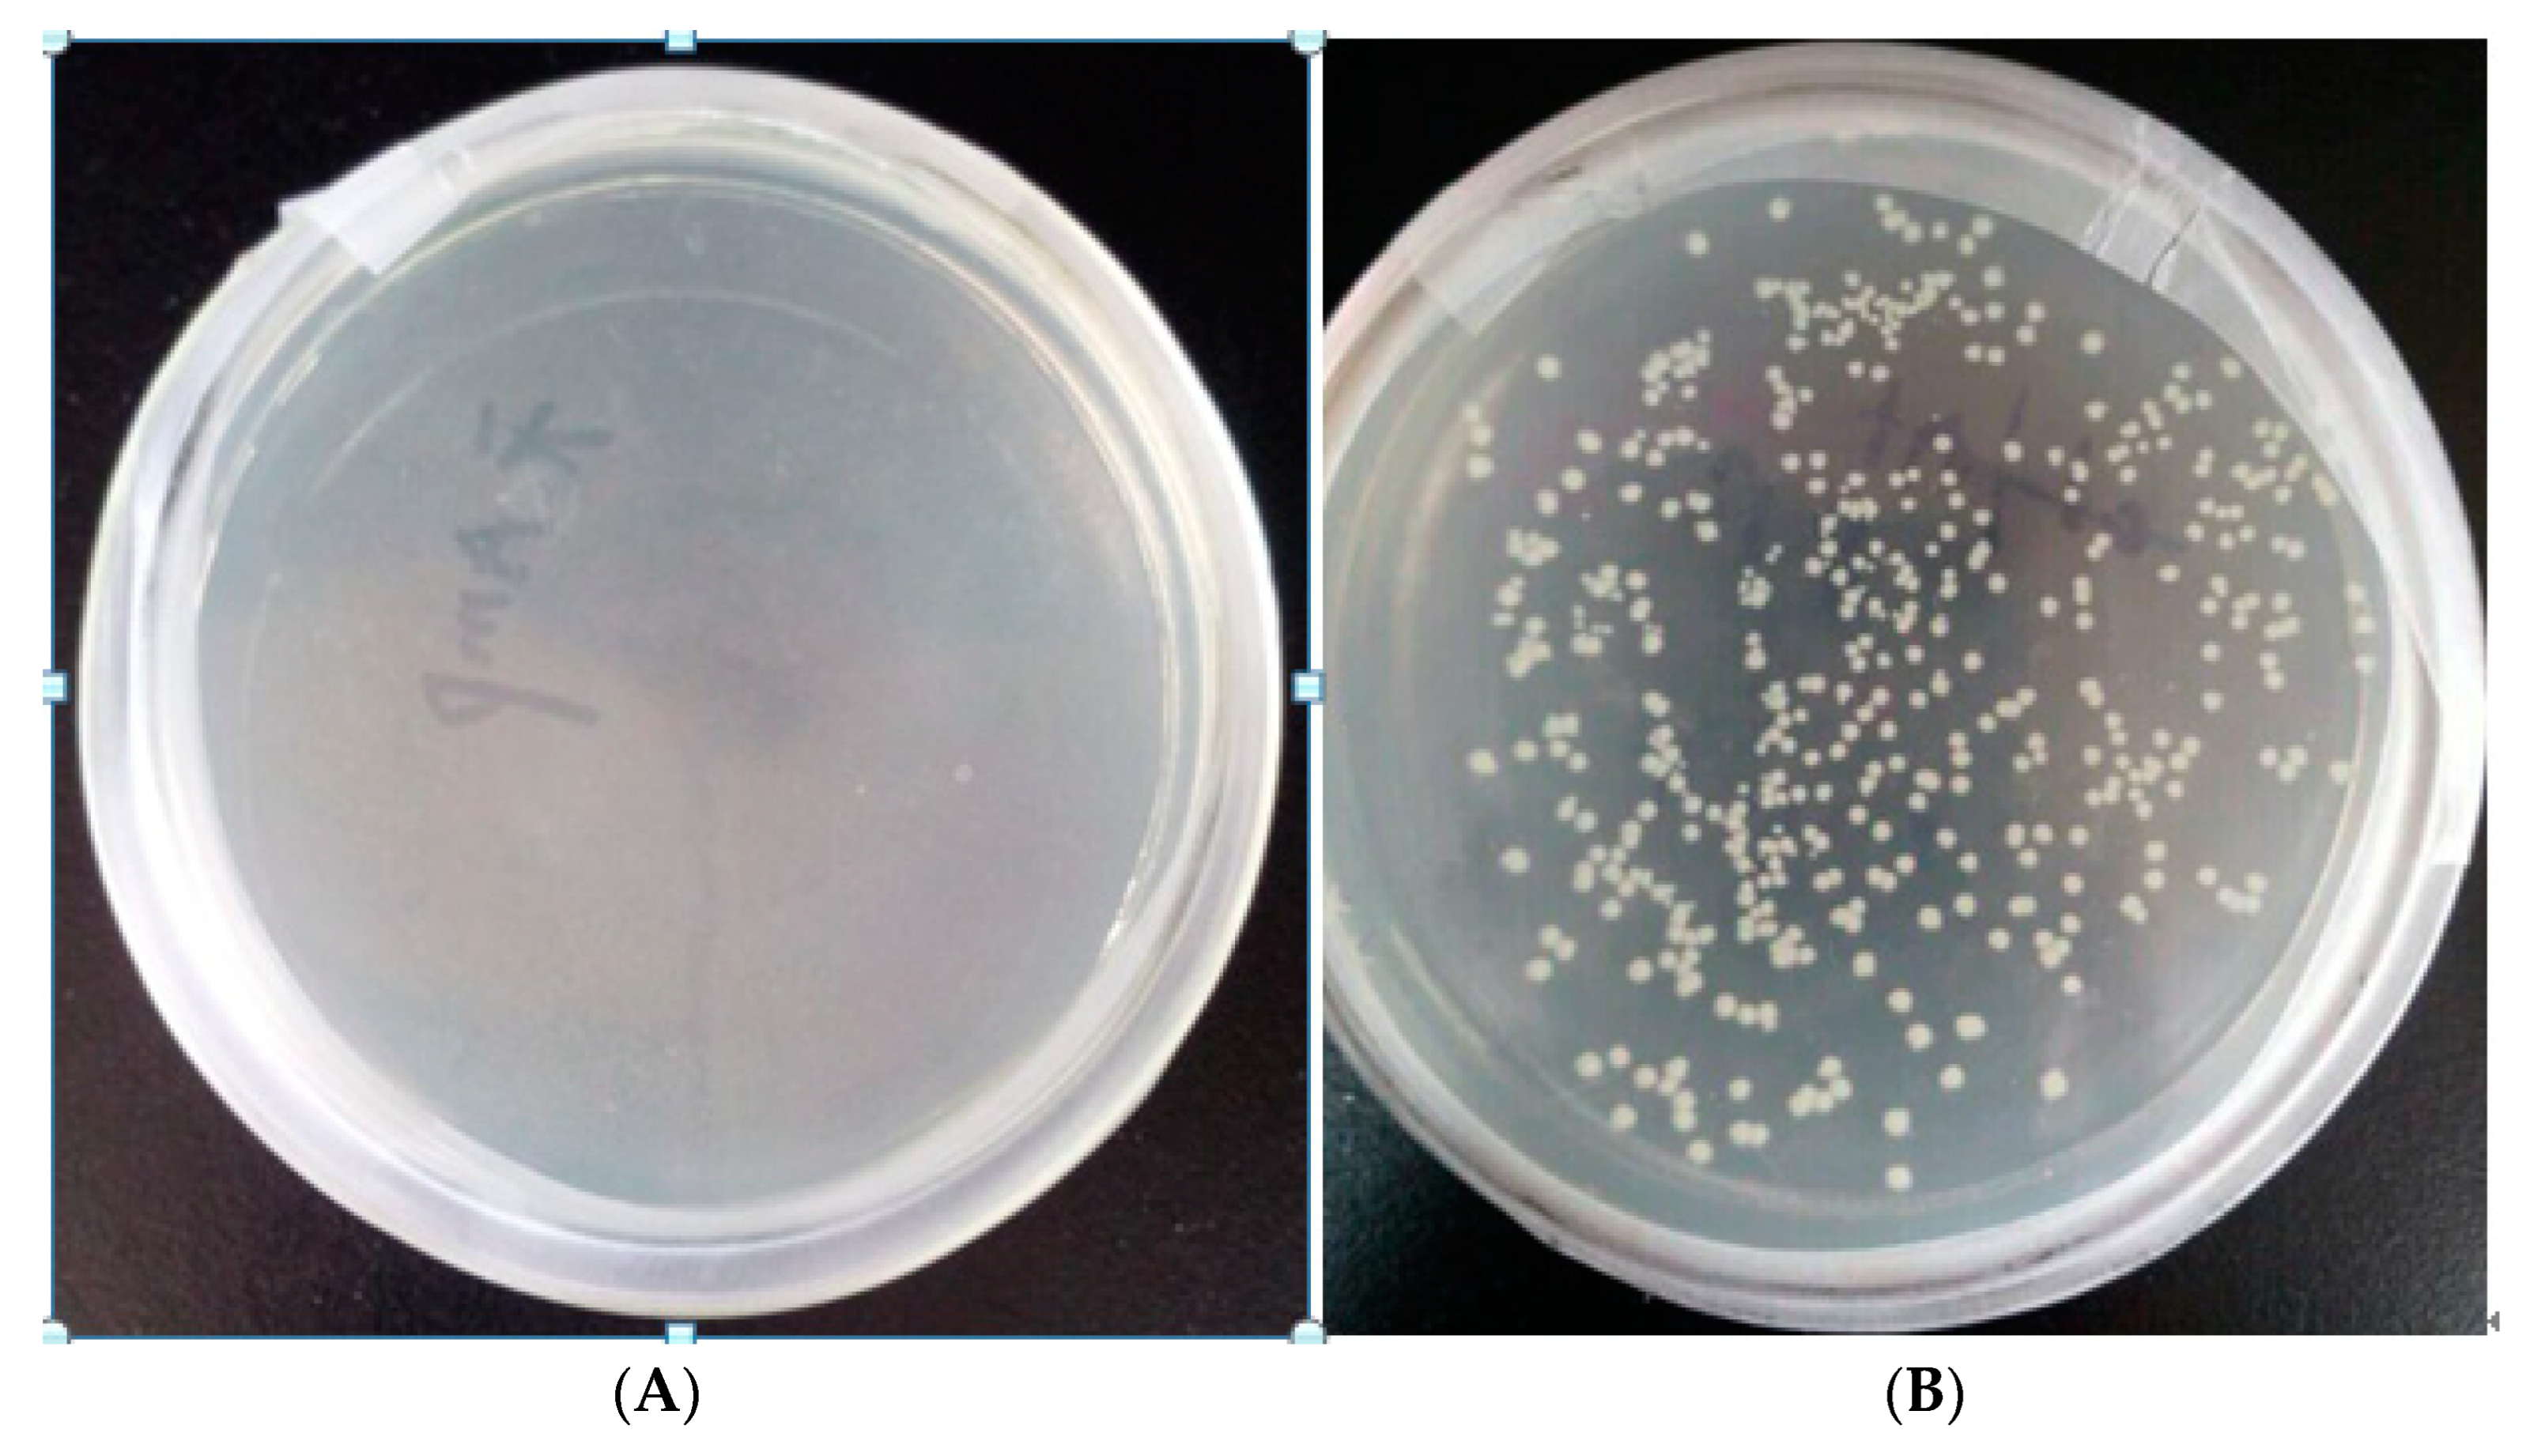
Figure 3.
Growth curve of recombinant Escherichia coli.
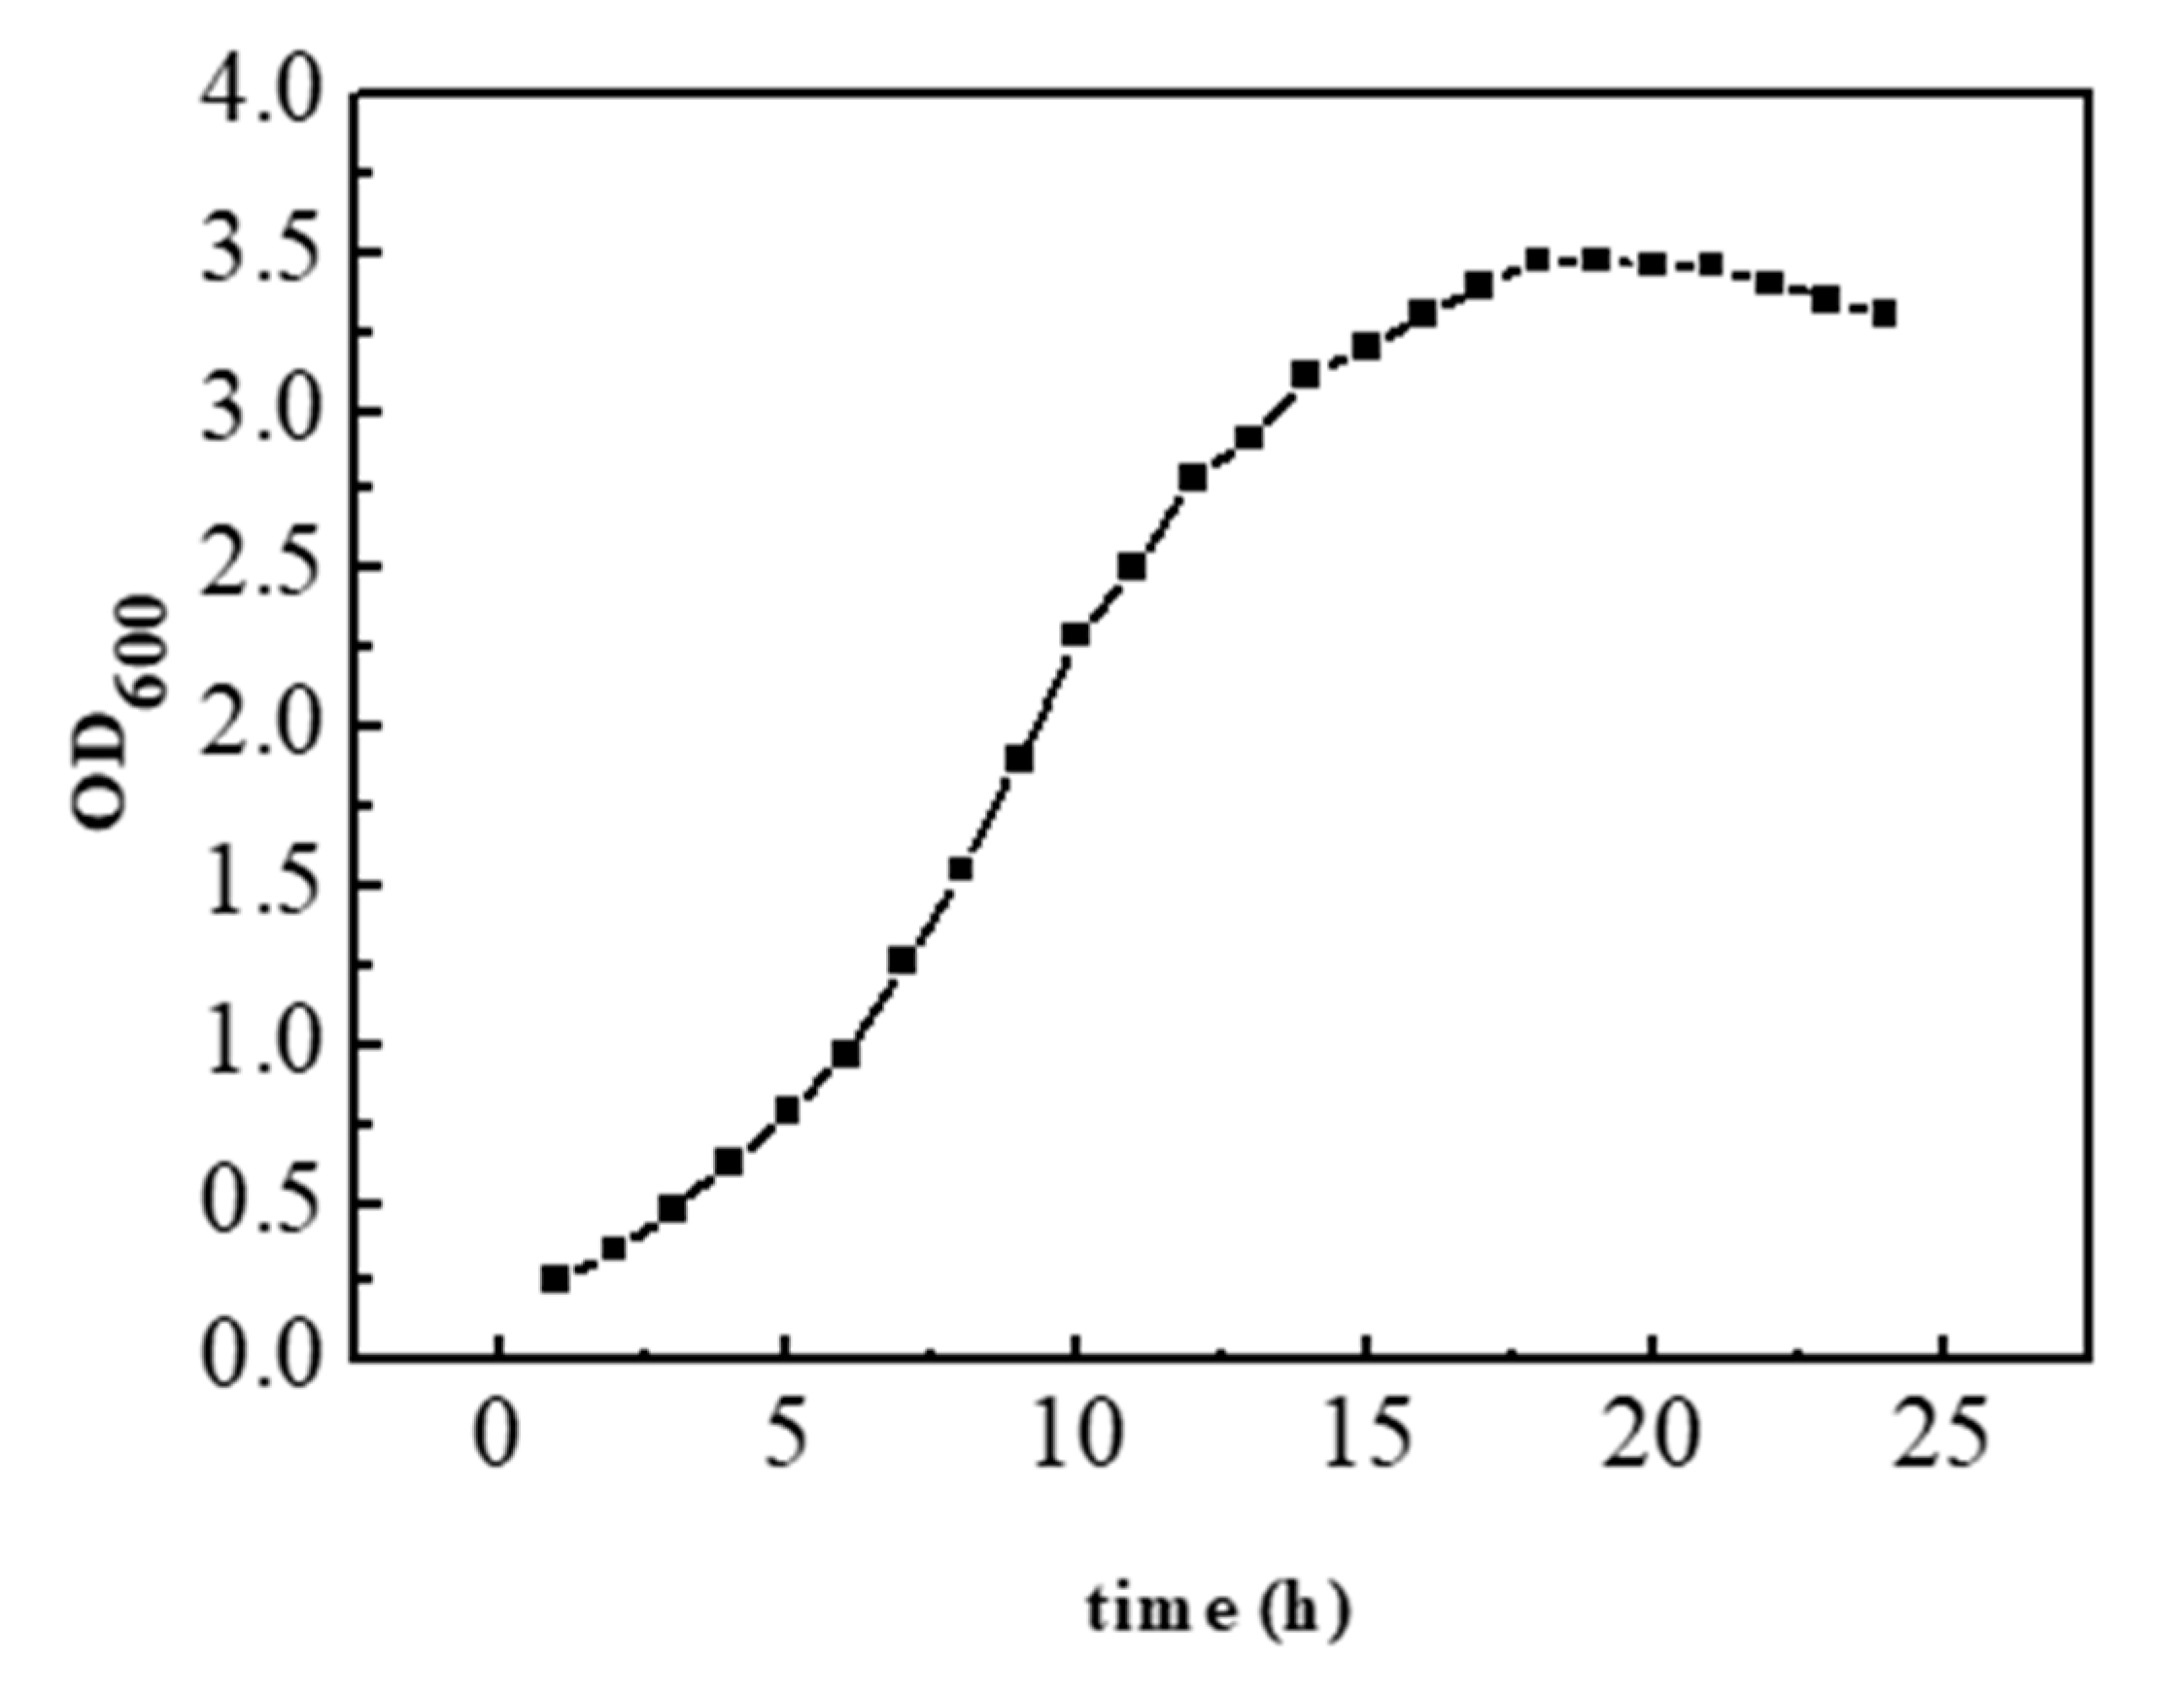
Figure 4.
Relationship between fermentation time and glucosinolate yield in different recombinant strains.
Figure 4.
Relationship between fermentation time and glucosinolate yield in different recombinant strains.
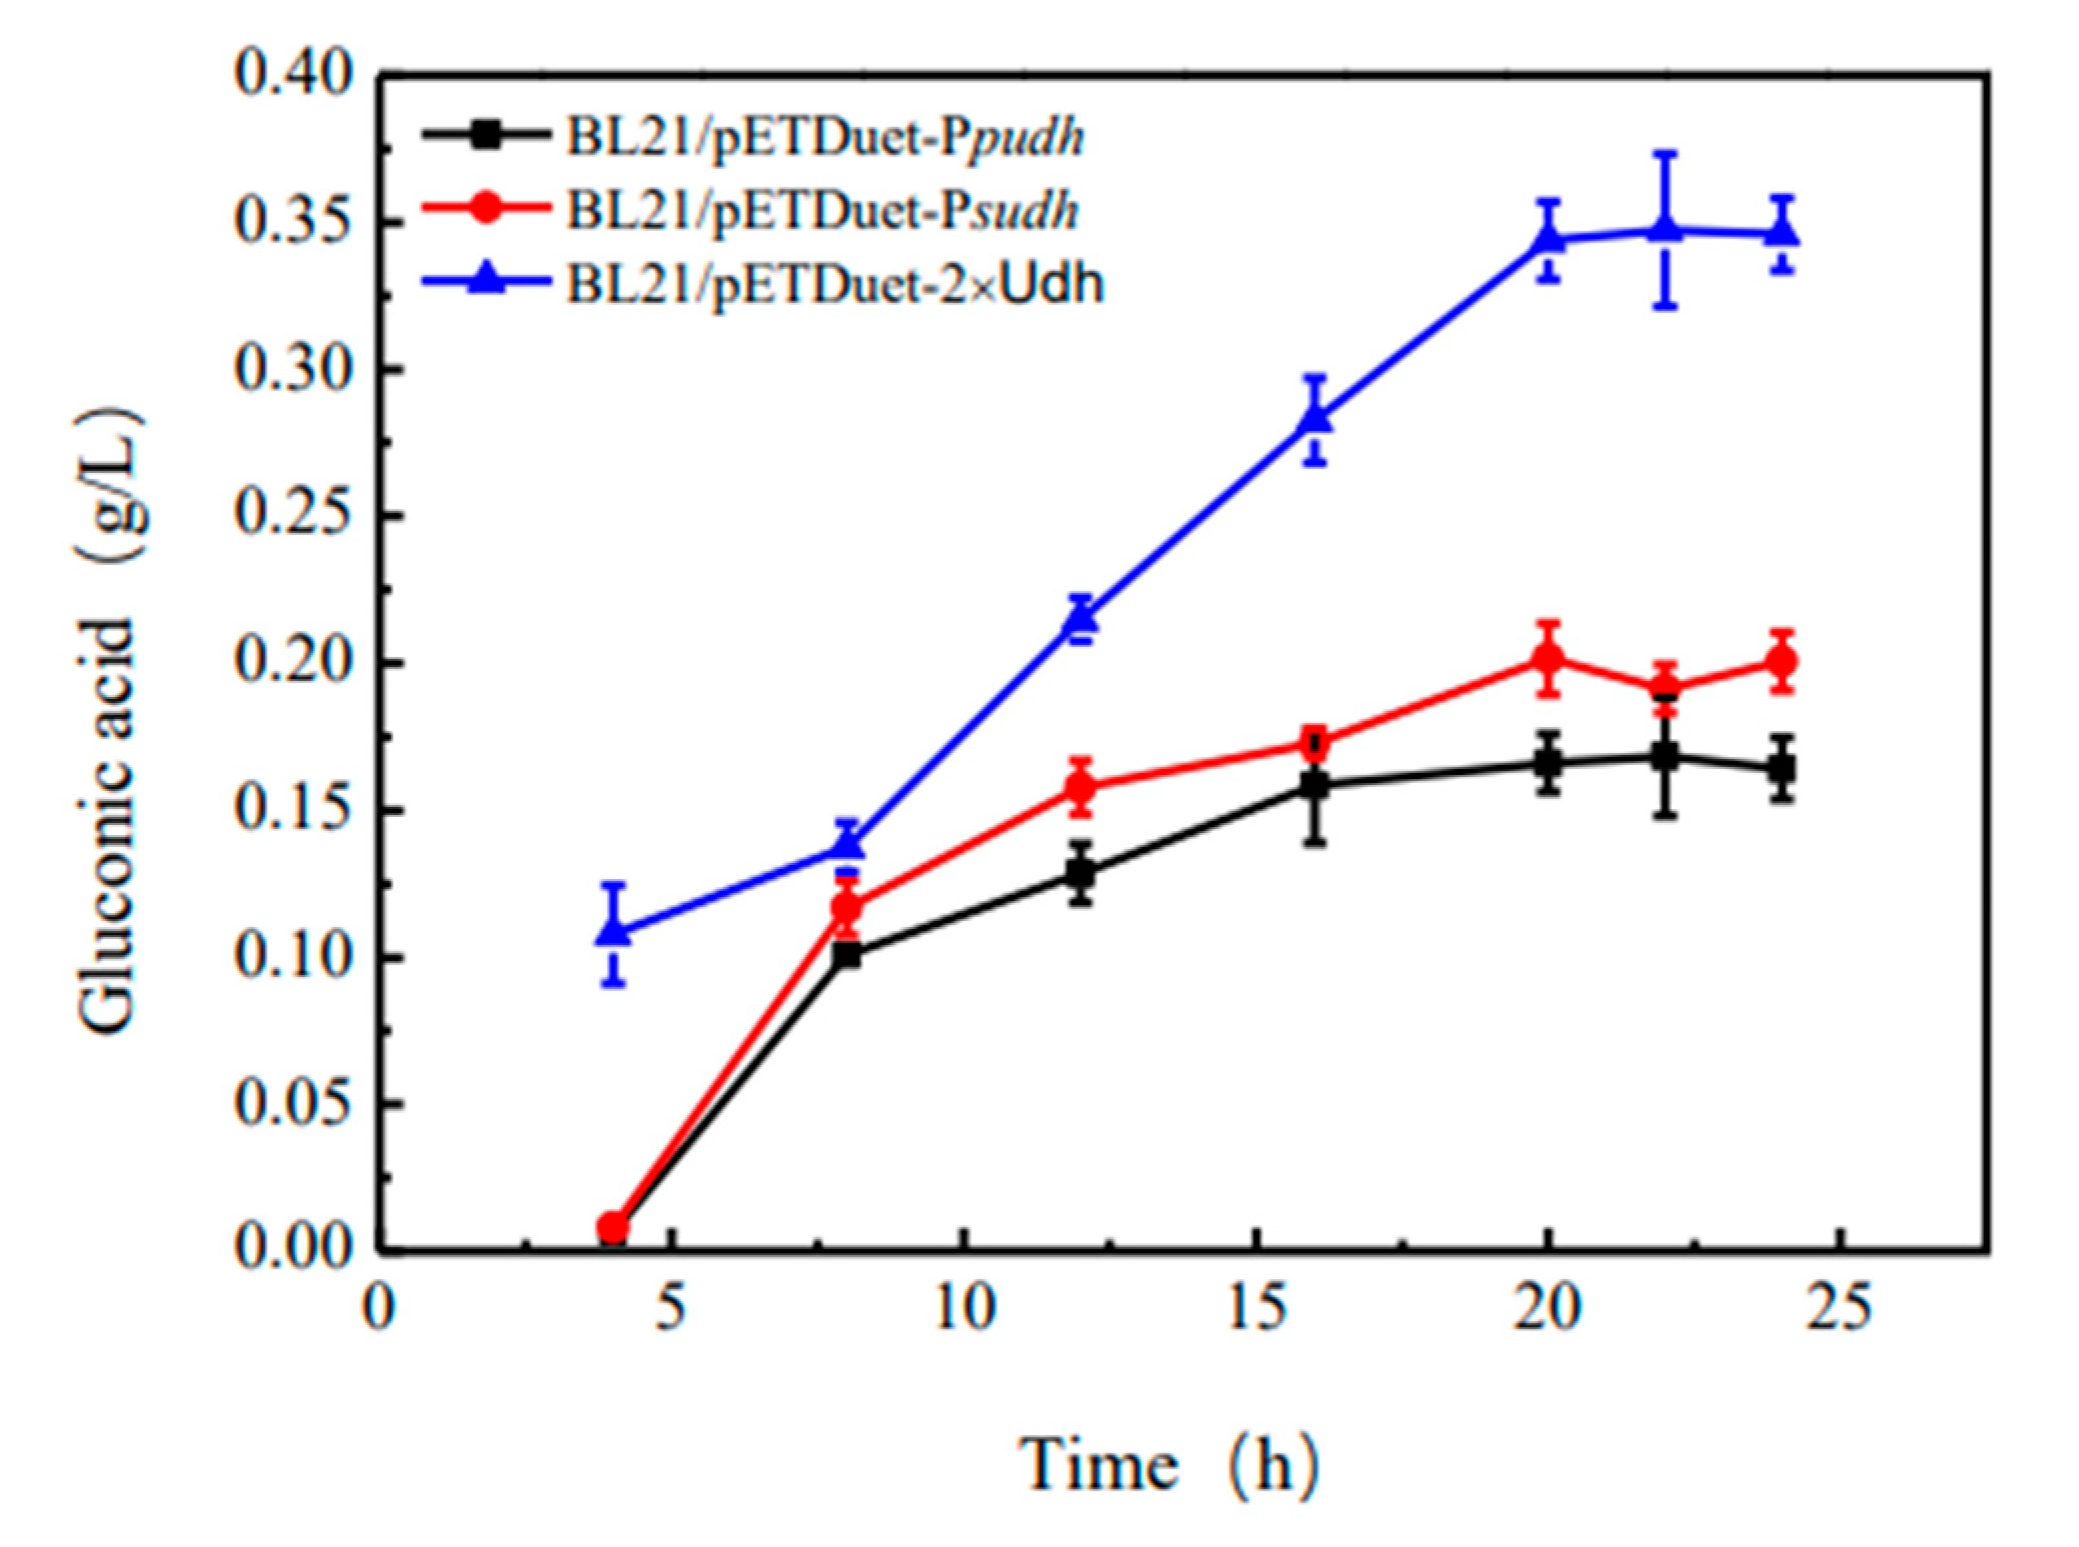
Figure 5.
SDS-PAGE analysis of Udh expression in BL21 strain (a), SDS-PAGE analysis of 2×Udh samples after affinity chromatography purification (b).
Figure 5.
SDS-PAGE analysis of Udh expression in BL21 strain (a), SDS-PAGE analysis of 2×Udh samples after affinity chromatography purification (b).
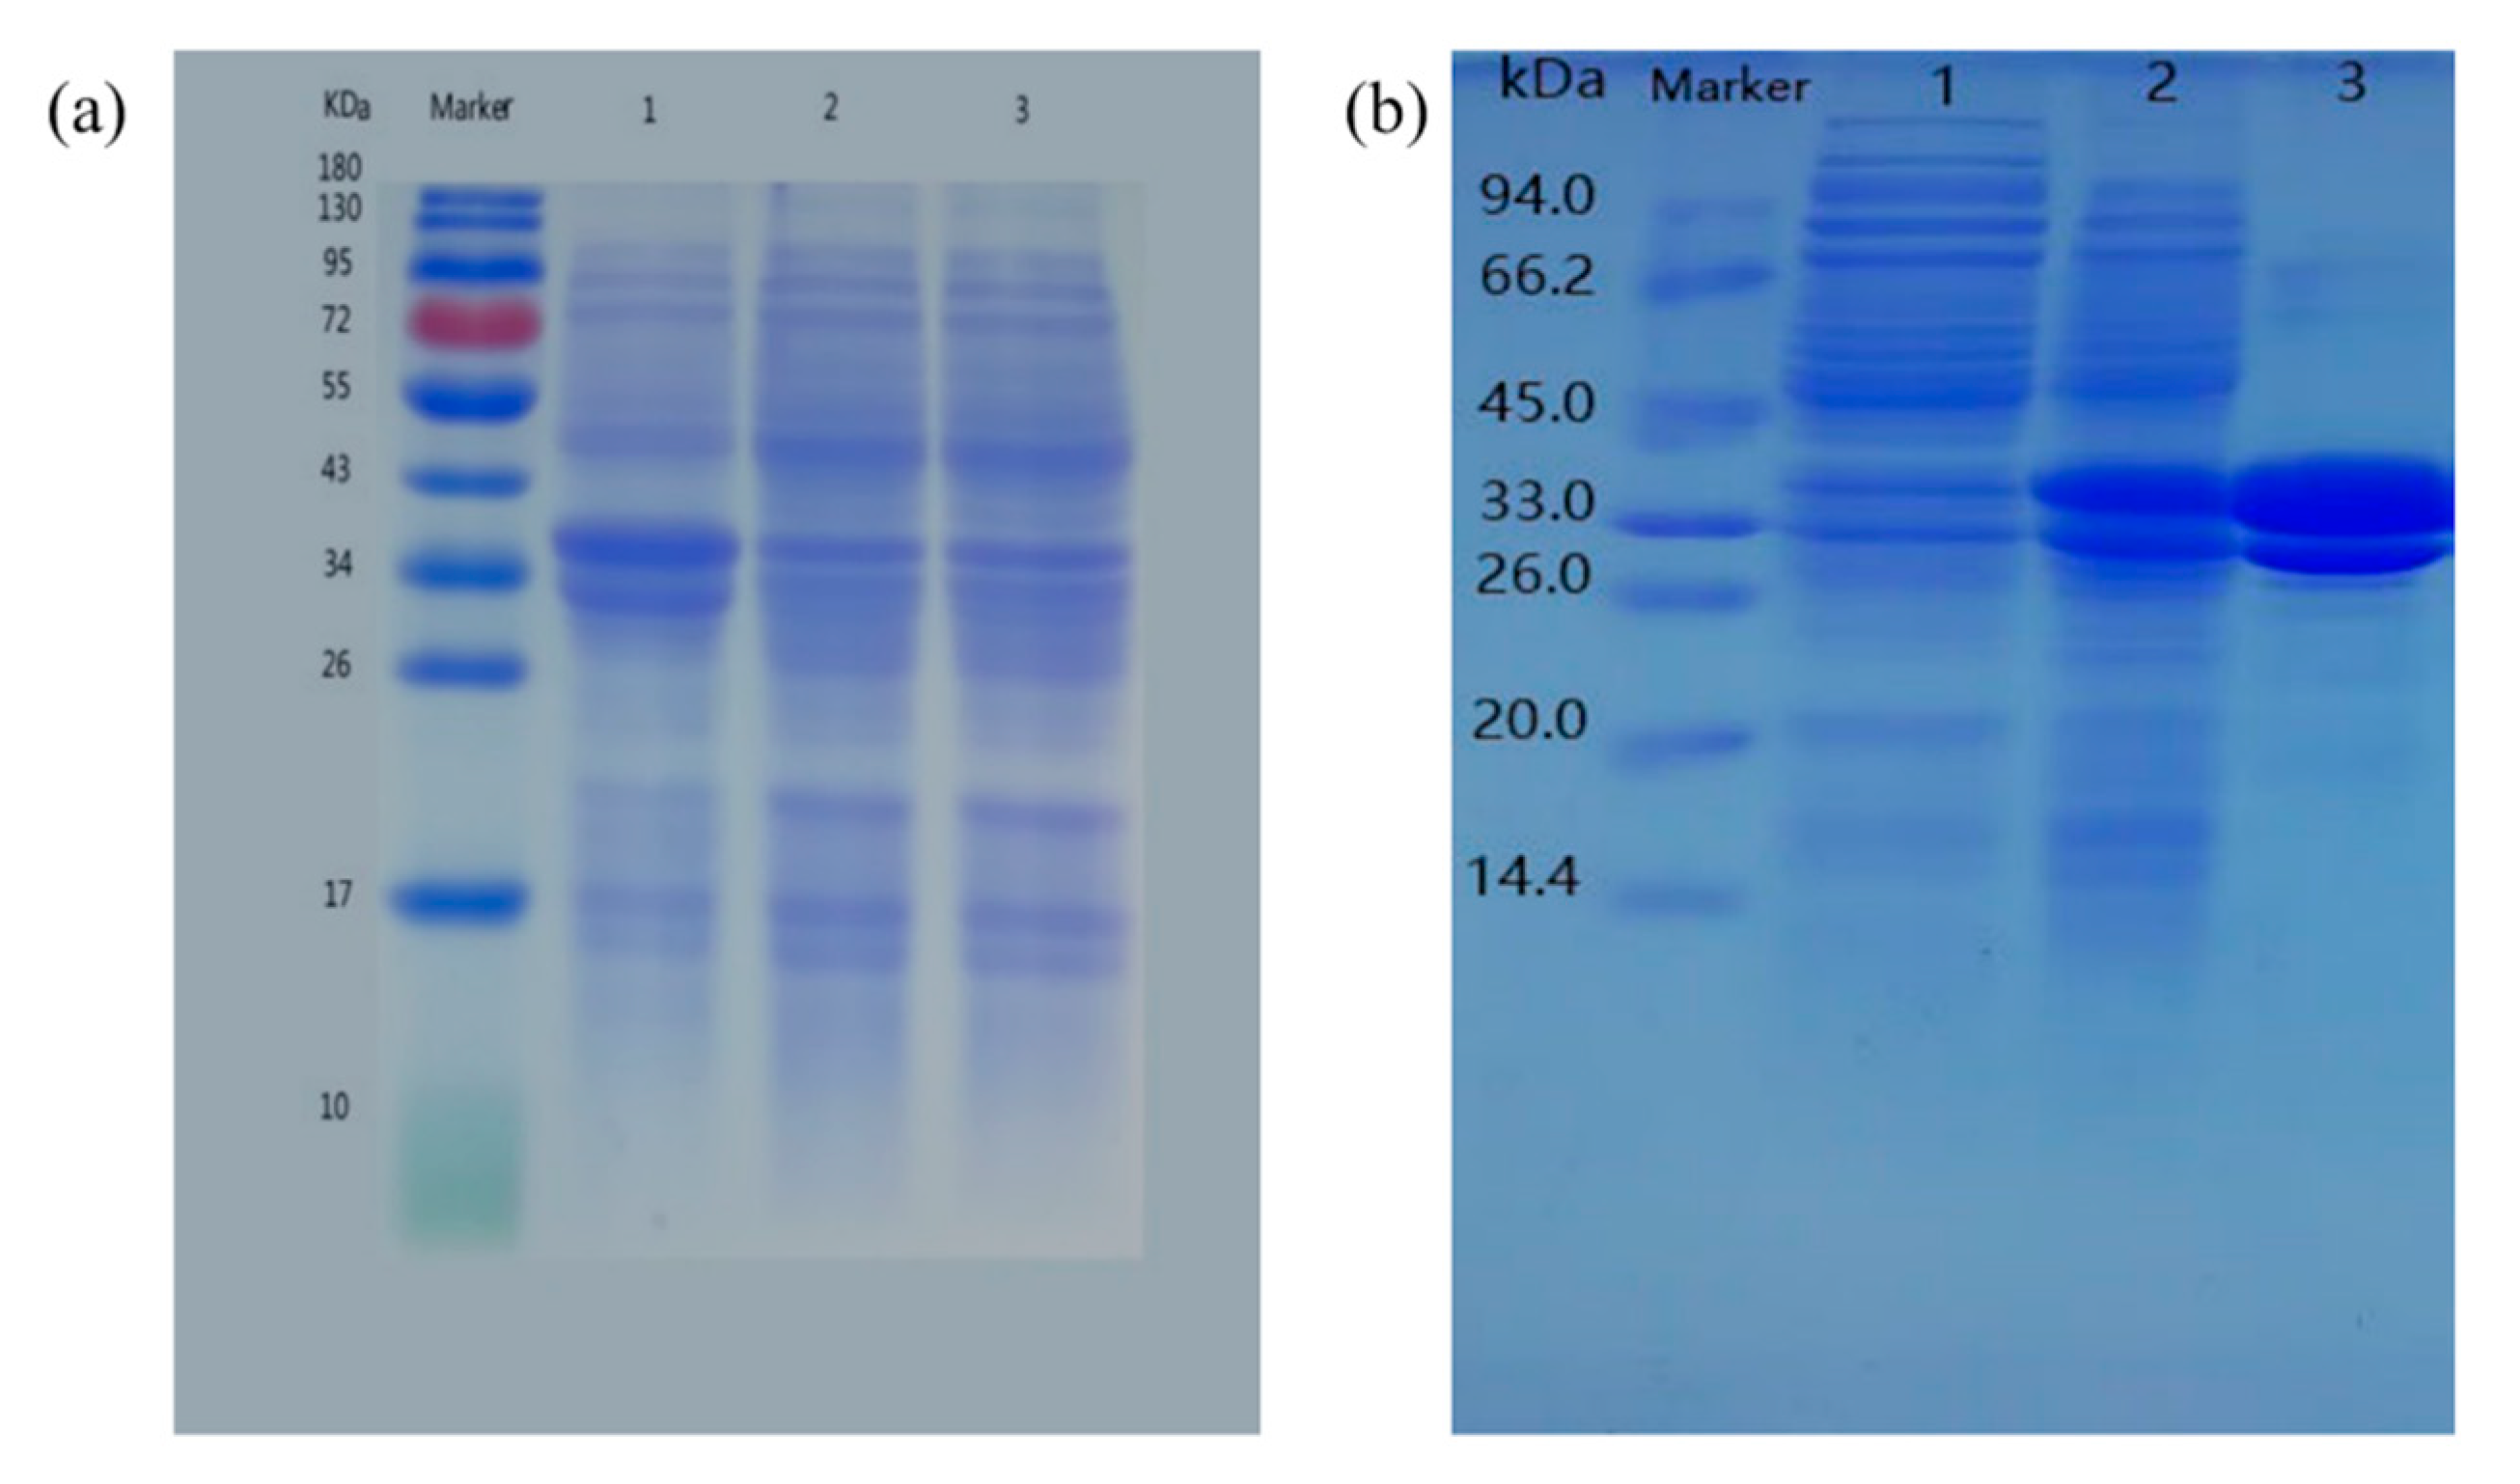
Figure 6.
SDS-PAGE analysis of 2×Udh samples induced with IPTG at different temperatures(a), induced times(b), concentrations(c), OD600 eluates(d).
Figure 6.
SDS-PAGE analysis of 2×Udh samples induced with IPTG at different temperatures(a), induced times(b), concentrations(c), OD600 eluates(d).
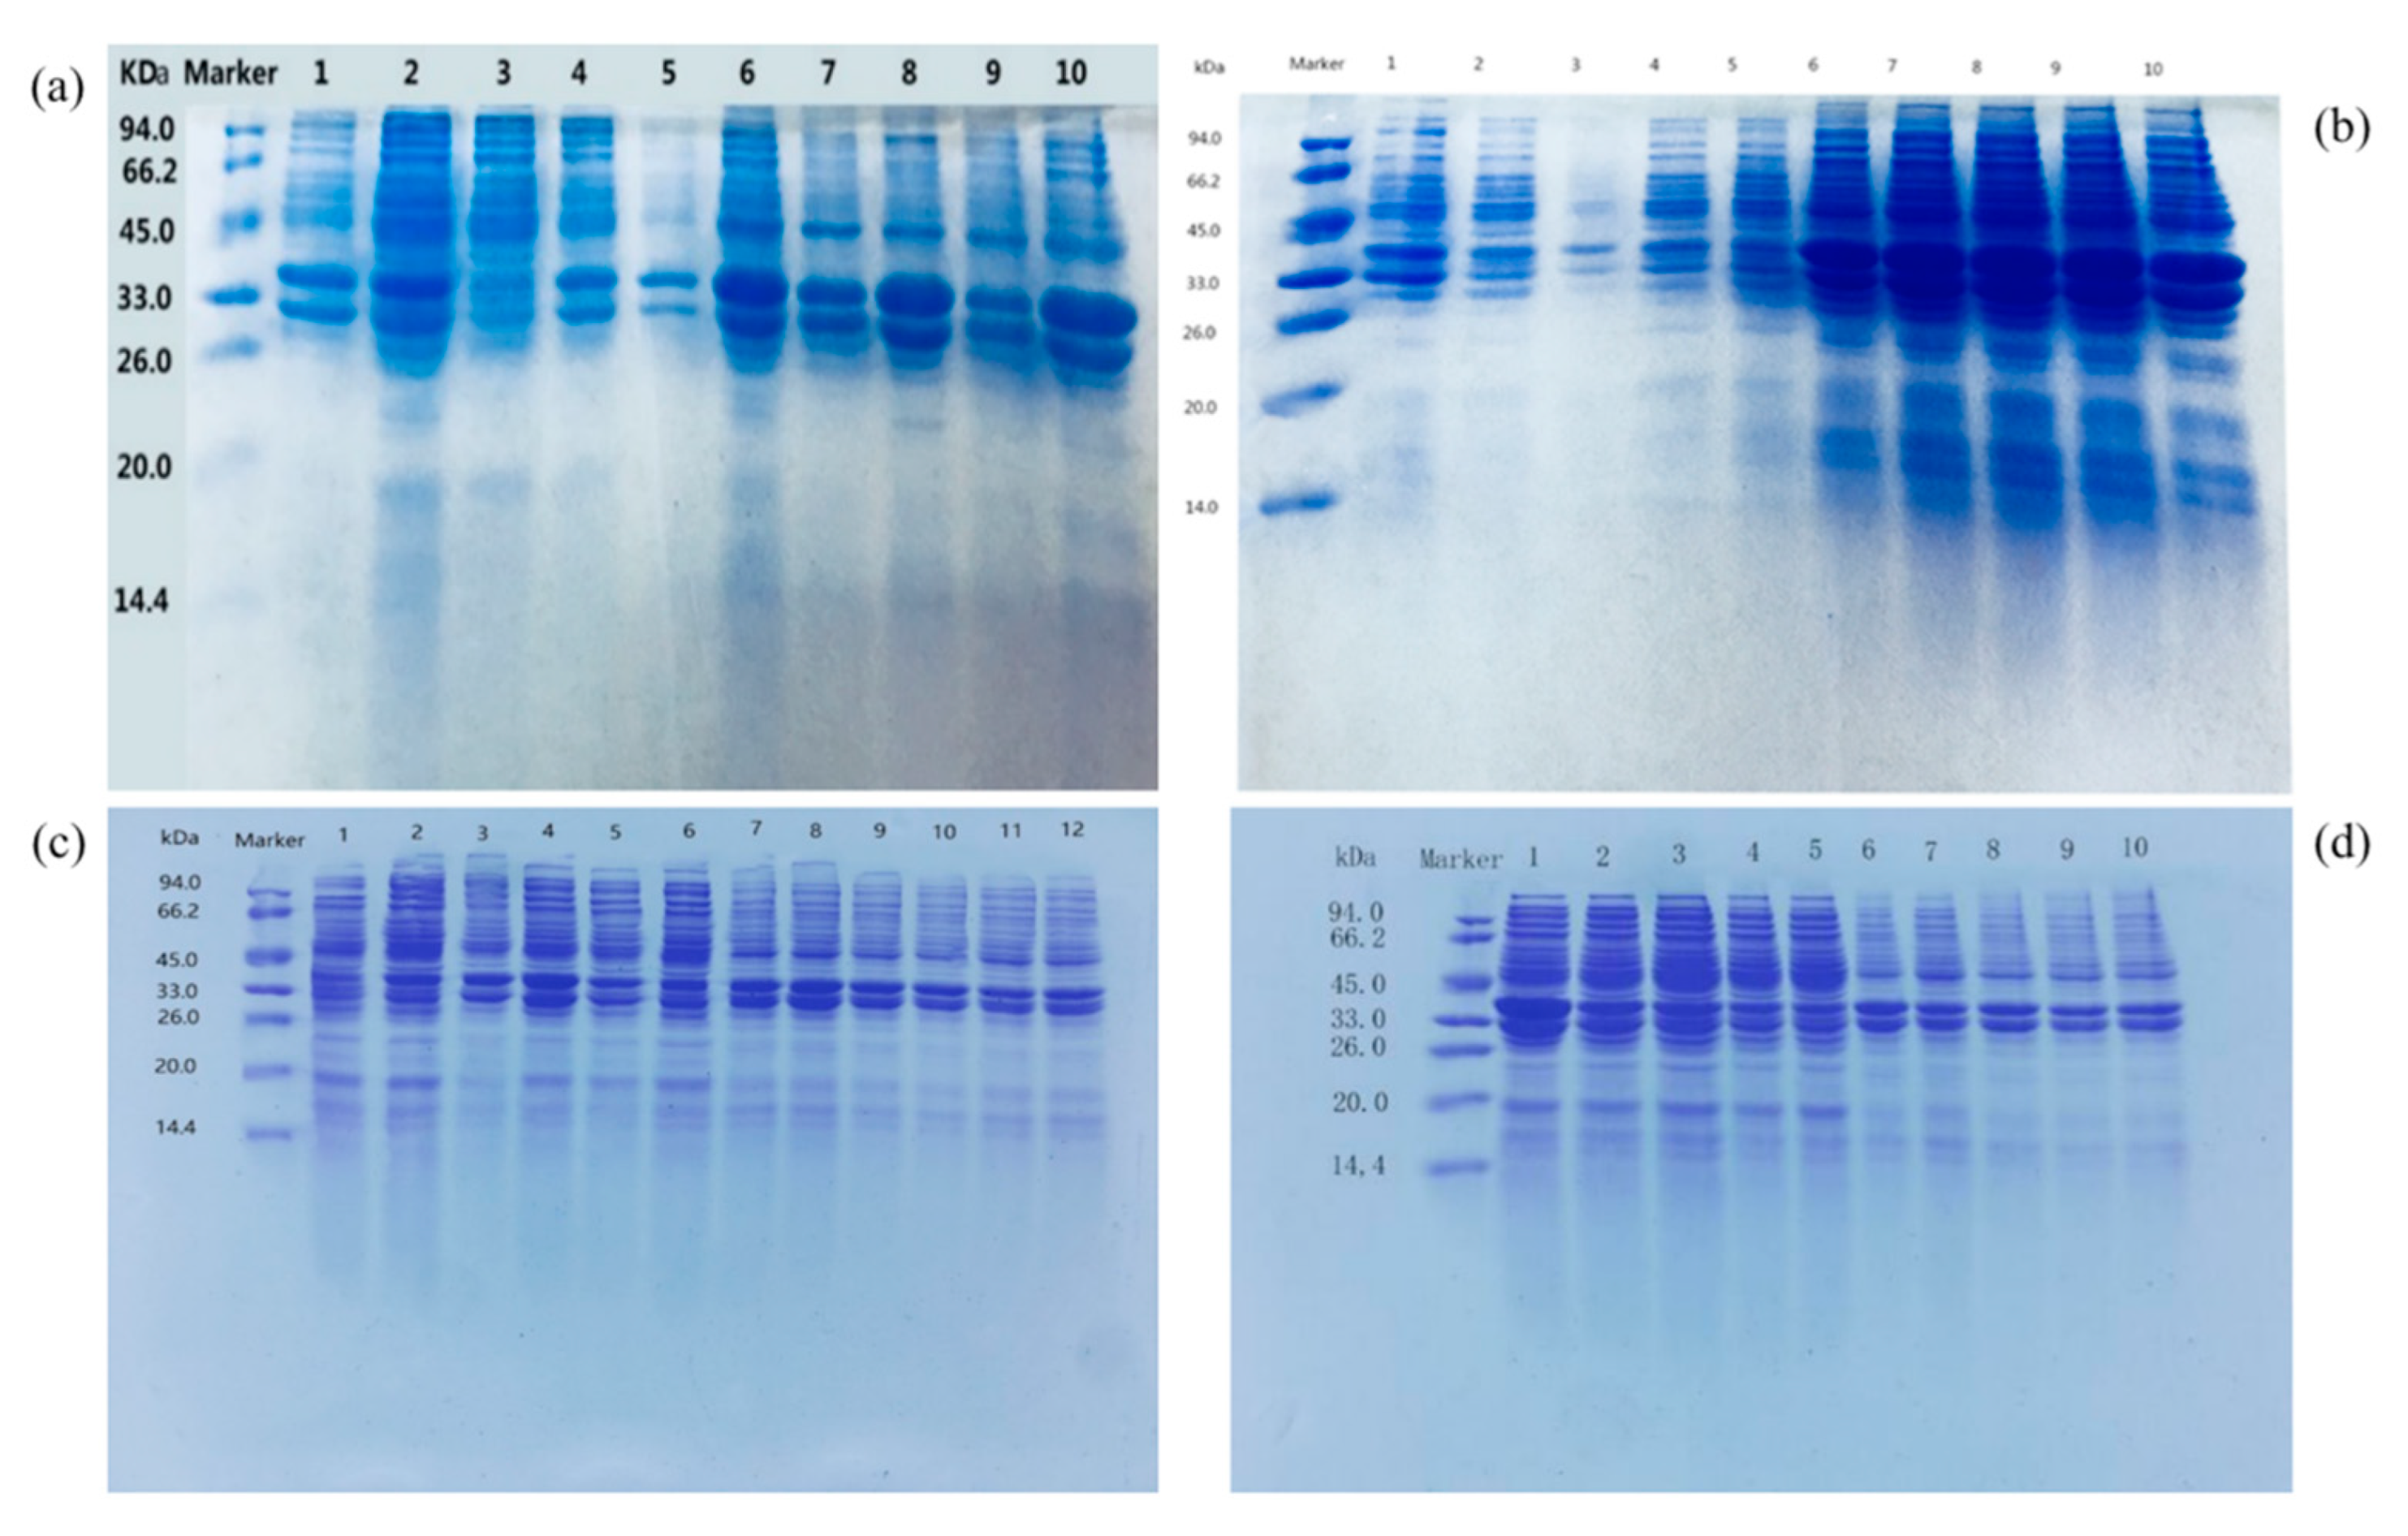
Figure 7.
Mass-spectrometric analysis of glucaric acid. (a) Sample of glucaric acid standard; (b) Sample separated from the enzymatic reaction mixture. High performance liquid chromatography (HPLC) of glucaric acid, (c) Sample of gluconic acid standard; (d) Sample separated from the enzymatic reaction mixture.
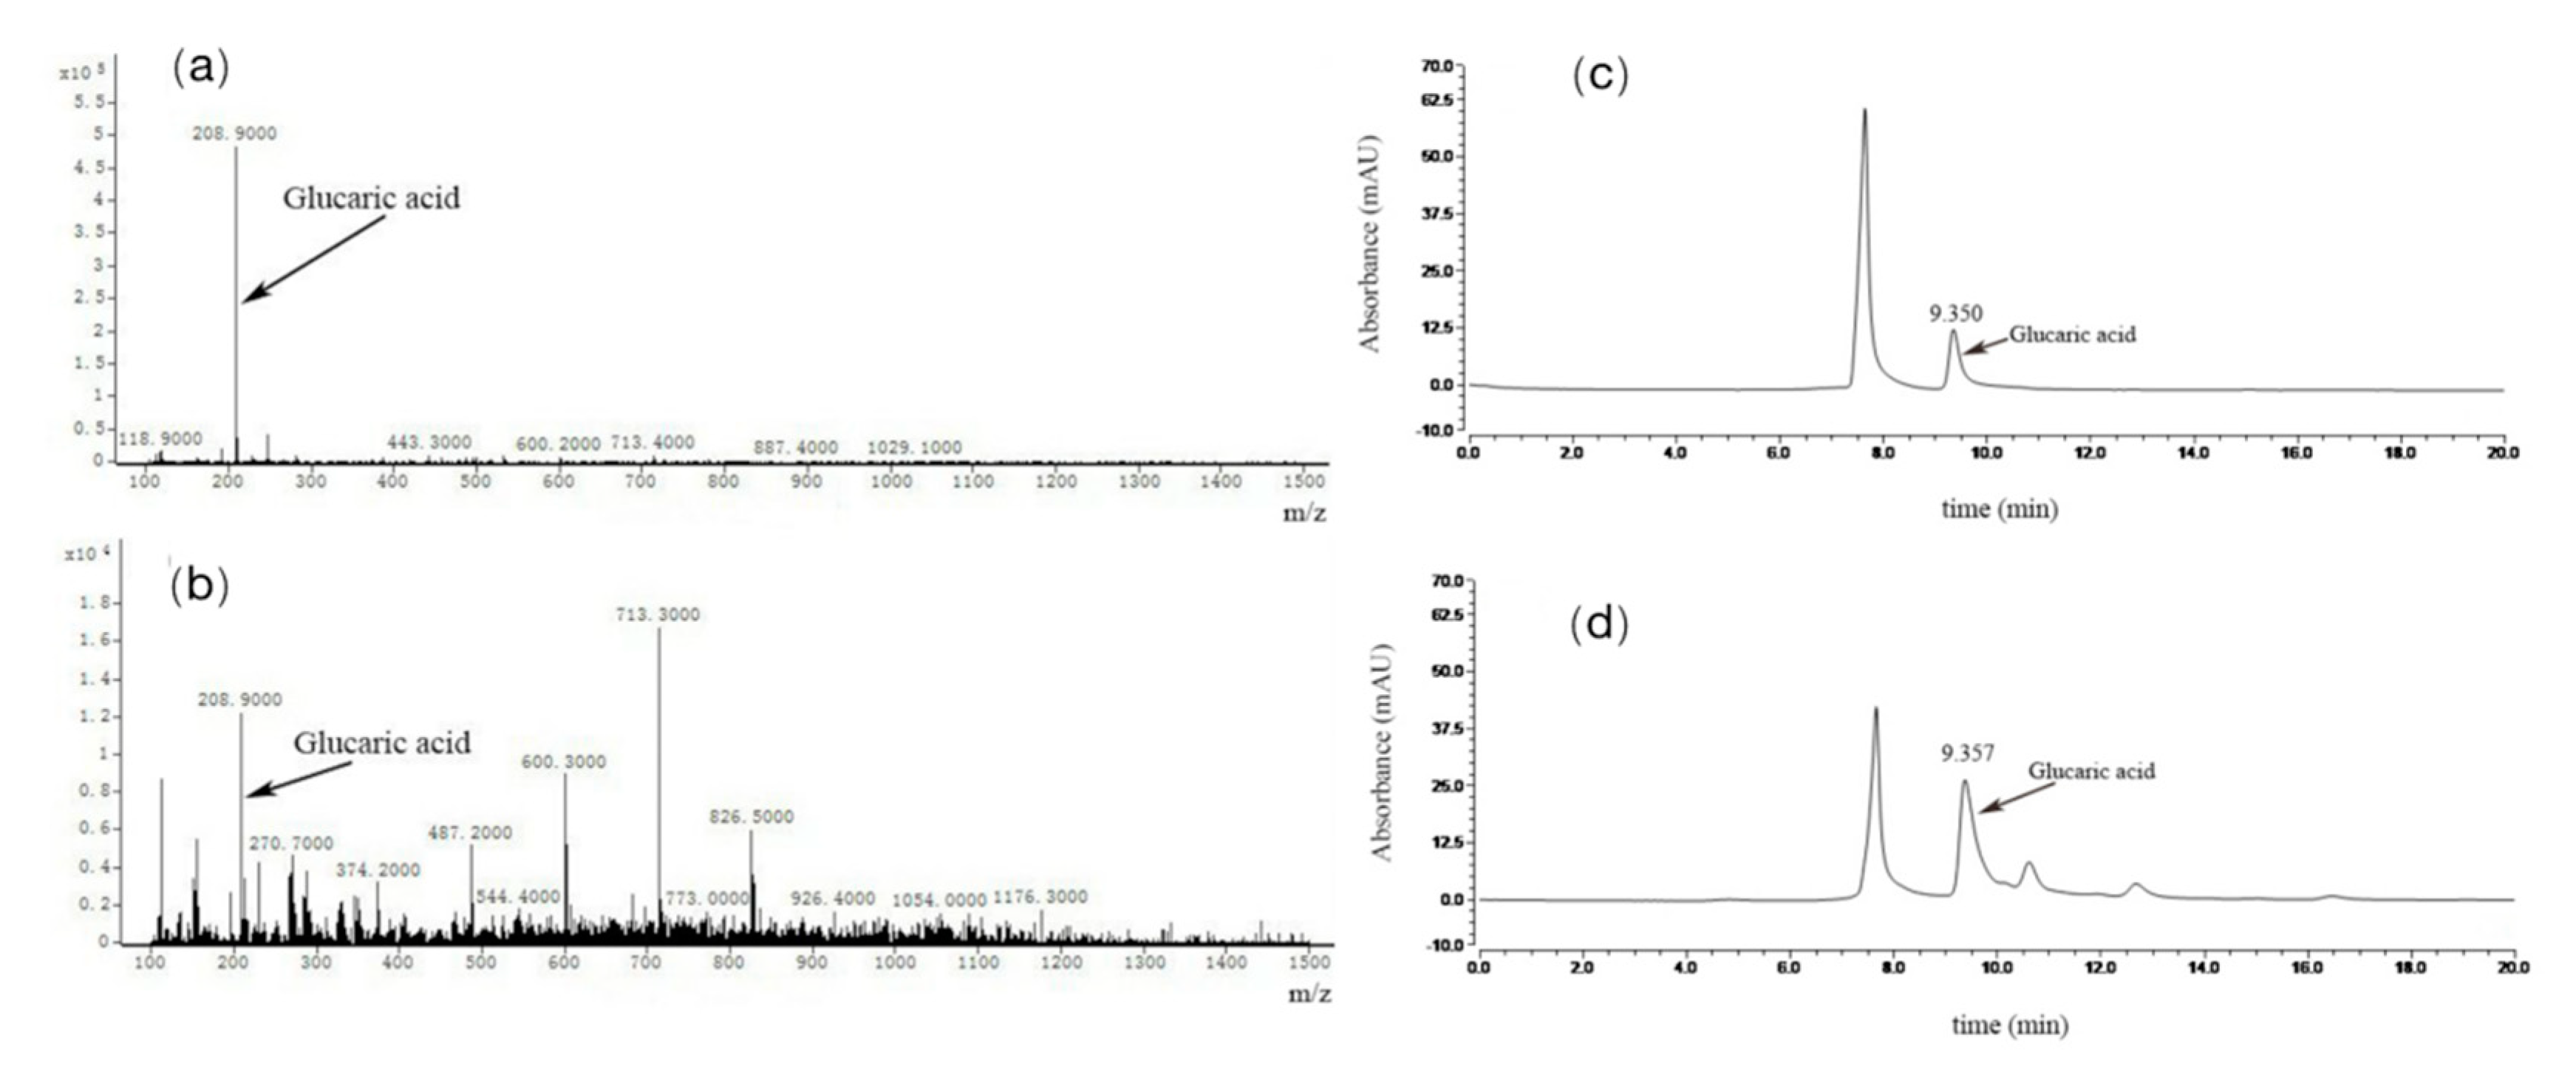
Figure 8.
Fed-batch fermentation of recombinant BL21 in 30 L tank with BSM medium and feeding with glucose and glucuronic acid.
Figure 8.
Fed-batch fermentation of recombinant BL21 in 30 L tank with BSM medium and feeding with glucose and glucuronic acid.
Disclaimer/Publisher’s Note: The statements, opinions and data contained in all publications are solely those of the individual author(s) and contributor(s) and not of MDPI and/or the editor(s). MDPI and/or the editor(s) disclaim responsibility for any injury to people or property resulting from any ideas, methods, instructions or products referred to in the content. |
© 2023 by the authors. Licensee MDPI, Basel, Switzerland. This article is an open access article distributed under the terms and conditions of the Creative Commons Attribution (CC BY) license (http://creativecommons.org/licenses/by/4.0/).
Copyright: This open access article is published under a Creative Commons CC BY 4.0 license, which permit the free download, distribution, and reuse, provided that the author and preprint are cited in any reuse.


