Submitted:
31 July 2023
Posted:
01 August 2023
You are already at the latest version
Abstract
Alzheimer's disease (AD) is a complex disease involving multiple factors such as amyloid plaque formation, mitochondrial dysfunction, telomere length, and oxidative stress. As the disease began 20 years before the onset of clinical symptoms, treatment of AD after its onset is likely to be too late to have a significant effect. Therefore, prevention from an early stage is important. Twendee X®︎ (TwX, Oxicut®︎) is an antioxidant supplement consisting of eight ingredients. TwX has been proven to prevent dementia in patients with mild cognitive impairment (MCI) in a multicenter, randomized, double-blind, placebo-controlled, prospective intervention trial. To elucidate the mechanisms of TwX on brain and cellular function, TwX was administered in in vitro experiments and in a C57BL/6 old wild-type, and spontaneous hyperglycemia model with accelerated cognitive decline, and its effects on diabetes, brain autophagy, neurogenesis, and telomere length were evaluated in comparison with those of the non-treated groups. TwX protected mitochondria from oxidative stress with higher antioxidant capacity than a single antioxidant. TwX not only lowered blood glucose levels, but also suppressed reduction of brain neurogenesis and loss of autophagy. Telomeres in aged mice were significantly longer than those in non-TwX-treated mice. Development of dementia is based on many factors of brain function. TwX was suggested to prevent dementia not only by its antioxidant effects, but also by its effects on diabetes, brain neurogenesis, telomere deficiency, and energy production.
Keywords:
Alzheimer's disease
; oxidative stress
; Twendee X®︎
; antioxidant
; dementia
; mitochondria
; reactive oxygen species
1. Introduction
Age-related accumulation of oxidation products elevates the risk for humans to develop many cognitive diseases including dementia. In Alzheimer’s disease (AD) for example, the greatest risk factor is advanced age, followed by genetics, nutrition, physical activity, and environmental factors [1]. As the world’s population ages, dementia is expected to increase to an estimated 135 million patients by 2050. This number will increase further if people with possible dementia risk factors (obesity in middle age, diabetes, etc.) are included. Despite these alarming statistics, there are currently no effective drugs to treat age-related cognitive dysfunction and dementia. Since pharmaceuticals can only be administered once dementia has been diagnosed, it can be difficult to expect their effectiveness after the onset of dementia. Therefore, prevention from an early stage is important.
AD is a progressive neurodegenerative disease characterized by cognitive and short-term memory impairment [1,2]. Multiple factors are involved in the development and progression of AD, including the formation of amyloid-β (Aβ) and phosphorylated tau (p-tau), neuroinflammation, synaptic dysfunction, mitochondrial dysfunction, telomere length, and oxidative stress [2,3,4]. Of these causes, oxidative stress tends to be the most implicated, with many studies labeling AD as an oxidative stress disease [5,6,7,8,9]. There are several reasons for this; mitochondrial dysfunction, for example, is said to be an early signal of the onset of AD [2,10] and it is closely related to oxidative stress, including decreased ATP production, and increased free radicals. Diabetes mellitus, which has also been branded as an oxidative stress disease, is one of the risk factors for AD. In addition to oxidative stress, diabetes mellitus exhibits inflammation, mitochondrial dysfunction, and several similar neurodegenerative mechanisms [11].
If dementia can be prevented with antioxidant combination products that are not positioned as pharmaceuticals, prevention can be achieved at a relatively early stage, and the onset and progression of dementia can possibly be delayed. However, there have been several studies that have shown promising effects of antioxidants on dementia, none of which have been successful [12].
As an antioxidant complex, Twendee X®︎ (TwX, products name Oxicut®︎) is being investigated as potential therapeutic option for cognitive and other diseases resulting from oxidative stress. Results so far seem promising, TwX has been shown to prevent mild cognitive impairment (MCI) in a multicenter, randomized, double-blind, placebo-controlled, prospective intervention trial [13]. The combined antioxidants in TwX seem to work synergistically to protect the mitochondria and increase the body’s antioxidative capacity and with no significant side effects. Although it is a dietary supplement, TwX has passed the same safety standards required of pharmaceuticals including chromosomal aberration, toxicity, and mutation tests. TwX was also found to have a favorable effect on several factors involved in the onset and progression of dementia. These studies are important from the perspective of preventing dementia in the future. This paper describes the differences between TwX and conventional antioxidants, as well as findings from our studies.
2. Results and Discussion
2.1. Antioxidant Capacity of TwX
TwX is an antioxidant complex containing eight different ingredients [14,15]. The antioxidant capacity of TwX solution (60 mg/ml) and the same amount of Vitamin C (VC) solution (20.5 mg/ml) contained in TwX were determined using the OXY adsorption test, respectively. TwX was found to have 5.6 times significantly higher antioxidant capacity than the same amount of VC contained in TwX (Figure 1).
It is known that exposure of cells to the oxidant hydrogen peroxide (H2O2) causes the production of reactive oxygen species (ROS). Exposure of human hepatocellular liver carcinoma cell line HepG2 to 100 µM H2O2 stimulated an increase in both mitochondria ROS (mtROS) by 69% and cellular ROS (cROS) by 68% compared to normal cells, a decrease in manganese superoxide dismutase (Mn-SOD) by 32% and copper/zinc superoxide dismutase (Cu/Zn-SOD) by 31%, and increase in total glutathione (GSSG/GSH) level. TwX reduced both ROS increased by H2O2 and increased antioxidant levels in cells and mitochondria. TwX also reduced total glutathione activity. 60, 120, and 240 µg/ml concentrations of TwX all showed an increase in ROS scavenging and SOD activity, with the highest effect at 60 µg/ml (Table 1).
H2O2 100µM was administered in HepG2 cells with or without Twendee X®︎ (TwX). Significance levels compared to the non-treated cells, *p<0.05, **p<0.01, ***p<0.001, NS non-significant (Student’s t-test). Prefixes c: cellular, mt: mitochondrial. GSHtot: total gulthathione level. - % effect is expressed with respect to non-treated cells for the H2O2 condition, and with respect to H2O2 -induced oxidative stress for anti-oxidant test elements.
ROS is the general term for radical or non-radical oxygen derivatives [16], including free radicals such as superoxide (O2•-), hydroxyl radical (OH•) and peroxides (hydrogen peroxide/H2O2). ROS are highly reactive, and in the presence of cellular biomolecule, they readily lose electrons (oxidation), setting off a chain reaction that ultimately damages the cellular structure. Among ROS, OH• has been reported to directly attack the DNA backbone and cause DNA damage [17,18]. Mitochondria are said to be the main production site of ROS. Many subunit syntheses in the mitochondrial respiratory chain complex (except complex II) are based on mitochondrial genes (mtDNA), and ROS can greatly affect the transcription of mtDNA-encoded proteins and RNAs. Thus, mitochondria with oxidized mtDNA dysfunctions and produce large amounts of ROS, which further impairs mitochondrial function, thus establishing a continuous cycle of oxidation. This chronic oxidative stress eventually leads to severe nuclear DNA damage and cell death [19].
ROS is also associated with inflammation. Inflammation is the host's protective immune response against foreign pathogens and it promotes the repair of damage tissue. Increased ROS production at the site of inflammation by polymorphonuclear neutrophils (PMNs) is primarily due to tissue damage and endothelial dysfunction. As far as this inflammatory response is concerned, inflammation promotes the production of ROS. This inflammatory cycle is known to be accelerated by the lack of an adequate ROS removal system. Furthermore, there is an inverse process where ROS induces the generation of an inflammatory response [20,21], which results in a synergistic effect.
Previous reports have clearly shown that oxidative damage is an important factor in the pathogenesis and progression of AD. In recent studies, oxidative stress has also been found to play an important role in the prodromal stages of AD, including MCI [22]. Aging, the greatest risk factor for AD, is the result of accumulated oxidative stress. Aβ accumulated in the brain after the onset of AD also generates free radicals and causes inflammation in the surrounding neurons, leading to mitochondrial dysfunction and eventual neuro-degeneration. In other words, AD is the result of a persistent cycle of oxidative stress, inflammation, and mitochondrial dysfunction.
Because oxidative stress is a major contributor to the etiology and progression of AD, studies have sought to analyze the potential effects of antioxidants in clinical trials. Vitamin E (VE), a fat-soluble vitamin, has antioxidant properties that may interrupt cell-damaging reactions by interacting with cell membranes to trap free radicals. Clinical trials using high doses of VE (2000 IU/day) reportedly slowed disease progression in patients with moderate AD more than in patients who received a placebo [23,24], however other subsequent studies using VE could not replicate these outcomes [25]. Ascorbic acid (AsA), is also said to inhibit oxidative stress and excessive secretion of inflammatory factors, thereby extending lifespan. Furthermore, AsA has been found to positively modulate two features of biological aging, inflammatory aging and immune aging, in mice model, however, to date no results in humans have been obtained [26]. In the present study, TwX had higher antioxidant capacity than a single equal dose of VC. In addition, TwX clearly protects cells and mitochondria from oxidation by oxidants. In other study, the free radical scavenging ability of TwX has been evidenced by the scavenging ability of free radicals (CH3•), (OH•), and (O2•-) generated from the H2O2/NaOH/DMSO reaction system using ESR [27]. In particular, (OH•) and (O2•-) scavenging can be eliminated at low doses. In AsA-containing formulations such as TwX, high concentrations of AsA produce ascorbyl radicals that increase the signal height of (CH3•) [28,29], but this adverse effect was not observed with TwX. These results may be attributed to the fact that TwX has a novel blend of eight active ingredients. These ingredients are the result of a long process of determining various ingredients and amounts over a long period of time. The mixing of several ingredients may effectively inhibit the formation of ascorbyl radicals. Also, TwX significantly improved cognitive dysfunction and impaired coordination in vitamin E-deficient mice [30].
Considering previous antioxidants have been single agents and have limited effects, TwX, which contains multiple agents, is a novel antioxidant.
2.2. Mitochondrial Energy Production
Metabolomic analysis was performed on human hepatocellular carcinoma HepG2 cells unstimulated (Control) or stimulated with TwX (60 µg /ml) for 1 hour. As a result, capillary electrophoresis-time-of-flight mass spectrometry (CE-TOFMS) revealed 233 peaks (111 cations and 122 anions). Liquid chromatography (LC-TOFMS) detected 93 peaks (58 positive and 35 negative). For the peaks, the relative area ratio between each was calculated and Welch's t-test was performed. Next, hierarchical cluster analysis (HCA) was performed using these metabolome data. The clustered heat map shows 326 biochemicals in lysates from HepG2 (Figure 2).
Among the substances detected in this study, metabolite levels related to the glycolytic and tricarboxylic acid cycle (TCA) are shown (Table S1), and depicted in the metabolic pathway (Figure 3). Adenosine tri-phosphate (ATP) and adenosine diphosphate (ADP) concentrations increased in the TwX-treated group compared to the control group.
Mitochondria are intracellular organelles responsible for most of the ATP needed for energy-requiring mechanisms and cellular pathways. Mitochondria also produce coenzymes, a component that is important for the neurotransmitter acetylcholine, and for the conversion of fatty acids into energy sources. On the other hand, it also produces several byproducts such as ROS superoxide (O2•-), hydroxyl radicals (OH•), and hydrogen peroxide (H2O2).
The brain utilizes about 25% of the total body's glucose [31]. Glucose is used for energy conversion through glycolysis and mitochondrial oxidative phosphorylation to aid in synaptic transmission. However, aging decreases glucose uptake from neurons and reduces the activity of the electron transport system. Furthermore, most neuronal energy transfer pathways are in the mitochondria, and elevated oxidation interferes with this energy conversion. This mitochondrial abnormality is a hallmark of brain aging and neurodegenerative diseases [32] and is particularly prominent in AD where it has been observed along with impaired mitochondrial dynamics (increased mitosis and decreased fusion), altered mitochondrial morphology and mitochondrial gene expression, increased free radical production and lipid peroxidation, and decreased cytochrome c oxidase (COX) and ATP production. These mitochondrial abnormalities lead to the progression and pathogenesis of AD [4,33,34,35,36]. In fact, in postmortem tissues of AD patients, dysfunction of the TCA cycle, impaired electron transfer and oxidative phosphorylation, as well as changes in mitochondrial morphology have been observed, suggesting disruption of mitochondrial function [37,38]. This dysfunction is associated with changes in redox status due to free radicals and H2O2. Both bioenergetic deficits and chronic oxidative stress contribute significantly to brain aging and cognitive decline associated with AD. TwX was suggested to protect mitochondria from redox state changes caused by free radicals and H2O2, thereby avoiding mitochondrial dysfunction and stimulating energy production.
2.3. Effect on Diabetes
Since diabetes is one of the risk factors for AD, the effect of TwX on diabetes was examined. The blood oxidative stress level of 35 weeks old spontaneously hyperglycemic mice was significantly higher than that of normal same-week-old mice (NC). TwX (40 mg/kg/day) group had lower oxidative stress levels than TwX non-treated group (Control), although the difference was not significant (Figure 4).
The mice at 41 weeks old were fasted for 16 hours, and a glucose tolerance test was performed to verify the changes in blood glucose levels. The blood glucose level of the non-treated group (Control) was significantly higher than that of normal mice of the same age (NC), and the blood glucose level of the TwX-treated (40 mg/kg/day) group did not show rapid changes and was lower than that of the Control group (Figure 5).
Diabetes, a treatable metabolic disease, has now been shown to increase the risk of AD, vascular dementia, and all other types of dementia [39,40]. Diabetes causes mild to moderate cognitive impairment not attributable to any other factor. Several common neurodegenerative mechanisms have been identified in diabetes, including oxidative stress, mitochondrial dysfunction, and inflammation. Although the brain is an immunologically endowed organ, there are reports of crosstalk between peripheral and central inflammation. Chronic hyperglycemia also chronically elevates inflammatory markers and contributes to increased ROS generation. This metabolic inflammation is associated with the induction of mitochondrial oxidative stress, endoplasmic reticulum (ER) stress, and autophagy defects. In parallel, blocking autophagy may be associated with proinflammatory signaling through oxidative stress pathways and NF-κB-mediated inflammation [41]. Diabetes, as with AD, is a disease that progresses and develops gradually over a long period of time. TwX was found to improve hyperglycemia as well as suppress the increase in ROS caused by persistent hyperglycemia. These results suggest that TwX may inhibit vascular endothelial damage caused by diabetes and may prevent cognitive decline.
2.4. Effect on Autophagy
Brains from 70 weeks old aged spontaneously hyperglycemic mice were harvested and its extracted protein was subjected to western blotting to examine expression level of LC3 protein.
LC3 protein was lost in the non-treated (Control) group, while LC3 protein was expressed in the TwX-treated group of the same age (Figure 6).
Autophagy is a process used to maintain the balance of healthy cells, cell organelles, proteins, and nutrients in an organism. It works selectively or non-selectively, depending on whether the target is a specific cellular component or an entire cell [2]. The efficiency of autophagy decreases with age; therefore, it is no surprise that autophagy dysfunction has been reported in many neurodegenerative diseases. Autophagy dysfunction can occur at numerous stages in the autophagy mechanism and may contribute to the formation of intracellular aggregates and ultimately neuronal cell death [42].
Recent studies have reported that dysfunction of autophagy and mitophagy induced by Aβ and p-tau, is a prominent phenomenon in the pathogenesis of AD. With age-dependent increases in Aβ and p-tau, levels of several autophagy proteins (ATG, LC3-1,-2) and mitophagy proteins (PINK1, Parkin, P62, BNIP3, FUNDC1, LC3-1, OPTN, TBK1) are decreased [2]. Maintaining normal autophagy is crucial since autophagy dysfunction, along with mitochondrial abnormalities and synaptic damage, is a major cellular event that occurs in Aβ accumulation as well as the onset, progression, and pathogenesis of AD. While further studies are needed as there are many other autophagy-related proteins, LC3 microtubule-associated proteins play an essential role in the autophagy pathway. The fact that LC3 microtubule-associated protein is completely absent in diabetic brain, a risk factor for AD, whereas the protein was expressed in the TwX-treated group is significant, suggesting that TwX may maintain autophagy function.
2.5. Effect on Telomere
Telomere length in tail DNA from 65-week-old aged spontaneously hyperglycemic mice was significantly longer in the TwX-treated group than in the same-week-old non-treated (Control) group (Figure 7).
.Telomere length is considered a biological marker of age. Located at the ends of chromosomes, telomeres shorten as cells divide during the aging process [43]. Recent reports have suggested that telomere shortening is a potential factor in the development of aging-related diseases and AD [44,45,46], and that shorter telomeres tend to be present in dementia patients [47].
The primary function of telomeres is to protect the ends of chromosomes from degrading and fusing with adjacent chromosomes. Telomeres also play an important role in the mechanism of genome replication, repair, and maintenance [48]. Many reports have shown involvement of telomeres in neurodegeneration and neurodegenerative disease processes [47,49]. Telomere shortening has been associated with cognitive dysfunction and amyloid pathology in AD and plays an important role in the pathogenesis of AD through mechanisms of oxidative stress and inflammation [50]. Whether the elongation of telomere length with TwX is the result of improvements in various factors involved in AD development and progression, such as reduction of ROS and protection of mitochondria, or whether telomere lengthening prevents AD, is unknown. However, the results show that TwX results in telomere lengthening.
2.6. Neurogenesis
In the hippocampal dentate gyrus of 56-week-old aged mice, Tuj-1, a marker of neurons during early development, was markedly decreased. On the other hand, the same week-old TwX-treated group suppressed the age-related decrease in Tuj-1 in the hippocampal dentate gyrus and maintained numbers similar to those of younger (6 weeks old) mice (Figure 8).
.In adult mammalian brain regions, including humans, neurogenesis is well known to occur throughout life. Adult neurogenesis is determined by neurotrophins, growth factors, hormones, exercise, ischemia, and trauma. However, with aging, the capacity for neurogenesis declines and its number decreases [51]. In the present study, we observed that there are fewer newborn neurogenic cells due to aging.
Not only aging but also neurotoxic degeneration causes a decrease in newborn neurogenic cells. Viable progenitor cells have been found to remain in aged normal and AD brains.
Progenitor cells from AD and aged normal control specimens can differentiate into tubulin-positive and Tuj-1-positive neurons and GFAP-positive astrocytes. However, there are significantly fewer viable progenitor cells in the hippocampus of AD patient brains compared to age-matched normal controls [52]. This translates into a lack of function in AD brains to compensate for neurons lost due to aging and neurodegeneration.
The present study results that TwX suppresses the decrease of newborn neurogenic cells in the old mouse brain; whether TwX can suppress the decrease of newborn neurogenic cells in the AD brain is not known. However, TwX can certainly affect neurogenesis in the brain. Further studies are needed to examine the effects of TwX on progenitor cells and neurogenic cell fields in the AD brain, which may be useful for prevention and treatment.
2.7. Effects on Brain Functions
Chronic cerebral hypoperfusion (CCH) is common in aged AD mice and has been shown to accelerate their AD pathology [53,54,55,56]. CCH significantly worsened motor dysfunction in AD mice over 5 months old and cognitive impairment in APP23 mice over 8 months old. As well as neuronal loss, extracellular Aβ plaque and intracellular oligomer formation, and amyloid angiopathy were observed at 12 months. Mouse models of AD with CCH (CCH + APP23 mice) showed significantly upregulated MMP-9 (involved in blood-brain barrier destruction), accelerated neurovascular remodeling, and inhibited neurovascular trophic connections. In addition, loss of hippocampal neurons and expression of oxidative stress markers (4-HNE, 8-OHdG, nitrotyrosine), p-tau and phospho-α-synuclein were significantly increased. Treating CCH+APP23 mice with TwX (20 mg/kg/d) improved motor coordination and working memory, restored loss of hippocampal neurons, and attenuated Aβ, inflammatory response and oxidative stress markers (p<0.05) [53,54]. Additionally, Studies have shown that TwX significantly inhibited Aβ Oligomer(AβO)-induced phosphorylation of tau protein, improved cell morphology, suppressed intracellular ROS, and even improved cell viability (p < 0.01) [57].
In 2019, a prospective, multicenter, randomized, double-blind, placebo-controlled intervention clinical trial in MCI, a precursor to human dementia, showed that TwX intake significantly improved Mini Mental State Examination (MMSE) and Revised Hasegawa's Dementia Scale (HDS-R) score compared to controls (p<0.05) [13].
Moreover, in a mouse model of ischemic stroke, TwX reduced infarct size, oxidative stress, and inflammatory markers, showing neuroprotective effects (p<0.05) [58].
3. Materials and Methods
3.1. Materials
TwX is a mixture consisting of L-glutamine (34.6 wt%), ascorbic acid (34.2 wt%), L-cystine (18.2 wt%), coenzyme Q10 (3.6 wt%; AQUA Q10 P40-NF, Nissin Pharmaceutical, Tokyo, Japan), succinic acid (3.6 wt%), fumaric acid (3.6 wt%), riboflavin (1.5 wt%; Bislase inj; Toa Eiyo, Tokyo, Japan), and niacin amid (.7 wt%),. MiliQ water (Millipore) was used to dissolve the TwX mixture. TwX solution was stored at 4 ℃ until use.
3.2. Antioxidant Measurement of Solutions
The antioxidant capacity of TwX and vitamin C solutions was determined using the OXY adsorption test (Diacron International Srl, Grosseto, Italy).
The OXY adsorption test accurately captures the antioxidant capacity of a sample by measuring its ability to scavenge hypochlorous acid (HClO), one of the most potent ROS produced by white blood cells.
TwX solution (60 mg/ml) and the same amount of Vitamin C solution (20.5 mg/ml) contained in TwX were prepared on the day of the assay, and the OXY adsorption test was performed according to the kit's instructions. Both tests were performed in duplicate, and the average value was used.
3.3. Intracellular and Intramitochondrial Redox Changes In Vitro
To characterize the antioxidant properties TwX, parameters of the redox state following the induction of oxidative stress by hydrogen peroxide (H2O2) in HepG2 cells was assessed. The study was conducted by ICDD-sas (France). The Mitosafe® technology, developed by ICDD-sas, was used. It consists in the study of integrated mechanisms controlling mitochondrial function within live cells. Briefly, analyses were carried out with TwX, measuring it antioxidant properties toward parameters of the redox state following the induction of oxidative stress by H2O2 (100µM) in HepG2 cells. TwX was compared to the reference antioxidant agent, Trolox. The following outcomes were measured: the mitochondrial and cellular reactive oxygen species (mtROS, cROS) production rate, Mn-SOD and Cu/Zn-SOD activities, and the total glutathione level. All data were recorded by the SkanIt software (Thermo), and Student’s t-test was used for statistical analysis.
3.4. Metabolome Analysis
3.4.1. Cell Preparation
HepG2 cells were cultured in 12 dishes (Φ10 cm) in Dulbecco's Modified Eagle medium (DMEM, Fujifilm Wako, Osaka, Japan) with 10% FBS (HyClone™, VA, USA) in a CO2 incubator at 37°C. After reaching confluency, TwX (60 µg/ml) was added to HepG2 cells in three dishes. One hour later, each TwX-stimulated and non-stimulated (Control) dish served as one sample and was subjected to metabolite extraction for CE-TOFMS (n=3) and LC-TOFMS (n=3) analysis.
3.4.2. Metabolite Extraction for CE-TOFMS
Culture medium was aspirated from the dish, and the cells were washed twice with 5% mannitol solution (10 mL and 2 mL for the first and second wash, respectively). The cells were then treated with 800 µL of methanol and incubated at room temperature for 30 sec to suppress enzyme activity. Next, 550 µL of Milli-Q water containing internal standards (H3304-1002, Human Metabolome Technologies, Inc. (HMT), Tsuruoka, Yamagata, Japan) was added to the cell extract, followed by further incubation at room temperature for 30 sec. The cell extract was then centrifuged at 2,300 ×g, 4ºC for 5 min, after which 700 µL of the supernatant was centrifugally filtered through a Millipore 5-kDa cutoff filter (UltrafreeMC-PLHCC, HMT) at 9,100 ×g, 4ºC for 120 min to remove macromolecules. Subsequently, the filtrate was evaporated to dryness under vacuum and reconstituted in 50 µL of Milli-Q water for metabolome analysis at HMT.
3.4.3. Metabolite Extraction for LC-TOFMS
Culture medium was aspirated from the dish, and the cells were washed twice with 5% mannitol solution (10 mL and 2 mL for the first and second wash, respectively). The cells were then treated with 1,300 µL of ethanol containing internal standards (H3304-1002, Human Metabolome Technologies, Inc. (HMT), Tsuruoka, Yamagata, Japan), transferred into a tube and re-suspended in 1,000 µl of Milli-Q water. The cell solution was sonicated for 5 min, and centrifuged at 2,300 ×g, 4ºC for 5 min. Subsequently, the supernatant was evaporated to dryness under nitrogen and reconstituted in 100 µL of 50% isopropanol (v/v) for metabolome analysis at HMT.
3.4.4. Analysis
Metabolome analysis was conducted according to HMT’s Dual Scan package, using CE-TOFMS and LC-TOFMS based on the methods described previously [59,60]. Briefly, CE-TOFMS analysis was carried out using an Agilent CE capillary electrophoresis system equipped with an Agilent 6210 time-of-flight mass spectrometer (Agilent Technologies, Inc., Santa Clara, CA, USA). LC-TOFMS analysis was carried out by Agilent 1200 HPLC pump with an Agilent 6210 time-of-flight mass spectrometer (Agilent Technologies). The systems were controlled by Agilent G2201AA ChemStation software version B.03.01 for CE (Agilent Technologies) and MassHunter for LC (Agilent Technologies). The spectrometer was scanned from m/z 50 to 1,000 and peaks were extracted using MasterHands, automatic integration software (Keio University, Tsuruoka, Yamagata, Japan) in order to obtain peak information including m/z, peak area, migration time (MT) for CE-TOFMS and retention time (RT) for LC-TOFMS analyses [61]. Signal peaks corresponding to isotopomers, adduct ions, and other product ions of known metabolites were excluded, and the remaining peaks were annotated according to HMT’s metabolite database based on their m/z values and MTs or RTs. Areas of the annotated peaks were then normalized to internal standards and sample amount in order to obtain relative levels of each metabolite. HCA and principal component analysis (PCA) [62] were performed by HMT’s proprietary MATLAB and R programs, respectively. Detected metabolites were plotted on metabolic pathway maps using VANTED software [63].
3.5. Animals
All experimental procedures were approved by the Animal Committee of the Gifu University Graduate School of Medicine. In all experiments, C57BL/ 6JJcl male mice obtained from Japan SLC (Shizuoka, Japan) were used throughout the study. Mice were maintained in a temperature and humidity-regulated room (23±3℃, 50±10%) on a 12-hour light– dark cycle and allowed free access to food and water unless otherwise mentioned.
3.6. Preparation of Old Spontaneous Hyperglycemia Model Mice
C57BL/6J mice (5 weeks old, male) were acclimatized for 7 days, and then fed a high-fat diet HFD-60 (Oriental Yeast Co., Ltd.) ad libitum, except for the negative control (NC group, n=2). Once the fasting blood glucose level of the mice reached 100 mg/dl, the mice were divided into two groups: a non-TwX group (sterile water, Control group, n=12) and a TwX group (40 mg/kg/day, TwX group, n=12) so that the fasting blood glucose level and body weight of the mice were equalized. After grouping, each mouse was given the same volume of TwX-containing solution or sterile water by forced oral gavage once a day until the required weekly age for the experiment. These mice were designated as old spontaneously hyperglycemic mice.
3.7. Glucose Tolerance Test
Among the 41-week-old spontaneously hyperglycemic mice raised ad libitum on HFD-60 diet, individuals within ±5.0 g from the mean body weight of each group were subjected to the following tests (Control group, n=10; TwX group, n=8; NC group, n=2). After each mouse was fasted for 16 hours, blood samples were collected. Then, in the glucose tolerance test, all mice were given 1 g/kg glucose solution (Fuso Pharmaceutical Industries, Ltd., Osaka, Japan) intraperitoneally, and blood glucose levels were measured at each time point along a schedule (15, 30, 60, 120, 180 minutes after glucose loading) for precise blood glucose measurement with self-test glucose meter (Nipro Corporation, Osaka, Japan).
3.8. Measurement of Oxidative Stress in Blood
The d-ROMs test (Diacron-Reactive Oxygen Metabolites) was used to measure oxidative stress in mouse blood.
The d-ROMs test quantifies in vivo oxidative stress by capturing hydroperoxide (ROOH), a metabolite produced when ROS and free radicals oxidize body components. The old spontaneously hyperglycemic mice within ±5.0 g of the mean body weight of each group (Control group, n=10; TwX group, n=8; NC group, n=2) were fasted for 16 h and blood was collected, and plasma was measured according to the d-ROMs kit instructions.
3.9. Western Blotting
The hippocampal dentate gyrus was removed from the 70-week-old spontaneously hyperglycemic mice. Samples were homogenized, lysed, and total proteins were extracted for Western blotting. Rabbit anti-LC3 (catalog no. PM036, Medical & Biological Laboratories; x1000 dilution with1% skimmed milk) and rabbit Anti-IgG pAb-HRP (MBL, code no. 458; x5000 dilution with 1% skimmed milk) were used as primary and secondary antibody, respectively. Western blotting was performed by Genostaff Co.,Ltd. (Tokyo, Japan) according to the following procedure.
The lysates (50-100μg protein) were fractionated by SDS-polyacrylamide gel electrophoresis (PAGE) and then transferred onto polyvinylidene fluoride sheets (PVDF) membranes. After being blocked with 10% skimmed milk dissolved in PBS overnight at 4℃, transferred PVDF membranes were incubated 1 hour at room temperature with the primary antibodies. The membrane was incubated with secondary antibody for 1 hour at room temperature. After removing extra reagent from the membrane, membrane was exposed to an X-ray film in a dark room for 3 minutes and bands were detected with C-DiGit Blot Scanner (LI-COR, Nebraska USA).
3.10. Measurement of Relative Telomere Length
The tails of the 65-week-old spontaneously hyperglycemic mice fed ad libitum on HFD-60 diet were cut 5 mm long from the tip and immediately quenched with liquid nitrogen. The following procedures were contracted to BioGate Co., Ltd (Gifu, Japan). MagExtractor Genome (TOYOBO NPK-1) was used for mouse tail genome extraction according to the manufacturer's instructions. The frozen mouse tails were filled with 850 µL of lysate and homogenized in a micro-homogenizer. Samples were centrifuged at 10000 rpm for 5 min, 40 µL of magnetic beads were added to the supernatant and mixed vigorously for 10 min, the supernatant was removed with a magnetic stand, washed twice with 900 µL of washing solution and twice with 70% ethanol, and then DNA was separated and eluted with 60 µL sterile water. Telomere length from the isolated DNA was measured with Relative Mouse Telomere Length Quantification qPCR Assay Kit (ScienCell M8908) and KOD-SYBR qPCR Mix (TOYOBO QKD-201) according to manufacturer instructions.
3.11. Neurogenesis in Hippocampal Dentate GYRUS
C57BL/6J mice were purchased at 15 weeks of age and reared under sterile water ad libitum until 26 weeks of age. Based on blood oxidative stress level (d-ROMs test, Diacron International Srl,) and blood antioxidant capacity (BAP test, OXY adsorbent-test, both Diacron International Srl,), mice were divided into control group (n=5) and the TwX group (n=5). The TwX group was fed ad libitum with TwX mixed in drinking water at 40 mg/kg/day.
Additionally, C57BL/6J mice were purchased at 5 weeks of age and acclimatized for 1 week to serve as a comparison group of young mice (n=5).
Mice were reared until 56 weeks of age and intracardially perfused with PBS. Brains were then perfused with 4% paraformaldehyde in PBS (PFA; pH 7.4-7.5), post-fixed with PFA, and sectioned into 10-µm coronal sections using a microslicer (Dousaka EM, Kyoto, Japan).
The obtained sections were subjected to immunostaining targeting tubulin III (TuJ-1) as previously reported [64], and the number of positive cells was measured by Prof. Tatsuki Ito of Kinki University.
4. Conclusions
TwX is thought to break the persistent cycle of inflammation and mitochondrial dysfunction by suppressing ROS. This could ensure mitochondrial energy production, telomere length, and autophagy function, thereby preventing dementia. TwX with its novel blend of antioxidants can potentially contribute to the prevention and treatment of AD in the future.
Supplementary Materials
The following supporting information can be downloaded at the website of this paper posted on Preprints.org. Table S1. Relative area and comparative analysis of HepG2 metabolites near the glycolytic and TCA circuits.
Author Contributions
Conceptualization, H.I.; Data curation, F.Y. and Y.H.; Investigation, F.Y. and Y.H.; Methodology, H.I. and F.Y.; Project administration, F.Y.; Supervision, T.Y.; Validation, F.Y. and Y.H.; Visualization, F.Y. and Y.H.; Writing - original draft, F.Y. and Y.H.; Writing - review & editing, H.I. and T.Y. All authors have read and agreed to the published version of the manuscript.
Funding
This research was funded by TIMA Establishment (Liechtenstein). All patents and trademarks of Twendee X® and Oxicut® are sole property of TIMA Establishment (Liechtenstein).
Institutional Review Board Statement
The study was conducted according to the guidelines of the Declaration of Helsinki. The animal studies were approved by the Animal Committee of the Gifu University Graduate School of Medicine. Approvement Numbers: 26-40, 29-96.
Acknowledgments
The authors thank Dr. Tatsuki Ito (Department of Food Science and Nutrition, Kinki University) for sharing his expertise on neurons in a brain and for his assistance in counting cells.
Conflicts of Interest
FY, YH and HI are employees of Gifu University. The Division of Anti-oxidant Research is a laboratory that has been established to the Life Science Research Center, Gifu University. based on a research fund from the TIMA Establishment (Liechtenstein). TY is advisor of TIMA Establishment (Liechtenstein). The sponsor had no control over the interpretation, writing, or publication of this work.
References
- Dominguez, L.J.; Veronese, N.; Vernuccio, L.; Catanese, G.; Inzerillo, F. : Salemi, G.; Barbagallo, M. Nutrition, Physical Activity, and Other Lifestyle Factors in the Prevention of Cognitive Decline and Dementia. Nutrients. 2021, 13, 4080. [Google Scholar] [CrossRef]
- Reddy, P.H.; Oliver, D.M. Amyloid Beta and Phosphorylated Tau-Induced Defective Autophagy and Mitophagy in Alzheimer's Disease. Cells. 2019, 8, 488. [Google Scholar] [CrossRef]
- Selkoe, D.J. Alzheimer’s disease: Genes, proteins, and therapy. Physiol Rev. 2001, 81, 741–766. [Google Scholar] [CrossRef]
- Reddy, P.H.; Manczak, M.; Yin, X.; Grady, M.C.; Mitchell, A.; Tonk, S.; Kuruva, C.S.; Bhatti, J.S.; Kandimalla, R.; Vijayan, M.; et al. Protective Effects of Indian Spice Curcumin Against Amyloid Beta in Alzheimer’s Disease. J Alzheimers Dis. 2018, 61, 843–866. [Google Scholar] [CrossRef]
- Butterfield, D.A.; Halliwell, B. Oxidative stress, dysfunctional glucose metabolism, and Alzheimer disease. Nat Rev Neurosci. 2019, 20, 148–160. [Google Scholar] [CrossRef]
- Cioffi, F.; Adam, R.H.I.; Broersen, K. Molecular Mechanisms and Genetics of Oxidative Stress in Alzheimer’s Disease. J Alzheimers Dis. 2019, 72, 981–1017. [Google Scholar] [CrossRef]
- Butterfield, D.A.; Boyd-Kimball, D. Redox Proteomics and Amyloid β-Peptide: Insights into Alzheimer Disease. J Neurochem. 2019, 151, 459–487. [Google Scholar] [CrossRef]
- Gella, A.; Durany, N. Oxidative stress in Alzheimer disease. Cell Adh Migr. 2009, 3, 88–93. [Google Scholar] [CrossRef]
- Chen, Z.; Zhong, C. Oxidative stress in Alzheimer's disease. Neurosci Bull. 2014, 30, 271–281. [Google Scholar] [CrossRef]
- Reddy, P.H.; Tripathi, R.; Troung, Q.; Tirumala, K.; Reddy, T.P.; Anekonda, V.; Shirendeb, U.P.; Calkins, M.J.; Reddy, A.P.; Mao, P.; et al. Abnormal mitochondrial dynamics and targeted antioxidant therapeutics. Biochim. Biophys. Acta. 2011, 1822, 639–649. [Google Scholar] [CrossRef]
- Pugazhenthi, S.; Qin, L.; Reddy, P.H. Common neurodegenerative pathways in obesity, diabetes, and Alzheimer’s disease. Biochim Biophys Acta Mol Basis Dis. 2017, 1863, 1037–1045. [Google Scholar] [CrossRef]
- Petersen, R.C.; Thomas, R.G.; Grundman, M.; Bennett, D.; Doody, R.; Ferris, S.; Galasko, D.; Jin, S.; Kaye, J.; Levey, A.; et al. Vitamin E and donepezil for the treatment of mild cognitive impairment. N Engl J Med. 2005, 352, 2379–2388. [Google Scholar] [CrossRef] [PubMed]
- Tadokoro, K.; Morihara, R.; Ohta, Y.; Hishikawa, N.; Kawano, S.; Sasaki, R.; Matsumoto, N.; Nomura, E.; Nakano, Y.; Takahashi, Y.; et al. Clinical Benefits of Antioxidative Supplement Twendee X for Mild Cognitive Impairment: A Multicenter, Randomized, Double-Blind, and Placebo-Controlled Prospective Interventional Study. J Alzheimers Dis. 2019, 71, 1063–1069. [Google Scholar] [CrossRef]
- Inufusa, H. Characterization of cell protection effects of Twendee X by oxidative stress. J World Mitochondria Soc. 2016, 2, 42. [Google Scholar]
- Inufusa, H. Composition for protection against cytotoxic effects. TIMA Foundation. Patent No. 5777821, 2015-9-9.
- Halliwell, B. Oxidative stress and neurodegeneration: where are we now? J Neurochem. 2006, 97, 1634–1658. [Google Scholar] [CrossRef]
- Cooke, M.S.; Evans, M.D.; Dizdaroglu, M.; Lunec, J. Oxidative DNA damage: mechanisms, mutation, and disease. FASEB J. 2003, 17, 1195–1214. [Google Scholar] [CrossRef]
- Cadet, J.; Delatour, T.; Douki, T.; Gasparutto, D.; Pouget, J.P.; Ravanat, J.L.; Sauvaigo, S. Hydroxyl radicals and DNA base damage. Mutat Res. 1999, 424, 9–21. [Google Scholar] [CrossRef]
- Filomeni, G.; De, Zio, D. ; Cecconi, F. Oxidative stress and autophagy: the clash between damage and metabolic needs. Cell Death Differ. 2015, 22, 377–388. [Google Scholar] [CrossRef]
- Halim, M.; Halim, A. The effects of inflammation, aging and oxidative stress on the pathogenesis of diabetes mellitus (type 2 diabetes). Diabetes Metab Syndr. 2019, 13, 1165–1172. [Google Scholar] [CrossRef]
- Hakim, J. Reactive oxygen species and inflammation. C R Seances Soc Biol Fil. 1993, 187, 286–295. [Google Scholar]
- Butterfield, D.A.; Reed, T.; Newman, S.F.; Sultana, R. Roles of amyloid beta-peptide-associated oxidative stress and brain protein modifications in the pathogenesis of Alzheimer’s disease and mild cognitive impairment. Free Radic Biol Med. 2007, 43, 658–677. [Google Scholar] [CrossRef] [PubMed]
- Sano, M.; Ernesto, C.; Thomas, R.G.; Klauber, M.R.; Schafer, K.; Grundman, M.; Woodbury, P.; Growdon, J.; Cotman, C.W.; Pfeiffer, E.; et al. A controlled trial of selegiline, alpha-tocopherol, or both as treatment for Alzheimer disease. The Alzheimer’s Disease Cooperative Study. N Engl J Med. 1997, 336, 1216–1222. [Google Scholar] [CrossRef] [PubMed]
- Grundman, M. Vitamin E and Alzheimer disease: the basis for additional clinical trials. Am J Clin Nutr. 2000, 71, 630S–636S. [Google Scholar] [CrossRef] [PubMed]
- Petersen, R.C.; Thomas, R.G.; Grundman, M.; Bennett, D.; Doody, R.; Ferris, S.; Galasko, D.; Jin, S.; Kaye, J.; Levey, A.; et al. Vitamin E and donepezil for the treatment of mild cognitive impairment. N Engl J Med. 2005, 352, 2379–2388. [Google Scholar] [CrossRef]
- Monacelli, F.; Acquarone, E.; Giannotti, C.; Borghi, R.; Nencioni, A. Vitamin C, Aging and Alzheimer's Disease. Nutrients. 2017, 9, 670. [Google Scholar] [CrossRef]
- Feng, T.; Yamashita, T.; Tsunoda, K.; Matsumoto, N.; Tadokoro, K.; Sasaki, R.; Abe, K. In Vitro Free Radical Scavenging Activities of Dietary Supplements by Electron Spin Resonance. Brain Supplements. 2020, 2, 1–12. [Google Scholar]
- Yamaguchi, F.; Yoshimura, Y.; Nakazawa, H.; Ariga, T. Free Radical Scavenging Activity of Grape Seed Extract and Antioxidants by Electron Spin Resonance Spectrometry in an H2O2/NaOH/DMSO System. J Agric Food Chem. 1999, 47, 2544–2548. [Google Scholar] [CrossRef]
- Yoshimura, Y.; Inomata, T.; Nakazawa, H.; Kubo, H.; Yamaguchi, F.; Ariga, T. Evaluation of Free Radical Scavenging Activities of Antioxidants with an H2O2/NaOH/DMSO System by Electron Spin Resonance. J Agric Food Chem. 1999, 47, 4653–4656. [Google Scholar] [CrossRef]
- Fukui, K.; You, F.; Kato, Y.; Kimura, M.; Harakawa, Y.; Yoshikawa, T.; Inufusa, H. Twendee X, a mixed antioxidant supplement, improves cognitive function, coordination, and neurotrophic factor expression in long-term vitamin E-deficient mice. J Clin Biochem Nutr. 2023, 72, 93–100. [Google Scholar] [CrossRef]
- Rossi, S.; Zanier, E.R.; Mauri, I.; Columbo, A.; Stocchetti, N. Brain temperature, body core temperature, and intracranial pressure in acute cerebral damage. J Neurol Neurosurg Psychiatry. 2001, 71, 448–454. [Google Scholar] [CrossRef]
- Yin, F.; Sancheti, H.; Patil, I.; Cadenas, E. Energy metabolism and inflammation in brain aging and Alzheimer's disease. Free Radic Biol Med. 2016, 100, 108–122. [Google Scholar] [CrossRef] [PubMed]
- Du, H.; Guo, L.; Yan, S.; Sosunov, A.A.; McKhann, G.M.; Yan, S.S. Early deficits in synaptic mitochondria in an Alzheimer’s disease mouse model. PNAS. 2010, 107, 18670–18675. [Google Scholar] [CrossRef] [PubMed]
- Cai, Q.; Tammineni, P. Alterations in Mitochondrial Quality Control in Alzheimer’s Disease. Front Cell Neurosci. 2016, 10, 24. [Google Scholar] [CrossRef] [PubMed]
- Wang, X.; Su, B.; Siedlak, S.L.; Moreira, P.I.; Fujioka, H.; Wang, Y.; Casadesus, G.; Zhu, X. Amyloid-beta overproduction causes abnormal mitochondrial dynamics via differential modulation of mitochondrial fission/fusion proteins. PNAS. 2008, 105, 19318–19323. [Google Scholar] [CrossRef]
- Wang, X.; Su, B.; Zheng, L.; Perry, G.; Smith, M.A.; Zhu, X. The role of abnormal mitochondrial dynamics in the pathogenesis of Alzheimer’s disease. J Neurochem. 2009, 109, 153–159. [Google Scholar] [CrossRef]
- Blass, J.P.; Sheu, R.K.; Gibson, G.E. Inherent abnormalities in energy metabolism in Alzheimer disease. Interaction with cerebrovascular compromise. Ann N Y Acad Sci. 2000, 903, 204–221. [Google Scholar] [CrossRef]
- Blass, J.P.; Sheu, K.F.; Piacentini, S.; Sorbi, S. Inherent abnormalities in oxidative metabolism in Alzheimer's disease: interaction with vascular abnormalities. Ann N Y Acad Sci. 1997, 826, 382–385. [Google Scholar] [CrossRef]
- Cheng, G.; Huang, C.; Deng, H.; Wang, H. Diabetes as a risk factor for dementia and mild cognitive impairment: a meta-analysis of longitudinal studies. Intern Med J. 2012, 42, 484–491. [Google Scholar] [CrossRef]
- Biessels, G.J.; Staekenborg, S.; Brunner, E.; Brayne, C.; Scheltens, P. Risk of dementia in diabetes mellitus: a systematic review. Lancet Neurol. 2006, 5, 64–74. [Google Scholar] [CrossRef]
- Muriach, M.; Flores-Bellver, M.; Romero, F.J.; Barcia, J.M. Diabetes and the brain: oxidative stress, inflammation, and autophagy. Oxid Med Cell Longev. 2014, 2014, 102158. [Google Scholar] [CrossRef]
- Martinez-Vicente, M. Autophagy in neurodegenerative diseases: From pathogenic dysfunction to therapeutic modulation. Semin Cell Dev Biol. 2015, 40, 115–126. [Google Scholar] [CrossRef]
- Baird, D.M.; Kipling, D. The extent and significance of telomere loss with age. Ann N Y Acad Sci. 2004, 1019, 265–268. [Google Scholar] [CrossRef] [PubMed]
- Kuan, X.Y.; Fauzi, N.S.A.; Ng, K.Y.; Bakhtiar, A. Exploring the Causal Relationship Between Telomere Biology and Alzheimer’s Disease. Mol Neurobiol. 2023. [Google Scholar] [CrossRef] [PubMed]
- Boccardi, V.; Pelini, L.; Ercolani, S.; Ruggiero, C.; Mecocci, P. ; From cellular senescence to Alzheimer's disease: The role of telomere shortening. Ageing Res Rev. 2015, 22, 1–8. [Google Scholar] [CrossRef]
- Eitan, E.; Hutchison, E.R.; Mattson, M.P. Telomere shortening in neurological disorders: an abundance of unanswered questions. Trends Neurosci. 2014, 37, 256–263. [Google Scholar] [CrossRef]
- Flanary, B.E.; Sammons, N.W.; Nguyen, C.; Walker, D.; Streit, W.J. Evidence that aging and amyloid promotenmicroglial cell senescence. Rejuvenation Res. 2007, 10, 61–74. [Google Scholar] [CrossRef] [PubMed]
- Rampazzo, E.; Bertorelle, R.; Serra, L.; Terrin, L.; Candiotto, C.; Pucciarelli, S.; Del Bianco, P.; Nitti, D.; De Rossi, A. Relationship between telomere shortening, genetic instability, and site of tumour origin in colorectal cancers. Br J Cancer. 2010, 102, 1300–1305. [Google Scholar] [CrossRef]
- Jaskelioff, M.; Muller, F.L.; Paik, J.H.; Thomas, E.; Jiang, S.; Adams, A.C.; Sahin, E.; Kost-Alimova, M.; Protopopov, A.; Cadiñanos, J.; et al. Telomerase reactivation reverses tissue degeneration in aged telomerase-deficient mice. Nature. 2011, 469, 102–106. [Google Scholar] [CrossRef]
- Cai, Z.; Yan, L.J.; Ratka, A. Telomere shortening and Alzheimer's disease. Neuromolecular Med. 2013, 15, 25–48. [Google Scholar] [CrossRef]
- Chen, Y.; Sun, FY. Age-related decrease of striatal neurogenesis is associated with apoptosis of neural precursors and newborn neurons in rat brain after ischemia. Brain Res. 2007, 1166, 9–19. [Google Scholar] [CrossRef]
- Nogueras-Ortiz, CJ.; Mahairaki, V.; Delgado-Peraza, F.; Das, D.; Avgerinos, K.; Eren, E.; Hentschel, M.; Goetzl, EJ.; Mattson, MP.; Kapogiannis, D. Astrocyte- and Neuron-Derived Extracellular Vesicles from Alzheimer's Disease Patients Effect Complement-Mediated Neurotoxicity. Cells. 2020, 9, 1618. [Google Scholar] [CrossRef] [PubMed]
- Liu, X.; Yamashita, T.; Shang, J.; Shi, X.; Morihara, R.; Huang, Y.; Sato, K.; Takemoto, M.; Hishikawa, N.; Ohta, Y.; et al. Twendee X Ameliorates Phosphorylated Tau, α-Synuclein and Neurovascular Dysfunction in Alzheimer's Disease Transgenic Mice With Chronic Cerebral Hypoperfusion. J Stroke Cerebrovasc Dis. 2019, 28, 104310. [Google Scholar] [CrossRef]
- Liu, X.; Yamashita, T.; Shang, J.; Shi, X.; Morihara, R.; Huang, Y.; Sato, K.; Takemoto, M.; Hishikawa, N.; Ohta, Y.; Abe, K. Clinical and Pathological Benefit of Twendee X in Alzheimer's Disease Transgenic Mice with Chronic Cerebral Hypoperfusion. J Stroke Cerebrovasc Dis. 2019, 28, 1993–2002. [Google Scholar] [CrossRef]
- Shang, J.; Yamashita, T.; Zhai, Y.; Nakano, Y.; Morihara, R.; Fukui, Y.; Hishikawa, N.; Ohta, Y.; Abe, K. Strong impact of chronic cerebral hypoperfusion on neurovascular unit, cerebrovascular remodeling, and neurovascular trophic coupling in Alzheimer's Disease Model Mouse. J Alzheimers Dis. 2016, 52, 113–26. [Google Scholar] [CrossRef] [PubMed]
- Zhai, Y.; Yamashita, T.; Nakano, Y.; Sun, Z.; Shang, J.; Feng, T.; Morihara, R.; Fukui, Y.; Ohta, Y.; Hishikawa, N.; et al. Chronic cerebral hypoperfusion accelerates Alzheimer's disease pathology with cerebrovascular remodeling in a Novel Mouse Model. J Alzheimers Dis. 2016, 53, 893–905. [Google Scholar] [CrossRef] [PubMed]
- Hu, X.; Yamashita, T.; Yu, H.; Bian, Z.; Hu, X.; Feng, T.; Tadokoro, K.; Morihara, R.; Abe, K. Neuroprotective and Therapeutic Effects of Tocovid and Twendee X on Aβ Oligomer-Induced Damage in the SH-SY5Y Cell Line. Neurodegener Dis. 2021, 21, 117–125. [Google Scholar] [CrossRef]
- Kusaki, M.; Ohta, Y.; Inufusa, H.; Yamashita, T.; Morihara, R.; Nakano, Y.; Liu, X.; Shang, J.; Tian, F.; Fukui, Y.; et al. Neuroprotective Effects of a Novel Antioxidant Mixture Twendee X in Mouse Stroke Model. J Stroke Cerebrovasc Dis. 2017, 26, 1191–1196. [Google Scholar] [CrossRef]
- Y. Ohashi, A. Hirayama, T. Ishikawa, S. Nakamura, K. Shimizu et al.: Depiction of metabolome changes in histidine-starved Escherichia coli by CE-TOFMS. Mol. Biosyst. 2008, 4, 135–147.
- T. Ooga, H. Sato, A. Nagashima, K. Sasaki, M Tomita et al.: Metabolomic anatomy of an animal model revealing homeostatic imbalances in dyslipidaemia. Mol. Biosyst. 2011, 7, 1217–1223. [Google Scholar] [CrossRef]
- M. Sugimoto, D.T. Wong, A. Hirayama, T. Soga, M. Tomita: Capillary electrophoresis mass spectrometry-based saliva metabolomics identified oral, breast and pancreatic cancer–specific profiles. Metabolomics 2009, 6, 78–95. [Google Scholar]
- H. Yamamoto, T. Fujimori, H. Sato, G. Ishikawa, K. Kami, Y. Ohashi: Statistical hypothesis testing of factor loading in principal component analysis and its application to metabolite set enrichment analysis. BMC Bioinformatics 2014, 15, 51. [Google Scholar]
- B. H. Junker, C. Klukas, F Schreiber: VANTED: A system for advanced data analysis and visualization in the context of biological networks. BMC Bioinformatics. 2006, 7, 109. [Google Scholar]
- Zhu, HF.; Shao, Y.; Qin, L.; Wang, JH.; Feng, S.; Jiang, YB.; Wan, D. Catalpol Enhances Neurogenesis And Inhibits Apoptosis Of New Neurons Via BDNF, But Not The BDNF/Trkb Pathway. Drug Des Devel Ther. 2019, 13, 4145–4157. [Google Scholar] [CrossRef] [PubMed]
Figure 1.
In vitro antioxidant capacity of Twendee X®︎ (TwX) and vitamin C (VC) alone in TwX solution. The antioxidant capacity of TwX (60 mg/ml) and vitamin C alone (20.5 mg/ml) in the same concentration of TwX was measured by the OXY adsorbent test (Diacron International Srl, Grosseto, Italy). The tests were run in duplicates. **: p<0.01 (Student's t-test).
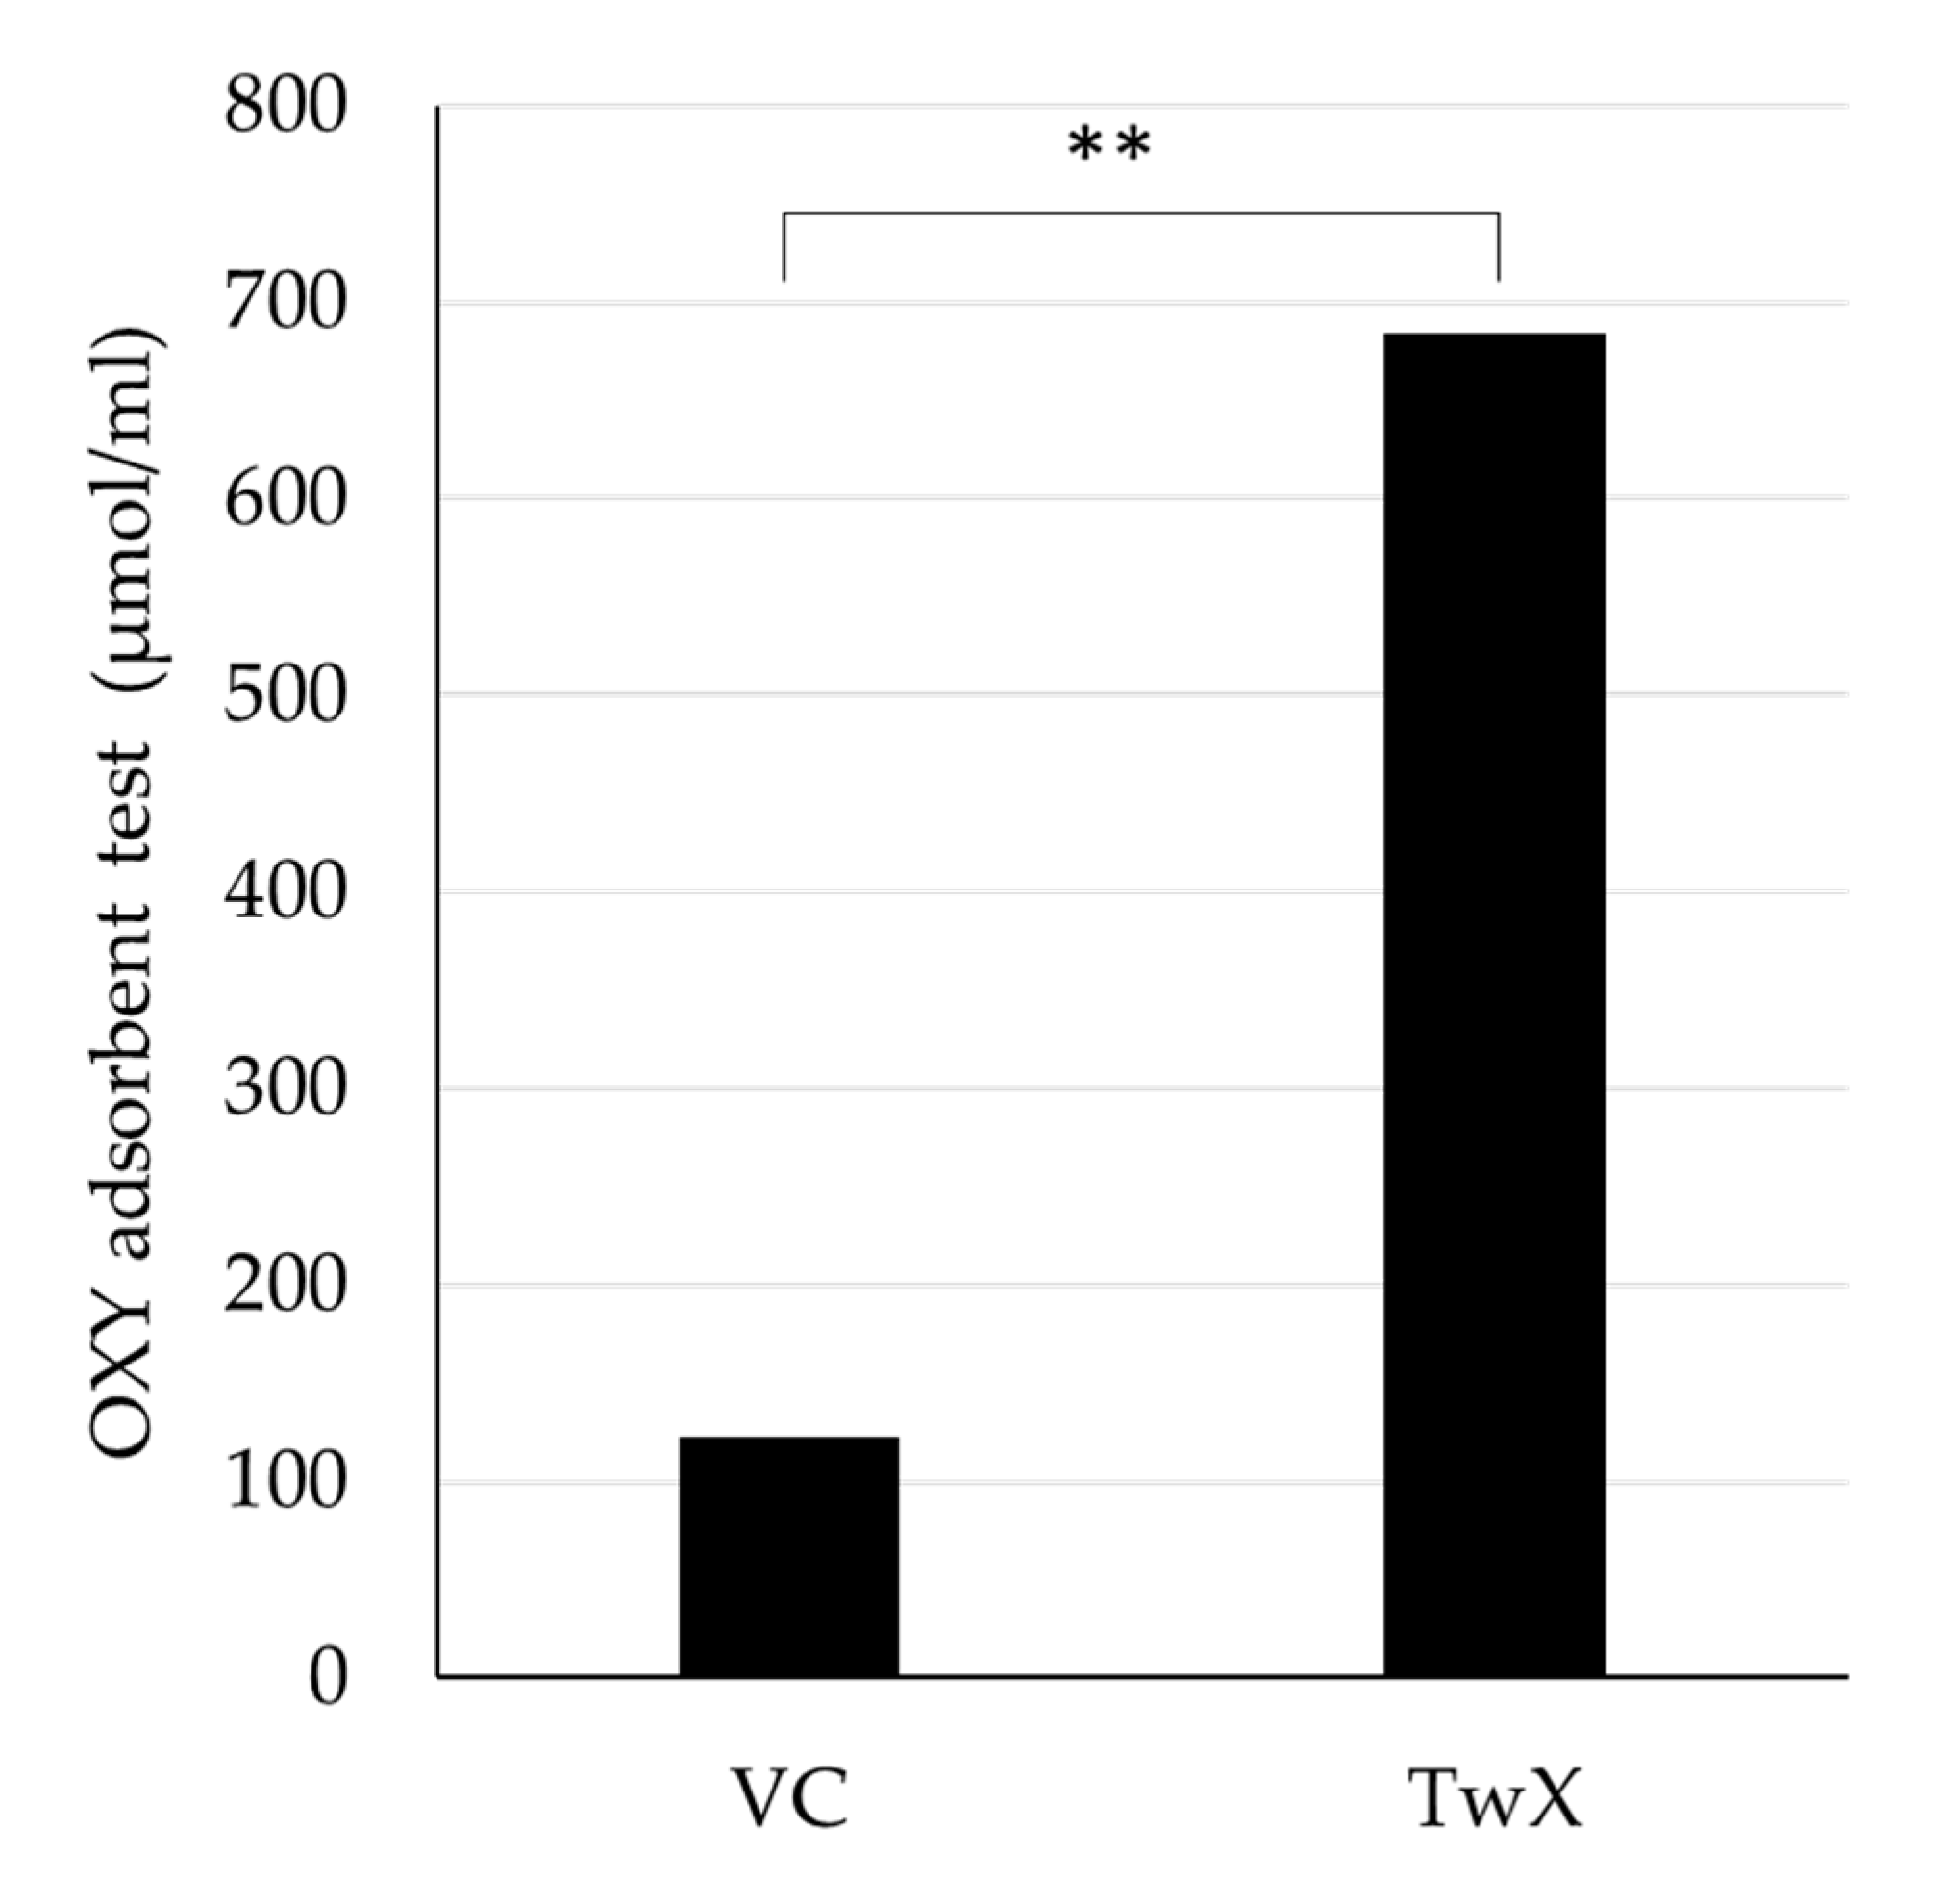
Figure 2.
Results of Hierarchical cluster analysis (HCA) of HepG2 metabolites. Twendee X®︎ (TwX) 60µg/ml was added to the human liver cancer cell line HepG2 and sampled 1 hour later. Unstimulated (Cont1-3) and TwX-stimulated cells (TwX1-3) were compared. The horizontal axis and vertical axis indicate the sample name and the peaks, respectively. HCA was performed on the peaks, and the distance between peaks is shown in the tree diagram in the figure. Darker green or red indicates smaller or larger than average, respectively.
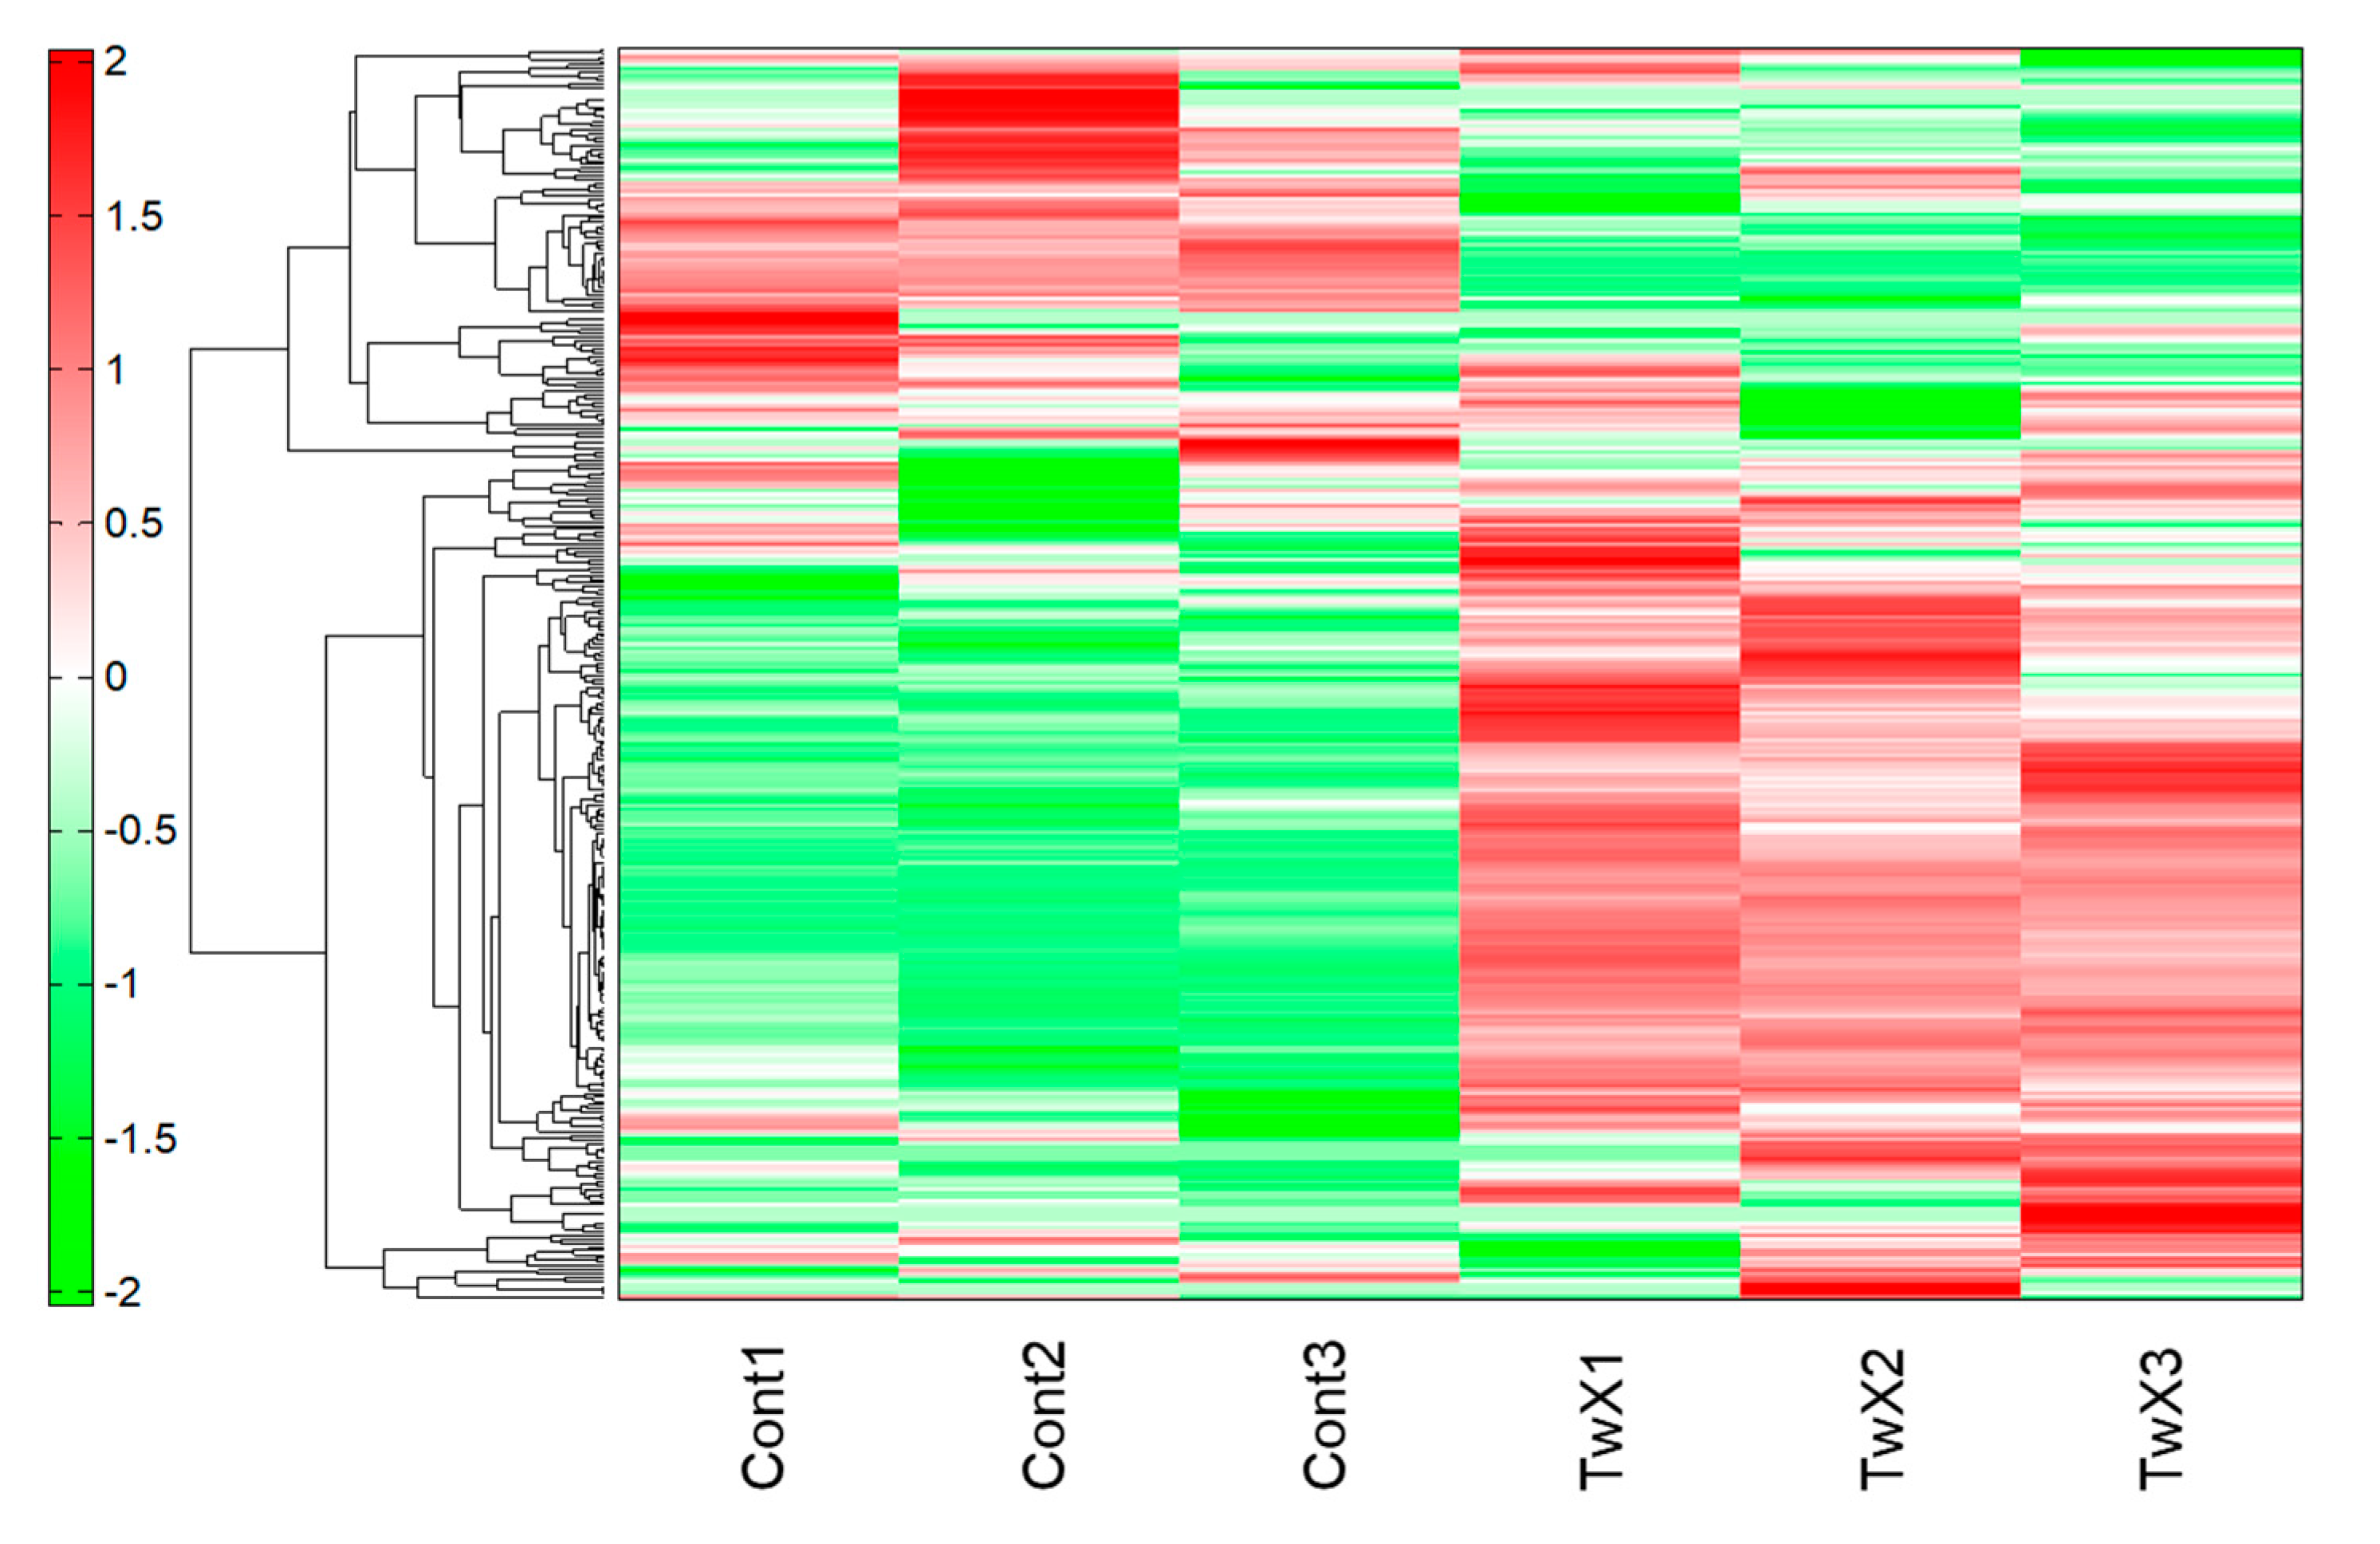
Figure 3.
HepG2 metabolite levels near the glycolytic and TCA circuits. Metabolites detected in this study are plotted in the metabolic pathway. The graph shows relative area values for Control (blue) and Twendee X®︎ (red). N.D. : Not Detected. 1,3-DPG, 1,3-Diphospoglycerate; 2-OG, 2-Oxoglutaric acid; 2-PG, 2-Phosphoglyceric acid; 3-HBA, 3-Hydroxybutyric acid; 3-PG, 3-Phosphoglyceric acid; 6-PG, 6-Phosphogluconic acid; AcCoA, Acetyl coenzyme A_divalent; ADP, Adenosine diphosphate; ADP-Rib, ADP-ribose; Ala, Alanine; Arg, Arginine; Asp, Aspartic acid; ATP, Adenosine triphosphate; CMP-NeuNAc, Cytidine-5'-monophosphate--N-acetylneuraminate; CoA, Coenzyme A_divalent; DHAP, Dihydroxyacetone phosphate; E4P, Erythrose 4-phosphate; F1,6P, Fructose 1,6-diphosphate; D-F1P, Fructose 1-phosphate; F6P, Fructose 6-phosphate; Gal1P, Galactose 1-phosphate; GDP-fucose, Guanosine diphosphate-fucose; GDP-Man, Guanosine diphosphate-mannose; Glu, Glucose; Glc-6P, Glucosamine 6-phosphate; G1P, Glucose 1-phosphate; G6P, Glucose 6-phosphate; GAP, Glyceraldehyde 3-phosphate; G3P, Glycerol 3-phosphate; Man1P, Mannose 1-phosphate; Man6P, Mannose 6-phosphate; Malonyl-CoA, Malonyl coenzyme A_divalent; GlcNAc, N-Acetylglucosamine; GlcNAc-P, N-Acetylglucosamine 1-phosphate; NAcGlcNP, N-Acetylglucosamine 6-phosphate; ManNAc, N-Acetylmannosamine; NeuNAc, N-Acetylneuraminic acid; NAD, Nicotinamide adenine dinucleotide; NADH, Reduced nicotinamide adenine dinucleotide; NADP, Nicotinamide adenine dinucleotide phosphate; NADPH, Reduced nicotinamide adenine dinucleotide phosphate_divalent; PEP, Phosphoenolpyruvic acid; PRPP, Phosphoribosyl pyrophosphate; R5P, Ribose 5-phosphate; Ru5P, Ribulose 5-phosphate; S7P, Sedoheptulose 7-phosphate; SucCoA, Succinyl coenzyme A_divalent; UDP-Glc, Uridine diphosphate-glucose; UDP-GlcA, Uridine diphosphate-glucuronic acid; UDP-GlcNAc, Uridine diphosphate-N-acetylglucosamine; X5P, Xylulose 5-phosphate.
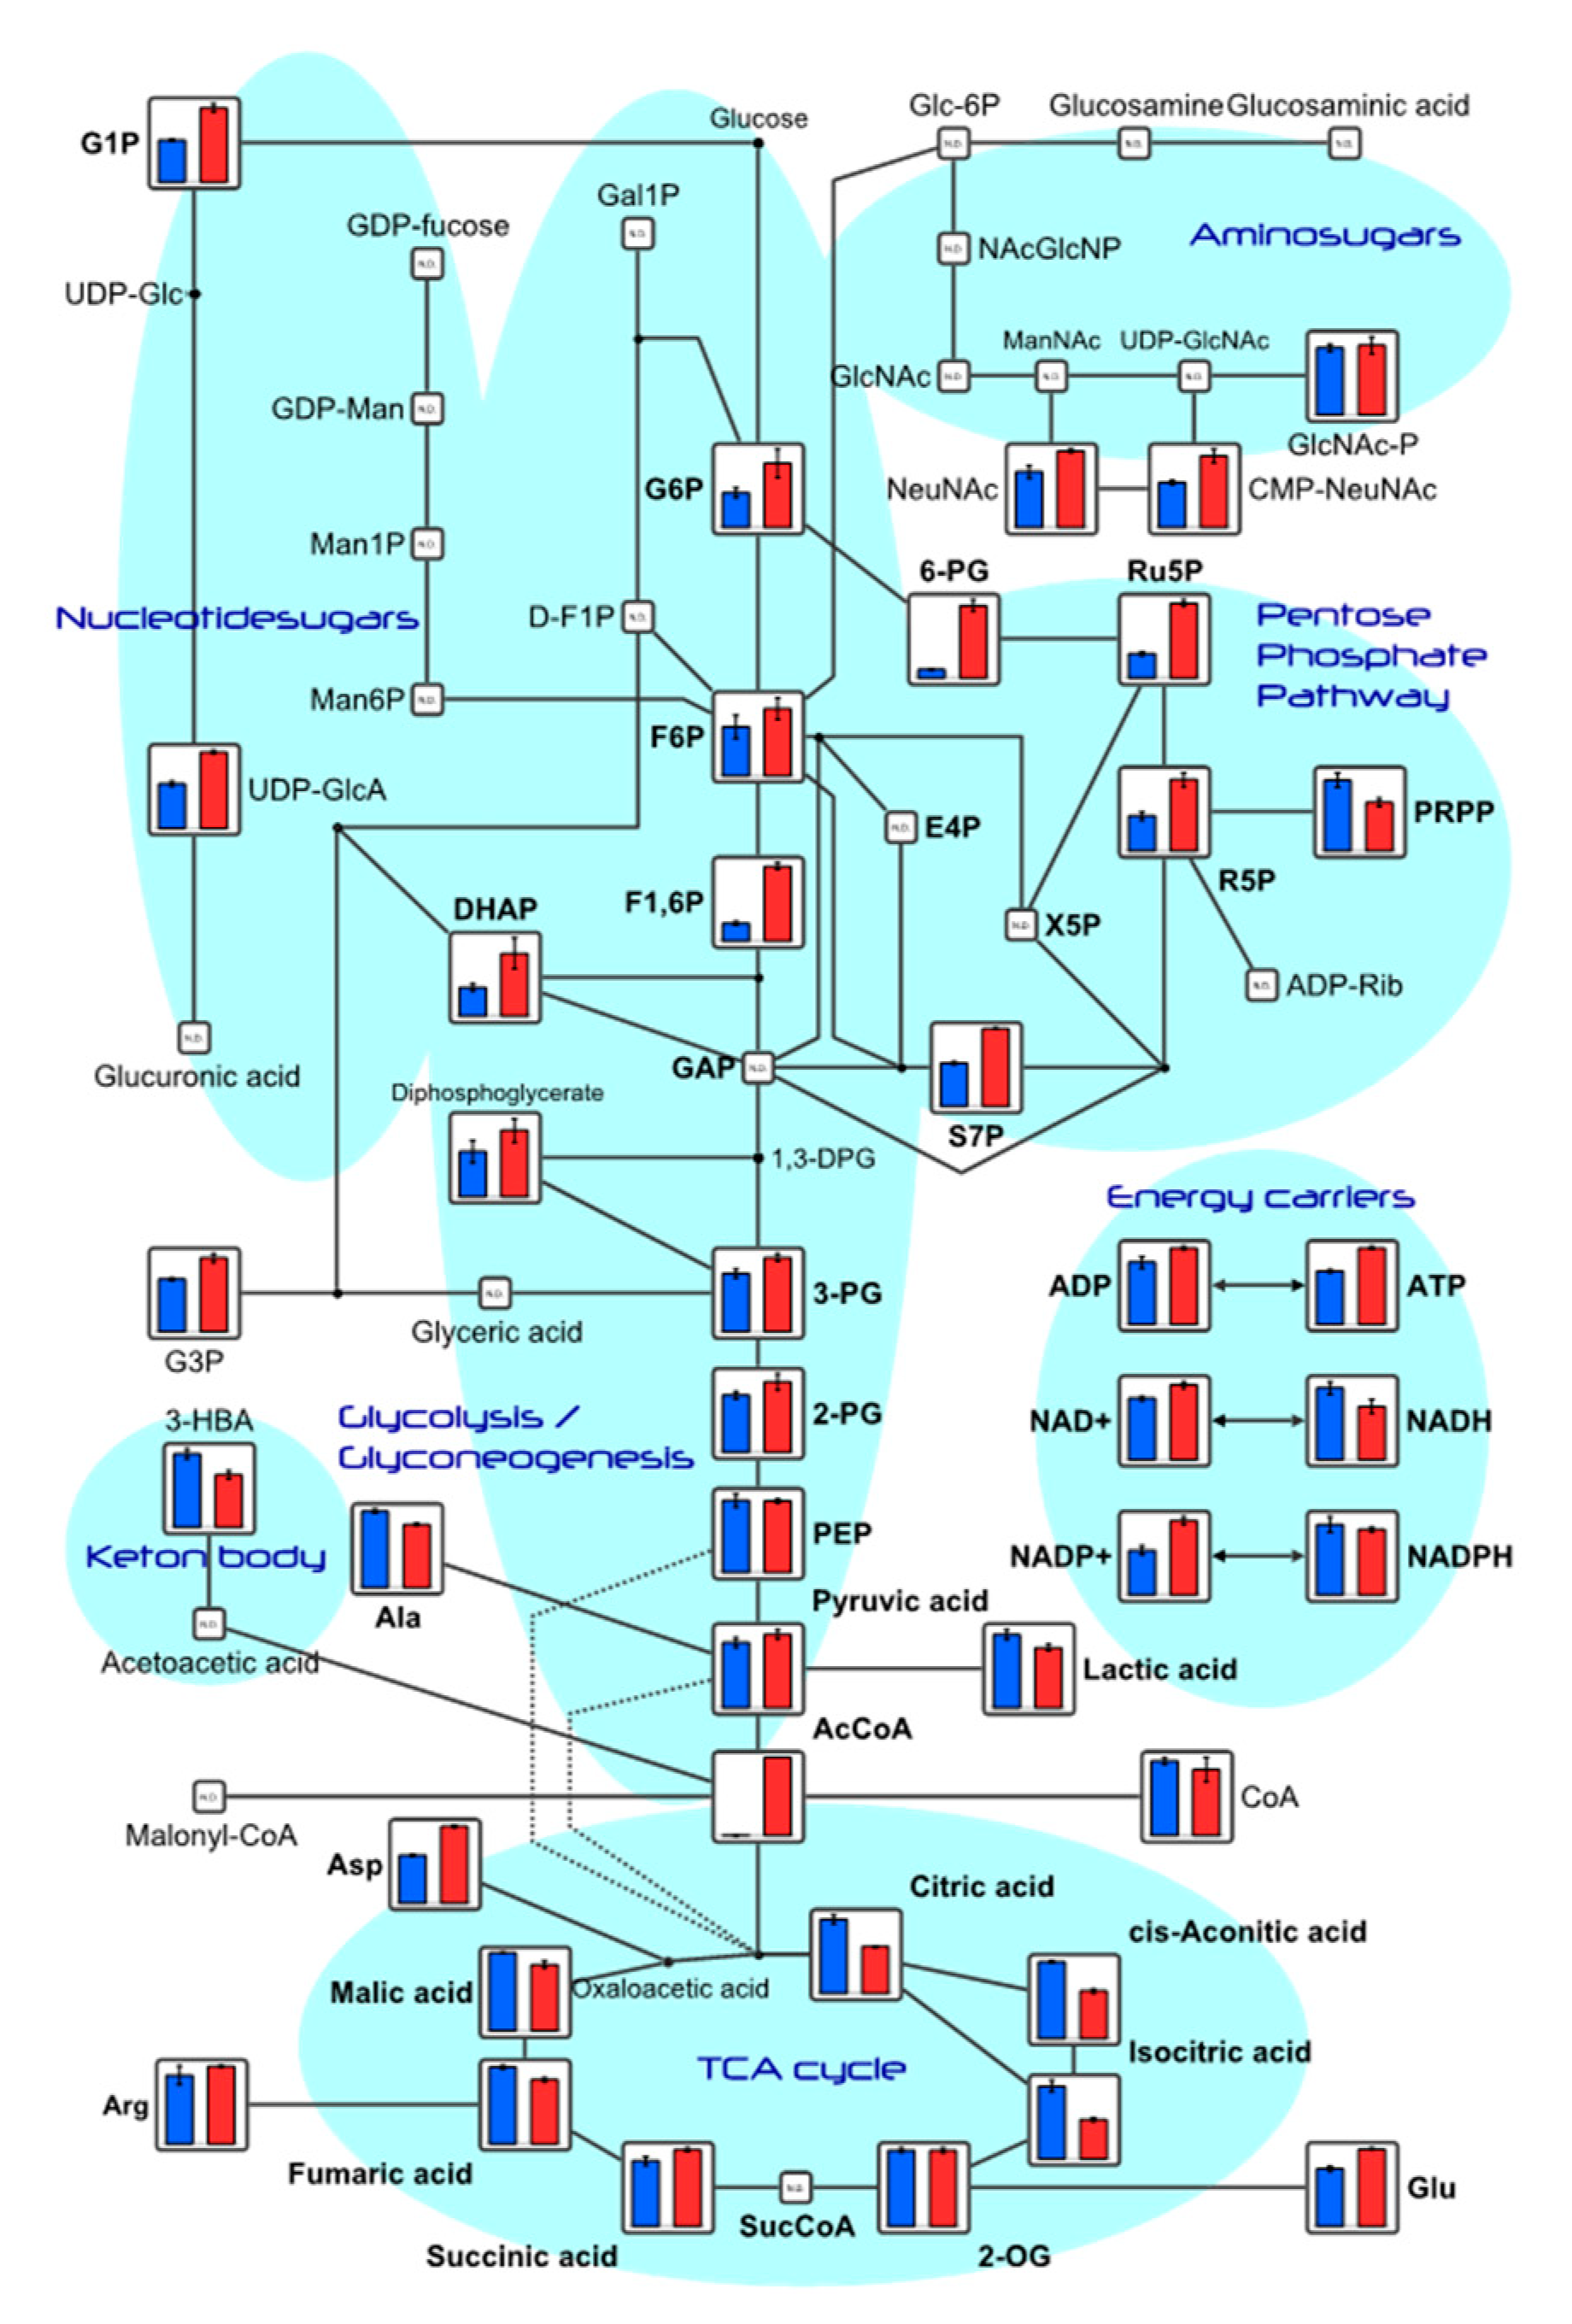
Figure 4.
Fasting blood oxidative stress in a mouse model of spontaneous diabetes mellitus. C57BL/6J spontaneous diabetic mice were administered sterile water (Control, n=10) or Twendee X®︎ (TwX, n=8) orally at 40 mg/kg/day. Untreated mice of the same age were kept as negative controls (NC, n=2). After fasting for 16 hours, blood oxidative stress level was measured by d-ROMs test (Diacron International Srl, Grosseto, Italy). ** : p<0.01 (Student’s t-test, vs NC).
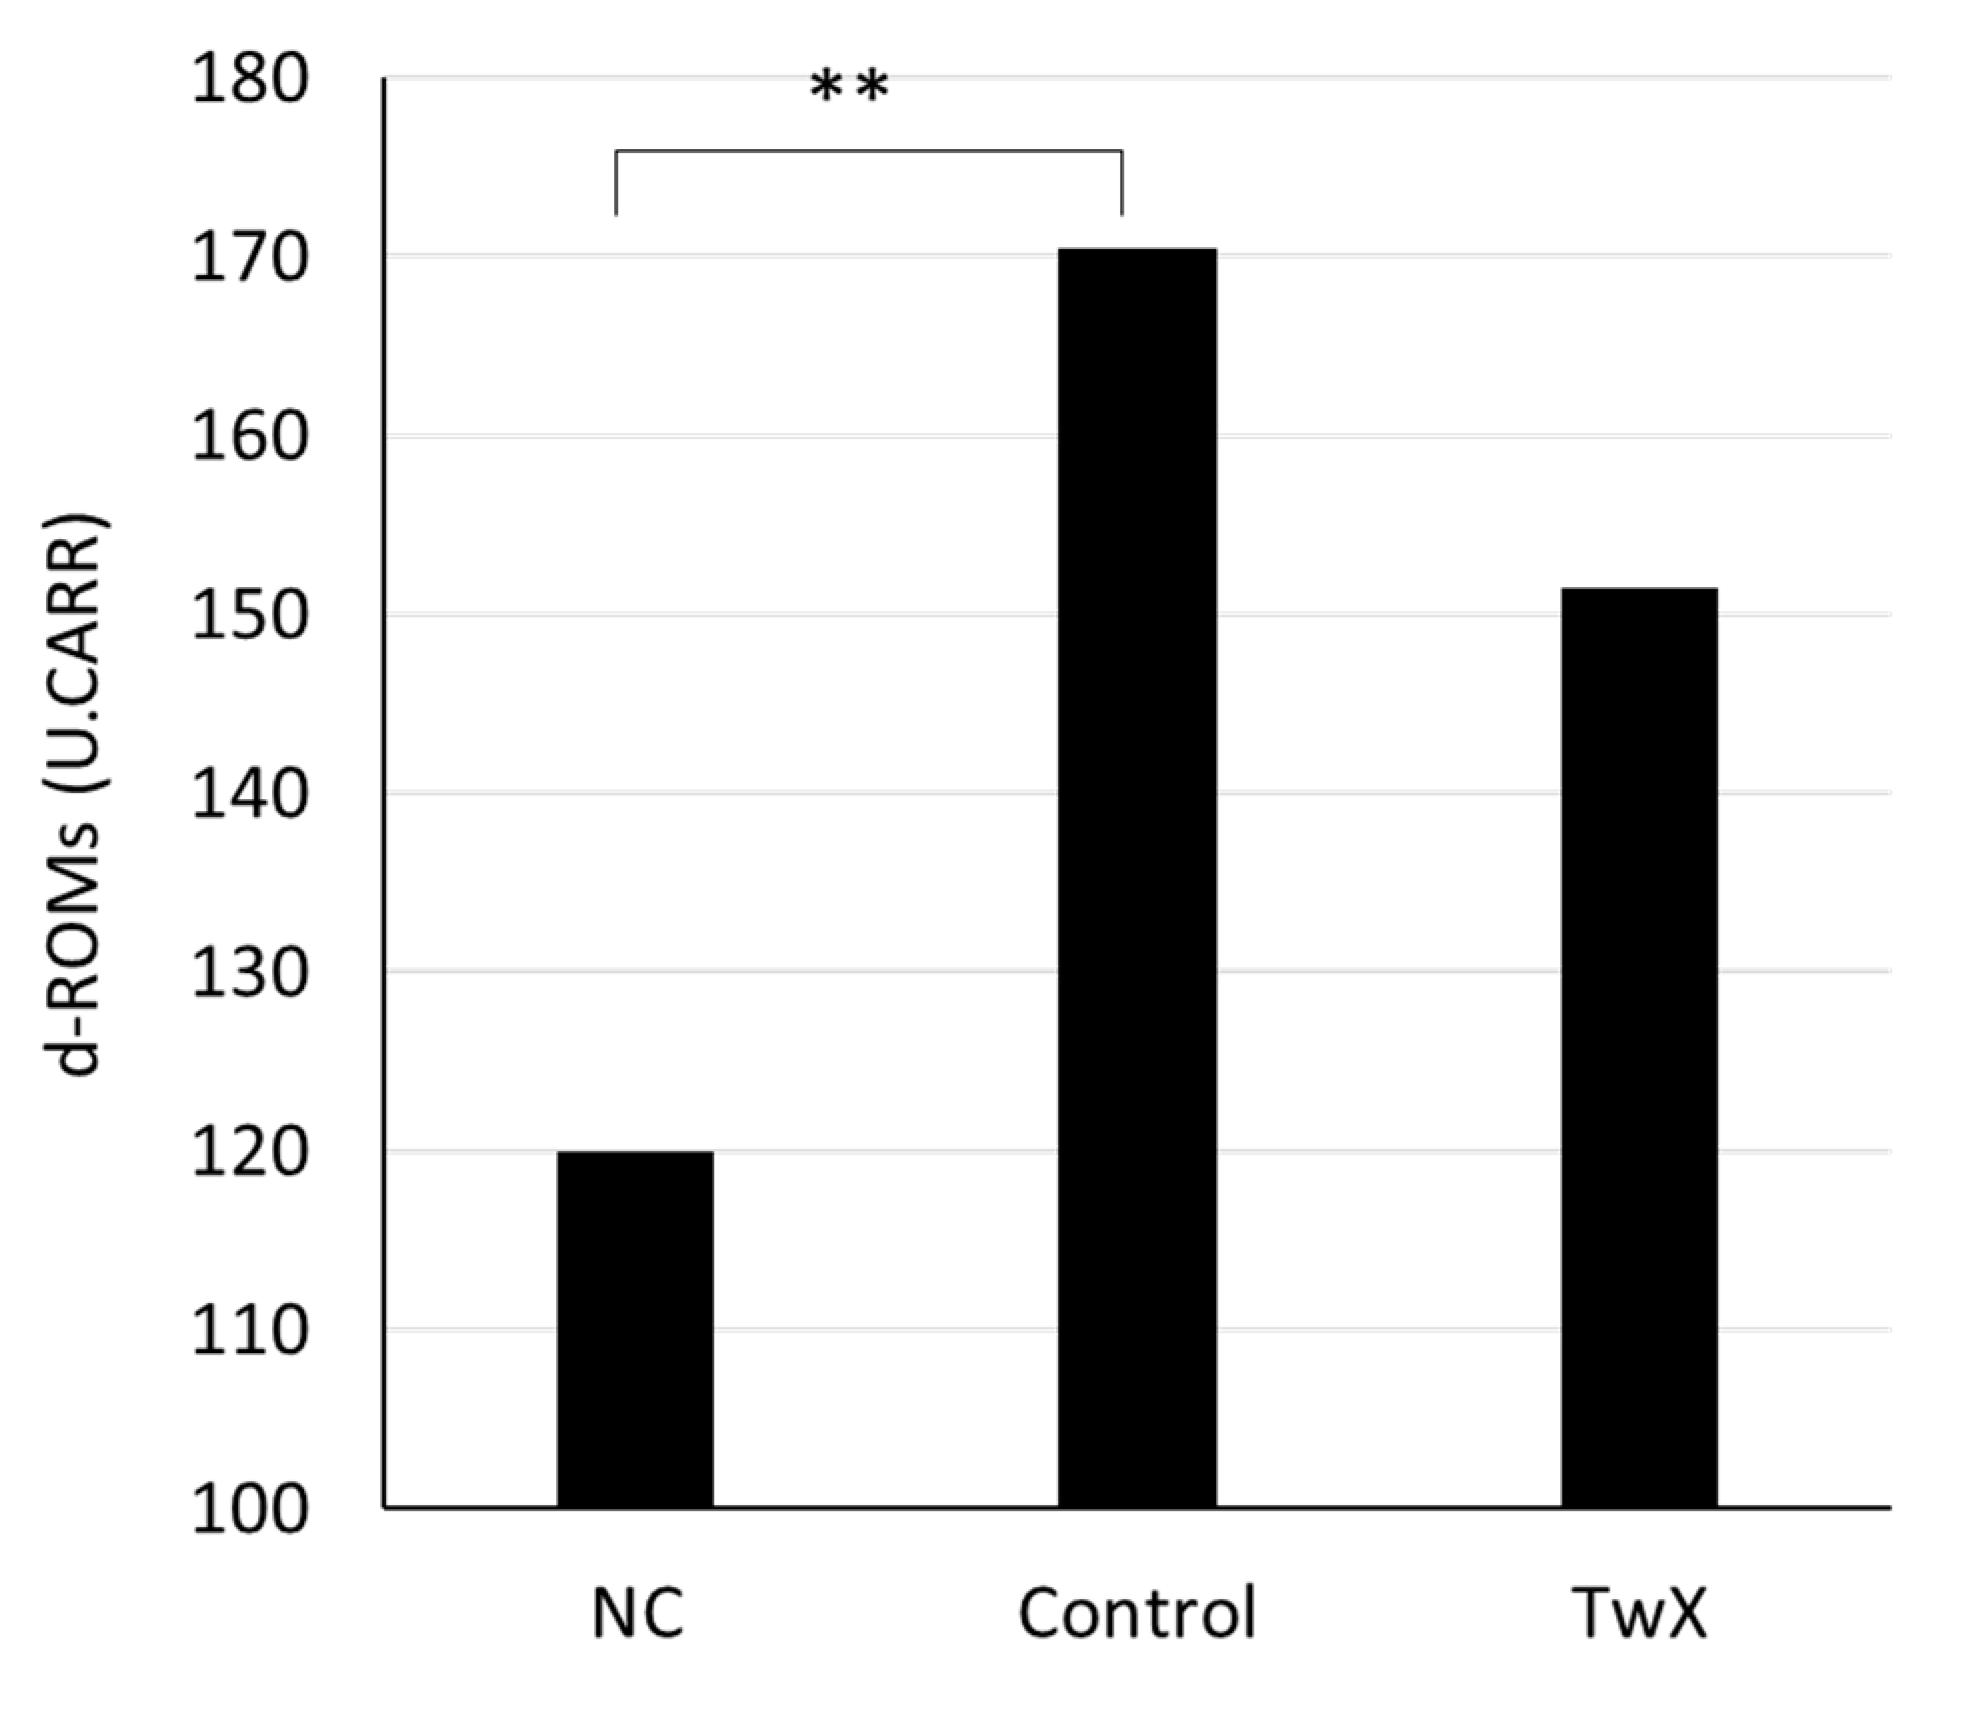
Figure 5.
Blood glucose level on glucose tolerance test in hyper glycemic mice. C57BL/6J spontaneous diabetic mice were administered sterile water (Control) or Twendee X®︎ (TwX) orally at 40 mg/kg/day. Untreated mice of the same age were kept as negative controls (NC). After fasting for 16 hours, mice were given glucose and their blood glucose levels were measured over time. Student’s t-test was used for all statistical analysis. †: p<0.05 (Control vs NC), ††: p<0.01 (Control vs NC), ‡: p<0.05 (TwX vs NC), *: p<0.05 (TwX vs Control).
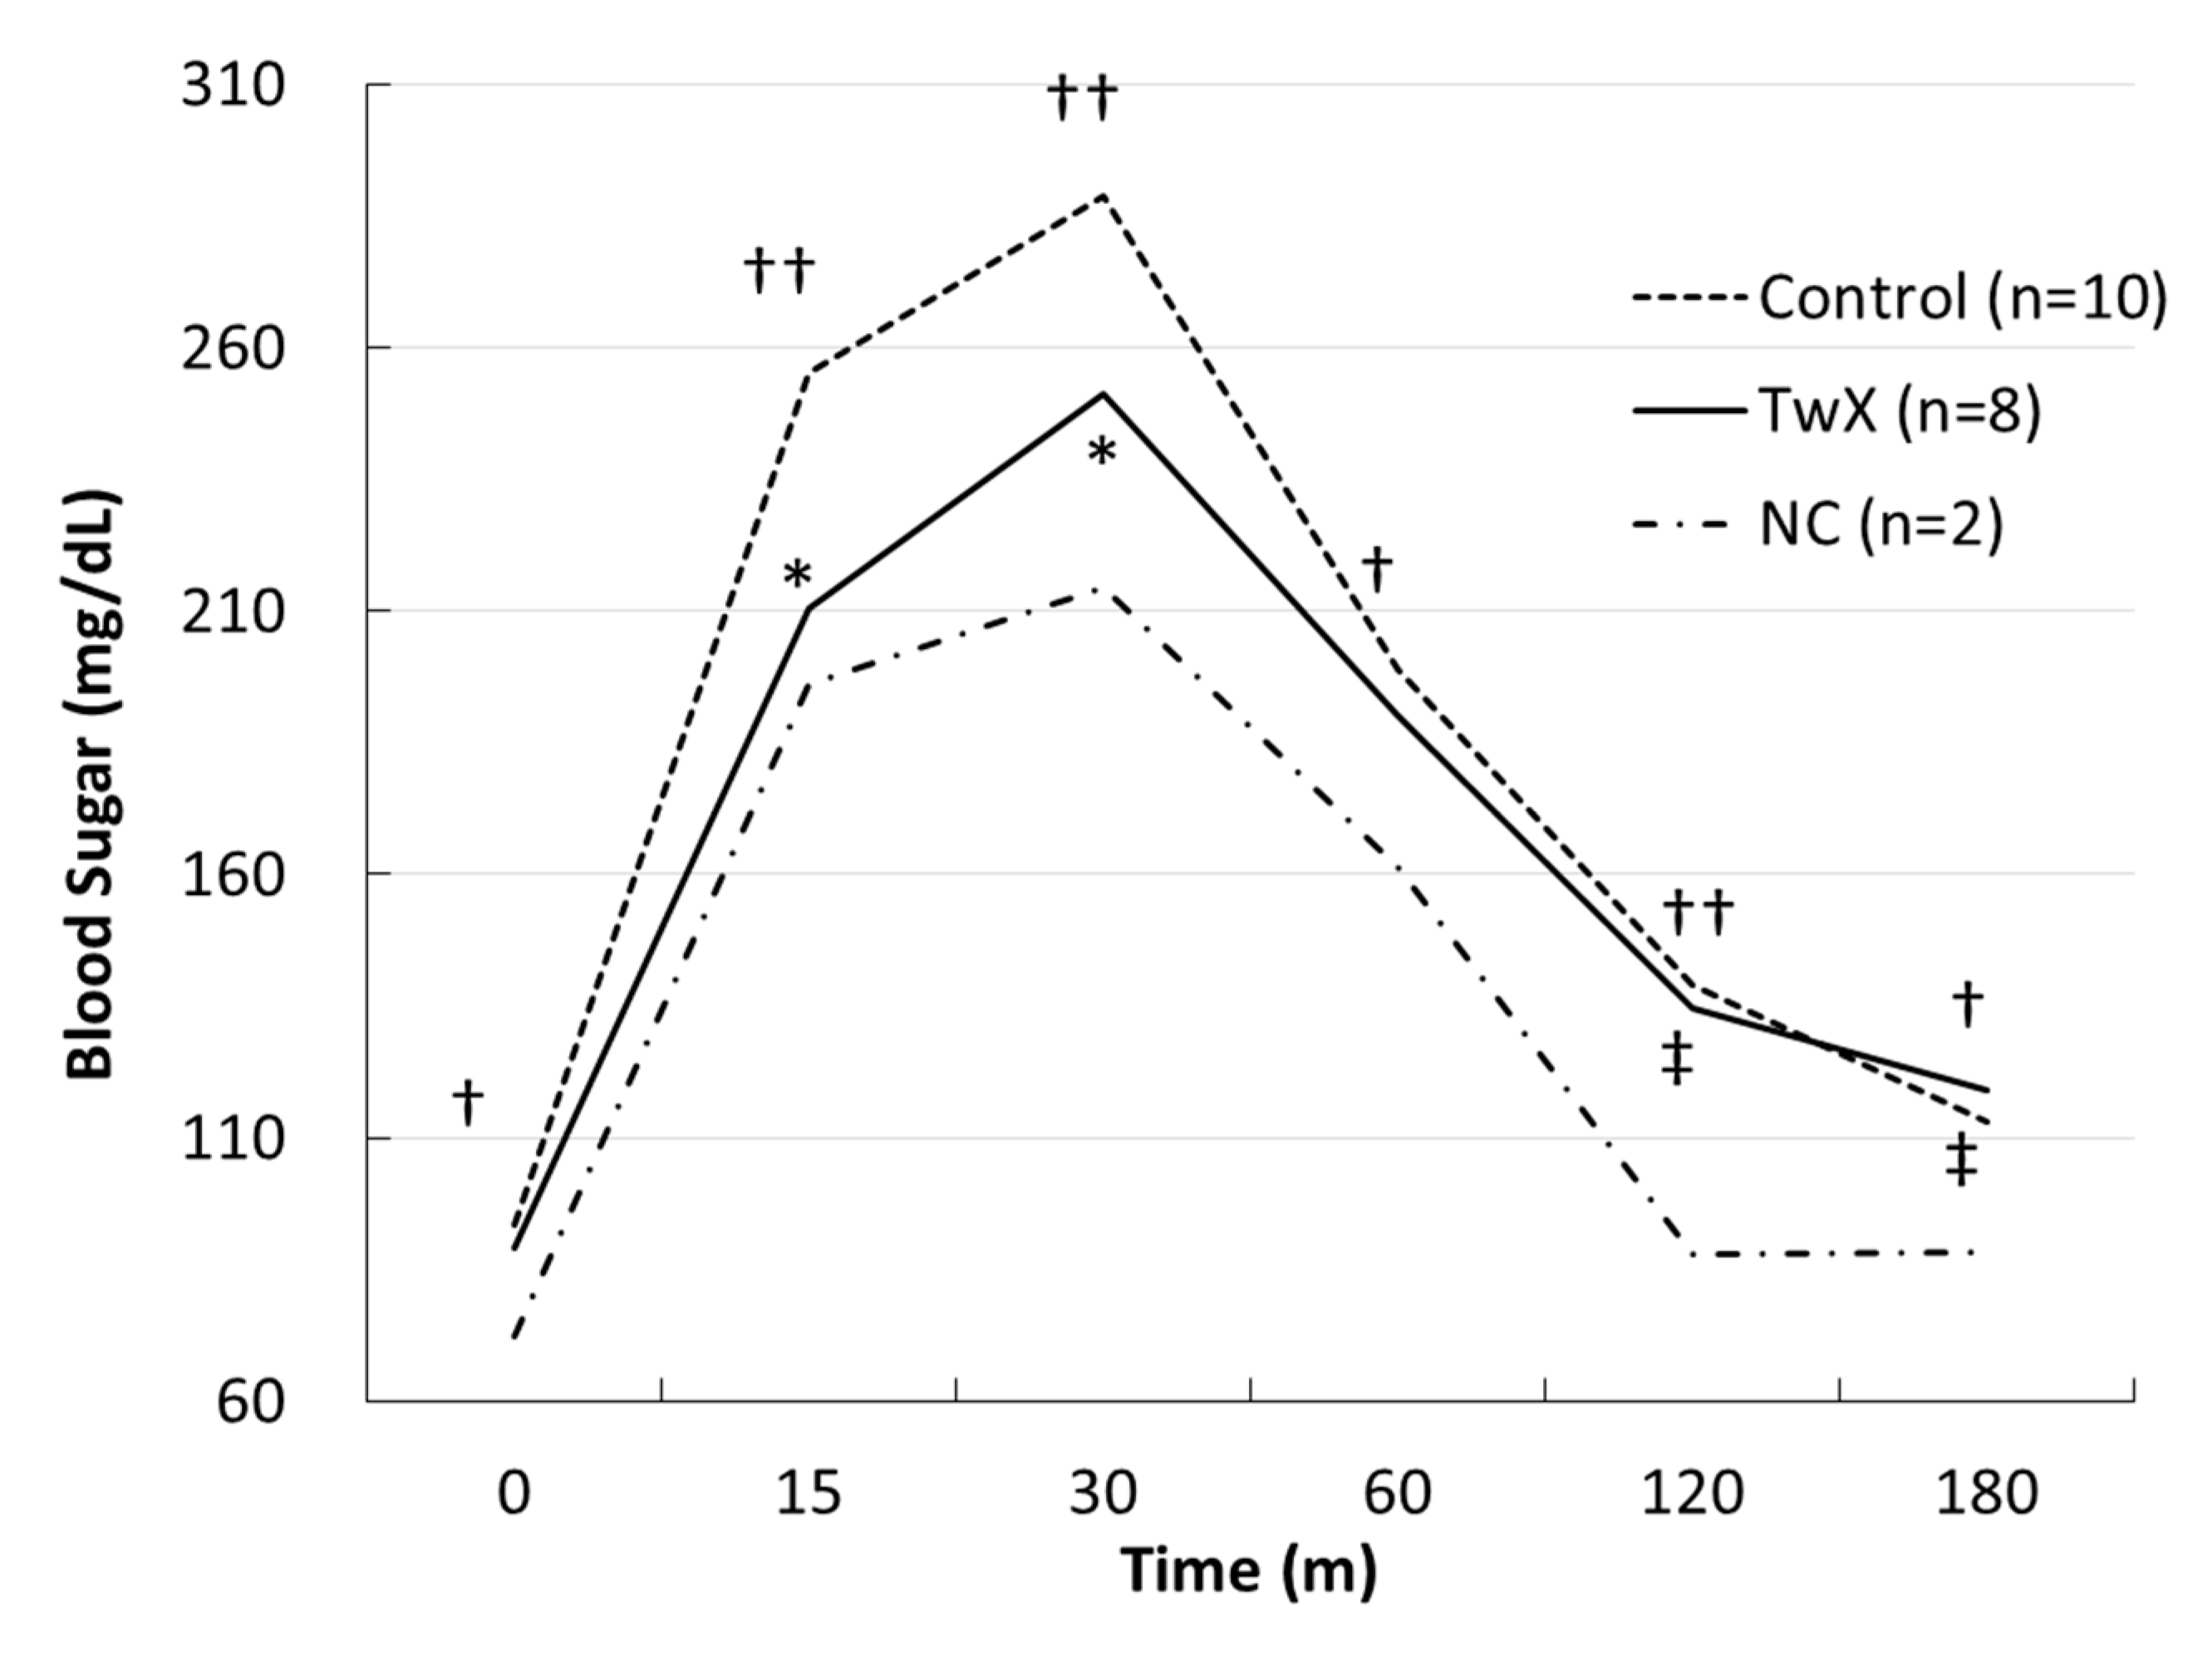
Figure 6.
Retention of autophagy in an aged mouse model of spontaneous diabetes mellitus. C57BL/6J spontaneous diabetic mice were administered sterile water (Control) or Twendee X®︎ (TwX) orally at 40 mg/kg/day. At 70 weeks of age, total protein of mouse hippocampus was extracted, and western blot was used to evaluate the protein level of LC3. Mouse brain lysate was also loaded as a control.
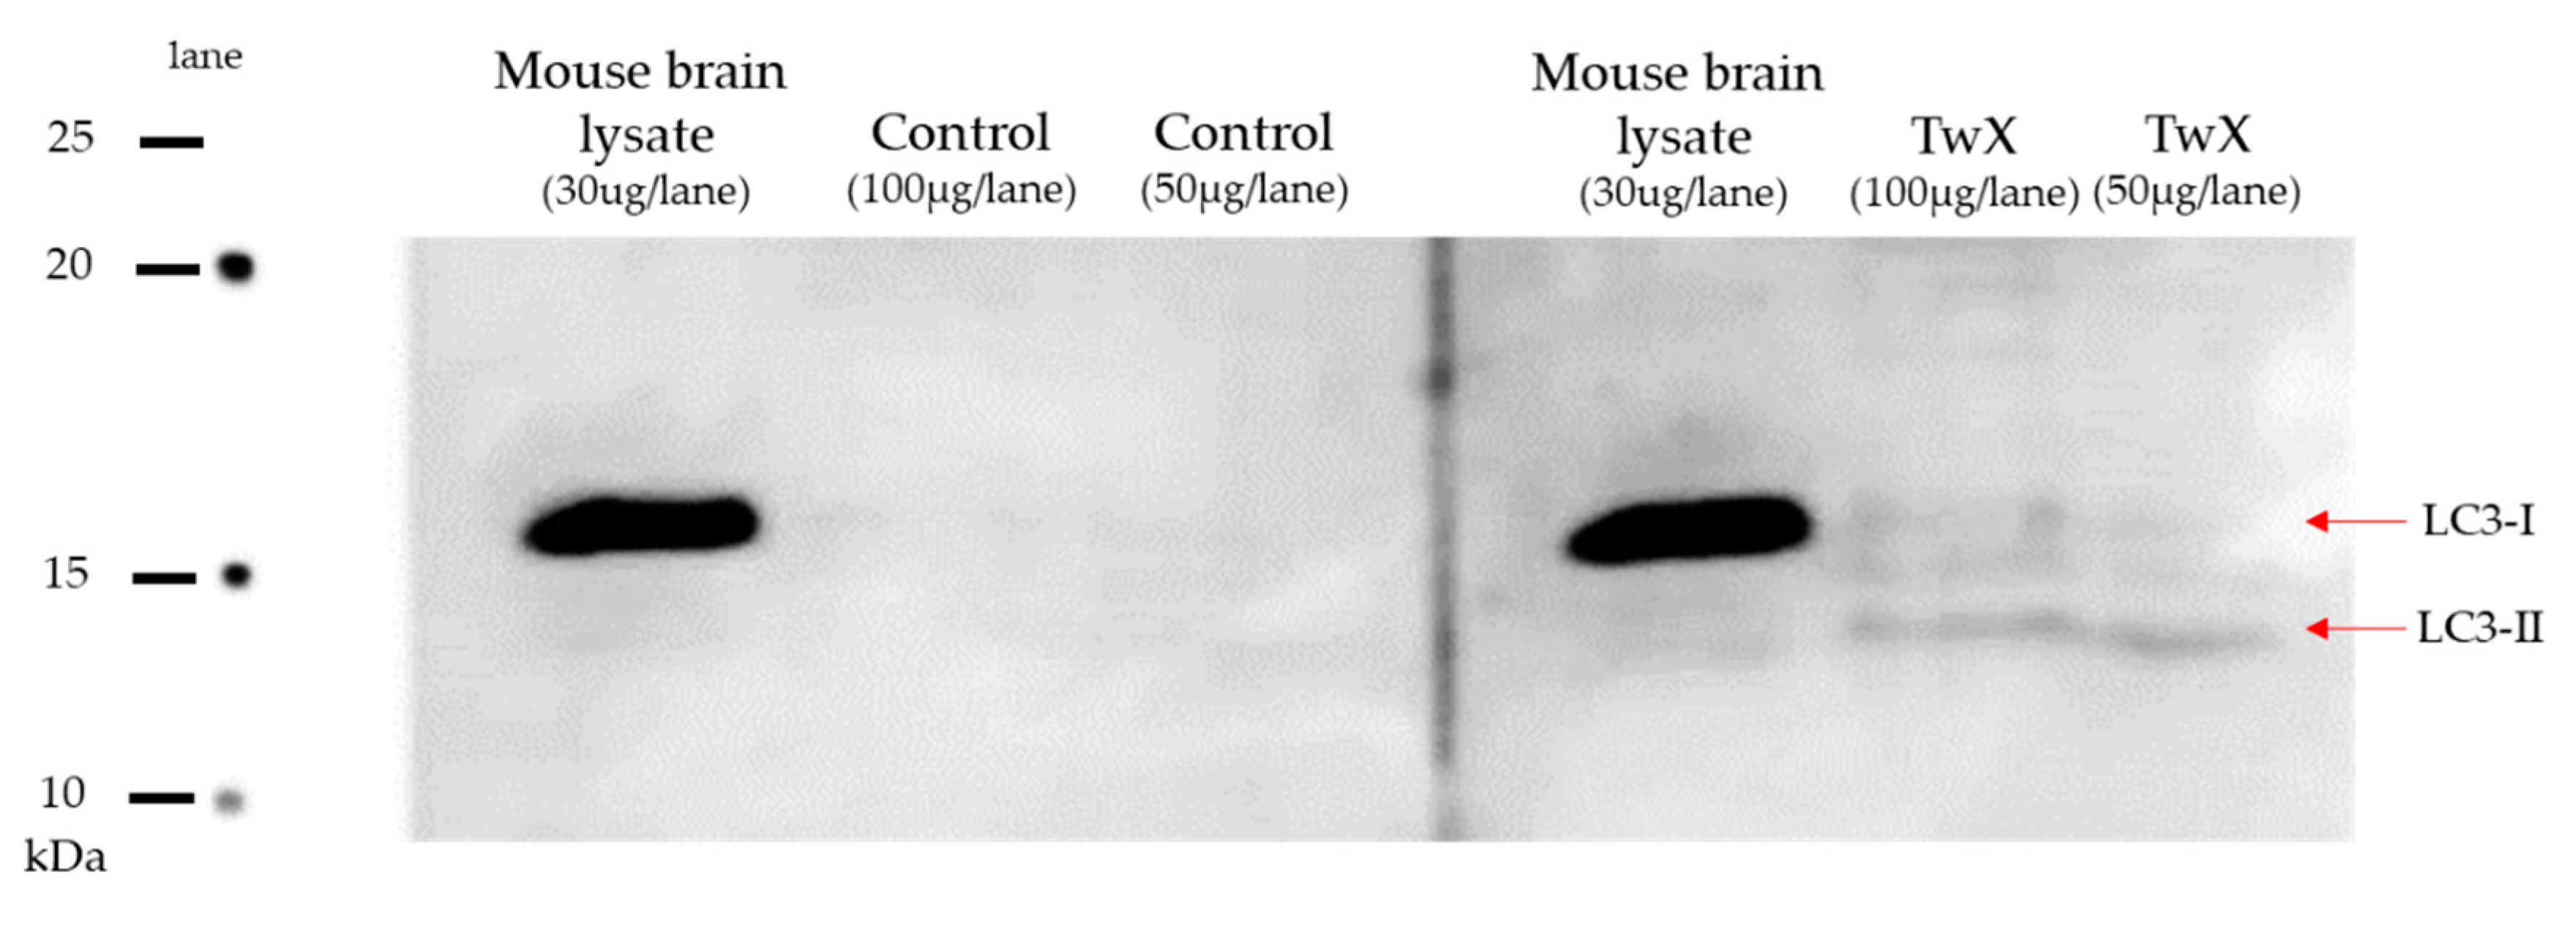
Figure 7.
Effect of Twendee X®︎ (TwX) on mouse telomeres. Spontaneous diabetic model C57BL/6J mice were orally administered sterile water (Control, n=10) or TwX (40mg/kg/day, n=10) for 33 weeks, after which telomere length in the tail tissue was measured. *: p=0.038 (Student's t-test)
Figure 7.
Effect of Twendee X®︎ (TwX) on mouse telomeres. Spontaneous diabetic model C57BL/6J mice were orally administered sterile water (Control, n=10) or TwX (40mg/kg/day, n=10) for 33 weeks, after which telomere length in the tail tissue was measured. *: p=0.038 (Student's t-test)
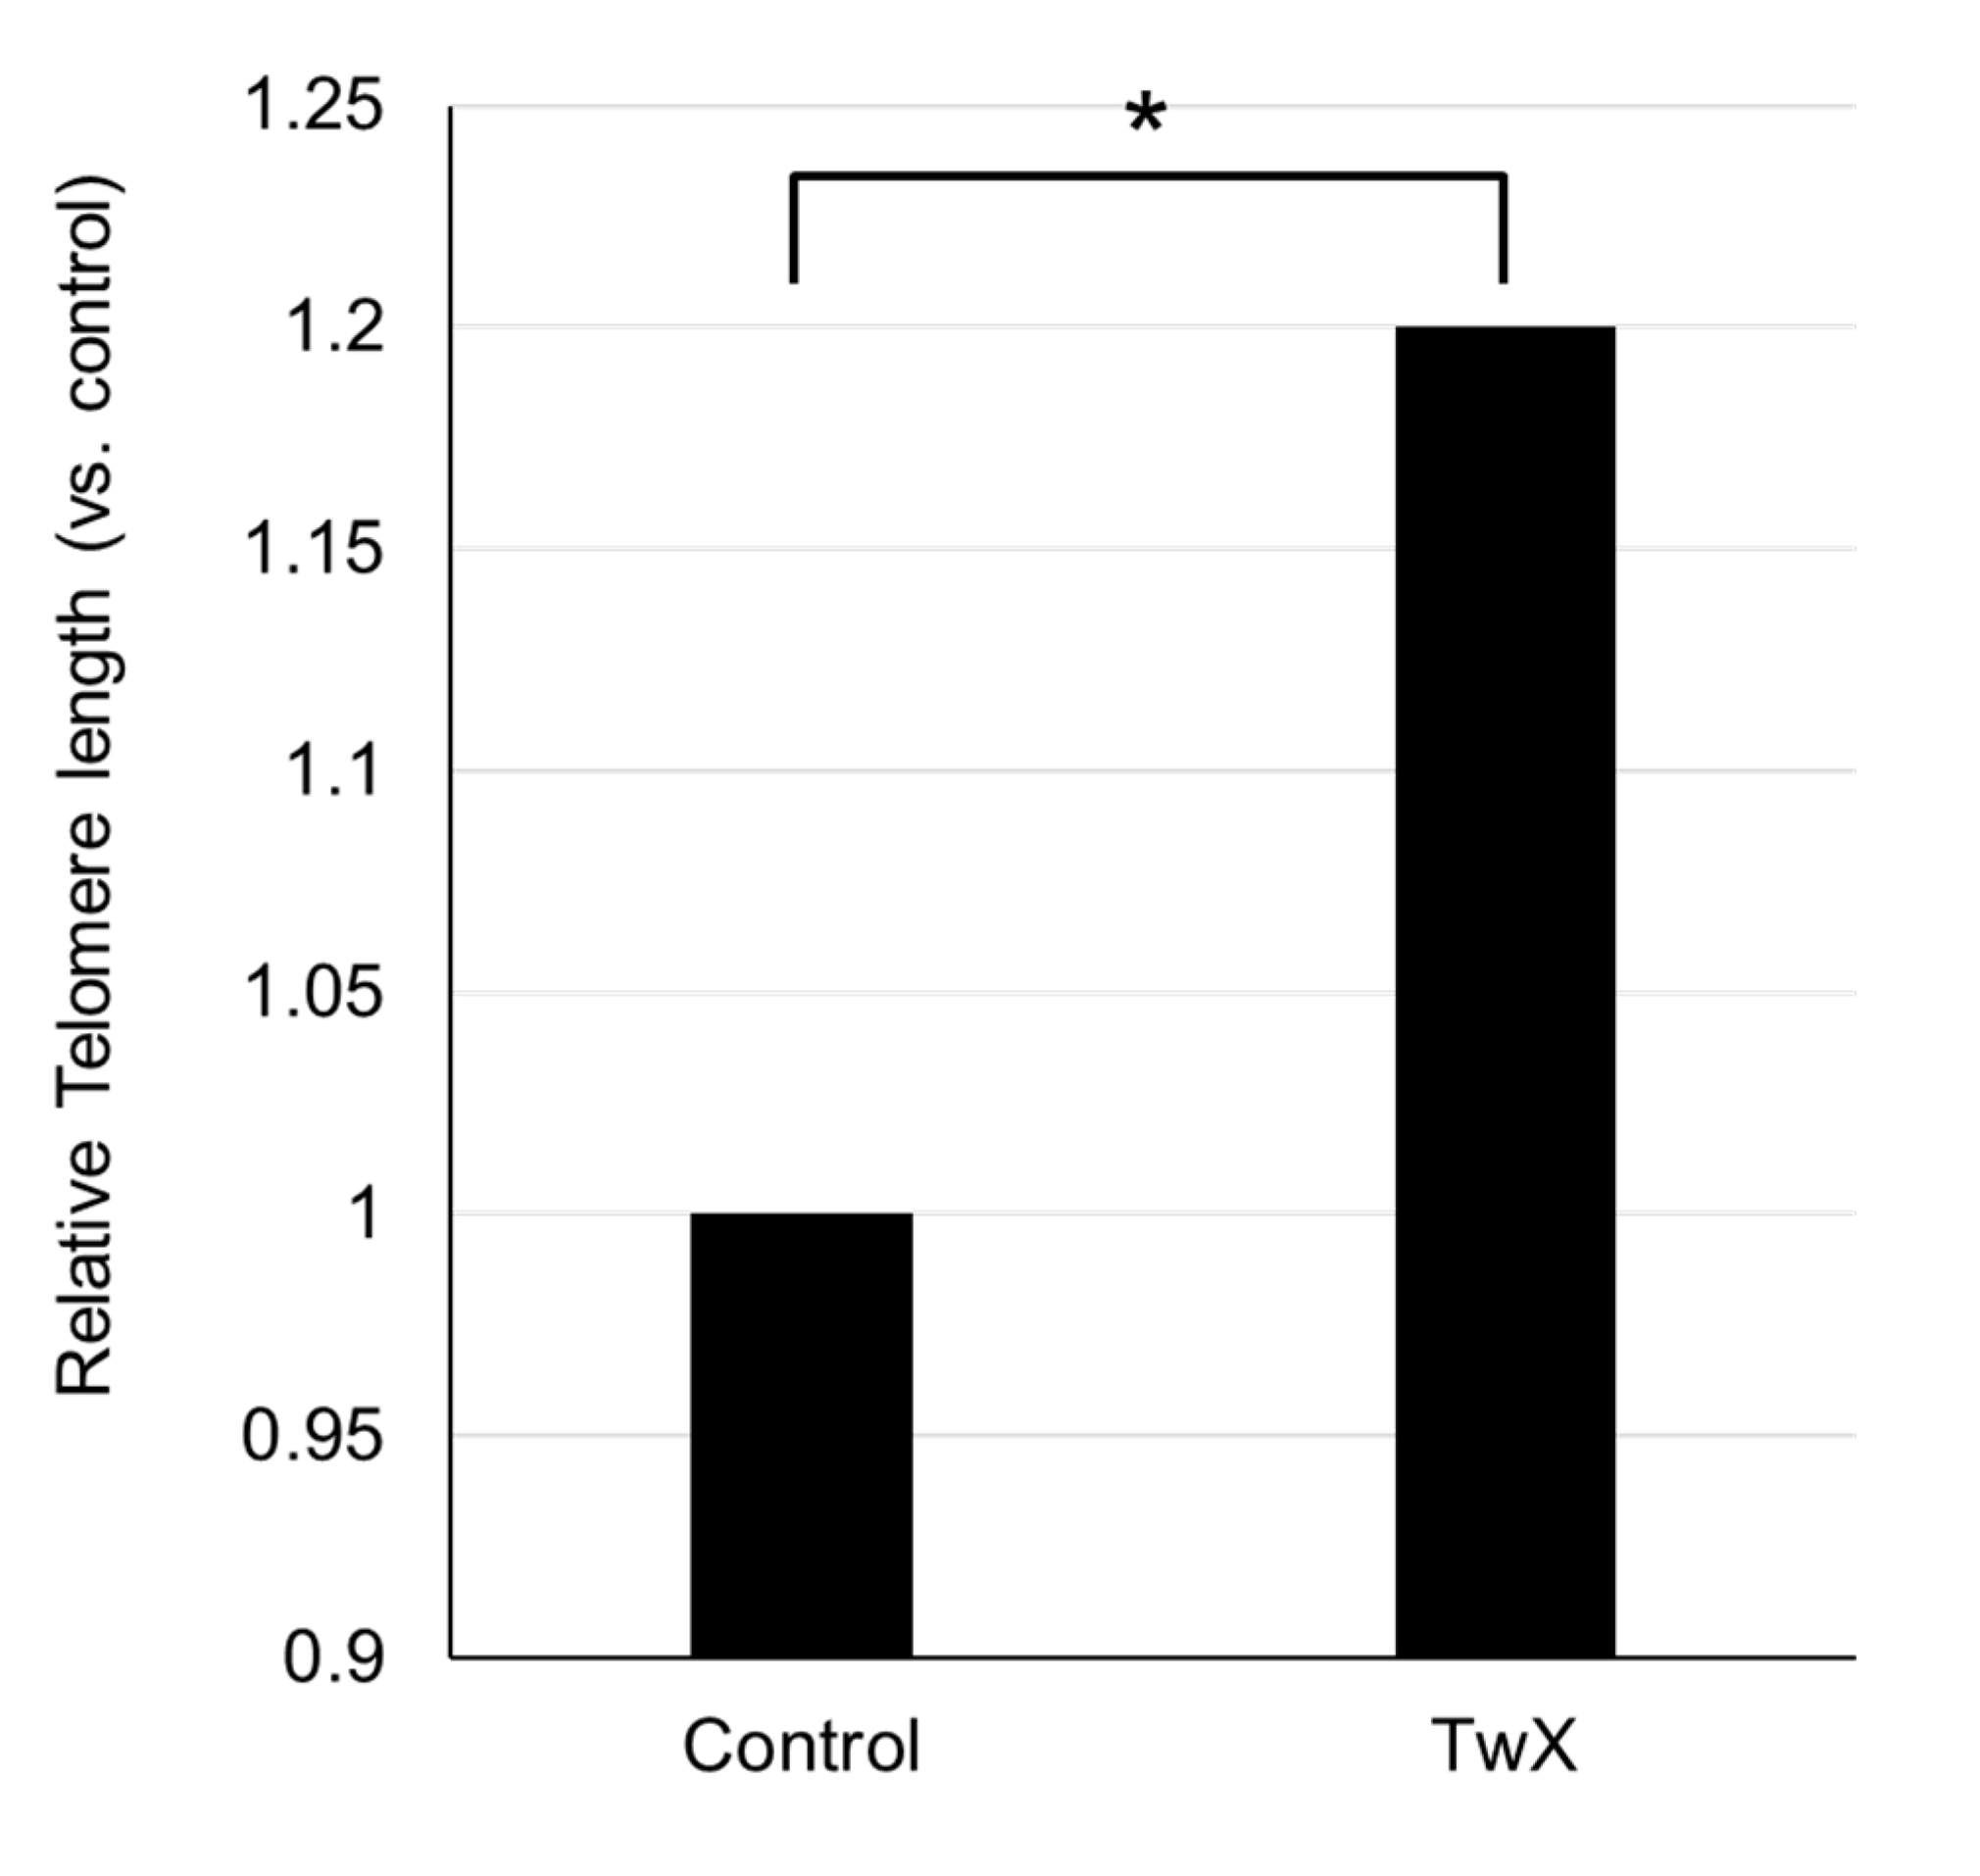
Figure 8.
Changes in the number of newborn neurons in the hippocampal dentate gyrus. C57BL/6J mice in the control (sterile water, n=5) and Twendee X®︎ group (TwX, 40mg/kg/day, n=5, administered from 26 weeks of age) were dissected at 56 weeks of age. 6 weeks old C57BL/6J mice were dissected as a control (n=5). The number of Tuj-1 cells in the hippocampal dentate gyrus was measured. *: p=0.029
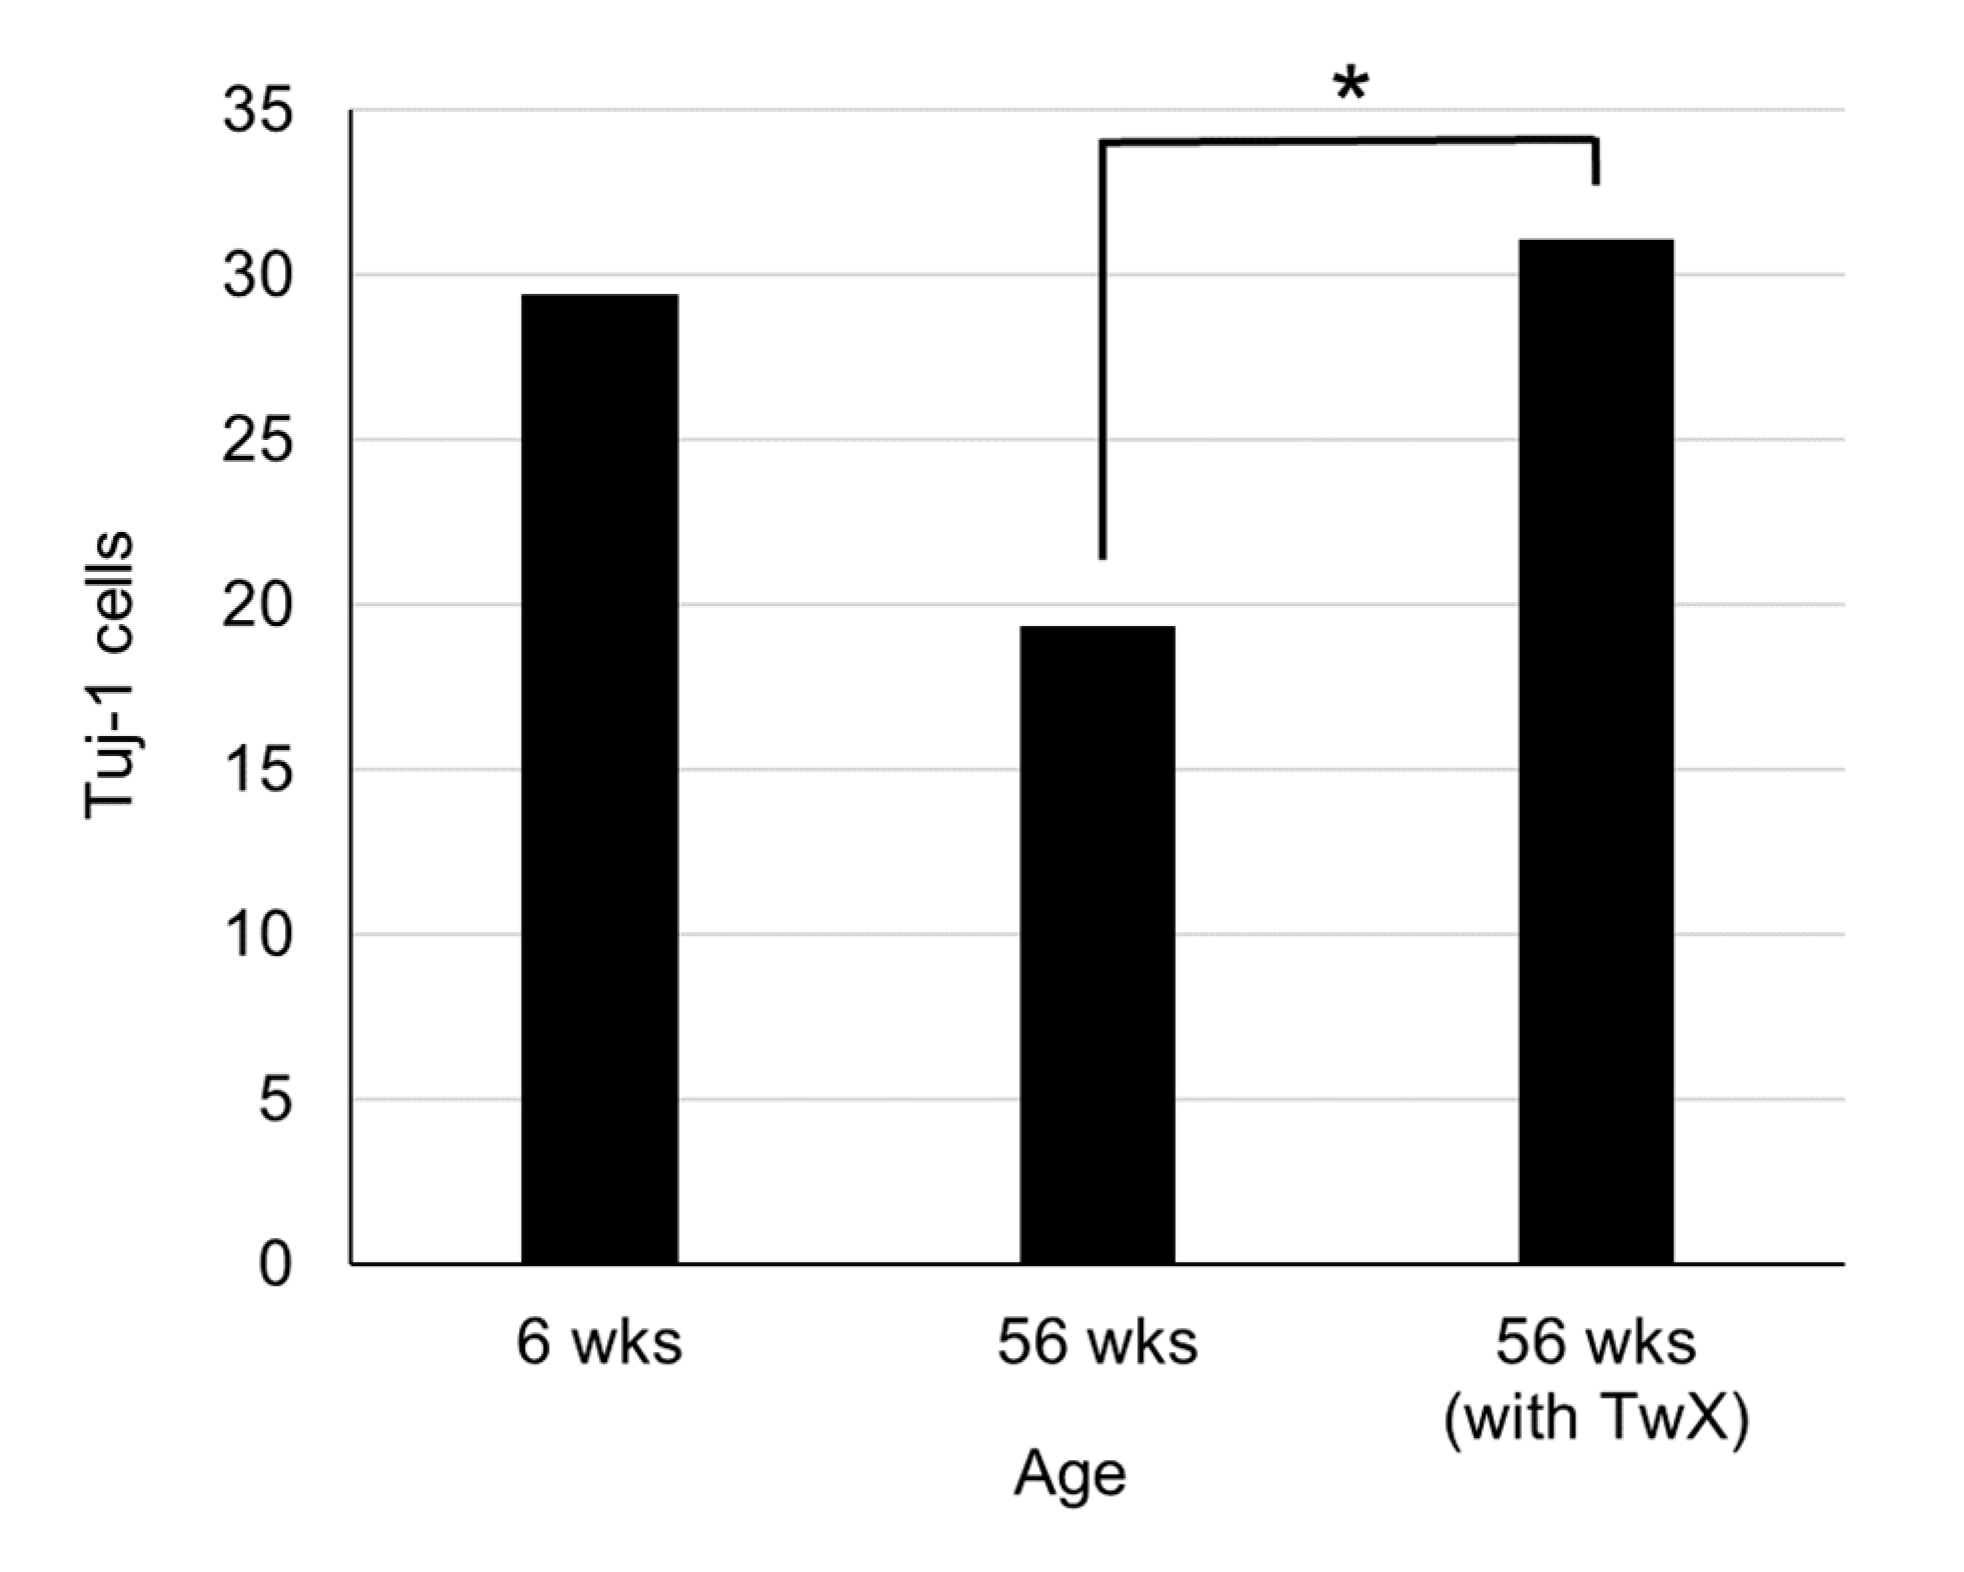

Table 1.
Effect on redox status after 1 hour- exposure of H2O2 100µM in HepG2 cells.
| Dose | Effects on REDOX status | |||||
|---|---|---|---|---|---|---|
| mtROS | cROS | Mn-SOD | Cu/Zn-SOD | GSHtot | ||
| H2O2 | 100µM | ↑* 69% | ↑*** 68% | ↓*** 32% | ↓*** 31% | ↑* 31% |
| TwX | 60µg/ml | ↓ 63% | ↓ 45% | ↑ 147% | ↑ 60% | ↓ 40% |
| 120µg/ml | ↓ 77% | ↓ 49% | ↑ 104% | ↑ 33% | NS ↓ 15% | |
| 240µg/ml | ↓ 65% | ↓ 37% | NS ↑ 38% | NS ↑ 19% | ↓ 20% | |
Disclaimer/Publisher’s Note: The statements, opinions and data contained in all publications are solely those of the individual author(s) and contributor(s) and not of MDPI and/or the editor(s). MDPI and/or the editor(s) disclaim responsibility for any injury to people or property resulting from any ideas, methods, instructions or products referred to in the content. |
© 2023 by the authors. Licensee MDPI, Basel, Switzerland. This article is an open access article distributed under the terms and conditions of the Creative Commons Attribution (CC BY) license (http://creativecommons.org/licenses/by/4.0/).
Copyright: This open access article is published under a Creative Commons CC BY 4.0 license, which permit the free download, distribution, and reuse, provided that the author and preprint are cited in any reuse.


