
Submitted:
31 July 2023
Posted:
01 August 2023
You are already at the latest version
Abstract
Forest biomass is one of the most significant renewable energy sources in the Czech Republic. Recently, Czech forests have been under attack by spruce bark beetles, threatening the stability of biomass supply also for energy purposes. The goal of this paper is to uncover the impact of four different biomass development scenarios and three policies on the energy system and to evaluate the contribution of biomass to decarbonization efforts. We use the TIMES-CZ energy system optimization model to perform the analyses. We provide a crucial extension of this model by regionalizing it into NUTS3 +1 regions. Our main findings are that under the expected price of various types of biomass and their transportation cost, energy system would still exploit available biomass almost entirely throughout the period under review; subsidizing the production cost of the most expensive type of biomass for households would help utilize the full potential of biomass; and power and heat sector and industry would compete for biomass consumption against the residential sector.
Keywords:
Biomass
; Energy model
; TIMES-CZ
; EU ETS
; Spruce beetle calamity
1. Introduction
One way to combat climate change is to promote renewable energy sources. For this reason, many countries all over the world have set up targets to produce a certain proportion of energy from renewable energy sources (RES). Biomass is one of the most significant RES in most Central European countries. This region has been hit by bark beetle calamity recently. We focus on the Czech Republic, twhich can be seen as a case study for the whole of Central Europe. In the Czech Republic, forest biomass is the largest source of clean energy. Biomass at the same time is quite flexible unlike many other RES, i.e. it can be burnt in the conventional power plants. However, transportation of biomass from one location to another may be cost-ineffective. In this article we have extended the Czech energy system optimizing model TIMES-CZ by splitting it into NUTS3 +1 regions. This allows for a more accurate allocation of the limited forest biomass given the transportation costs between the regions. In addition, we evaluate the impact of the potential spruce bark beetle calamity development scenarios on the Czech energy system until 2050.
Since 2012 bark beetles have been massively destroying spruce trees which occupy roughly half of the Czech forests [1]. Institute for Forest Ecosystem Research (IFER) developed four possible scenarios on the availability of biomass for energy purpose given the spread of spruce beetles by Czech regions. These scenarios help measure the preparedness of Czech energy system to reach greenhouse gas emission reduction targets. Since forest biomass is unequally distributed across Czech regions as well as the infestation with spruce beetle is not uniform, it is crucial to apply the regionalization of the energy system modelling software.
TIMES-CZ is a complex energy system modelling tool. It uses energy balance components and certain constraints as inputs in order to identify the least-cost mix of energy technologies for a given time horizon. The original model [2] had restricted capability to distinguish energy production and demand technologies by location. Regionalization of the model more conveniently takes into consideration possible transportation costs of energy fuels between the regions, enforces more realistic decisions on where to install new power plants, and facilitates trade. Therefore, regionalized TIMES-CZ model enhances the resolution of the Czech energy system.
The rest of this paper is structured as follows. In Section 2, we describe the model and data used in the analysis. The modeled scenarios and their assumptions are described in Section 3. We then analyze and discuss the results of the model in Section 4 after which we conclude the paper in Section 5.
2. Regionalized TIMES-CZ and Trade Parameters
TIMES is a bottom-up energy system optimization model which under initial conditions and certain constraints searches for a least-cost path to satisfy energy service demands. TIMES is developed and maintained within the Energy Technology System Analyses Program (ETSAP) by the International Energy Agency (IEA) [3]. TIMES-CZ originally was a part of Pan-European TIMES PanEu model developed by the Institute of Energy Economics and Rational Energy Use at the University of Stuttgart [4]. However, original TIMES-CZ model was a more aggregated version of the Czech energy system.
Multiple attempts have been made to improve the resolution of the TIMES-CZ model in the past. In the following, we list the ones more essential to the current research. First, thanks to the available data on individual facilities under EU ETS scheme, we have been able to identify locations, efficiencies, consumption of energy fuels, output of heat and power or various types of emissions for individual facilities. For the facilities outside the EU ETS scheme, we have kept the original structure of the TIMES-PanEu model. We, nevertheless, have split up the aggregated non- EU ETS energy sources by NUTS3 +1 regions [5,6], where NUTS3 classifies Czechia into 14 regions depicted on Figure 1 and +1 implies Czechia aggregated as one region.
Second, we have regionalized final energy demand for the residential and commercial sectors by NUTS3 +1 regions using ENERGO data [7] combined with the data on available stock of houses distinguished by family type, semi-detached or multi-flat buildings and by regions. Third, we have changed the base year to 2019. This is the year from which we take the Czech energy balance sheet as an initial condition for the model. One may argue that in 2019 the economy was behaving abnormally due to COVID19. However, comparing the 2018 and 2019 energy balance sheets, we could not observe significant differences. In perspective, a more recent base year certainly allows for a more accurate prediction of the future allocation of energy resources. Finally, we have integrated the forest biomass development scenarios by types of biomass.
Spruce bark beetles have become a major problem for Czech forests since 2012. These beetles destroy massive areas of forests as spruce is one of the most widespread species of trees. With the climate warming, bark beetles multiply even faster and the pace of felling trees and removing them from the forests fails to catch up. The driven calamity threatens the availability of biomass for various purposes, including energy.
IFER analyzed possible pathways for managing and adapting Czech forests to respond to the challenge. They developed four possible scenarios for the evolution of the bark beetle calamity [8]. RED scenario, which we use as the baseline, anticipates that the spruce beetle calamity would subside in the existing area. The GREEN scenario predicts that the calamity would end sooner than in RED and allows 6% higher timber harvesting than the other three scenarios. The BLACK scenario conjectures that the calamity would spread towards western regions given the riskiness level involved and finally, the BLACK-REP scenario envisions that the calamity would repeat every ten years. Figure 2 depicts the maximum amount of biomass harvest possible for energy purposes under these four scenarios. From Figure 2 it is clear that the largest differences between scenarios occur in 2025 - 2035. Nevertheless, the magnitude may not be large enough to drive significant differences in the final allocation of resources.
In Figure 2 it can be seen that biomass is categorized by types. Types of wood differ based on their energy content and quality. Such properties determine which type of wood is used primarily for what purpose. For example, firewood and pellets derived from white chips are primarily used by the residential sector, while forest chips are favored for heat and power production and industry. The Figure 2 depicts the maximum possible supply of white chips and firewood. To avoid converting biomass into more expensive products, such as pellets, the model directs unprocessed white chips to power and heat and industry.
The general scheme of biomass flows across sectors and the price range for types of wood are shown in Figure 3 and Table 1, respectively.
The regionalized TIMES-CZ model takes into consideration the transportation costs of biomass. Transportation cost is distance-specific and time-variant. We have combined various sources to calculate average transportation costs for different types of wood.
Pellets and briquettes derived from white chips can be purchased in online stores. Online stores typically have fixed costs of transportation, around 45€. Given that pellets have roughly energy content of 18 MJ/kg [9] and a typical homeowner would need approximately 2-3 tones of pellets [10], in the cheapest case, to transport white chips would cost 0.8 €/GJ irrespective of the distance.
With firewood, calculating the transportation cost is more complex. For example, firewood is typically sold in one-cubic-meter cords (prm), where depending on whether the wood is ordered (prmr) or not (prms), weight and accordingly, energy content (E) will differ [11]. In addition, coniferous firewood is lighter and has less energy content compared to broadleaf firewood per cubic meter. Furthermore, the maximum volume of transportation by service providers is limited and differs. Therefore, we had to rely on some average figures and assume 9 prmr of capacity to calculate total energy transported per ride. According to [11], 1 prm of wood pallet contains roughly 475kg of broadleaf wood with energy content of 14.6 MJ/kg and 340 kg of coniferous wood with energy content of 15.6 MJ/kg with moisture content of 15%.
In addition, we derived a 14x14 distance matrix between the centers of Czech regions to allow for trade between each of them. Because transportation companies typically charge for both the outbound and inbound transportation of biomass, we doubled the distances (D) and multiplied them by the average transportation cost (C) of biomass per kilometer. We obtained the average transportation cost (C) of biomass per kilometer by reviewing offers from transportation companies. Subsequently, we divided the total transportation cost between regions by the total energy transported to calculate the cost of transportation between regions expressed in €/GJ. Therefore, simple formula for calculating the transportation cost of firewood between regions is the following:
where is the transportation cost of biomass by type, is the distance in kilometers between regions i and j, C is the price of transportation per kilometer, and is calculated total energy carried per ride by type of biomass. Equation 1 is valid for forest chips as well. Clearly, the assumptions on energy content are different. Forest chips, with 10% of moisture level have energy content of 16.4 MJ/kg, and 1 prms of forest chips weigh roughly 170kg [11]. In addition, forest chips are primarily used by power and heat, and industry sectors, where transporting larger quantities on one ride is more likely. We assume the maximum capacity of the track reaches 85 prms [12].
In the model, we also allow the transportation of biomass from regions to CZ as an aggregate region. We calculate the distance from each region to CZ as an average of all distances excluding Prague and Brno where availability of biomass is not significant. For the rest of the calculations equation 1 applies.
We made transportation cost time-variant considering EUA prices on CO2 emissions by HCT 2023 WAM schedule. EUA involves pricing1 tone of CO2 emission in 2030 at 47 €/t and increasing it linearly every five years reaching 386 €/t in 2050. Provided that large tracks consume roughly 0.4 liters of diesel per kilometer [13] and each liter of diesel produces 2.7 kg of CO2 [14], then the time-variant element of the transportation cost starting from 2030 can be calculated by the following formula:
where is the time-invariant part of the transportation cost calculated in equation 1, is the EUA2 price of emission on tone of CO2, l is the liters of diesel consumed per kilometer and EM is the tone of CO2 emitted per liter of diesel.
3. Scenarios
In order to assess the impact of various biomass development paths on the overall energy mix of the economy we first define the baseline scenario. The baseline scenario is derived from the National Energy and Climate plan [15]. The main ingredients of the baseline scenario is that demands for energy services and energy-intensive products are derived from the National Plan. Czech Republic is assumed to be self-sufficient in terms of renewable and hydrogen energy production due to the fact that: (i) The main renewable energy source is biomass, which is not suitable for long-distance transportation, (ii) The effective State Energy Policy [16] mandates to keep the import dependence for gaseous and liquid fuels at most at the current level, (iii) it is uncertain whether hydrogen will be sufficient for entire Europe to begin with [17].
Other assumptions include: fossil fuel prices are according to HCT 2023 projection; development of new nuclear power plants is not limited and is the outcome of the model’s optimization problem; profile of possible electricity imports are according to Czech transmission system operator (ČEPS) and assumes no shortages; in 2050 maximum production of wind farms, solar PV’s and hydrogen imports are limited to 7 GW, 25.9 GW and 36.7 TWh, respectively; and carbon capture use and storage (CCUS). In the baseline scenario biomass development path is according to the RED scenario of IFER predictions in Figure 2. For this reason, we refer to the baseline scenario as RED. Three other scenarios share the same assumptions as RED but follow different IFER predictions from Figure 2. These scenarios are referred to as BLACK, BLACK-REP, and GREEN.
In addition to IFER projections, we consider three additional scenarios for sensitivity analysis. RED-0 assumes an exogenous reduction of greenhouse gas emissions to three megatons in 2050. The purpose is to see whether increased pressure to reduce emissions would encourage renewable production. RED-HH assumes that starting from 2030 biomass can only be consumed by households. The goal is to see how the limited availability of biomass would affect the overall energy mix and annualized system costs. Finally, RED-P50 considers 50% production cost subsidies on white chips to observe the possible substitution of alternative fuels with biomass. All three scenarios for sensitivity analysis rely on the projection of biomass development according to IFER.
4. Results
4.1. Primary Energy Supply
Estimation of all modeled scenarios delivers approximately 20% decrease in the consumption of primary energy sources (PESs) between 2019 and 2050 (Figure 4). From 2030 it is a noticeable significant increase in gas consumption, whereas brown coal is almost phased out. Limiting biomass only for household consumption RED-HH primarily involves substitution with natural gas, while exogenous GHG reduction to 3 Mt in 2050 RED-0 activates more nuclear and ambient heat technologies replacing natural gas and oil combustion plants.
The regionalized TIMES-CZ model enhances the resolution of the Czech energy system. The best instance is forest biomass as it is unevenly distributed across the country. According to Figure 5, forest biomass supply for energy purposes is more abundant in the South-West parts of the Czech Republic. Due to the increase of biomass transportation cost with distance, regionalized TIMES-CZ will make more realistic choices on where to place new biomass-burning or co-burning plants. Regionalization allows for the incorporation of various limitations, specific details, or heterogeneities across regions. Figure 5 may suggest that in order to promote other renewable energy sources, it would probably be a good idea to deploy them in the northeastern parts of the CZ.
4.2. Final Energy Consumption
Figure 6 shows the final consumption of biomass by sectors contrasting it with the availability of biomass according to the IFER projections. Biomass usage as an energy fuel falls short of biomass availability between 2025 and 2035. In 2040, timber harvesting recovers significantly, but the demand for biomass has already adapted to lower biomass availability. As a result, biomass consumption does not increase as quickly as timber harvesting recovers. In the rest of the years, the full potential of biomass is exploited. This can be explained by the fact that some steps on the cost curve of the broadleaf firewood chops and white chips are more expensive than natural gas. To exploit the full potential of biomass, it may be favorable to subsidize biomass production cost as can be observed from RED-P50 scenario.
Figure 6 also reveals other crucial trends. In all scenarios, residential consumption of biomass steadily declines over the period under review. The opposite is true for the power and heat (P&H) sector. Hence, large sources can absorb available biomass even at the expense of households, nevertheless, from a system-wide perspective this may appear more efficient. More detailed overview of the residential sector in Figure 7 and Figure 8 follows.
In the residential sector energy consumption generally declines over time in all scenarios. From 2035 district heating and biomass are primarily substituted by natural gas and ambient heat technologies. Exogenous reduction of GHG to 3 Mt in 2050 (RED-0 scenario) does not seem to favor biomass but instead, ambient heat technology. This is probably because P&H and industry absorb most of the biomass. This observation can be confirmed by RED-HH scenario where the residential sector does not face competition for biomass consumption from other sectors.
Figure 8 provides a breakdown of energy consumption in the residential sector by purpose. Households consume the largest amount of energy for heating purposes. Reduction in energy demand by households can probably be explained by improvements in the efficiency of appliances as well as improved insulation in buildings.
GHG emissions by scenarios are shown in Figure 9. The figure shows that even the EUA price of €3862 is not sufficient to achieve climate neutrality in Czechia.
Contrasting annualized system costs with RED scenario the largest spikes in the annualized costs are observed for RED-HH and RED-0 scenarios. Limiting the availability of biomass forces the system to consume dirty fuels which increases the abatement costs significantly. Forcing the model to reduce GHG to 3 Mt by 2050 activates investment in expensive technologies such as nuclear power earlier in the period under review which increases the annualized investment costs.
5. Conclusions
Forest biomass is the main source of renewable energy in Czechia. This precious resource is currently facing destruction from spruce bark beetles. In this paper, we explore the impact of possible biomass development scenarios reflecting spruce bark beetle calamity on the Czech energy system. We have regionalized the TIMES-CZ model to account for the fact that forests are unevenly distributed across the country and that transporting biomass over long distances is uneconomic. This updated model makes more realistic choices on where to place new biomass-burning or co-burning plants. More broadly, regionalization incorporates various constraints, specific details, and heterogeneities across regions. Such an addition to the model will certainly benefit future research.
All of the scenarios that we ran in this model confirm that even an EUA price of €386 is not sufficient to achieve climate neutrality in the Czech Republic. In addition, achieving climate neutrality by 2050 would require investing in expensive technologies. The differences between biomass development scenarios are significant only until 2035. Even these differences do not seem to have a lasting impact on the overall energy mix. The residential sector is competing with the power and heat and industry sectors for biomass consumption and is essentially losing this competition. However, from a system-wide perspective, this may be more efficient. As a result, households are adapting by using more efficient appliances and insulated buildings, and they are investing in heat pump technologies more often.
Author Contributions
Conceptualization, L.R. and M.Š.; methodology, L.R. and D.T.L.; software, L.R. and D.T.L.; validation, L.R., D.T.L. and M.Š.; formal analysis, L.R., D.T.L. and M.Š.; investigation, L.R. and D.T.L.; resources, L.R. and M.Š.; data curation, L.R. and D.T.L.; writing—original draft preparation, D.T.L.; writing—review and editing, L.R.; visualization, L.R. and D.T.L.; supervision, L.R. and M.Š.; project administration, L.R. and M.Š.; funding acquisition, L.R. and M.Š. All authors have read and agreed to the published version of the manuscript.
Funding
This research was funded by the Technology Agency of the Czech Republic, grant number TL02000440: "Modelling of Sustainable Forestry Scenarios Contributing To Climate Change Adaptation – Examining the Impacts on Energy Sector and GHG Emissions in the Czech Republic and Public Acceptability of These Scenarios by Czech population".
Data Availability Statement
Not applicable.
Conflicts of Interest
The authors declare no conflict of interest. The funders had no role in the design of the study; in the collection, analyses or interpretation of data; in the writing of the manuscript; or in the decision to publish the results.
Abbreviations
| ETSAP | Energy Technology System Analyses Program |
| H&P | Heat and power |
| IEA | International Energy Agency |
| IFER | Institute for Forest Ecosystem Research |
| RES | Renewable energy sources |
| TIMES | The Integrated MARKAL-EFOM System |
References
- Lorenc, F. Škodliví činitelé v lesích Česka 2021/2022. Výzkumný ústav lesního hospodářství a myslivosti, v. v. i. Lesní ochranná služba, Ministerstvo zemědělství 2022.
- Rečka, L.; Ščasnỳ, M. Impacts of reclassified brown coal reserves on the energy system and deep decarbonisation target in the Czech Republic. Energies 2017, 10, 1947.
- IEA-ETSAP. TIMES. Accessed June, 2023, from https://iea-etsap.org/index.php/etsap-tools/model-generators/times.
- Capros, P.; Paroussos, L.; Fragkos, P.; Tsani, S.; Boitier, B.; Wagner, F.; Busch, S.; Resch, G.; Blesl, M.; Bollen, J. Description of models and scenarios used to assess European decarbonisation pathways. Energy Strategy Reviews 2014, 2, 220–230.
- ERU. Roční zpráva o provozu elektrizační soustavy ČR 2019 2019. Retrieved May, 2022, from https://www.eru.cz/rocni-zprava-o-provozu-elektrizacni-soustavy-cr-pro-rok-2019.
- ERU. Roční zpráva o provozu teplárenských soustav ČR 2019." 2019. Retrieved May, 2022, from https://www.eru.cz/rocni-zprava-o-provozu-teplarenskych-soustav-cr-za-rok-2019.
- CZSO. Spotřeba paliv a energií v domácnostech, 2017. Czech Satitistical Office - ENERGO 2015 data. Retrieved June, 2020, from https://www.czso.cz/csu/czso/spotreba-paliv-a-energii-v-domacnostech.
- Cienciala, E.; Melichar, J. Forest carbon stock budget development following extreme drought-induced dieback of coniferous stands in Central Europe–a CBM-CFS3 model application 2023. preprint.
- Lyčka, Z. Náklady na vytápění dřevními peletami, 2010. Retrieved June, 2022, from https://oze.tzb-info.cz/biomasa/6263-naklady-na-vytapeni-drevnimi-peletami.
- Energy Pellets of America. How Many Wood Pellets Do I Need to Heat My Home?, 2018. Retrieved June, 2022, from https://www.energypelletsamerica.com/how-many-wood-pellets-do-i-need-to-heat-my-home/#:~:text=40%20lb%20bags.-,The%20average%20homeowner%20will%20need%202%20to%203%20tons%20of,commercial%20site%20with%20wood%20pellets.
- TZBINFO. Přehled energetických plodin, jejich vlastnosti a přepočty jednotek. Retrieved June, 2022, from https://www.tzb-info.cz/tabulky-a-vypocty/98-prehled-energetickych-plodin-jejich-vlastnosti-a-prepocty-jednotek.
- Vytečka, L. Logistika Výrobního Procesu Zaměřeno na Skladování Nákladu a Přepravu Dřevní Štěpky. Dřevošrot a.s. Retrieved July, 2023, from https://docplayer.cz/3301723-Logistika-vyrobniho-procesu-zamereno-na-skladovani-nakladku-a-prepravu-drevni-stepky-drevosrot-a-s.html.
- Wang, J.; Rakha, H.A. Fuel consumption model for heavy duty diesel trucks: Model development and testing. Transportation Research Part D: Transport and Environment 2017, 55, 127–141.
- Natural Resources Canada. Learn the facts: Emissions from your vehicle, 2014. Retrieved JuLy, 2023, from https://natural-resources.canada.ca/sites/www.nrcan.gc.ca/files/oee/pdf/transportation/fuel-efficient-technologies/autosmart_factsheet_9_e.pdf.
- MIT. The National Energy and Climate Plan of the Czech Republic 2019. Cambridge, MA, USA.
- MoE. National Inventory Report (NIR) 2021. Ministry of the Environment of the Czech Republic: Prague, Czech Republic.
- CIEP., I. Hydrogen in North-Western Europe 2021. International Energy Agency: Paris, France; Clingendael International Energy Programme: The Hague, The Netherlands.
| 1 | expressed in 2015 Euros |
| 2 | expressed in 2015 euros |
Figure 1.
Czech NUTS 3 regions.
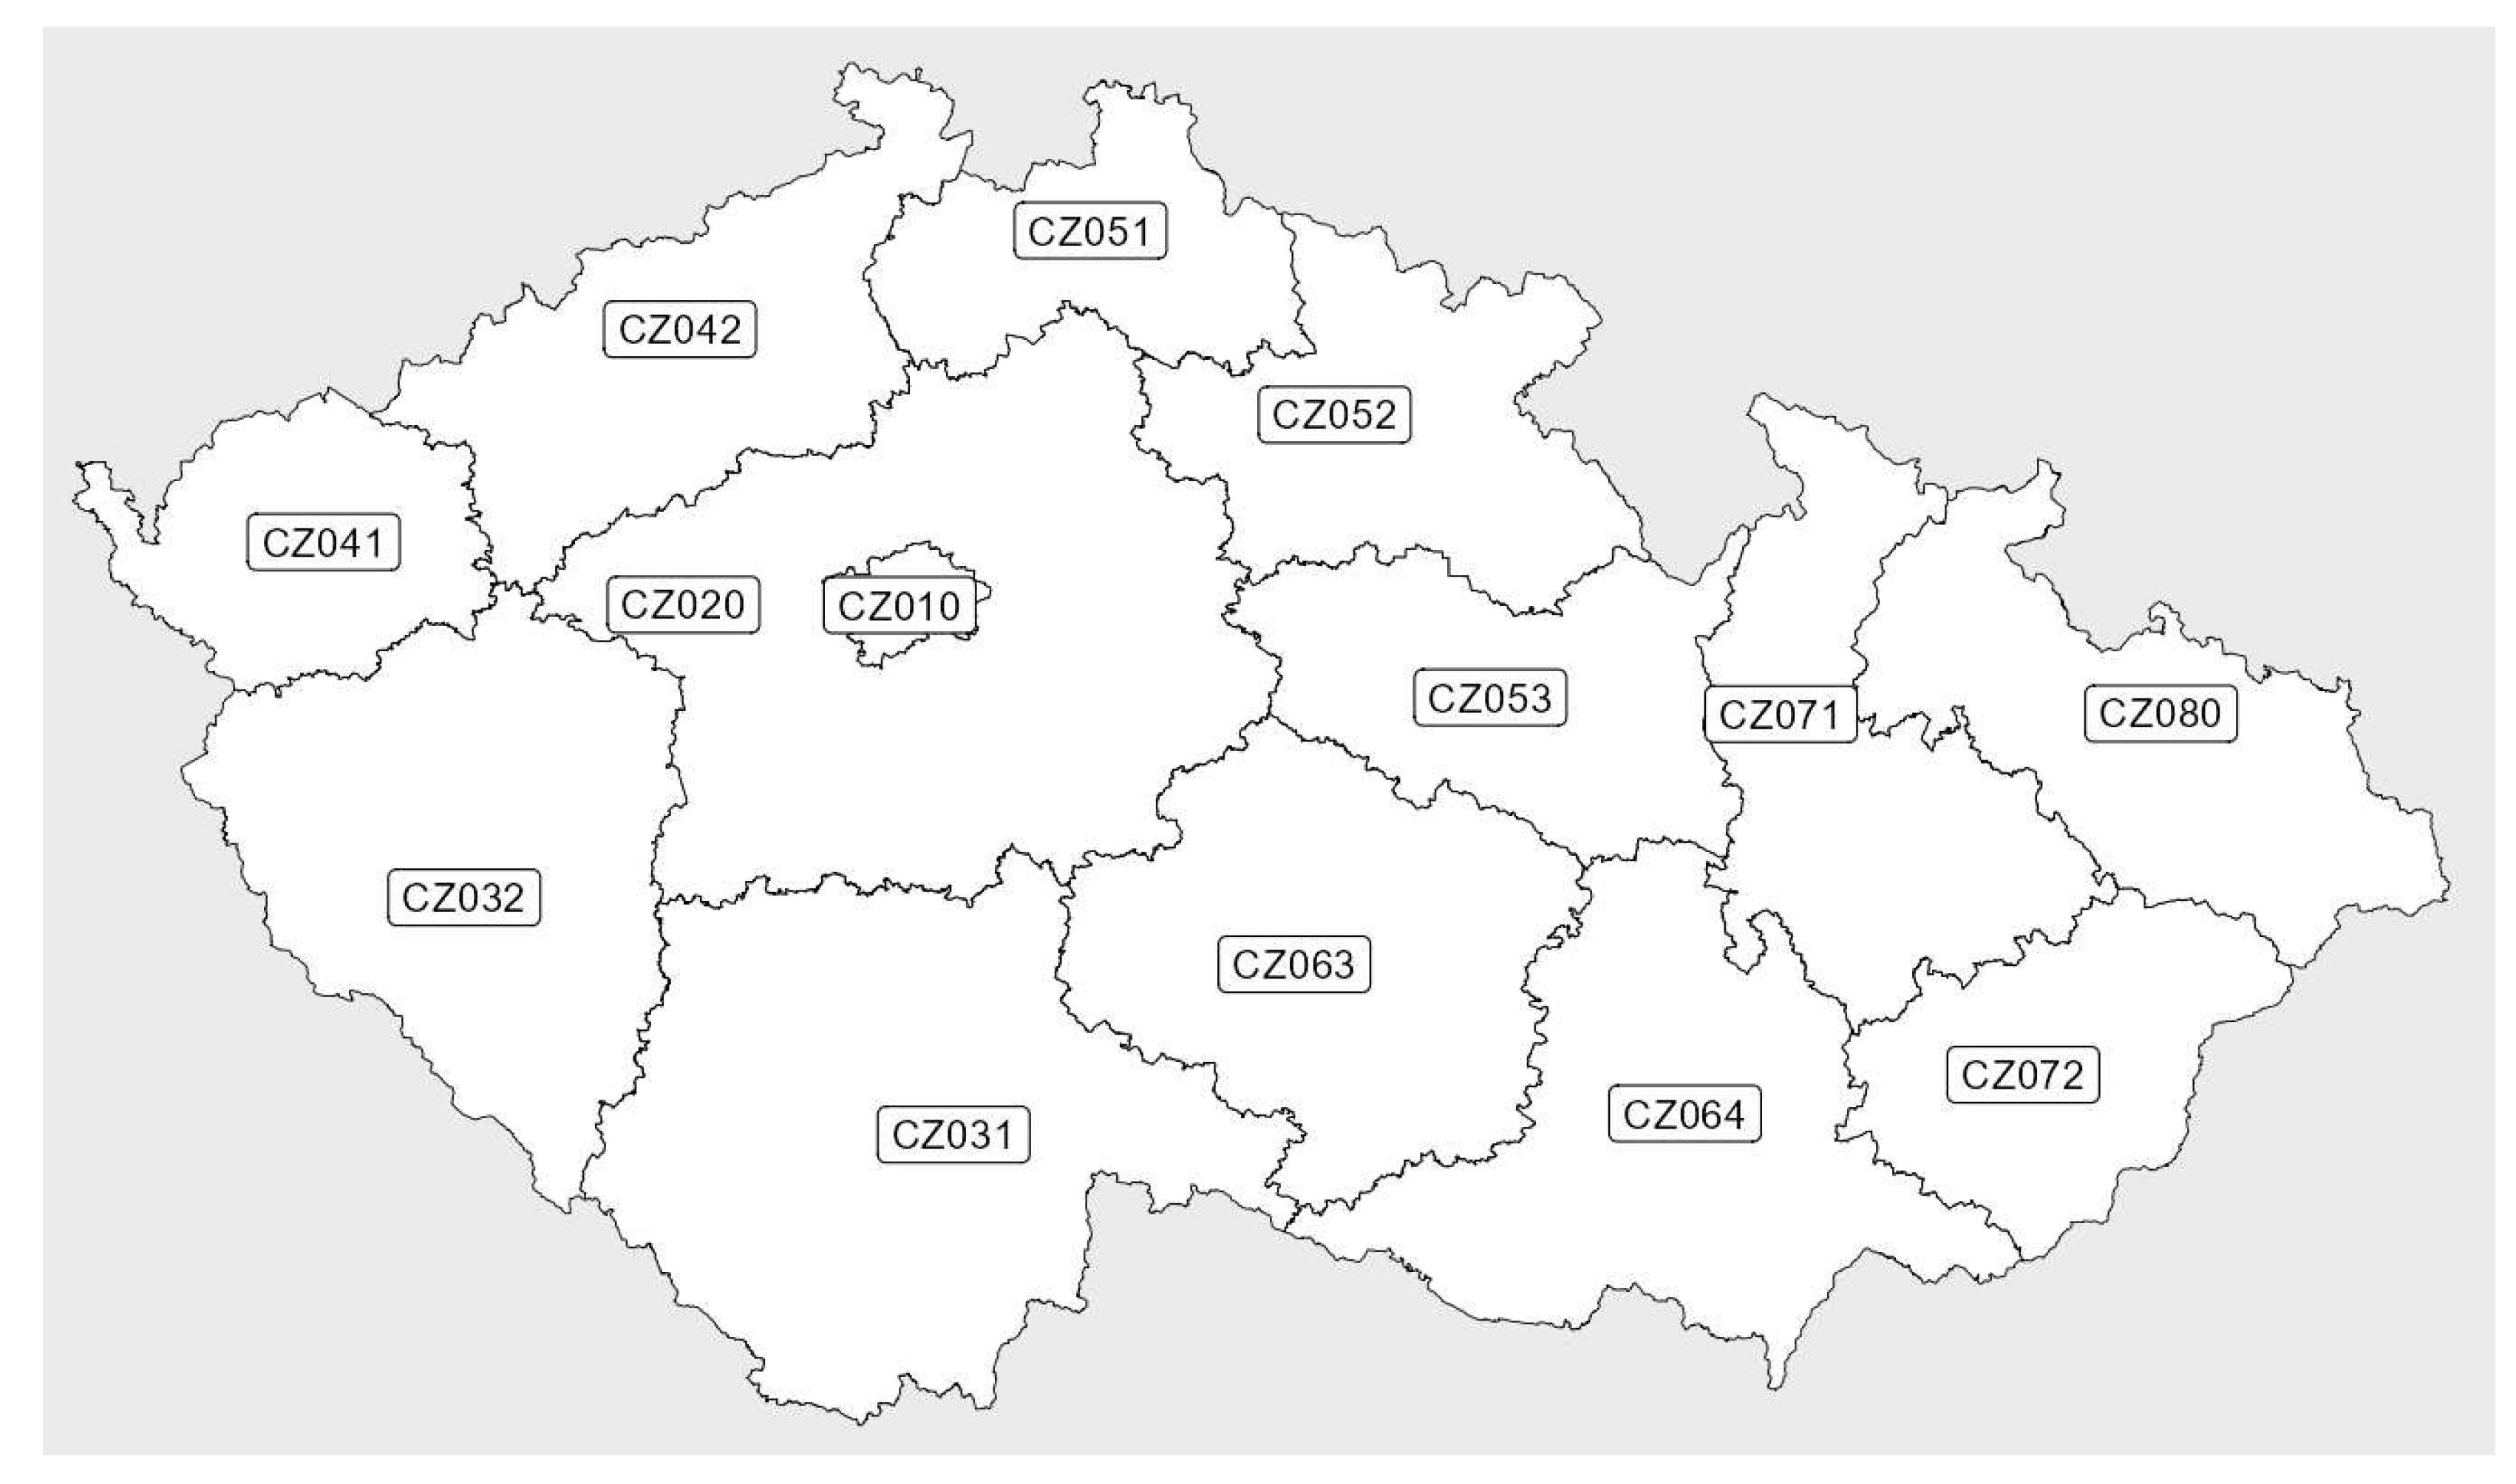
Figure 2.
Biomass availability. Source: IFER
Figure 2.
Biomass availability. Source: IFER
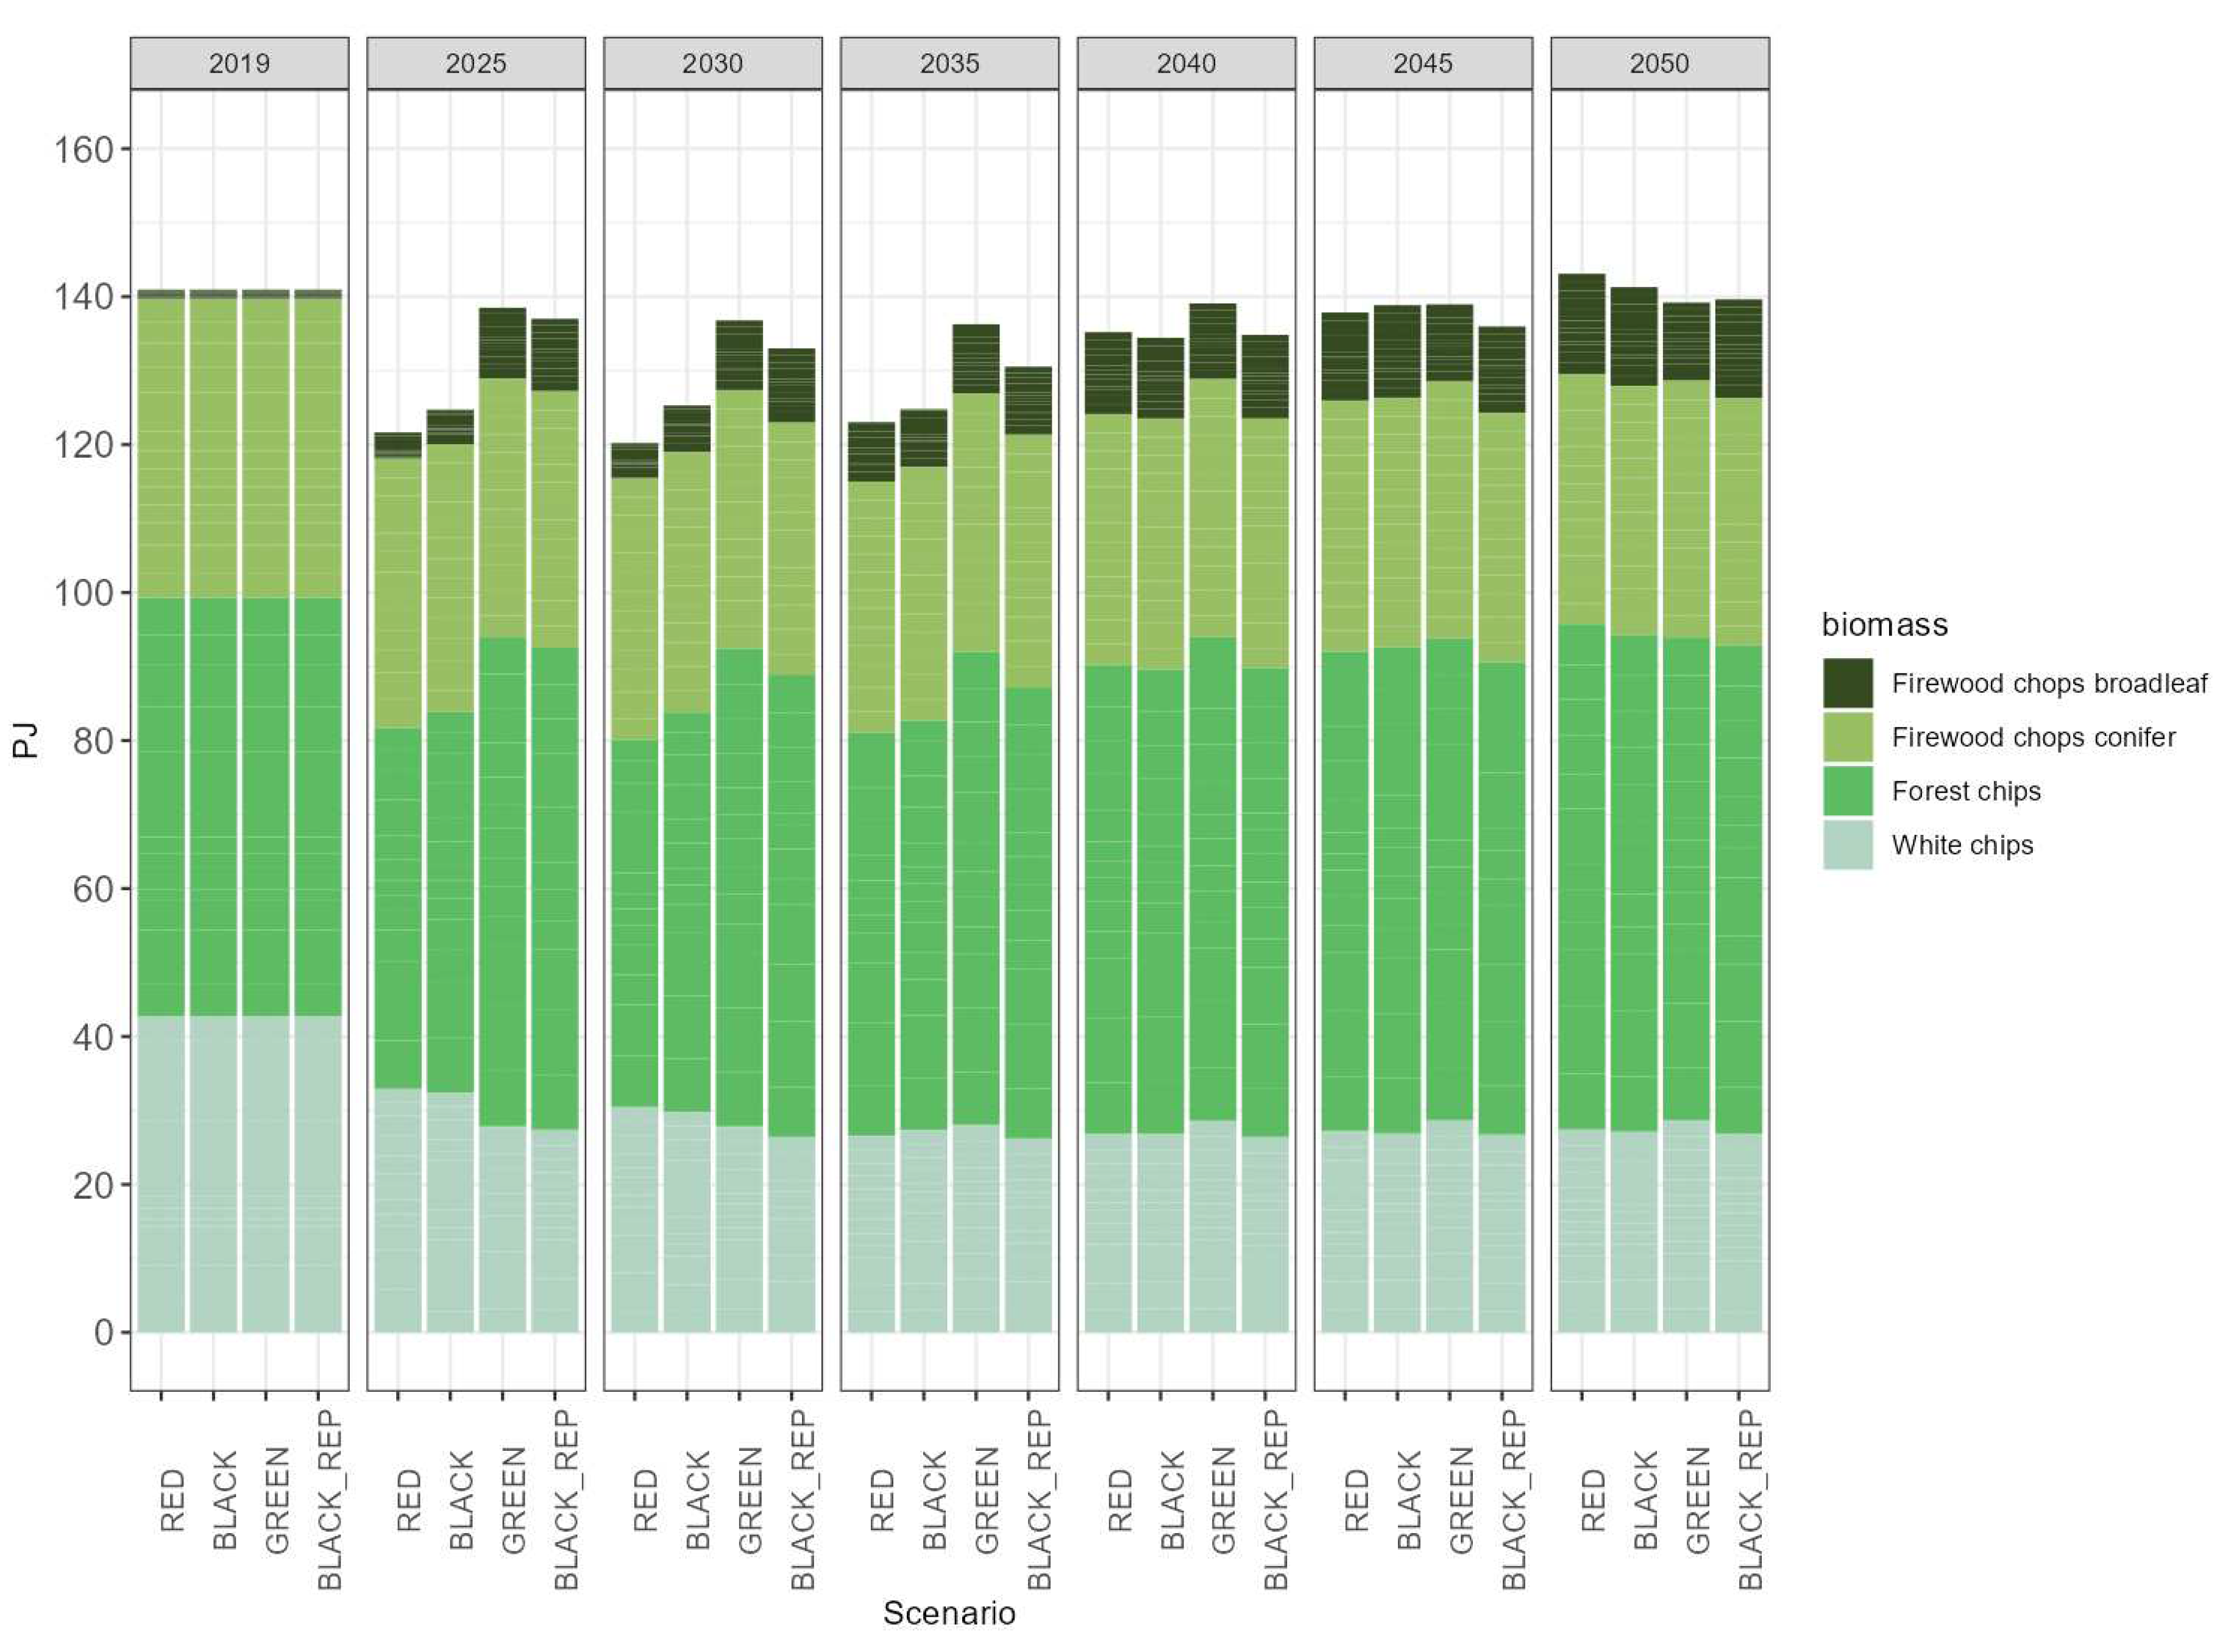
Figure 3.
Biomass flows in TIMES-CZ.
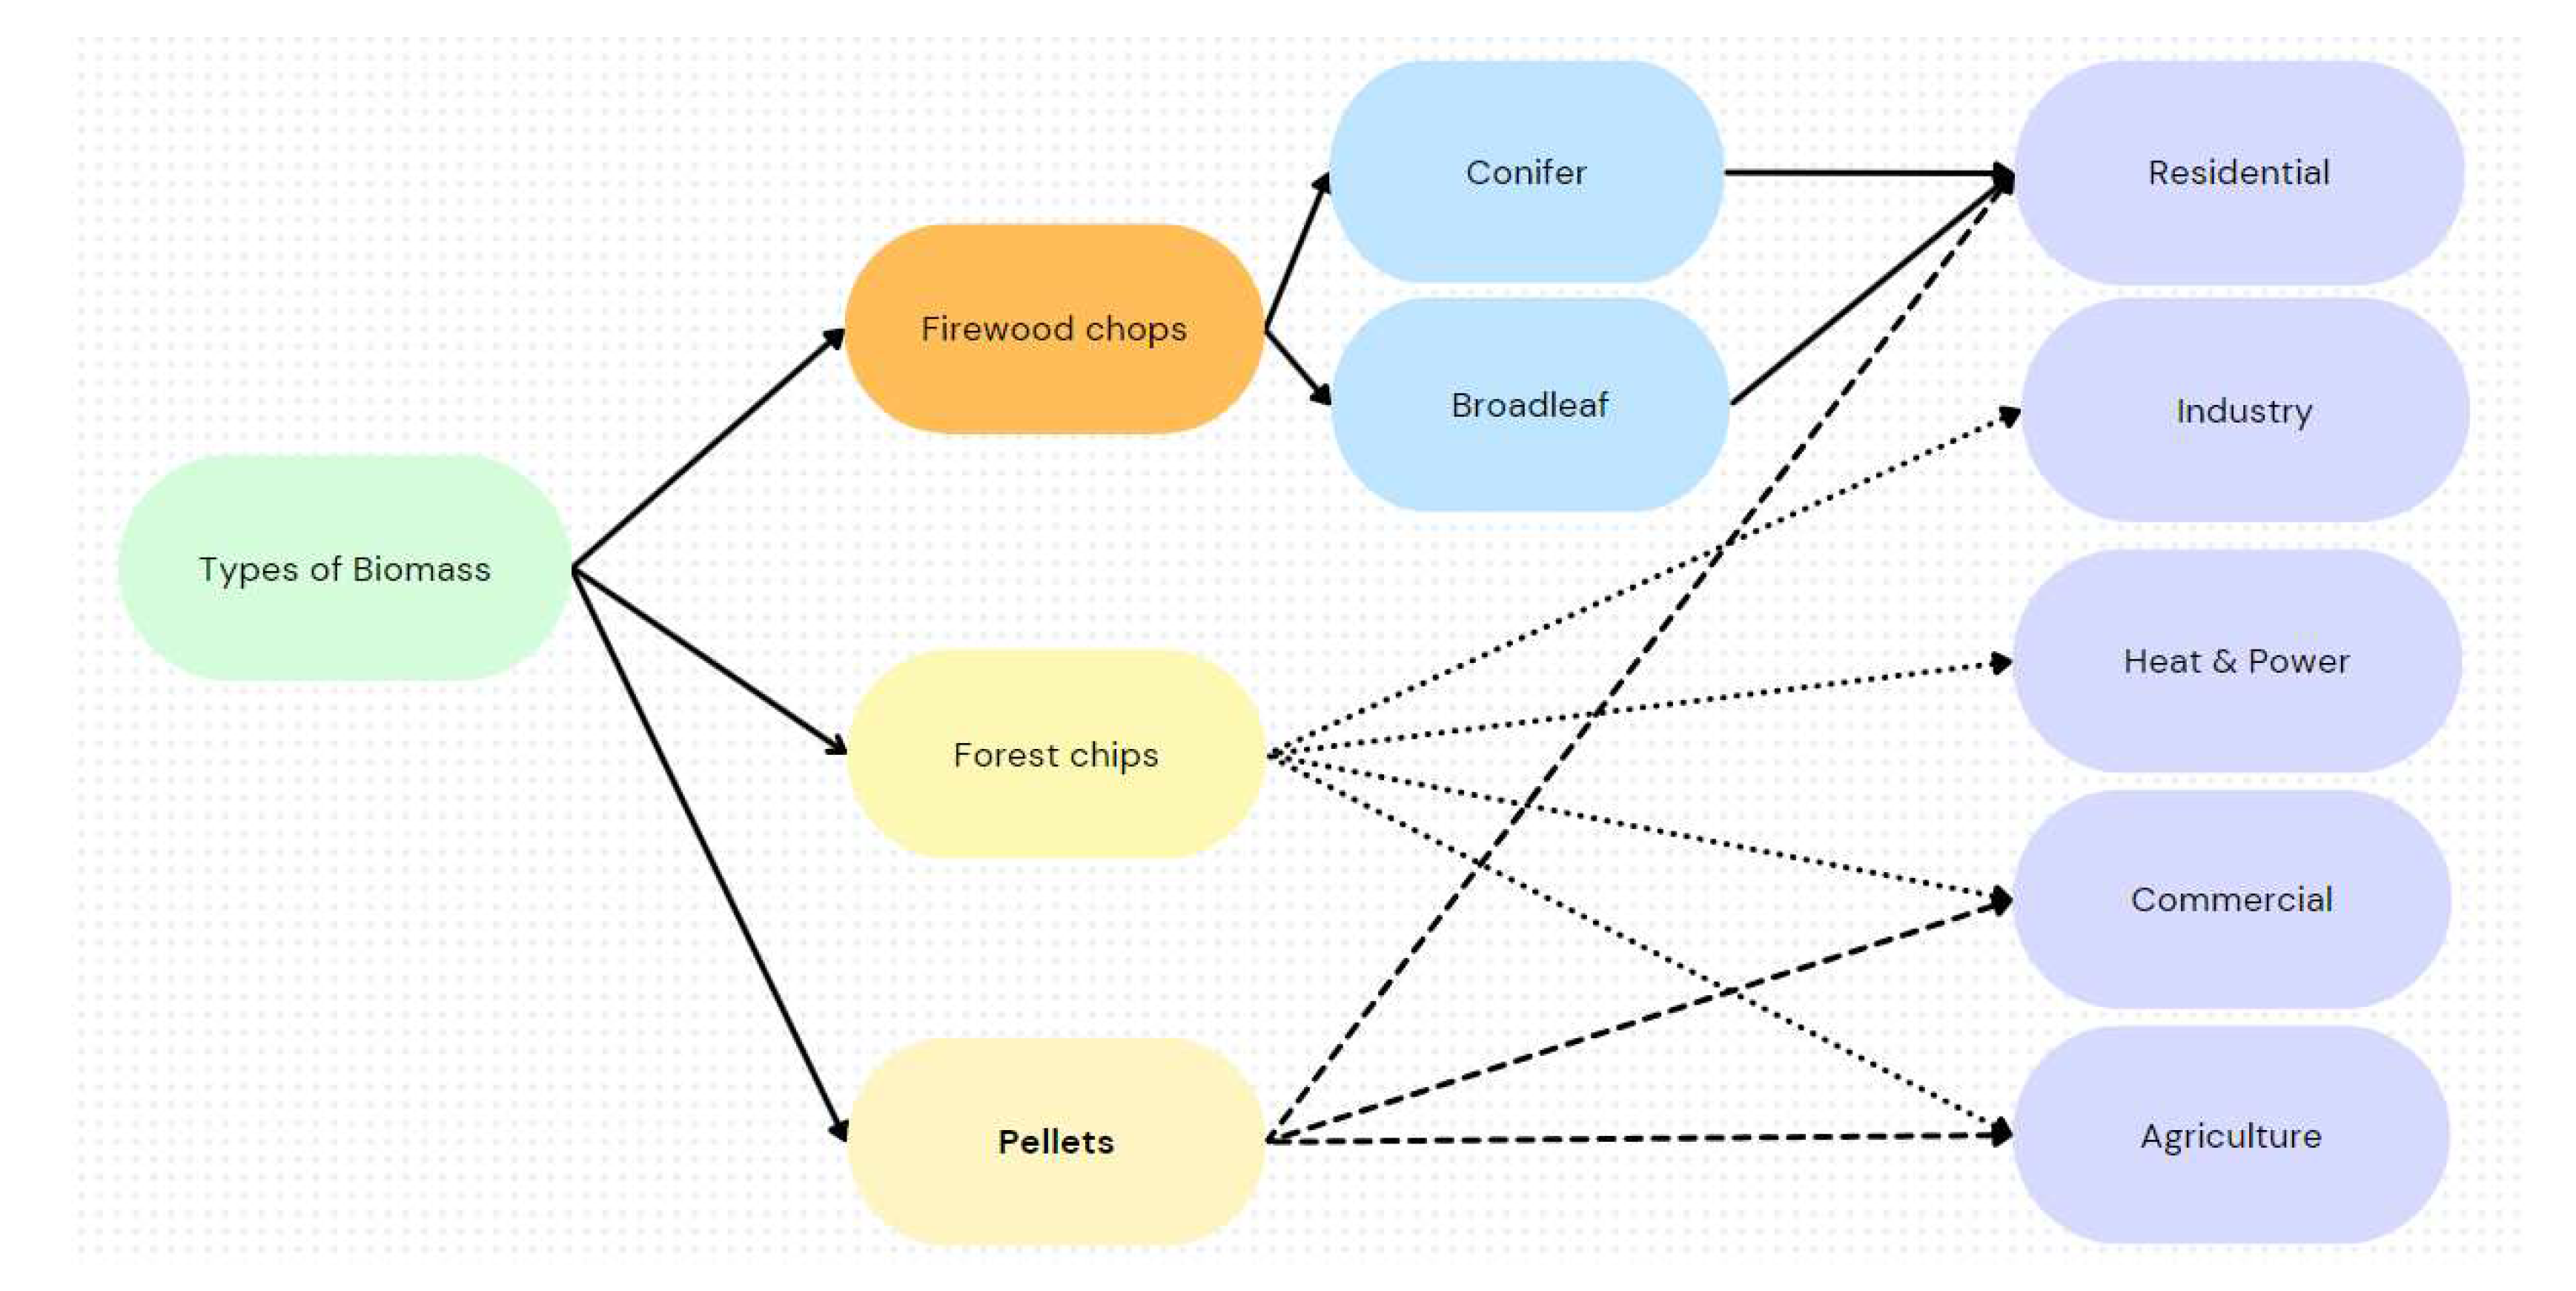
Figure 4.
Supply of primary energy sources.
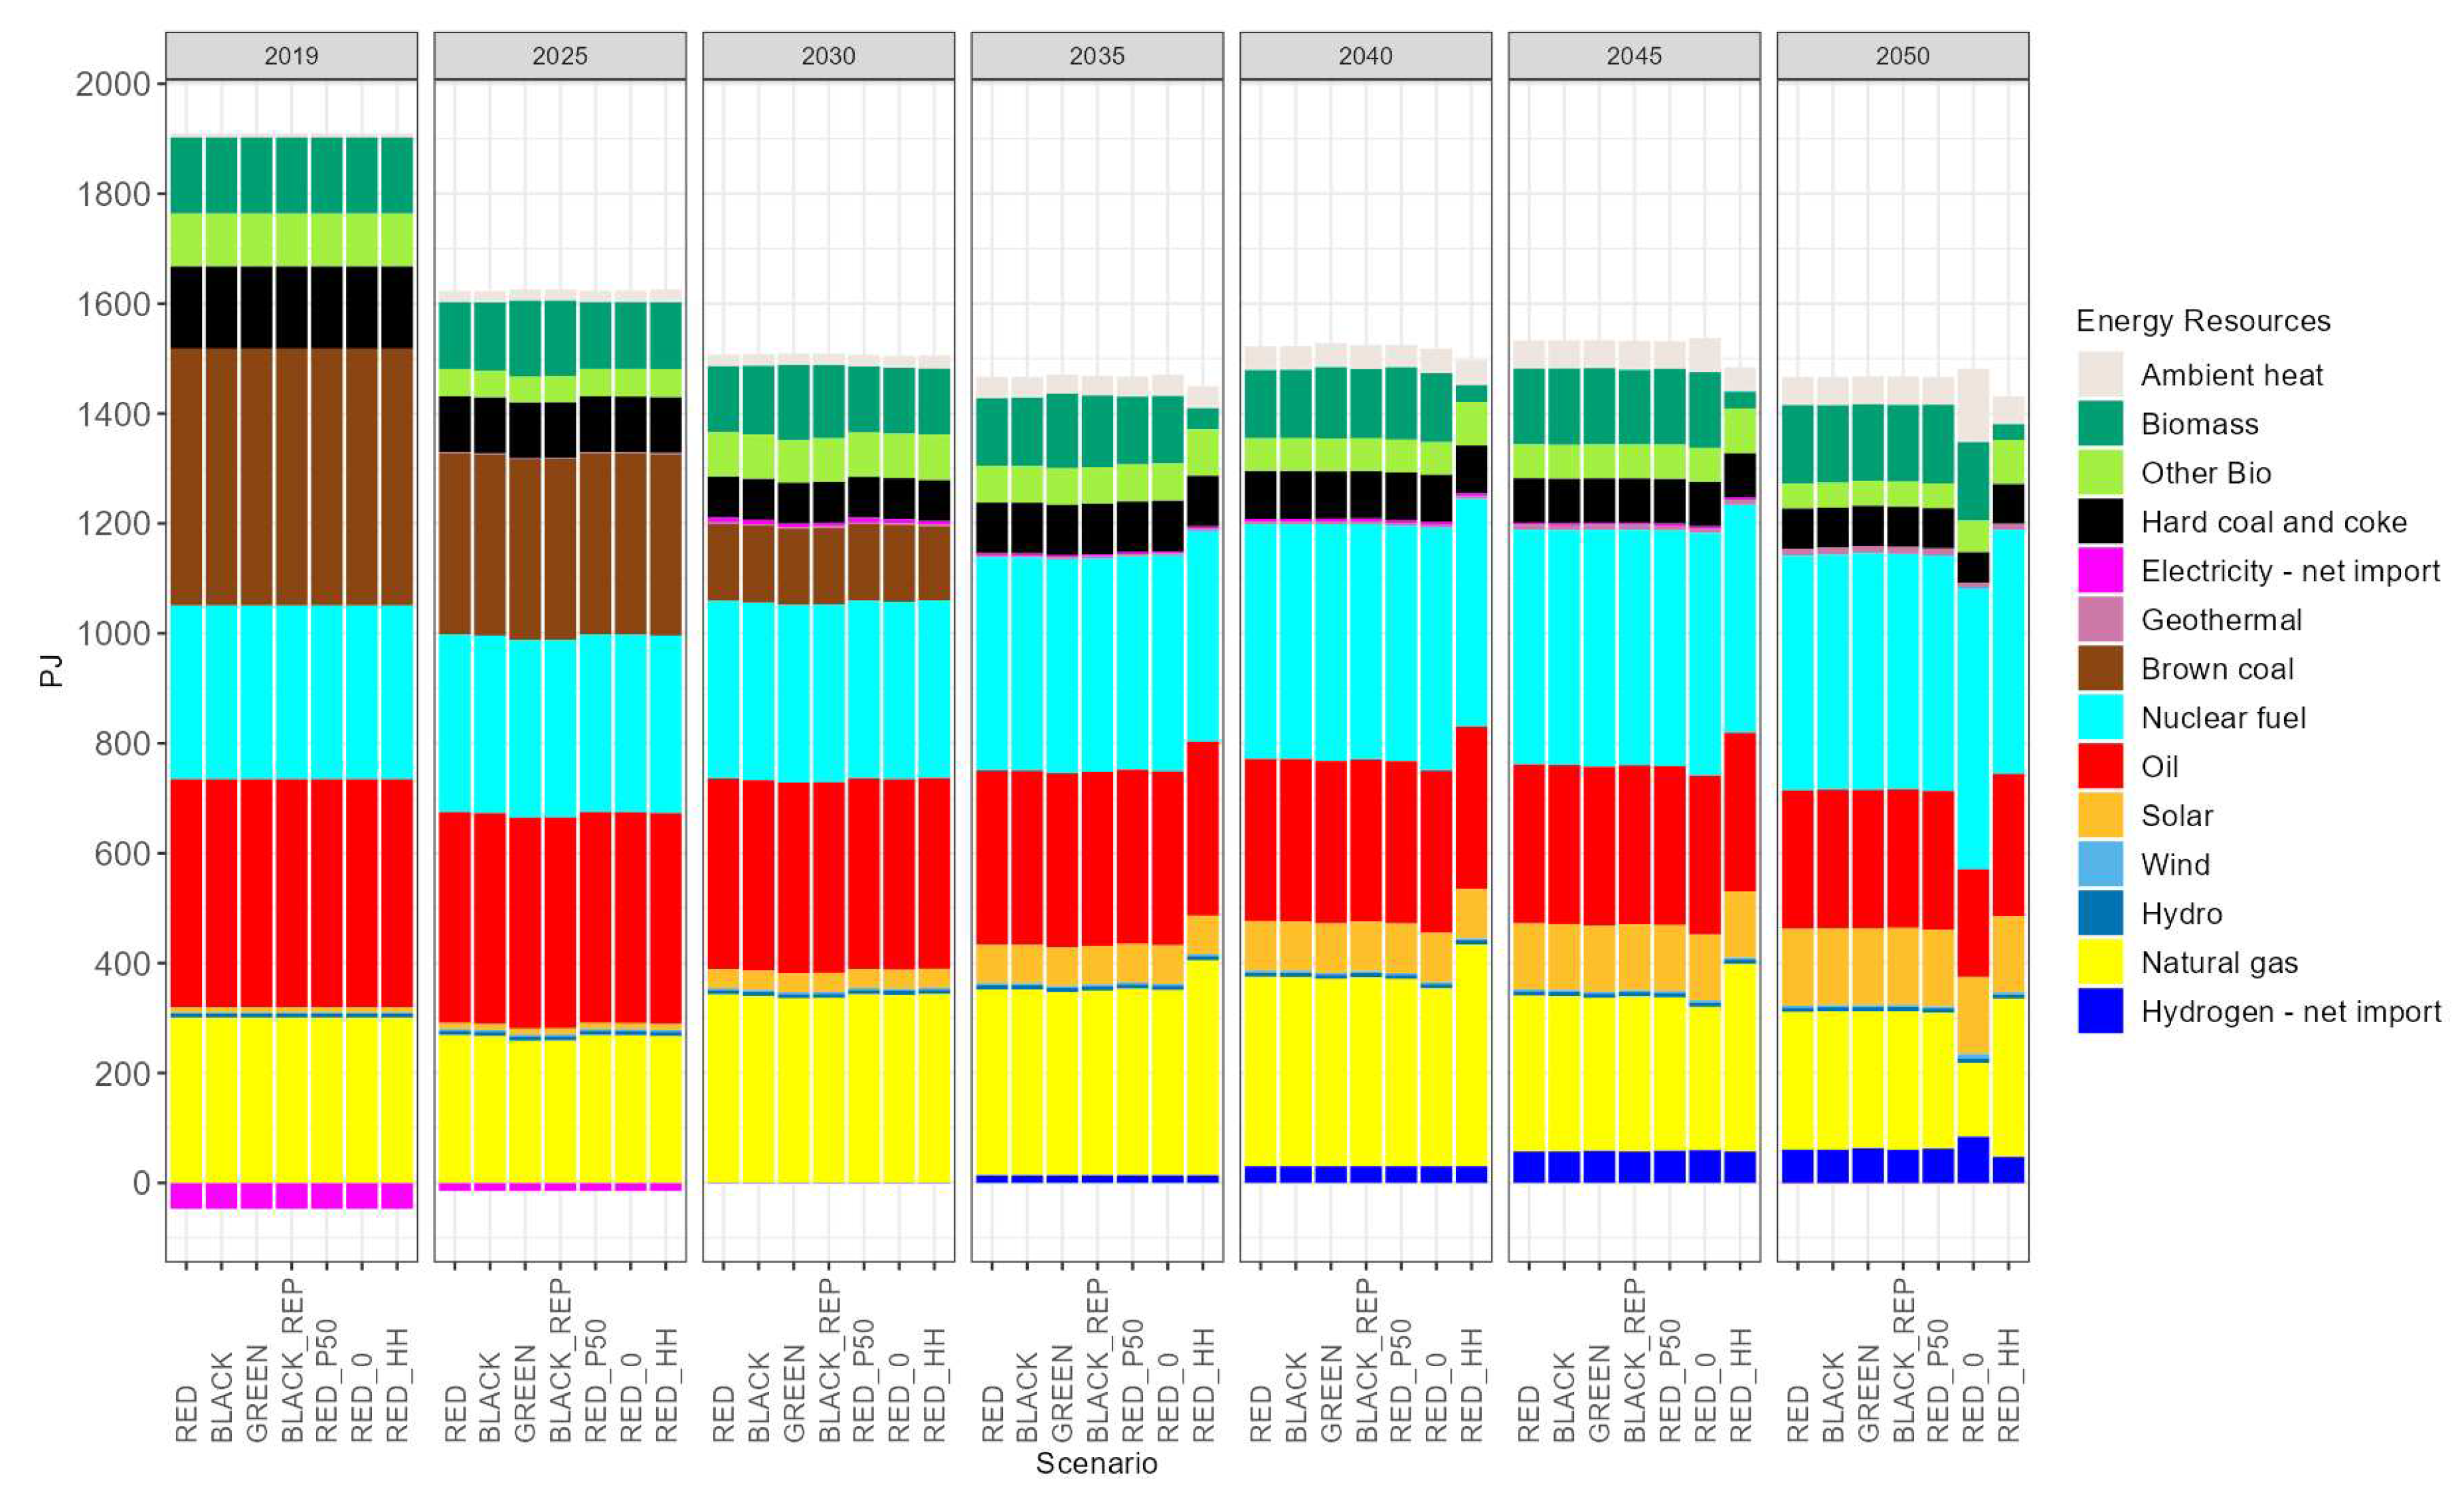
Figure 5.
Biomass supply RED scenario.
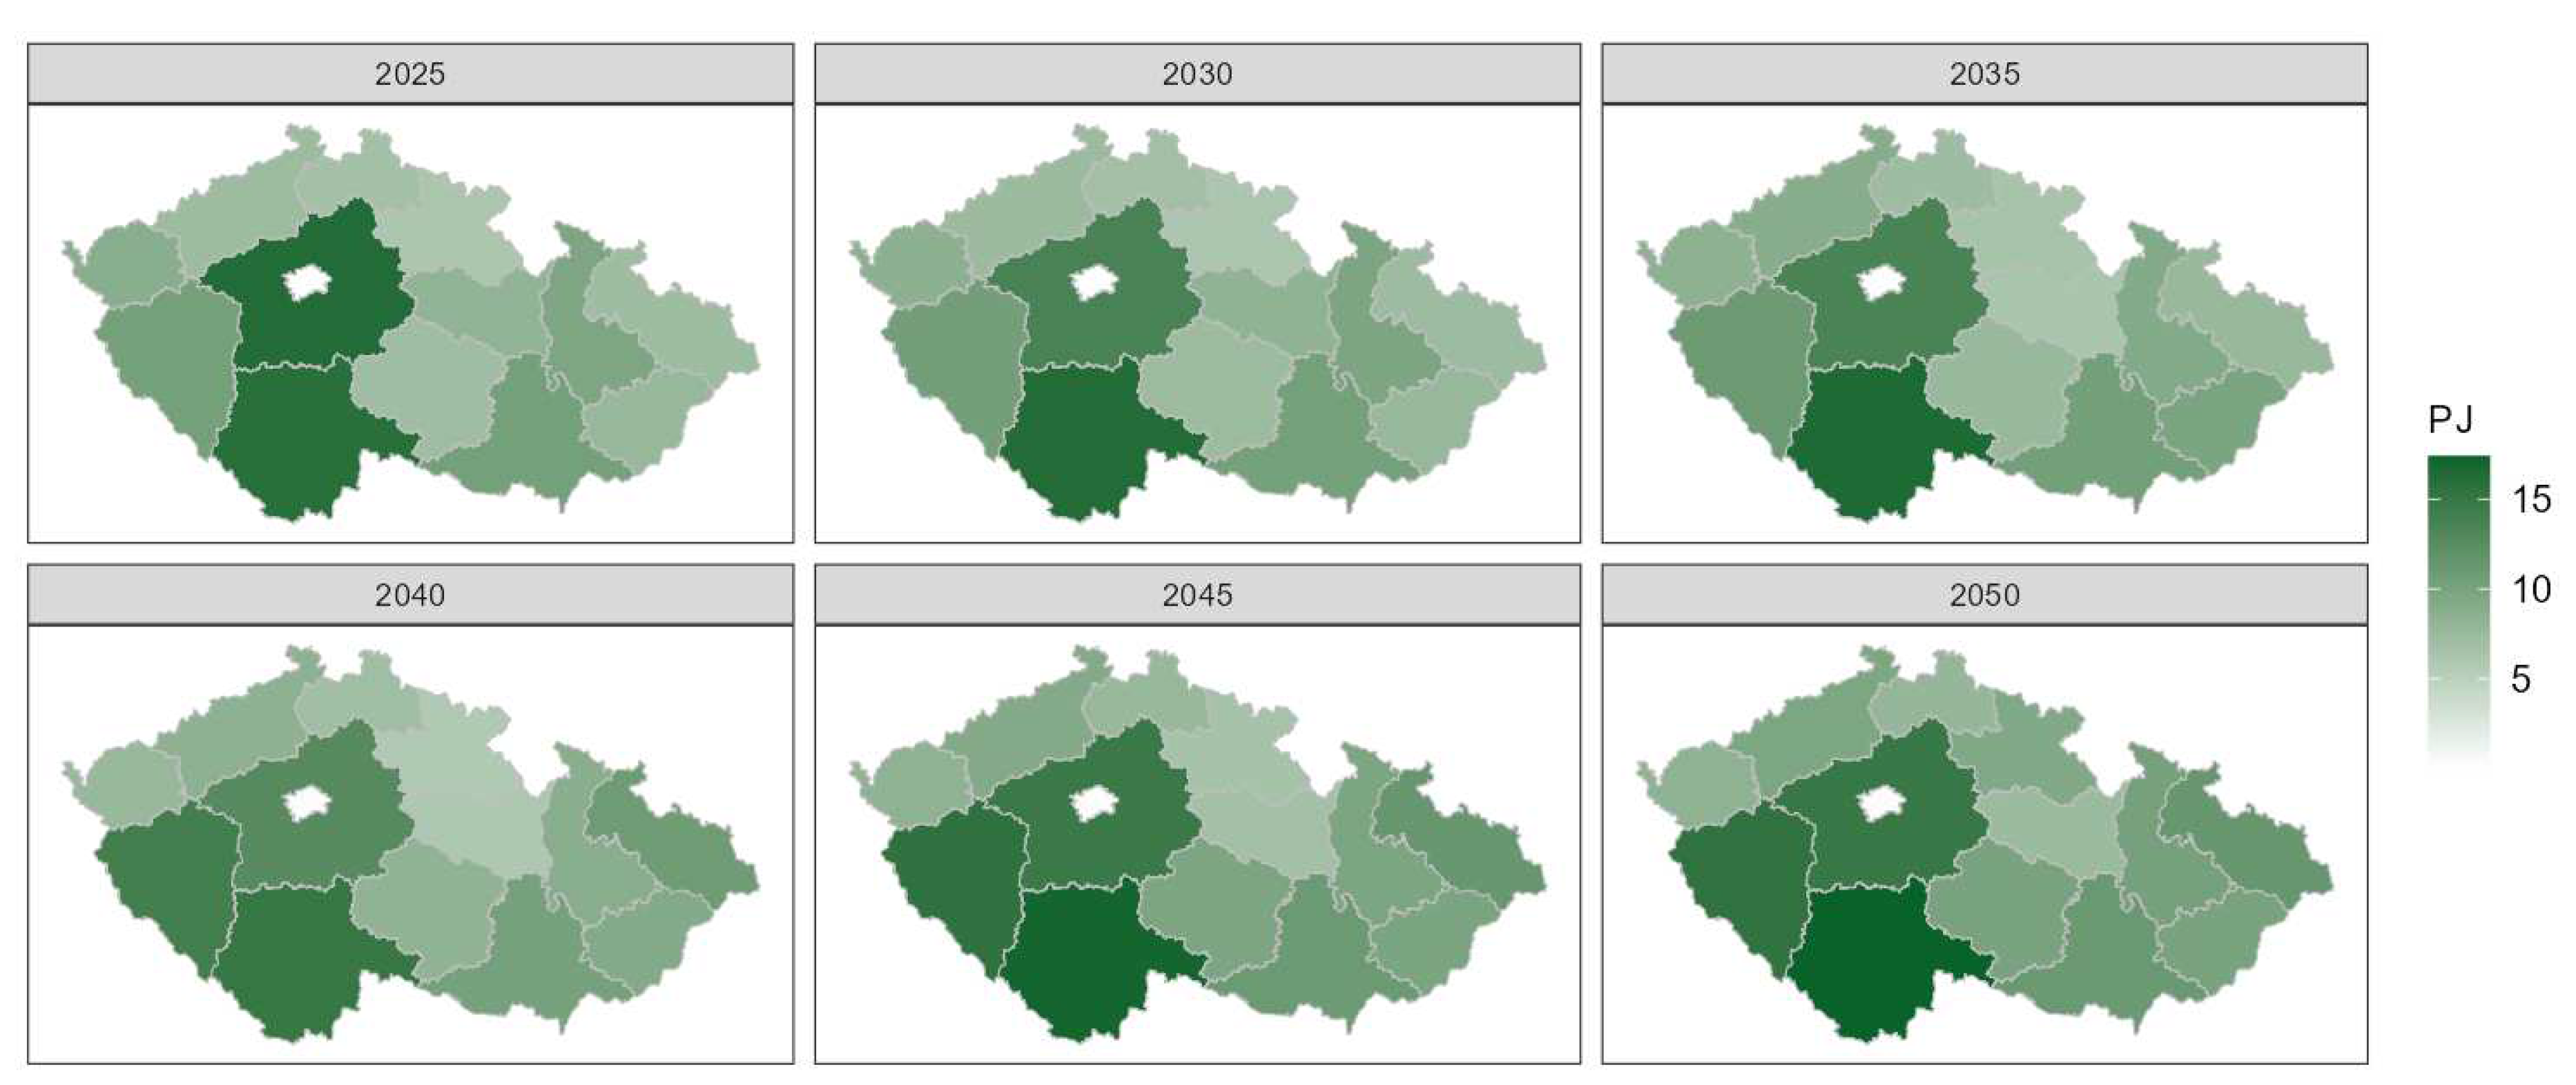
Figure 6.
Biomass consumption by sectors and its availability.
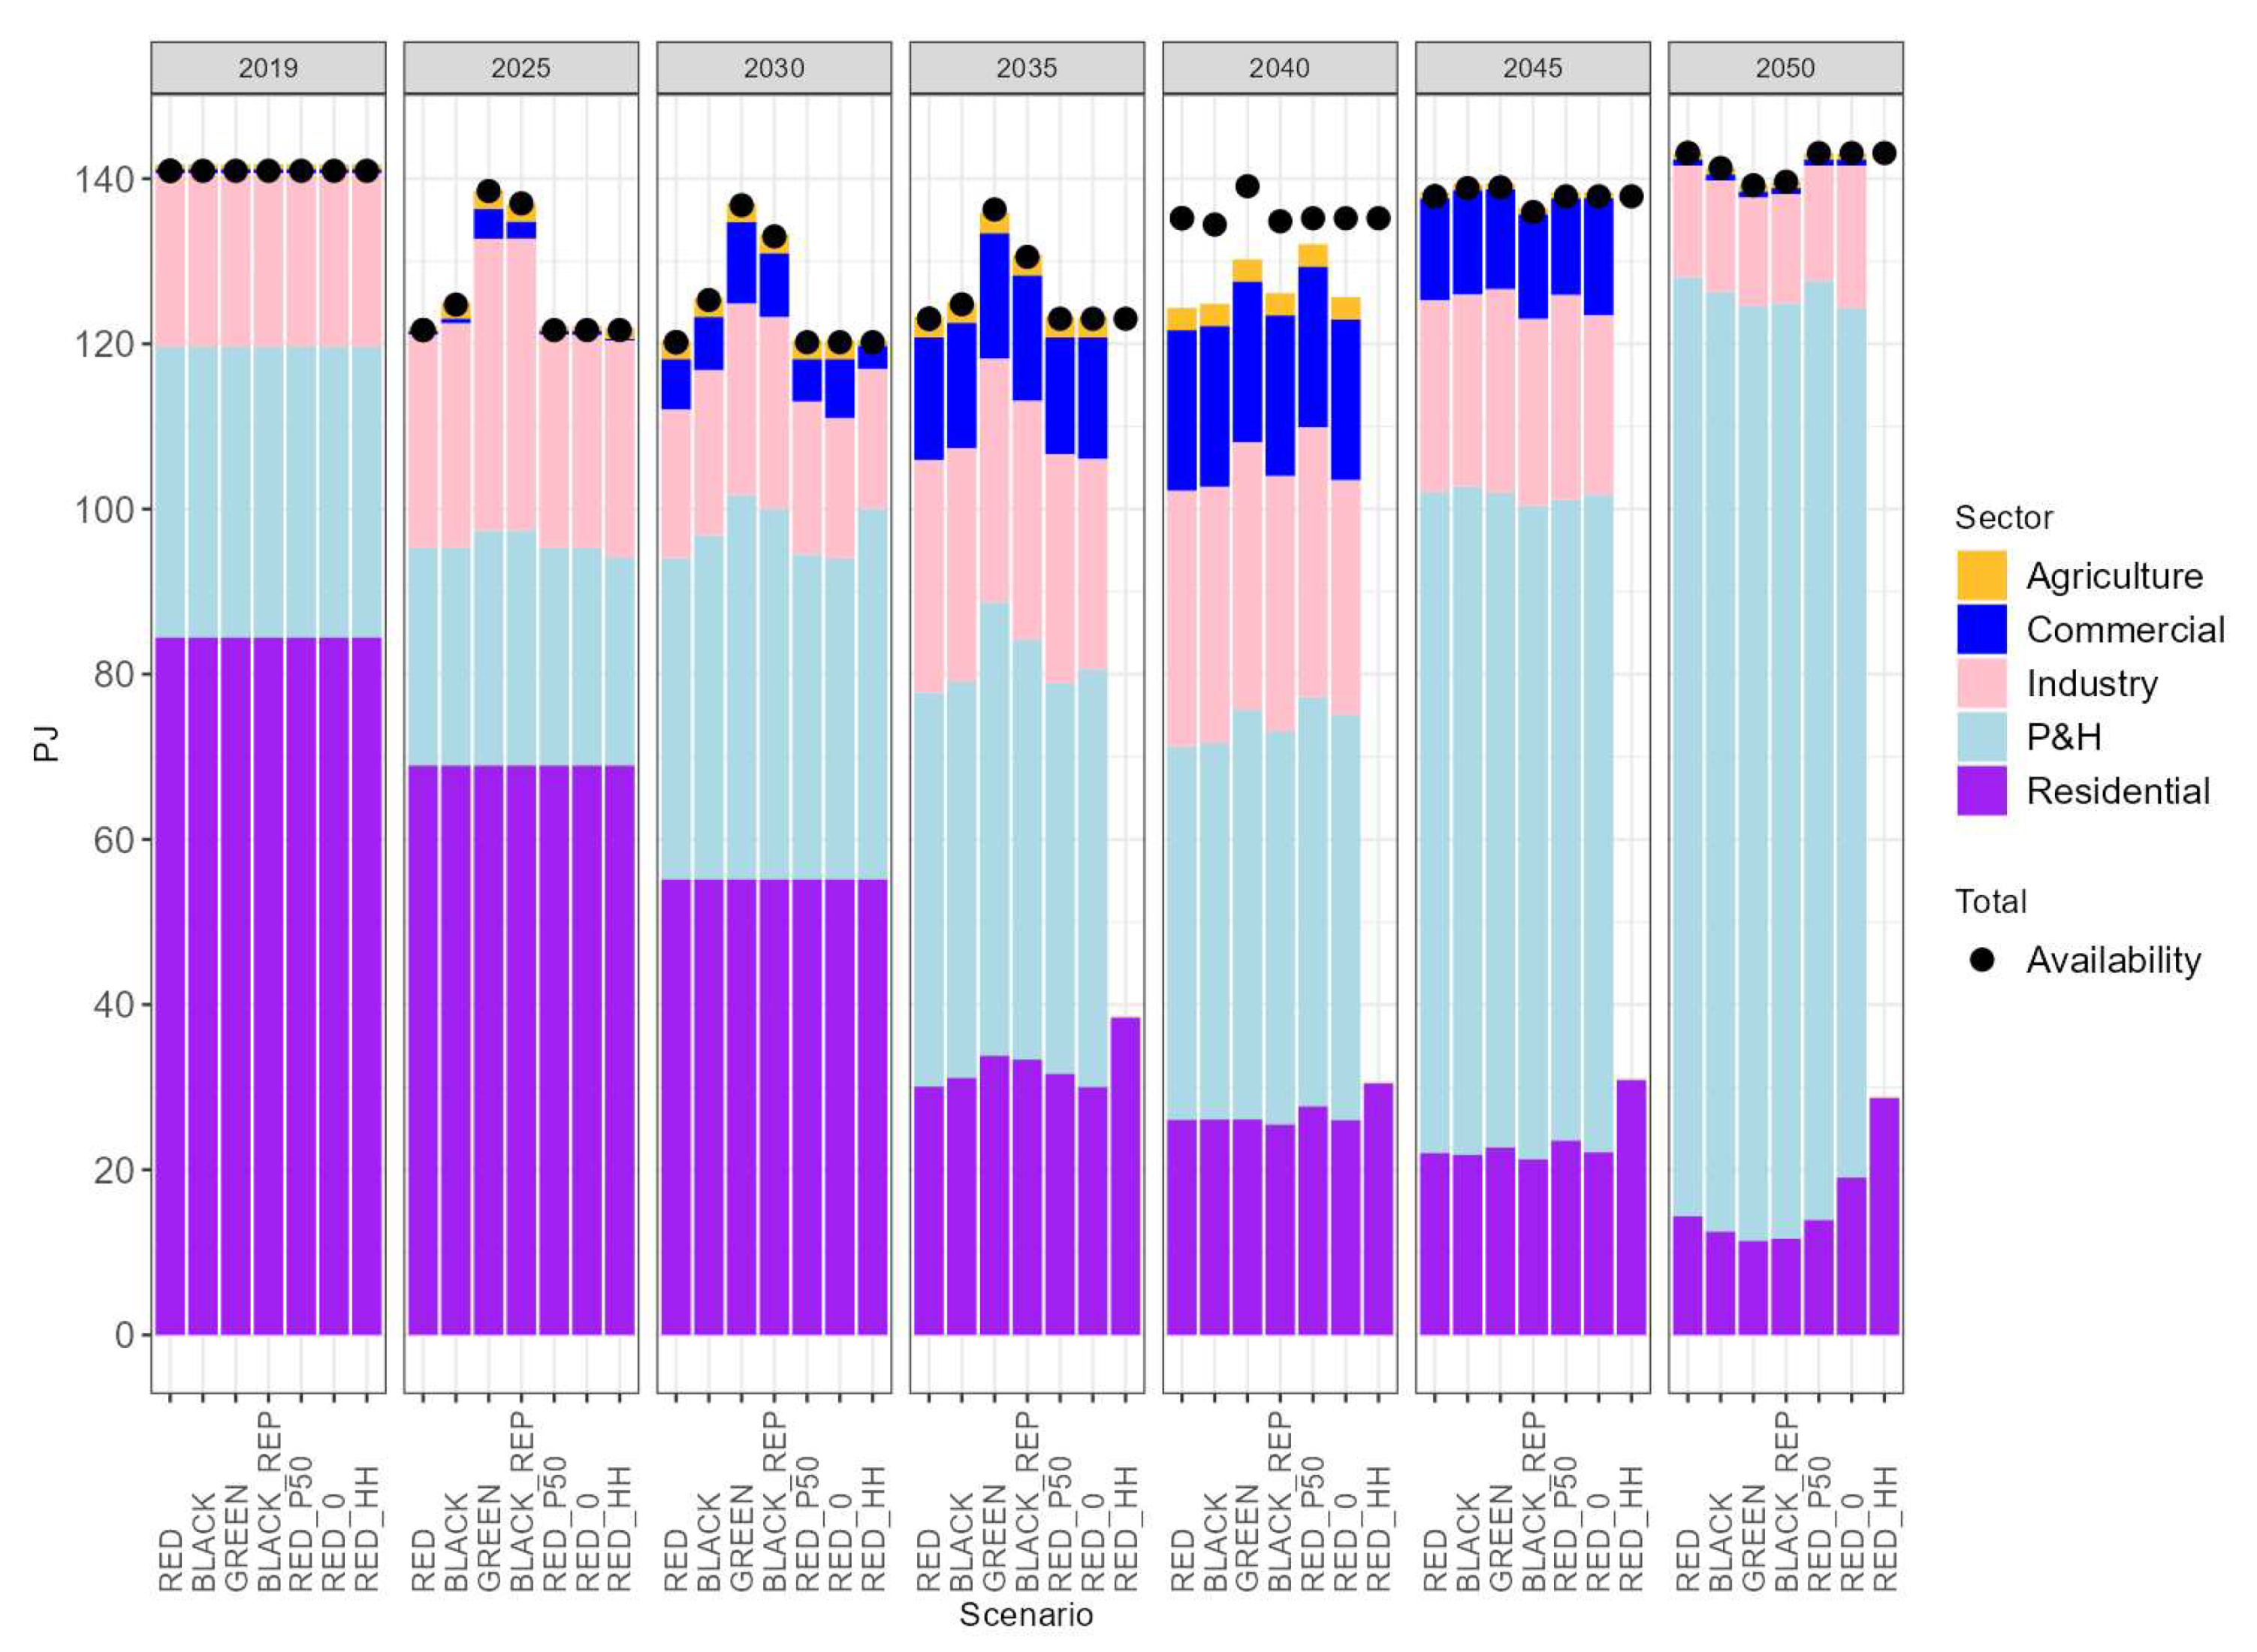
Figure 7.
Final consumption of energy by the residential sector.
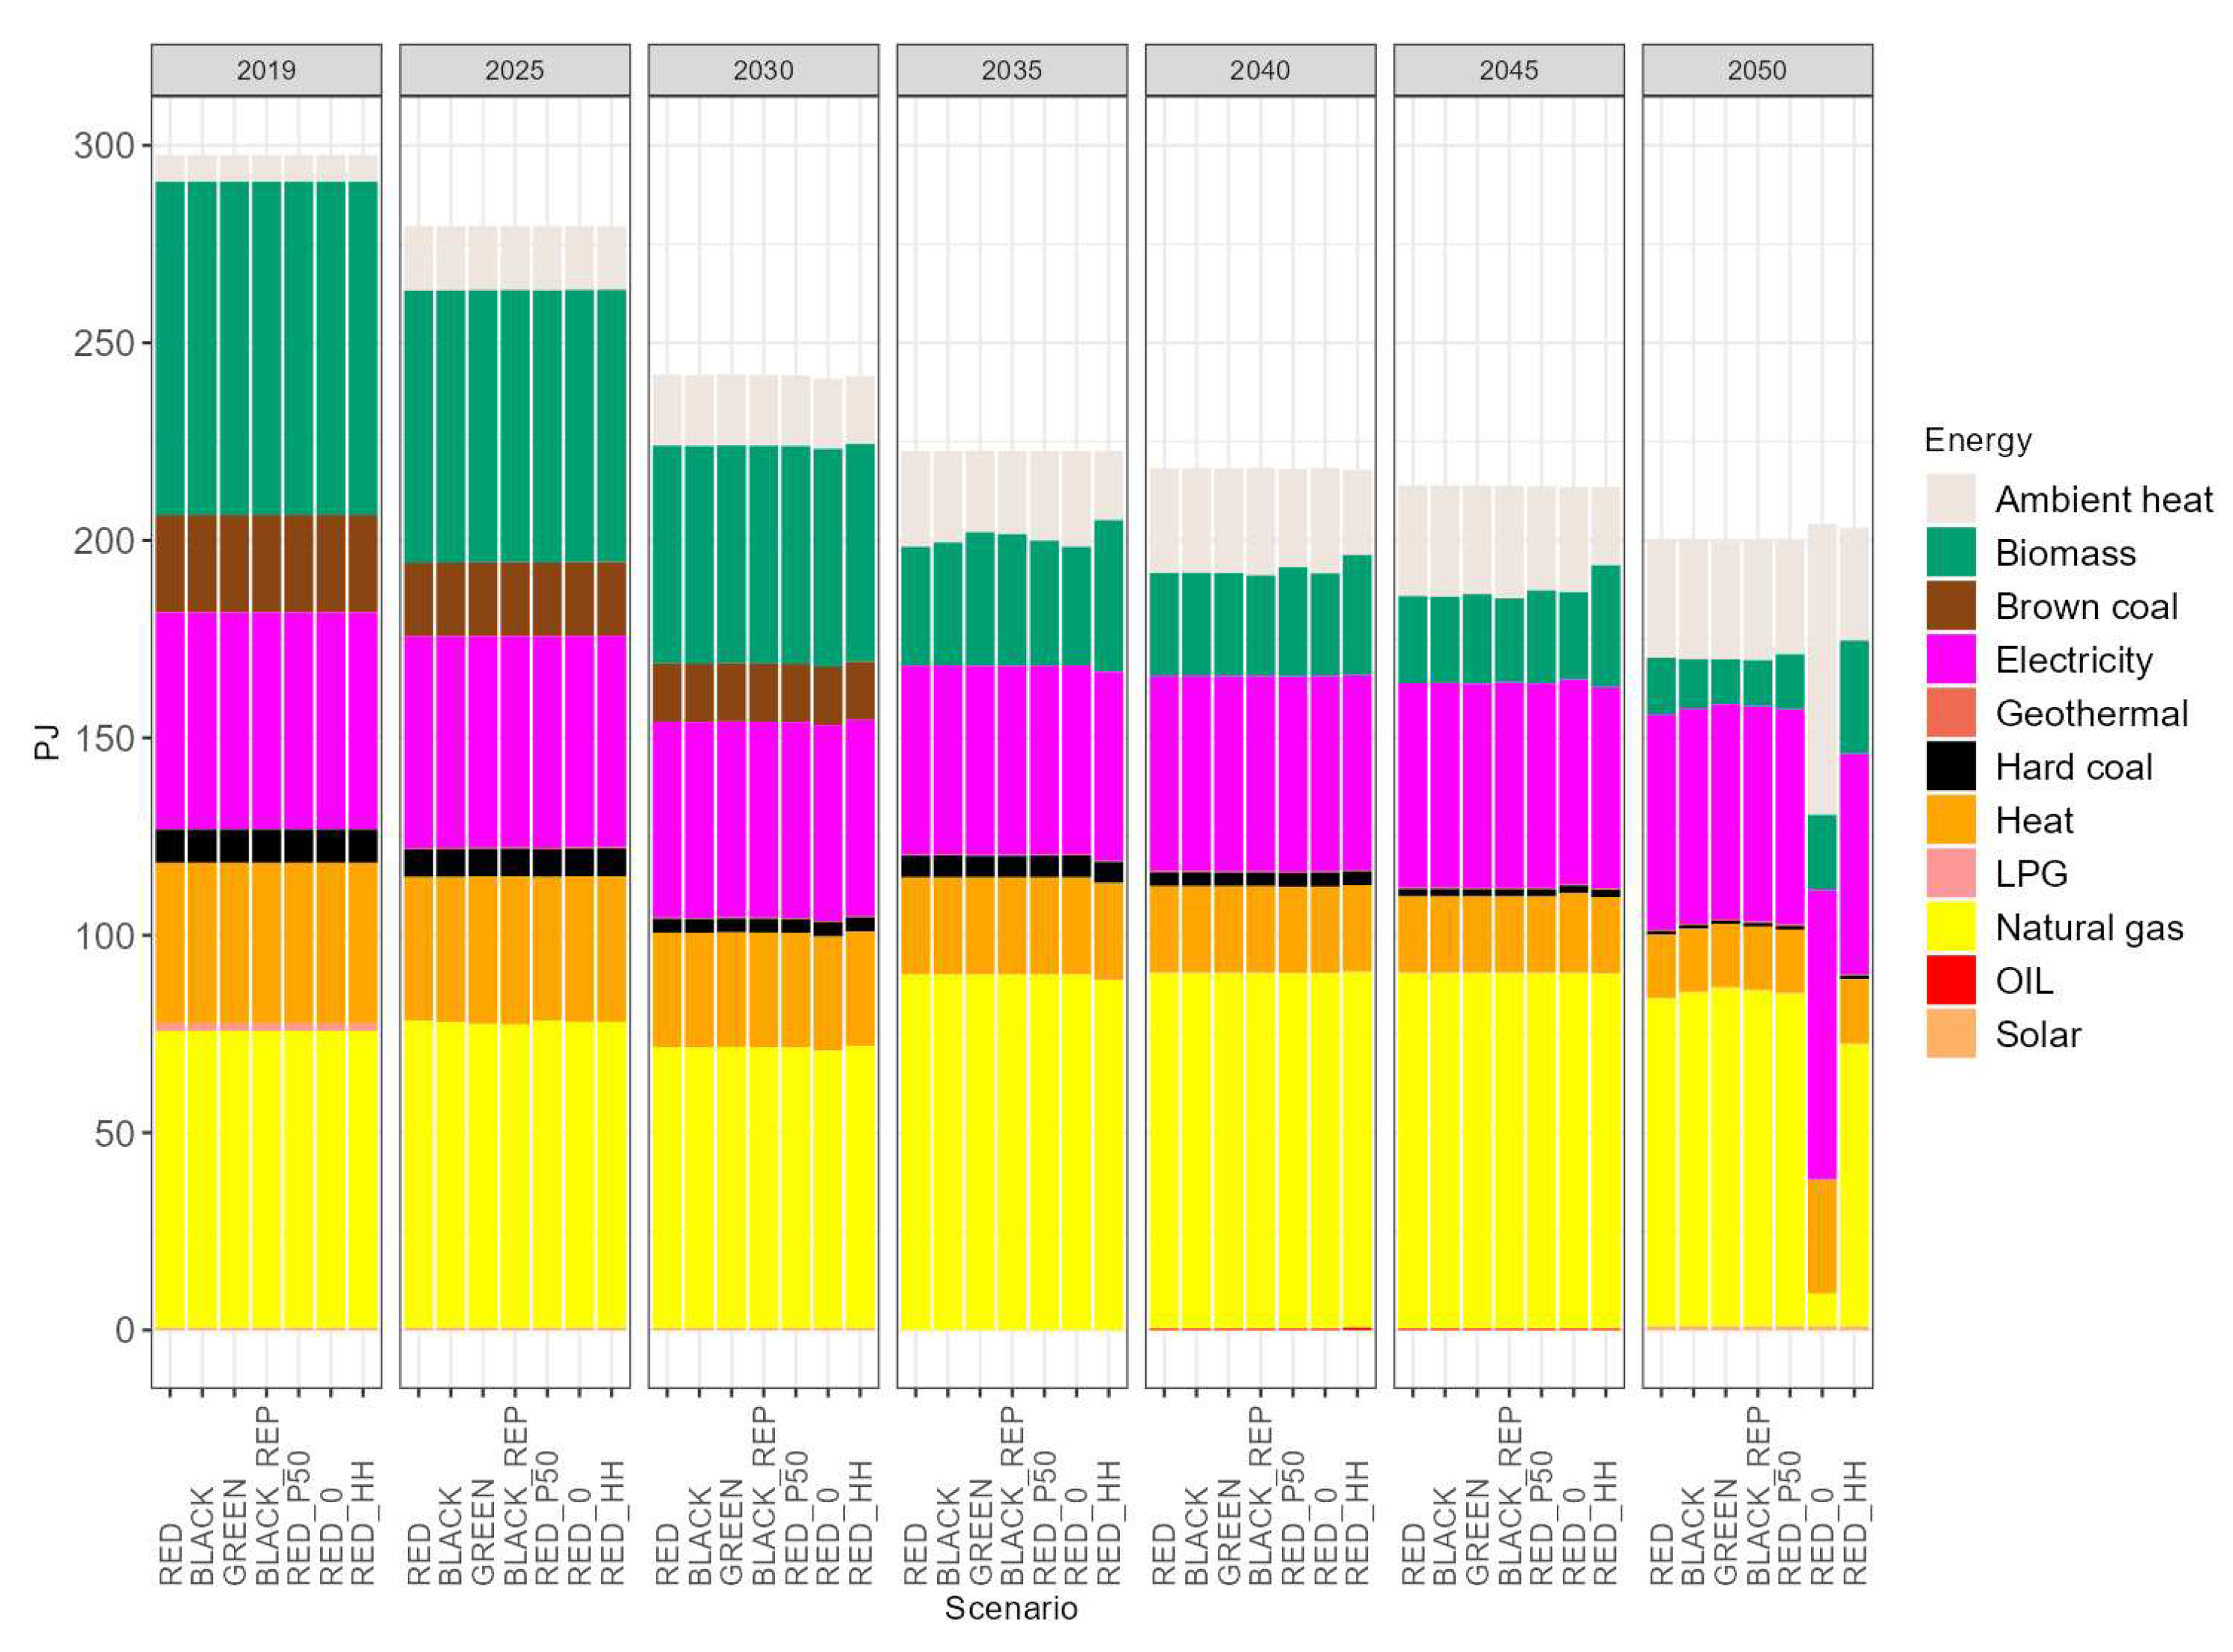
Figure 8.
Final consumption of energy by residential sector by purpose.
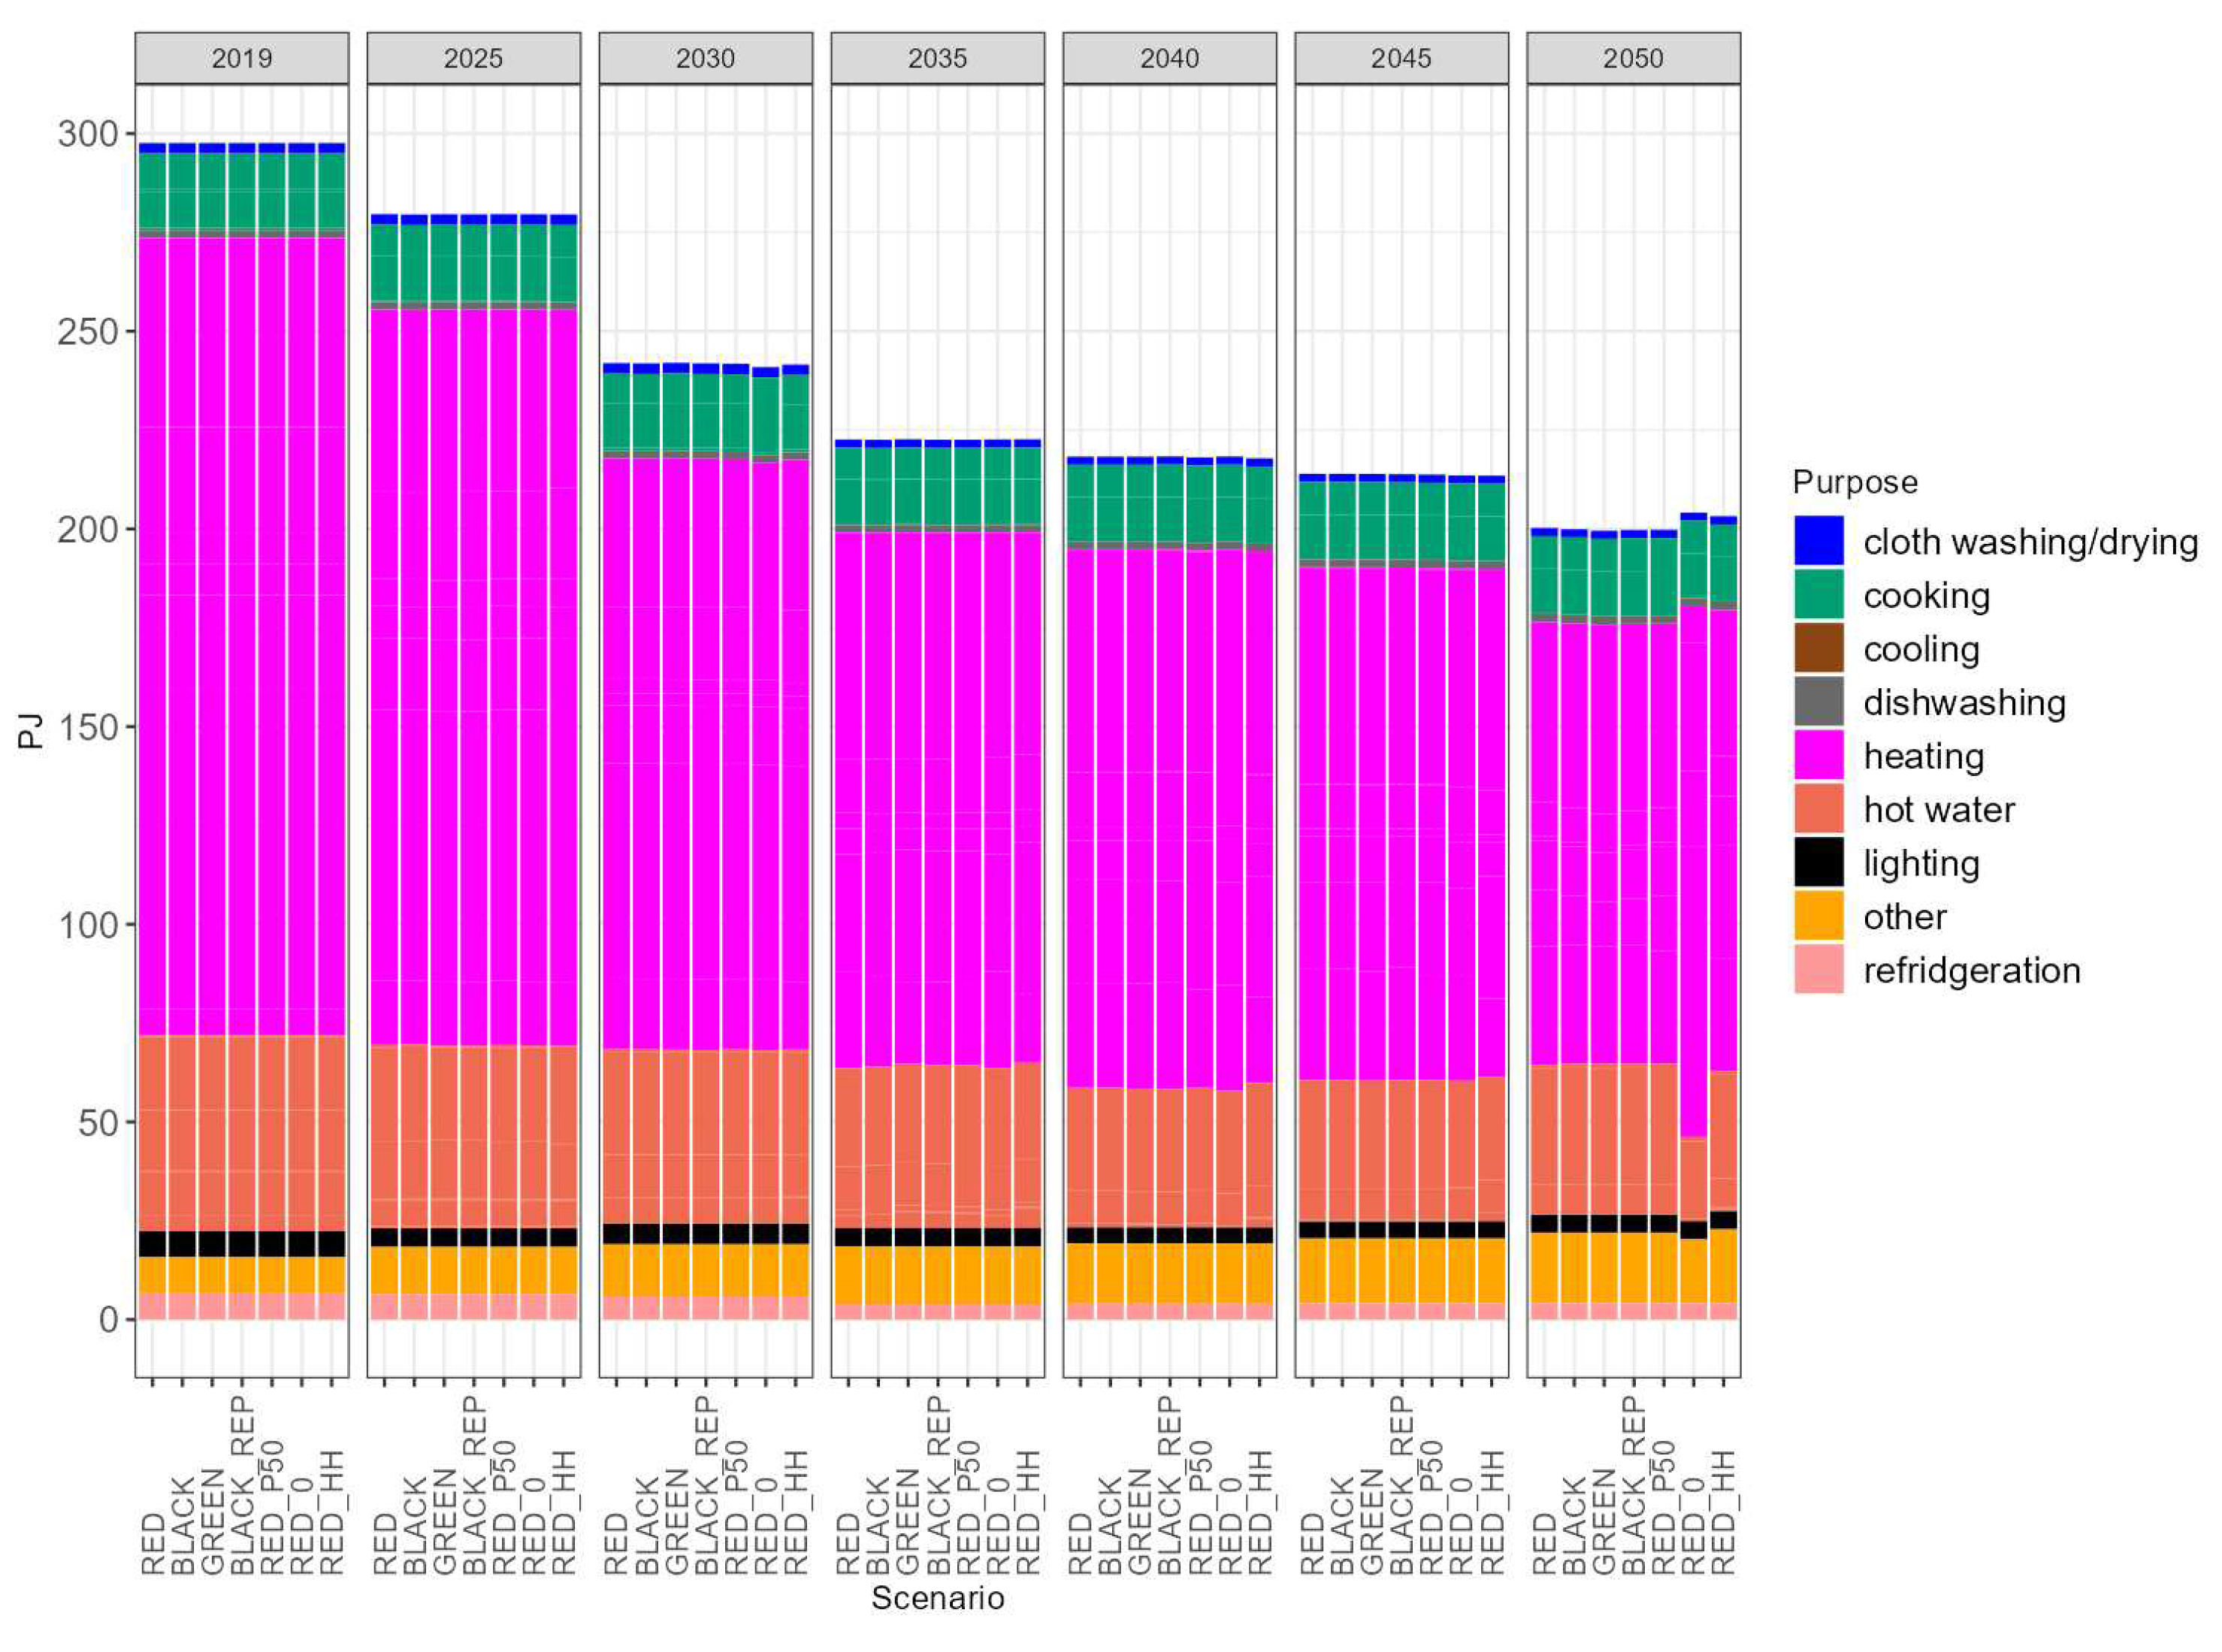
Figure 9.
Total greenhouse gas emissions.
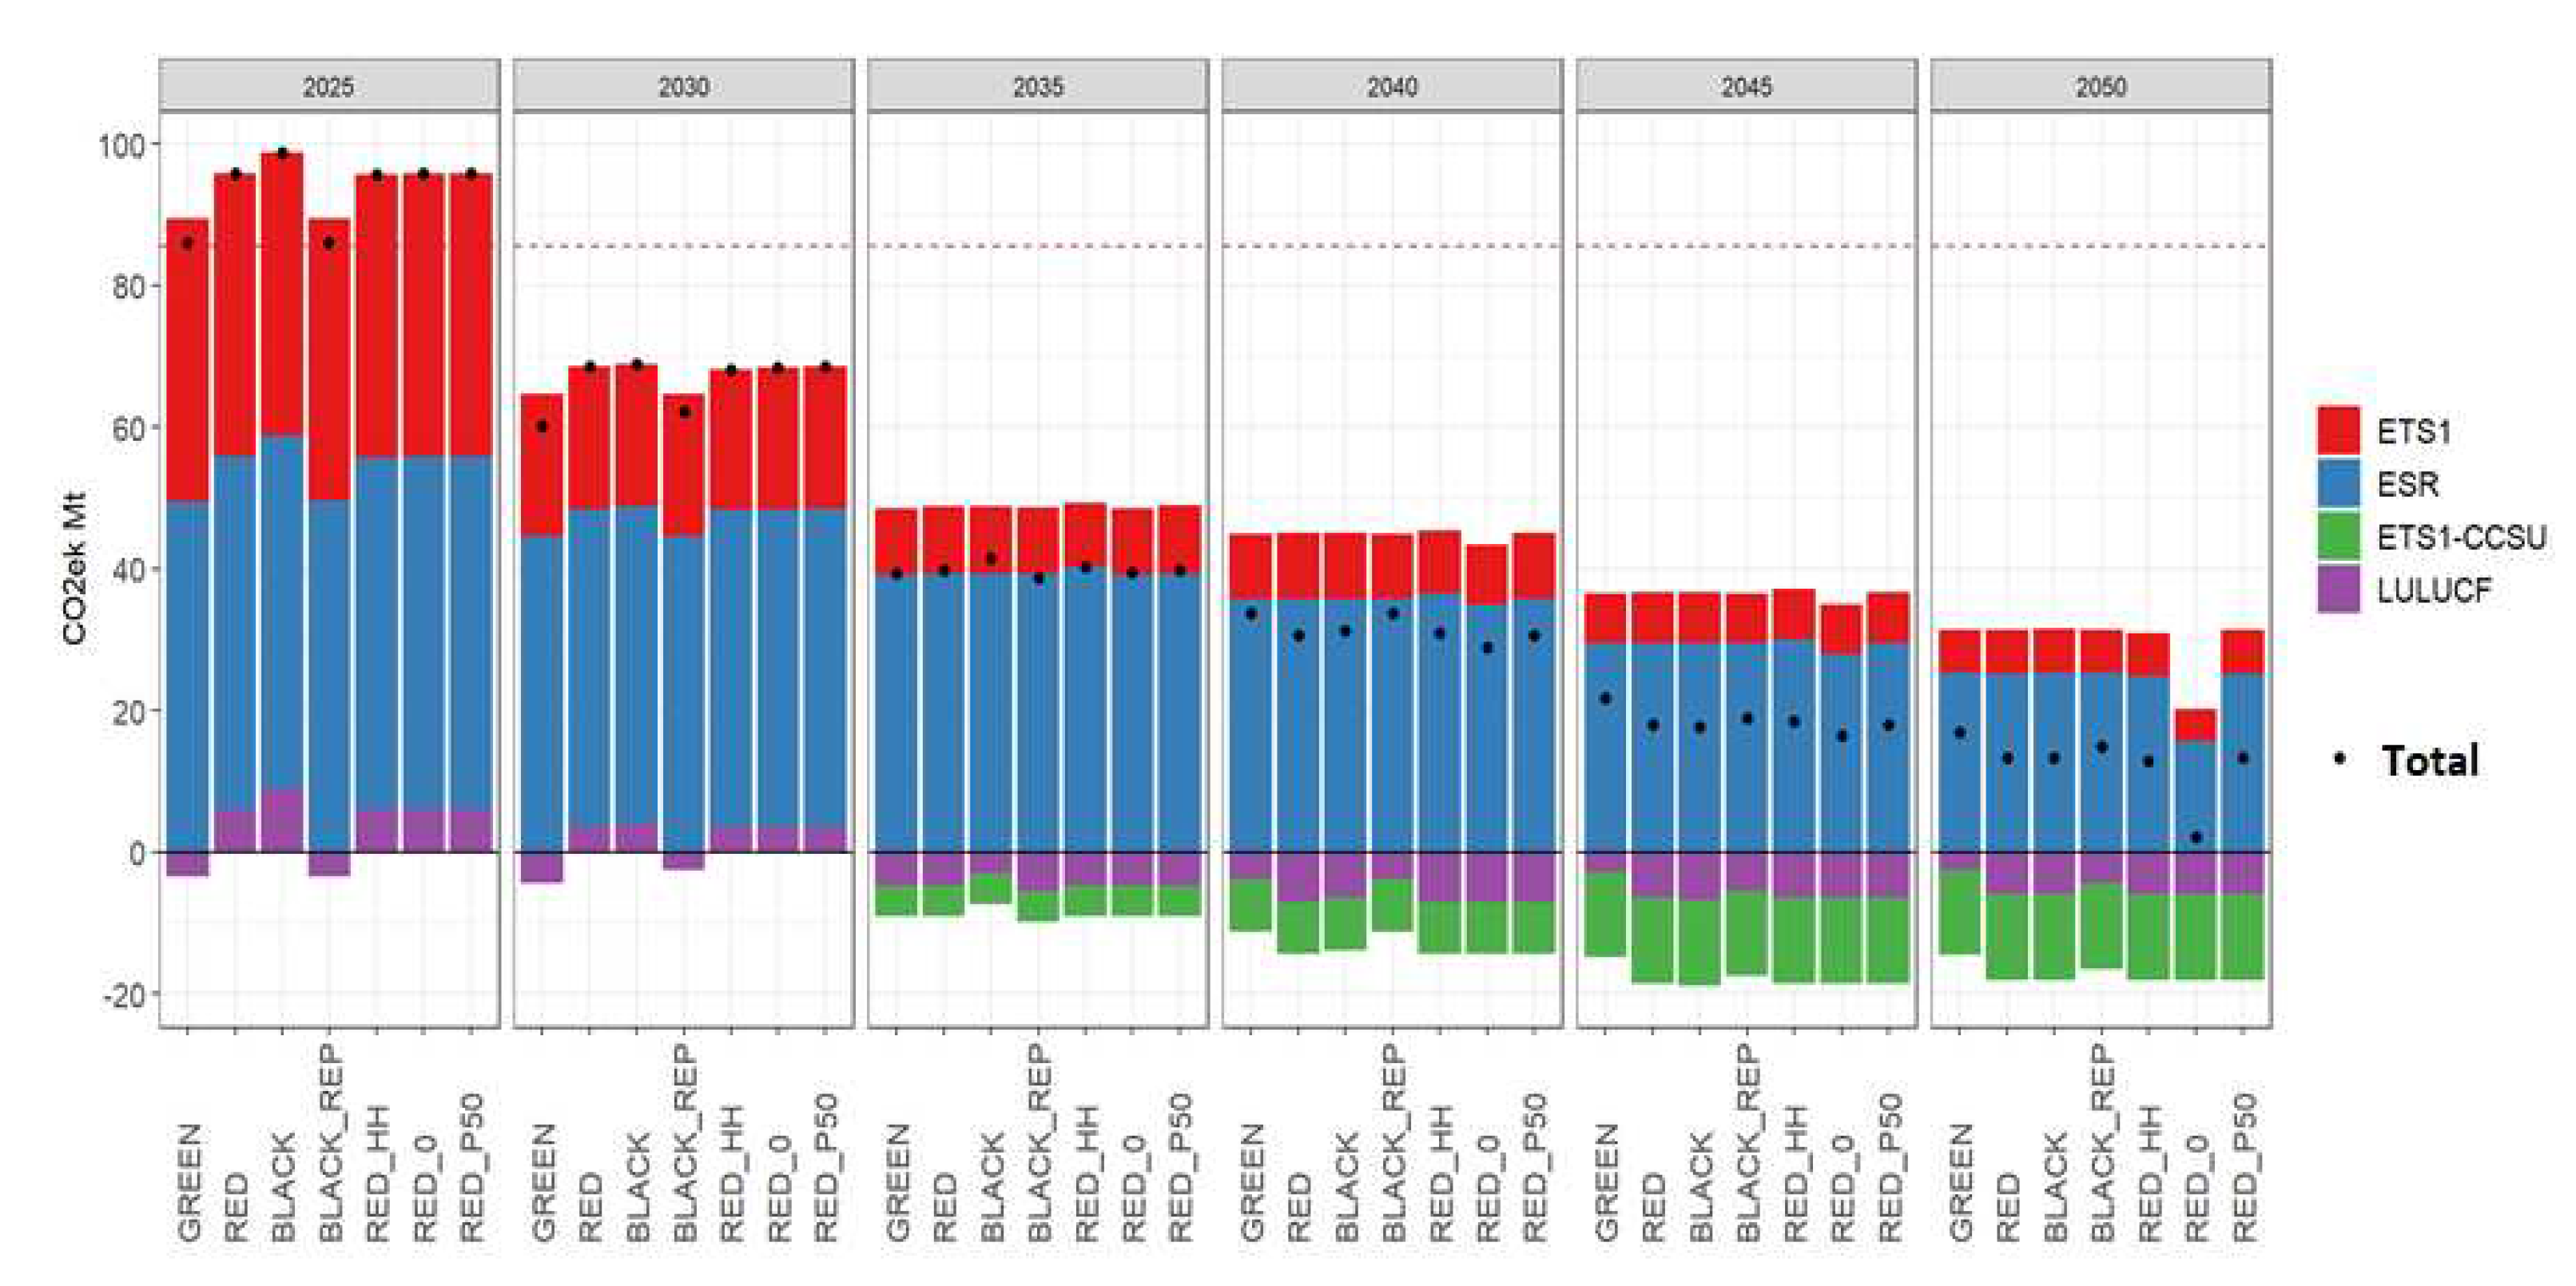
Figure 10.
Annualized system cost difference against baseline scenario.
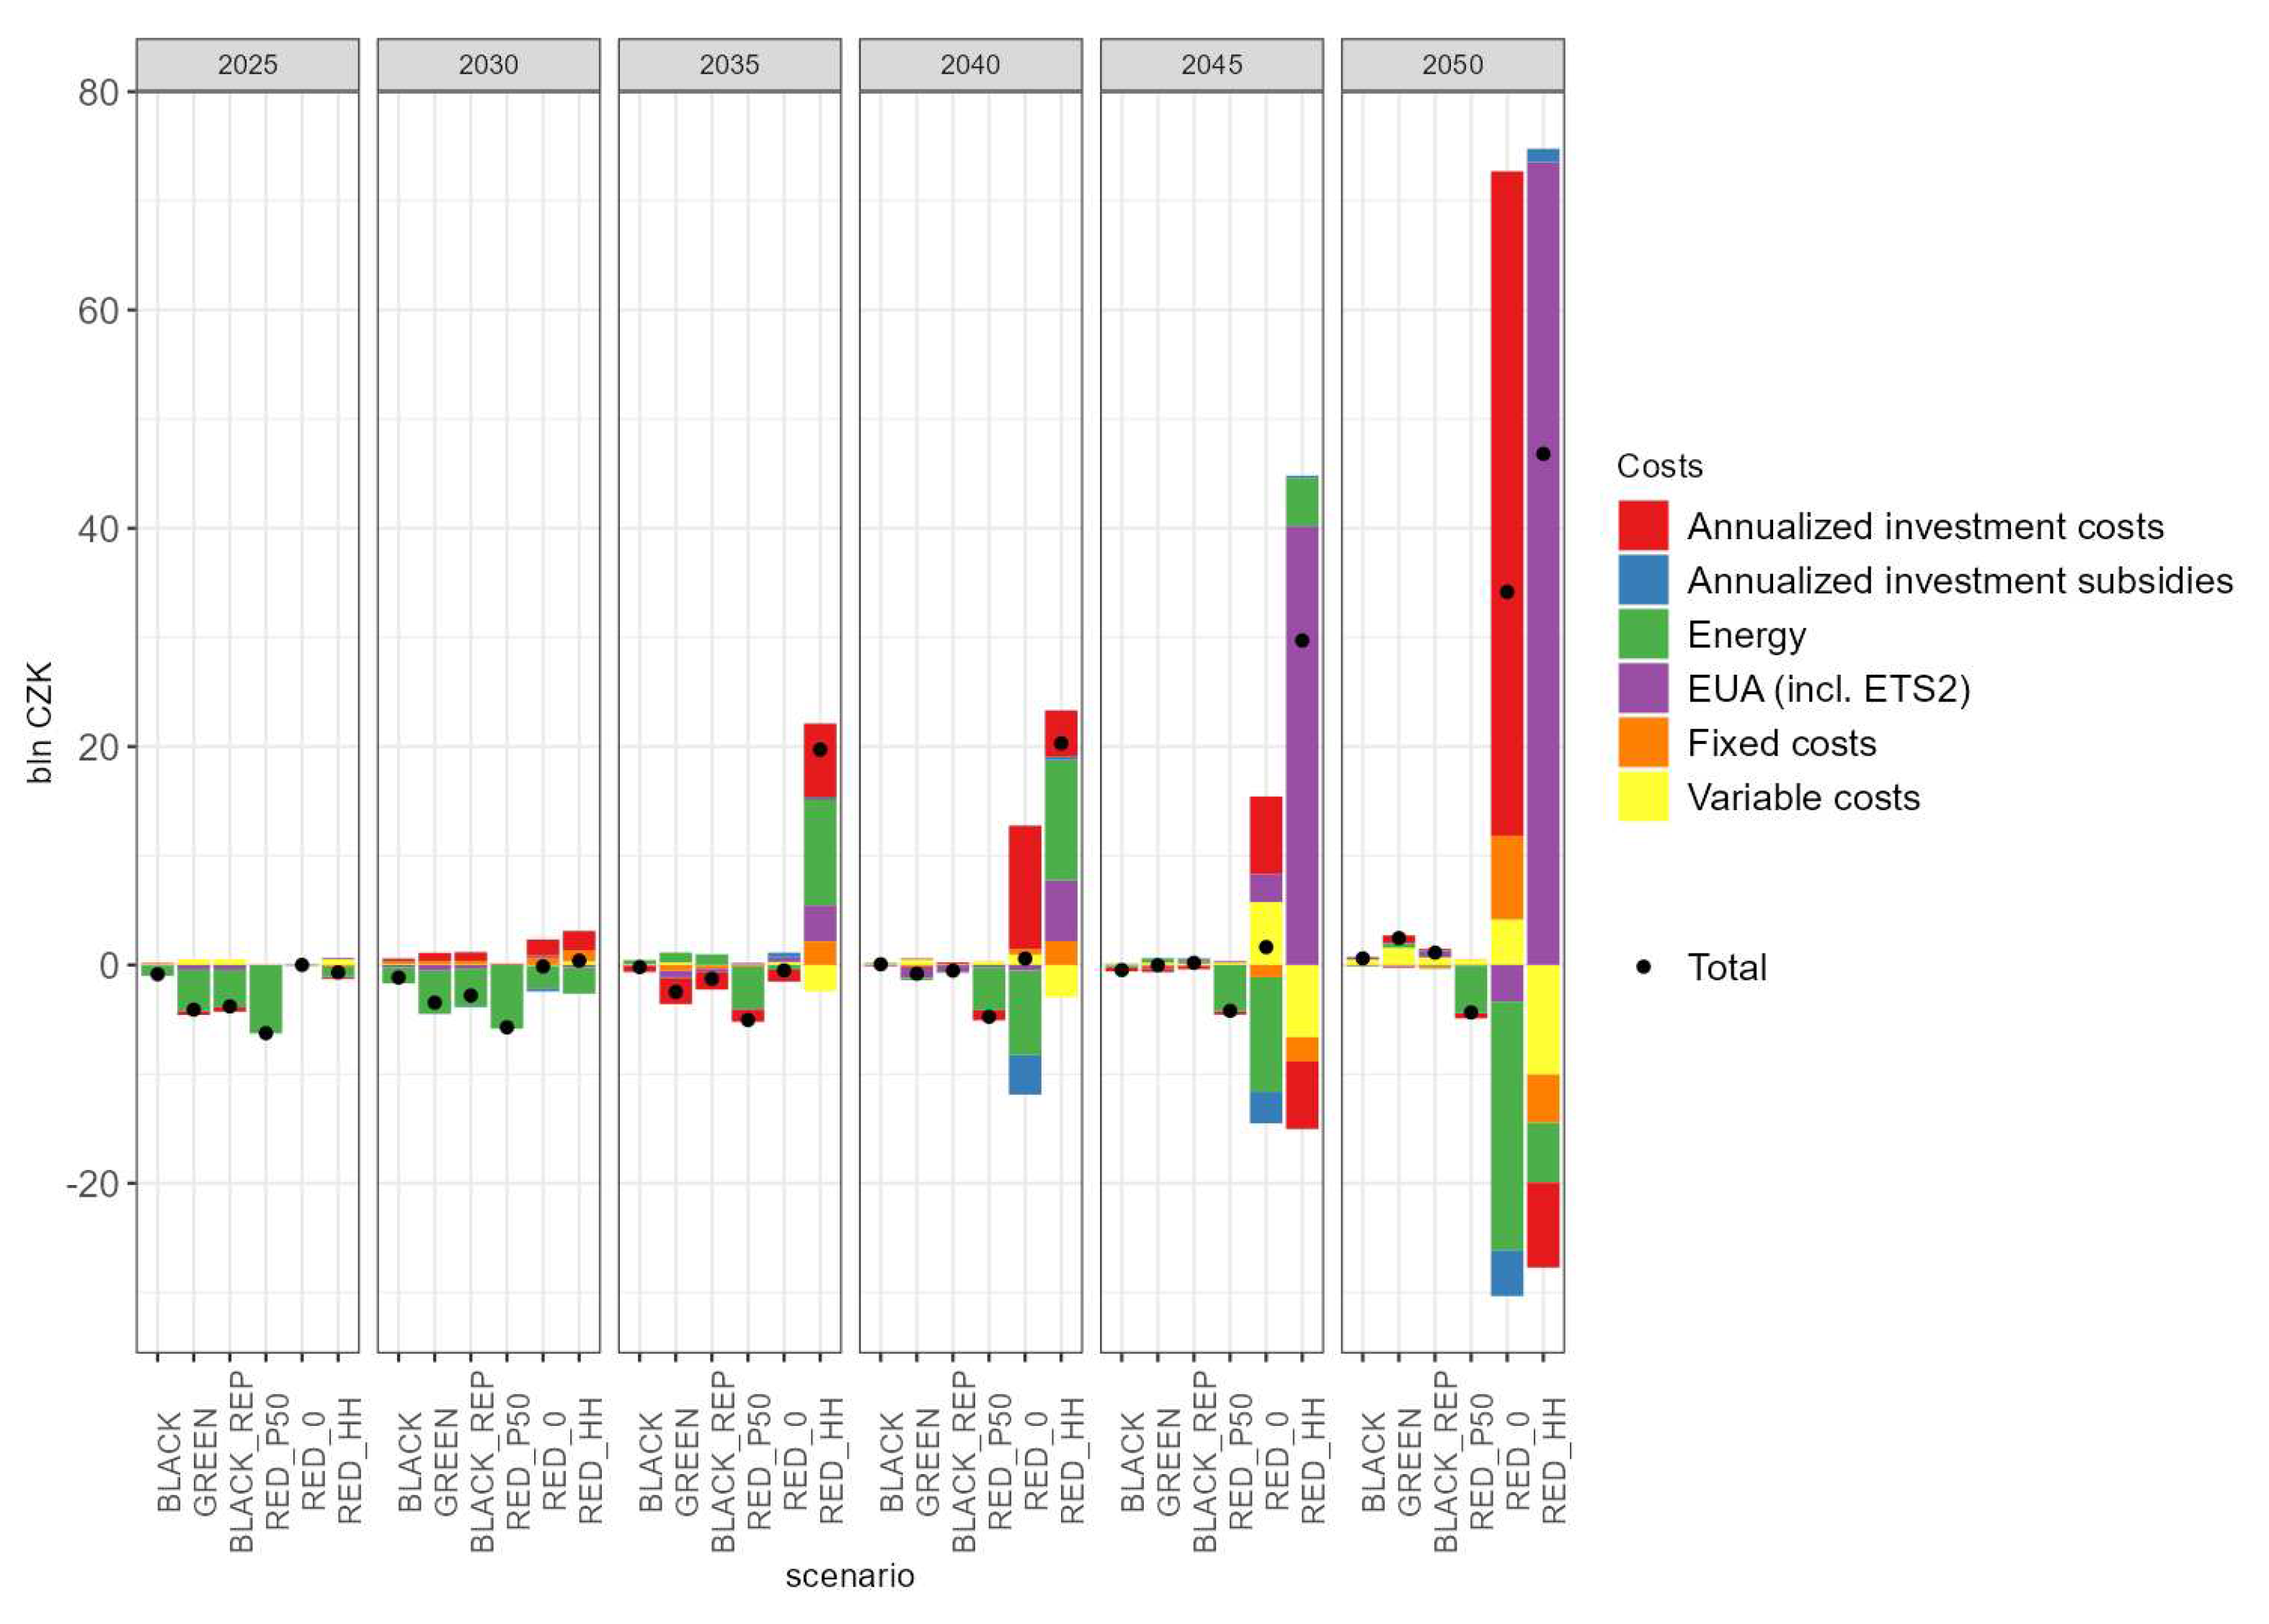

Table 1.
Price of biomass 2019 €/GJ.
| Biomass type | Price range | Steps |
|---|---|---|
| Firewood conifer | 9.5 - 14.3 | 4 |
| Firewood broadleaf | 10.8 - 15.0 | 2 |
| Pellets | 12.0 - 15.6 | 8 |
| Forest chips | 4.7 - 6.3 | 5 |
Notes: The steps determine the steepness of the cost curve of biomass production. The marginal increase in the price will be a linear extrapolation between the price range given the number of steps.
Disclaimer/Publisher’s Note: The statements, opinions and data contained in all publications are solely those of the individual author(s) and contributor(s) and not of MDPI and/or the editor(s). MDPI and/or the editor(s) disclaim responsibility for any injury to people or property resulting from any ideas, methods, instructions or products referred to in the content. |
© 2023 by the authors. Licensee MDPI, Basel, Switzerland. This article is an open access article distributed under the terms and conditions of the Creative Commons Attribution (CC BY) license (http://creativecommons.org/licenses/by/4.0/).
Copyright: This open access article is published under a Creative Commons CC BY 4.0 license, which permit the free download, distribution, and reuse, provided that the author and preprint are cited in any reuse.


