
Submitted:
26 January 2023
Posted:
30 January 2023
You are already at the latest version
Abstract
The Green Deal for Europe aims to achieve climate neutrality by 2050 and sets a binding EU target of a 55% reduction in greenhouse gas emissions by 2030 compared to 1990 levels. The contributions of EU Member States to this target will be partly determined by the market through the EU Emissions Trading Scheme. For the remaining part of greenhouse gas emissions outside the EU Emissions Trading Scheme, the Effort Sharing Regulation sets binding national reduction targets. The paper applies an energy optimization model to analyze the ability of the Czech Republic to meet the climate targets. Given the high level of GHG emissions in 1990 and the significant reduction of GHG emissions in the 1990s, Czechia could achieve a 55% reduction by 2030. However, further decarbonization will be quite challenging.
Keywords:
Green deal
; GHG emissions
; carbon neutrality
; EU ETS
; TIMES-CZ
1. Introduction
The Green Deal for Europe aims to achieve climate neutrality by 2050 and sets a binding EU target of a 55% reduction in greenhouse gas (GHG) emissions by 2030 compared to 1990 level. The Fit for 55 package, which includes a series of legislative initiatives across a range of sectors to put the EU on track to meet its 2030 climate target of 55%, got close to its final approval during 2022. The EU-wide impact assessment of the Climate Target Plan [1] preceding Fit for 55 package and the subsequent ‘core policy scenarios’ with Member State-level details [2], have been followed by other studies. While Pietzcker et al. [3] focus only on the on EU Emissions Trading System (EU ETS) sectors, Kattelmann et al. [4] analyze the optimal share of GHG emission reductions between EU ETS and Effort Sharing Regulation (ESR) sectors and the optimal GHG emission reductions in ESR sectors for each EU Member State. Other studies assess the impacts of the Fit for 55 package on a specific sector [5,6,7,8] or on one sector or more sectors in a single country, e.g [9,10].
The paper aims to enrich the literature by a case study of Czechia. Czechia had significantly reduced its greenhouse gas emissions during 1990’s [11] but remains one of the two most industrialized EU member states [12] with the third highest GHG emissions per capita [13], high energy intensity of industry and relatively lukewarm attitude towards climate change mitigation measures [14,15,16]. Therefore, we analyze the capability of Czechia to fulfill the climate targets.
We apply the energy optimization model TIMES-CZ to analyze the impacts of the extension of the EU ETS to buildings and road transport (EU ETS 2) and of a coal phase-out on the Czech energy system. We also assess the capability of Czechia to achieve climate neutrality by 2050 without biomass or hydrogen imports. We evaluate a baseline scenario derived from the National Energy and Climate Plan [17] and four policy scenarios. We find that Czechia should be able to achieve a 55% reduction in total GHG emissions in 2030, mainly due to GHG emission reductions in the EU ETS sectors. The effort required to reach this target is reduced by the high level of GHG emissions in the base year 1990. The energy efficiency and renewable energy targets for 2030 are more difficult to achieve. Further decarbonization is quite challenging and climate neutrality in 2050 cannot be achieved without additional measures or higher imports of renewable energy. We evaluate the GHG emission savings and relate them to the EC REF2020 scenario [18] to assess several alternative policy scenarios and to show how ambitious the EC REF2020 scenario is for Czechia.
The rest of this paper is structured as follows. In Section 2, we describe the model and data used in the analysis. The modeled scenarios and their assumptions are described in Section 3. We then present our scenario analyses in Section 4. Finally, we provide a discussion of our results including an outlook for further research in Section 5.
2. Model and Data
TIMES-CZ is a technology rich, bottom-up, cost-optimizing integrated assessment model built within the generic and flexible TIMES (The Integrated MARKAL-EFOM System) model generator’s General Algebraic Modelling System (GAMS) code. TIMES has been developed and maintained within the Energy Technology System Analyses Program (ETSAP) by the International Energy Agency (IEA) [19]. TIMES searches for an optimal solution for an overall energy mix that will satisfy exogenously given energy service demand with the least total discounted costs in a given timeframe with a perfect foresight principle [20].
TIMES-CZ is based on the Czech region of the Pan-European TIMES PanEu model developed by the Institute of Energy Economics and Rational Energy Use at the University of Stuttgart [21] but its base year is updated to 2015 and its structure is modified. The modelling horizon spans from 2015 to 2050, split into 5 year-time steps. A year is divided into 12 time-slices, 4-seasonal and 3-day levels (day, peak and night). GHG emissions (CO2, CH4, N2O) and other pollutants (SO2, NOx, NMVOC, PM) are included in the model.
The TIMES-CZ model covers the entire energy balance of Czechia from the supply of resources to the energy service demand. Compared to the original TIMES-PanEu model, the structure of the TIMES-CZ is considerably extended through the following four ways. First, all sectors included in the EU ETS are disaggregated up to individual plants, while the non-ETS part follows the original structure as defined by the TIMES-PanEu model. Unique multi-fuel mixes are created for the individual ETS sources according to their real consumption based on data from EU ETS emission reports. Other input data for individual EU ETS sources are obtained from the Register of Emission and Air Pollution Sources (REZZO database) regularly compiled by the Czech Hydrometeorological Institute and from the Energy Regulatory Office. Second, emission trading is adjusted to consider the transition to auctioning and derogation (Czechia has made use of the derogation under Article 10c of the EU ETS Directive which allows it to give a decreasing number of free allowances to existing power plants for a transitional period until 2019.). Third, district heating demand and supply are both regionalized into 36 regions according to postal codes. Forth, detailed transport module is developed. In the base year, the transport module contains 135 technologies for road vehicles by COPERT categories [22] (i.e. distinguishing vehicle category and type, fuel and EURO norm). Transport technologies for future years include both new and second-hand vehicles. The module includes biofuel production.
The technical and economic characteristics of new technologies are taken from TIMES-PanEu [21] and JRC-EU-TIMES [23] models and [24], with a few exceptions. The investment costs of solar photovoltaic (PV) and wind power plants are adjusted according to Czech conditions, cf. Table 1. The investment cost of new nuclear power sources is forecasted at 6317 €2015 per kW; these investment costs are derived from those of the Hinkley Point C nuclear power plant.
3. Scenarios
We define a baseline scenario, called NECP, derived from the National Energy and Climate Plan [17] (hereafter referred to as the National Plan), and three policy scenarios to assess impacts of the extension of the EU ETS to buildings and transport (EU ETS 2) and of coal phase-out on the Czech energy system. One of the policy scenarios (REG) aims also to approaching the climate neutrality in 2050. On top of that, another scenario (NECP_zero) does not assess the impacts of the EU ETS 2 and of coal phase-out but searches for the optimal pathway to near the climate neutrality in 2050.
In all scenarios, demands for energy services and energy-intensive products are derived from the National Plan [17]. We assume an increase in iron and steel recycling by 10% by 2050, thereby the availability of steel scrap as an input for steel production is up to 2 Mt in 2050 (This is a conservative assumption that limits the decarbonization of iron and steel production through direct reduction by hydrogen). We conservatively assume, Czechia is self-sufficient in all renewables and hydrogen production. Description of individual scenarios follows.
The NECP scenario, derived from the National Plan [17], assumes the decommissioning of the Dukovany nuclear power plant between 2036-37 and its simple replacement with a new nuclear power source. GHG emissions are capped in 2030 at 98.5 Mt CO2ek in total and 52.3 Mt CO2ek under Effort Sharing Regulation (ESR, i.e. outside the EU ETS and LULUCF sectors), representing a 50% reduction in GHG emissions compared to 1990 and a 14% reduction compared to 2005 under ESR. After 2030, the evolution of GHG emissions is the result of cost optimization by the TIMES-CZ model. The electricity export balance (net imports) is fixed according to the National Plan, Table 3.
The NECP_zero scenario has the same assumptions as the NECP scenario, but it aims to approach climate neutrality in 2050.
The REF scenario is derived from the European Commission's REF2020 scenario (EC REF2020)[18], including nuclear power generation and net electricity imports. The share of RES in gross final consumption is at least 22.6% from 2030. The electricity export balance (net imports) is fixed according to the EC REF2020 scenario, Table 3.
The CPRICE scenario is derived from the CTP2030 CPRICE scenario (EC CPRICE). From 2026 onwards, the CPRICE scenario foresees the extension of the EU ETS to buildings and transport (EU ETS 2), the EUA price is the same in both parts of the EU ETS. The decommissioning of the Dukovany nuclear power plant is assumed in 2036 and the installation of new nuclear sources is the result of cost optimization in the TIMES-CZ model. The assumption on the electricity export balance is relaxed and net electricity imports are allowed up to 20 TWh/year from 2030. Within this range, the resulting electricity export balance is the result of the cost optimization of the model (assuming 70-80 €/MWh for import and export of electricity).
The REG scenario is derived from the CTP2030 REG scenario (EC REG). The REG scenario assumes a shift away from coal after 2030: end of brown coal mining and consumption, end of domestic and energy coal consumption. The scenario assumes the decommissioning of the Dukovany nuclear power plant by 2036/2037 and its simple replacement with a new nuclear power source. The electricity export balance (net imports) is fixed at the same levels as in scenarios NECP and NECP_zero. The REG scenario aims to approach carbon neutrality in 2050.
In the NECP and NECP_zero scenarios, the assumptions on fossil fuel prices and EUA prices are identical. The other scenarios differ mainly in the assumptions on EUA prices (Table 4) and fossil fuel prices (Table 5), which are important factors influencing the consumption of each primary resource and production of GHG emissions.
For the NECP, CPRICE and REG scenarios, sensitivity analyses of the impact of the price of EUA and nuclear power development options (a pair of new reactors, different time of closure and development according to cost optimization) on the Czech power system are performed.
4. Results
4.1. Primary Energy Surces
The evaluation of all modelled scenarios shows a general trend of a 24-30% decrease in consumption of primary energy sources (PES) by 2050 compared to 2015 (Figure 1). The most rapid decline occurs in the CPRICE scenario, due to a rapid shift away from brown coal. The CPRICE scenario also has the highest net import of electricity - it is the only scenario that allows net import of electricity up to 20 TWh. In contrast, the slowest decline in PES consumption (and specifically of brown coal) occurs in the NECP and NECP_zero scenarios. After 2045, PES consumption is the highest in the REF scenario. In the REF, REG and partly also CPRICE scenarios, brown coal is mainly replaced by natural gas. In 2050, the total consumption of primary energy sources ranges from 1166 (CPRICE) to 1273 PJ (REF).
Consumption of black coal and coke falls in all scenarios to between 65 and 70 PJ in 2050, when it is almost exclusively used for iron and steel production. Consumption of fossil liquid fuels falls in all scenarios to between 194 (NECP_zero) and 235 PJ (REF) in 2050. In the REG scenario, brown coal consumption ceases from 2030 due to the cessation of domestic mining (exogenous assumption). In the other scenarios, brown coal consumption decreases to between 4.5 and 32 PJ (NECP). The NECP scenario is the only one where brown coal is consumed to a greater extent elsewhere than in households, specifically in electricity and heat generation.
Natural gas consumption is mainly influenced by assumptions about the future price of natural gas. In the NECP and NECP_zero scenarios, natural gas consumption in 2050 is the lowest, 255 and 279 PJ respectively. In the CPRICE, REF and REG scenarios, a significantly lower natural gas price is assumed (Table 5) and its consumption increases significantly compared to the base year, peaking here between 2030 and 2040, from 339 (CPRICE) to 418 PJ (REG), and then natural gas consumption decreases to 303 (REF) to 327 PJ (REG).
In all scenarios, there is a significant increase in the consumption of flow RES, in the case of hydro, solar and wind, to the level of their projected potentials in 2050. Geothermal energy use ranges from 49 (REF) to 67 PJ (REG) in 2050.
4.2. Energy Transformation - Electricity and Heat
In the energy consumption for electricity and heat production, the different rates of shift away from coal are again evident in the scenarios. In the CPRICE scenario, which assumes the highest allowance price while allowing for net imports of electricity from 2025 onwards, there is already a significant decline in brown coal consumption in electricity and heat generation (to 36 PJ) in 2025. In the REG scenario, brown coal is mainly replaced by natural gas already in 2030, while in the NECP scenario it is still marginally present (21 PJ) in 2050. In all scenarios, the representation of RES develops gradually, mainly solar, geothermal and wind energy; biomass use grows more slowly, except for a significant increase in the REG (87 PJ) and NECP_zero (97 PJ) scenarios in 2050, which is related to the need for carbon capture and storage (CCS) from biomass and a negative emission balance due to the scenario target of near to climate neutrality.
In all scenarios, there is a significant increase in flow RES (i.e. geothermal, solar, wind, and hydropower) and hydropower, solar, and wind reach their projected potentials in 2050.
4.3. Final Energy Consumption
Total final energy consumption in all scenarios peaks around 2025 at approximately 1170 PJ. After 2025, total final energy consumption is on a declining trend, being 12.5 (REF) to 20% (NECP_zero) lower in 2050 than in 2015. In all scenarios, the share of renewable energy increases, especially ambient energy used by heat pumps. After 2045, the final consumption of natural gas decreases to less than 30 PJ in the NECP_zero and REG scenarios. The share of electricity in final energy consumption increases from 20% in 2015 to between 28% (NECP and REF) and 38% (NECP_zero and REG) in 2050 (Figure 3).
The electricity consumption increases from 206 PJ in 2015 to 254 (NECP) – 324 (REG) PJ in 2050 (Figure 4). The electricity substitutes mainly the natural gas and biomass in the final consumption. The increase in electricity consumption is rather conservative because the conservative assumptions preclude deeper industry decarbonization that would imply further increase in electricity consumption.
4.4 Greenhouse Gas Emissions
The distribution of GHG emissions between ETS and non-ETS sectors is summarized in Figure 5. In the ETS sectors, emissions decline fastest in the CPRICE scenario, while the decline is slowest in the NECP and NECP_zero scenarios. The REF scenario assumes an EUA price in 2050 that is more than double that of the NECP scenario, and also almost half the price of natural gas. At the same time, due to decentralization and deliberate reduction of rated thermal input of fossil fuel heat plants and CHPs below 20 MW, individual installations are partially shifted from ETS to non-ETS. This shift of installations between ETS and non-ETS is one of the factors of the significantly faster decline in GHG emissions in the ETS sector compared to non-ETS.
Outside the ETS sectors, the decline is also initially largest in the CPRICE scenario, but after 2045 the largest reductions occur in the REG and NECP_zero scenarios, which aim to achieve carbon neutrality in 2050. However, carbon neutrality in 2050 is not achievable under the given assumptions (no imports of biofuels, hydrogen or electricity, and increasing emissions from agriculture). In the REG and NECP_zero scenarios, GHG emissions (not including LULUCF) are reduced to 20 Mt CO2ek, and taking into account the 4.5 Mt CO2ek captured from biomass sources, to less than 16 Mt CO2ek. Including the assumed LULUCF sinks, the REG and NECP_zero scenarios reduce the GHG emissions to less than 10 20 Mt CO2ek in 2050.
The GHG emissions decline fastest and the most significantly in the energy sector, across all scenarios. In the CPRICE, NECP_zero, REG and REF scenarios, the power sector even has a negative GHG emission balance, thanks to CCS technology in biomass electricity and heat production. In the scenarios with the lowest GHG emissions, NECP_zero and REG, the most significant GHG emitters are agriculture (9 Mt CO2ek) followed by transport and industry (Figure 6). GHG emissions from agriculture, waste and F-gases are in the model exogenous in the carbon balance.
The CCS is piloted in 2030 in the CPRICE and REF scenarios. It is used to the least extent in the NECP scenario for lime production. In contrast, it is the most significant in the REG (20 Mt CO2ek) and NECP_zero (17.5 Mt CO2ek) scenarios, where CCS is mainly applied in the production of electricity and heat from natural gas and biomass, as shown in Figure 7.
4.4.1. GHG Emission Savings and Comparison with the EC REF2020 Scenario
We evaluate the GHG emission saving and put them to the relation with the EC REF2020 scenario to assess the policy scenarios and to show if the EC REF2020 scenario is too ambitious for Czechia or not.
The overall GHG emission savings in 2030 of 55% compared to 1990 are realistic even at the Czech level, but mainly due to emission reductions in the EU ETS sectors. Table 6 shows the savings in total GHG emissions compared to 1990 and the savings in nonETS sectors outside LULUCF (i.e. in ESR sectors) compared to 2005 for each scenario. The NECP and NECP_zero scenarios are the only scenarios that do not achieve an overall GHG emission reduction of 55% compared to 1990. The rate of GHG emission reductions in the ESR sectors is slow in all scenarios, which is also due to the increasing demand for energy services, and in 2030, GHG emissions in the ESR sectors are only reduced by 15 (REG) to 22% (NECP and NECP_zero) compared to 2005. After 2030, the rate of emission reductions in ESR sectors increases until 2050.
In 2050, the savings in total GHG emissions including LULUCF emissions range from 81% (NECP and REF) to 93% (NECP_zero and REG).
Table 7 shows the GHG emission savings in the EC REF2020 scenario and compares the main scenarios of this study with this scenario. We infer that the PRIMES model is most likely not able to correctly distinguish between ETS and non-ETS sectors due to its aggregation. In the REF2020 scenario, emissions in the ETS sectors are higher than verified EU ETS emissions [31] and, conversely, emissions from the non-ETS sectors are underestimated (in 2005 ETS emissions in the REF2020 scenario are 8 Mt CO2ek higher than verified emissions, in 2010 by 4.5 Mt CO2ek , in 2015 by 8 Mt CO2ek and in 2020 by 2 Mt CO2ek). Again, this results in the REF2020 scenario achieving higher GHG savings in the non-ETS sectors than the scenarios modelled in this study.
The NECP and NECP_zero scenarios have higher GHG emissions than the REF2020 scenario in 2030. The other scenarios, applying additional policy measures on emissions, have lower total GHG emissions than REF2020 in 2030. The difference in non-ETS emissions between the modeled scenarios and the REF2020 scenario might be affected by the different structure of ETS and non-ETS sectors between the models.
In 2050, even the NECP scenario reaches 41 % lower total GHG emissions than the REF2020 scenario.
4.5. Share of Renewable Energy Sources
Renewable energy sources (RES) make an increasing contribution to meeting energy needs in all scenarios. Table 8 shows the share of RES in final energy consumption (RES) and electricity generation (RES-E). In 2030, the share of RES in final energy consumption varies across scenarios from 21 (REF) to 25% (REG), and in 2050 from 39 (REF) to 49% (NECP_zero). Compared to today, the use of ambient energy in heat pumps, solar energy and, after 2040, geothermal and wind energy increases in particular. The share of RES in electricity generation ranges from 22.6% (REF) to 31.6% (REG) in 2030 and from 38% (REG) to 46.6% (NECP) in 2050. The second smallest electricity generation in NECP scenario (after CPRICE) increases the RES-E share in NECP.
4.6. Cost
The investment costs of the whole system are on an increasing trend and are the most significant in the total cost structure of the whole energy system (including transport, industry, households, etc.) for all scenarios. Figure 8 shows the overnight investment costs by sector, always aggregated over a 5-year period (e.g. "2030" covers the period 2028-2032) and Figure 9 their differences from the NECP scenario, which serves as a reference scenario.
Road vehicles account for the largest share of investment costs. The drop in investment costs in road vehicles in 2045 is mainly due to the purchase of hydrogen vehicles in 2040 and partly due to some discrepancy in transport module, where detailed assumptions about available technologies end in 2040. This discrepancy is common to all scenarios and thus does not affect the assessment of the impacts of individual policies. All costs are in constant 2020 prices, excluding VAT.
It should be emphasised that, given the age of most of the technological units in the Czech Republic and the expected development of emission allowance prices, significant investments in new energy sources and energy savings will be necessary in the coming decades, regardless of the 2050 emission targets. Other significant investments are triggered by the natural renewal of technologies, e.g. the vehicle fleet, i.e. again regardless of emission targets. These (natural) investment costs (which would occur anyway) are quantified in the NECP scenario, which is the reference scenario in this respect.
In the NECP scenario, over the monitored period from 2018 to 2052, the cumulative investment costs in road vehicles - encompassing fleet replacement and partial transition to electromobility - amount to € 359 billion (i.e. 61% of total cumulative investment cost and on average € 10 billion per year), in households the cumulative investment costs amount to € 126 billion (i.e. € 4 billion per year on average), in the tertiary sector € 48 billion (i.e. € 1.4 billion per year on average), in the electricity and CHP sector € 39 billion (i.e. € 1.1 billion per year on average), and industrial investments related to energy processes or energy management amount to € 19 billion (i.e. € 0.5 billion per year on average). The total cumulative investment costs over 35 years in the NECP reference scenario amount to a total of € 591 billion (€ 17 billion on average per year).
In terms of dynamics, investment in the energy sector for electricity and heat generation and in households grow the most over time (cf. Figure 10). Newly installed nuclear units in 2040 in all scenarios (exogenous assumption) except CPRICE induce increased investment in electricity and heat generation by € 13 billion (NECP_zero, NECP, REG) and € 20 billion (REF). In the NECP scenario, investment in new nuclear power plants accounts for one third of all investment in the electricity and heat generation sector over the whole period.
In the NECP_zero and REG scenarios, targeting GHG emission neutrality, the investment costs in electricity and heat generation, households and the tertiary sector increase significantly after 2045. In the last period between 2048 and 2052, investment costs in the electricity and CHP sector are € 15 billion (+335%, i.e. € 3 billion per year on average) higher in NECP_zero than in the NECP scenario. In the tertiary sector, including public institutions, investment costs are € 6 billion (+75%, i.e. € 1.1 billion per year on average) higher in this period.
In REG, investment costs in the electricity and CHP sector are € 16 billion (+365%, i.e. € 3.2 billion per year on average) higher than in the NECP scenario over the period 2048-2052. In the tertiary sector, including public institutions, investment costs are € 5 billion (+63%, i.e. € 1 billion per year on average) higher in this period than in the NECP scenario.
For comparison, the gross fixed capital formation of the whole Czech economy was € 57 billion in 2020 [32], the annual average of induced investment for the NECP reference scenario is around € 17 billion [32]. For the REG scenario in the period 2048 to 2050, in which the average annual additional investment costs are not higher, they thus represent around 13% of the total gross fixed capital formation of the pandemic year 2020. In this comparison, the average annual additional investment in the electricity and CHP sector represents less than 6% of the total gross fixed capital formation in 2020.
The CPRICE scenario has the lowest total investment costs over the whole period, with the largest decreases in investment in electricity generation and CHP (no new nuclear units plus net electricity imports) compared to the other scenarios, while investment mainly in households and fleet renewal is higher than in the NECP and REF scenarios, which also do not have a 2050 emissions target.
Annualized costs spread the investment costs over time according to the expected lifetime of the investment. In addition to the investment thus spread, energy (fuel) costs, operating costs and the cost of emission allowances are added to the total annualized costs.
Investments before 2020 are not quantified in the model, so energy costs are higher than annualized investment costs until 2025, after which annualized investment costs have the largest share of total annualized costs and account for more than half of total annualized costs in 2050.
Energy costs do not rise significantly over time. The cost of emission allowances (EUAs) differs the most between scenarios. The CPRICE scenario has the highest projected cost of an emission allowance and extends the emission allowance system to transport and buildings from 2030 onwards, therefore it has the highest cost of acquiring EUAs.
Annualized investment support includes support from envisaged subsidy programs. We assume a total volume of investment support for energy savings and new sources of heat and electricity in households and enterprises in the aggregate amount of 20 billion. Previous study on the development of renewable sources in Czechia until 2030 [33] however showed that even the scenario with the originally planned volume of RES support from the Modernisation Fund of € 2.8 billion does not lead to a greater development of RES than foreseen in the National Plan.
Figure 11 and Figure 12 show the absolute level of annualized costs and their difference from the NECP scenario.
Compared to the NECP scenario, the increased annualized investment, variable and fixed costs (and in the case of the CPRICE scenario also the cost of EUA emission allowances) are at least two-thirds offset by lower energy costs in all scenarios. Energy costs are lower due to lower assumed fossil fuel prices and lower energy consumption compared to the NECP scenario.
4.7. Composition of the Vehicle Fleet
The composition of the vehicle fleet does not differ significantly between the scenarios, given the slow pace of its renewal. In 2030, there is a clear presence of battery electric vehicles (BEVs), which gradually become the dominant powertrain in passenger cars. Hydrogen propulsion is also represented from 2040 onwards but does not grow significantly in the following years. Still, the number of ICE cars keeps growing in all scenarios until 2035, after which they are displaced mainly by BEVs.
For other vehicles, the largest differences between scenarios are in the medium and heavy goods vehicles and bus categories. In the NECP_zero and REG scenarios, hydrogen buses account for about 15% of the total number of buses in 2050. Emission trading extension to transport sector (CPRICE) or a strict emission target (NECP_zero and REG) lead to a higher share of electric vehicles in the medium goods vehicles category at the expense of diesel hybrids. For the same reasons, hydrogen vehicles are more prominent in the CPRICE, NECP_zero and REG scenarios in 2050.
4.8. Sensitivity analyses
4.8.1. EUA Price Sensitivity Analysis - NECP and CPRICE Scenarios
A sensitivity analysis on the price of emission allowances (EUAs) is carried out for the NECP reference scenario and for the CPRICE scenario. The current EUA price most closely matches the prices of the 90 and 140 variants or the CPRICE scenario (also used for NECP_C), cf. Table 9. These options reflect the current situation better than the original EUA price assumption from National Plan, so in a sense they could be said to update the National Plan with respect to the EUA price.
The NECP and CPRICE scenarios (except for the NECP scenario with no additional label as in the first row of Table 6) differ mainly in the pricing (CPRICE) or non-pricing (NECP) of GHG emissions outside the current EU ETS. In addition, the CPRICE scenarios have a relaxed assumption on net electricity imports and may import up to 20 TWh of electricity per year from 2025 onwards.
We therefore focus mainly on the impact of the EUA price when interpreting the sensitivity analysis (CA).
For the CPRICE scenarios, the highest two projected EUA price trajectories lead to increased electrification, which is reflected in increased consumption of natural gas that is used for electricity generation when GHG emissions are simultaneously captured by CCS. Electricity generation here increases by approximately 15 TWh up to the level of the NECP scenarios. As the EUA price increases, GHG emissions decrease in both the current EU ETS and new ETS2 sector. In the highest EUA price variant (250), GHG emissions in CPRICE_250 fall to 33 MtCO2e in 2050. Even in this variant no new nuclear source is built.
In CPRICE and CPRICE_250 there is a significant deployment of hydrogen-propelled heavy good vehicles around 2050. This additional hydrogen is produced from natural gas using CCS.
In both cases the EUA price has an impact mainly on the cost of electricity and heat production. In the case of CPRICE, it is then reflected in the increased cost of buying emission allowances in ETS2.
In NECP and NECP_90, brown coal is used to a small extent for electricity and heat generation also in 2050. In contrast, in NECP_200 and NECP_250, biomass is replaced by natural gas in hydrogen production (with CCS) and this replaced biomass is used for electricity and heat production with CCS (i.e. providing negative GHG balance there).
The PES consumption responds the most to the emission allowance price in the CPRICE, CPRICE_090 and CPRICE_140 scenarios, due to the extension of the ETS to buildings and road transport.
In electricity and heat generation, the use of natural gas increases at high emission allowance prices, identically in the CPRICE_200, CPRICE_250, NECP_200 and NECP_250 scenarios.
Hydrogen production increases significantly after 2040 in the CPRICE and CPRICE_250 scenarios, dominated by natural gas. In the NECP, NECP_090, NECP_140 and NECP_C scenarios, biomass is dominant for hydrogen production.
4.8.2. Sensitivity of Nuclear Power Plant Construction in the REG Scenario
For the REG scenario, which aims to achieve carbon neutrality in 2050, a sensitivity analysis of the possible development of nuclear power in the Czech Republic is performed.
The most significant impact compared to option REG is the REG_c option, i.e. no extension of the NPP and new nuclear units in 2045 and 2050. Lack of installed capacity in 2035-2045 is replaced mainly by brown coal and natural gas (although brown coal mining is terminated, the necessary coal is imported from neighboring countries). REG_c therefore has the highest GHG emissions in 2030 and 2035 of the options considered.
The REG_o option, with endogenous construction of new nuclear units, installs a total of 160 MW more nuclear units than the REG option, which merely replaces the decommissioned Dukovany NPP.
5. Discussion
Our modelling shows that achieving 55% reduction in total GHG emissions by 2030 is realistic for the small open economy such as that of Czechia, mainly due to emission reductions in the EU ETS sectors. However, the pace of GHG emission reductions in the non-ETS sectors is slow in all scenarios, which is also due to the increasing demand for energy services. In 2030, GHG emissions in the ESR sectors are reduced by 15 (REG) to 22% (NECP and NECP_zero) compared to 2005. In contrast, carbon neutrality is not achieved in any scenario by 2050, and 10 Mt CO2ek remains in the NECP_zero and REG scenarios even when accounting for emission sinks from LULUCF and CCS. There are several reasons for it, primarily stemming from modelling assumptions. First, all scenarios assume national self-sufficiency in renewables, hydrogen production and electricity generation; and the modelling results clearly shows how restricting these assumptions are, especially for decarbonization of industry. Second, two sectors with non-negligible GHG emissions, agriculture and waste, are not directly modelled and the emission trajectories used for them are not in line with ambitious climate policies that will strive for deeper uptake of circularity principles and waste hierarchy, progressive uptake of GHG abatement practices in livestock and farming practices as well as profound dietary changes in the population. Third, the imposed maximum potentials of solar and wind are rather conservative, and can be overcome with the deployment of more advanced technologies and better coordination. Fourth, the assumptions about the costs of emissions allowances and fossil fuels represent an outlook prior to the Russian aggression on Ukraine. Everything followed, including full or partial embargoes on imports of coal, oil and gas from Russia and a large shift to LNG imports, will likely have a lasting effect on energy prices, energy policies and consequently also on entire energy systems.
Importantly, even under rather restrictive assumptions about self-sufficiency and the maximal potentials of renewable energy sources, these are projected to make an increasing contribution to meeting energy needs in all scenarios. The share of RES in final energy consumption rises to 21-25% by 2030 and to 39-49% by 2050. Compared to today, the use of ambient energy in heat pumps, solar energy and, after 2040, geothermal and wind energy increases in particular. It is worth noting that solar energy deployment is constrained by the assumed maximum annual installation of 1 GWe of PV with this limit being reached in one or two five-year periods between 2025-2040 in all the scenarios. The RES share predicted for Czechia in European Commission’s REF2020 scenario and the three core policy scenarios presented along with Fit for 55 impact assessment [2] is broadly comparable to our results. In REF2020 scenario the share of RES in gross final energy consumption is predicted to increase to 22.6% in 2030 and 32.1% in 2050. In core policy scenarios, RES share in 2030 increases to 27.9%, 28.5% and 31.3% in MIX-CP, MIX and REG scenario, respectively.
We also show that the costs of the decarbonization will be substantial, but there will be also savings, some of which we have estimated, and vast benefits from climate change mitigation that are not reflected in the analysis. Savings and energy efficiency improvements are crucial to achieving emission targets, and among other measures the extension of ETS to buildings and road transport seems particularly relevant. A clear downward trend in primary energy consumption is portrayed in all scenarios modelled, with 24-30% less in 2050 compared to 2015, and a bit more moderate in final energy consumption that is 12.5 to 20% lower in 2050 than in 2015. In this respect, REF2020 scenario predicts 23% reduction in primary energy consumption by 2030 and beyond, while core policy scenarios predict 28%, 30% and 30% reduction by 2030 in MIX-CP, MIX and REG scenario, respectively. Final energy consumption is predicted to decline by 10% by 2030 and 13% by 2050 in REF2020 scenario, and by 14%, 16% and 16% in MIX-CP, MIX and REG scenario, respectively.
The huge volume of needed investment costs is partly concealed by the fact that the bulk of the investment goes into the renewal of the road vehicle fleet that is largely routine. This can be seen in Figure 9 where the difference against a baseline scenario is portrayed. The other single investment item is the new nuclear power plant with estimate overnight costs of €13 or 20 billion depending on installed capacity. This roughly corresponds to for one third of all investment in the electricity and heat generation sector in the baseline (NECP) scenario, and when the decision on the investment is left to the cost optimization algorithm, no new nuclear power plant is installed (CPRICE scenario), and import of electricity increases to almost 20%.
At the same time, Czechia has a tremendous opportunity to use substantial financial resources available for climate policies from EU funds. It is estimated that the key funds – European Structural and Investment Funds, Just Transition Fund, Recovery and Resilience Facility, Modernization Fund, Innovation Fund and newly proposed Social Climate Fund – will provide around 450-800 billion CZK (approx. € 18-32 billion) by 2030 [34], and more funding in the subsequent Multiannual Financial Framework, to support a rapid but socially just transition to carbon neutrality in Czechia.
Author Contributions
“Conceptualization, Lukáš Rečka, Vojtěch Máca and Milan Ščasný; methodology, Lukáš Rečka; software, Lukáš Rečka; validation, Lukáš Rečka, Vojtěch Máca and Milan Ščasný; formal analysis, Lukáš Rečka; investigation, Lukáš Rečka, Vojtěch Máca and Milan Ščasný; resources, Lukáš Rečka, Vojtěch Máca and Milan Ščasný; data curation, Lukáš Rečka and Vojtěch Máca; writing—original draft preparation, Lukáš Rečka and Vojtěch Máca; writing—review and editing, Lukáš Rečka, Vojtěch Máca and Milan Ščasný; visualization, Lukáš Rečka and Vojtěch Máca; supervision, Lukáš Rečka and Milan Ščasný; project administration, Lukáš Rečka and Milan Ščasný; funding acquisition, Lukáš Rečka and Milan Ščasný. All authors have read and agreed to the published version of the manuscript.
Funding
“This research was funded by the Technology Agency of the Czech Republic under the THÉTA Programme, grant number TK01010119: "Integrated models for regulatory impact analysis and simulation of long-term scenarios of energy sector development" (RegSim).” and “The APC was waived”.
Data Availability Statement
Not applicable.
Conflicts of Interest
The authors declare no conflict of interest. The funders had no role in the design of the study; in the collection, analyses, or interpretation of data; in the writing of the manuscript; or in the decision to publish the results.
References
- EC Commission Staff Working Document Impact Assessment Accompanying the Document Communication from the Commission to the European Parliament, the Council, the European Economic and Social Committee and the Committee of the Regions Stepping up Europe’s 2030 Climate Ambition Investing in a Climate-Neutral Future for the Benefit of Our People 2020.
- Directorate-General for Climate Action (European Commission) Policy Scenarios for Delivering the European Green Deal; Directorate-General for Climate Action (European Commission).
- Pietzcker, R.C.; Osorio, S.; Rodrigues, R. Tightening EU ETS Targets in Line with the European Green Deal: Impacts on the Decarbonization of the EU Power Sector. Applied Energy 2021, 293, 116914. [Google Scholar] [CrossRef]
- Kattelmann, F.; Siegle, J.; Cunha Montenegro, R.; Sehn, V.; Blesl, M.; Fahl, U. How to Reach the New Green Deal Targets: Analysing the Necessary Burden Sharing within the EU Using a Multi-Model Approach. Energies 2021, 14, 7971. [Google Scholar] [CrossRef]
- Mallouppas, G.; Yfantis, E.A.; Ktoris, A.; Ioannou, C. Methodology to Assess the Technoeconomic Impacts of the EU Fit for 55 Legislation Package in Relation to Shipping. Journal of Marine Science and Engineering 2022, 10, 1006. [Google Scholar] [CrossRef]
- Vinck, N. The Fit for 55 Package and the European Climate Ambitions An Assessment of Their Impacts on the European Metallurgical Silicon Industry. Proceedings of the Silicon for the Chemical & Solar Industry XVI. [CrossRef]
- Ovaere, M.; Proost, S. Cost-Effective Reduction of Fossil Energy Use in the European Transport Sector: An Assessment of the Fit for 55 Package. Energy Policy 2022, 168, 113085. [Google Scholar] [CrossRef]
- Oxera Assessment of the Impact of the Fit for 55 Policies on Airports; 2022.
- García Vaquero, M.; Sánchez-Bayón, A.; Lominchar, J. European Green Deal and Recovery Plan: Green Jobs, Skills and Wellbeing Economics in Spain. Energies 2021, 14, 4145. [Google Scholar] [CrossRef]
- Ján Dráb; Marek Engeľ; Katarína Nánásiová Analýza Vplyvov Balíka Fit for 55; Inštitút environmentálnej politiky: Bratislava, 2022; p. 119;
- Ščasný, M.; Ang, B.W.; Rečka, L. Decomposition Analysis of Air Pollutants during the Transition and Post-Transition Periods in the Czech Republic. Renewable and Sustainable Energy Reviews 2021, 145, 111137. [Google Scholar] [CrossRef]
- Eurostat Gross Value Added and Income by A*10 Industry Breakdowns Available online:. Available online: https://ec.europa.eu/eurostat/databrowser/view/NAMA_10_A10/default/table?lang=en&category=na10.nama10.nama_10_bbr (accessed on 16 December 2022).
- Tiseo, I. EU: GHG Emissions per Capita by Country 2020 Available online:. Available online: https://www.statista.com/statistics/986392/co2-emissions-per-cap-by-country-eu/ (accessed on 16 December 2022).
- Alberini, A.; Bigano, A.; Ščasný, M.; Zvěřinová, I. Preferences for Energy Efficiency vs. Renewables: What Is the Willingness to Pay to Reduce CO2 Emissions? Ecological Economics 2018, 144, 171–185. [Google Scholar] [CrossRef]
- Ščasný, M.; Zvěřinová, I.; Czajkowski, M.; Kyselá, E.; Zagórska, K. Public Acceptability of Climate Change Mitigation Policies: A Discrete Choice Experiment. Climate Policy 2017, 17, S111–S130. [Google Scholar] [CrossRef]
- Lehotský, L.; Černoch, F.; Osička, J.; Ocelík, P. When Climate Change Is Missing: Media Discourse on Coal Mining in the Czech Republic. Energy Policy 2019, 129, 774–786. [Google Scholar] [CrossRef]
- MIT The National Energy and Climate Plan of the Czech Republic 2019.
- Directorate-General for Climate Action (European Commission); Directorate-General for Energy (European Commission); Directorate-General for Mobility and Transport (European Commission); De Vita, A. ; Capros, P.; Paroussos, L., Fragkiadakis, K., Karkatsoulis, P., Höglund-Isaksson, L., Winiwarter, W., Eds.; et al. EU Reference Scenario 2020: Energy, Transport and GHG Emissions : Trends to 2050; ISBN 978-92-76-39356-6. [Google Scholar]
- IEA-ETSAP Times Available online:. Available online: https://iea-etsap.org/index.php/etsap-tools/model-generators/times (accessed on 16 December 2022).
- Loulou, R.; Lehtilä, A.; Kanudia, A.; Remme, U.; Goldstein, G. Documentation for the TIMES Model PartII; Energy Technology Systems Analysis Programme, 2020.
- Capros, P.; Paroussos, L.; Fragkos, P.; Tsani, S.; Boitier, B.; Wagner, F.; Busch, S.; Resch, G.; Blesl, M.; Bollen, J. Description of Models and Scenarios Used to Assess European Decarbonisation Pathways. Energy Strategy Reviews 2014, 2, 220–230. [Google Scholar] [CrossRef]
- Emisia COPERT | EMISIA SA.
- Nijs, W.; Ruiz, P. 01_JRC-EU-TIMES Full Model 2019.
- Schröder, A.; Kunz, F.; Meiss, J.; Mendelevitch, R.; Hirschhausen, V.C. Current and Prospective Costs of Electricity Generation until 2050; Berlin, 2013.
- IEA World Energy Outlook 2020; IEA, 2020.
- CHMI Integrated Reporting on Greenhouse Gas Policies and Measures and on Projections in the Czech Republic; Czech Hydrometeorological Institute, 2021.
- Lucas, P.L.; van Vuuren, D.P.; Olivier, J.G.J.; den Elzen, M.G.J. Long-Term Reduction Potential of Non-CO2 Greenhouse Gases. Environmental Science & Policy 2007, 10, 85–103. [Google Scholar] [CrossRef]
- MoE National Inventory Report (NIR); Ministry of Envrironment, 2021.
- TA CR Modelling of Sustainable Forestry Scenarios Contributing To Climate Change Adaptation – Examining the Impacts on Energy Sector and GHG Emissions in the Czech Republic and Public Acceptability of These Scenarios by Czech population.
- ERU Annual Report on Electricity System Operation for 2020; ERU, 2020.
- EEA EU Emissions Trading System (ETS) Data Viewer — European Environment Agency Available online:. Available online: https://www.eea.europa.eu/data-and-maps/dashboards/emissions-trading-viewer-1 (accessed on 9 January 2023).
- CZSO GDP by the Expenditure Approach Available online:. Available online: https://apl.czso.cz/pll/rocenka/rocenkavyber.makroek_vydaj (accessed on 9 January 2023).
- Rečka, L.; Ščasný, M.; Máca, V.; Kopečná, V. Rozvoj Obnovitelných Zdrojů v ČR Do Roku 2030; 2021.
- Fakta o klimatu Finance z fondů EU na klimatická opatření v ČR Available online:. Available online: https://faktaoklimatu.cz/infografiky/fondy-eu (accessed on 25 January 2023).
Figure 1.
Consumption of primary energy sources.
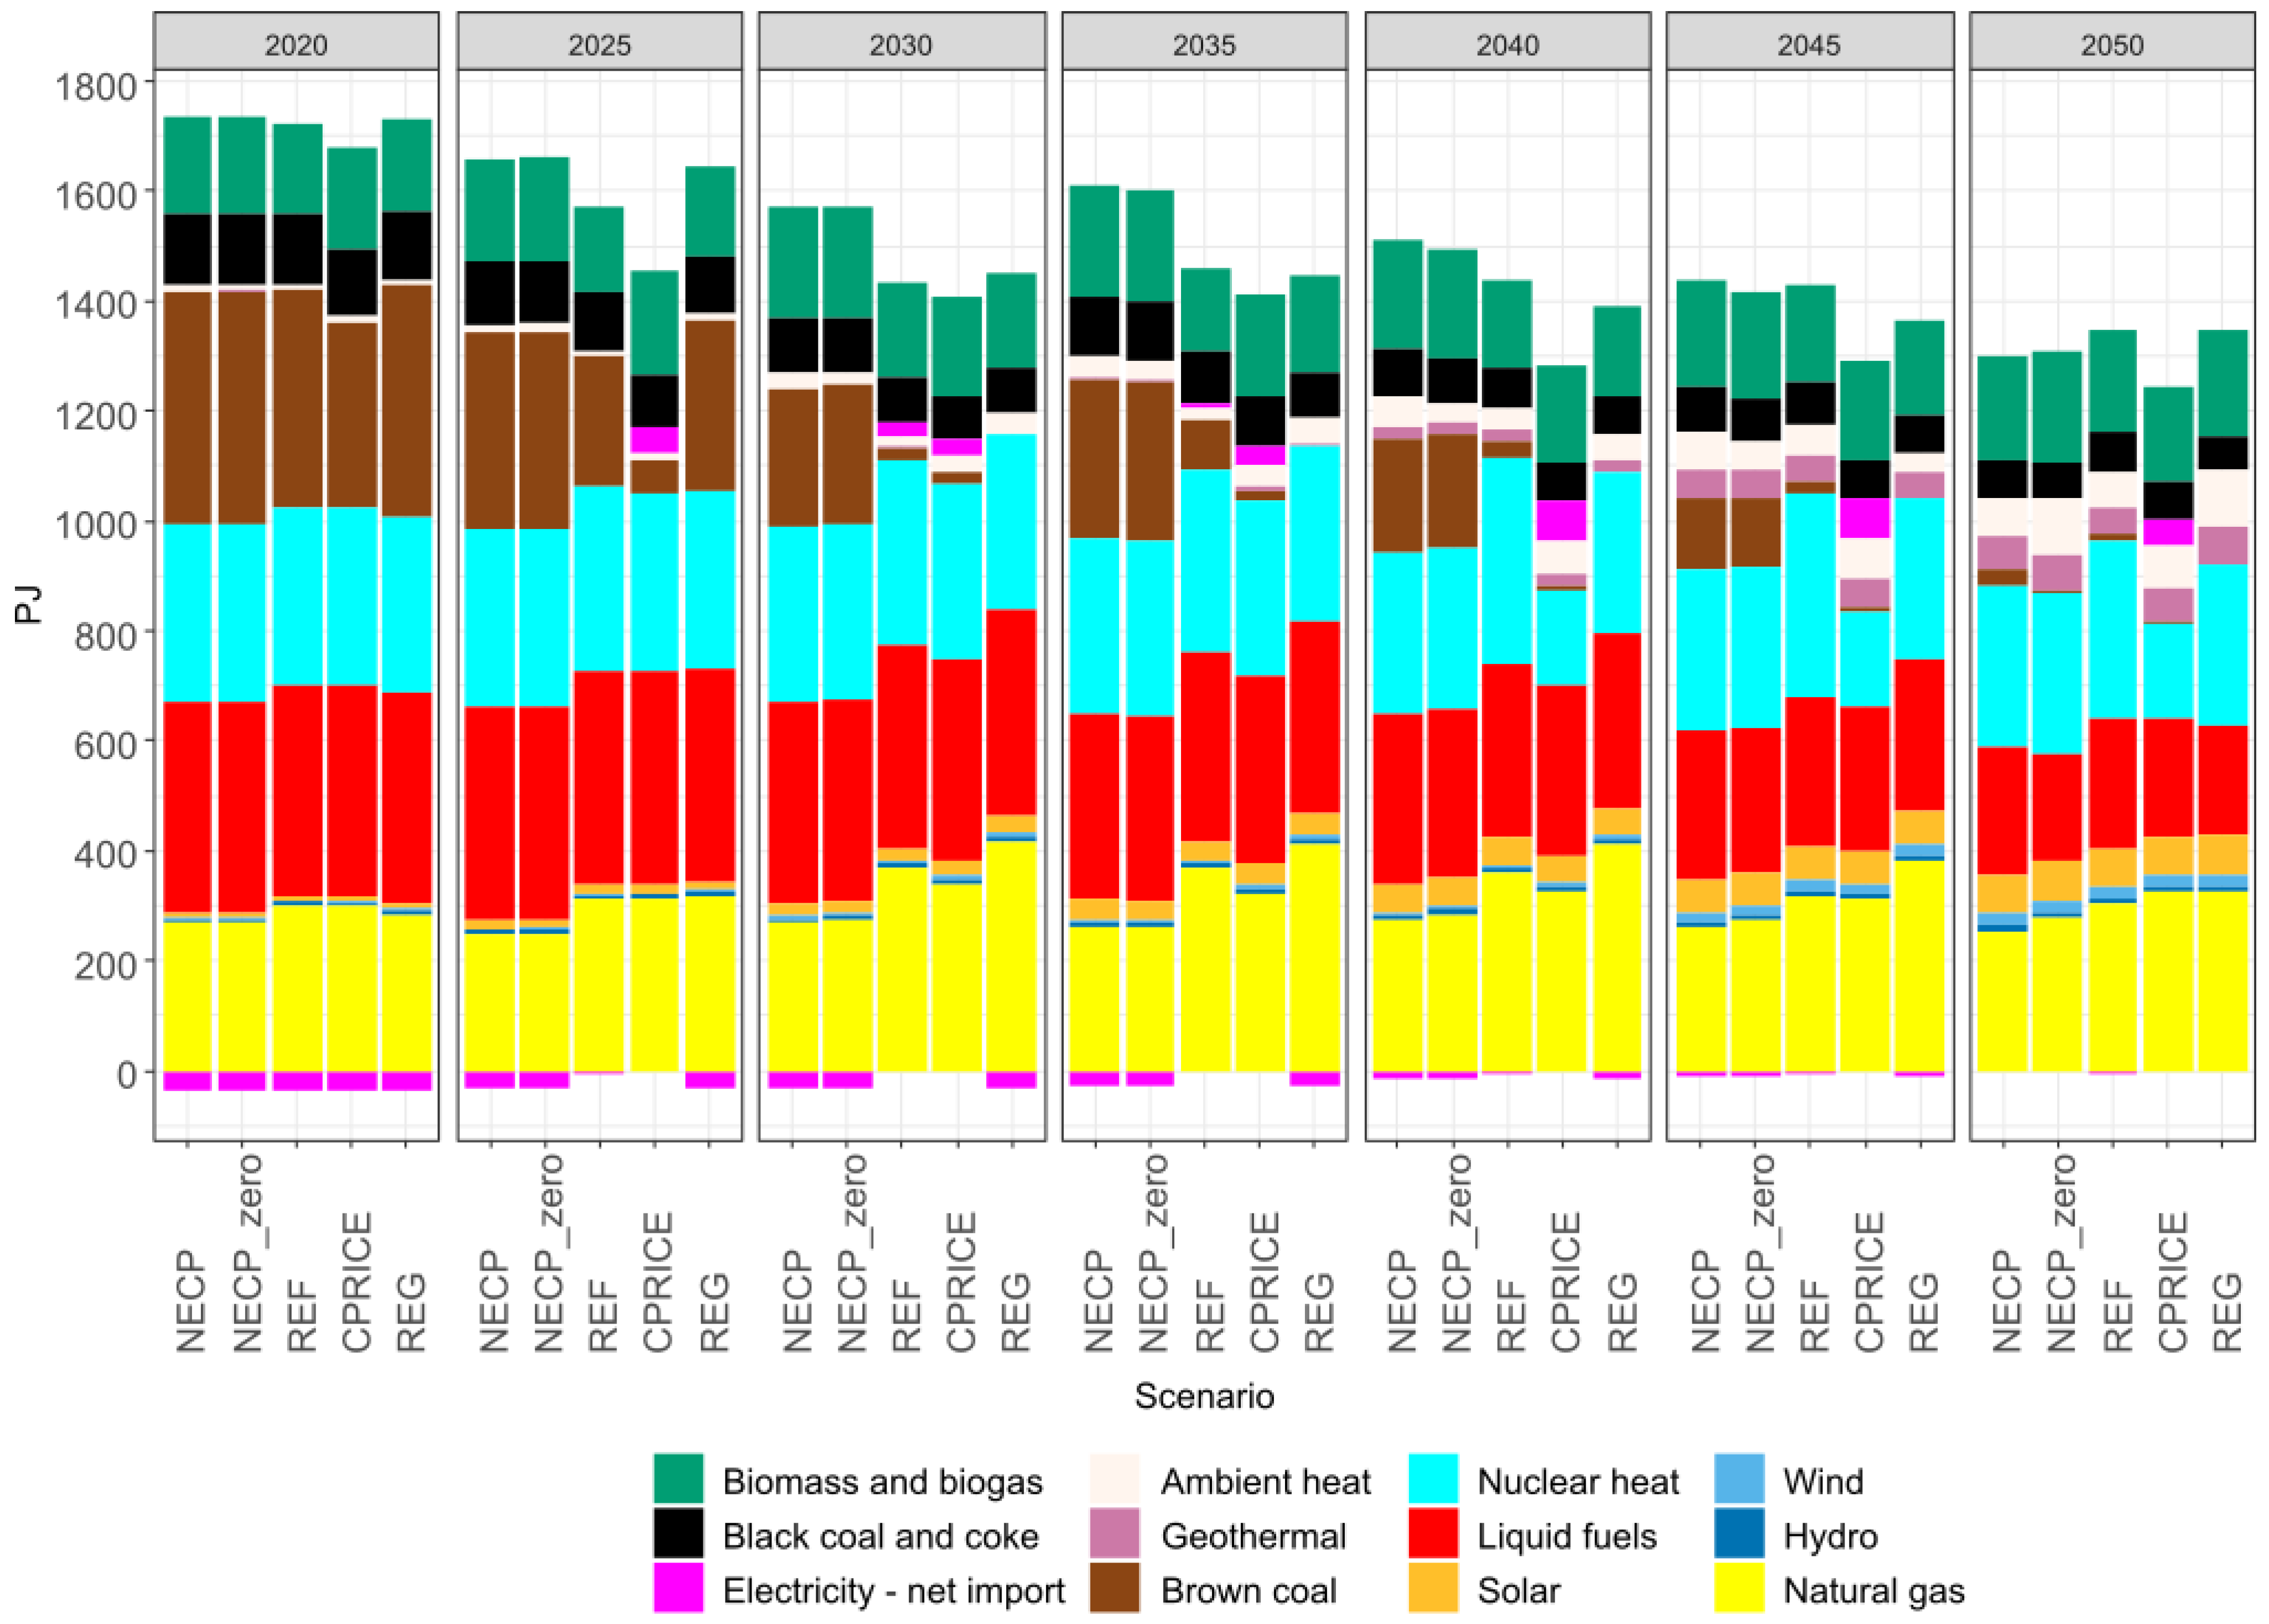
Figure 2.
Energy input for heat and power generation.
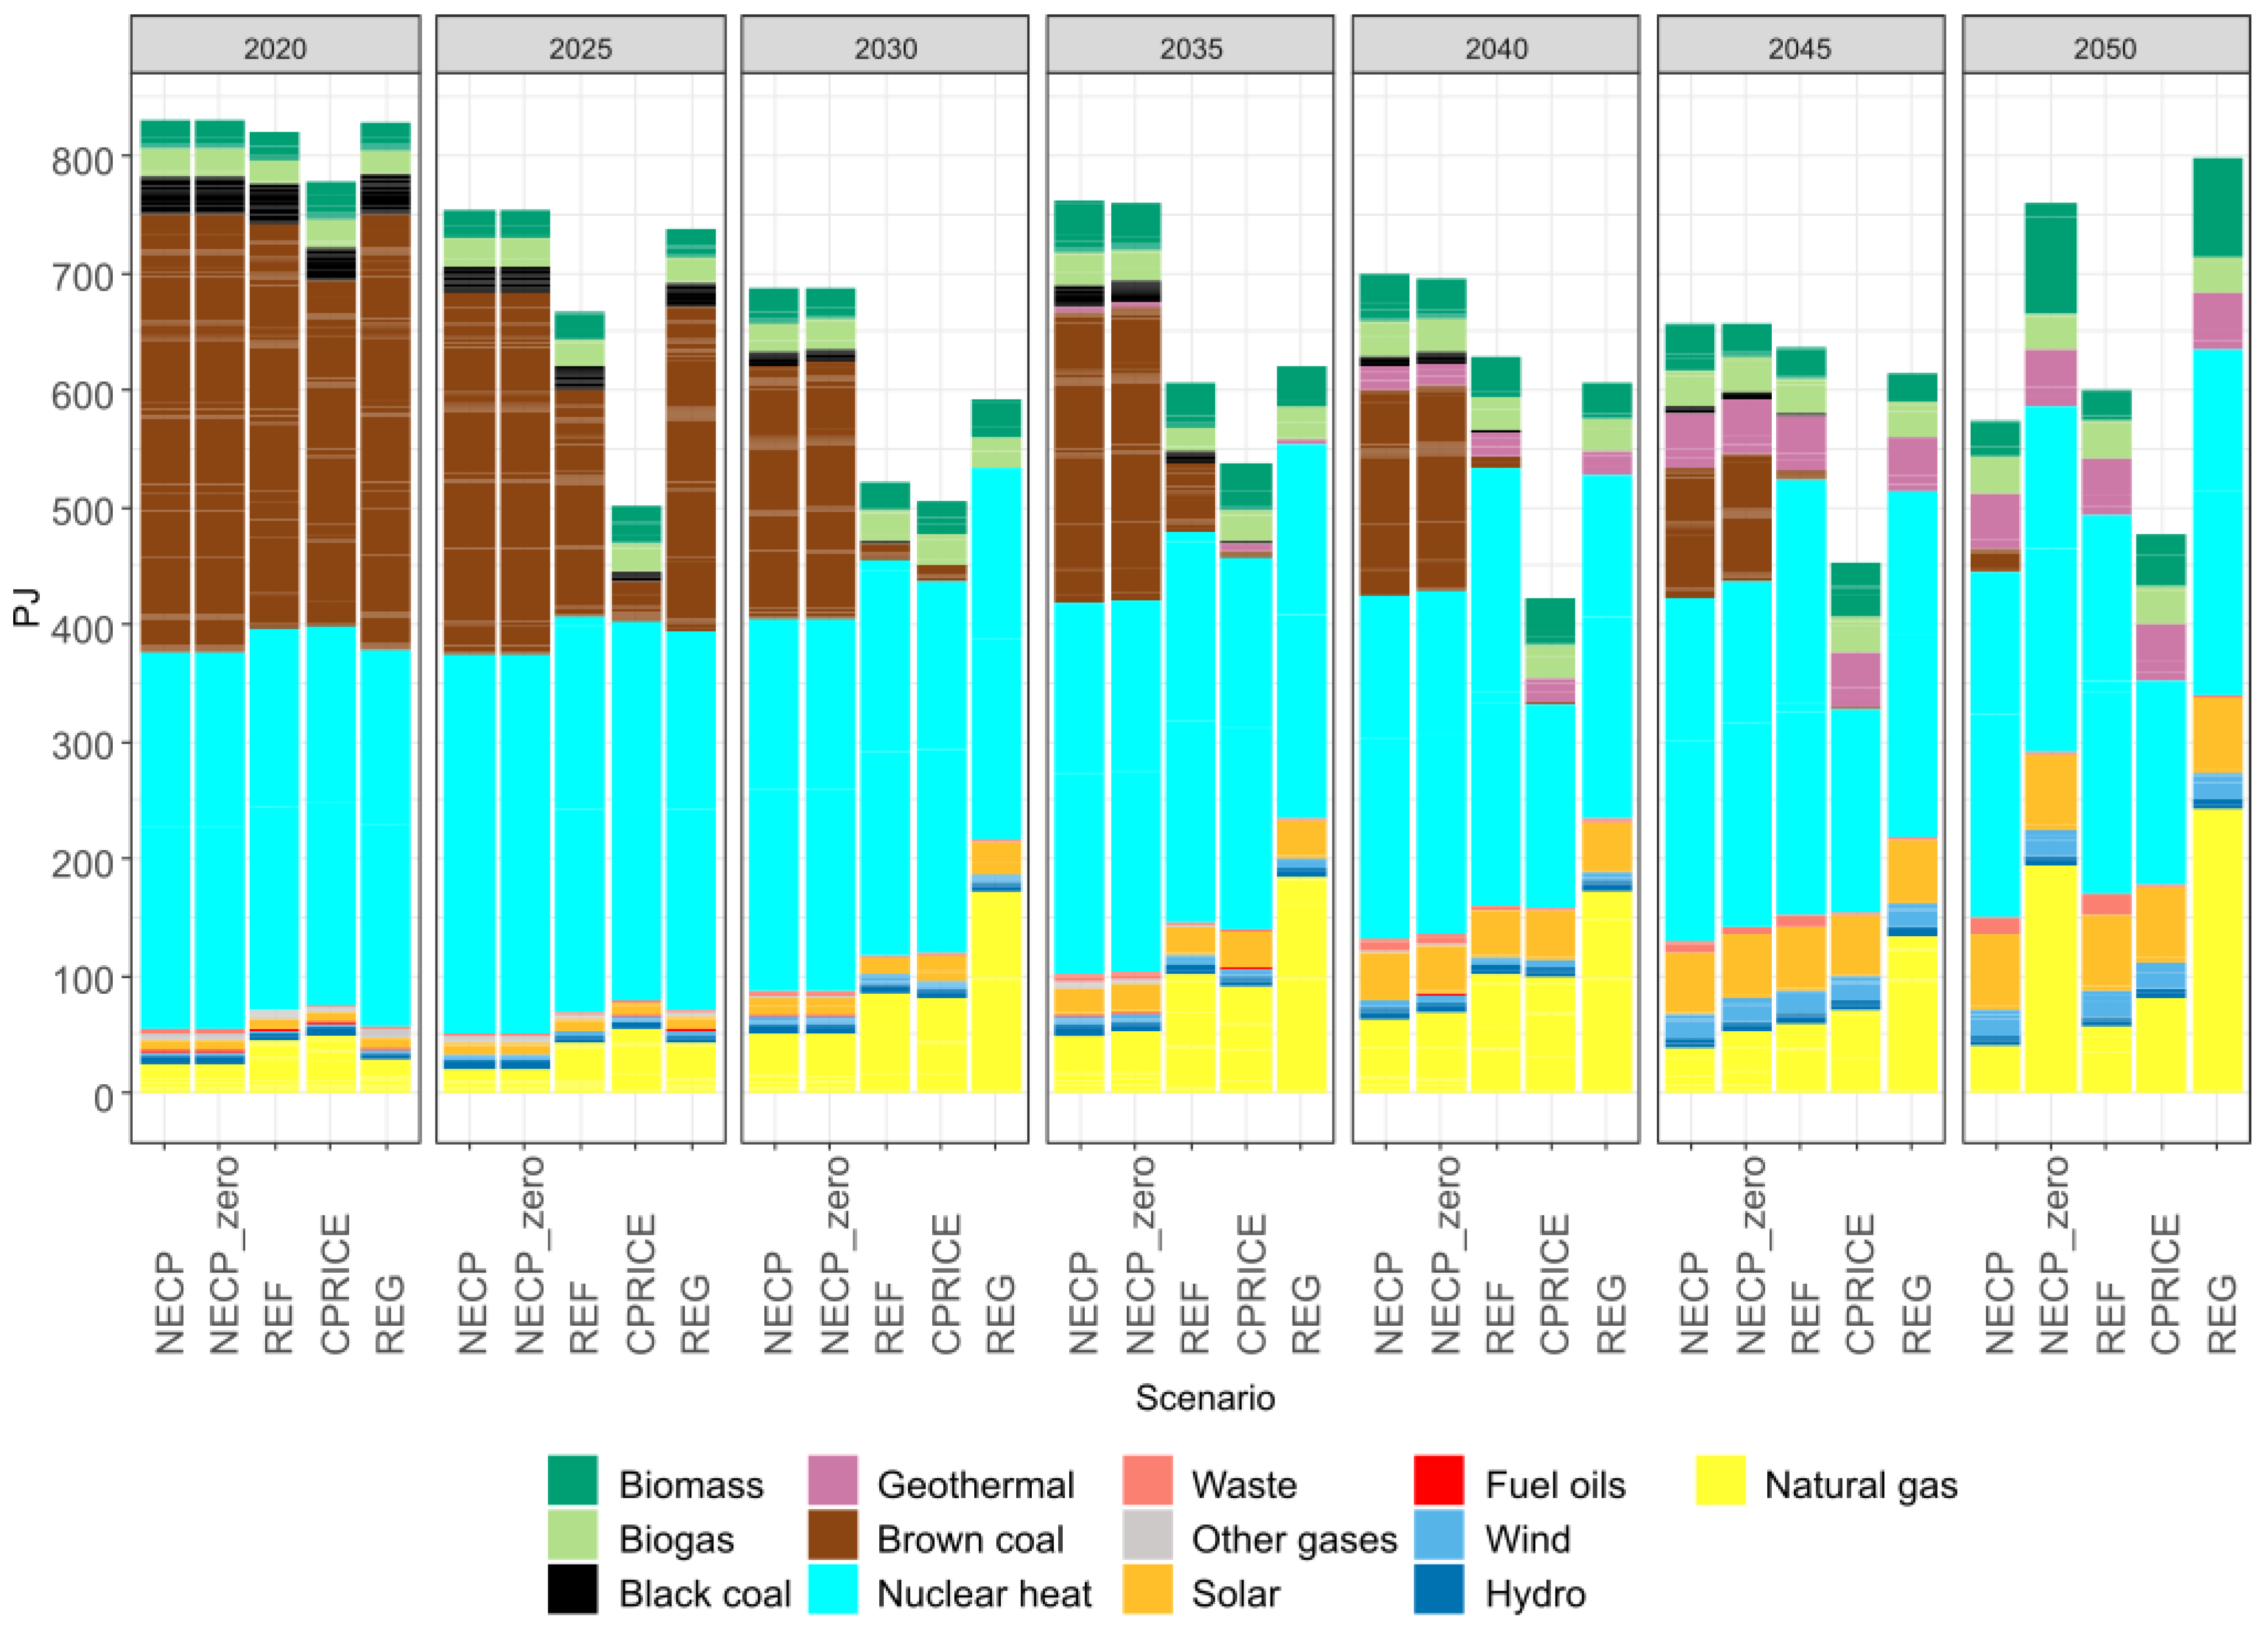
Figure 3.
Total final energy consumption.
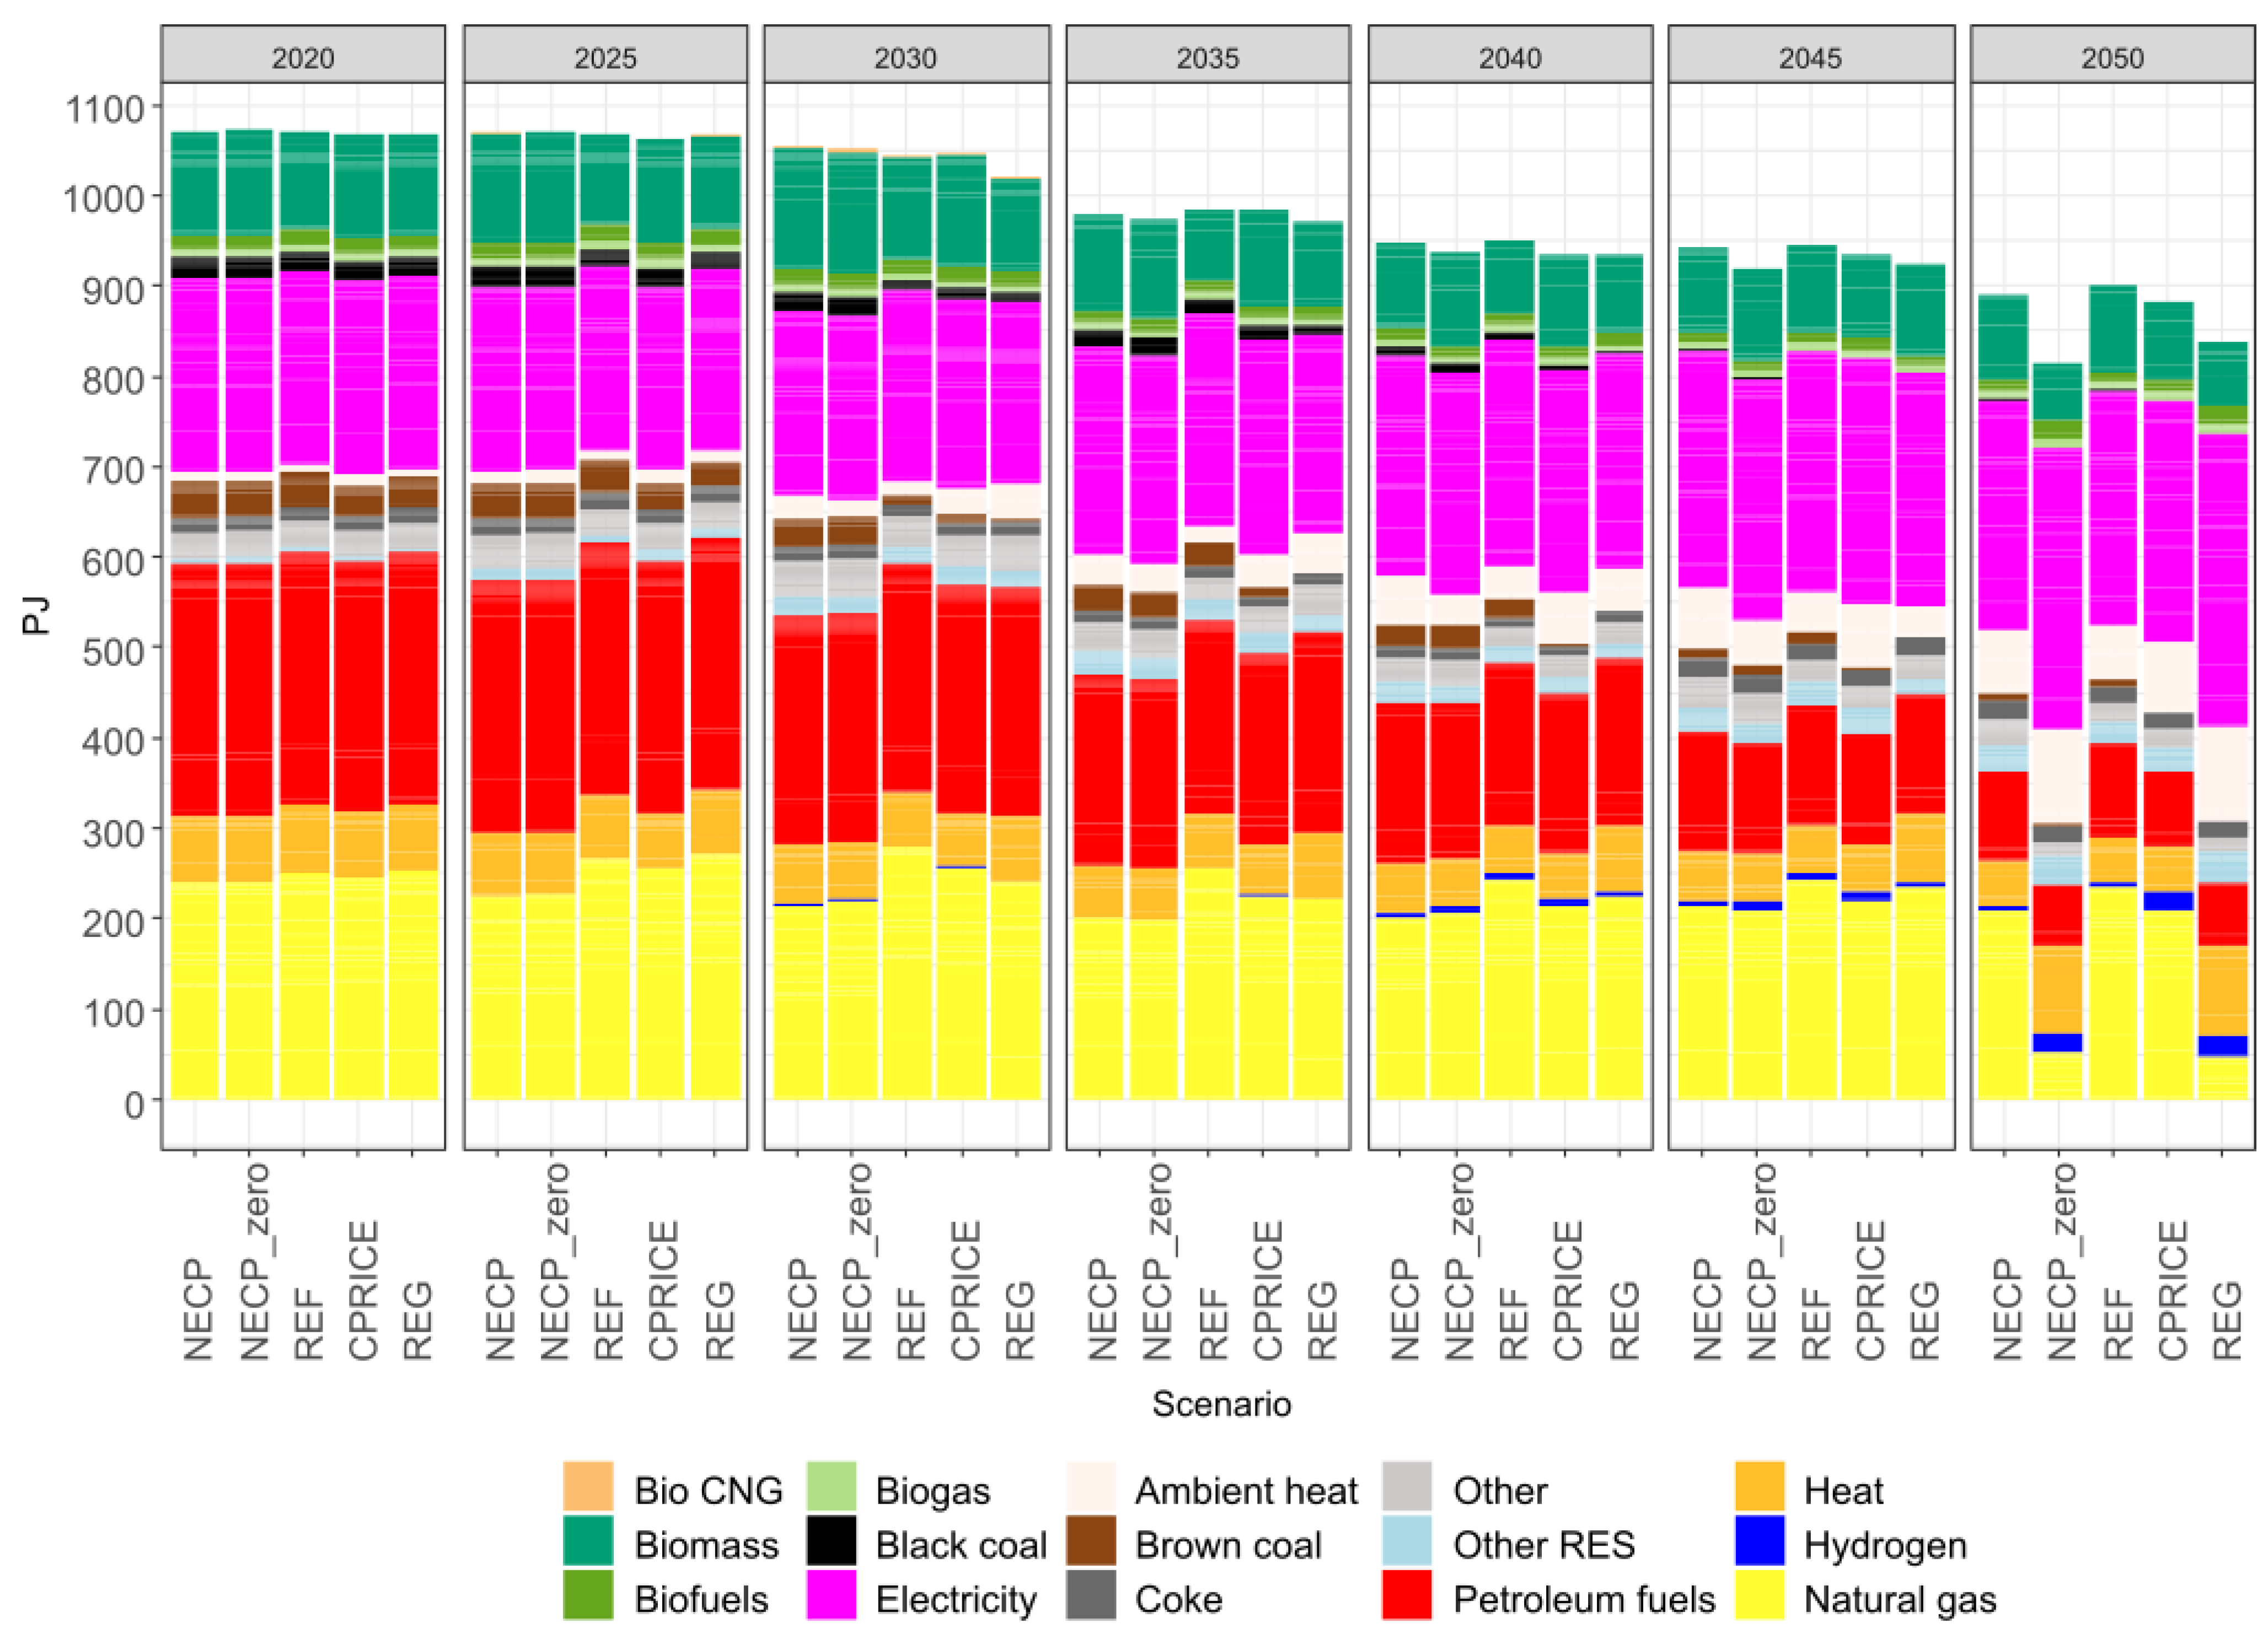
Figure 4.
Final energy - selected energy carriers.
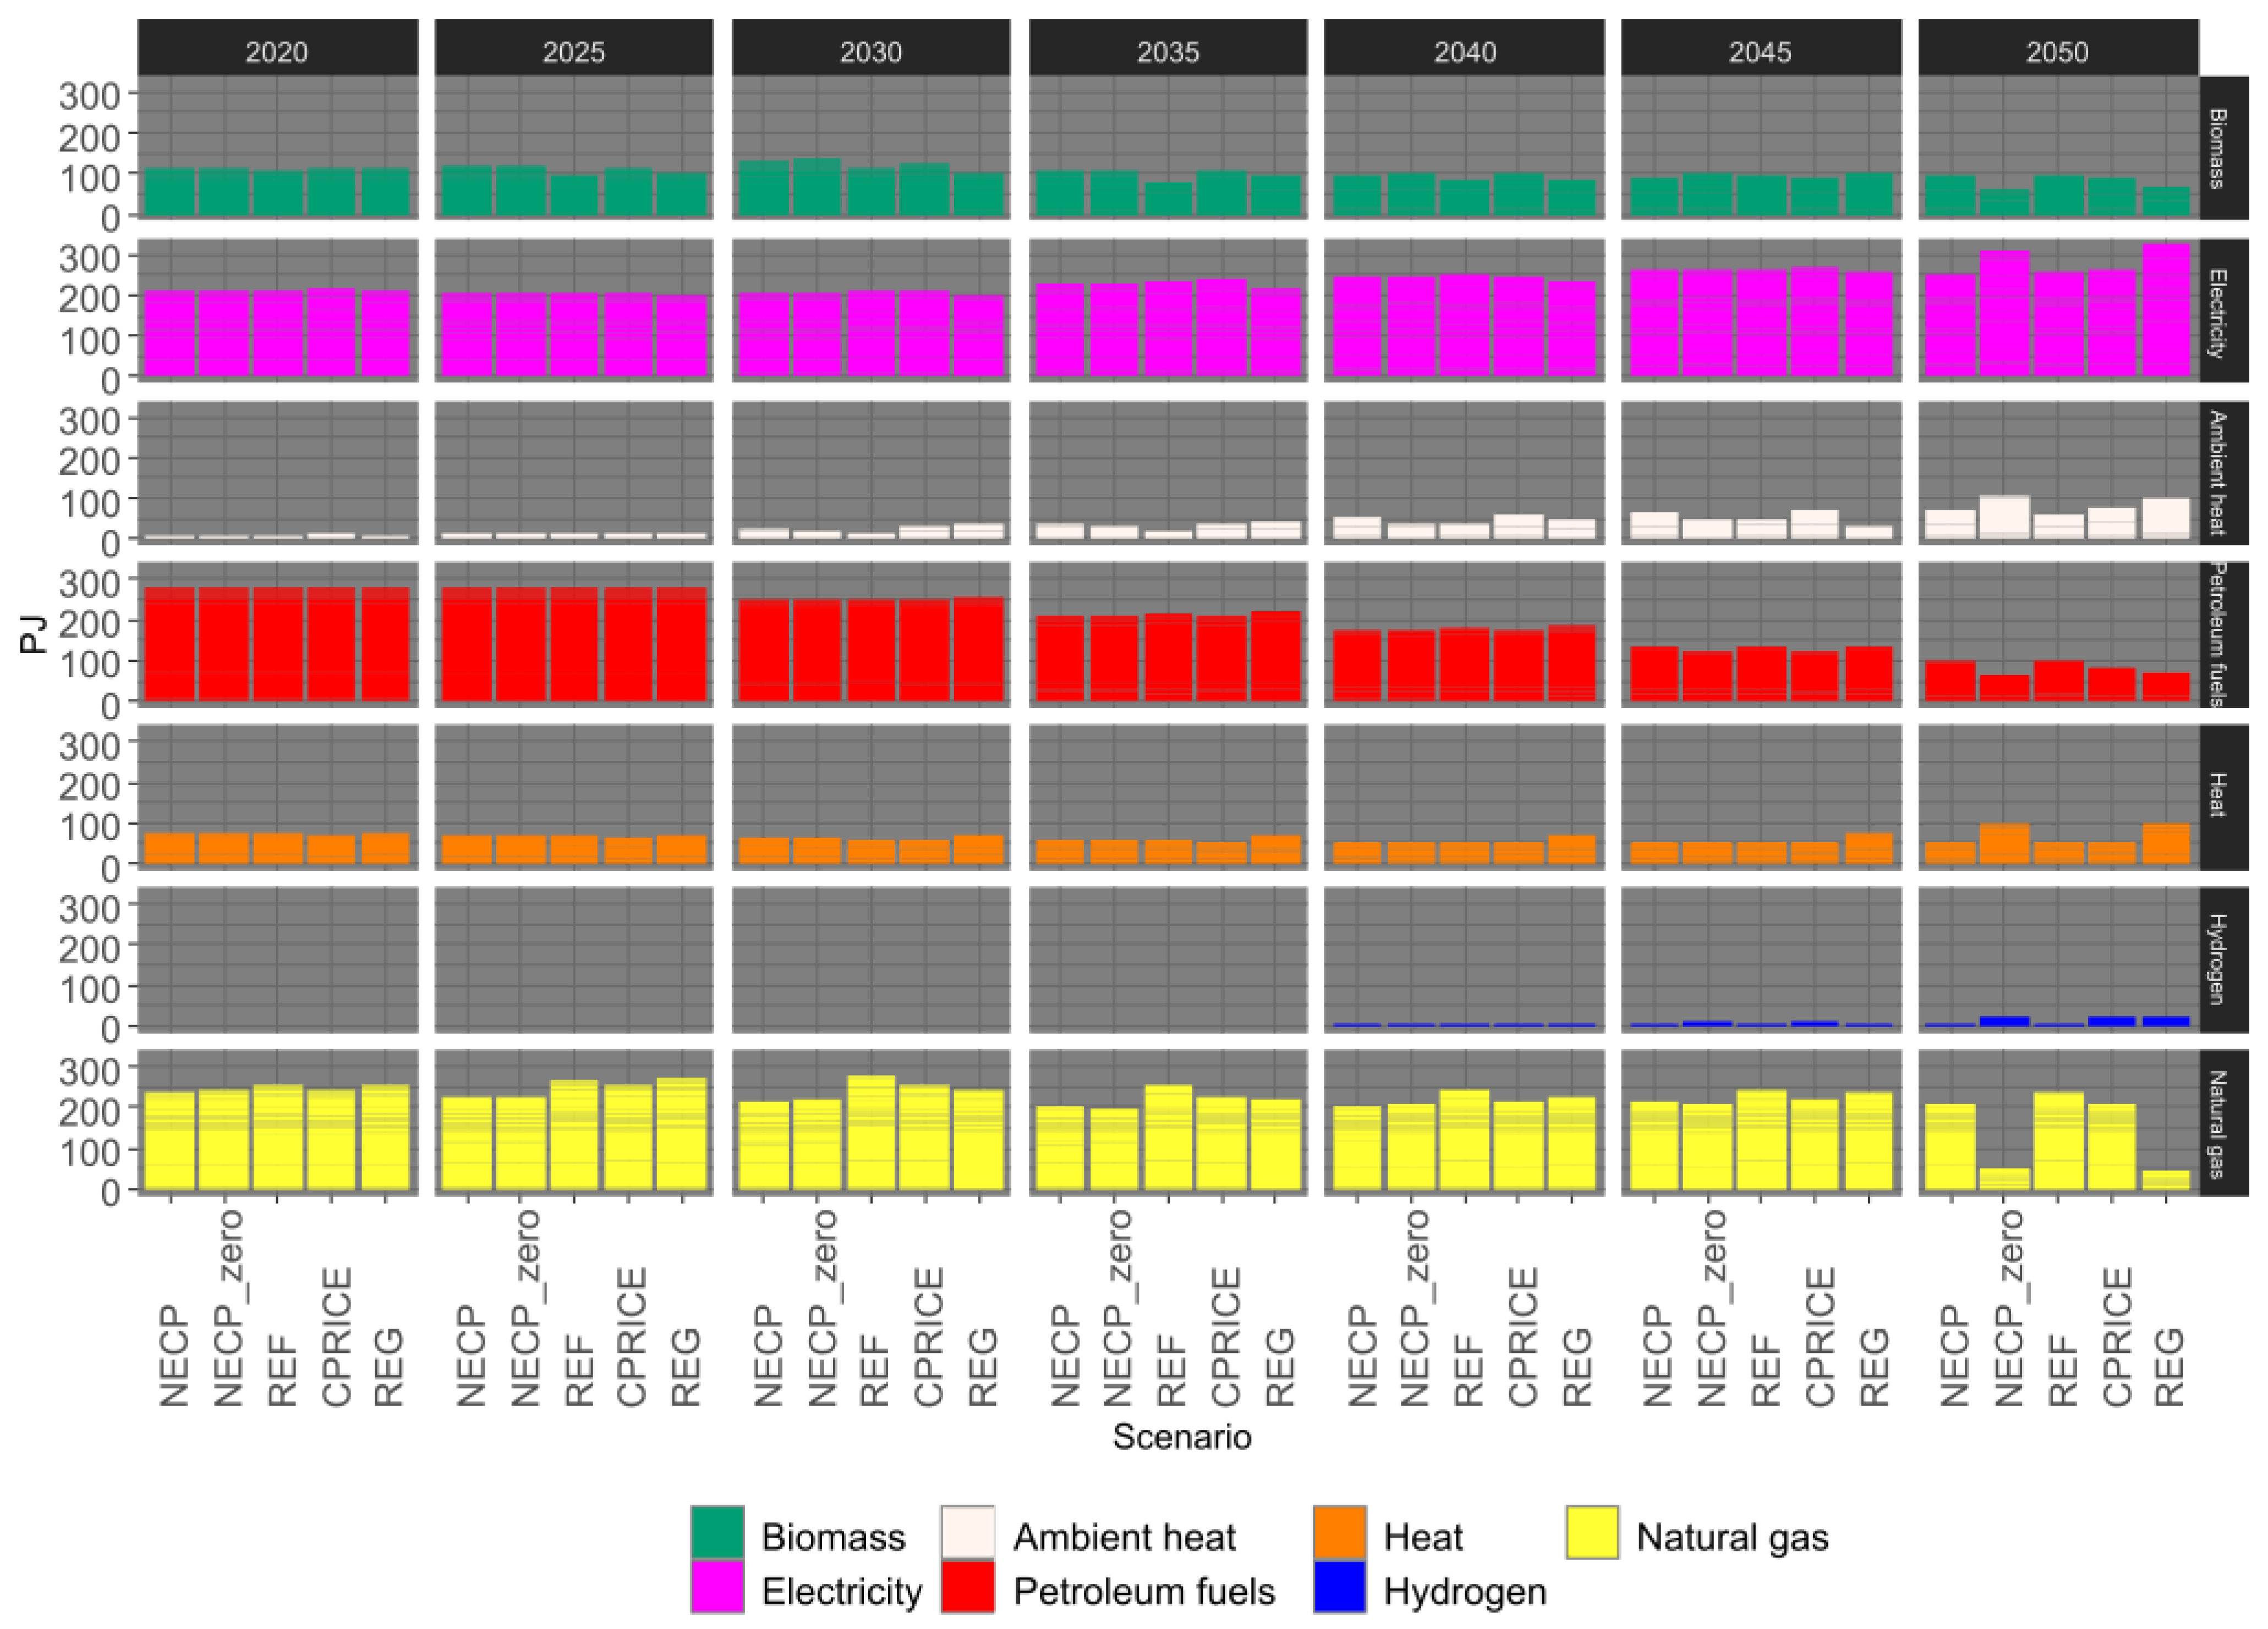
Figure 5.
Emissions of GHG from ETS and non-ETS sectors, (without GH4 and NO2 from EU ETS and without LULUCF).
Figure 5.
Emissions of GHG from ETS and non-ETS sectors, (without GH4 and NO2 from EU ETS and without LULUCF).
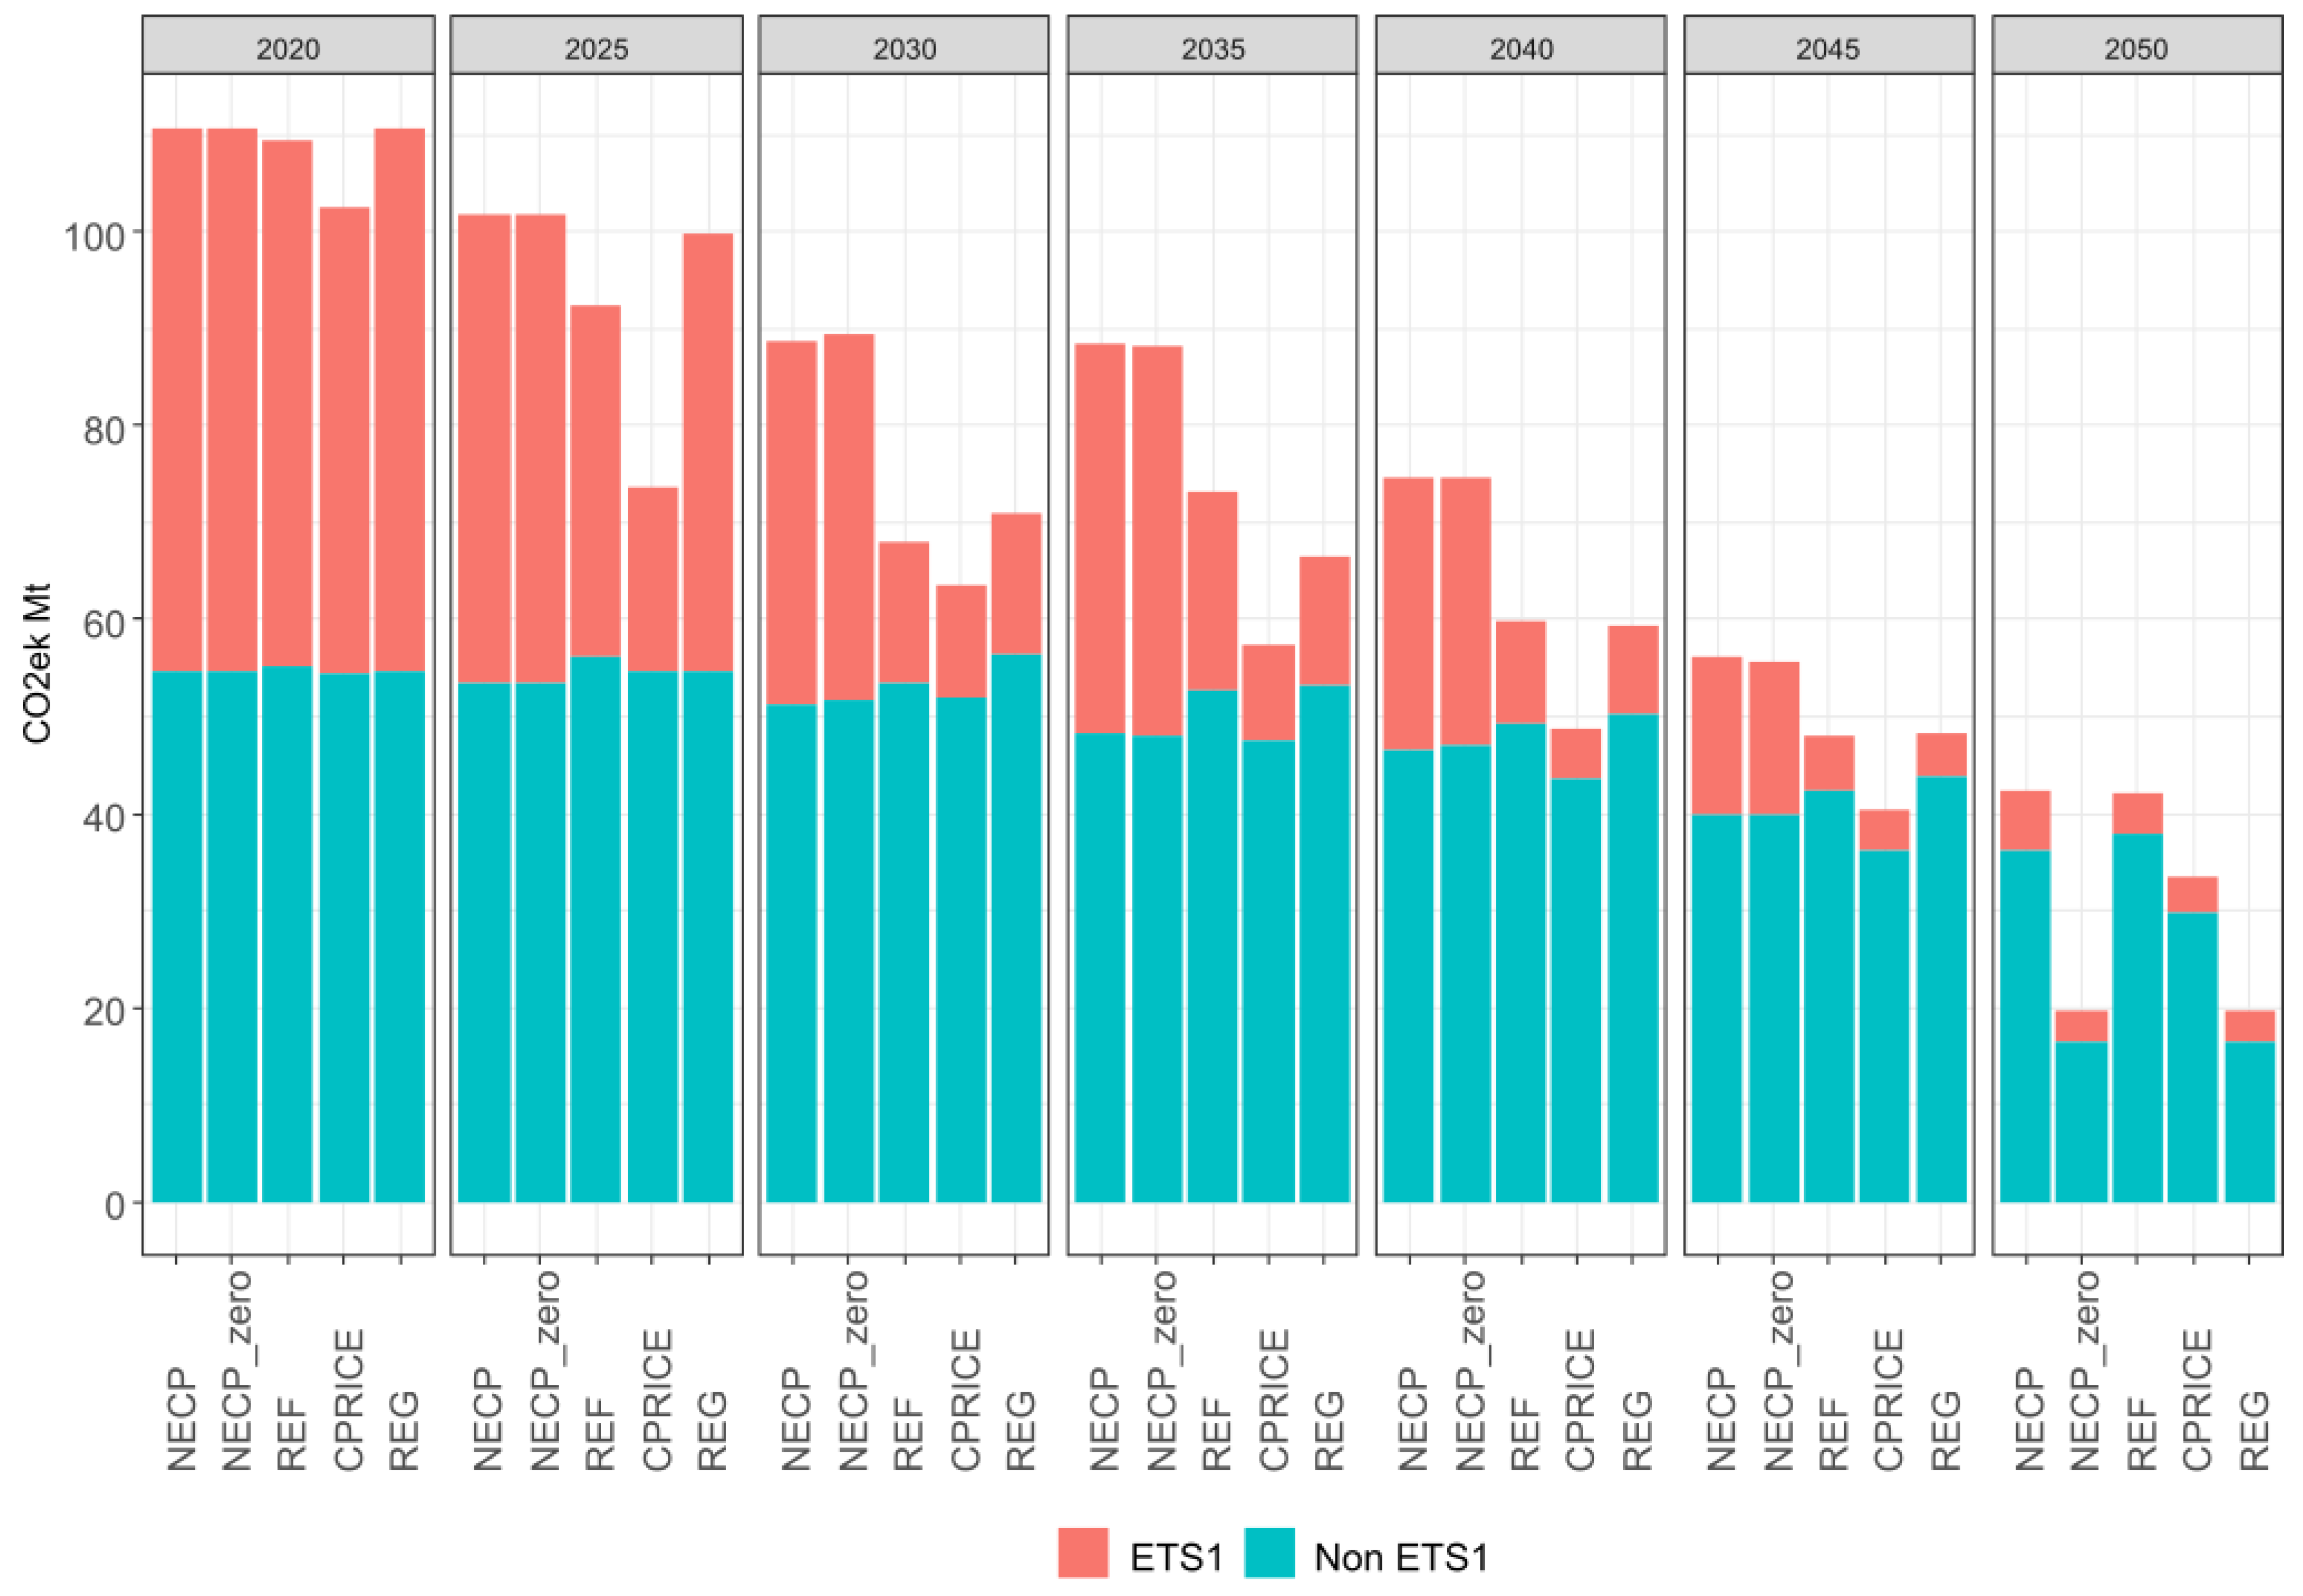
Figure 6.
Emissions of GHG by sector (without LULUCF).
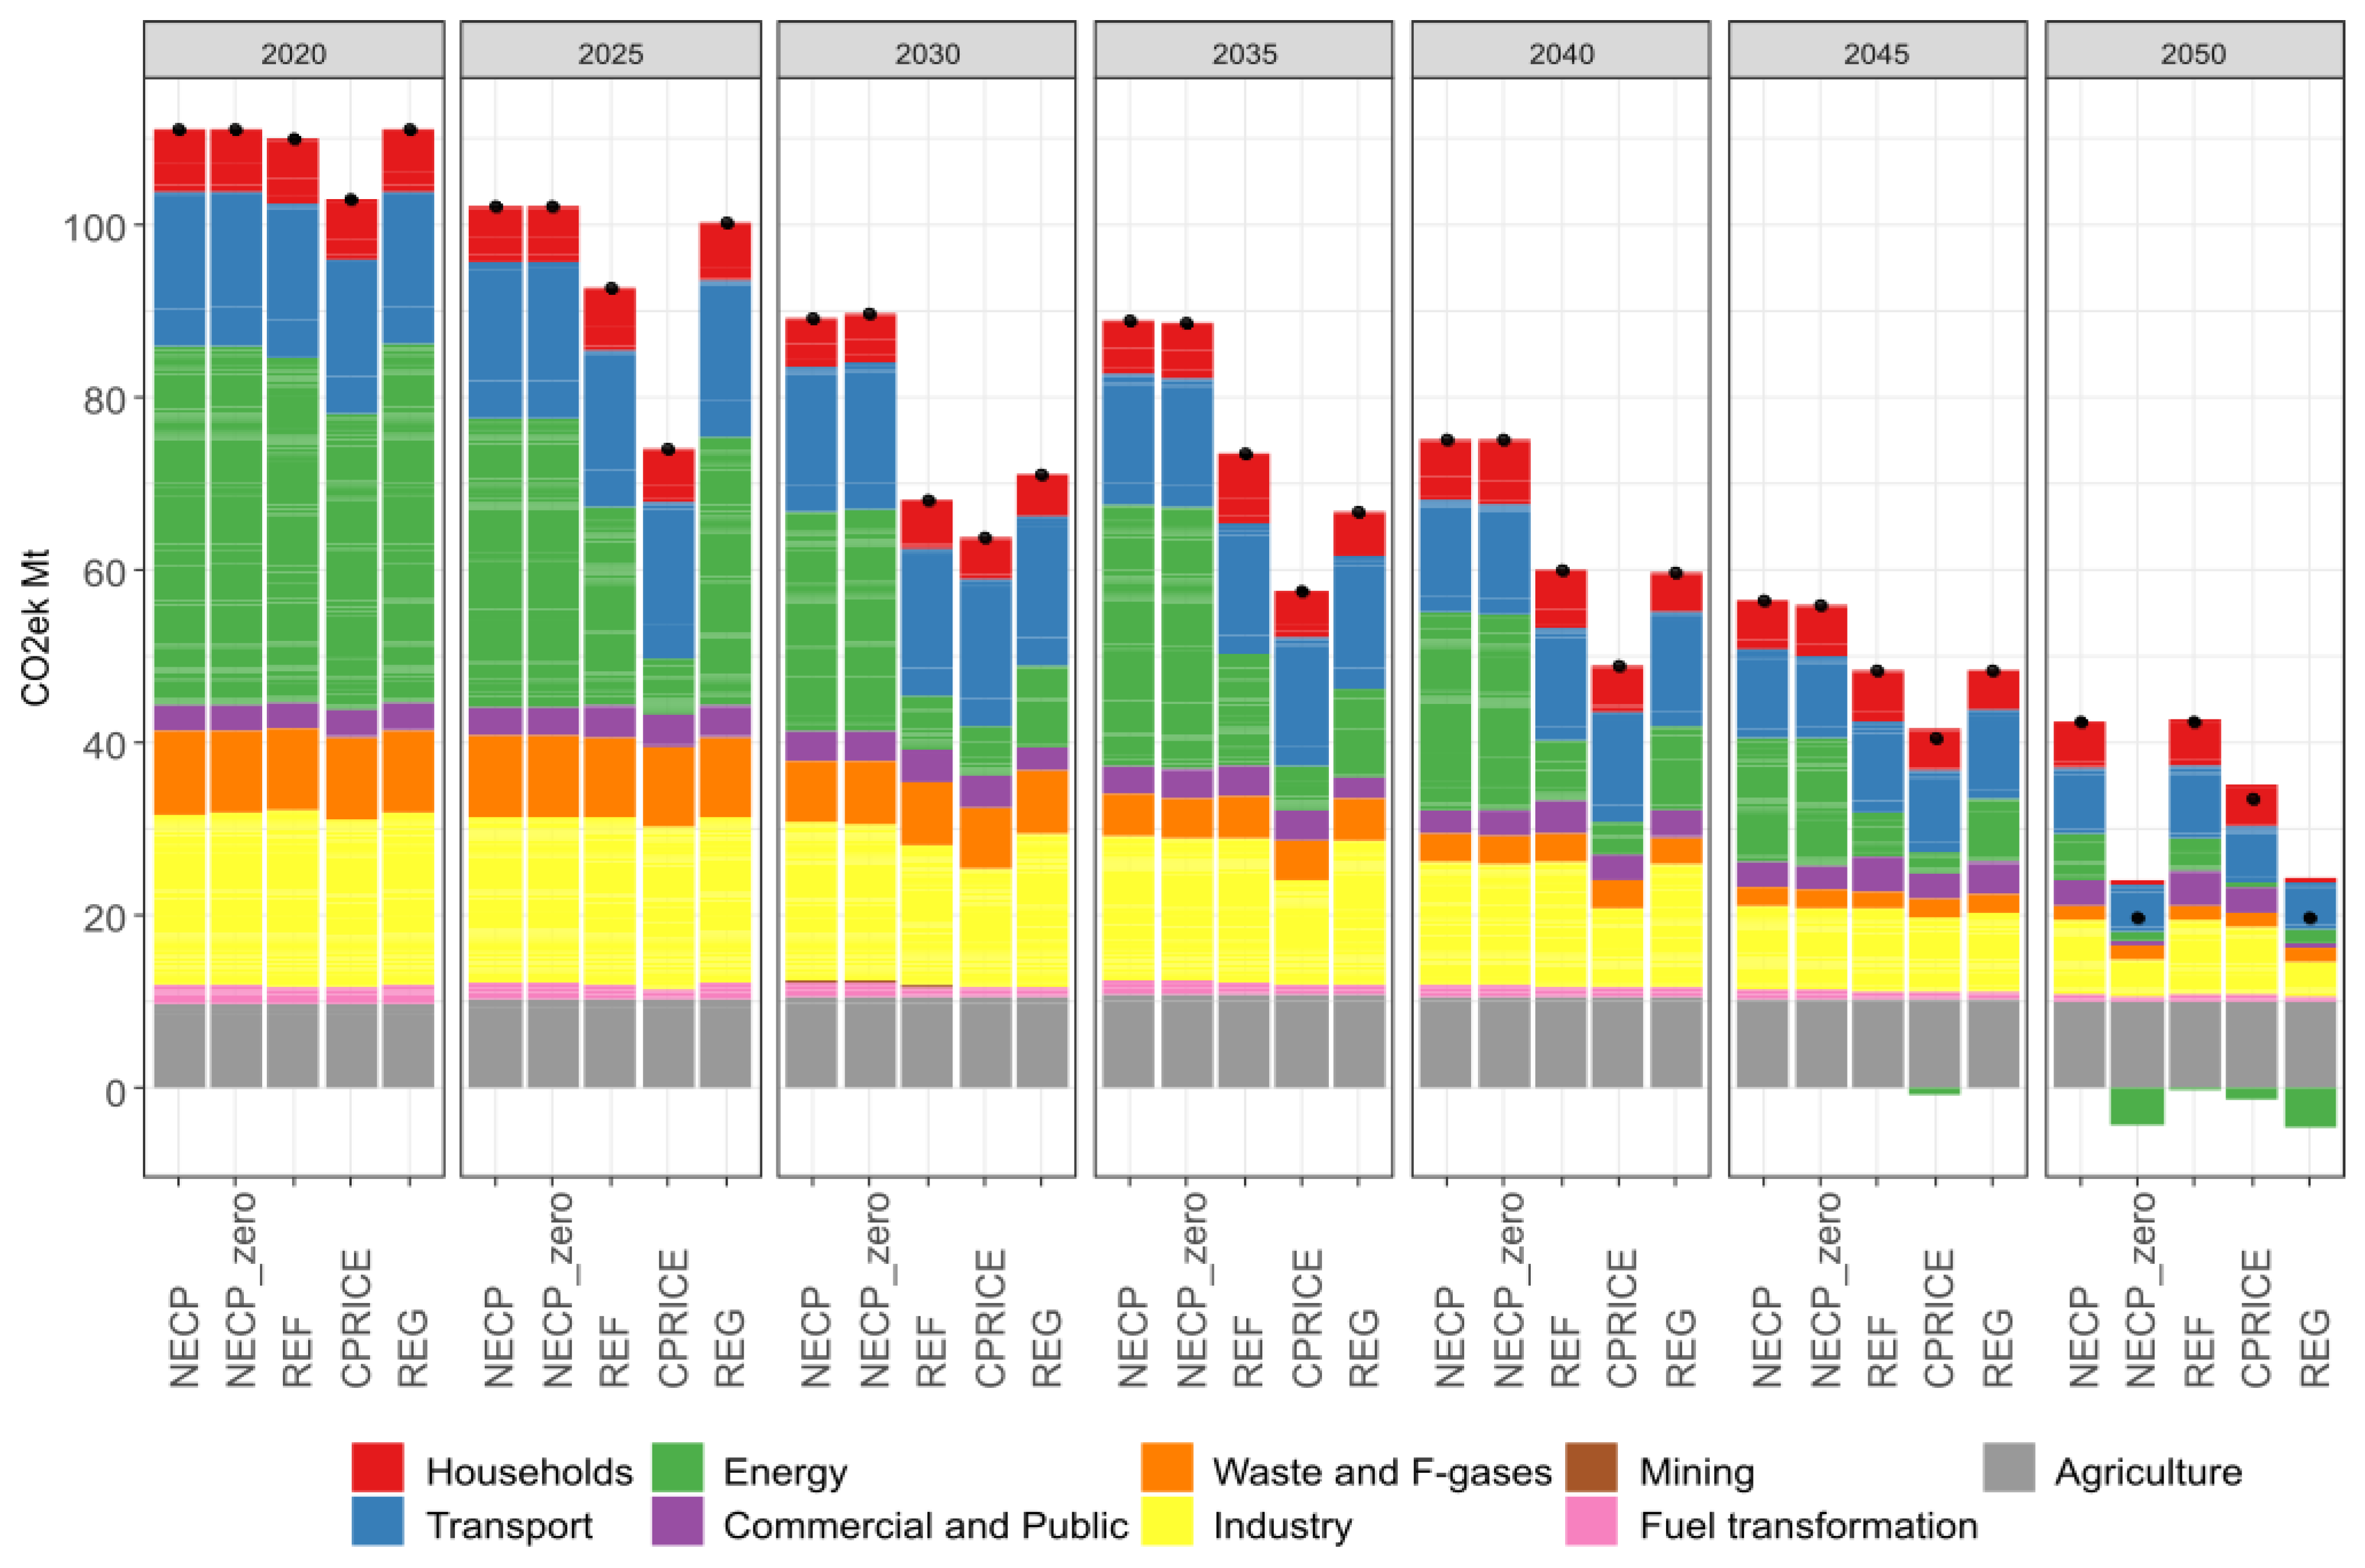
Figure 7.
Carbon capture by fuel or industry (left panel) and by sector (right panel).
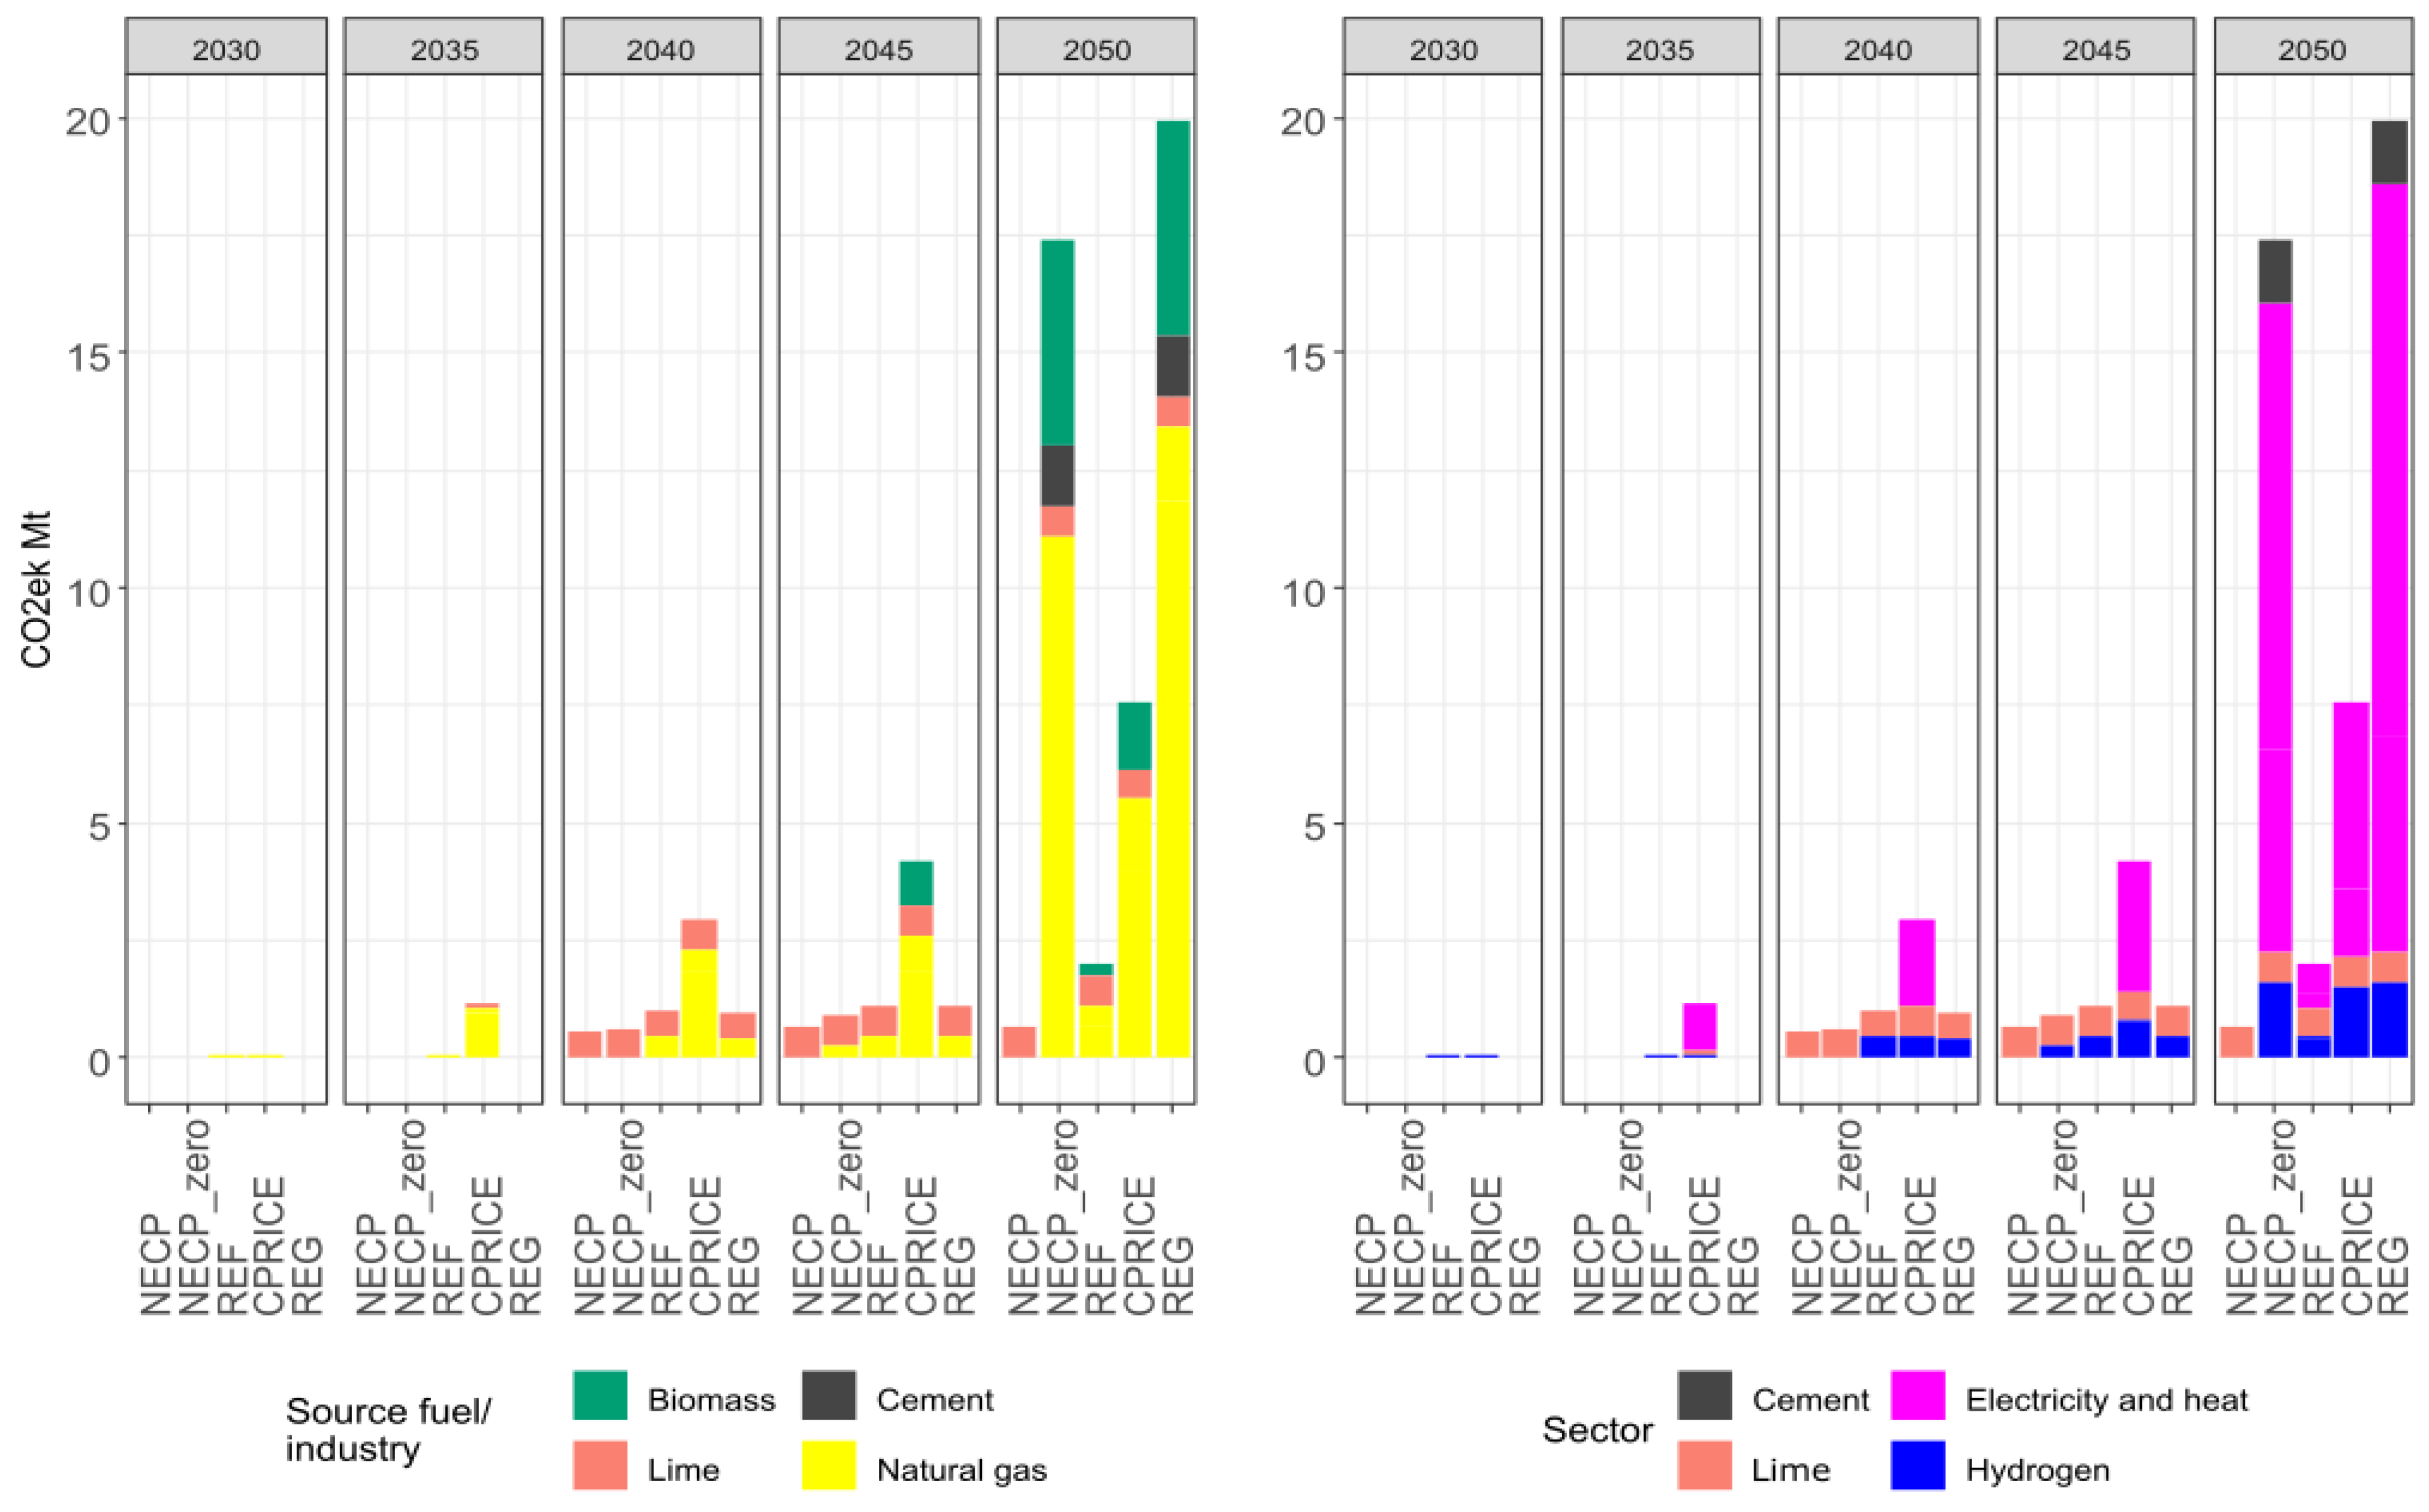
Figure 8.
Investment cost by sector, (sum over 5-year period, €2020, without VAT).
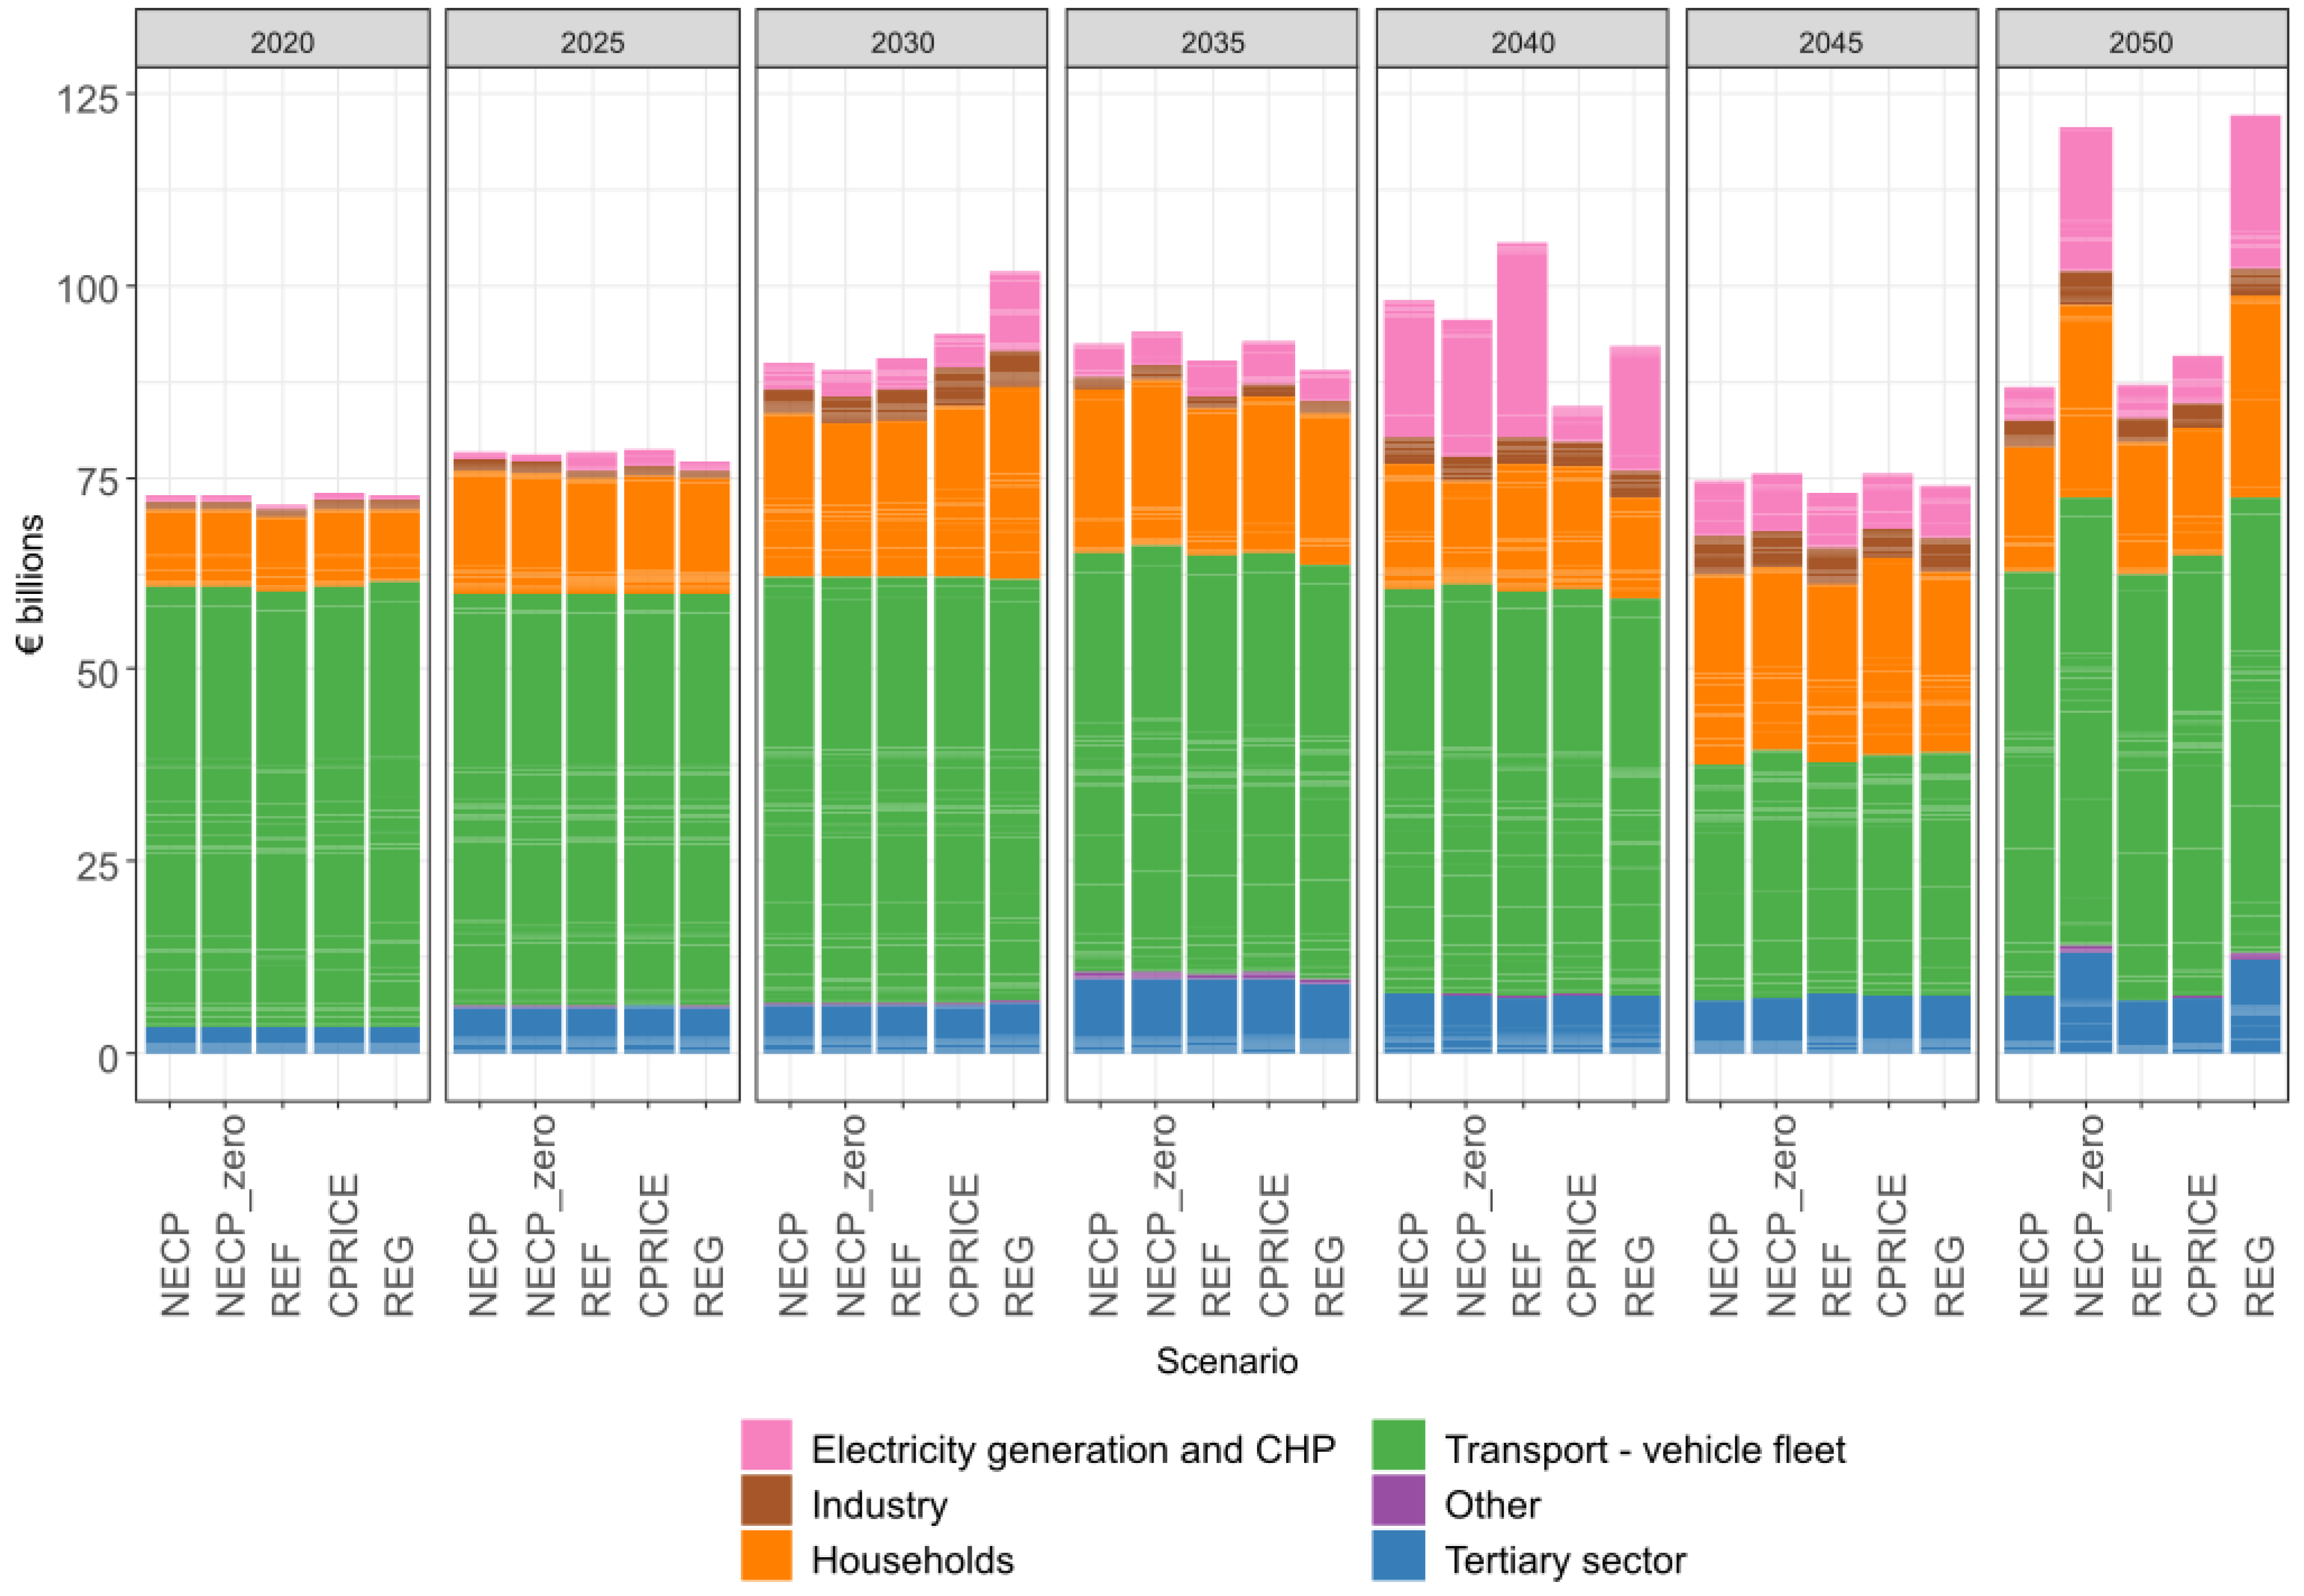
Figure 9.
Difference in investment cost against NECP scenario, (sum over 5-year period, €2020, without VAT).
Figure 9.
Difference in investment cost against NECP scenario, (sum over 5-year period, €2020, without VAT).
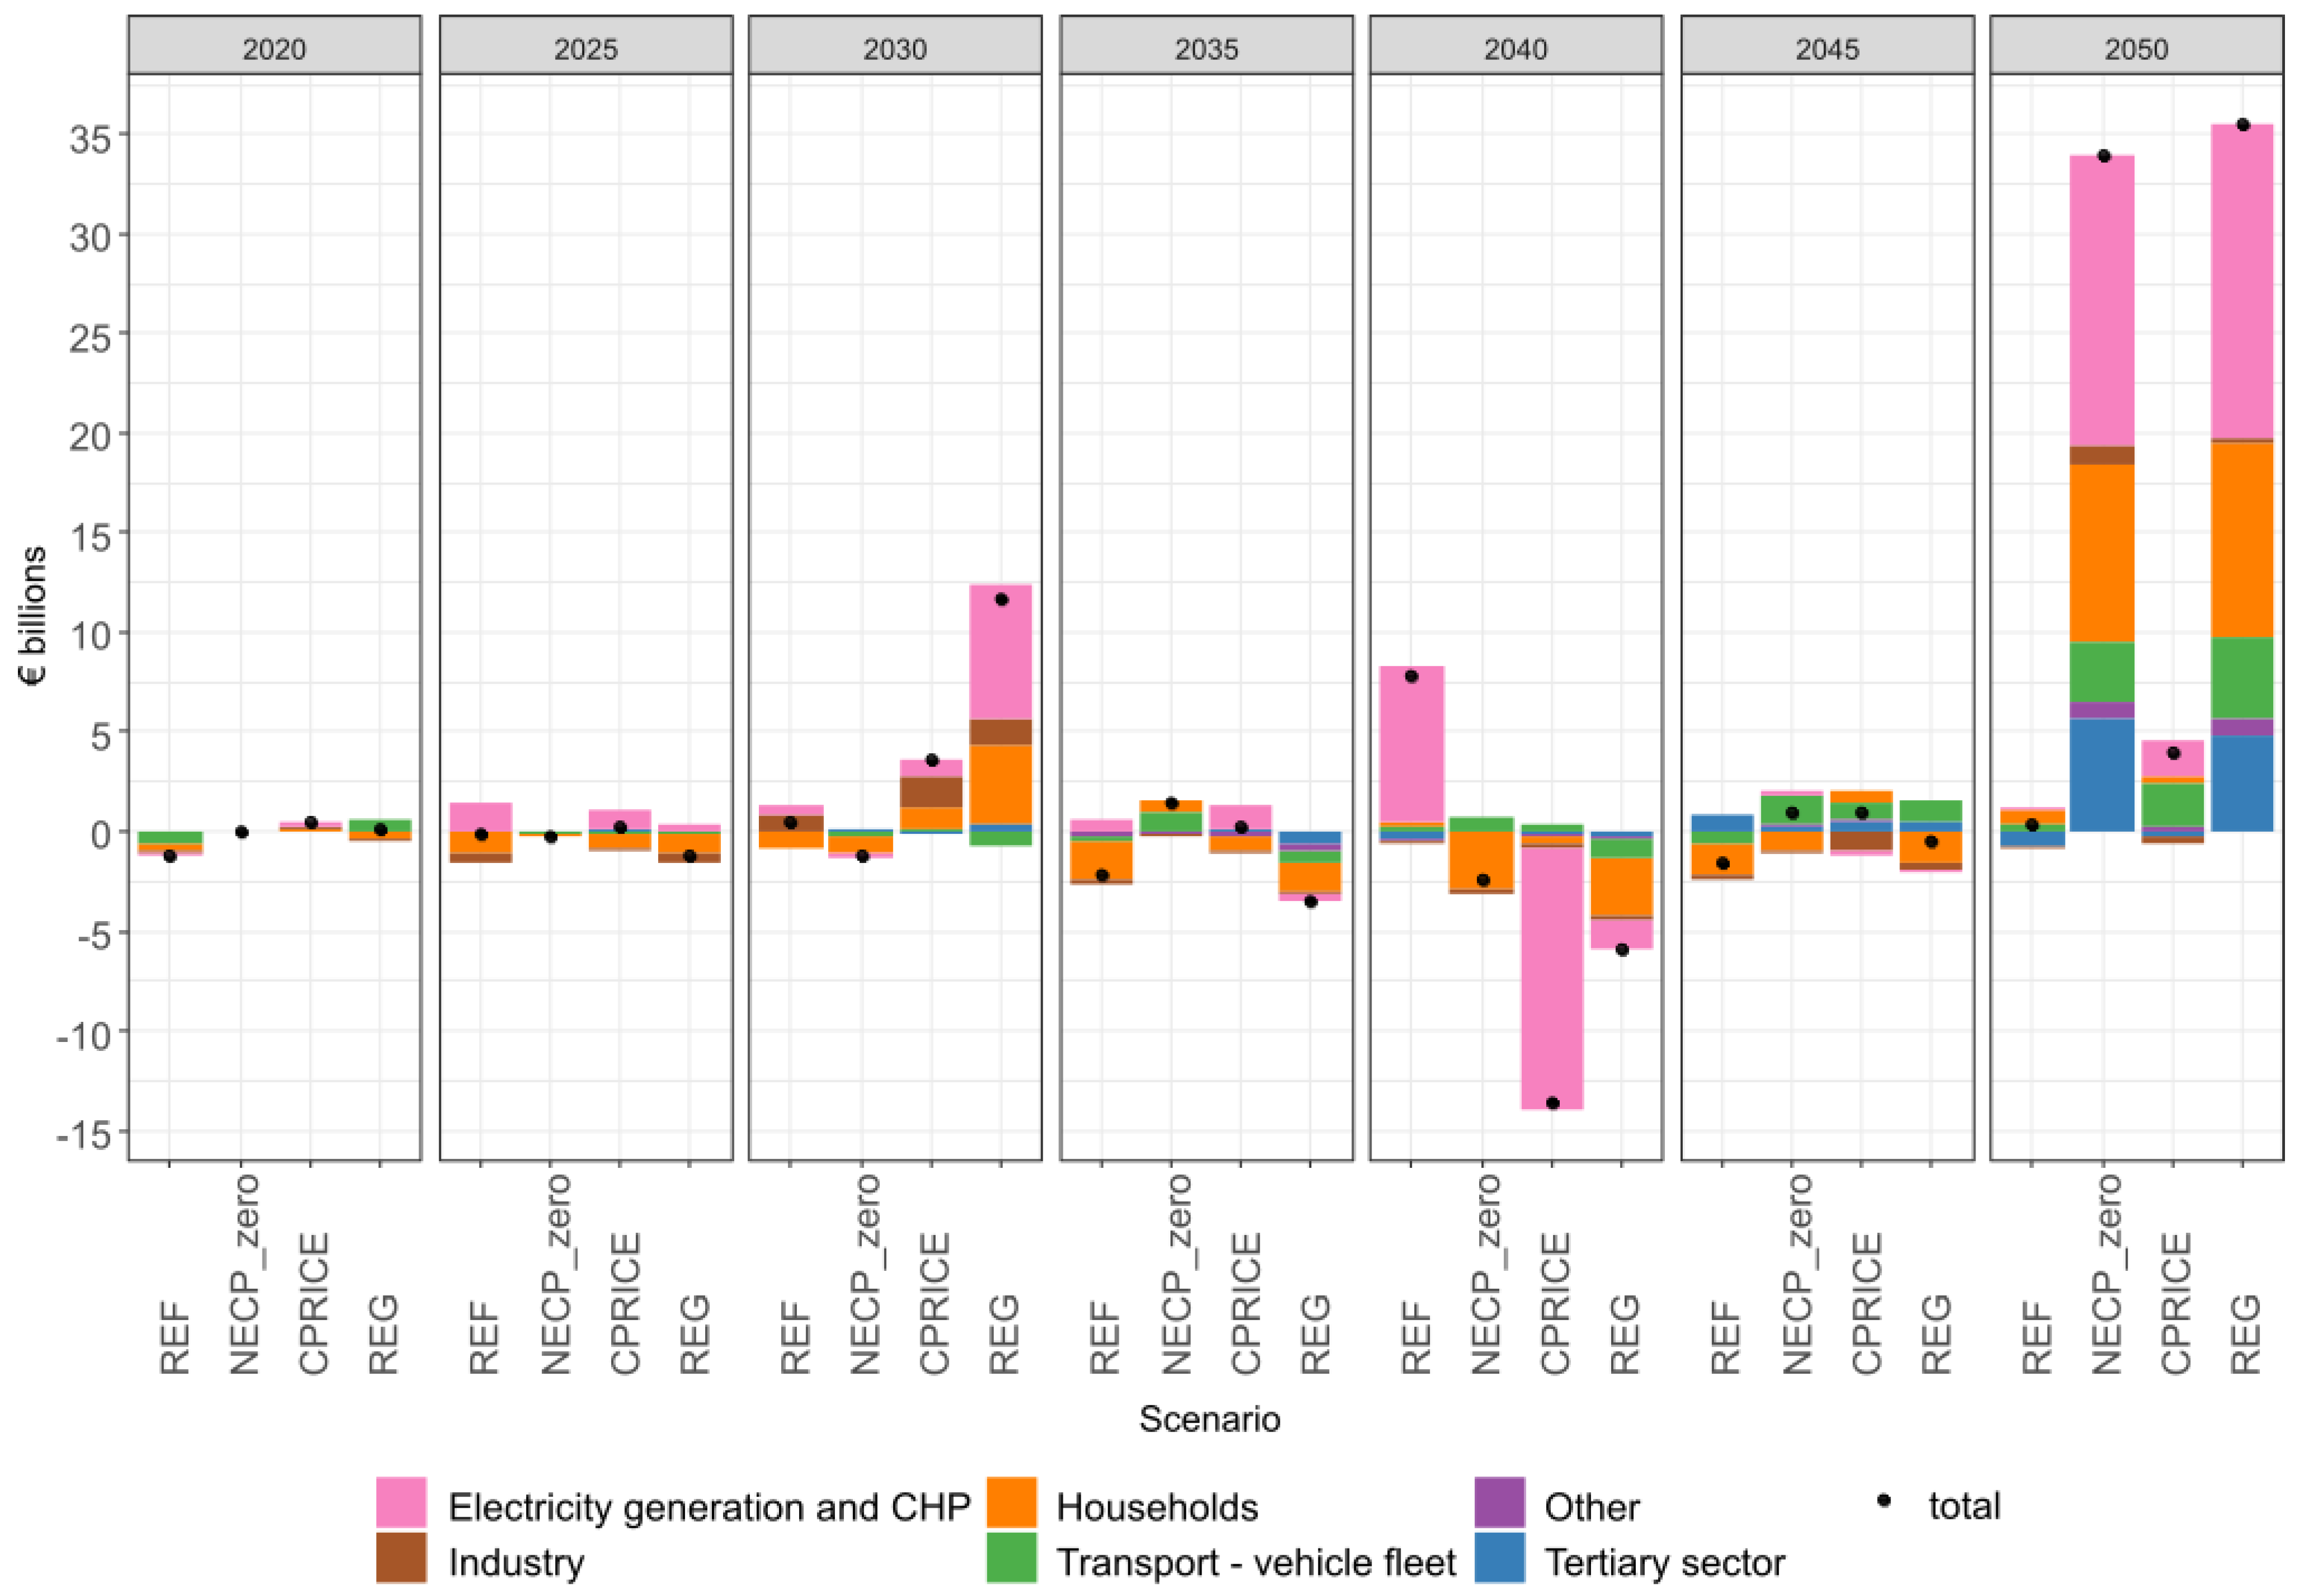
Figure 10.
Investment cost - heat and power generation, (sum over 5-year period, €2020, without VAT).
Figure 10.
Investment cost - heat and power generation, (sum over 5-year period, €2020, without VAT).
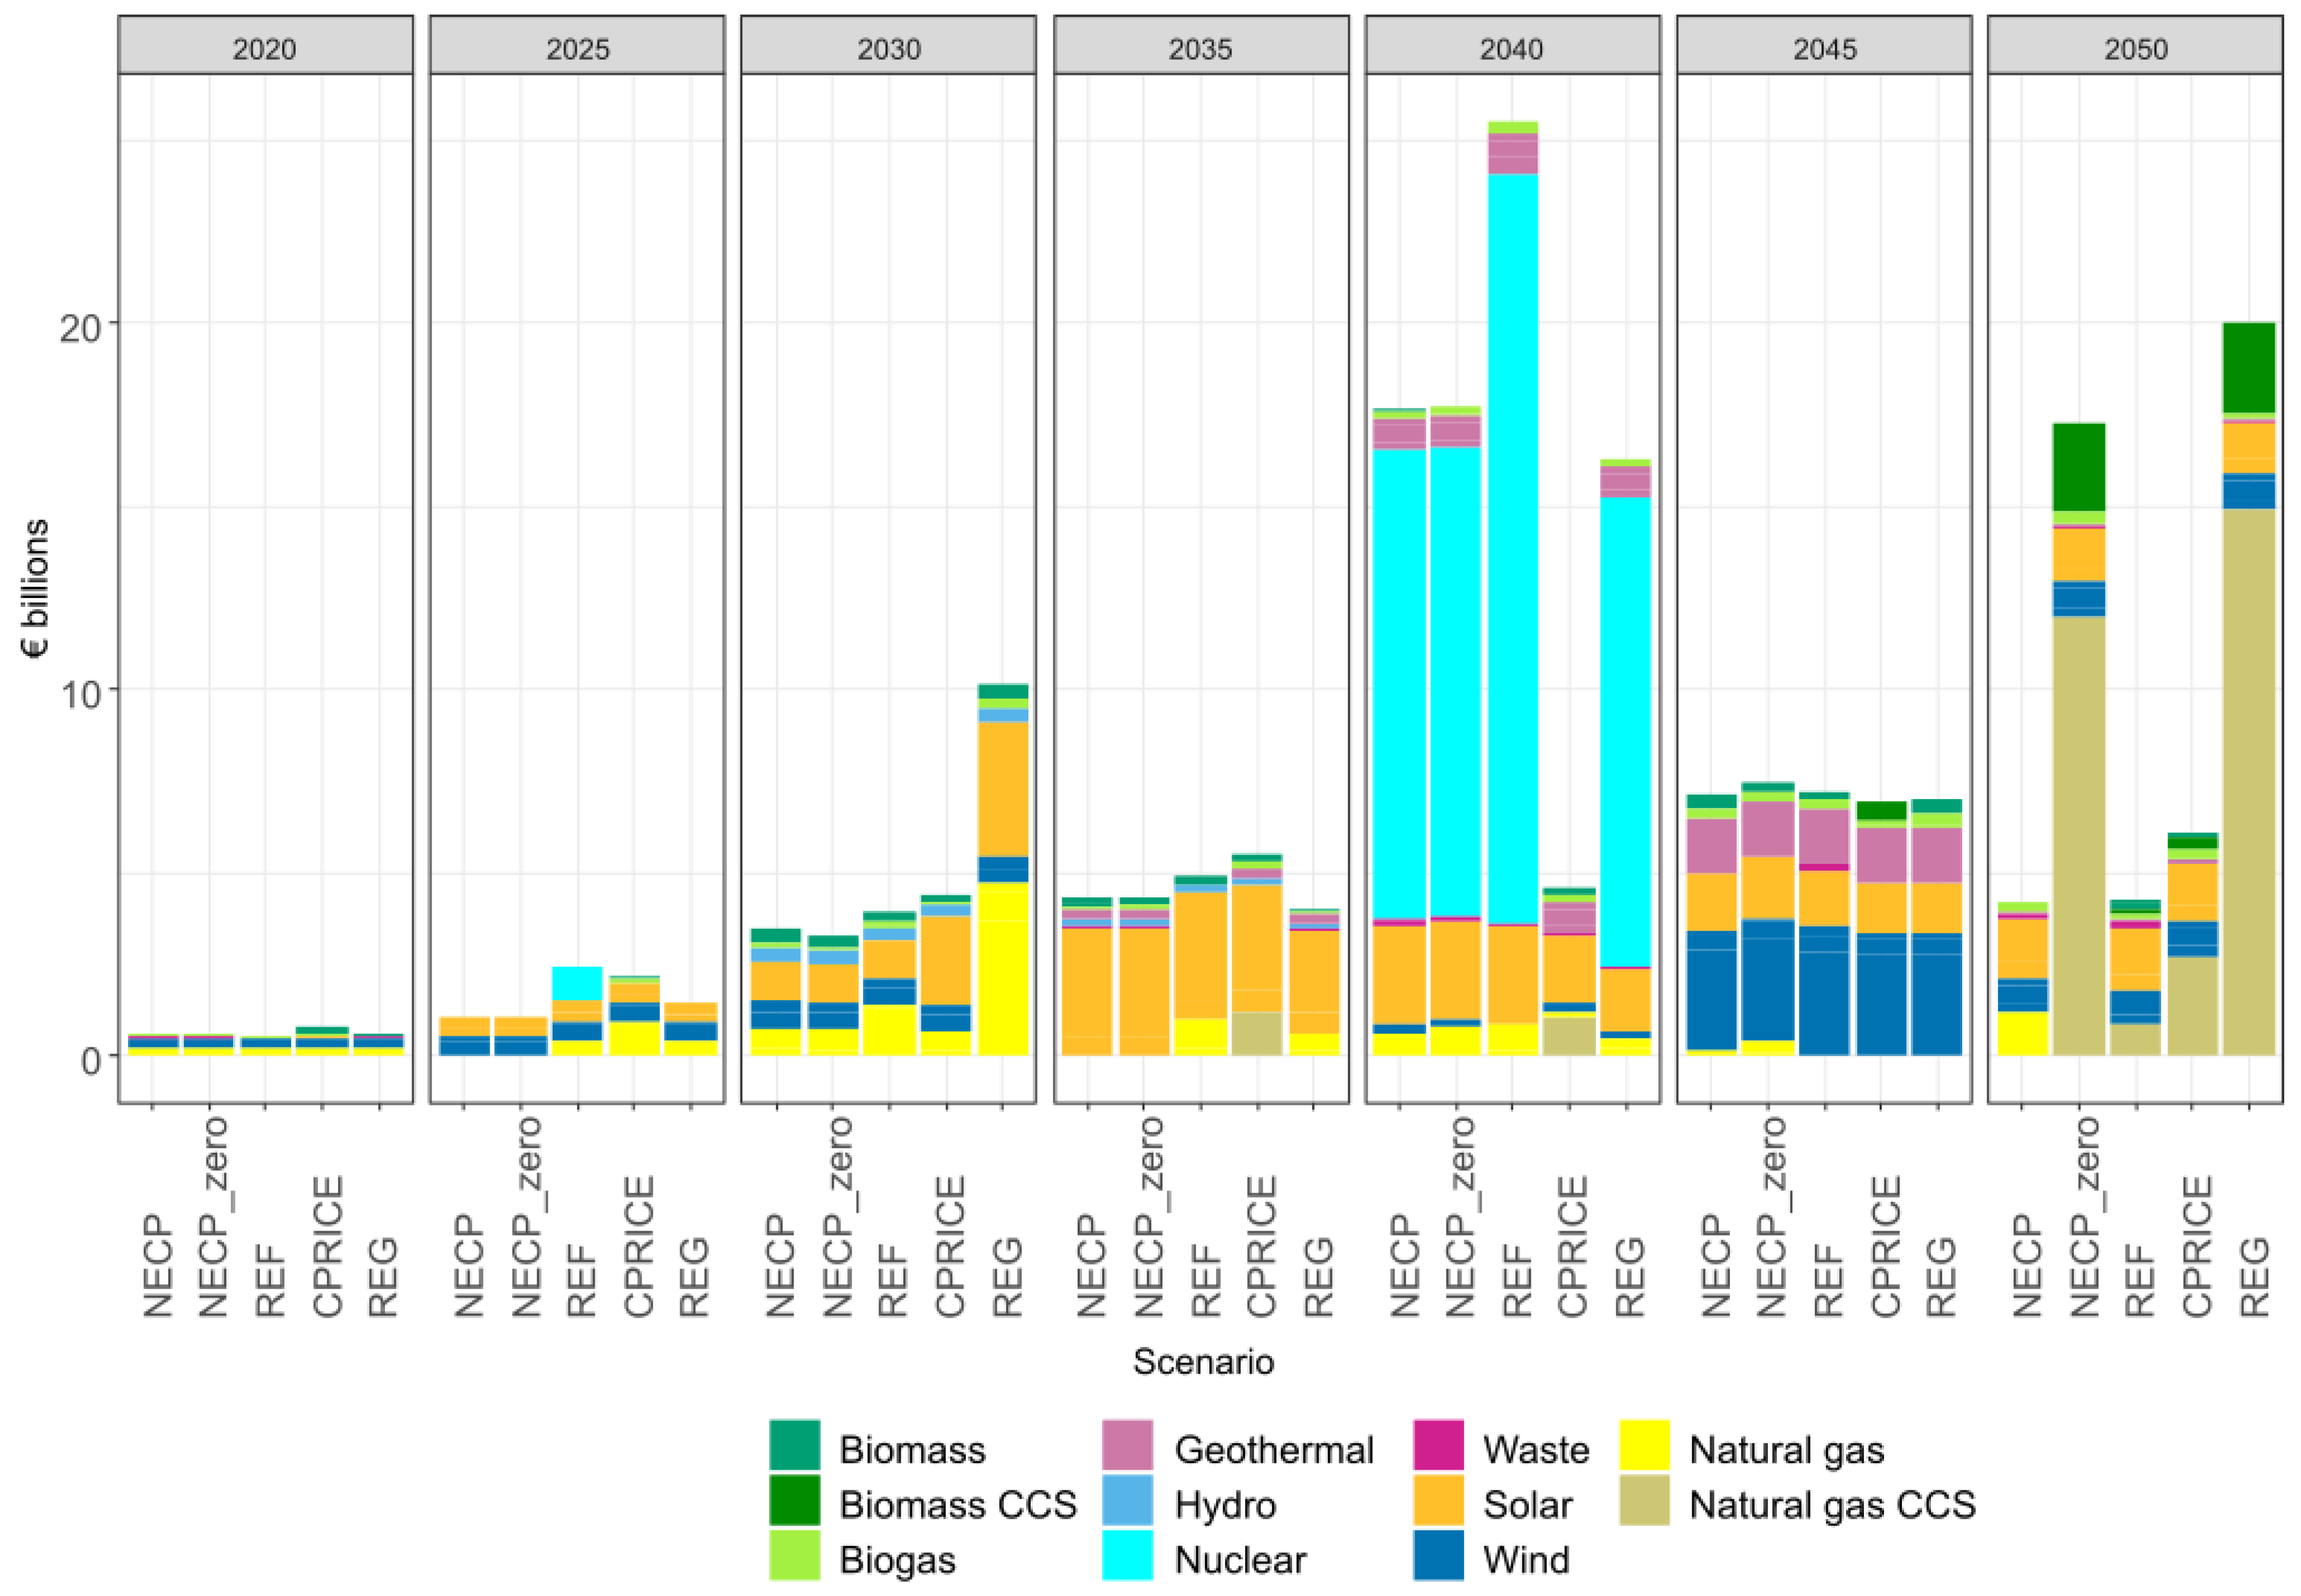
Figure 11.
Annualized system cost (€2020, without VAT).
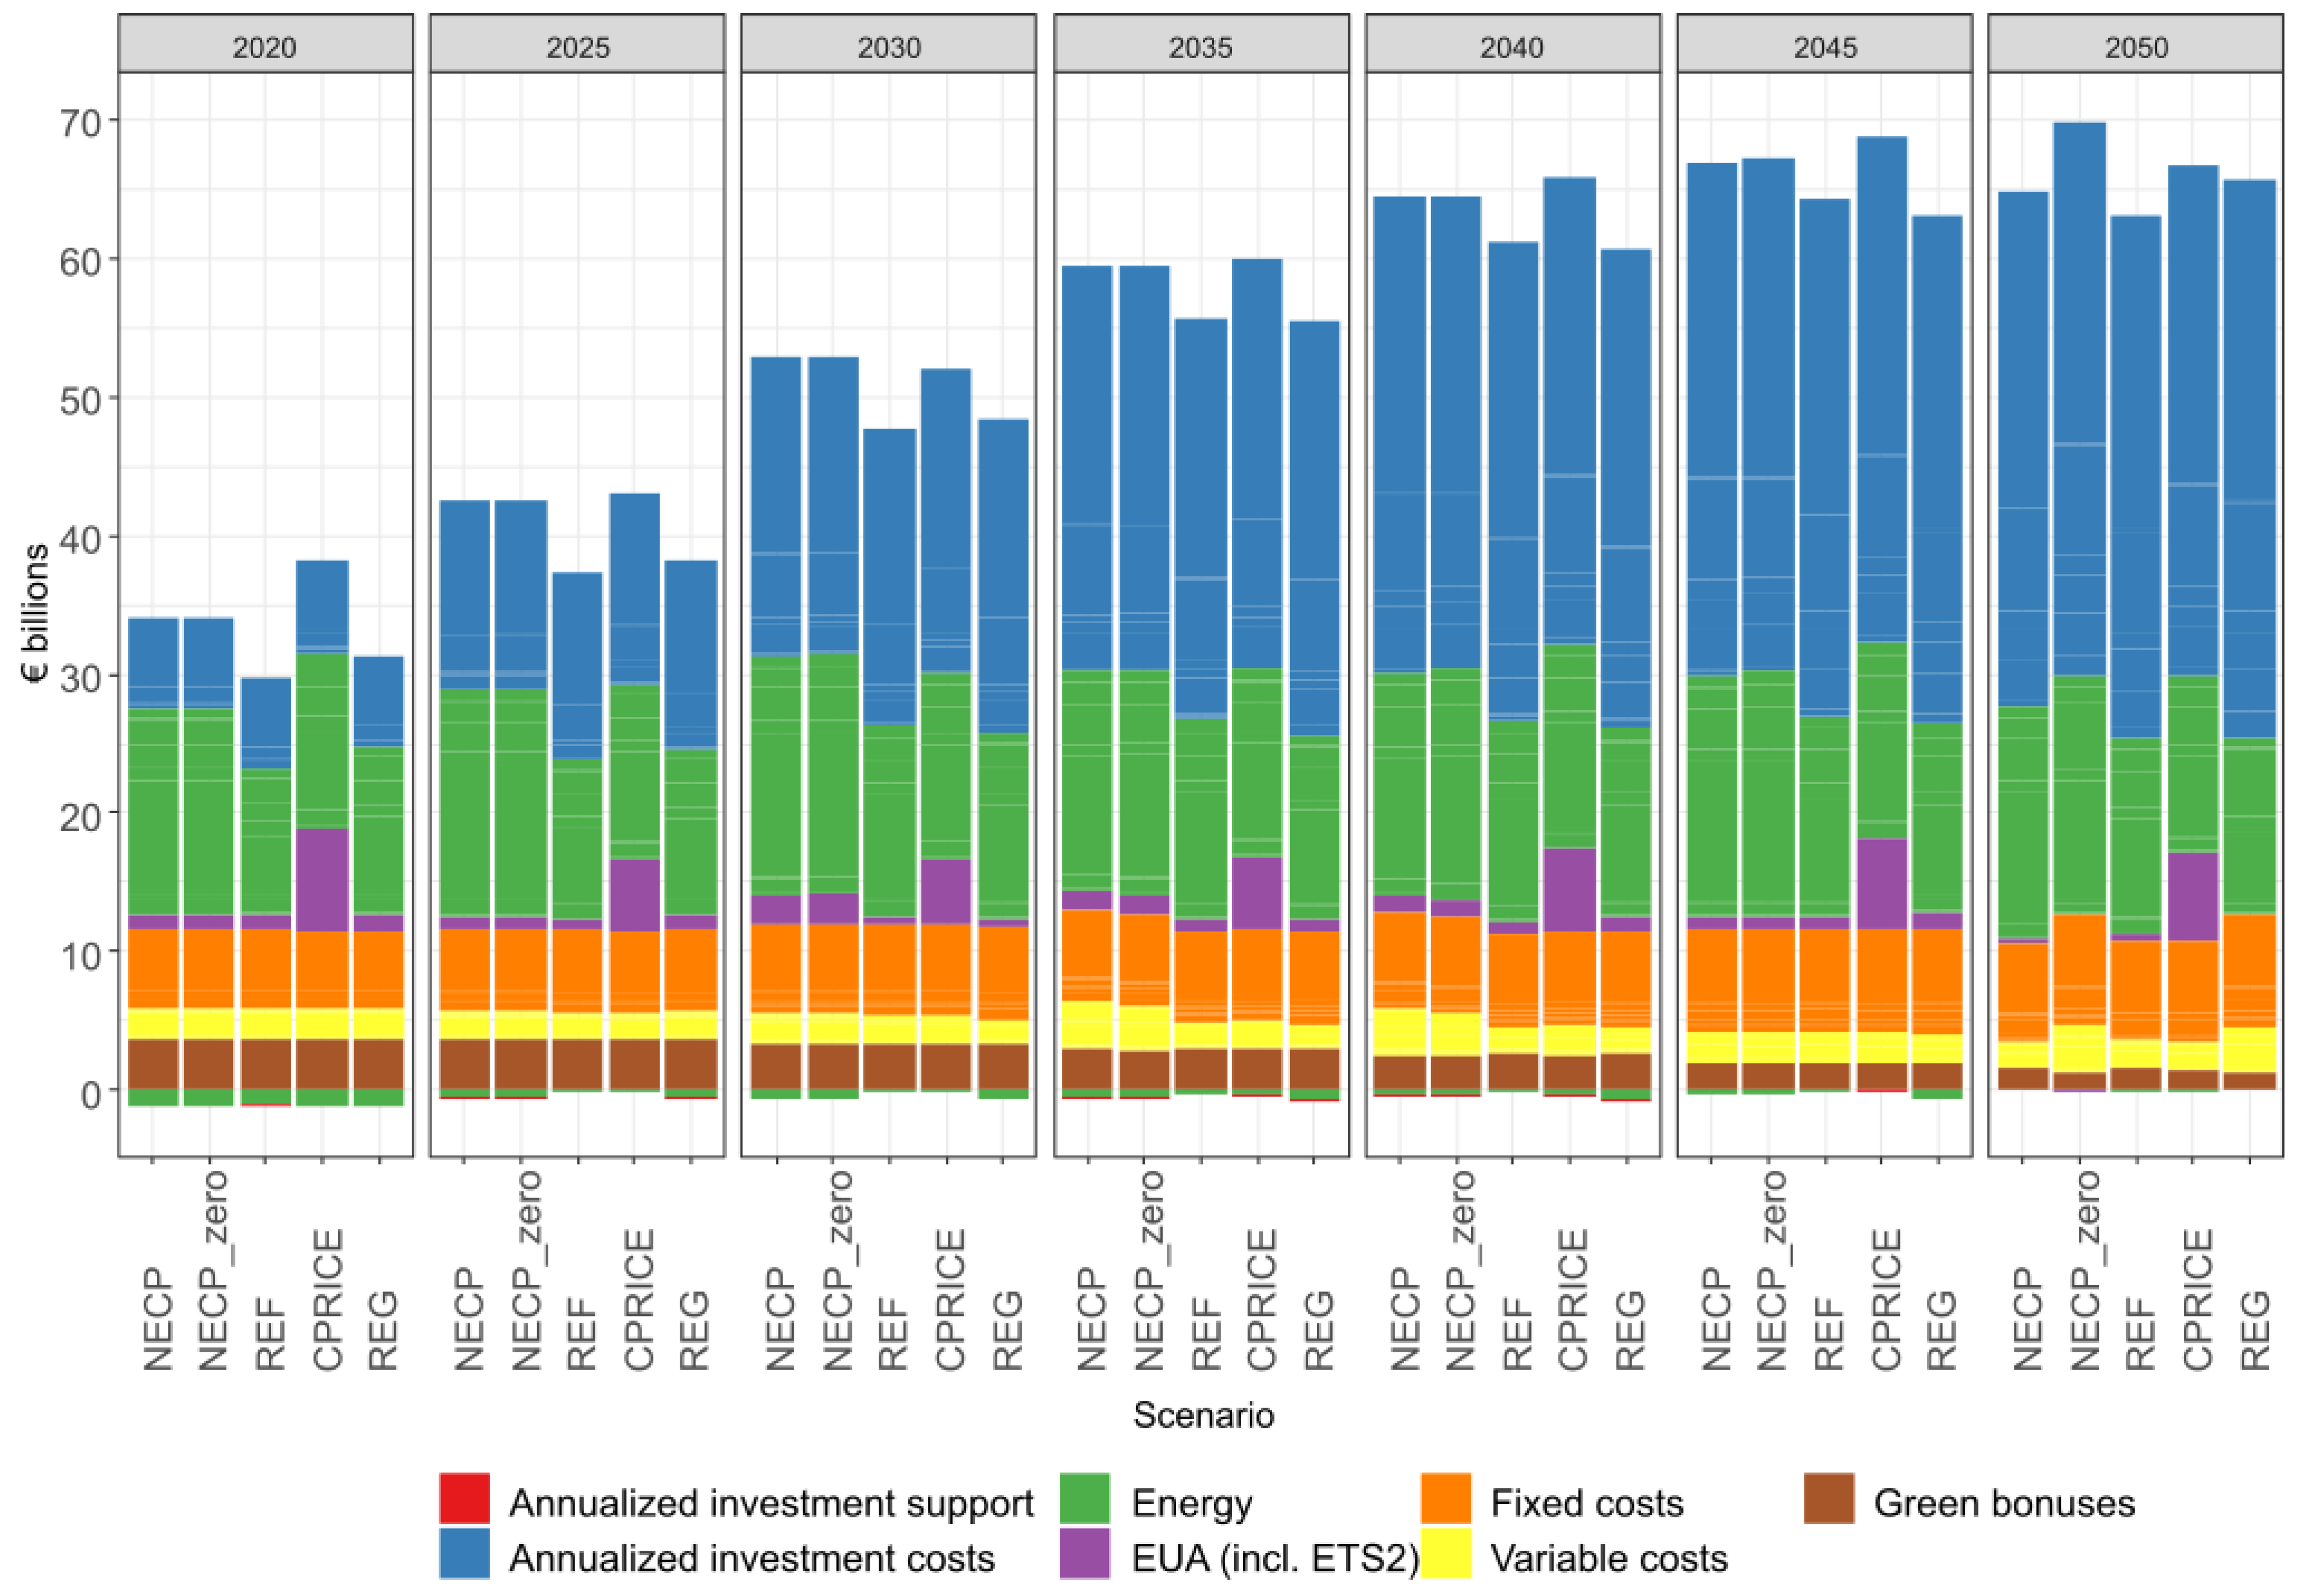
Figure 12.
Annualized system cost - difference from NECP.
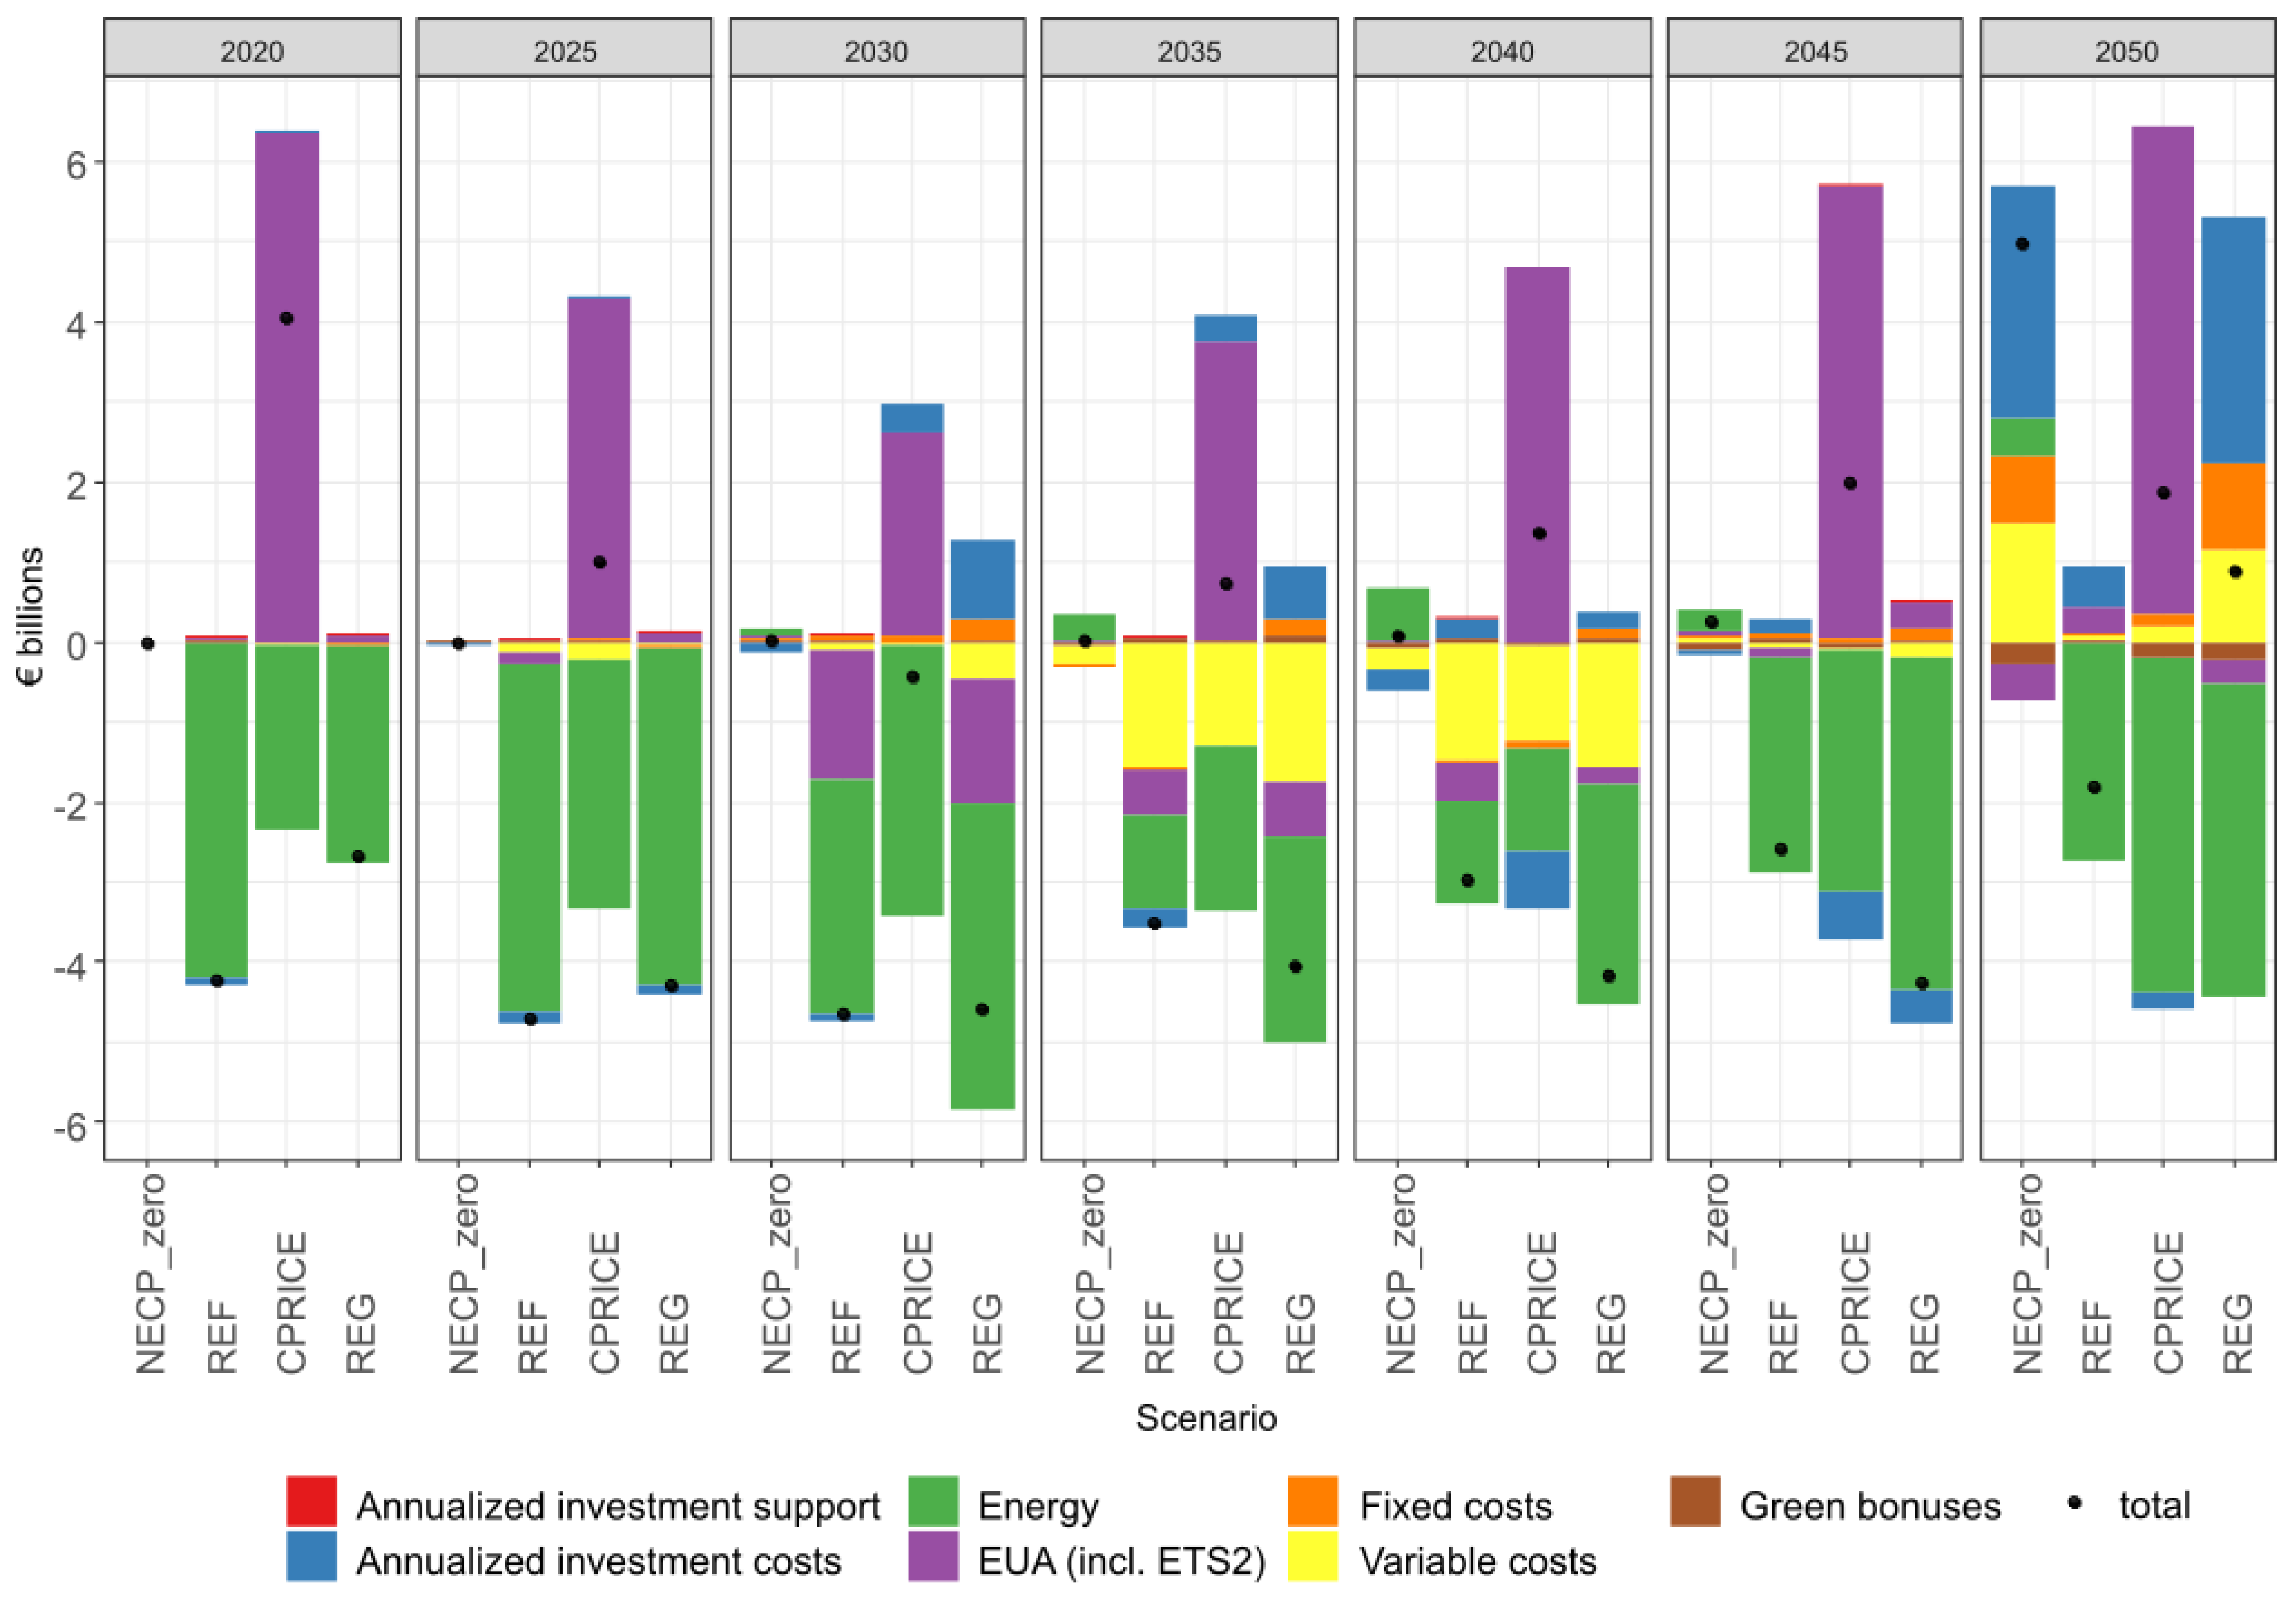

Table 1.
Estimated investment cost of PV and wind turbines [€2015/kWp].
| 2020 | 2025 | 2030 | 2035 | 2040 | 2045 | 2050 | |
|---|---|---|---|---|---|---|---|
| PV residential | 1398 | 1176 | 1103 | 915 | 760 | 630 | 523 |
| PV large | 770 | 649 | 601 | 499 | 414 | 343 | 285 |
| PV industrial | 1015 | 852 | 793 | 658 | 546 | 453 | 376 |
| Wind turbine | 1917 | 1864 | 1812 | 1776 | 1208 | 1196 | 1184 |
Source: Alliance for Energy Self-Reliance, own adaptations based on https://www.pv-magazine.com/module-price-index/ and IEA World Energy Outlook - World Energy Model 2020 [25].
Table 2.
Exogenous assumptions on the evolution of GHG emissions from agriculture, waste, and F-gas, and LULUCF [kt CO2ek].
Table 2.
Exogenous assumptions on the evolution of GHG emissions from agriculture, waste, and F-gas, and LULUCF [kt CO2ek].
| 2015 | 2020 | 2025 | 2030 | 2035 | 2040 | 2045 | 2050 | |
|---|---|---|---|---|---|---|---|---|
| Agriculture | 8483 | 8639 | 9124 | 9682 | 9899 | 9899 | 9899 | 9899 |
| Waste and F-gases | 8837 | 9557 | 9255 | 7181 | 4774 | 3230 | 2119 | 1605 |
| LULUCF | -6641 | 17823 | 6127 | 2315 | -4366 | -6880 | -6454 | -6105 |
Note: GHG emissions from agriculture are taken from the emission projection by Czech Hydrometeorological Institute [26], assuming a constant level from 2040 onwards. This assumption on GHG emissions from agriculture is very conservative. The EC REF2020 scenario [18] and many studies (e.g. [4,27]) assume that the number of livestock and thus GHG emissions will be reduced by about half by 2050 due to lifestyle changes and better farming practices. Assumptions of GHG emissions from waste and of F-gases combine historical values from emission inventories [28] and their trends from the EC REF2020 scenario. The GHG emissions from the LULUCF sector and forest biomass potentials are taken from the Red scenario projection of the Forests-ADAPT project [29].
Table 3.
Net electricity imports [TWh].
| Reference | 2020 | 2025 | 2030 | 2035 | 2040 | 2045 | 2050 |
|---|---|---|---|---|---|---|---|
| National Plan [17] | -10.2 * | -8.4 | -8.4 | -7.4 | -4.6 | -2.9 | 0.0 |
| EC REF2020 | -10.2 * | -1.1 | 8.1 | 2.2 | -1.6 | -1.8 | -1.6 |
Note: * The value for 2020 is adjusted according to the Annual Report on Electricity System Operation for 2020 [30].
Table 4.
EUA emission allowance price [€ 2020/ t CO2].
| Scenarios | 2020 | 2025 | 2030 | 2035 | 2040 | 2045 | 2050 | Reference | |
|---|---|---|---|---|---|---|---|---|---|
| REF | 26.6 | 28 | 32 | 53 | 85 | 127 | 159 | EC REF2020 | |
| REG | 24.8 | 29 | 34 | 55 | 87 | 129 | 161 | EC REG, REF2020 | |
| NECP, NECP_zero | 24.8 | 24 | 36 | 45 | 53 | 60 | 70 | NECP 2019 | |
| CPRICE, NECP_C | 24.8 | 55 | 64 | 83 | 115 | 157 | 189 | EC CPRICE, REF2020 | |
| Sensitivity Analysis (SA) | 90 | 24.8 | 70 | 90 | 90 | 90 | 90 | 90 | |
| 140 | 24.8 | 70 | 90 | 100 | 110 | 120 | 140 | ||
| 200 | 24.8 | 80 | 120 | 145 | 170 | 185 | 200 | WEO 2021 (APS, SDS) | |
| 250 | 24.8 | 90 | 130 | 165 | 205 | 230 | 250 | WEO 2021 (NZE) |
Note: APS - announced pledges scenario, NZE - net zero scenario, SDS - sustainable development scenario.
Table 5.
Fossil fuel prices [€ 2020/ PJ].
| Scenarios | 2020 | 2025 | 2030 | 2035 | 2040 | 2045 | 2050 | Reference | |
|---|---|---|---|---|---|---|---|---|---|
| NECP NECP_zero | Oil | 11.2 | 14.8 | 16.3 | 17.0 | 18.0 | 18.8 | 19.8 | NECP 2019 |
| Natural gas (NCV) | 7.9 | 10.1 | 11.0 | 11.7 | 12.1 | 12.7 | 13.2 | ||
| Black coal | 2.7 | 3.0 | 3.6 | 3.8 | 3.9 | 4.1 | 4.3 | ||
| CPRICE REG | Oil | 7.3 | 8.0 | 10.0 | 9.3 | 9.3 | 10.0 | 8.6 | CTP2030 |
| Natural gas (NCV) | 4.4 | 4.9 | 5.1 | 5.3 | 6.0 | 6.0 | 5.6 | ||
| Black coal | 2.3 | 2.5 | 2.6 | 2.7 | 2.7 | 2.7 | 2.7 | ||
| REF | Oil | 5.3 | 8.0 | 10.6 | 12.0 | 12.9 | 14.0 | 15.7 | REF2020 |
| Natural gas (NCV) | 2.6 | 4.0 | 5.3 | 5.9 | 6.9 | 7.4 | 7.6 | ||
| Black coal | 1.2 | 1.8 | 2.3 | 2.5 | 2.7 | 2.8 | 2.9 | ||
| SA_200 | Oil | 5.2 | 4.9 | 4.5 | 4.1 | 3.8 | 3.4 | 3.0 | WEO SDS |
| Natural gas (NCV) | 3.2 | 3.2 | 3.2 | 3.3 | 3.4 | 3.4 | 3.4 | ||
| Black coal | 1.4 | 1.5 | 1.6 | 1.6 | 1.6 | 1.6 | 1.5 | ||
| SA_250 | Oil | 5.2 | 4.9 | 4.5 | 4.1 | 3.8 | 3.4 | 3.0 | WEO NZE |
| Natural gas (NCV) | 3.2 | 3.1 | 2.9 | 2.9 | 2.9 | 2.8 | 2.7 | ||
| Black coal | 1.4 | 1.4 | 1.4 | 1.4 | 1.3 | 1.2 | 1.2 |
Table 6.
GHG emission savings compared to 1990 and 2005 levels.
| 2020 | 2025 | 2030 | 2035 | 2040 | 2045 | 2050 | ||
|---|---|---|---|---|---|---|---|---|
| NECP_zero | Total GHG incl. LULUCF (savings vs. 1990) | 34% | 44% | 53% | 57% | 65% | 75% | 93% |
| non-ETS without LULUCF (saving vs. 2005) | 17% | 19% | 22% | 27% | 29% | 40% | 75% | |
| CPRICE | Total GHG incl. LULUCF (saving vs. 1990) | 38% | 59% | 66% | 73% | 78% | 82% | 86% |
| non-ETS without LULUCF (saving vs. 2005) | 17% | 17% | 21% | 28% | 34% | 45% | 55% | |
| NECP | Total GHG incl. LULUCF (savings vs. 1990) | 34% | 44% | 53% | 57% | 65% | 74% | 81% |
| non-ETS without LULUCF (saving vs. 2005) | 17% | 19% | 22% | 27% | 29% | 39% | 45% | |
| REF | Total GHG incl. LULUCF (savings vs. 1990) | 34% | 49% | 64% | 65% | 73% | 79% | 81% |
| non-ETS without LULUCF (saving vs. 2005) | 16% | 15% | 19% | 20% | 26% | 36% | 43% | |
| REG | Total GHG incl. LULUCF (savings vs. 1990) | 34% | 45% | 62% | 68% | 73% | 78% | 93% |
| non-ETS without LULUCF (saving vs. 2005) | 17% | 17% | 15% | 20% | 24% | 33% | 75% |
Table 7.
GHG emission savings in EC REF2020 and comparison of the scenarios of this study with EC REF2020.
Table 7.
GHG emission savings in EC REF2020 and comparison of the scenarios of this study with EC REF2020.
| 2020 | 2025 | 2030 | 2035 | 2040 | 2045 | 2050 | ||
|---|---|---|---|---|---|---|---|---|
| REF2020 | ETS [kt CO2ek] | 56978 | 44305 | 35350 | 34767 | 25233 | 21767 | 22753 |
| non-ETS [kt CO2ek] | 55371 | 55236 | 49338 | 45043 | 41151 | 39823 | 38780 | |
| Total GHG without LULUCF [kt CO2ek] | 112349 | 99541 | 84688 | 79810 | 66384 | 61590 | 61533 | |
| LULUCF (REF2020) Globiom/G4M [kt CO2ek] | 4.6 | -4.9 | 1.6 | -4.1 | 4.5 | -2.4 | 5.1 | |
| Savings - Total GHG incl. LULUCF (1990 level) | 42% | 49% | 56% | 59% | 66% | 68% | 68% | |
| Savings - non-ETS without LULUCF (2005 level) | 16% | 16% | 25% | 32% | 38% | 40% | 41% | |
| Difference in GHG emissions compared to REF2020 scenario | ||||||||
| NECP_zero | Total GHG incl. LULUCF | 14% | 8% | 8% | 5% | 2% | -20% | -78% |
| non-ETS without LULUCF | -1% | -3% | 5% | 7% | 14% | 0% | -58% | |
| CPRICE | Total GHG incl. LULUCF | 7% | -20% | -22% | -34% | -37% | -45% | -56% |
| non-ETS without LULUCF | -1% | -1% | 5% | 6% | 6% | -9% | -23% | |
| NECP | Total GHG incl. LULUCF | 14% | 8% | 8% | 5% | 2% | -19% | -41% |
| non-ETS without LULUCF | -1% | -3% | 4% | 7% | 13% | 0% | -7% | |
| REF | Total GHG incl. LULUCF | 13% | -1% | -17% | -14% | -20% | -32% | -41% |
| non-ETS without LULUCF | 0% | 2% | 8% | 17% | 19% | 6% | -2% | |
| REG | Total GHG incl. LULUCF | 14% | 6% | -13% | -22% | -21% | -32% | -78% |
| non-ETS without LULUCF | -1% | -1% | 14% | 18% | 22% | 10% | -57% | |
Note: REF2020 scenario results from the July 2021 PRIMES model [18].
Table 8.
Share of renewable energy sources in final energy consumption (RES) and electricity generation (RES-E) [%].
Table 8.
Share of renewable energy sources in final energy consumption (RES) and electricity generation (RES-E) [%].
| 2015 | 2020 | 2025 | 2030 | 2035 | 2040 | 2045 | 2050 | ||
|---|---|---|---|---|---|---|---|---|---|
| RES | NECP_zero | 15.5 | 16.8 | 18.8 | 23.7 | 27.5 | 29.9 | 35.4 | 48.6 |
| CPRICE | 15.5 | 17.2 | 18.7 | 24.1 | 27.7 | 32.4 | 37.3 | 41.1 | |
| NECP | 15.5 | 16.8 | 18.7 | 24.2 | 27.3 | 31.1 | 36.1 | 40.6 | |
| REF | 15.5 | 15.7 | 16.1 | 21.3 | 21.9 | 27.7 | 34.1 | 38.9 | |
| REG | 15.5 | 16.3 | 16.7 | 25.2 | 27.6 | 29.5 | 33.1 | 47 | |
| RES-E | NECP_zero | 14.1 | 14.1 | 16.6 | 23.4 | 26.2 | 30.8 | 40.4 | 41.5 |
| CPRICE | 14.1 | 15.7 | 17.6 | 26 | 28.8 | 32.8 | 40.4 | 45.2 | |
| NECP | 14.1 | 14.0 | 16.6 | 24 | 26.4 | 31.4 | 41.3 | 46.6 | |
| REF | 14.1 | 13.7 | 16 | 22.6 | 25.9 | 31.5 | 40.3 | 45.9 | |
| REG | 14.1 | 13.8 | 16.2 | 31.6 | 32.9 | 34.9 | 42.2 | 38.2 |
Note: Share of renewables according to the Eurostat’s SHARES methodology 2020 manual. Share of RES in electricity generation (RES-E) calibrated to 2015 baseline. The calculation of the share of renewables in final consumption does not fully include self-consumption for electricity and heat production, which causes an overestimation of the RES value by about 0.5 percentage points compared to the RES share in gross final consumption according to SHARES 2020 manual. However, this overestimation decreases as the share of RES in electricity and heat production increases.
Table 9.
Variants of the EUA price in the sensitivity analysis [€ 2020/ t CO2].
| Scenarios | 2020 | 2025 | 2030 | 2035 | 2040 | 2045 | 2050 | Reference | |
| NKEP | 24.8 | 24 | 36 | 45 | 53 | 60 | 70 | NECP 2019 | |
| CPRICE, NKEP_C | 24.8 | 55 | 64 | 83 | 115 | 157 | 189 | EC CPRICE, REF2020 | |
| Sensitivity Analysis (SA) | _090 | 24.8 | 70 | 90 | 90 | 90 | 90 | 90 | |
| _140 | 24.8 | 70 | 90 | 100 | 110 | 120 | 140 | ||
| _200 | 24.8 | 80 | 120 | 145 | 170 | 185 | 200 | WEO 2021 (APS,SDS) | |
| _250 | 24.8 | 90 | 130 | 165 | 205 | 230 | 250 | WEO 2021 (NZE) |
Note: APS - announced pledges scenario, NZE - net zero scenario, SDS - sustainable development scenario.
Table 10.
Assumed nuclear power development options in the sensitivity analysis.
| Option | Description | Note | Scenarios |
|---|---|---|---|
| REG | Dukovany NPP extension/replacement | From 2030 constant nuclear electricity generation at 29.6 TWh gross (net = 27.9 TWh) | REG |
| REG_c | Dukovany NPP until 2036, 1200 MW 2045 and 1200 MW 2050 | CA | |
| REG_d | Dukovany NPP until 2045, 1200 MW 2040 and 1200 MW 2045 | ||
| REG_o | Dukovany NPP until 2036, new units according to model optimization |
Disclaimer/Publisher’s Note: The statements, opinions and data contained in all publications are solely those of the individual author(s) and contributor(s) and not of MDPI and/or the editor(s). MDPI and/or the editor(s) disclaim responsibility for any injury to people or property resulting from any ideas, methods, instructions or products referred to in the content. |
© 2023 by the authors. Licensee MDPI, Basel, Switzerland. This article is an open access article distributed under the terms and conditions of the Creative Commons Attribution (CC BY) license (http://creativecommons.org/licenses/by/4.0/).
Copyright: This open access article is published under a Creative Commons CC BY 4.0 license, which permit the free download, distribution, and reuse, provided that the author and preprint are cited in any reuse.


