
Submitted:
28 July 2023
Posted:
31 July 2023
You are already at the latest version
Abstract
Iron is an essential micronutrient for Citrus, playing an important role in photosynthesis and yield. The aim of this paper is to evaluate the tolerance to Fe deficiency of five Citrus rootstocks: sour orange (S), Carrizo citrange (C), Citrus macrophylla (M), Troyer citrange (T) and Volkamer lemon (V). Plants were grown for 5 weeks in nutrient solution that contained the following Fe concentrations (in µM): 0, 5, 10, 15 and 20. At the end of the experiment, biomass (dry weight), leaf area, total leaf chlorophyll (CHL) and the activity of root chelate activity (FCR) were registered. Additionally, the mineral composition of roots (R) and shoots (S) was evaluated. Principal Component Analysis was used to study the relationships between all parameters and, subsequently, the relations between rootstocks. In the first component, N-S, P-S, Ca-S, Cu-S, Zn-S, Mn-S and Zn-R and Mn-R concentrations were related to leaf CHL and FCR. Increases in leaf CHL, Mg-R, DW (shoots and roots) were inversely related to Cu-R, which was shown in the second component. The values obtained were consistent for V10, C15, and C20, but in contrast for S0 and S5. Overall, the Fe/Cu ratio was significantly related to CHL, which may be used to assist rootstock performance.
Keywords:
Fe-chlorosis
; ferric-chelate reductase
; mineral composition
1. Introduction
Plants have different adaptation responses to nutrient depletion such as improvement of root nutrient uptake, reallocation of nutrients to priority organs and modulation of cellular physiology [1].
Iron (Fe) deficiency is the most common micronutrient deficiency that predominantly occurs in calcareous soils. In the Mediterranean basin it has been estimated that 20-50% of fruit orchards have Fe chlorosis [2], which causes reduced yield and quality [3]. Symptoms always start on young leaves with an interveinal chlorosis, where the veins remain greener than the rest of the leaf [4].
When faced with Fe deficiency, plants can be grouped into two strategies, according to their induced Fe uptake mechanisms[5]:Strategy I, considered the reduction-based strategy, typical of non-Poaceae species, and Strategy II or complexing strategy characterized by the formation of soluble Fe(III) complexes which are then taken up by roots. The latter is found exclusively in monocotyledonous plants of Poaceae family. Furthermore, rice (Oryza sativa L.) plants employ a combined Strategy, composed by all features of Strategy II, and some features of Strategy I [6]. Recently, a new approach indicated that the boundaries between these strategies are not so well defined, since dicotyledons can also exudate complex Fe compounds [7] and grasses can have the ability to reduce Fe [8].
Citrus, like the other dicots, are included in Strategy I group, which comprised several steps to increase Fe uptake into roots, such as proton extrusion, secretion of chelators, enhanced of Fe(III) reduction and increased activity of Fe transporters in the root plasmalemma [4]. These steps occur through an increase in rhizosphere acidification (H+-ATPase) and in the activity of ferric chelate-reductases (FCR) and, consequently, in the uptake of Fe2+ through the root cell membranes, mediated by IRT1, a specific regulated Fe transporter [9,10]. After the uptake into rhizodermal cells, Fe moves across the cortical cells towards the xylem vessels in a chelated form [11]. Once in the leaves, Fe is essential in several metabolic processes such as photosynthesis, respiration, N2 fixation, and nitrate reduction [12].
Iron homeostasis is controlled not only by root Fe availability but also by leaves that under chlorosis are able to send signals to the roots to induce the reactions described above [10].
Rootstocks/scion combinations determine tree size, yield, and fruit quality parameters and may be used to enhance tolerance to specific abiotic stress. Citrus resistance to Fe deficiency is primarily determined by the rootstock and its ability to trigger physiological, biochemical, and morphological mechanisms at root level (for a review see [4,10].
The number of rootstocks that combine tolerance to Fe deficiency with resistance to biotic stress, such as Tristeza virus or Phytophthora spp., is still scarce but there is a large pool of work on the response of Citrus rootstocks to several abiotic and nutritional stress [13,14,15,16]. In this regard, Martínez-Cuenca et al. [13] compared Carrizo citrange (Fe chlorosis sensitive) and Cleopatra mandarin (Fe tolerant) and concluded that the later accumulated more Fe in the root apoplast.
In a recent review by Alfaro et al. [17] it was concluded that citrus rootstocks influence the quality of citrus fruits, however few studies have focused on the assimilation of nutrients by rootstocks and on the corresponding translocation of nutrients through the rootstock/cultivar union. More recently, it was demonstrated the particular importance of Fe in Citrus, since as the application of Fe(II) could restore the growth of trees affected by Citrus greening or Huanglongbing (HLB), one of the most serious Citrus diseases in the world [18].
In our previous work, five citrus rootstocks were classified according to their resistance to Fe deficiency [19]. This approach was based on the number of days that each plant material was able to grow under low Fe concentrations in the nutrient solution before the leaf chlorophyll (CHL) concentration decreased to 50 %. Under the experimental conditions of the study, Sour orange and Volkamer lemon were able to cope with low Fe for a longer period and were classified as tolerant to Fe deficiency.
Iron deficiency affects multiple metabolic pathways, including nutrient uptake and transport to the leaves, which lead to unbalanced mineral composition in different organs. Several studies (for example [4,20,21,22]) were done to access the effect of Fe chlorosis on the nutritional patterns in Citrus, but in some cases the results were inconsistent, since nutritional requirements are highly variable.
The aim of this work is to compare the Fe use of five citrus rootstocks (Troyer citrange (Citrus sinensis (L.) Osb. x Poncirus trifoliata (L.) Raf.), Carrizo citrange, Volkamer lemon (C. volkameriana Ten. & Pasq.), alemow (C. macrophylla Wester) and sour orange (C. aurantium) when grown under different Fe levels and to establish the impact of Fe chlorosis on nutritional composition of shoots and roots. It is expectable that this work reveals some trends on the ability of Citrus rootstocks to cope with Fe deficiency.
2. Results
At the beginning of the experiment, values of leaf CHL (Table S1), ranged between 349.9 ± 78.0 µmol m-2 (Sour orange) and 460.2 ± 93.1 µmol m-2 (Troyer citrange) and shoot DW presented values between 0.29 ± 0.02 g (Troyer citrange) and 0.66 ± 0.07 g (Sour orange).
The root DW varied between 0.09 ± 0.01 g (C. macrophylla) and 0.22 ± 0.01 g (Carrizo citrange). The lowest root to shoot ratio (DW) value was observed in C. macrophylla (0.30 ± 0.07 g) and the highest in Troyer citrange (0.62 ± 0.13 g). The total plant DW (shoot plus roots) ranged between 0.39 ± 0.01 g (C. macrophylla) and 0.87 ± 0.04 g (Sour orange).
2.1. Chlorophyll Concentration, Biomass and Root Ferric Chelate Reductase Activity
At the last day of the experimental period, physiological responses to Fe availability in the nutrient solution varied between rootstocks (Table 1).
Iron concentration in nutrient solution did not affect total plant dry weight (DW) neither in the Sour orange nor in the Troyer rootstocks. Nevertheless, Volkamer lemon plants increased DW under higher Fe concentrations in the nutrient solution, while the other two citrus rootstocks did not show a clear trend. The root/shoot ratio (in DW) was only affected in Sour orange and C. macrophylla but without obvious trends.
At the end of the experiment, all the rootstocks grown with 20 µM of Fe, except Carrizo citrange, showed greater leaf area (cm2) and leaf CHL concentrations (positive values in % of variation between initial and final values). Regardless of the rootstock, the symptoms of Fe chlorosis appeared whenever the decrease in foliar CHL concentration was greater than 45 % of the initial values. Leaf CHL values ranged from a minimum of 39.9 µmol m-2 (- 91.3 %; Troyer citrange) to a maximum of 212.9 µmol m-2 (- 45.0 %; Volkamer lemon).
Iron leaf chlorosis was observed at concentrations of 0, 5 and 10 µM of Fe for rootstocks Carrizo citrange, C. macrophylla and Troyer citrange, while in Volkamer lemon it was observed at the two lowest concentrations (0 and 5 µM of Fe). In Sour orange chlorosis was only observed in the total absence of Fe in the nutrient solution.
The root FCR activity of Carrizo and Troyer rootstocks reached maximum values at the concentration of 15 µM of Fe. In C. macrophylla, FCR activity was induced in plants grown in the total absence of Fe, while in the remaining rootstock there was no consistent pattern.
2.2. Mineral Composition
The concentrations of macronutrients and micronutrient in the shoot are shown in Table 2. In Sour orange, P and Fe concentrations in shoots showed a clear increase in treatments with higher Fe levels. The concentrations of N, Ca, Mg and Cu did not show significant differences between treatments.
In Carrizo citrange, Ca, Mg, K and Fe concentrations were similar between treatments. Phosphorus was higher in treatments with 10, 15 and 20 µM of Fe. Copper and Zn did not show a clear pattern, and Mn was significantly higher at 15 µM of Fe.
In shoots of C. macrophylla, the concentrations of Mg, Fe and Cu were similar, while Mn was significantly higher in the absence of Fe in the solution. Calcium, K and Zn did not show a clear trend, but P was higher in the 15 µM of Fe treatment.
Troyer citrange did not show significant differences in the concentrations of N, Ca, Mg and Zn in the shoot. The highest concentrations of Fe and K in the shoots were registered in the treatments with 20 and 10 µM of Fe, respectively.
In Volkamer lemon, K and Cu concentrations in the shoots were similar between treatments. Phosphorus was higher in the treatments with 10, 15 and 20 µM of Fe, and Zn in 10 µM of Fe. The Fe concentration in shoots was higher in treatments with 15 and 20 µM of Fe.
In the case of mineral composition of the root (Table 3), there were different responses in the studied citrus rootstocks. For example, in Sour orange, N and Zn concentrations in the roots were similar. Regarding the other nutrients evaluated, the values of P, Ca and Mg were higher at 15 µM of Fe, while K, Fe and Mn were higher at 20 µM of Fe. On the other hand, Cu increased in total absence of Fe.
Carrizo citrange did not show a clear trend regarding N, Mg and Fe. However, P, K and Zn were higher in the treatment with 10 µM Fe and Ca in the 15 µM Fe treatment. Manganese concentration in the root was higher in the treatment with 20 µM of Fe, but the concentration of Cu in the roots was higher in the treatments with 0, 5 and 10 µM of Fe.
In C. macrophylla, the root concentrations of N, Mg and K remained the same in all treatments, while Cu, Zn and Mn were higher in the treatment without Fe. Calcium did not present a clear response and P was higher at 20 µM of Fe in the nutrient solution. Root Fe concentration was significantly higher at 5 and 10 µM of Fe.
Troyer citrange did not show significant differences in the concentration of N in the root. No clear response was observed for P, Ca, Mg, Fe and Mn, but Zn and Cu concentrations were higher in the absence of Fe. Root K concentration increased in treatments with higher levels of Fe (15 and 20 µM of Fe).
In Volkamer lemon, the Fe concentration in the roots remained constant regardless of the treatment. Root concentrations of N, K and Mn were higher in the treatments with more Fe, while Cu values was significantly higher in roots grown without Fe. No evident response was detected for P and Ca.
The PCA analysis selected six principal components with eigenvalues greater than 1 among the 23 parameters tested, including shoot and root nutrient composition, DW, leaf CHL, leaf area and root FCR. The cumulative percent of variance of the six principal axes was 85.2 % of the total variance.
The variations in nutrient concentrations in shoots and roots for the five citrus rootstocks produced a dominant first principal component (PC1), which explained 31 % of the total variance (Figure 1a; Table S2).
The second component (PC2) explained 21 % of the variance and PC3 explained 13 % with further components explaining less than 8 %. This analysis indicated that data could be summarized in two dimensions. Increases in N-S, P-S, Ca-S, Cu-S, Zn-S, Mn-S and Zn-R and Mn-R concentrations were coordinated with CHL and FCR and put in contrast to S-DW along PC1. However, the contribution of S-DW was small. PC2 reflected the coordinated increases in leaf CHL, Mg-R, DW (shoots and roots) in contrast to Cu-R.
Along PC1 and PC2, the scores for each treatment (rootstock x Fe level = 25) were also analysed (Figure 1b). The main patterns identified along the two principal components (PC1 and PC2) were mainly related with differences between Fe treatments. Along PC1, the values obtained were consistent for V10, C15, and C20, but opposite to those obtained for S0 and S5. Consequently, the Fe0 level had the highest concentrations of N-S, P-S, Ca-S, Cu-S, Zn-S, Mn-S, Zn-R and Mn-R, and the lowest values of S-DW. Regarding to PC2, it is evident that S20, S15, T15, M15 and M20 presented the smallest values of Cu-R.
As expected, several significant relationships were observed between the studied parameters, as shown in Pearson’s correlations (Table S3). CHL leaf concentration was positively related to Fe-S (0.56) and K-S (0.51), but inversely related to Cu-R (-0.53). Root FCR was directly related to K-S (0.63) and Mn-S (0.41).
To assess the influence of five Fe levels on leaf chlorosis parameters (CHL, FCR, total DW and Leaf Area) and nutrient contents (in mg: N, P, K, Ca and Mg; in µg: Fe, Zn, Cu and Mn; Table S4) of whole plants, a PCA was performed that considered all rootstocks as one (Figure 2).
PCA extracted two axes with eigenvalues > 1, representing about 92 % of the overall variability in the data. After rotation of the PC axis with the varimax approach (normalized), two axes showed patterns associated with Fe chlorosis variables (Figure 2a; Table S5).
The first axis (PC1), which reflects leaf chlorosis, represented the variation in leaf CHL concentration, leaf area, and total DW of plants. CHL leaf concentration was positively associated with increases in total Fe content in plants and with increases in N, P, K, Mg and Zn contents, and with decreases in total Cu contents (Figure 2A). The root FCR variable was represented in a separate axis (PC2) and was shown to be totally unrelated to the Fe chlorosis variables. Increases in FCR were associated with increases in Ca and Mn contents in plants (Figure 2a).
The main patterns identified along the two principal components (PC1 and PC2) were mainly related to the differences between treatments without and with 5 µM of Fe (Fe0 and Fe5; Figure 2b). Consequently, the plants in the treatments without Fe (Fe0) showed the lowest values of leaf CHL, leaf area and total DW, which were associated with the lowest content of N, P, Mg, K, Fe and Zn and the highest content of Cu. In PC2, it is evident that from treatments with 5 µM Fe (Fe5) showed the lowest values of FCR, and Ca and Mn contents.
As Cu showed a contrasting response between macro and micronutrients (Figure 1a and Figure 2a), the ratio Fe/Cu was studied in detail. A positive linear relationship was obtained between the Fe/Cu ratio and foliar CHL concentrations (Figure 3).
This global analysis highlights the relationship between the Fe/Cu ratio and leaf CHL concentration (R2=0.41). However, when we analyse this relationship by citrus rootstock, only Volkamer and Sour orange plants showed a significant relationship between these parameters. These rootstocks exhibited the highest Fe/Cu ratio (> 4) at 20 µM of Fe. On the other hand, the lowest values were registered in the absence of Fe for Troyer and C. macrophylla plants (< 1).
3. Discussion
In citrus production, selecting the adequate rootstock is a key element not only to face adverse environmental conditions, including biotic and abiotic stress, but also influences the final quality of the fruits (for a revision see Alfaro et al. [17]). Although there are previous works on the physiological responses of Fe-chlorotic citrus plants [19,21] it is of great importance to establish the nutritional profile of macro and micronutrients of citrus rootstocks grown under different Fe intakes to improve their nutritional performance and select the best scion/rootstock combinations.
In previous results [19] we identified two strategies associated with the growth and Fe-use efficiency of these species: an Fe-spending strategy versus an Fe-conservative strategy.
The Volkamer, a non-trifoliate species, is a fast-growing rootstock that is able to cope with Fe deficiency by promoting increased Fe reductase activity in the roots [19]. The FCR results presented here are inconclusive, but an increase in Volkamer biomass (DW) was observed in response to Fe in the nutrient solution, as well as an increase in essential elements such as N, Ca, Mg, Zn and Mn in the shoot. In this rootstock, the highest proportions of nutrients were allocated to the shoot compared to the roots probably due to an efficient upward transport, which may have promoted photosynthetic efficiency and/or, a better performance of antioxidative systems as suggested by Oustric et al [23]. Interestingly, the absence of a clear response of root nutrients profiles in Volkamer may indicate that Fe depletion did not have an impact on nutrients accumulation in roots.
Sour orange also presents tolerance to Fe depletion [19]. Only Fe and P were notably enhanced in shoots due to Fe increment in the solution (15 and 20 µM Fe treatments) suggesting that small amounts of Fe were not enough to trigger some nutritional imbalance in the shoot. However, Fe stress signalling occurred at root level, as Cu was increased in response to the total absence of Fe, which led to a lower Fe/Cu ratio. This close functional role between these two metals (Fe and Cu) has already been reported in several species [24,25,26].
The rootstock most sensible to Fe deficiency is Troyer citrange, a fact supported by the very low values of leaf chlorophyll registered in treatments with 0, 5 and 10 µM of Fe, compared to the other rootstocks. Regarding this rootstock, most of the nutrients present in the shoot, with the clear exception of N, were partially affected by Fe deficiency, but the pattern is quite inconclusive (for example, the concentrations of all micronutrients were higher in the treatments 10 and 15 µM of Fe). However, in the roots, it is possible to observe that in addition to Cu, Zn also accumulated in the treatments without Fe. This specific increase of Zn in the root was also observed in the susceptible Poncirus trifoliata [20]. The values of the activity of FCR enzyme were low in the absence of Fe (Fe0) but also in the treatment with 20 µM of Fe, which does not allow a clear interpretation of the behaviour of this enzyme.
Citrus macrophylla and Carrizo citrange can be considered rootstocks with an intermediate resistance to Fe depletion. In C. macrophylla, despite the increase in leaf chlorophyll content at higher concentrations of Fe in the nutrient solution, the main outcome was the increase of Zn and Mn in the shoot and of Cu, Zn and Mn in the roots under Fe depletion. It is possible that these nutrients were uptaken instead of Fe, a strategy already mentioned to respond to Fe deficiency. However, the increment of Mn in the roots is a trait that distinguished this rootstock from the other. Although Mn activates many enzymes, only a small number contain Mn [27]. One of these is superoxide dismutase (MnSOD), which plays a role in cell protection from oxygen radicals. It is possible to assume that the lack of Fe induced an oxidative stress and, consequently, there was a greater demand for Mn demand for the activity of the SOD enzyme.
Carrizo citrange is also moderately resistant to Fe chlorosis and it was found that as Fe availability increased, the concentration of several macro and micronutrients also increased both in shoots and roots, thus supporting the negative and generalized impact of low Fe values in its mineral composition. However, and like C. macrophylla, higher concentrations of Cu were observed in the treatment without Fe. FCR activity was low in plants without Fe in the solution, but similar to that of the treatment with 20 µM of Fe, which is not in accordance with the findings by Martinez-Cuenca et al. [13]. Apparently, the highest values of P and micronutrients were registered in the shoot of the plants grown in 10 µM of Fe, but in the roots only Mg and P showed similar behavior.
In Citrus, the processes involved in tolerance to Fe chlorosis depend on genotype [23]. Fu et al. [28] found that Fe tolerance was associated, among other factors, with increased Fe uptake in roots and subsequent translocation to shoots. In our experiment, it was observed that the rootstock Volkamer showed high values of Fe in the shoot ( > 100 mg kg) of plants grown at 15 and 20 µM of Fe, leading to a higher percentage of Fe allocation in the shoot. Moreover, there was a significant amount of Fe present in the roots, specially under Fe deprivation, suggesting an efficient use of Fe. In fact, a high Fe content in the roots was one of the traits identified by Forner-Alcaide [29] as being associated with greater tolerance to Fe deficiency in Citrus rootstocks.
As confirmed by the PCA analysis, the nutritional balance of Sour orange when grown with low Fe availability (0 and 5 µM of Fe) was contrasting to that of the other rootstocks that grew at the highest Fe concentrations (10, 15 and 20 µM of Fe).
It seems that in the absence of Fe in the nutrient solution, although Cu can be uptake in place of Fe, it cannot fulfil the functions of Fe, compromising the entire performance of the plants.
Metal homeostasis plays an important role in plant growth with a complex network of interactions. Iron and Cu metabolic pathways are closely linked as they share the same metal transporters (such as IRT1) and metal-binding proteins. For example, nicotianamine is a non-proteinogenic amino acid able to bind to Fe, but also with high affinity to other metals such as Cu [30]. Interaction between Fe and Cu is well documented. For example, Waters and Armbrust [31] found that in Arabidopsis, leaf Cu concentration increased under low Fe supply, and that high Cu reduced FCR activity. Thus, several reports suggest that Fe-deficient plants assimilate extra Cu to supply CuSOD proteins and ensure protective mechanisms against oxidative damage [32].
We can conclude that the reduced uptake of mineral elements under Fe depletion is not only due to the lack of Fe but also to the balance between nutrients. Thereby, total Cu seems to be a key nutrient to distinguish Fe tolerance, considering the set of all rootstocks under study. Furthermore, the Fe/Cu ratio is useful to elucidate the difference in the use of these micronutrients among rootstocks under different Fe availability, as well as to evaluate the impact of this nutritional balance on foliar CHL synthesis.
Rootstocks responses demonstrated how Fe deficiency induces imbalances in citrus trees, thus highlighting the importance of establishing the best nutrient management for sustainable fruit production. In addition, it will be possible to control Fe applications, using rootstocks with greater Fe use efficiency and adapting fertilization programs for a more sustainable production.
It remains necessary to investigate the role of rootstocks in the impact caused by Fe deficiency on fruit production and quality. Likewise, continuous screening of genotypic varieties with high resistance to iron deficiency is essential to overcome plant tolerance to Fe deficiency.
4. Materials and Methods
4.1. Plant Material and Growth Conditions
The experiment was conducted with five citrus rootstocks grown under greenhouse conditions. The five citrus rootstocks studied were: Troyer citrange (Citrus sinensis (L.) Osb. x Poncirus trifoliata (L.) Raf.), Carrizo citrange, Volkamer lemon (Citrus volkameriana Ten. & Pasq.), alemow (C. macrophylla Wester) and sour orange (C. aurantium L.). Seeds of all rootstocks were obtained from Willits & Newcomb (Arvin, California, USA), and were disinfected by immersion in a 15 % of sodium hypochlorite solution for 15 minutes and then washed three times with distilled water.
Seeds were germinated in the dark at 22 ºC in plastic trays with sterilised moist vermiculite. After germination, the seedlings were grown in moist vermiculite during four weeks in a controlled environment with day/night temperatures of 21/22 ºC, a relative humidity of 80% and a 12-hour photoperiod. During this period, the minimum photon flux density at plant level was 113 μmol quanta of photosynthetic active radiation (PAR) m-2 s-1, provided by a combination of fluorescent and incandescent lamps.
After this period, groups of uniform seedlings (14 ± 2 cm length and five to nine fully expanded leaves) were selected for each rootstock and transferred to 20 L polyethylene vessels (six plants per vessel) filled with full-strength Hoagland solution containing (in mM): 5.0 Ca(NO3)2, 1.4 KNO3, 0.6 K2SO4, 1.0 MgSO4, 0.9 NaCl, 0.6 (NH4)2HPO4, 3.0 (NH4)2SO4, 0.2 MgCl2 and (in µM): 41.8 H3BO3, 3.8 ZnSO4, 3.9 CuSO4, 6.9 MnSO4 and 1.0 (NH4)6Mo7O24 following the recommendations established by Carpena [33]. Iron was added to the solution as Fe(III)-EDHHA at five different concentrations (µM Fe): 0 (Fe0), 5 (Fe5), 10 (Fe10), 15 (Fe15) and 20 (Fe20). Treatments were imposed during five weeks. The initial pH of nutrient solutions was adjusted to 6.0 ± 0.1 using NaOH 0.1 M (the electrical conductivity -EC- was 2.1 ± 0.1 dS m-1). The pH and EC of the solutions were monitored every two days. The nutrient solution was frequently aerated, using alternated cycles of 15 min with and without aeration programmed with a timer. The experiment was performed between June and July in a glasshouse under natural photoperiod conditions. The air temperature was ≤ 25 o C and the average relative humidity was 65%. The experiment was arranged as in a complete randomized design, with 25 combinations of Fe concentrations and rootstocks, and six replications (plant) per combination.
Measurements of different parameters were carried out immediately before the beginning and at the end of the experiment, in at least five plants per treatment (each Fe level and each rootstock).
4.2. Leaf Chlorophyll
Leaf chlorophyll (CHL) concentrations were estimated using a portable SPAD-502 apparatus (Minolta Corp., Osaka, Japan). The SPAD-502 readings were taken in the youngest fully expanded leaves, using the average of at least three measurements per leaf. Leaf SPAD readings (X) were converted to total CHL concentrations (in µmol m-2) using the same calibration equations, quadratic regression models, obtained in a previous study with the same Citrus rootstocks [19]. Leaf CHL were extracted using 100 % acetone in the presence of Na ascorbate according to the method described by Abadía and Abadía [34]. The percentage of variation between initial leaf CHL concentration and final values was also calculated.
4.3. Determination of the Root Fe-Chelate Reducing Capacity
The activity of the root ferric chelate reductase (FCR; EC1.16.1.17) was measured at the end of the experiment (after 34 days) in all plants, using bathophenanthroline disulfonate (BPDS), which forms a red Fe3BPDS2 complex with Fe(II), as in Bienfait et al. [35]. In each plant, a single root tip, approximately 2 cm in length (14.39 ± 0.92 mg of dry weight - DW), was excised with a razor blade and incubated in an Eppendorf tube, in the darkness for one hour, with 900 μL of micronutrient-free half-strength Hoagland's nutrient solution, containing 300 µM BPDS, 500 μM Fe(III)-EDTA and 5 mM MES, pH 6.0. Then, the FCR activity was measured at 535 nm, using a spectrophotometer (CADAS 100 UV-VIS Photometer; Dr. Lange, Düsseldorf, Germany), with a molar extinction coefficient of 22.14 mM-1 cm-1. Each root tip was then blotted on paper and the fresh weight (FW) was determined. Values shown for FCR activity were the mean of at least five root tips (plants) in each treatment, and values were calculated on a FW basis. Blank controls without root tips were also used to correct for any non-specific photoreduction.
4.4. Biomass Determination and Mineral Composition Analysis
At the beginning of the experiment, plants of each rootstock and Fe level were collected and separated into shoots (leaves and stems), and roots. The leaf area was measured in at least 5 plants per treatment and per rootstock, considering the set of leaves of each plant. For this measurement, a leaf area meter was used (ADC, AM 200). Each sample consisted of two plants from each treatment and three replicates were analysed.
The plant material was weighed to determine the fresh weight (FW) and subsequently washed with tap water, followed by deionized water with a non-ionic detergent and then with 0.01 M HCl. To finish, three rinses were made with distilled water. The plant material was dried at 70 ºC during at least 48 h until constant weight to determine the respective dry weight (DW). Dried samples were ground to pass through a 1 mm stainless sieve and stored. Nitrogen and P were determined by the Kjeldahl method and colorimetrically by the molybdovanadate method, respectively. The dried material was ashed at 450 ºC, followed by digestion with 1 M HCl. Potassium was determined by emission spectrophotometry and Ca, Mg, Mn, Zn, Cu and Fe were determined by atomic absorption spectrophotometry (SolaarM Series, Pye Unicam, Cambridge, UK) following standard laboratory procedures [36]. Macronutrients concentrations were expressed as mg g-1 DW and micronutrients as µg g-1 DW. Nutrient contents were calculated by multiplying the DW of each plant organ by the nutrient concentration in that organ. The total nutrient contents resulted from the sum of the values obtained in shoots (leaves and stems) plus roots. The nutrient ratio was calculated with total content of the different nutrients assessed per citrus rootstock.
4.5. Statistical Analysis
The experiment had a completely randomized design. Analysis of variance (ANOVA; F test) was conducted for all studied variables and conditions, and the means were compared using the Duncan Multiple Range Test at P ≤ 0.05.
The assessment of the main nutritional patterns as a response to all treatments (5 Fe levels x 5 rootstocks) was done by Principal Component Analysis (PCA). Using PCA, it is possible to reveal associations in the data that cannot be found by analyzing each variable separately. Each extracted component or factor accounts for part of the variation of all data sets and is associated to an eigenvalue. The eigenvalue associated with each eigenvector is a measure of the variance within variables of the corresponding principal component. The eigenvectors can be used to calculate new values, called scores, for each observation on each principal component. The scores can be positioned on a plot to identify the cases that contributed more related to the formation of the component. For the interpretation of data, only the components with eigenvalues greater than one were kept (Kaiser’s criterion). To obtain a better representation of gradients in shoots and roots nutrients associated with chlorosis variables (CHL, FCR, shoot DW and root DW), a varimax (normalized) rotation was applied to the PCA results. This approach simplifies interpretation of the patterns associated with any given parameter of interest, because the rotation maximizes the loading of each parameter in a single factorial axis.
In addition, PCA was also carried out to determine the relationships between the mineral composition according to the Fe level regardless of the rootstock. For this PCA, new averages per rootstock resulted from the grouping of nutrient content by Fe level.
Linear correlations between studied parameters were determined and the Pearson correlation coefficients presented. For each rootstock, linear regression analysis between leaf CHL in last day and the plant Fe/Cu ratio was carried out. The global model for all rootstocks was also presented.
Statistical analyses were performed using the SPSS® software (IBM SPSS Statistics for Windows, Version 29.0. Armonk, NY, IBM Corp).
Supplementary Materials
The following supporting information can be downloaded at: www.mdpi.com/xxx/s1, Table S1: Shoot and root dry weight (DW in g), root to shoot ratio (in DW basis), and total DW of five citrus rootstocks at the beginning of the experiment, Table S2: Loadings of the PCA for nutrient composition and leaf chlorosis parameters for five citrus rootstocks, Table S3: Pearson's correlations between PCA variables: leaf chlorosis parameters and nutrients in Shoots (S) and in Roots (R) of five citrus rootstocks, Table S4: Macronutrients (mg) and micronutrients (µg) contents at the end of the experiment in five citrus rootstocks grown with five Fe concentrations in nutrient solution: 0, 5, 10, 15 and 20 µM, Table S5: Loadings of the PCA for total nutrient content and leaf parameters for five Fe levels in nutrient solution considering rootstocks as one. DW – shoot plus root dry weights.
Author Contributions
“Conceptualization, A.V., M.P., P.J.C. and J.A.; methodology, A.V., M.P. and J.A.; software, M.P. and P.J.C.; investigation, P.G., T.S. and F.G.; writing—original draft preparation, M.P., P.G. and P.J.C.; writing—review and editing, A.V. and M.P.; project administration, J.A., M.P. and A.V.; funding acquisition, J.A and M.P.. All authors have read and agreed to the published version of the manuscript.”
Funding
This study was funded by the National Project (PTDC/AGR-PRO/3861/2012) from Foundation for Science and Technology (FCT), coordinated by M. Pestana and the Spanish Project MCIN/AEI/ PID2020-115856RB-I00, coordinated by A. Álvarez-Fernández and J. Abadía. T.S. is thankful to FCT for the Grant SFRH/BD/144764/2019.
Data Availability Statement
The data that support the findings of this study are available from the corresponding author upon reasonable request.
Acknowledgments
We would like to publicly thank Javier Abadía for his availability, for the opportunities he gave us and all the knowledge he transmitted over the past 30 years, maintaining an indelible attitude of respect for others. He will always be on our hearts as a friend and a mentor.
Conflicts of Interest
The authors declare no conflict of interest.
References
- Saito, A.; Shinjo, S.; Ito, D.; Doi, Y.; Sato, A.; Wakabayashi, Y.; Honda, J.; Arai, Y.; Maeda, T.; Ohyama, T.; et al. Enhancement of Photosynthetic Iron-Use Efficiency Is an Important Trait of Hordeum Vulgare for Adaptation of Photosystems to Iron Deficiency. Plants 2021, 10, 1–25. [Google Scholar] [CrossRef]
- Rombolà, A.D.; Tagliavini, M. Iron Nutrition of Fruit Tree Crops. Iron Nutrition in Plants and Rhizospheric Microorganisms 2006, 61–83. [Google Scholar] [CrossRef]
- Álvarez-Fernández, A.; Melgar, J.C.; Abadía, J.; Abadía, A. Effects of Moderate and Severe Iron Deficiency Chlorosis on Fruit Yield, Appearance and Composition in Pear (Pyrus Communis L.) and Peach (Prunus Persica (L.) Batsch). Environ Exp Bot 2011, 71, 280–286. [Google Scholar] [CrossRef]
- Pestana, M.; De Varennes, A.; Goss, M.J.; Abadía, J.; Faria, E.A. Floral Analysis as a Tool to Diagnose Iron Chlorosis in Orange Trees. Plant Soil 2004, 259, 287–295. [Google Scholar] [CrossRef]
- Römheld, V.; Marschner, H. Evidence for a Specific Uptake System for Iron Phytosiderophores in Roots of Grasses. Plant Physiol 1986, 80, 175–180. [Google Scholar] [CrossRef]
- Wairich, A.; de Oliveira, B.H.N.; Arend, E.B.; Duarte, G.L.; Ponte, L.R.; Sperotto, R.A.; Ricachenevsky, F.K.; Fett, J.P. The Combined Strategy for Iron Uptake Is Not Exclusive to Domesticated Rice (Oryza Sativa). Sci Rep 2019, 9. [Google Scholar] [CrossRef]
- Rajniak, J.; H Giehl, R.F.; Chang, E.; Murgia, I.; von Wirén, N.; Sattely, E.S.; Chem Biol, N. Biosynthesis of Redox-Active Metabolites in Response to Iron Deficiency in Plants HHS Public Access Author Manuscript. Nat Chem Biol 2018, 14, 442–450. [Google Scholar] [CrossRef]
- Nozoye, T.; Aung, M.S.; Masuda, H.; Nakanishi, H.; Nishizawa, N.K. Bioenergy Grass [Erianthus Ravennae (L.) Beauv.] Secretes Two Members of Mugineic Acid Family Phytosiderophores Which Involved in Their Tolerance to Fe Deficiency. Soil Sci Plant Nutr 2017, 63, 543–552. [Google Scholar] [CrossRef]
- Jeong, J.; Connolly, E.L. Iron Uptake Mechanisms in Plants: Functions of the FRO Family of Ferric Reductases. Plant Science 2009, 176, 709–714. [Google Scholar] [CrossRef]
- Abadía, J.; Vázquez, S.; Rellán-Álvarez, R.; El-Jendoubi, H.; Abadía, A.; Álvarez-Fernández, A.; López-Millán, A.F. Towards a Knowledge-Based Correction of Iron Chlorosis. Plant Physiology and Biochemistry 2011, 49, 471–482. [Google Scholar] [CrossRef]
- Rellán-Álvarez, R.; Abadía, J.; Álvarez-Fernández, A. Formation of Metal-Nicotianamine Complexes as Affected by PH, Ligand Exchange with Citrate and Metal Exchange. A Study by Electrospray Ionization Time-of-Flight Mass Spectrometry. Rapid Communications in Mass Spectrometry 2008, 22, 1553–1562. [Google Scholar] [CrossRef]
- Welch, R.M. Micronutrient Nutrition of Plants. CRC Crit Rev Plant Sci 1995, 14, 49–49. [Google Scholar] [CrossRef]
- Martínez-Cuenca, M.R.; Iglesias, D.J.; Forner-Giner, M.A.; Primo-Millo, E.; Legaz, F. The Effect of Sodium Bicarbonate on Plant Performance and Iron Acquisition System of FA-5 (Forner-Alcaide 5) Citrus Seedlings. Acta Physiol Plant 2013, 35, 2833–2845. [Google Scholar] [CrossRef]
- Martínez-Cuenca, M.R.; Forner-Giner, M.Á.; Iglesias, D.J.; Primo-Millo, E.; Legaz, F. Strategy I Responses to Fe-Deficiency of Two Citrus Rootstocks Differing in Their Tolerance to Iron Chlorosis. Sci Hortic 2013, 153, 56–63. [Google Scholar] [CrossRef]
- Martínez-Cuenca, M.R.; Iglesias, D.J.; Talón, M.; Abadía, J.; López-Millán, A.F.; Primo-Millo, E.; Legaz, F. Metabolic Responses to Iron Deficiency in Roots of Carrizo Citrange [Citrus Sinensis (L.) Osbeck. × Poncirus Trifoliata (L.) Raf.]. Tree Physiol 2013, 33, 320–329. [Google Scholar] [CrossRef]
- Martinez-Cuenca, M.R.; Primo-Capella, A.; Quiñones, A.; Bermejo, A.; Forner-Giner, M.A. Rootstock Influence on Iron Uptake Responses in Citrus Leaves and Their Regulation under the Fe Paradox Effect. PeerJ, 3553. [Google Scholar] [CrossRef]
- Alfaro, J.M.; Bermejo, A.; Navarro, P.; Quiñones, A.; Salvador, A. Effect of Rootstock on Citrus Fruit Quality: A Review. Food Reviews International 2021, 39 (5): 2835-2853. [CrossRef]
- Kwakye, S.; Kadyampakeni, D.M. Micronutrients Improve Growth and Development of HLB-Affected Citrus Trees in Florida. 2022. [Google Scholar] [CrossRef]
- Pestana, M.; Correia, P.J.; David, M.; Abadía, A.; Abadía, J.; de Varennes, A. Response of Five Citrus Rootstocks to Iron Deficiency. Journal of Plant Nutrition and Soil Science 2011, 174, 837–846. [Google Scholar] [CrossRef]
- Correia, P.J.; Saavedra, T.; Gama, F.; da Graça Miguel, M.; de Varennes, A.; Pestana, M. Biologically Active Compounds Available in Ceratonia Siliqua L. Grown in Contrasting Soils under Mediterranean Climate. Sci Hortic 2018, 235, 228–234. [Google Scholar] [CrossRef]
- Pestana, M.; De Varennes, A.; Abadía, J.; Faria, E.A. Differential Tolerance to Iron Deficiency of Citrus Rootstocks Grown in Nutrient Solution. Sci Hortic 2005, 104, 25–36. [Google Scholar] [CrossRef]
- Dhaliwal, S.S.; Sharma, V.; Shukla, A.K. Impact of Micronutrients in Mitigation of Abiotic Stresses in Soils and Plants—A Progressive Step toward Crop Security and Nutritional Quality. In Advances in Agronomy; Academic Press Inc., 2022; Vol. 173, pp. 1–78 ISBN 9780323989558.
- Oustric, J.; Morillon, R.; Luro, F.; Herbette, S.; Martin, P.; Giannettini, J.; Berti, L.; Santini, J. Nutrient Deficiency Tolerance in Citrus Is Dependent on Genotype or Ploidy Level. Front Plant Sci 2019, 10. [Google Scholar] [CrossRef]
- Palmer, C.M.; Guerinot, M. Lou Facing the Challenges of Cu, Fe and Zn Homeostasis in Plants. Nat Chem Biol 2009, 5, 333–340. [Google Scholar] [CrossRef]
- Pestana, M.; Correia, P.J.; Saavedra, T.; Gama, F.; Dandlen, S.; Nolasco, G.; de Varennes, A. Root Ferric Chelate Reductase Is Regulated by Iron and Copper in Strawberry Plants. J Plant Nutr 2013, 36, 2035–2047. [Google Scholar] [CrossRef]
- Correia, P.J.; Pestana, M. Exploratory Analysis of the Productivity of Carob Tree (Ceratonia Siliqua) Orchards Conducted under Dry-Farming Conditions. Sustainability (Switzerland) 2018, 10. [Google Scholar] [CrossRef]
- Marschner, P. Marschner’s Mineral Nutrition of Higher Plants Third Edition; Marschner, H., Ed.; Third Edition.; Elsevier: London, 2012; ISBN 9780123849052. [Google Scholar]
- Fu, L.; Zhu, Q.; Sun, Y.; Du, W.; Pan, Z.; Peng, S. Physiological and Transcriptional Changes of Three Citrus Rootstock Seedlings under Iron Deficiency. Front Plant Sci 2017, 8. [Google Scholar] [CrossRef]
- Llosá, J.; Bermejo, A.; Cano, A.; Quiñones, A.; Forner-Giner, A. The Citrus Rootstocks Cleopatra Mandarin, Poncirus Trifoliata, Forner-Alcaide 5 and Forner-Alcaide 13 Vary in Susceptibility to Iron Deficiency Chlorosis; Journal of the American Pomological Society 2009, 63 (4): 160-167.
- Nikolić, D.; Bosnić, D.; Samardžić, J. Silicon in Action: Between Iron Scarcity and Excess Copper. Front Plant Sci 2023, 14. [Google Scholar] [CrossRef] [PubMed]
- Waters, B.M.; Armbrust, L.C. Optimal Copper Supply Is Required for Normal Plant Iron Deficiency Responses. Plant Signaling & Behavior 2013, 8(12): a26611. [CrossRef]
- Rai, S.; Singh, P.K.; Mankotia, S.; Swain, J.; Satbhai, S.B. Iron Homeostasis in Plants and Its Crosstalk with Copper, Zinc, and Manganese. Plant Stress 2021, 1. [Google Scholar] [CrossRef]
- Carpena, O. Dinámica de Nutrientes En Portainjertos de Citrus. In Proceedings of the I Congreso Mundial de la Associación de Viveristas de Agrios; International Society of Citrus Nurserymen, Ed.; Valencia, Spain; 1983; pp. 65–77. [Google Scholar]
- Abadía, J.; Abadía, A. Iron and Pigments. In Iron Chelation in Plants and Soil Microorganisms; Barton, L.L., Ed.; San Diego CA, USA, 1993; pp. 327–343.
- Bienfait, H.F.; Bino, R.J.; Vander Bliek, A.M.; Duivenvoorden, J.F.; Fontaine, J.M. Characterization of Ferric Reducing Activity in Roots of Fe-deficient Phaseolus Vulgaris. Physiologia Plantarum 1983; 59 (2): 196-202. doi/epdf/10.1111/j.1399-3054.1983.tb00757.x.
- A.O.A.C. Association of Official Agricultural Chemists. Official Methods of Analysis. Washington, D.C., 1990.
Figure 1.
a) Principal component analysis of nutrient concentrations (in mg g-1 DW: N, P, K, Ca and Mg; in µg g-1: DW: Fe, Cu, Zn and Mn) in shoots (S) and roots (R) of five citrus rootstocks. PC1 - first principal component; PC2 - second principal component. Each vector represents the loadings of variables (nutrients and Fe chlorosis parameters: CHL, Leaf Area, S-DW, R-DW and FCR) in each principal component. Loadings represent the relative contribution of each nutrient to that component. Concentration of nutrients in shoots (S) and roots (R): N (N-S and N-R), P (P-S and P-R), K (K-S and K-R), Ca (Ca-S and Ca-R), Mg (Mg-S and Mg-R), Cu (Cu-S and Cu-R), Fe (Fe-S and Fe-R), Mn (Mn-S and Mn-R) and Zn (Zn-S and Zn-R). b) Projection of 25 scores resulting from 5 rootstocks (S -Sour orange, V – Volkamer lemon, T – Toyer citrange, C – Carrizo citrange and M – C. macrophylla) x 5 Fe levels (0, 5, 10, 15 and 20 µM of Fe) onto the plane defined by the principal components. The labels of treatments results from the combination of the letter associated to each rootstock and the concentration of Fe in nutrient solution.
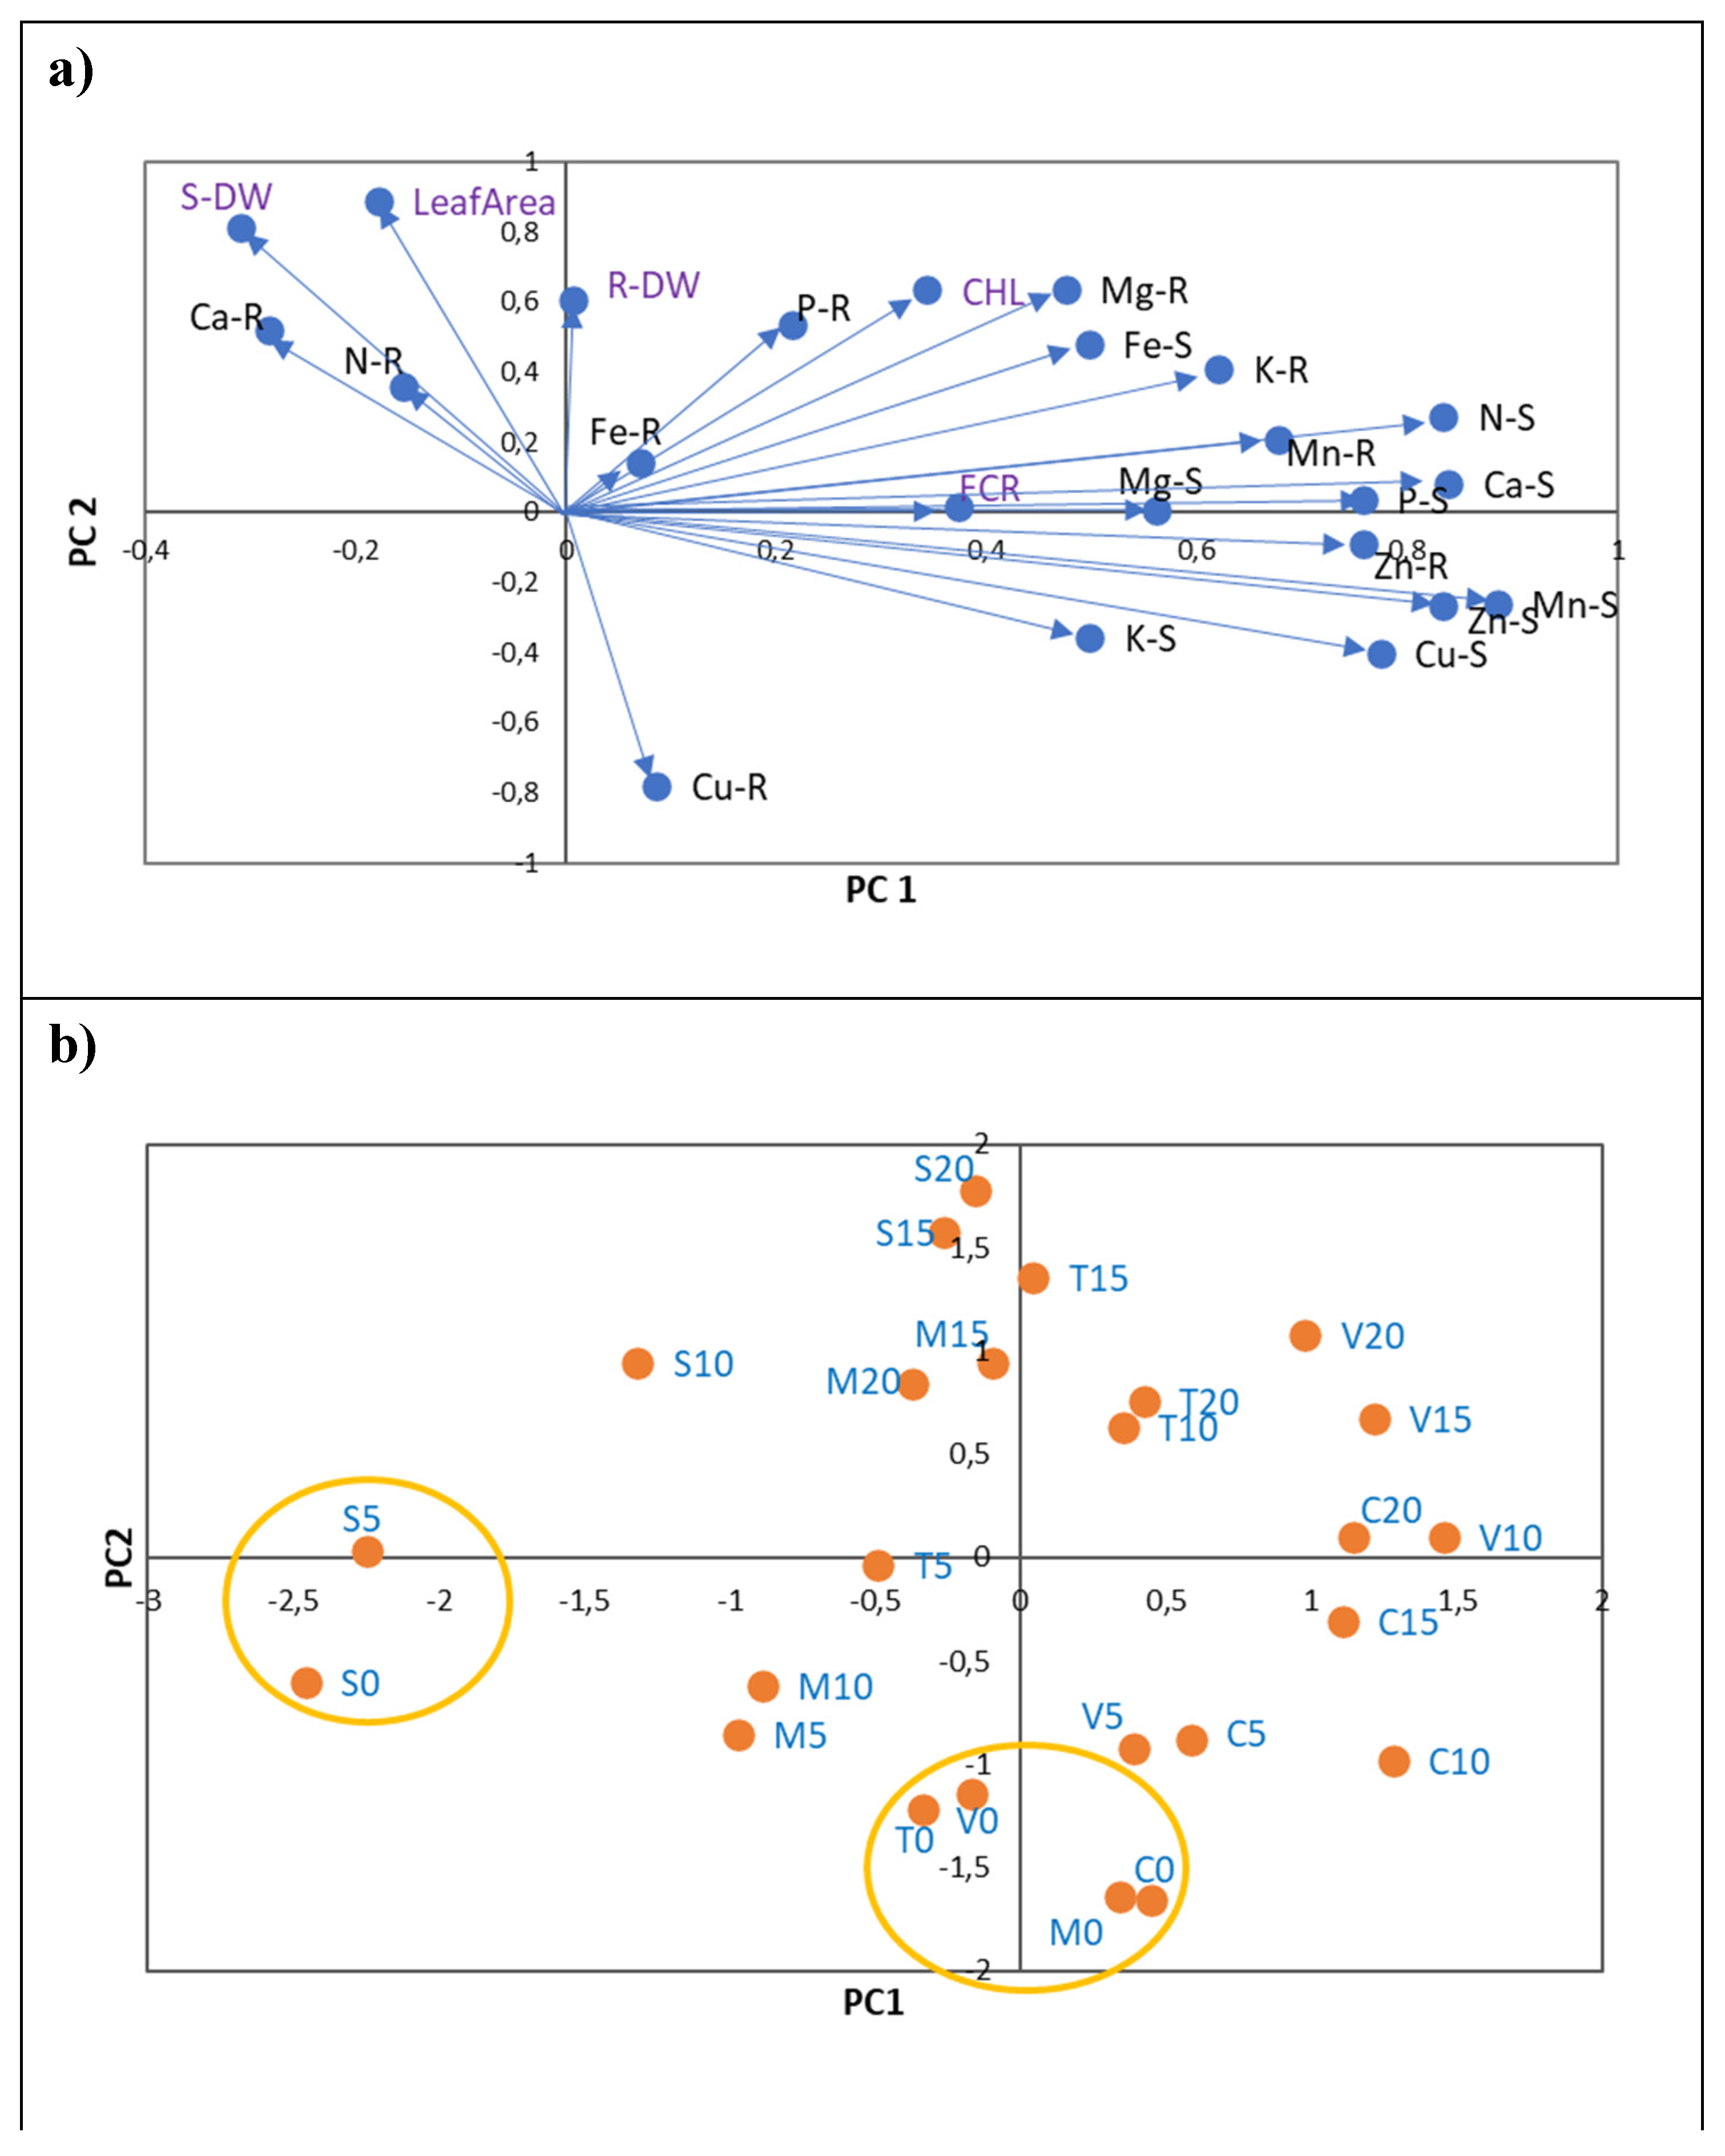
Figure 2.
a) Principal component analysis of nutrients content (in mg: N, P, K, Ca, Mg and in µg: Fe, Cu, Zn and Mn) of five citrus rootstocks considering the total in plants (roots plus shoots). PC1 - first principal component; PC2 - second principal component. Each vector represents the loadings of variables (nutrients and Fe chlorosis parameters: CHL, Leaf Area, S-DW, R-DW and FCR) in each principal component. Loadings represent the relative contribution of each nutrient to that component. b) Projection of 5 Fe levels (0, 5, 10, 15 and 20 µM of Fe) considering all rootstocks.
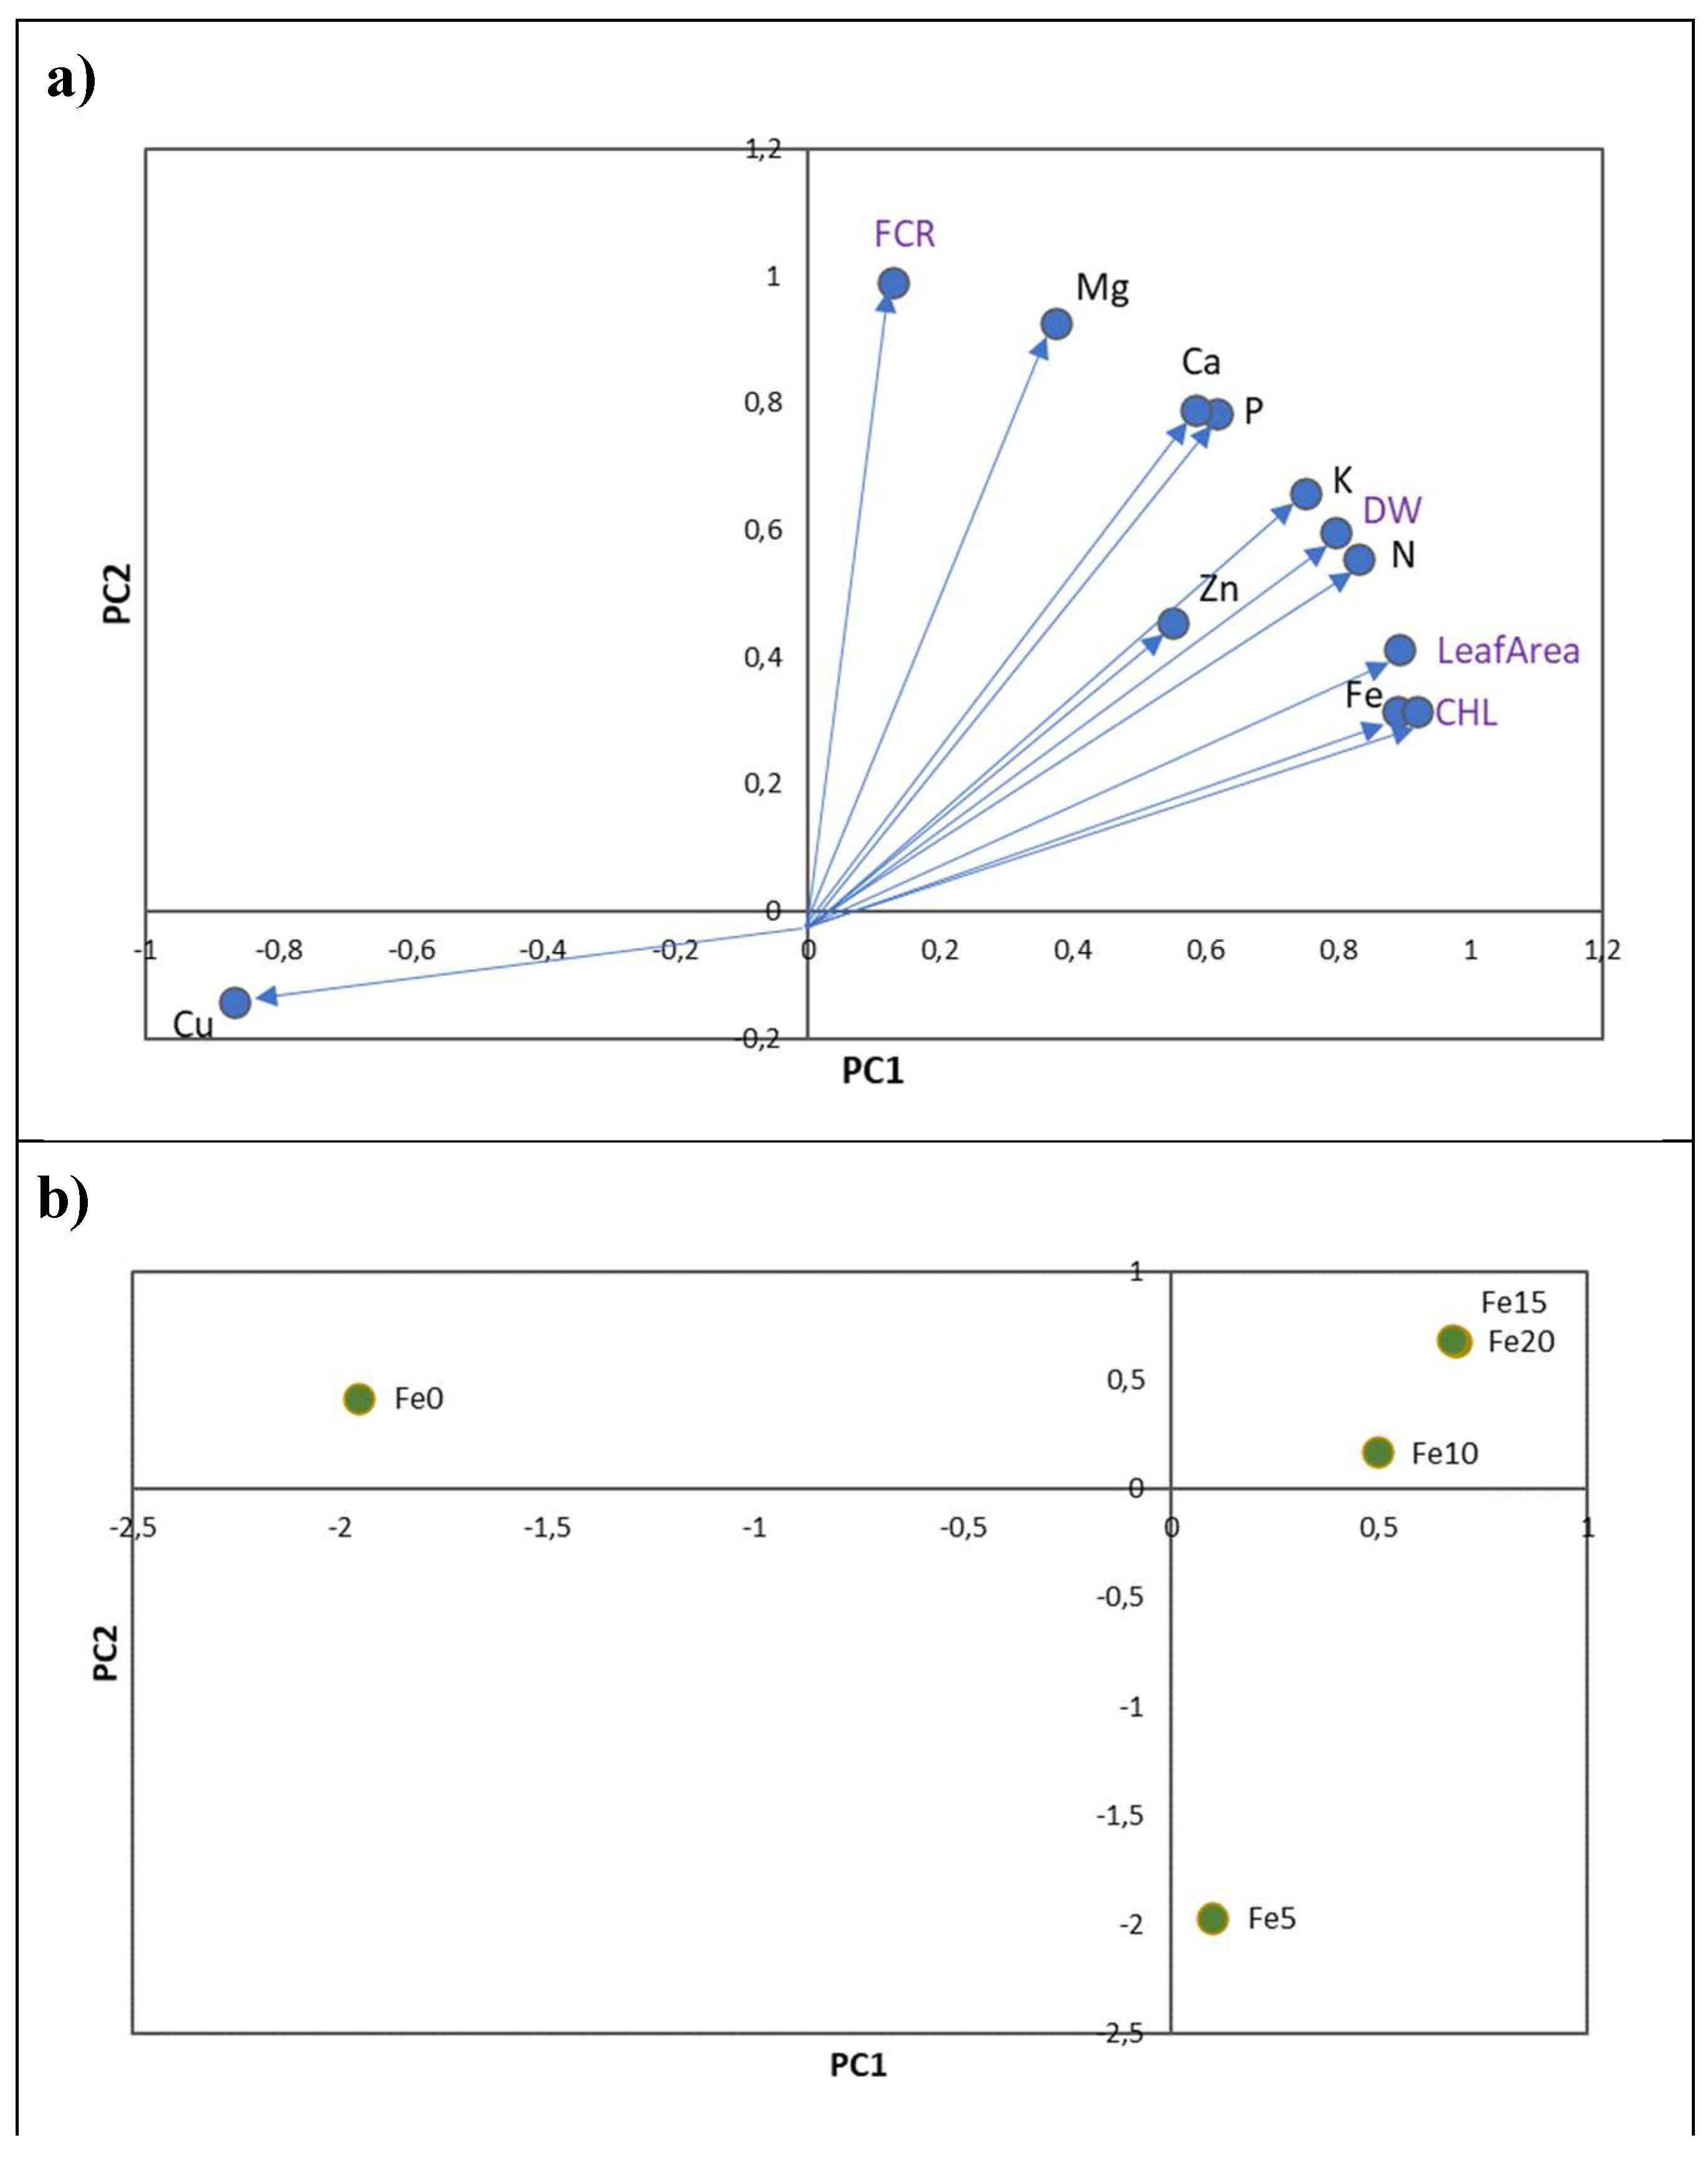
Figure 3.
Linear regression relationships between total leaf CHL (µmol m-2) and total Fe/Cu ratio for each rootstock (circles), and also considering all treatments together (purple line). Treatments are 5 rootstocks (S -Sour orange, V – Volkamer lemon, T – Toyer citrange, C – Carrizo citrange and M – C. macrophylla) x 5 Fe levels (0, 5, 10, 15 and 20 µM of Fe). The coefficient of determination (R2) was presented for each model and significant models (P < 0.05) are indicated by one asterisk (*).
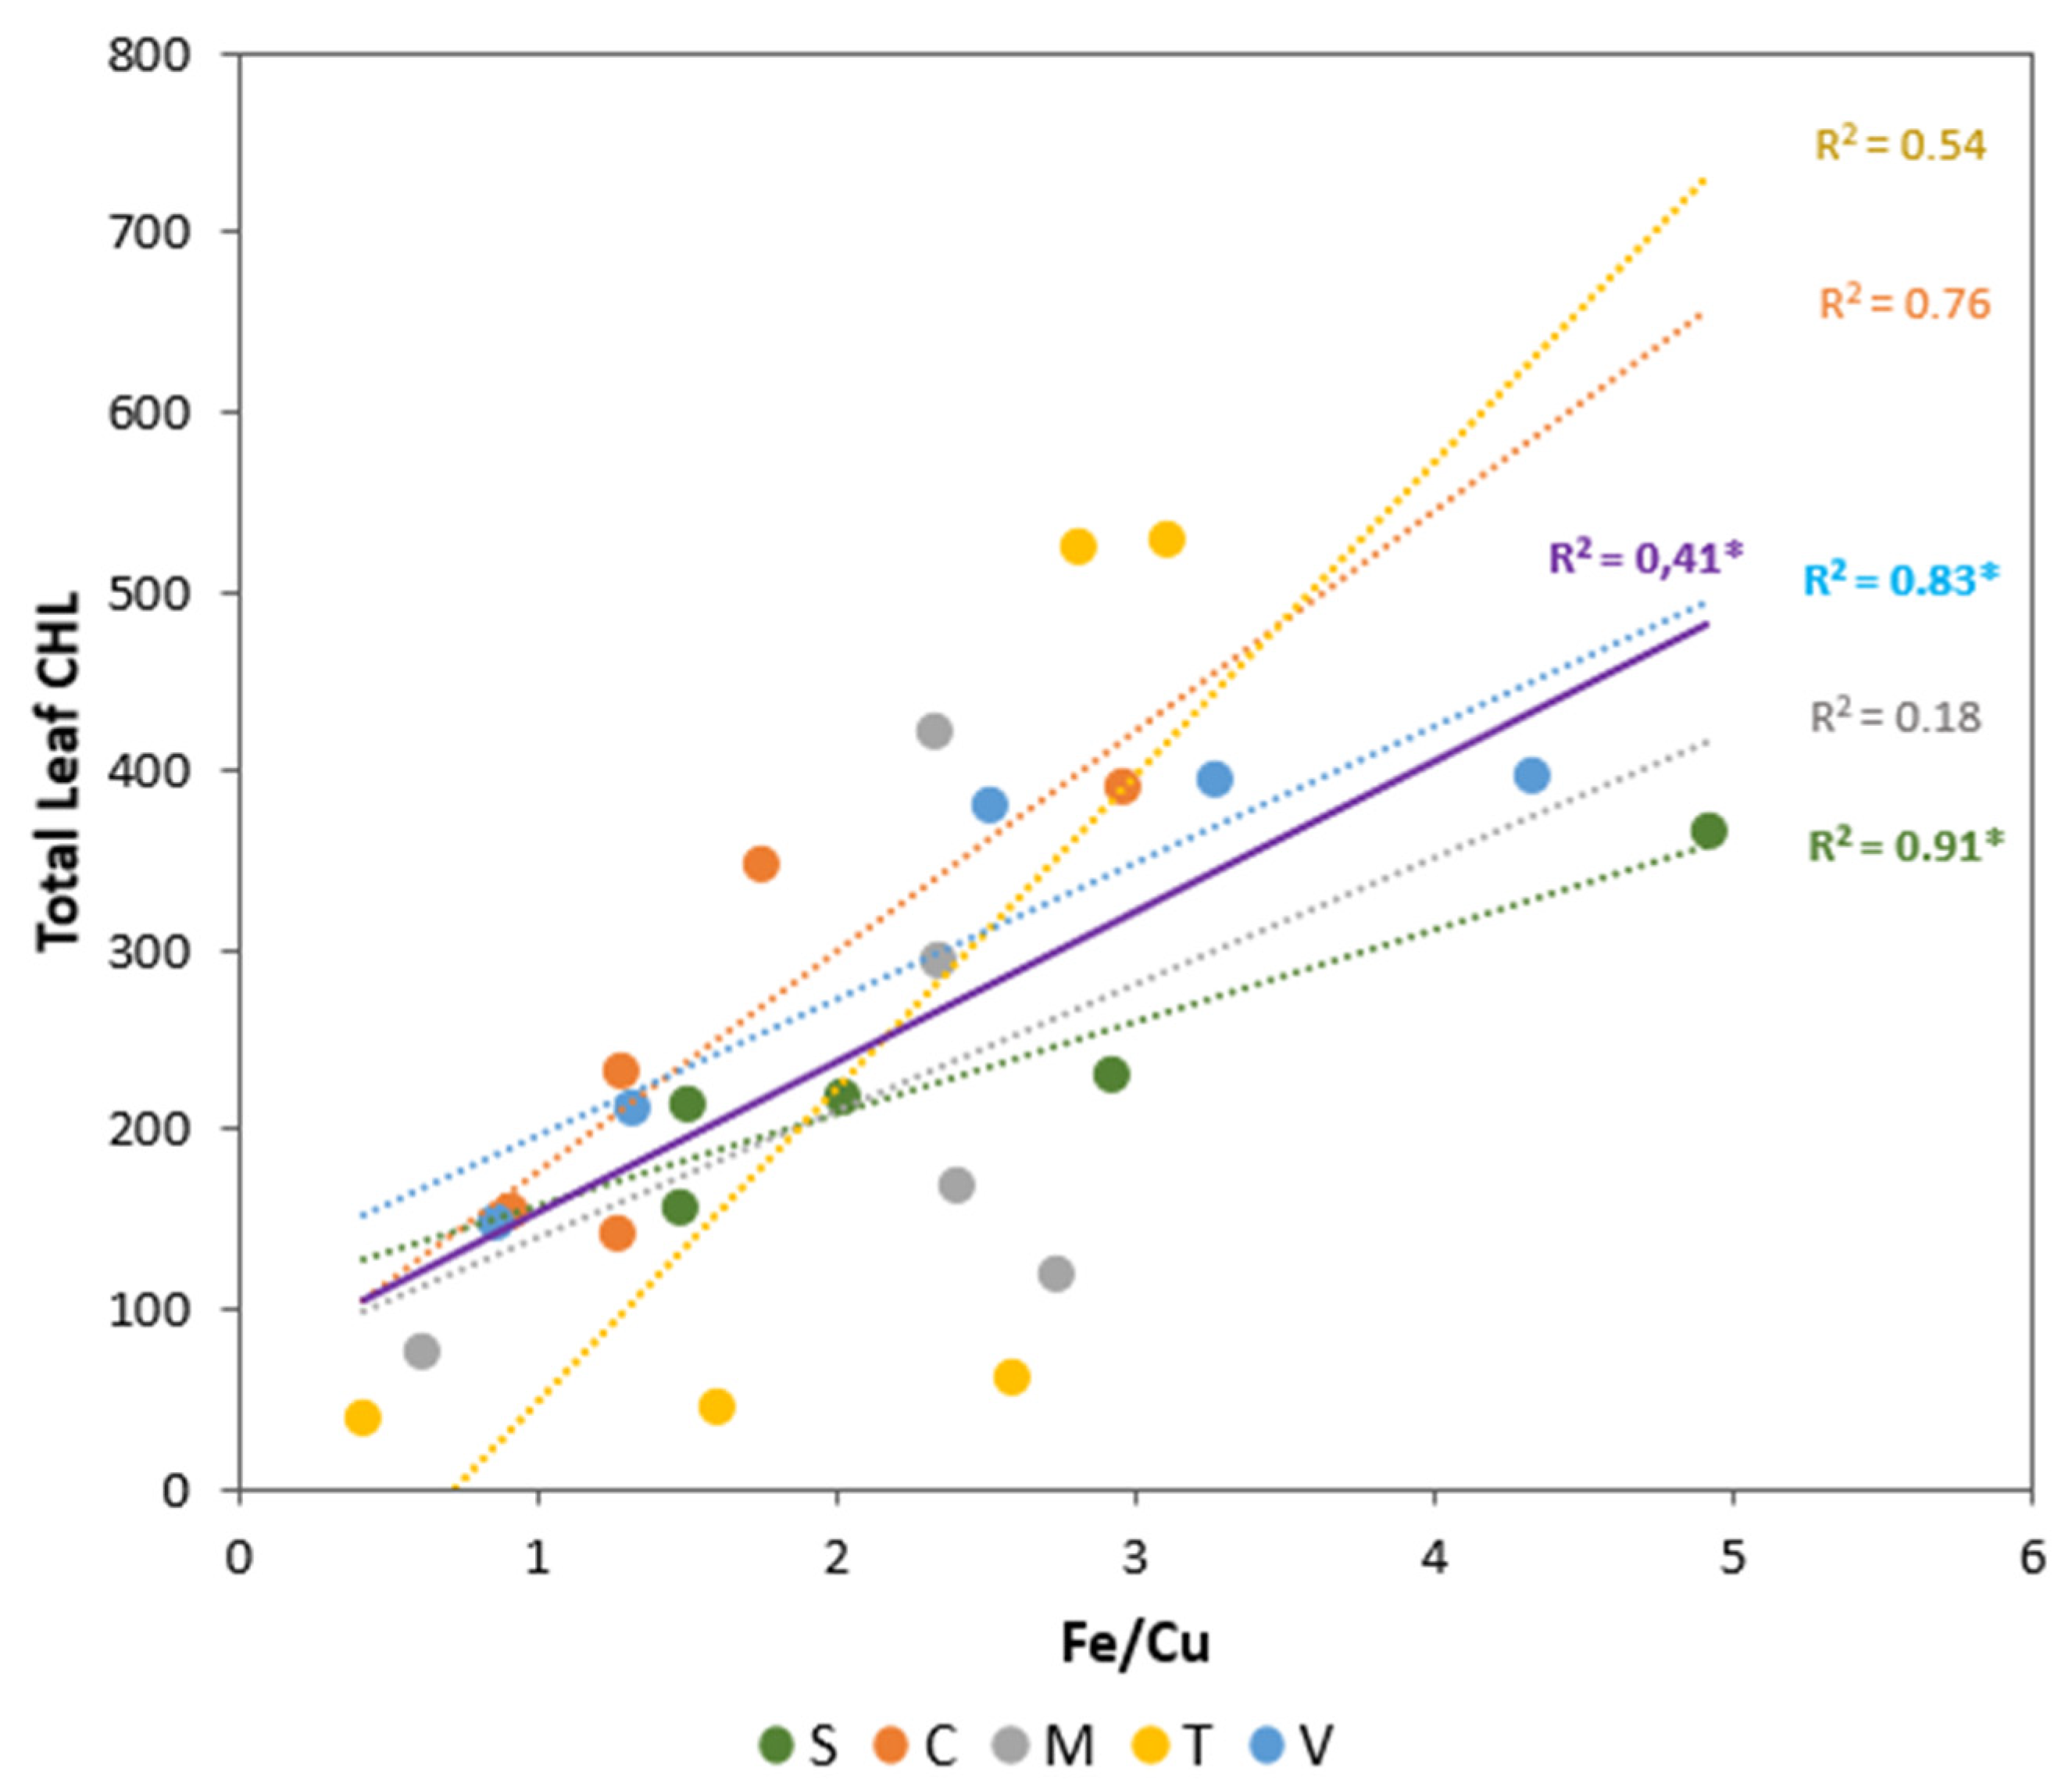

Table 1.
Total plant dry weight (DW in g), root to shoot ratio (in DW basis), total leaf chlorophyll concentration (CHL in µmol m-2 and % of variation between initial and final values), leaf area (cm2) and root ferric chelate reductase activity (FCR in nmol Fe(II) min-1 g-1 fresh weight - FW) at the end of experiment of five citrus rootstocks grown in different Fe concentrations: 0, 5, 10, 15 and 20 µM.
| Treatments | Plant DW | Root/Shoot | Leaf CHL | Leaf Area | Root FCR | |
|---|---|---|---|---|---|---|
| [µM Fe] | (g) | *µmol m-2 | % variation | (cm2) | (nmol Fe(II) min-1 g-1 FW) | |
| Sour orange | ||||||
| 0 | 1.58 a | 0.28 c | 157.9 b | -54,9% | 104.0 b | 0.66 ab |
| 5 | 1.83 a | 0.36 ab | 214.9 b | -38,6% | 119.0 ab | 0.40 b |
| 10 | 1.98 a | 0.31 bc | 218.9 b | -37,4% | 135.5 ab | 0.78 ab |
| 15 | 1.93 a | 0.45 a | 230.7 b | -34,1% | 151.5 ab | 1.79 ab |
| 20 | 1.82 a | 0.42 ab | 367.3 a | 4,9% | 179.1 a | 1.83 a |
| Carrizo citrange | ||||||
| 0 | 0.90 b | 0.59 a | 154.9 c | -66,0% | 43.9 c | 1.01 b |
| 5 | 1.22 a | 0.60 a | 142.8 c | -68,7% | 62.6 bc | 1.73 b |
| 10 | 1.06 ab | 0.59 a | 232.3 b | -49,0% | 69.7 bc | 1.15 b |
| 15 | 1.18 a | 0.60 a | 348.1 a | -23,6% | 90.2 b | 5.02 a |
| 20 | 1.28 a | 0.76 a | 391.4 a | -14,1% | 120.7 a | 1.56 b |
| C. macrophylla | ||||||
| 0 | 0.87 c | 0.59 b | 76.2 d | -81,0% | 50.4 b | 6.48 a |
| 5 | 0.77 c | 0.76 a | 169.3 c | -57,7% | 55.7 b | 0.62 c |
| 10 | 0.96 c | 0.59 b | 120.7 cd | -69,8% | 111.4 a | 1.10 c |
| 15 | 1.63 a | 0.60 b | 294.6 b | -26,3% | 120.3 a | 4.55 ab |
| 20 | 1.29 b | 0.49 b | 421.4 a | 5,4% | 146.3 a | 3.87 b |
| Troyer citrange | ||||||
| 0 | 1.48 a | 0.61 a | 39.9 b | -91,3% | 85.0 c | 0.72 c |
| 5 | 1.56 a | 0.56 a | 47.4 b | -89,7% | 101.8 b | 2.07 b |
| 10 | 1.71 a | 0.51 a | 61.1 b | -86,7% | 148.2 ab | 1.24 bc |
| 15 | 2.07 a | 0.50 a | 529.1 a | 14,2% | 174.3 a | 6.49 a |
| 20 | 1.92 a | 0.45 a | 520.3 a | 15,0% | 127.2 ab | 0.90 c |
| Volkamer lemon | ||||||
| 0 | 1.07 c | 0.44 a | 149.2 b | -61,5% | 49.3 b | 0.86 b |
| 5 | 1.31 bc | 0.43 a | 212.9 b | -45,0% | 62.1 b | 3.25 ab |
| 10 | 1.39 bc | 0.40 a | 381.8 a | -1,4% | 108.4 ab | 4.68 a |
| 15 | 1.73 a | 0.36 a | 395.7 a | 2,2% | 136.7 a | 1.38 b |
| 20 | 1.93 a | 0.36 a | 397.6 a | 2,7% | 164.2 a | 2.42 ab |
For each rootstock, and each parameter, means with the same letter were not significantly different at P < 0.05, using the Duncan’s test. * Published by Pestana et al. [19].
Table 2.
Macronutrient (mg g-1 DW) and micronutrient (µg g-1 DW) concentrations at the end of the experiment in shoots of five citrus rootstocks grown in five Fe concentrations:0, 5, 10, 15 and 20 µM.
Table 2.
Macronutrient (mg g-1 DW) and micronutrient (µg g-1 DW) concentrations at the end of the experiment in shoots of five citrus rootstocks grown in five Fe concentrations:0, 5, 10, 15 and 20 µM.
| Treatments[µM Fe] | N | P | Ca | Mg | K | Fe* | Cu | Zn | Mn | |||||||||
|---|---|---|---|---|---|---|---|---|---|---|---|---|---|---|---|---|---|---|
| Sour orange | ||||||||||||||||||
| 0 | 24.80 | a | 1.50 | b | 11.40 | a | 1.30 | a | 10.70 | c | 37.46 | b | 5.90 | a | 20.70 | b | 28.57 | ab |
| 5 | 27.46 | a | 1.35 | b | 11.80 | a | 1.45 | a | 12.70 | abc | 32.00 | b | 9.60 | a | 21.87 | ab | 18.12 | bc |
| 10 | 30.16 | a | 1.55 | b | 11.70 | a | 1.40 | a | 11.50 | bc | 40.36 | b | 7.09 | a | 24.56 | a | 16.37 | c |
| 15 | 31.50 | a | 2.07 | ab | 13.20 | a | 1.65 | a | 14.80 | a | 64.70 | a | 7.96 | a | 25.98 | a | 27.59 | abc |
| 20 | 28.95 | a | 2.49 | a | 12.35 | a | 1.45 | a | 13.60 | ab | 80.36 | a | 6.34 | a | 22.69 | a | 35.35 | a |
| Carrizo citrange | ||||||||||||||||||
| 0 | 36.84 | b | 3.68 | b | 18.45 | a | 2.20 | a | 16.35 | a | 69.35 | a | 16.32 | ab | 45.52 | c | 68.08 | b |
| 5 | 34.34 | b | 4.34 | b | 16.00 | a | 2.20 | a | 14.50 | a | 45.08 | a | 13.36 | b | 77.13 | a | 85.35 | b |
| 10 | 41.35 | ab | 6.65 | a | 14.30 | a | 2.45 | a | 15.50 | a | 57.20 | a | 27.78 | a | 57.82 | bc | 91.59 | b |
| 15 | 45.34 | a | 5.84 | a | 21.00 | a | 2.45 | a | 18.20 | a | 57.69 | a | 17.34 | ab | 66.69 | ab | 116.98 | a |
| 20 | 40.46 | ab | 6.10 | a | 20.00 | a | 2.15 | a | 17.45 | a | 78.15 | a | 16.94 | ab | 51.47 | c | 88.91 | b |
| C. macrophylla | ||||||||||||||||||
| 0 | 28.90 | a | 2.16 | b | 18.90 | a | 1.25 | a | 25.65 | a | 50.49 | a | 18.61 | a | 46.27 | a | 115.40 | a |
| 5 | 22.05 | c | 1.05 | c | 8.65 | b | 1.00 | a | 16.70 | bc | 70.63 | a | 13.27 | a | 24.41 | b | 25.99 | b |
| 10 | 21.79 | c | 1.09 | c | 8.95 | b | 1.10 | a | 15.65 | c | 69.74 | a | 13.16 | a | 24.72 | b | 22.62 | b |
| 15 | 23.73 | bc | 5.67 | a | 12.60 | ab | 1.15 | a | 21.00 | ab | 55.85 | a | 14.39 | a | 29.85 | ab | 32.53 | b |
| 20 | 26.52 | ab | 1.72 | b | 12.05 | ab | 1.20 | a | 17.60 | bc | 51.10 | a | 15.46 | a | 24.50 | b | 36.23 | b |
| Troyer citrange | ||||||||||||||||||
| 0 | 27.03 | a | 2.86 | ab | 13.75 | a | 2.15 | a | 13.25 | b | 38.41 | b | 15.46 | a | 41.63 | a | 47.43 | ab |
| 5 | 27.67 | a | 2.75 | b | 13.35 | a | 2.10 | a | 14.35 | b | 35.02 | b | 10.15 | ab | 37.07 | a | 36.56 | b |
| 10 | 30.98 | a | 2.75 | b | 15.85 | a | 2.35 | a | 16.35 | a | 42.30 | b | 10.93 | ab | 36.95 | a | 62.35 | a |
| 15 | 31.57 | a | 3.05 | ab | 14.50 | a | 2.25 | a | 13.95 | b | 44.25 | b | 6.91 | b | 36.60 | a | 40.47 | ab |
| 20 | 31.86 | a | 3.44 | a | 17.85 | a | 2.30 | a | 13.40 | b | 77.73 | a | 13.76 | ab | 39.15 | a | 60.30 | ab |
| Volkamer lemon | ||||||||||||||||||
| 0 | 23.79 | c | 1.98 | c | 17.40 | bc | 1.90 | ab | 16.75 | a | 45.40 | c | 15.14 | a | 36.97 | c | 47.00 | c |
| 5 | 30.99 | bc | 2.55 | b | 15.55 | c | 1.90 | ab | 18.55 | a | 44.68 | c | 15.64 | a | 44.13 | b | 46.35 | c |
| 10 | 37.56 | ab | 3.23 | a | 19.65 | ab | 1.80 | ab | 17.45 | a | 80.76 | bc | 17.96 | a | 55.95 | a | 79.09 | a |
| 15 | 38.28 | ab | 3.58 | a | 22.50 | a | 2.05 | a | 15.85 | a | 104.52 | ab | 16.22 | a | 48.09 | b | 56.47 | bc |
| 20 | 41.57 | a | 3.66 | a | 19.75 | ab | 1.60 | b | 16.15 | a | 123.70 | a | 17.91 | a | 37.49 | c | 70.52 | ab |
For each rootstock and each parameter, means with the same letter were not significantly different at P < 0.05, using the Duncan’s test. * Published by Pestana et al. (2011) [19].
Table 3.
Macronutrient (mg g-1 DW) and micronutrient (µg g-1 DW) concentrations at the end of the experiment in roots of five citrus rootstocks grown in five Fe concentrations: 0, 5, 10, 15 and 20 µM.
Table 3.
Macronutrient (mg g-1 DW) and micronutrient (µg g-1 DW) concentrations at the end of the experiment in roots of five citrus rootstocks grown in five Fe concentrations: 0, 5, 10, 15 and 20 µM.
| Treatments[µM Fe] | N | P | Ca | Mg | K | Fe | Cu | Zn | Mn | |||||||||
|---|---|---|---|---|---|---|---|---|---|---|---|---|---|---|---|---|---|---|
| Sour orange | ||||||||||||||||||
| 0 | 58.0 | a | 2.4 | c | 12.3 | b | 1.15 | b | 5.1 | b | 63.2 | bc | 116.3 | a | 97.0 | a | 110.1 | c |
| 5 | 67.2 | a | 1.7 | c | 7.2 | b | 1.15 | b | 5.0 | b | 53.6 | c | 67.6 | bc | 71.6 | a | 94.7 | c |
| 10 | 49.7 | a | 3.4 | bc | 11.0 | b | 1.50 | bc | 5.9 | b | 78.8 | bc | 80.5 | b | 94.4 | a | 100.1 | c |
| 15 | 42.7 | a | 14.0 | a | 30.1 | a | 2.40 | a | 6.9 | ab | 84.8 | ab | 60.5 | bc | 97.2 | a | 432.6 | b |
| 20 | 54.7 | a | 7.9 | b | 14.0 | b | 1.95 | ab | 8.5 | a | 110.6 | a | 46.2 | c | 82.8 | a | 526.7 | a |
| Carrizo citrange | ||||||||||||||||||
| 0 | 29.82 | b | 3.90 | b | 3.85 | b | 1.20 | b | 5.65 | b | 48.91 | b | 132.53 | a | 129.56 | b | 156.79 | c |
| 5 | 31.06 | b | 3.79 | b | 3.75 | b | 1.45 | ab | 6.00 | b | 83.63 | ab | 104.43 | ab | 208.12 | b | 246.60 | c |
| 10 | 33.53 | ab | 8.48 | a | 3.55 | b | 1.65 | a | 12.30 | a | 108.75 | ab | 129.83 | a | 315.25 | a | 373.80 | b |
| 15 | 48.42 | a | 4.82 | b | 14.75 | a | 1.65 | a | 8.00 | b | 99.30 | ab | 76.10 | b | 190.34 | b | 372.55 | b |
| 20 | 30.69 | b | 4.80 | b | 3.75 | b | 1.60 | a | 8.80 | b | 146.84 | a | 69.02 | b | 174.32 | b | 693.88 | a |
| C. macrophylla | ||||||||||||||||||
| 0 | 43.62 | a | 1.35 | c | 6.05 | bc | 1.55 | a | 10.80 | a | 72.95 | c | 288.03 | a | 129.15 | a | 867.85 | a |
| 5 | 32.84 | a | 1.50 | bc | 9.10 | ab | 1.35 | a | 8.10 | a | 193.92 | a | 137.79 | b | 87.00 | ab | 286.49 | b |
| 10 | 44.16 | a | 2.59 | bc | 5.75 | c | 1.25 | a | 8.30 | a | 167.49 | a | 94.31 | b | 83.03 | b | 130.42 | b |
| 15 | 35.85 | a | 3.62 | b | 10.75 | a | 1.40 | a | 8.80 | a | 119.95 | b | 79.17 | b | 63.13 | b | 128.34 | b |
| 20 | 32.26 | a | 7.59 | a | 11.10 | a | 1.40 | a | 8.00 | a | 135.54 | b | 76.50 | b | 65.48 | b | 228.83 | b |
| Troyer citrange | ||||||||||||||||||
| 0 | 25.22 | a | 2.77 | a | 4.55 | b | 1.20 | b | 6.40 | b | 39.16 | c | 217.77 | a | 141.32 | a | 269.92 | ab |
| 5 | 27.61 | a | 2.07 | b | 5.35 | ab | 1.30 | ab | 7.30 | b | 92.15 | ab | 78.26 | b | 92.59 | b | 115.97 | b |
| 10 | 25.97 | a | 2.92 | a | 6.20 | a | 1.65 | a | 8.35 | b | 123.44 | a | 50.66 | cd | 79.00 | b | 316.02 | a |
| 15 | 28.27 | a | 2.51 | ab | 6.25 | a | 1.50 | ab | 10.35 | a | 87.08 | b | 34.99 | d | 97.76 | b | 141.85 | b |
| 20 | 24.30 | a | 3.10 | a | 5.40 | ab | 1.45 | ab | 11.45 | a | 108.13 | ab | 60.16 | bc | 105.35 | b | 389.78 | a |
| Volkamer lemon | ||||||||||||||||||
| 0 | 31.27 | b | 2.68 | c | 8.30 | a | 1.50 | b | 7.65 | b | 71.52 | a | 174.89 | a | 61.00 | c | 116.36 | b |
| 5 | 41.32 | ab | 3.10 | c | 3.70 | b | 1.25 | b | 7.70 | b | 92.47 | a | 113.67 | b | 149.02 | b | 237.58 | b |
| 10 | 45.82 | a | 5.20 | a | 5.25 | b | 2.25 | a | 20.90 | a | 111.54 | a | 80.58 | c | 307.12 | a | 825.71 | a |
| 15 | 50.23 | a | 4.47 | ab | 8.05 | a | 2.35 | a | 24.20 | a | 95.97 | a | 73.04 | c | 188.08 | b | 351.90 | b |
| 20 | 48.55 | a | 4.23 | b | 6.90 | a | 1.65 | b | 19.90 | a | 128.50 | a | 60.47 | c | 79.82 | c | 788.18 | a |
For each rootstock, Fe concentration in the nutrient solution and each parameter, means of at least three replicates with the same letter were not significantly different at P < 0.05, using the Duncan’s test.
Disclaimer/Publisher’s Note: The statements, opinions and data contained in all publications are solely those of the individual author(s) and contributor(s) and not of MDPI and/or the editor(s). MDPI and/or the editor(s) disclaim responsibility for any injury to people or property resulting from any ideas, methods, instructions or products referred to in the content. |
© 2023 by the authors. Licensee MDPI, Basel, Switzerland. This article is an open access article distributed under the terms and conditions of the Creative Commons Attribution (CC BY) license (http://creativecommons.org/licenses/by/4.0/).
Copyright: This open access article is published under a Creative Commons CC BY 4.0 license, which permit the free download, distribution, and reuse, provided that the author and preprint are cited in any reuse.


