
Submitted:
26 July 2023
Posted:
28 July 2023
You are already at the latest version
Abstract
High-strength wastewaters from a variety of sources, including the food industry, domestic septage and landfill leachate, are often hauled to municipal wastewater treatment plants (WWTPs) for co-treatment. Due to their high organic loadings, these wastewaters can cause process upsets in both the WWTP’s liquid and solids treatment trains and consume organic treatment capacity, leaving less capacity available to service customers in the catchment area. A novel pre-treatment method, the Waste Activated Sludge-High Rate (WASHR) process, is proposed to optimize the co-treatment of high-strength wastewaters. The WASHR process combines the contact stabilization and sequencing batch reactor processes. It utilizes waste activated sludge from the municipal WWTP as its biomass source, allowing rapid start-up. Bench scale treatment trials of winery wastewater confirm the WASHR process can reduce loadings on the downstream WWTP’s liquid treatment and solids treatment trains. A case study approach is used to confirm the economic viability and environmental sustainability of the WASHR process compared to direct co-treatment using life cycle cost analyses and greenhouse gas emissions estimates.
Keywords:
WASHR
; co-treatment
; high-rate treatment
; high-strength wastewater
; waste activated sludge-high rate
; winery wastewater
1. Introduction
Municipal wastewater treatment plants (WWTPs) are often tasked with treating loads of high-strength wastewaters, such as septage, landfill leachate, and industrial wastewaters (MOE, 2008; Metcalf and Eddy, 2014). Commonly, these high-strength wastewaters are hauled to municipal WWTPs by truck, allowing operators to control their addition rates and locations to the overall treatment process.
Full-scale anaerobic co-digestion with municipal wastewater sludges has been shown to be effective for the treatment of a wide variety of wastewaters from the food industry, including fats, oils, and greases (FOG), dairy manufacturing wastewater, slaughterhouse wastewater and winery wastewater (WWW), among others (Carr et al., 2018; Mehariya et al., 2018; Johnson and Mehrvar, 2020a). Wastewaters generated by the food industry are often also biodegradable by aerobic biomass, and co-treatment with domestic wastewater in the aerobic bioreactors at municipal WWTPs has also been used successfully for co-treatment (Torrijos and Moletta, 1997; Eusebio et al., 2004). Septage and leachate are often co-treated in a municipal WWTP’s liquid treatment train (Metcalf and Eddy, 2014).
Despite this, there are several factors that limit the feasibility of direct co-treatment of high-strength wastewaters using existing municipal WWTP infrastructure. Even small volumes of high-strength wastewater can exert a substantial organic loading on the WWTP’s treatment trains, reducing capacity available for domestic wastewater servicing. In addition, without adequate equalization infrastructure, the rapid off-loading of hauled waste truck contents into the treatment train can cause slug-loadings, which can negatively impact both the aerobic and anaerobic treatment processes. Finally, significant variations in influent loadings can negatively impact process performance, with potential impacts including: anaerobic digester souring due to organic overloading; poor effluent quality due to insufficient aerobic reaction time and/or exceeding the available oxygenation system capacity; high sludge generation rates impacting operating solids retention time (SRT) and nitrification performance; and, poor sludge settleability impairing secondary clarifier solids capture and biomass inventory capacity of the aerobic bioreactors. These negative impacts have been observed during the co-treatment of WWW (Bolzonella et al., 2007, 2019; Johnson and Mehrvar, 2020a), a high-strength wastewater that can exert significant environmental impacts on receiving water bodies even after treatment (Johnson and Mehrvar, 2019, 2021).
The Niagara Region (Region) is the hub of Ontario, Canada’s wine industry, home to over 100 wineries (Wines of Canada, 2021), and provides over 90% of Canada’s grape growing capacity (Wines of Canada, 2017). During the vinification season, which coincides with the start of the grape harvest period in the late summer, the Region’s municipal WWTPs are subject to significant increases in the quantity and strength of WWW hauled in for co-treatment (Johnson and Mehrvar, 2020b). The current operating strategy of direct co-treatment of the WWW in either the anaerobic digesters or liquid treatment train has resulted in negative operational and performance impacts (Johnson and Mehrvar, 2020a). A more effective approach to WWW handling and treatment at the Region’s WWTPs is required to ensure continued compliance with WWTP effluent standards as the wine industry and serviced populations continue to grow.
The overall objective of this study was to develop a pre-treatment system for hauled high-strength wastewaters capable of reducing loadings on downstream municipal WWTP treatment trains, be simple to operate, minimize or eliminate the need for additional chemicals, and be economically viable and environmentally sustainable. To be able to react to rapidly changing influent loading conditions associated with the batch discharge of hauled wastewaters, the process must be capable of rapid start-up and produce effluent that is suitable for subsequent treatment in the municipal WWTP’s solid and/or liquid treatment trains.
A novel pre-treatment method, the Waste Activated Sludge-High Rate (WASHR) process, was developed to meet these objectives and an international patent application was filed for this novel technique (Mehrvar and Johnson, 2022). The process utilizes two waste streams from the municipal WWTP process and batch-wise treatment in stand-alone tankage to reduce organic loadings to the downstream WWTP’s treatment trains. The performance of the WASHR process was confirmed at the bench-scale for the treatment of high-strength WWW, and an economic analysis completed using a case study to confirm its cost effectiveness.
2. Methodology
2.1. Analytical Methods
In situ reactor dissolved oxygen (DO), temperature and pH were measured using LDO101 and PHC101 probes connected to a portable HQ30d meter (HACH, Canada). Total solids (TS), volatile solids (VS), total suspended solids (TSS), and volatile suspended solids (VSS) were analyzed as per APHA Section 5210B and Section 2540, as appropriate [16]. Samples were filtered using 0.45-micron glass Whatman filter papers.
HACH method 8000 was used for chemical oxygen demand (COD). A Shimazdu TOC-500A analyzer was used for total organic carbon (TOC). A Skalar SAN Plus 3000/5000 Segmented Flow Analyzer was used for total ammonia nitrogen (TAN) (method 155-324w/r), and total phosphorus (TP) and ortho-phosphate phosphorus (PO4-P) (method 503-324w/r).
2.2. Winery Wastewater and Anaerobic Digester Supernatant
A sample of actual WWW was collected directly from a load hauled by truck to a municipal WWTP in Niagara Region on October 7, 2019. Digester supernatant was collected directly from a secondary (unheated and unmixed) anaerobic digester from a Niagara Region municipal WWTP on October 8, 2019. Characteristics of the WWW and digester supernatant are presented in Table 1.
2.3. Mixed Liquor
Mixed liquor was collected from the aerobic bioreactors of one of Niagara Region’s conventional activated sludge (CAS) municipal WWTP on October 9, 2019. The facility has a rated capacity of 61,350 m3/d and is equipped with primary sedimentation tanks located upstream of the aerobic bioreactors, with oxygenation provided by mechanical aeration. Samples of mixed liquor were collected directly from the bioreactors on the morning of the bench-scale trials.
2.4. Experimental Set-up and Procedures
Bench-scale trials were conducted using 20-L flat bottomed, open topped containers with a diameter of 29 cm each equipped with two ceramic fine bubble diffusers, one 9 cm diameter and the other 4 cm diameter. A total aeration rate of 4.0 L/min per container was provided by an 8-outlet ActiveAQUA AAPA25L air pump (Hydrofarm, California). Reactors were operated at room temperature, with recorded temperatures varying from 16.3 to 17.4oC during testing of the contact stage and 11.1 to 16.7oC during the stabilization stage. Each aerobic reactor was seeded with 14 L of waste activated sludge (WAS) taken directly from a municipal WWTP’s bioreactor. The reactors were fed with actual WWW and anaerobic digester supernatant during the contact stage of the process, with WWW added at time zero and supernatant added at 2 h. Sodium hydroxide diluted with distilled water to 1 N was used to adjust the pH of the WWW to 8 prior to its addition to the reactors.
Over the course of the contact stage test, 1 L of supernatant and 1.7 L mixed liquor was removed from each reactor for analysis. Prior to the stabilization stage, supernatant was removed until only 6 L of settled biomass remained in each bioreactor.
3. Configuration and Performance of the WASHR Process
3.1. WASHR System Configuration, Theory, and Concept
The WASHR process is based on the contact stabilization (CS) activated sludge process that was a popular treatment scheme for municipal WWTPs in the mid-20th century but was phased-out in most jurisdictions as effluent quality requirements became more stringent [2]. In its full-scale configuration, CS consisted of a contact tank where influent wastewater was allowed to mix with the activated sludge. The residence time in the contact tank was short, generally ranging between 0.5 h and 3 h, providing enough time for contaminant sorption with the biological floc [2,17]. Solids separation of the activated sludge from the secondary effluent was accomplished in a clarifier, with treated effluent directed to additional treatment steps. To maintain consistent mixed liquor concentrations, WAS was periodically wasted from the system as needed. The return activated sludge (RAS) was pumped to an aerated stabilization tank, which provided the oxygenation and reaction time necessary for the oxidation of the organic material sorbed to the activated sludge floc. Removal efficiencies for 5-day biochemical oxygen demand (BOD5) was generally in the range of 85% to 95% for domestic wastewater; however, due to the high-rate nature of the CS system, this process provided little to no nitrification [2,17]. Figure 1 presents a process diagram of the conventional high-rate contact stabilization process.
The WASHR process utilizes the contact stabilization concept modified in several novel ways to operate as a dedicated pre-treatment system for high-strength wastewaters. Rather than seeding and maintaining a dedicated biomass within the WASHR process, each treatment cycle utilizes newly wasted WAS from the municipal WWTP’s liquid treatment train. This allows the system to be brought online when and as needed, with no start-up or acclimation period required. However, overall treatment capacity of the WASHR process is limited by the available daily WAS wasting rate from the WWTP’s main liquid treatment train.
Nutrient limitations that can affect the performance of the aerobic biological treatment are common in high-strength wastes, such as insufficient N and P in WWW [2]. To treat high-strength wastewaters that are deficient in either N and/or P, the ammonia and phosphorus rich supernatant from the municipal WWTP’s anaerobic digestion process can be added to the WASHR process as a nutrient source, without the need for additional chemicals. If anaerobic digester supernatant is not available, chemical addition could be used to add additional nutrients as needed.
In addition, while the CS process operates in a continuous mode, the WASHR process operates in batch-mode to better accommodate the periodic loads of high-strength wastewaters hauled to the WWTP by tanker trucks. Batch-wise operation also allows operational flexibility to vary the duration of aerobic biological treatment during both the contact and stabilization stages. The WASHR contact tank operates in a five-step mode similar to that of a sequencing batch reactor (SBR):
- Step 1 – Fill Cycle: WAS and high-strength wastewater is added to the contact tank. If necessary, the municipal WWTP’s effluent can be added to dilute the WAS.
- Step 2 – React Cycle: The contact tank is continuously aerated, during which time organic and other contaminants are sorbed onto the biological floc.
- Step 3 – Settle Cycle: Aeration ceases, and the contact tank contents are allowed to settle under quiescent conditions.
- Step 4 – Empty Cycle: The clarified supernatant is directed to the liquid treatment train of the municipal WWTP, and the settled biomass is transferred to the WASHR stabilization tank. At the end of this four-step process, the WASHR contact tank is empty and ready for another batch treatment cycle.
- Step 5 – Idle Cycle: The empty contact tank awaits the start of the next fill cycle.
The WASHR stabilization tank provides aerobic oxidation of the organic material captured by the biological floc during the contact stage, in a four-stage process:
- Step 1 – Fill Cycle: During the Empty Cycle of the contact stage, settled biomass is directed to the stabilization tank, which marks the start of the stabilization stage Fill Cycle.
- Step 2 – Aeration Cycle: The settled biomass is aerated continuously, allowing the biomass to continue oxidizing organic material sorbed during the contact phase.
- Step 3 – Empty Cycle: The settled, stabilized biomass is emptied out of the stabilization tank and directed to the municipal WWTP’s digestion process for further treatment.
- Step 4 – Idle Cycle: The empty stabilization tank then enters Idle Cycle, awaiting the transfer of settled biomass from the Empty Cycle of the next contact stage.
Figure 2a presents a process flow diagram of the WASHR system, while Figure 2b presents a simplified process flow diagram of the WASHR system integrated into a CAS municipal WWTP treatment process. The WASHR process could also be accommodated within any suspended growth system that generates a WAS stream, including but not limited to extended aeration, membrane bioreactor (MBR), and integrated fixed-film activated sludge processes.
The WASHR process would be best suited for high-strength wastewaters that have components that are rapidly removed via sorption to the biological floc and have a significant readily biodegradable fraction (either aerobic or anaerobic). While a portion of the aerobically biodegradable fraction is removed during the WASHR process, the anaerobically biodegradable fraction is removed during anaerobic digestion of the WASHR waste sludge in the WWTP’s anaerobic digesters.
In addition, the WASHR process could operate with minimal equipment and operational complexity for wastewaters that do not negatively affect the settleability of the activated sludge, allowing a simple, single tank configuration for the contact stage of the process. For wastewaters that negatively impact settleability, the Settle Cycle of the contact stage could be replaced with a dedicated solids separation process. A mechanical sludge thickening process, such as a rotary drum thickener (RDT), thickening centrifuge, or gravity belt thickener (GBT) could be installed to provide solids separation at the end of the contact phase. An MBR could also be used for the contact stage, providing simultaneous solids separation and sludge thickening within the contact tank. These potential process modifications are presented in Figure 3.
3.2. Bench-Scale Trials
3.2.1. WASHR System Feed Characteristics and Operating Conditions
Actual WWW was used as a complex and high-strength wastewater stream to assess the effectiveness of the WASHR process at the bench-scale. Given WWW’s low biochemical oxygen demand (BOD) to COD ratios, a significant fraction of the COD may be resistant to aerobic treatment [5,18,19]. Full-scale anaerobic treatment readily removes a significant fraction (89%) of the initial COD [5]. In addition, our own study of kinetics and co-treatment, done under separate experiments, showed that sorption is a key contaminant removal mechanism during the aerobic biological oxidation of WWW by activated sludge from municipal WWTPs, with COD removal rates of up to 98% at initial concentrations of up to 1,550 mg/L. Furthermore, our earlier bench-scale trials confirmed that pH inhibition effects could be eliminated by adjusting the WWW pH prior to addition to the aerobic biomass.
Four bench-scale reactors were run in parallel at increasing loadings of WWW (Runs A, B, C and D operating at WWW loadings of 1, 2, 3 and 4% v/v, respectively). Anaerobic digester supernatant was also added to each run (3.9% v/v) as an additional nutrient (N and P) source, while the pH of the WWW was adjusted to 8.0 using 1 N NaOH prior to its addition to each reactor. Table 2 presents detailed operating conditions for the bench-scale trials.
3.2.2. Contact Stage Performance
Figure 4 presents the removal efficiencies of COD, TOC, TSS and TAN during the contact treatment phase of the bench-scale WASHR process for all treatment runs. Removal rates were based on the initial parameter concentrations shown in Table 2 and the measured clarified effluent concentrations after 3 h and 6 h of reaction time.
After 3 h of reaction time, COD removal rates were within a narrow range, from 61.5 to 64.6%, for all runs, regardless of CODo which ranged from 1,751 to 6,639 mg/L (Figure 4a). After 6 h of reaction time, the COD removal rates further increased for the reactors subjected to the lowest initial loadings (Runs A and B) and decreased for the reactor with the highest loading (Run C). Conversely, 3-h TOC removal rates decreased as TOCo increased, varying from 56.6% (TOCo 2,302 mg/L) to 76.3% (TOCo 583 mg/L), with further improvements in TOC removal after 6 h of reaction time for all runs (Figure 4b). These results suggest rapid sorption of WWW constituents that contribute to COD and TOC, which is consistent with the finding of previous bench-scale trials using mixed liquor from four municipal activated sludge WWTPs. However, COD and TOC removal rates cannot be simultaneously maximized.
TSS removal rates (Figure 4c) were consistent between all runs, regardless of reaction time, with removal rates ranging from 84.7% (Run A at 3 h) to 86.5% (Run A at 6 h). A rapid (<6 h) incorporation of WWW solids into the biological floc was observed during previous co-treatment trials; the results of the WASHR trials suggest that WWW solids are incorporated within 3 h, and that the mixed liquor can accommodate initial TSS loadings of up to 2.3 mg TSSo/mg MLVSS without a deterioration in TSS removal.
TAN removal rates at 3 h (Figure 4d) varied between 18.5% (Run D) to 27.3% (Run A). After 6 h of contact time, removal rates decreased significantly for Run A and Run B, decreasing to 5.1% and 2.1%, respectively. Furthermore, the calculated removal rate for Run C at 6 h was negative (-3.8%), with the clarified supernatant TAN concentration (33.0 mg/L) higher than TANo (31.8 mg/L). Conversely, TAN removals for Run D increased from 18.5% at 3 h to 32.7% at 6 h. The MLSS used for the WASHR trials was from a non-nitrifying municipal WWTP. The data suggest that both the biological uptake of TAN for biomass growth and conversion of organic nitrogen to TAN is occurring during the contact phase. At lower CODo:MLVSS ratios (<4.0 mg COD/mg MLVSS), the biological uptake of TAN appears to predominate at a contact time of up to 3 h; however, by 6 h, the conversion of organic nitrogen to TAN appears to predominate. A the highest tested CODo:MLVSS ratio (5.3 mg COD/mg MLVSS), biological uptake appears to predominate throughout the entire 6 h contact time.
TP removal rates were also evaluated. For all runs, the TP removals were negative at both 3 h (ranging from -26% to -103%) and 6 h (-16% to -116%). The reason for the apparent negative TP removal is unclear; however, as with organic N, it is possible that particulate P is being converted to soluble species during the contact stage. Despite this, the TP concentration appears to exceed that initially fed to the reactors (Table 2). This may be due to presence and/or release of phosphorus present in the mixed liquor, which was not accounted for in the initial feed concentrations. The concentration of PO4-P, which is highly bioavailable, ranged between 0.16 mg/L (Run A) to 0.42 mg/L (Run D) after 6 h, suggesting solubilization may be contributing to the increase in supernatant P concentration, and confirming that P was not a limiting nutrient in the trials.
3.2.3. Stabilization Stage Performance
During the stabilization stage, the settled biomass from the contact stage is aerated (Figure 2a) to provide additional pre-treatment prior to discharge of these solids into the municipal WWTP’s solids treatment train (Figure 2b). During the contact stage, COD is removed via sorption, TSS removal is enhanced by incorporation of solids into the biological floc, and some biological oxidation is provided. The performance assessment of the WASHR process stabilization stage focused on TS, VS, TSS and COD removal rates since these are key parameters that affect the design requirements and performance of the WWTP’s digestion process, the ultimate end-point for the settled biosolids after stabilization. The characteristics of the settled biomass both pre- and post-stabilization for the key parameters are shown in Table 3.
TS removal was observed for all runs, ranging from 7.4% (Run A) to 16.6% (Run D). VS removal rates were lower, reaching a maximum of 11.6% for Run C, with a small increase in VS observed for Run A. Conversely, all runs showed negative TSS removal rates, with TSS concentrations increasing by 9.3% (Run A) to 13.1% (Run B). It can be inferred from these results that there is active biomass growth during the stabilization stage resulting in an increase in TSS, with a simultaneous reduction in VS and TS due to conversion of a portion of these solid fractions to inert, volatile or gaseous products during the aerobic biological oxidation.
Negative COD removal was observed for Run A (-21.7%), and essentially no removal (0.8%) for Run B. This may be due to the conversion of complex compounds that resist oxidation during the COD test into more readily oxidizable products, resulting in an apparent increase in COD. Therefore, the observed COD removal rates should be evaluated in terms of any trends that can be observed, rather than in terms of absolute values. COD removal rates increased for runs with higher initial COD loading rates to the contact phase, appearing to plateau for Run C and Run D (contact phase loadings of 4.0 to 5.3 mg COD/mg MLVSS).
3.3. Discussion and Analysis
The objective of the WASHR process is to provide pre-treatment of high-strength wastewaters to reduce loadings on the municipal WWTP. Typical co-treatment involves direct discharge of high-strength wastewaters into either the solid or liquid treatment trains. Conversely, the liquid-phase WASHR effluent is treated in the bioreactor and solid-phase WASHR effluent is treated in the solid’s treatment train (Figure 2b).
The results of the treatment trials suggest that initial COD loadings did not impact COD removal rates at 3 h of contact time; however, by 6 h, the reactors operated at higher initial loadings (Runs C and D at 4.0 mg and 5.3 CODo/mg MLVSS, respectively) showed no improvement or a reduction in COD removal. Conversely, TOC removal was a function of both initial loadings (mg TOC/mg MLVSS) and contact time. Over the range of initial TOC loadings tested (0.47 to 1.9 mg TOCo/mg MLVSS), TOC sorption increased with increasing reaction time and lower initial TOC to biomass loading. Therefore, it is not possible to select operating conditions that can simultaneously optimize the performance of the contact stage in terms of COD removal, TOC removal, and minimizing reactor volume (by increasing applied loading rates).
A holistic assessment approach was used to calculate the reductions in loadings to the municipal WWTP’s liquid and solids treatment trains that could be achieved via the use of the WASHR pre-treatment system as compared to directing all the WWW to either treatment train (current operating strategy). Parameters of focus of each treatment train consist of the critical design parameters for each. The loading reductions estimated using the results of the bench-scale trials are presented in Table 4. These results are based on reaction times of 3 h (contact phase) and 21 h (stabilization stage).
Pre-treating the WWW using the WASHR system rather than discharging this high-strength wastewater directly to the WWTP’s liquid treatment train has the potential to reduce COD and TOC loadings by more than 81% and TSS loadings by more than 92%, thus minimizing the potential negative impact of co-treatment on the liquid treatment train. For example, if WWW is typically added upstream of the primary clarifiers, this would reduce the potential for septic conditions which can cause odours and rising sludge in the clarifier. No matter where the point of addition to the liquid treatment train is, the WWW has a significant impact on the operation and performance of the downstream aerobic bioreactors due to its high soluble COD concentration, and minimal removal across primary clarification. Operational issues encountered include low operating DO concentration and increases in solids yield, affecting operating solids retention time (SRT).
Pre-treating the WWW using the WASHR system rather than discharging this high-strength wastewater directly to the WWTP’s solids treatment train (digestion processes) has the potential to reduce COD loadings by more than 59% and VS loadings by more than 47%. These reductions in loadings reduce the potential for digester souring, which is a risk when co-digesting high-strength wastewaters such was WWW [5], and particularly when the loadings from these high-strength wastewaters have significant temporal variations [1-3].
Based on the results of the bench-scale trials, the WASHR process can significantly reduce loadings on downstream municipal WWTP treatment processes. Operating costs are greatly reduced because this process uses two waste streams (WAS and digester supernatant) to provide biomass and nutrients to the system. In addition, the substantial reductions in loadings to the municipal WWTP’s liquid and solids treatment trains can reduce and/or eliminate upgrades needed to effectively treat high-strength waste streams, particularly those that are periodic in nature. While treatment trials of the WASHR process have thus far focused on WWW, this should be expanded to other wastes that are often hauled to municipal WWTPs, including septage, portable toilet waste, feed mill wastewater, dairy wastewater, and slaughterhouse wastewater, among others.
Despite the above, the WASHR system has several limitations. Its overall daily treatment capacity is limited by the daily mass of WAS generated by the municipal WWTP’s liquid treatment train. Furthermore, for facilities that do not have a nutrient-rich internal recycle stream (such as anerobic digester supernatant), additional chemicals may be required which would increase the operational complexity and cost of the WASHR system.
4. Economic and Environmental Impact Analysis
4.1. Capital and Operating Costs
Development of capital cost estimates associated with implementation of the WASHR process are site specific and depend on the nature and volume of the high-strength wastewater to be treated, as well as the configuration of the municipal WWTP and characteristics of its mixed liquor. In addition, although direct co-treatment in the WWTP’s solid and/or liquid treatment trains is often accomplished without implementing any upgrades, this is done at the cost of available treatment capacity [5]. To maintain available capacity to accommodate influent flows and loadings from a WWTP’s while also co-treating hauled high-strength wastewater, it is necessary to expand the capacities of key unit processes. These generally include expanding aerobic bioreactor and anaerobic digester volume, as well as ancillary equipment (blowers for bioreactors; heat exchangers, mixing systems, biogas handling systems for digesters). Developing these upgrade needs also need to be assessed on a case-by-case basis, taking into consideration the current and projected future influent flows and loadings requiring treatment, effluent targets that need to be maintained, and minimum design requirements as specified by local regulatory agencies.
Differential operations and maintenance (O&M) costs are driven by the energy needs to aerate the aerobic bioreactors of either the WASHR process and/or the WWTP’s liquid treatment train, as well as heating and mixing of the anaerobic digesters. Biogas generated during the co-digestion of high-strength wastewaters can be utilized for heating, which could offset some or all the additional anaerobic digester heating costs. In the case of treating high-strength wastewaters that are seasonal in nature, such as WWW, the digesters will be oversized during the low loading periods; however, they will still require heating and mixing, increasing year-round O&M costs. As with capital costs, O&M cost estimates will depend upon the unique characteristics of the WWTP facility and the high-strength wastewater to be treated.
The advantage of the WASHR process is that it can accommodate seasonal variations in loadings, if needed, since its start-up is immediate, and all necessary inputs are available. This is particularly important for wastewaters with seasonal variations in loadings, such as WWW. At the same time, properly co-treating the WWW directly in either the liquid or solids treatment trains not only requires providing additional aerobic bioreactor and/or anaerobic digester volume, it is also necessary to build up sufficient biomass in advance of the high-loading season to accommodate the increased loadings. Therefore, adding a food source to ensure biomass availability prior to the vintage season is used for systems treating variable WWW loadings [20], and needs to be considered in the O&M cost estimates for any co-treatment scheme.
For the purpose of this economic analysis, capital cost estimates were developed using typical engineering design approaches, including unit costs for excavation, fill, and cast-in-place concrete, estimates for major process equipment including installation, engineering, and contingency allowances at 30%. Operations and maintenance (O&M) costs were estimated using typical costs for electricity ($0.14/kWh, as per Niagara Region) and supplemental feed to the digester and/or bioreactors to increase biomass prior to vintage season assumed to be sugar with a bulk cost of $578/ton, [21]. Life cycle cost (LCC) estimates were based on 25-year period, discount rate of 4%, and energy cost escalation rate 2% per annum. All costs are reported in 2021 and are in Canadian dollars. A case study will be presented in a later section.
4.2. Quantifying Greenhouse Gas Emissions
Greenhouse gas (GHG) emission quantification needs to consider the configuration and operation of the WWTP, the methods used for biological oxidation (aerobic, anaerobic), the overall loadings of high-strength wastewater, and the efficiencies and emission rates of the biological and other processes used. For the WASHR process, GHG emissions from not only the pre-treatment system, but also the impact of the treated effluent (sent to liquid treatment train) and waste biomass (sent to the anaerobic process) must also be considered for a holistic assessment of overall impacts on GHG emissions. Similarly, the direct co-treatment of WWW in the municipal WWTP must take into consideration the impact on the aerobic bioreactors and anaerobic digesters.
Operating large equipment, such as blowers, requires considerable energy use in the form of electricity. The amount of electricity consumed can be converted into a measure of equivalent CO2 (eCO2), which varies geographically based on the type of power source available (e.g. higher eCO2/kWh for coal-fired plants vs. those with hydroelectric plants). For Ontario, this value is 0.029 kg eCO2/kWh [22].
GHG emissions are also produced during biological treatment: CO2 and N2O are released during aerobic treatment, while CO2 and CH4 are released during anaerobic treatment. The mass of each GHG emitted depends on the operation of the system as well as influent loadings. For aerobic treatment, the mass of CO2 emitted by heterotrophs per kg BOD removed has been reported to be 0.14 kg CO2/kg BOD [23]. N2O, a much stronger GHG than CO2, is generated during nitrification in the aerobic activated sludge process but is not released at appreciable levels by facilities that are not nitrifying and thus contributes little to the overall GHG emissions [23]. Anaerobic digesters generate a great deal of biogas (CH4), which is typically used as a fuel source for boilers maintaining adequate operating temperatures in the digesters, with the excess biogas flared to convert CH4 to CO2, reducing GHG potential as well as for safety. Current biogas flares can vary in terms of performance with respect to local conditions such as methane content of the gas being flared, configuration of the flare stack, and local wind conditions [24]. Generally, well operated flares can be assumed to have conversion efficiencies of 96% to 98% [24]. A value of 98% was used for this assessment.
4.3. Case Study
The feasibility of the full-scale implementation of the WASHR process was confirmed through a case study analysis. Upgrades needs were developed to provide treatment of an average of 40 m3/d (peak of 60 m3/d) of WWW during the vintage season, for a total seasonal volume of 4,800 m3 or approximately 30% of all the WWW generated in the Region of Niagara. Based on average characteristics from WWW samples collected in the Region [14], this would result in estimated average COD, TSS and VSS loadings during the vintage season of 3,400 kg/d, 496 kg/d, and 1,228 kg/d, respectively. These loading rates were used as the design basis for the economic assessment of all treatment methods. Furthermore, it was assumed that these loadings would occur over a 4-month vintage period.
The case study facility was a conventional activated sludge WWWP with anaerobic digestion located in the Region. The facility has a rated capacity of 61,350 m3/d, and is currently operating at approximately 57% of its rated capacity. The WWTP generates, on average, approximately 2,000 kg/d of WAS with an average MLVSS:MLSS ratio of 0.76.
Upgrades required to the WWTP’s liquid and solids treatment trains were developed for three treatment options (pre-treatment using the WASHR process; direct co-treatment in the liquid treatment train; and direct co-treatment in the solids treatment train) for each timeline scenario. These upgrade needs were determined based on projected influent loadings and maintaining operating conditions within standard design guideline values [1]. An allowance for the construction and operation of a new hauled waste station, including coarse screening, grit removal, equalization (30 m3), and pH adjustment was incorporated into all options. Bioreactor and/or anaerobic digestion capacity increases were assessed for each option, and capital cost estimates included allowances for increasing capacity of associated equipment, such as boilers, gas flares, digester mixing equipment, blowers, diffuser assemblies, piping, instrumentation, and other appurtenances.
In addition to the treatment options, two future loading scenarios were also considered: short-term, representing upgrades needed to address co-treatment limitations assuming modest growth (15%) in overall influent flow rates to the WWTP; and, long-term, representing upgrades needed when the WWTP is operating at 100% of its rated capacity.
The conceptual design of the WASHR process was based on a contact phase COD loading rate of 4.0 kg COD/kg MLVSS, operating MLSS concentration of 2,000 mg/L, MLVSS:MLSS ratio of 0.76, total contact phase duration of 5 h (0.5 h fill, 3 h react, 0.5 h settle, 1.0 h pump-out), and 21 h stabilization phase. Assumed WASHR performance was based on the results of the bench-scale tests at assumed removal rates of 80% COD and 92% TSS during the contact stage, and 58% COD and 47% TS removal during the stabilization stage. Capital costs included allowances for a single contact phase tank (200 m3) and a four-celled stabilization tank (400 m3 total volume), necessary aeration system and blowers, pumps and piping, and other appurtenances. Upgrades required to the WWTP’s bioreactors, oxygenation system, anaerobic digesters and biogas handling systems were considered for all three WWW treatment options. The projected upgrades were developed based on typical design guideline requirements for Ontario municipal WWTPs [1]. Table 5 presents a summary of the capital, O&M, LCCs, and GHG emissions for the three upgrade options, for both the short- and long-term scenarios.
The LCC assessment confirms the economic viability of the WASHR, with overall costs for both the short-term ($47.88/m3) and long-term ($67.31/m3) scenarios is significantly less than co-treatment in the liquid treatment train ($54.15/m3 and $89.04/m3 for short- and long-term) and slightly higher than anaerobic co-treatment ($43.37/m3 and $54.08/m3). Furthermore, from a greenhouse gas (GHG) emissions perspective, the WASHR process would result in 959 to 960 tonnes eCO2/yr, which is significantly less than anaerobic co-treatment (2,204 to 2,205 tonnes eCO2/yr). Therefore, the WASHR process provides a good balance between cost effectiveness while also minimizing environmental impact.
5. Conclusions
A novel pre-treatment process (WASHR) was developed to optimize the co-treatment of hauled, high-strength wastewaters. The process is a combination and modification of the contact stabilization and SBR treatment processes and is operated in batch mode to accommodate the batch-nature of WAS wasting and receipt of hauled loads to municipal WWTPs. The WASHR process can be integrated into most municipal WWTPs, provided it is a suspended growth, aerobic treatment process that generates a WAS stream. The advantages of the WASHR process include that, although it is a biological treatment system, it can be brought online as needed, with no start-up or acclimation period needed. It also utilizes waste streams from the WWTP (WAS as well as digester supernatant, if available or needed), reducing costs. However, the capacity of the WASHR process is limited by the available WAS wasting rate from the WWTP’s main liquid treatment train.
Bench-scale trials confirm that the WASHR process, vs. direct co-treatment, can reduce COD and TSS loadings to the WWTP’s liquid treatment train by more than 81% and 92%, respectively, and to the solid’s treatment train by more than 59% and 30%, respectively. Furthermore, the implementation of the WASHR pre-treatment system could reduce or eliminate operational concerns associated with direct co-treatment, including: the development of septic conditions and odour generation in the primary clarifiers, low operating DO in the bioreactors, excessive sludge yield reducing operating SRT, digester overloading and souring, and exceeding the capacity of the biogas handling system, resulting in safety concerns.
A detailed economic and environmental impact analysis, using a case study approach, confirmed that the pre-treatment WASHR process has a lower cost than that in the direct co-treatment in the liquid treatment train, and smaller GHG footprint than that in the direct co-digestion in the solid’s treatment train. When incorporating the potential for carbon offsetting, the WASHR process has the potential to significantly reduce both GHG emissions and LCC costs compared to direct co-treatment.
6. Patents
A PCT patent (PCT/CA2022/050507 (WO 2022/204823)) was filed in April 2022 as a result of this study. This manuscript covers the novel method of high strength wastewater treatment in details.
Author Contributions
Conceptualization, M.B.J. and M.M.; methodology, M.B.J.; formal analysis, M.B.J.; writing—original draft preparation, M.B.J.; writing—review and editing, M.M.; supervision, M.M. All authors have read and agreed to the published version of the manuscript.
Funding
This research was funded by Natural Sciences and Engineering Research Council of Canada (NSERC) and Toronto Metropolitan University Faculty of Engineering and Architectural Science Dean’s Research Fund.
Data Availability Statement
Data is contained within the article.
Acknowledgments
The authors would like to thank the Region of Niagara (Canada) for providing data used in this study. The financial support of the Natural Sciences and Engineering Research Council of Canada (NSERC), the Region of Niagara (Ontario, Canada), and Toronto Metropolitan University Faculty of Engineering and Architectural Science Dean’s Research Fund is greatly appreciated.
Conflicts of Interest
The authors declare that a PCT patent (PCT/CA2022/050507 (WO 2022/204823)) was filed in April 2022 as a result of this study [15]. The funders had no role in the design of the study; in the collection, analyses, or interpretation of data; in the writing of the manuscript; or in the decision to publish the results”.
References
- MOE (2008). Ministry of the Environment Design Guidelines for Sewage Works. Available online at https://www.ontario.ca/document/design-guidelines-sewage-works-0 (accessed: October 2018).
- Metcalf & Eddy, Tchobanoglou, G, Stensel, D, Tsuchihashi, R, Burton, F L (2014). Wastewater engineering: treatment and resource recovery. 5th ed. (McGraw-Hill Education: New York, NY, USA). ISBN 978-0-07-340118-8.
- Carr S, Kobylinski E, Long J, Swezy R, Nolkemper D (2018). What to consider before you co-digest FOG. Water Environment and Technology, November 2018, 24-29.
- Mehariya S, Patel, A K, Obulisamy P K, Punniyakotti E, Wong J W C (2018). Co-digestion of food waste and sewage sludge for methane production: current status and perspective. Bioresource Technology, 265: 519-531. [CrossRef]
- Johnson M B, Mehrvar M (2020a). Winery wastewater management and treatment in Niagara Region, Ontario, Canada: A review and analysis of current regional practices and treatment performance. Canadian Journal of Chemical Engineering, 98: 5-24. [CrossRef]
- Torrijos M, Moletta R (1997). Winery wastewater depollution by sequencing batch reactor. Water Science and Technology, 35(1): 249-257. [CrossRef]
- Eusebio A, Petruccioli M, Lageiro M, Federici F, Duarte J (2004). Microbial characterisation of activated sludge in jet-loop bioreactors treating winery wastewaters. Journal of Industrial Microbiology and Biotechnology, 31(1): 29-34. [CrossRef]
- Bolzonella D, Zanette M, Battistoni P, Cecchi F (2007). Treatment of winery wastewater in a conventional municipal activated sludge process: five years of experience. Water Science and Technology, 56(2): 79-87. [CrossRef]
- Bolzonella D, Papa M, Da Ros C, Muthukumar L A, Rosso D (2019). Winery wastewater treatment: a critical overview of advanced biological processes. Critical Reviews in Biotechnology, 39(4): 489-507. [CrossRef]
- Johnson M B, Mehrvar M (2019). An assessment of the grey water footprint of winery wastewater in the Niagara Region of Ontario, Canada. Journal of Cleaner Production, 214: 623-632. [CrossRef]
- Johnson M B, Mehrvar M. From field to bottle: water footprint estimation in the winery industry (2021). In: Muthu, S S , ed. Water Footprint Assessment and Case Studies”, part of series: Environmental Footprints and Eco-design of Products and Processes, Springer Nature, Singapore, 103-136.
- Wines of Canada (2021). List of Ontario, Canada Wineries. Available online at http://www.winesofcanada.com/list_ont.html (accessed April 22, 2021).
- Wines of Canada (2017). Ontario. Available online at www.winesofcanada.com/Ontario.html (Accessed 29 May 2017).
- Johnson M B, Mehrvar M (2020b). Charactersing winery wastewater composition to optimize treatment and reuse. Australian Journal of Grape and Wine Research, 26(4): 410-416. [CrossRef]
- Mehrvar M., Johnson M B (2022). Method and system for pre-treating high strength wastewater. International Patent Application No. PCT/CA2022/050507 (WO 2022/204823).
- APHA (American Public Health Association) (2012) Standard Methods for the Examination of Water and Wastewater, 22nd Edition, Washington, DC, ISBN 0875530133.
- Ganczarczyk J (1983) Activated sludge process: theory and practice. New York, NY. ISBN 0-8247-1758-9.
- Bustamante M A, Paredes C, Moral R, Moreno-Caselles J, Perez-Espinosa A, Perez-Murcia M D (2005). Uses of winery and distillery effluents in agriculture: characterisation of nutrient and hazardous components. Water Science and Technology, 51(1), 145-151. [CrossRef]
- Lofrano G, Meric S (2016). A comprehensive approach to winery wastewater treatment: a review of the state-of-the-art. Desalination and Water Treatment, 57: 3011-3028. [CrossRef]
- Wines and Vines (2021). B.C. winery ferments water – Tantalus Vineyards purifies wastewater in sequencing batch reactor. Availabel online at https://winesvinesanalytics.com/news/article/87687/BC-Winery-Ferments-Water (accessed April 22, 2021).
- International Sugar Organization (2021). Daily sugar prices. https://www.isosugar.org/prices.php (Accessed April 22, 2021).
- Environment and Climate Change Canada (2020). National Inventory Report 1990-2018: Greenhouse gas sources and sinks in Canada – Part 3, Table A13-7. Available online at http://publications.gc.ca/collections/collection_2020/eccc/En81-4-2018-3-eng.pdf (accessed April 22, 2021).
- Caivano M, Bellandi G, Mancini I M, Masi S., Brienza R, Panariello S, Gori R, Caniani D (2017). Monitoring the aeration efficiency and carbon footprint of a medium-sized WWTP: experimental results on oxidation tank and aerobic digester. Environmental Technology, 38(5): 629-638. [CrossRef]
- Gogolek P (2012). Methane emission factors for biogas flares. International Flame Research Foundation. ISSN 2075-3071. Available online at https://ifrf.net/research/archive/methane-emission-factors-for-biogas-flares/# (accessed April 28, 2020).
Figure 1.
Process flow diagram of the contact stabilization activated sludge process.
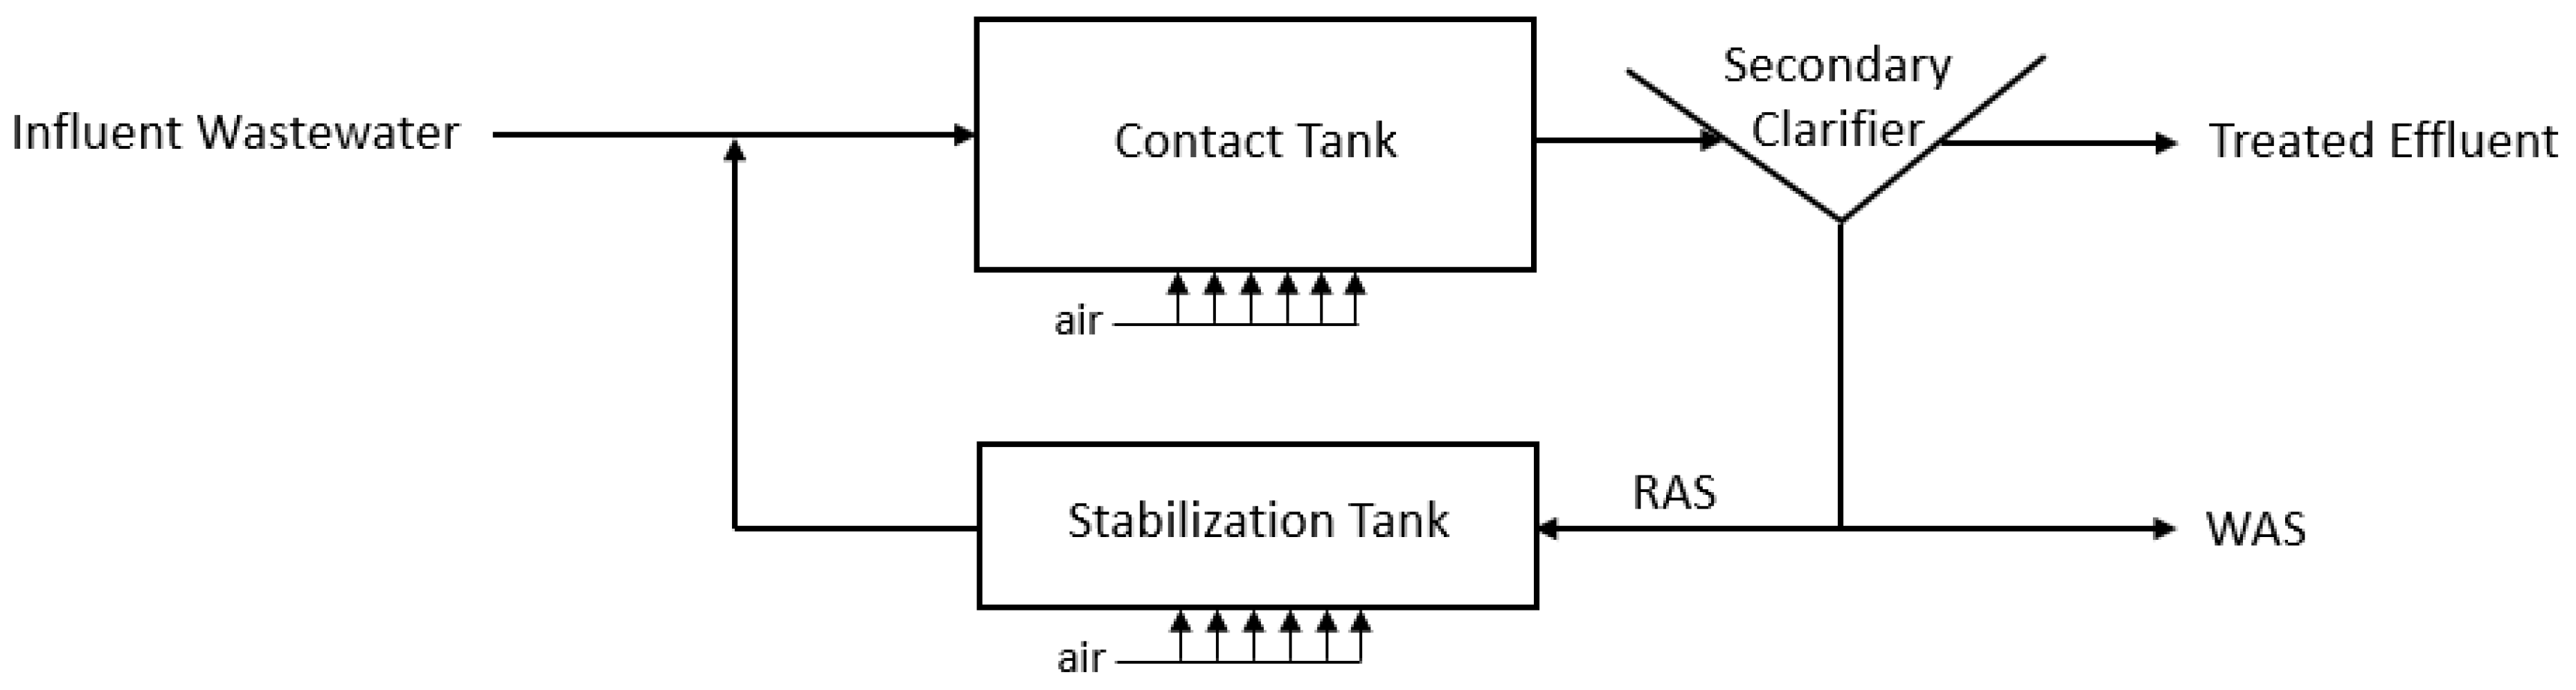
Figure 2.
WASHR process: a) detailed process flow diagram and, b) simplified process flow diagram showing its integration into an existing CAS municipal WWTP treatment process.
Figure 2.
WASHR process: a) detailed process flow diagram and, b) simplified process flow diagram showing its integration into an existing CAS municipal WWTP treatment process.
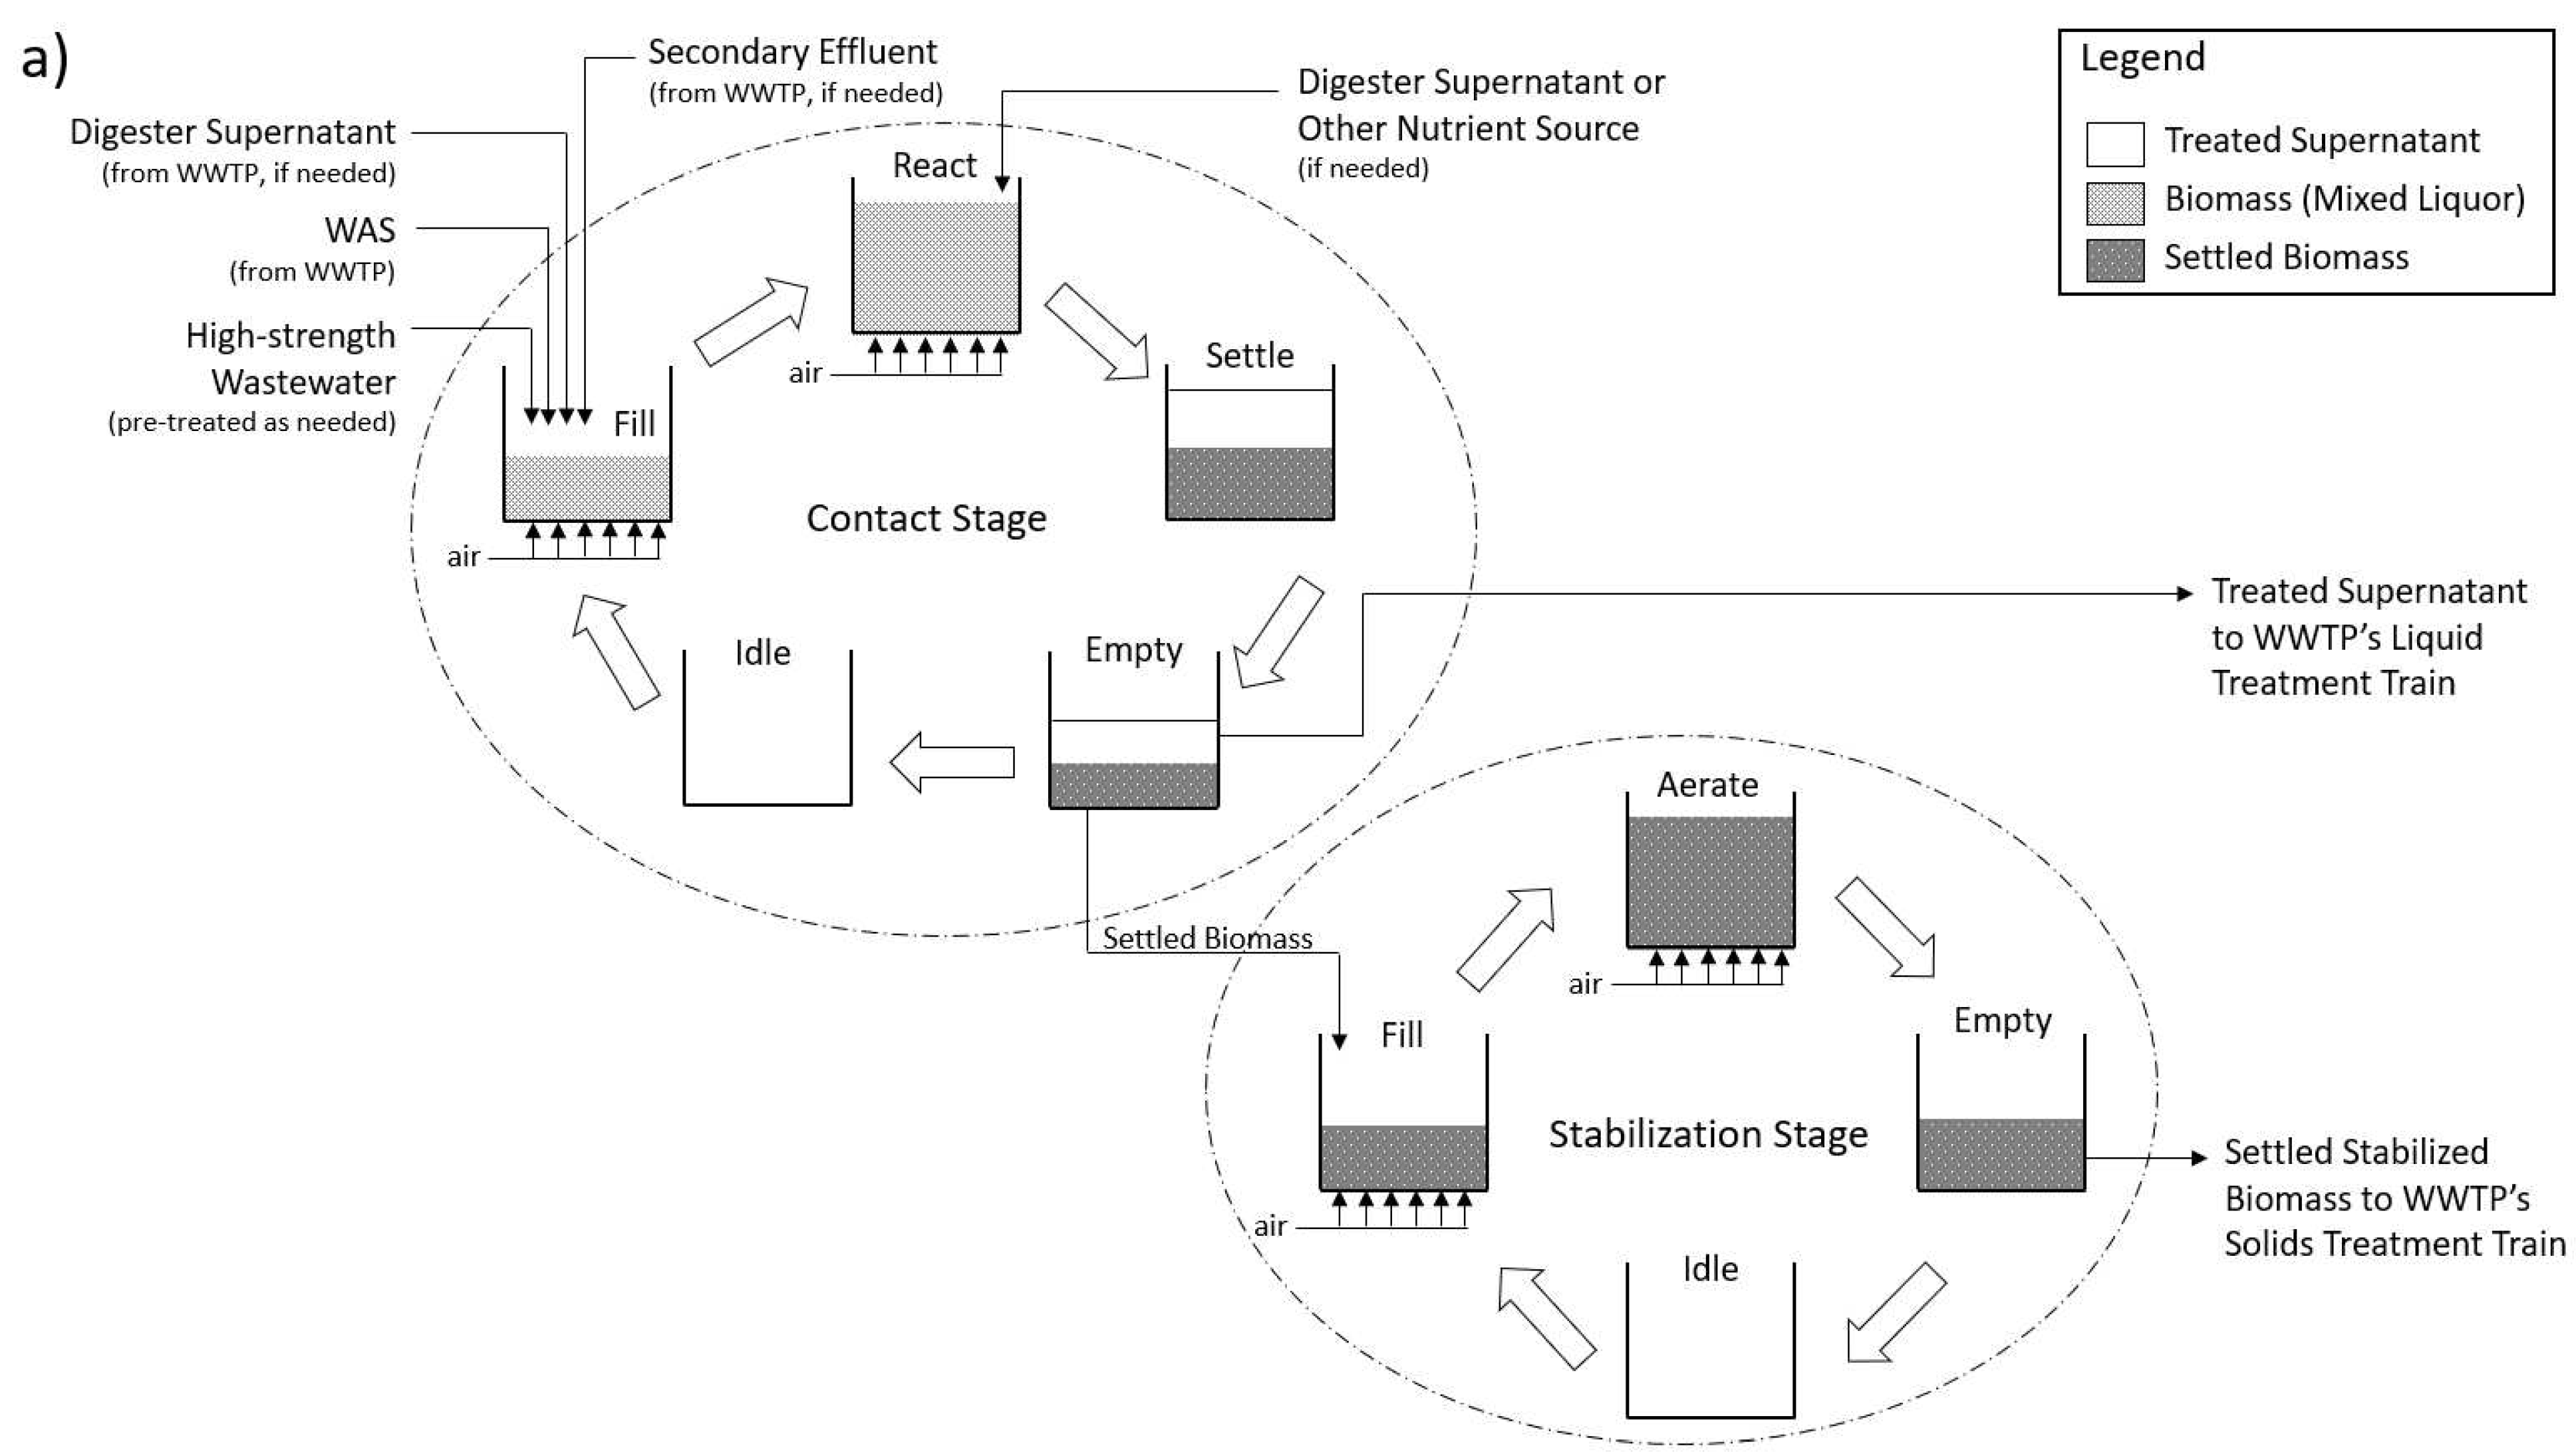
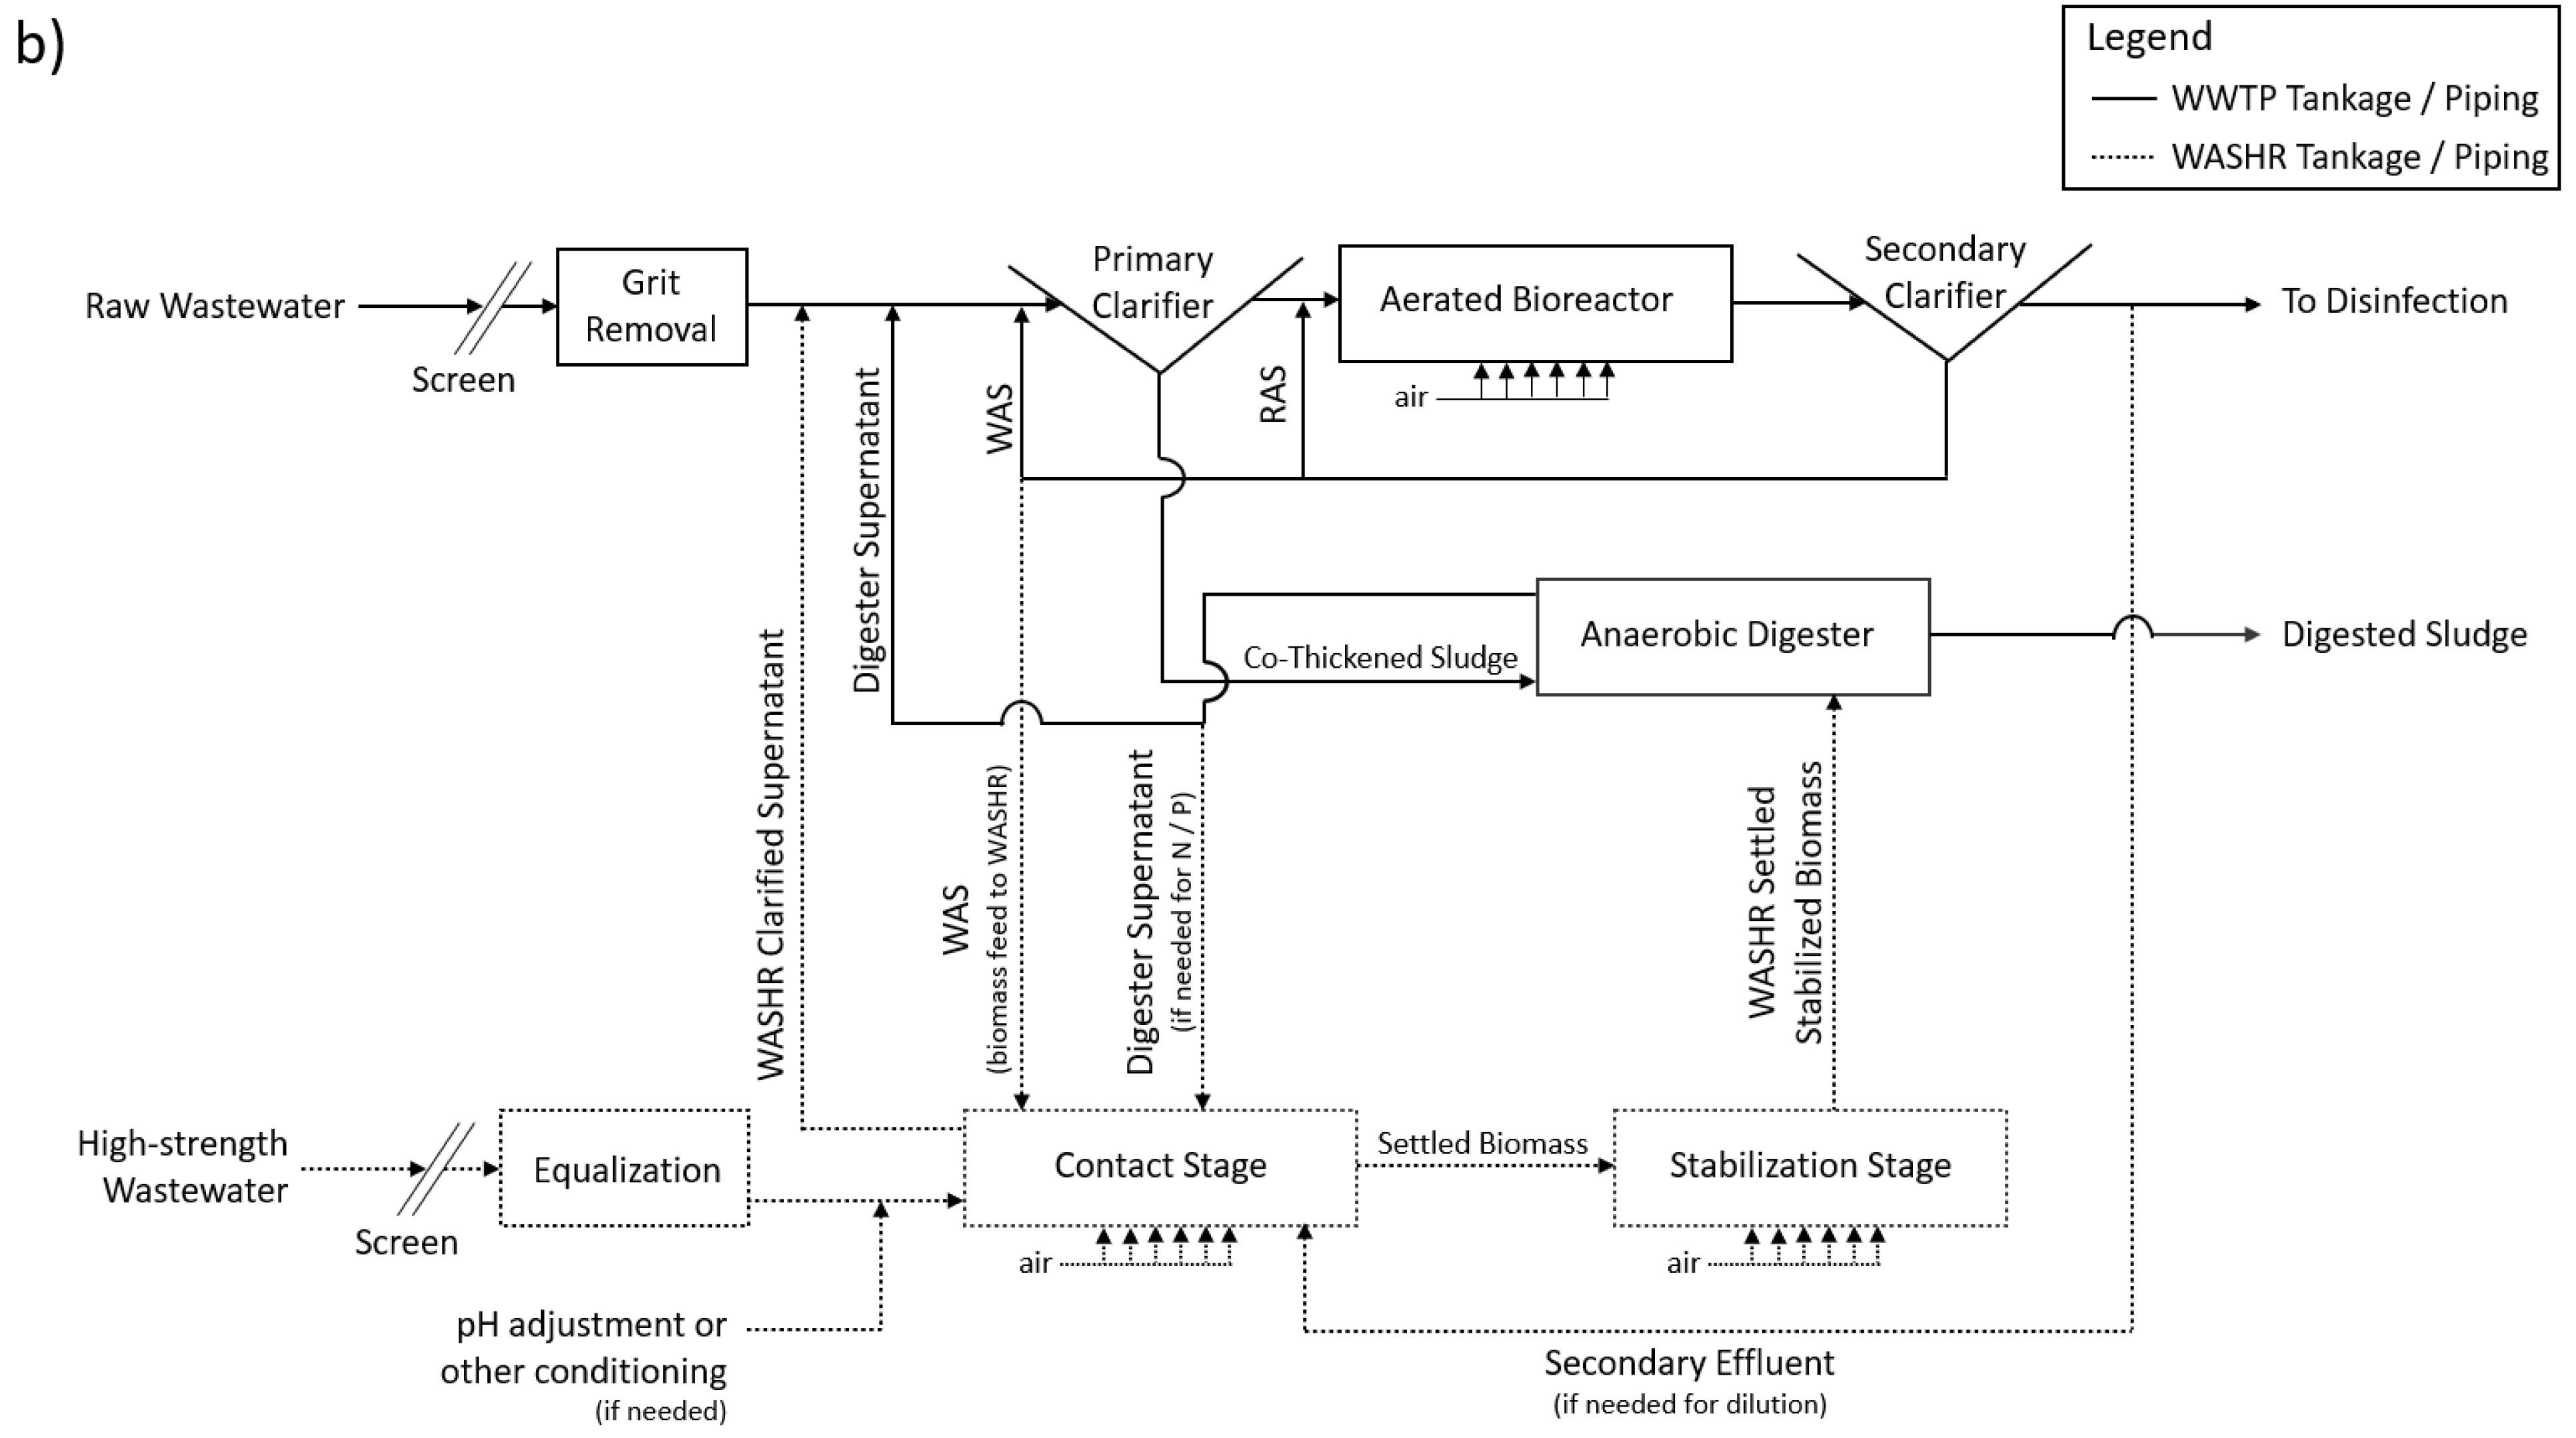
Figure 3.
Potential modification to the WASHR process treating wastewaters that negatively affect sludge settleability.
Figure 3.
Potential modification to the WASHR process treating wastewaters that negatively affect sludge settleability.
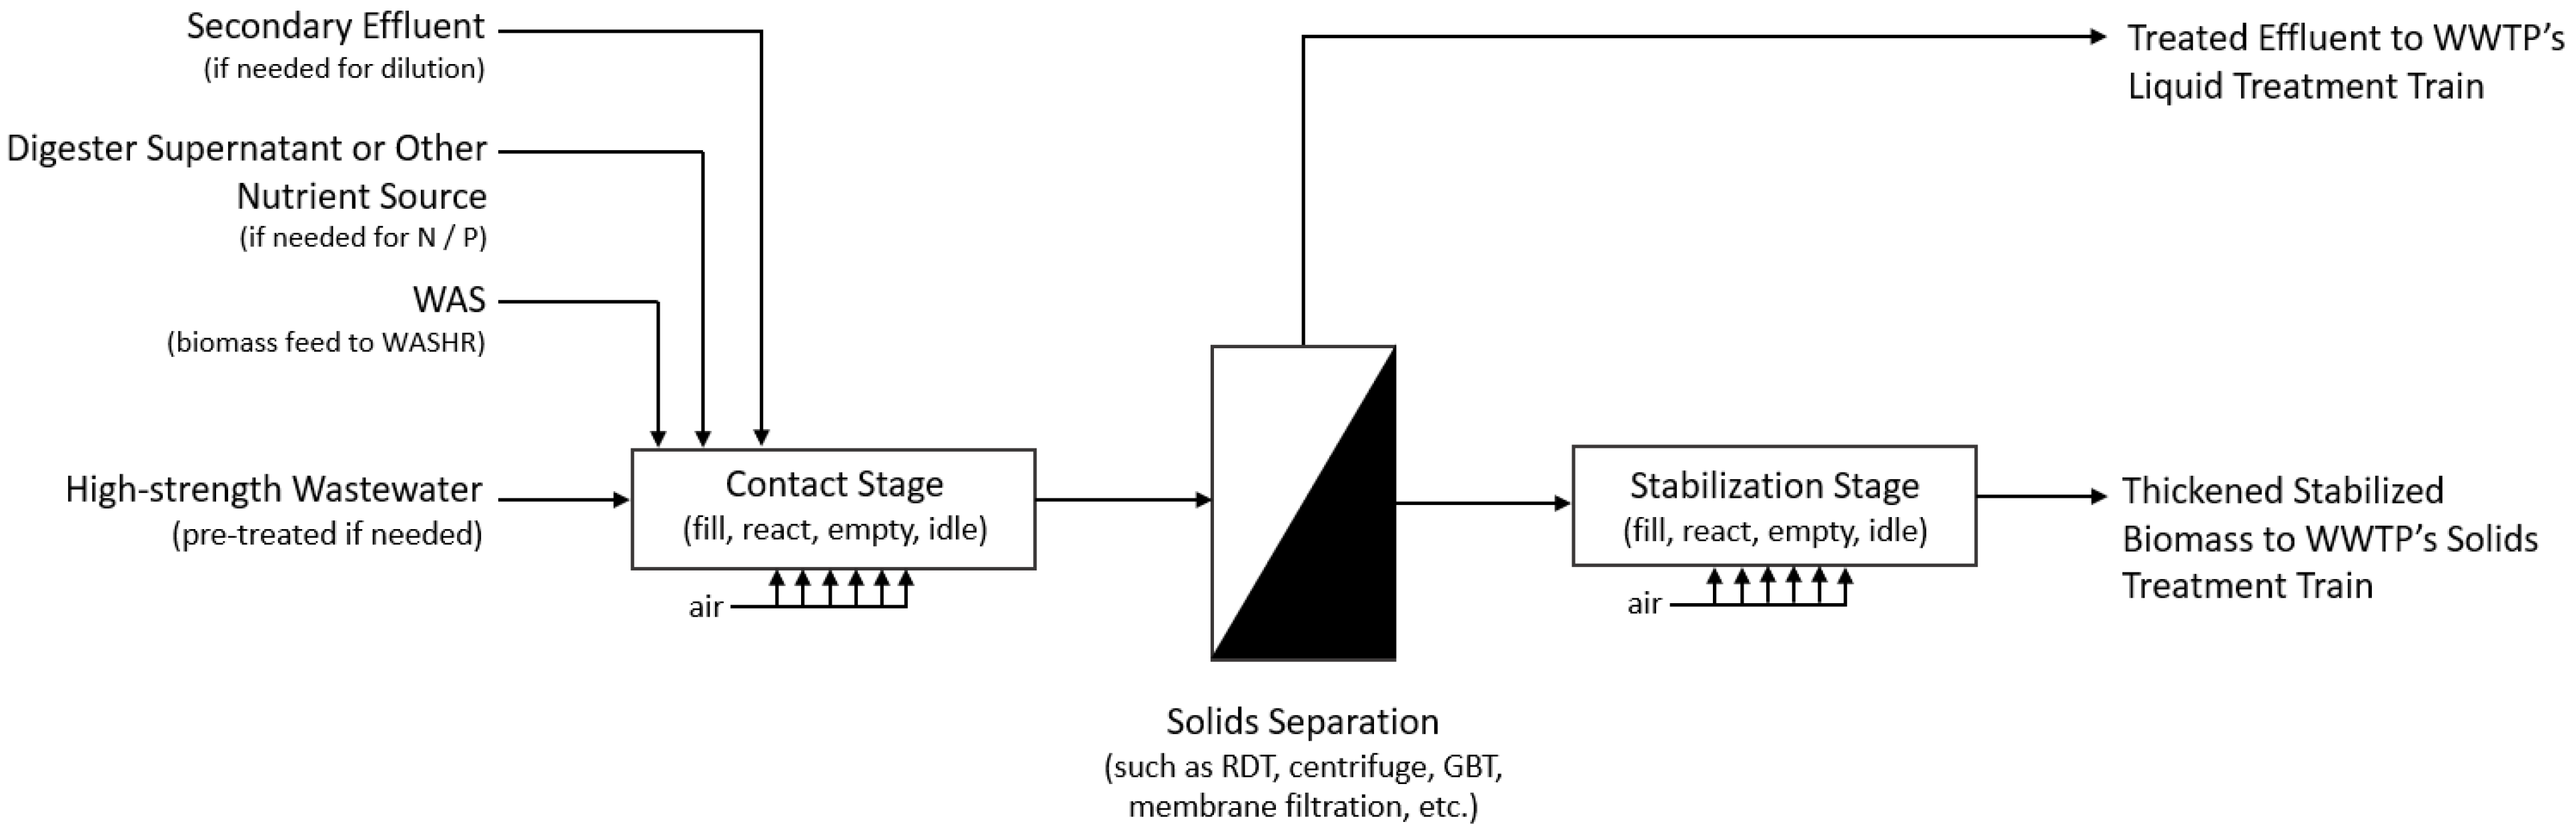
Figure 4.
Results of removal efficiencies during the contact phase of the bench-scale WASHR treatment of WWW after reaction cycle times of 3 h and 6 h for a) COD, b) TOC, c) TSS, d) TAN.
Figure 4.
Results of removal efficiencies during the contact phase of the bench-scale WASHR treatment of WWW after reaction cycle times of 3 h and 6 h for a) COD, b) TOC, c) TSS, d) TAN.
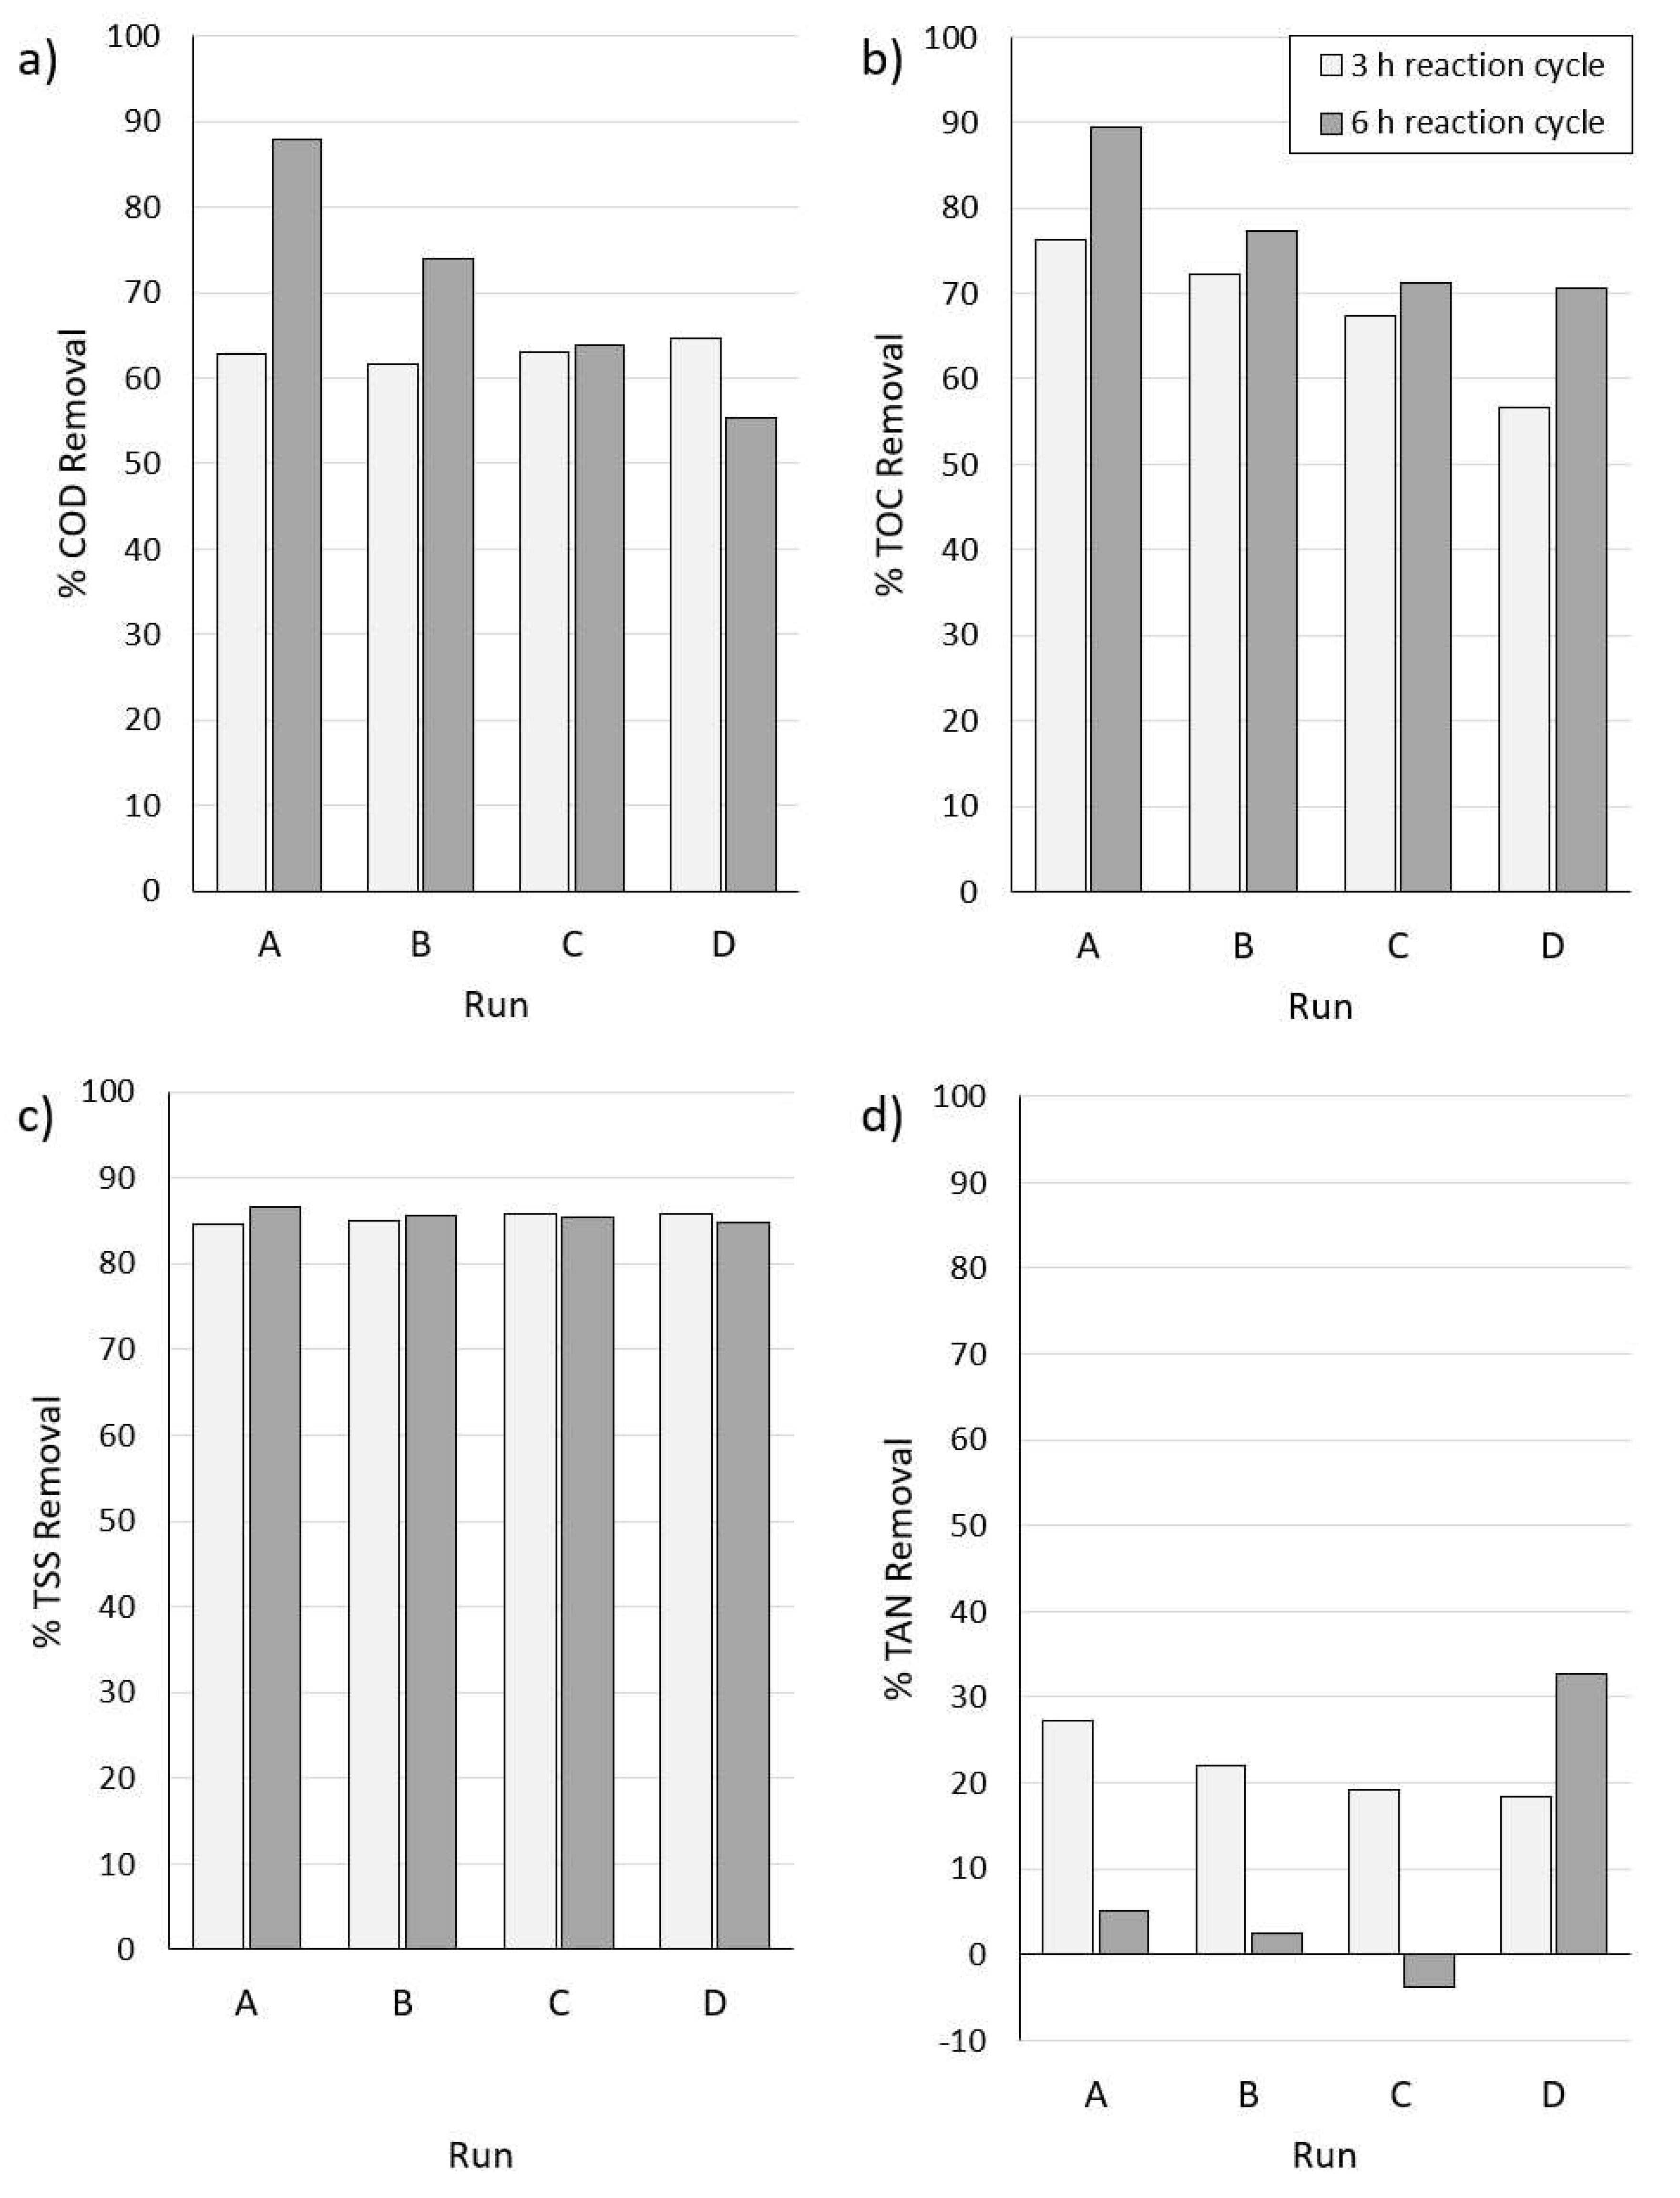

Table 1.
Characteristics of the WWW and anaerobic digesters supernatant used in the bench-scale WASHR treatment trials.
Table 1.
Characteristics of the WWW and anaerobic digesters supernatant used in the bench-scale WASHR treatment trials.
| Parameter | WWW | Digester Supernatant |
|---|---|---|
| COD (mg/L) | 163,000 | 1,200 |
| TOC (mg/L) | 57,300 | 259 |
| TSS (mg/L) | 71,600 | 556 |
| VSS (mg/L) | 51,600 | 438 |
| TAN (mg/L) | 10.9 | 246 |
| TP (mg/L) | 30.2 | 32.5 |
Table 2.
Operating Conditions for WASHR System Trial Runs.
| Parameter | Unit | Run A | Run B | Run C | Run D |
|---|---|---|---|---|---|
| Contact Stage MLSSo |
mg/L |
1,488 |
1,488 |
1,488 |
1,488 |
| MLVSSo | mg/L | 1,244 | 1,244 | 1,244 | 1,244 |
| Operating Volume | L | 14 | 14 | 14 | 14 |
| Reaction Cycle Duration | h | 3 and 6 | 3 and 6 | 3 and 6 | 3 and 6 |
| Settle Cycle Duration | h | 0.5 | 0.5 | 0.5 | 0.5 |
| Stabilization Stage Operating Volume Aeration Cycle Duration |
L h |
6 18 |
6 18 |
6 18 |
6 18 |
| Feed Volumes WWW Digester Supernatant |
L L |
0.14 0.54 |
0.28 0.54 |
0.42 0.54 |
0.56 0.54 |
| Initial Concentrations (1) CODo |
|||||
| mg/L | 1,751 | 3,381 | 5,010 | 6,639 | |
| TOCo | mg/L | 583 | 1,156 | 1,729 | 2,302 |
| TSSo | mg/L | 757 | 1,473 | 2,188 | 2,904 |
| VSSo | mg/L | 551 | 1,066 | 1,582 | 2,098 |
| TANo | mg/L | 32.1 | 31.9 | 31.8 | 31.7 |
| TKNo | mg/L | 47.7 | 49.1 | 50.6 | 52.1 |
| TPo | mg/L | 2.07 | 2.37 | 2.66 | 2.96 |
| Total Effluent Volumes (2) | |||||
| Clarified Supernatant | L | 7.1 | 7.1 | 7.1 | 7.1 |
| Settled Biomass | L | 6.9 | 6.9 | 6.9 | 6.9 |
Notes: MLSS – mixed liquor suspended solids; MLVSS – mixed liquor volatile suspended solids; TKN – total Kjeldahl nitrogen. (1) Initial overall concentrations in the reactor including contributions from WWW, digester supernatant and liquid phase of the feed biomass (WAS from the WWTP). (2) Includes allowances for volumes removed for the purposes of sample analysis.
Table 3.
Characteristics of the settled biomass prior to and post-bench-scale WASHR stabilization phase treatment of WWW.
Table 3.
Characteristics of the settled biomass prior to and post-bench-scale WASHR stabilization phase treatment of WWW.
| Parameter | Unit | Run A | Run B | Run C | Run D |
|---|---|---|---|---|---|
| TS | |||||
| Pre-stabilization | mg/L | 4,859 | 6,177 | 7,251 | 8,230 |
| Post-stabilization | mg/L | 4,500 | 5,480 | 6,000 | 6,860 |
| Removal rate | % | 7.4 | 11.3 | 17.3 | 16.6 |
| VS | |||||
| Pre-stabilization | mg/L | 3,221 | 4,143 | 4,991 | 5,594 |
| Post-stabilization Removal rate |
mg/L | 3,250 | 4,020 | 4,410 | 5,080 |
| % | -0.9 | 3.0 | 11.6 | 9.2 | |
| TSS | |||||
| Pre-stabilization | mg/L | 4,060 | 4,685 | 5,443 | 5,826 |
| Post-stabilization | mg/L | 4,440 | 5,297 | 5,995 | 6,390 |
| Removal rate | % | -9.3 | -13.1 | -10.1 | -9.7 |
| COD | |||||
| Pre-stabilization | mg/L | 5,688 | 7,439 | 9,831 | 11,300 |
| Post-stabilization | mg/L | 6,920 | 7,380 | 7,980 | 9,400 |
| Removal rate | % | -21.7 | 0.8 | 18.8 | 16.8 |
Table 4.
Projected reductions in loadings to the WWTP’s treatment trains achievable using the WASHR pre-treatment system compared with direct co-treatment of WWW.
Table 4.
Projected reductions in loadings to the WWTP’s treatment trains achievable using the WASHR pre-treatment system compared with direct co-treatment of WWW.
| Parameter | Reduction in Loadings to: | |
|---|---|---|
| Liquid Treatment Train | Solids Treatment Train | |
| COD | 81.4% | 59.6% |
| TOC | 83.6% | - |
| TSS | 92.8% | 30.2% |
| VS | - | 47.9% |
| TAN | 59.3% | - |
Table 5.
Comparison of the estimated capital costs, O&M costs, LCCs, and GHG emissions for the seasonal treatment of WWW at the case study facility.
Table 5.
Comparison of the estimated capital costs, O&M costs, LCCs, and GHG emissions for the seasonal treatment of WWW at the case study facility.
| Parameter | Unit | Liquid treatment train co-treatment | Solids treatment train co-treatment | WASHR pre-treatment |
|---|---|---|---|---|
| Short-term | ||||
| Capital cost | $ | 2,470,000 | 2,510,000 | 2,590,000 |
| O&M cost | $/yr | 115,100 | 53,000 | 67,900 |
| LCC cost (15 year) | $ | 3,898,800 | 3,122,800 | 3,447,500 |
| Cost per unit WWW treated | $/m3 | 54.15 | 43.37 | 47.88 |
| GHG emission | eCO2 ton/yr | 771 | 2,204 | 959 |
| Long-term | ||||
| Capital cost | $ | 8,520,000 | 5,580,000 | 6,770,000 |
| O&M cost LCC cost (25 year) |
$/yr | 118,200 | 55,400 | 69,500 |
| $ | 10,685,000 | 6,489,100 | 8,077,300 | |
| Cost per unit WWW treated | $/m3 | 89.04 | 54.08 | 67.31 |
| GHG emission | eCO2 ton/yr | 771 | 2,205 | 960 |
Disclaimer/Publisher’s Note: The statements, opinions and data contained in all publications are solely those of the individual author(s) and contributor(s) and not of MDPI and/or the editor(s). MDPI and/or the editor(s) disclaim responsibility for any injury to people or property resulting from any ideas, methods, instructions or products referred to in the content. |
© 2023 by the authors. Licensee MDPI, Basel, Switzerland. This article is an open access article distributed under the terms and conditions of the Creative Commons Attribution (CC BY) license (http://creativecommons.org/licenses/by/4.0/).
Copyright: This open access article is published under a Creative Commons CC BY 4.0 license, which permit the free download, distribution, and reuse, provided that the author and preprint are cited in any reuse.


