
Submitted:
26 July 2023
Posted:
27 July 2023
You are already at the latest version
Abstract
This study aimed to optimize the bioelectricity production process using a vinasse solution through the application of Plackett-Burman and Box-Behnken designs. An electrochemical cell was constructed using Arduino to measure the potential difference between the anode and cathode immersed in the vinasse solution, a byproduct of wine production containing organic compounds and ions that undergo redox reactions. The Plackett-Burman design identified the most influential variables among eight previously selected, including vinasse concentration, agitation, and yeast, which positively affected millivolt production, while temperature showed a negative correlation. Based on these results, the Box-Behnken design was used for process optimization, varying parameters such as concentration, stirring, and sodium chloride. Response surface graphs demonstrated the relationship between these variables and millivolt production. The findings indicate that higher agitation levels, lower concentrations of vinasse, and the addition of sodium chloride can enhance bioelectricity generation. The study provides insights into the bioelectricity production process from vinasse, contributing to the understanding and potential for sustainable energy generation. The methodology involving Arduino-based measurement and the utilization of experimental designs offers a systematic approach to optimize bioelectricity production from vinasse.
Keywords:
wine
; electrolysis
; microbial cell
; optimization.
1. Introduction
Efficient experimentation is based on the methods of experimental design and its quantitative evaluation, either by mathematical models or graphical representations [1]. In chemical or biological engineering, it is frequently to employ chemometric tools for process optimization. They present advantages such as the reduction in the number of experiments carried out, considerably less work in the laboratory and a consequent cost reduction. These tools allow the development of models that facilitate the evaluation of the results, deduce statistics, and study the interaction between different factors to check the significant variations that may occur in the parameters of interest. So, optimization techniques arise as a set of methods to improve the operation of current systems and to achieve the best efficiency of a system to obtain the best possible result. Data processing techniques are used to compare data with others, make trends or recognize patterns aiming at classifying in clusters or to predict future observations.
Among the Design of Experiments (DoE) techniques, one of the best-known today is the use of factorial and fractional factorial designs [2]. These methods allow deducing a behavior from various data observed. The process needs a carefully examination of the variables influencing the process and the selection of which values they can get. When conducting these experiments, several values may be modified simultaneously instead of just one. In this method, a mesh is made in which there are 2k points, where k is the number of factors to vary. In case of being fractional, only 2k-p values of the mesh will be taken into consideration. In the equation the superscript k-p defines the resolution of the system, where k will be the factors and p the number of their interactions. However, these systems can become very complex if the number of variables increases. To carry out an optimizing technology with a considerable number of variables, multivariate optimization techniques will have to be applied on a larger scale.
One of the factorial designs which allow the combination of a high number of variables is Plackett-Burman (PB) optimization, which aims at determining the influence of certain variables in an experiment. It is a process with L levels and L-1 variables which generates a table with L(L-1) combinations, whose values depend on a numerical value, in this case, one in positive value and another in negative (Table 1). The order of rows and the table code values are generated randomly so that there is no influence between each of the experiments. This method will allow to discriminate between a high number of variables to find which of them are really influencing a process [3].
The other DoE employed in this study is the Box-Behnken Design (BBD), a three-level incomplete design, combining factorial designs which will be employed to predict the response of the dependent variables by the estimation of the coefficients fitted to a polynomial equation. In this model, data will be classified into two types: variables and responses. The model fits to a quadratic model (Equation 1), as we want to obtain a response surface and it is suspected that it has a curvature since the relationship of variables and data does not vary linearly [4,5].
In the BBD, the sample corresponds to a repeated three-level factorial design on different combinations. Parameters that are not included in the two-level factorial design will be put at their mean value. This is essential to be able to map a response surface region (Figure 1), which will allow to deduce responses at intermediate conditions not assayed. BBD manages to study the combination of variables more precisely than Plackett-Burman designs.
This work highlights the importance of both optimization processes, with similar characteristics but different purposes. The first one will facilitate the selection of the most influential parameters and the second one will allow their combination to provide their optimal experimentation to maximize or minimize the response. In this study, PB and BBD designs have been applied to obtain bioelectricity from winery residues. European Union is the world's largest wine producer, with some of its countries leading the wine business, such as France, Spain, and Italy [6,7]. Although wine production has been interpreted as a respectful process for the environment, winemaking generates large amounts of solid and liquid wastes [8]. Tons of bagasse, lees and vinasses, among others, are generated each year and valorization strategies are encouraged in order to mitigate the huge environmental impact they produce. In this sense, fermentation of grape marc, trimming vine shoot or vinification lees may be employed to produce lactic acid, biosurfactants, xylitol, ethanol, and other compounds. Also, grape marc and seeds may exhibit antioxidants properties, and vinasse contains tartaric acid that can be extracted and commercialized [9]. The complexity of these procedures has led some producers to manufacture compost, another by-product of agricultural interest [10]. Vinasses present favorable chemical characteristics for their use in the production of sustainable energy, since they present conditions that help the electricity production: they have a remarkable acidity (pH = 2-6), high salinity, high values of dissolved oxygen, high content of organic matter (900-35,000 mg·l-1) due to its high carbon, nitrogen and potassium concentrations, in addition to phenolic substances and heavy metals [11,12].
So, the main objective of this study is to employ winery residues to produce bioelectricity to generate renewable energy. Also, as secondary benefits are the reduction in waste production and disposal, as management of these residues can be a challenge [6] to wineries and they can benefit from an environmentally friendly approach which also will contribute to reduce their carbon footprint. Finally, reducing wastes can bring benefits from an economical perspective, as wineries can reduce their energy costs by using their own residues to generate bioelectricity, becoming more self-sufficient.
2. Materials and Methods
2.1. Construction of an electrochemical cell and electrolyte employed
The objective of this experiment is to build an electrochemical cell of one chamber, using vinasse residues as electrolyte and copper/zinc electrodes. An Arduino was used to measure the potential difference between the anode and cathode while they are immersed in a solution of vinasse. The vinasse solution is a byproduct of wine production that contains organic compounds and ions that can undergo redox reactions at the electrodes. The Arduino will serve as a data acquisition system to measure the potential difference between the electrodes and to record the values in real time (Figure 2).
Connectig the Arduino board to the USB port of a computer were made as following: (1) connect the blue wire to the GND port of the Arduino and the other end to the breadboard; (2) connect a 100 Ω resistor and a wire to the zinc cathode (10x2 cm) and connect the wire to the breadboard in parallel with the blue wire; (3) connect the red wire to one of the analog input ports of the Arduino and the other end to a 100 Ω resistor; (4) connect the resistor in parallel with another wire that goes to the copper anode (10x2 cm), and connect the wire to the breadboard; (5) sand the surfaces of the zinc cathode and copper anode to remove impurities; (6) clean the electrodes with pure ethanol and then with distilled water to remove any remaining impurities; (7) dry the electrodes with laboratory paper to minimize contamination; (8) insert the electrodes into the beaker containing the vinasse solution, making sure they do not touch each other; (9) use insulating tape and clips to attach the wires to the electrodes, ensuring that the wire ends are in continuous contact with the electrodes; (10) turn on the Arduino and open the data acquisition software; (11) monitor the potential difference values on the computer screen and record the data. On the other hand, wine residues, in a fermentation process, were employed as electrolyte in the electrochemical cell. Residues were employed at a 1/10 dilution rate to decrease viscosity of the samples. 100 ml of liquid wastes were placed in 250 ml beakers equipped with a pHmeter and a termometer to register data continously (Figure 3).
The electrolyte used in this experiment, vinasse, was modified in the first laboratory phase to find out under what conditions energy production is maximized. Thus, in some of the experiments the initial vinasse was modified by adding sodium chloride, with the aim of checking whether the addition of an additional electrolyte increases the efficiency of the process. On the other hand, the initial sample was incubated with 1g/L of yeast, at 28 ºC for 24 hours, to check if the conduction improves with the count of microorganisms. Finally, it was also evaluated if the effectiveness of the electrolyte was affected by its pH.
2.2. Phase 1: analysis of the most infuential variables with Plackett-Burman design
The initial phase of this study focuses on identifying the variables that have the greatest impact on the process of generating electricity from vinasses. This stage starts with the design of a Plackett-Burman experiment, in which seven variables were selected, each with a minimum and maximum value assigned. The following independent variables were studied, including their ranges of variation in parentheses:
- A: Concentration of the electrolyte, diluted in 𝐻2𝑂 (1:4-1:2);
- B: pH (native value (2.5) and corrected native value (4.5));
- C: Temperature (25 - 35ºC higher);
- D: Agitation (with or without agitation);
- E: Additional electrolyte, effect of adding NaCl (without salt and with salt 10% by volume);
- F: Additional microorganisms, effect of adding yeast extract (without yeast and adding 1g/L);
- G: Electrode ratio in 50 and 100 ml.
A total of eight experiments were carried out using this design. The Plackett-Burman table was generated using the STATISTICS program (Table 2).
2.3. Phase 2: optimization of the process by means of a Box-Behnken factorial design
Between the first and second stages of the experiment, the data obtained were analyzed to determine the most influential variables for the project's continuation. After the analysis, three variables were selected to move on to the next stage, while all other variables were discarded. The selected variables were vinasse concentration, sodium chloride dose, and stirring, which will be further explained in the Results section.
In this stage, the Box-Behnken optimization method were used, where fifteen experiments were conducted, each lasting sixteen minutes. The three most influential parameters were varied according to Table 3. The parameters and their ranges of variation are as follows: electrolyte concentration diluted in 𝐻2𝑂 (1:4-1:2-1:1); minimum, medium, and maximum agitation (100, 3100, and 6200 rpm); additional electrolyte, the effect of adding NaCl (2%, 6%, and 10% of the volume of the solution). Instead, the parameters not used in this stage were kept constant, such as temperature, pH, the same electrode-solution ratio, and no addition of yeast. A thermometer and pH meter were used to ensure that all fifteen samples start from the same initial conditions. If necessary, adjustments were made to the temperature and pH values to ensure consistency among the samples.
3. Results
3.1. Phase 1: analysis of Plackett-Burman results to identify patterns
Vinasse concentration, pH, temperature, stirring, NaCl concentration, yeast dose and electrode:solution ratio were tested as influential variables in the bioelectricity production. The measurements were taken at multiple time points, starting from 1 minute and continuing at 5, 10, and 15 minutes. Measuring bioelectricity at short intervals, ranging from 1 to 15 minutes, is important in microbial fuel cell experiments. The dynamic nature of bioelectrochemical processes occurring within these systems necessitates frequent monitoring to capture the transient behavior and fluctuations in electrical output and provides valuable data for comprehensive analysis, improves experimental control, and enhances the understanding of bioelectrochemical processes in microbial fuel cells. So, Table 4 shows the average values obtained for the six experiments of the Plackett-Burmann design with measurements registered every 10 seconds:
The observed millivolt values exhibited a gradual decline over time, except for experiment 1, where the minimum values decreased up to 60% of the maximum peaks at the 15-minute mark (Figure 4). Maximum value was observed in experiment 1, reaching over 306 mV. However, in the other six experiments, the millivolt values were sustained at around 90% of their maximums after 15 minutes. Notably, the minimum values consistently remained above 75% of the maximum values, except for the aforementioned exception.
The PB design experiments were further analyzed using Pareto charts, depicted in Figure 5, which illustrate the influence of the analyzed variables on millivolt production. The data revealed that concentration, agitation, and yeast were the most influential variables, while temperature showed a negative correlation. Within 1 minute of the experiment, these three variables accounted for up to 70% of the millivolt variability. However, after 15 minutes, their influence increased to approximately 83%. As the experiment progressed, agitation became more important, while the influence of concentration and yeast decreased. The pH showed a slight positive influence on the conductivity of the solution, and the concentration of NaCl increased over time. Additionally, concentration was found to have an inverse relationship with agitation.
Based on the obtained results, the PB model successfully identified the most important parameters for optimizing the process of electricity production from a solution. Concentration and agitation consistently appeared as important factors in the process. However, yeast concentration appears as an important factor only during the first five minutes of experiments and its importance decay in favor of NaCl whose influence seems more important at larger experiments. So, for the second stage of the experiment, stirring, concentration, and sodium chloride were chosen as the relevant parameters. Stirring was considered the most important parameter, although its use requires energy. Concentration positively influenced electricity production, but finding the optimal concentration is challenging due to the balance between density and the ability to agitate or dilute the solution. Sodium chloride was chosen due to its lower cost, ability to work for an extended time, and ease of instant preparation compared to yeast. Furthermore, considering the use of seawater instead of distilled water and sodium chloride was suggested to increase sustainability and reduce costs.
In summary, the study identified the key variables influencing bioelectricity production and highlighted the importance of agitation, concentration, and yeast. The results of the PB design experiments provided insights into the optimal parameters for the electricity production process. The microbial fuel cell experiment conducted in this study was performed at a small scale, which allowed for controlled conditions and ease of monitoring. However, scaling up the microbial fuel cell system holds the potential to enhance electricity generation and address the cost associated with stirring. By increasing the scale, a higher volume of microbial biomass and substrate can be accommodated, leading to increased power output. The larger surface area and increased number of electrochemically active microorganisms can result in greater electron transfer rates and improved overall performance. Moreover, as the scale increases, the need for mechanical stirring can be reduced or eliminated. At larger scales, natural convection and diffusion processes can play a more significant role in providing adequate mixing and substrate availability throughout the system. This equilibrium between electricity production and reduced stirring costs makes scaling up microbial fuel cells an attractive avenue for achieving higher energy yields and improving the economic feasibility of the technology.
3.2. Phase 2: optimization of the process to maximize milivolt production
The PB design allowed to identify concentration, stirring and yeast as the most important factors that affect the process. This analysis allows screening many factors at once with a minimum number of experimental runs. After the PB analysis, the most significant factors were selected for further optimization using a Box-Behnken design. Overall, the combined findings from the PB design and subsequent Box-Behnken design highlight the influential factors in bioelectricity production and provide insights into their optimal settings. By systematically varying and analyzing these factors, the study aims to optimize the process and achieve the desired bioelectricity output.
The Box-Behnken design, a type of response surface methodology, enables the optimization of multiple factors concurrently while minimizing the number of experimental runs required. This approach involves systematically varying each factor across low, medium, and high levels to determine their optimal values. The goal is to identify the combination of factor settings that yield the desired response or outcome. The BBD typically involves a series of experimental runs, where the response of interest is measured and used to construct a mathematical model to predict the optimal settings for each factor.

Table 2.
Values of mV obtained for Box-Behnken experiments. Results are expressed as mean values±coefficient of variation (%).
Table 2.
Values of mV obtained for Box-Behnken experiments. Results are expressed as mean values±coefficient of variation (%).
| Exp 1 | Exp 2 | Exp 3 | Exp 4 | Exp 5 | Exp 6 | Exp 7 | Exp 8 | |
|---|---|---|---|---|---|---|---|---|
| 1 min | 222,8±14,1 | 422,5±1,5 | 392,3±15,8 | 311,7±42,2 | 437,9±20,9 | 424,9±1,5 | 397,6±30,8 | 430,6±1,5 |
| 5 min | 197,3±10,9 | 432,3±2,5 | 260,9±33,4 | 384,6±24,5 | 289,6±35,6 | 425,3±1,6 | 252,3±41,2 | 412,5±3,1 |
| 10 min | 194,3+8,5 | 433,6±2,1 | 208,1±33,6 | 411,8±16,2 | 235,7±33,7 | 422,6±1,6 | 213,0±34,2 | 394,4±4,5 |
| 15 min | 189,3±8,2 | 435,8±1,9 | 193,1±31,4 | 414,2±13,3 | 219,1±31,3 | 421,9±1,5 | 204,2±29,6 | 384,3±5,4 |
| Exp 9 | Exp 10 | Exp 11 | Exp 12 | Exp 13 | Exp 14 | Exp 15 | ||
| 1 min | 373,5±1,7 | 430,6±1,5 | 430,6±1,5 | 430,6±1,5 | 430,6±1,5 | 430,6±1,5 | 430,6±1,5 | |
| 5 min | 371,0±1,5 | 412,5±3,1 | 412,5±3,1 | 412,5±13,0 | 412,5±3,1 | 412,5±3,1 | 412,5±3,1 | |
| 10 min | 365,0±1,8 | 394,4±4,5 | 394,4±4,5 | 394,4±4,5 | 394,4±4,5 | 394,4±4,5 | 394,4±4,5 | |
| 15 min | 361,2±2,2 | 384,3±5,4 | 384,3±5,4 | 384,3±5,4 | 384,3±5,4 | 384,3±5,4 | 384,3±5,4 |
In the experiments conducted, the observed millivolt values exhibited notable differences depending on the specific experiment (Table 2). For example, experiment 1 displayed low millivolt values, as it was carried out with intermediate vinasse concentration, along with the lowest stirring and NaCl values. Conversely, experiments 13 to 15, which utilized intermediate values of concentration, NaCl, and stirring, significantly increased millivolt values. The maximum bioelectricity production was observed in experiment 2, with an average value of 431.1 mV. This experiment employed the highest stirring value, intermediate concentration, and the minimum NaCl dose. Importantly, the minimum millivolt values consistently remained above 75% of the maximum values throughout the experiments.
In this study Pareto chart was employed as a tool to detect the influence of variables. The use of a Pareto chart of standardized effects in the analysis of influential variables in bioelectricity production provides valuable insights into the significance of each factor. The Pareto chart allows for a visual representation of the magnitude of the effects, helping to prioritize and focus on the most influential factors for process optimization. The use of a standardized effects chart allows for a fair comparison of the influence of different variables, as the effects are normalized to a common scale. This normalization enables researchers to identify the most critical factors that significantly impact the response variable, regardless of the differences in their units or scales. In this study, the standardized effects chart provided a clear representation of the relative importance of the variables, highlighting concentration, agitation, and yeast as the primary drivers of millivolt production.
In the presented study, the Pareto chart of standardized effects (Figure 6) revealed that vinasse concentration and agitation were the most influential variables in the bioelectricity production process at the beginning of the process. These variables exhibited positive effects on millivolt production, indicating that higher levels of concentration and agitation were associated with increased bioelectricity generation. These variables showed positive significant influence either in linear or quadratic forms.
Once the main variables were determined, surface response graphs were generated, to determine their magnitude. Surface response graphs play a crucial role in BBD, providing valuable insights into the relationship between multiple variables and the response of a system. These graphs illustrate the behavior of the response surface by depicting contours or three-dimensional plots, enabling scientists to visualize and analyze the interactions among factors within the design space. The utility of surface response graphs lies in their ability to identify optimal settings for the variables, aiding in process optimization and improving product quality. In the response surface (Figure 7a), agitation and NaCl addition are utilized as the lower axes since they are the most consistent variables ensuring a voltage. The surface exhibits a curvature that reaches its maximum point with 8% NaCl concentration and near-maximum agitation, resulting in approximately 500 mV. This behavior is attributed to the fact that sodium chloride yields the highest performance when completely dissolved in the solution. Beyond this point, although it may appear physically dissolved, it is likely that it is not fully dissolved, leading to a reduction in performance. The response surface for the five-minute interval exhibits an almost linear behavior, which increases at the maximum parameter additions, resulting in a value of 490 mV. This value is like the one obtained in the one-minute analysis (Figure 7b).
For the analysis of the ten-minute interval, agitation and concentration are used as independent axes (Figure 7c,d) as these two variables are the most important variables at larger times. From 10 to 15 minutes, stirring appears as the most important factor together with vinasse concentration. When interpreted together with the Pareto diagram, as more time elapses, agitation becomes a more influential factor than NaCl addition. With agitation predominating, the response surfaces become less curved. Although concentration has a greater influence, it is observed that the highest voltage is obtained at its average value (concentration 1:2), yielding approximately 460 mV, slightly lower than at shorter time intervals. Finally, after 15 min of experiments the model predicts that the target voltage of 500 mV may be obtained (Figure 7d) at the maximum agitation and minimum concentration (1:4). The selection of the minimum concentration is rationalized by the observation that heightened agitation promotes earlier attainment of homogeneity within the solution. Consequently, it is imperative to avoid a dense solution that may induce irregularities in the fluid dynamics.
4. Discussion
The PB and BBD play pivotal roles in experimental design and optimization studies, offering valuable insights into identifying the most influential variables in a system. The PB design efficiently screens numerous factors, aiding in narrowing down key factors that significantly impact the response of interest. By exploring a wide parameter space with minimal experimental runs, it provides valuable insights in the initial stages of research, enhancing our understanding of the system's behavior.
In contrast, BBD allows for a thorough examination of the response surface, considering both main effects and second-order interactions. This design facilitates the construction of response surface models and process parameter optimization, enabling us to understand complex interactions among multiple variables [13]. It provides valuable information on curvature, optimal factor levels, and regions of maximum or minimum response, contributing to process optimization, quality improvement, and efficient resource allocation [14].
In our study, we employed both PB and BBD to identify the most influential variables in a microbial fuel cell (MFC) for maximizing its performance and efficiency. Through systematic optimization, we enhanced power output, increased conversion efficiency, and improved overall MFC performance. Our findings align with previous research that highlights the crucial role of these designs in narrowing down critical variables and developing robust models for process optimization.
Among the variables analyzed, the composition of vinasse emerged as a crucial factor in MFC performance. Excessive microorganism growth during treatment can lead to a decline in MFC activity. To mitigate this issue, previous studies have suggested various strategies, such as the addition of a polymer to increase viscosity [15] or utilizing porous solids to prevent electrolyte sedimentation [16,17,18]. Also, having an electrolyte that may sediment necessitates continuous stirring, which affects MFC yield. Furthermore, the effect of flow velocity on bioelectricity generation should also be considered [19]. These approaches help maintain stable MFC operation and enhance yield. However, electricity production by MFCs remains a substantial problem for practical implementations owing to the difficulty in balancing yield with overall system upscaling [20].
Temperature also emerged as a significant factor affecting MFC energy production. High temperatures were found to negatively impact MFC performance due to excessive microorganism growth. To optimize energy production, maintaining MFCs at values close to room temperature has been recommended in previous studies [21,22]. Room temperature offers advantages such as power savings, low solid production, and higher treatment efficiency, contributing to sustainable MFC operation [23]. Similarly, Cano et al. [24] found additional implications regarding temperature, as wastewater treated at high values may require a cooling step prior to discharge to avoid negative effects on the natural system.
In contrast, salt concentration showed the least influence on the MFC process. Surprisingly, experiment 2 conducted without salt exhibited the highest millivolt values when combined with maximum stirring and medium vinasse dose. Additionally, experiment 4 conducted with the maximum salt concentration, medium vinasse dose, and the lowest stirring yielded values comparable to experiment 2. These findings suggest the possibility of expanding MFC applications to saline wastewater without adversely affecting MFC yield. Vijay et al. [25] analyzed saline environments as critical issues to be addressed due to the presence of halophilic bacteria, which alter the composition of the medium and could impact electrochemical activity.
The results highlighted the significance of variables such as vinasse composition, temperature, and salt concentration in influencing MFC operation. Furthermore, by incorporating theoretical frameworks and empirical findings, we advanced our understanding of complex interactions within the MFC system. These insights not only contribute to the development of sustainable energy technologies but also pave the way for further research on optimizing MFC operation, improving waste treatment processes, and exploring the potential synergies between waste valorization and renewable energy generation.
5. Conclusions
This study found that concentration, stirring, and yeast are the most influential variables in the bioelectricity production process as determined by employing PB. This design allows for the screening of multiple factors simultaneously with a minimal number of experimental runs. By conducting PB analysis, the key factors that significantly affect the process were determined, setting the stage for further optimization using a BBD. Next, the BBD was carried out to determine the optimum range of the variables assayed from 1 to 15 min.
In the experiments conducted, the observed millivolt values exhibited notable differences depending on the specific experiment. For example, experiment 1 displayed low millivolt values, as it was carried out with intermediate vinasse concentration, along with the lowest stirring and NaCl values. Conversely, experiments 13 to 15, which utilized intermediate values of concentration, NaCl, and stirring, significantly increased millivolt values. The maximum bioelectricity production was observed in experiment 2, with an average value of 431.1 mV. This experiment employed the highest stirring value, intermediate concentration, and the minimum NaCl dose. Importantly, the minimum millivolt values consistently remained above 75% of the maximum values throughout the experiments.
One of the problems encountered was density of vinasse. High concentration of vinasse poses challenges in achieving homogeneity due to its inherent density. Vinasse is a byproduct of the ethanol production process and typically exhibits a high viscosity and density. When present in high concentrations, it can create difficulties in achieving uniform distribution within a solution, thereby interfering with accurate measurements and analysis. The dense nature of concentrated vinasse can lead to localized variations in fluid dynamics, causing uneven mixing and potential irregularities in the system. These non-uniform conditions hinder the accurate assessment of variables and measurements, impacting the reliability and reproducibility of experimental results. Therefore, it is crucial to consider the challenges associated with the homogeneity of highly concentrated vinasse and take appropriate measures to mitigate their effects during scientific investigations and analysis.
Author Contributions
Methodology, R.D.-R. and A.S.G.; investigation, A.C.; writing—original draft preparation, R.D.-R.; writing—review and editing, A.S.G., E.A. and R.D.-R.; project administration, R.D.-R. and A.S.G.; funding acquisition, R.D.-R. and A.S.G. All authors have read and agreed to the published version of the manuscript.
Funding
The authors thank the Defense University Center at the Spanish Naval Academy (CUD-ENM) for all the support provided for this research (Project PICUD-2022-02).
Conflicts of Interest
The authors declare no conflict of interest. The funders had no role in the design of the study; in the collection, analyses, or interpretation of data; in the writing of the manuscript; or in the decision to publish the results.
References
- Otto, M. Chemometrics. In Statistics and Computer Applications in Analytical Chemistry, 3rd ed; Wiley-VCH, 2017; ISBN 978-3-527-34097-2. [Google Scholar]
- Isam, M.; Baloo, L.; Kutty, S.R.M.; Yavari, S. Optimisation and Modelling of Pb(II) and Cu(II) Biosorption onto Red Algae (Gracilaria changii) by Using Response Surface Methodology. Water 2019, 11, 2325. [Google Scholar] [CrossRef]
- Devesa-Rey, R.; González-Aller, J.; Urréjola, S. Analysis of Biomaterials as Green Coagulants to Control Suspended Solids for Surface Water Treatment. Int. J. Environ. Res. Public Heal. 2020, 17, 1777. [Google Scholar] [CrossRef] [PubMed]
- Ferreira, S.L.C.; Bruns, R.E.; Ferreira, H.S.; Matos, G.D.; David, J.M.; Brandão, G.C.; da Silva, E.G.P.; Portugal, L.A.; dos Reis, P.S.; Souza, A.S.; et al. Box-Behnken design: An alternative for the optimization of analytical methods. Anal. Chim. Acta 2007, 597, 179–186. [Google Scholar] [CrossRef] [PubMed]
- Yateh, M.; Lartey-Young, G.; Li, F.; Li, M.; Tang, Y. Application of Response Surface Methodology to Optimize Coagulation Treatment Process of Urban Drinking Water Using Polyaluminium Chloride. Water 2023, 15, 853. [Google Scholar] [CrossRef]
- Devesa-Rey, R.; Vecino, X.; Varela-Alende, J.L.; Barral, M.T.; Cruz, J.M.; Moldes, A.B. Valorization of winery waste vs. the costs of not recycling. Waste Manag. 2011, 31, 2327–2335. [Google Scholar] [CrossRef]
- Santos, J.R.F.; Rodrigues, R.P.; Quina, M.J.; Gando-Ferreira, L.M. Recovery of Value-Added Compounds from Winery Wastewater: A Review and Bibliometric Analysis. Water 2023, 15, 1110. [Google Scholar] [CrossRef]
- Vecino, X.; Devesa-Rey, R.; Moldes, A.; Cruz, J. Optimization of batch operating conditions for the decolourization of vinasses using surface response methodology. Microchem. J. 2011, 102, 83–90. [Google Scholar] [CrossRef]
- Devesa, R.; Moldes, A.; Diazfierros, F.; Barral, M. Extraction study of algal pigments in river bed sediments by applying factorial designs. Talanta 2007, 72, 1546–1551. [Google Scholar] [CrossRef]
- Paradelo, R.; Villada, A.; Devesa-Rey, R.; Moldes, A.B.; Domínguez, M.; Patiño, J.; Barral, M.T. Distribution and availability of trace elements in municipal solid waste composts. J. Environ. Monit. 2010, 13, 201–211. [Google Scholar] [CrossRef]
- Salgado, J.M.; Rodríguez, N.; Cortés, S.; Domínguez, J.M. Development of Cost-Effective Media to Increase the Economic Potential for Larger-Scale Bioproduction of Natural Food Additives by Lactobacillus rhamnosus, Debaryomyces hansenii, and Aspergillus niger. J. Agric. Food Chem. 2009, 57, 10414–10428. [Google Scholar] [CrossRef]
- Paradelo, R.; Moldes, A.B.; Barral, M.T. Treatment of red wine vinasses with non-conventional substrates for removing coloured compounds. Water Sci. Technol. 2009, 59, 1585–1592. [Google Scholar] [CrossRef] [PubMed]
- Vecino, X.; Devesa-Rey, R.; Cruz, J.M.; Moldes, A.B. Entrapped Peat in Alginate Beads as Green Adsorbent for the Elimination of Dye Compounds from Vinasses. Water, Air, Soil Pollut. 2013, 224, 1–9. [Google Scholar] [CrossRef]
- Vecino, X.; Devesa-Rey, R.; Cruz, J.; Moldes, A. Study of the physical properties of calcium alginate hydrogel beads containing vineyard pruning waste for dye removal. Carbohydr. Polym. 2015, 115, 129–138. [Google Scholar] [CrossRef]
- Luo, S.; Wang, Y.; Pan, W.; Zhao, X.; Leong, K.W.; Leung, D.Y. A breakthrough in the performance and fuel utilization of methanol microfluidic fuel cell via viscous co-flow electrolyte. Energy Convers. Manag. 2023, 290. [Google Scholar] [CrossRef]
- Rethinasabapathy, M.; Lee, J.H.; Roh, K.C.; Kang, S.-M.; Oh, S.Y.; Park, B.; Lee, G.-W.; Cha, Y.L.; Huh, Y.S. Silver grass-derived activated carbon with coexisting micro-, meso- and macropores as excellent bioanodes for microbial colonization and power generation in sustainable microbial fuel cells. Bioresour. Technol. 2019, 300, 122646. [Google Scholar] [CrossRef] [PubMed]
- Li, H.; Zhang, L.; Wang, R.; Sun, J.; Qiu, Y.; Liu, S. 3D hierarchical porous carbon foams as high-performance free-standing anodes for microbial fuel cells. EcoMat 2022. [Google Scholar] [CrossRef]
- Sun J, Wang R, Li H, Zhang L, Liu S. Boosting bioelectricity generation using three-dimensional nitrogen-doped macroporous carbons as freestanding anode. Materials Today Energy 2023, 33, 101273. [CrossRef]
- Kudier, W.N.; Atta, S.Z.; Majdi, H.S.; Hasan, B.O.; C, I. Effect of Electrode Surface Enhancement on the Performance of Microbial Fuel Cell Under Flow Conditions. Egypt. J. Chem. 2022. [Google Scholar] [CrossRef]
- Malik, S.; Kishore, S.; Dhasmana, A.; Kumari, P.; Mitra, T.; Chaudhary, V.; Kumari, R.; Bora, J.; Ranjan, A.; Minkina, T.; et al. A Perspective Review on Microbial Fuel Cells in Treatment and Product Recovery from Wastewater. Water 2023, 15, 316. [Google Scholar] [CrossRef]
- Cano, V.; Cano, J.; Nunes, S.C.; Nolasco, M.A. Electricity generation influenced by nitrogen transformations in a microbial fuel cell: assessment of temperature and external resistance. Renew. Sustain. Energy Rev. 2020, 139, 110590. [Google Scholar] [CrossRef]
- Silva-Palacios, F.; Salvador-Salinas, A.; Quezada-Alvarez, M.; Rodriguez-Yupanqui, M.; Segundo, R.-F.; Renny, N.-N.; Cabanillas-Chirinos, L. Bioelectricity generation through Microbial Fuel Cells using Serratia fonticola bacteria and Rhodotorula glutinis yeast. Energy Rep. 2023, 9, 295–301. [Google Scholar] [CrossRef]
- Ahn, Y.; Logan, B.E. Effectiveness of domestic wastewater treatment using microbial fuel cells at ambient and mesophilic temperatures. Bioresour. Technol. 2010, 101, 469–475. [Google Scholar] [CrossRef] [PubMed]
- Cano, V.; Cano, J.; Nunes, S.C.; Nolasco, M.A. Electricity generation influenced by nitrogen transformations in a microbial fuel cell: assessment of temperature and external resistance. Renew. Sustain. Energy Rev. 2020, 139, 110590. [Google Scholar] [CrossRef]
- Vijay, A.; Ghosh, P.C.; Mukherji, S. Power Generation by Halophilic Bacteria and Assessment of the Effect of Salinity on Performance of a Denitrifying Microbial Fuel Cell. Energies 2023, 16, 877. [Google Scholar] [CrossRef]
Figure 1.
(a) BBD assigns maximum, mean and minimum values to independent variables in order to create a space which allows to infer responses of the dependent variables; (b) results obtained allow to interpret the conditions to maximize or minimize the response desired (Devesa-Rey et al., 2007).
Figure 1.
(a) BBD assigns maximum, mean and minimum values to independent variables in order to create a space which allows to infer responses of the dependent variables; (b) results obtained allow to interpret the conditions to maximize or minimize the response desired (Devesa-Rey et al., 2007).
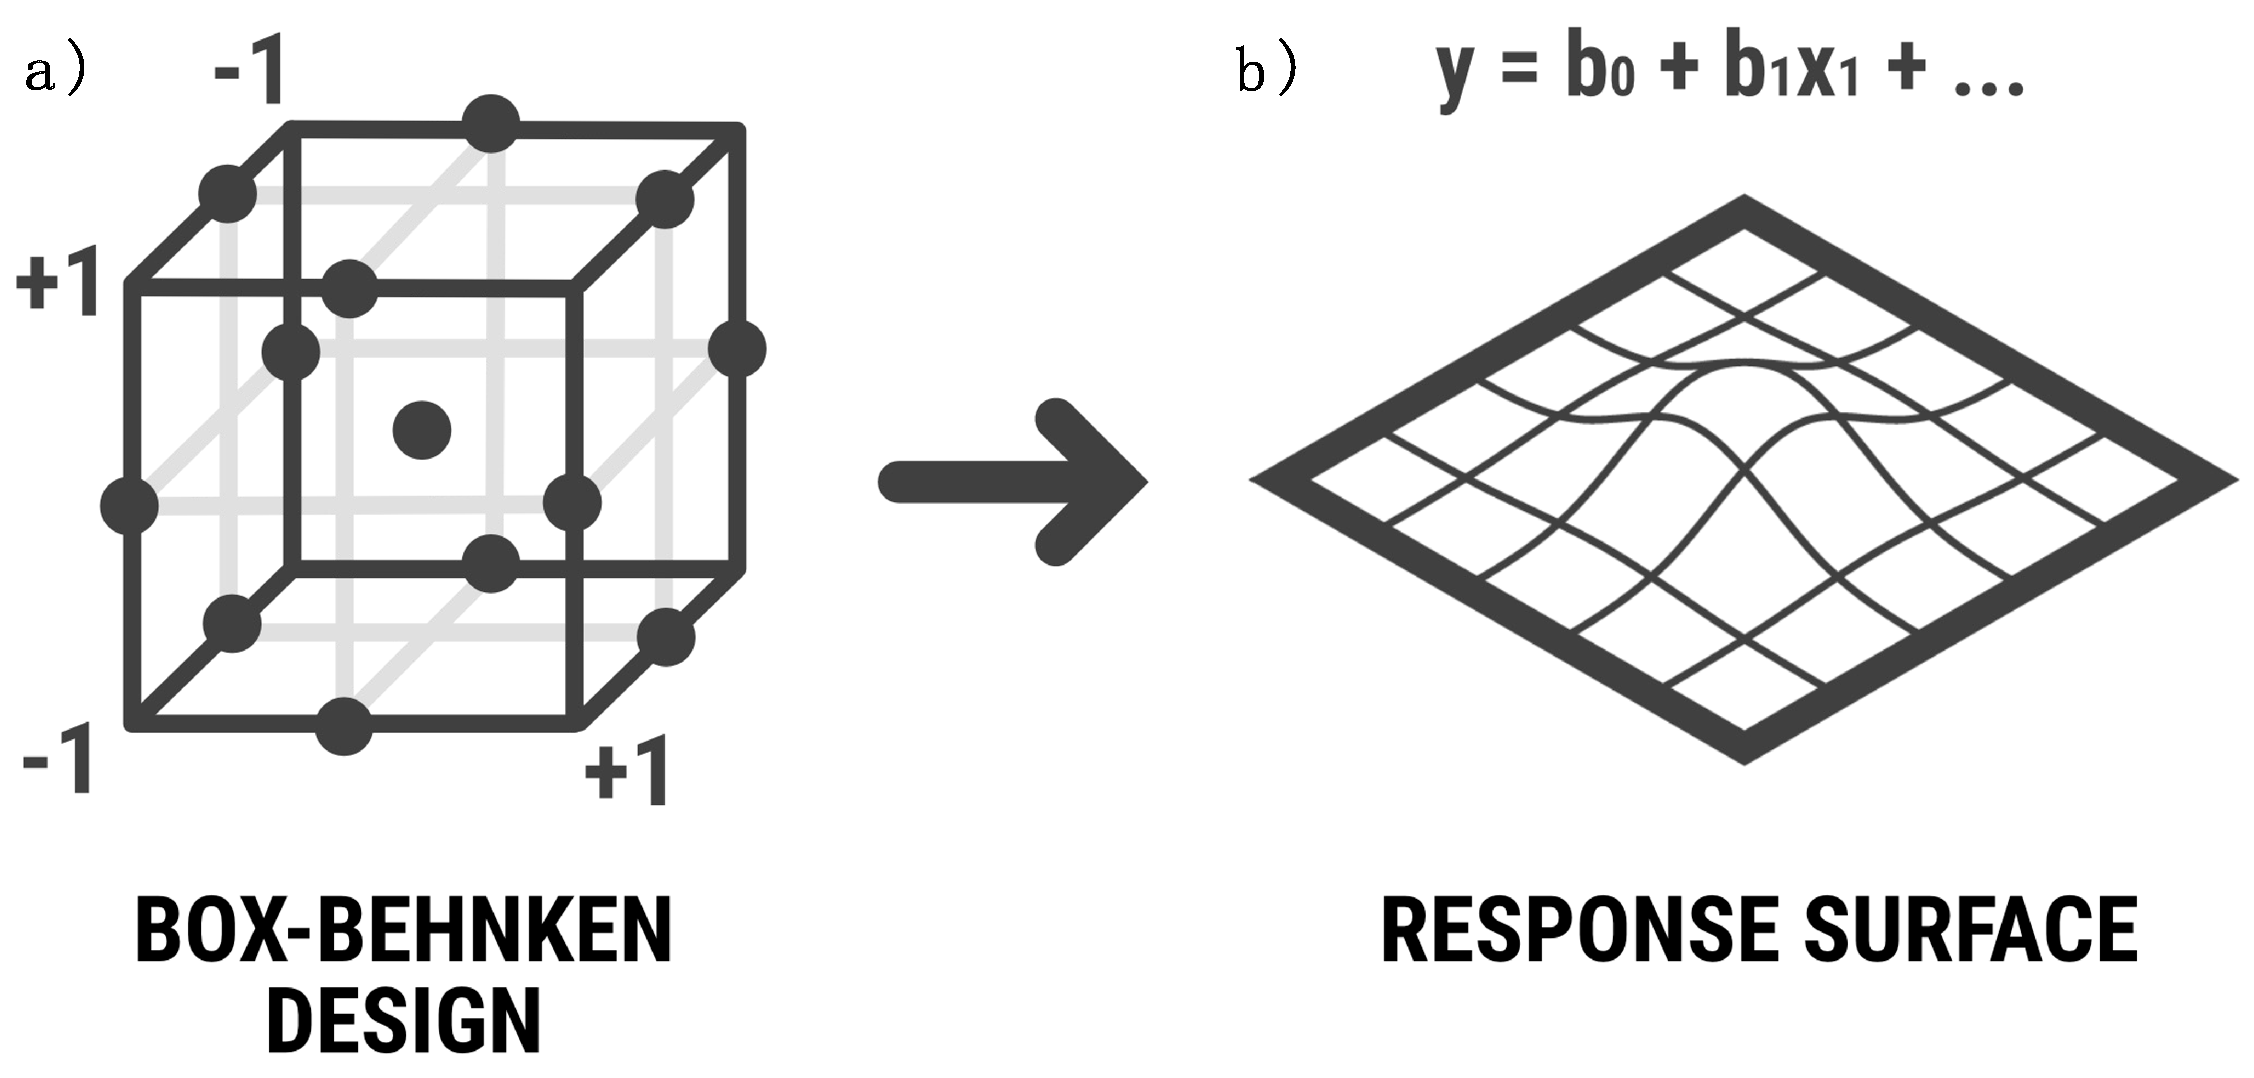
Figure 2.
Scheme of the cell used in this study, using copper and zinc as cathode and anode and stillage as electrolyte. The data was collected continuously by programming with Arduino.
Figure 2.
Scheme of the cell used in this study, using copper and zinc as cathode and anode and stillage as electrolyte. The data was collected continuously by programming with Arduino.
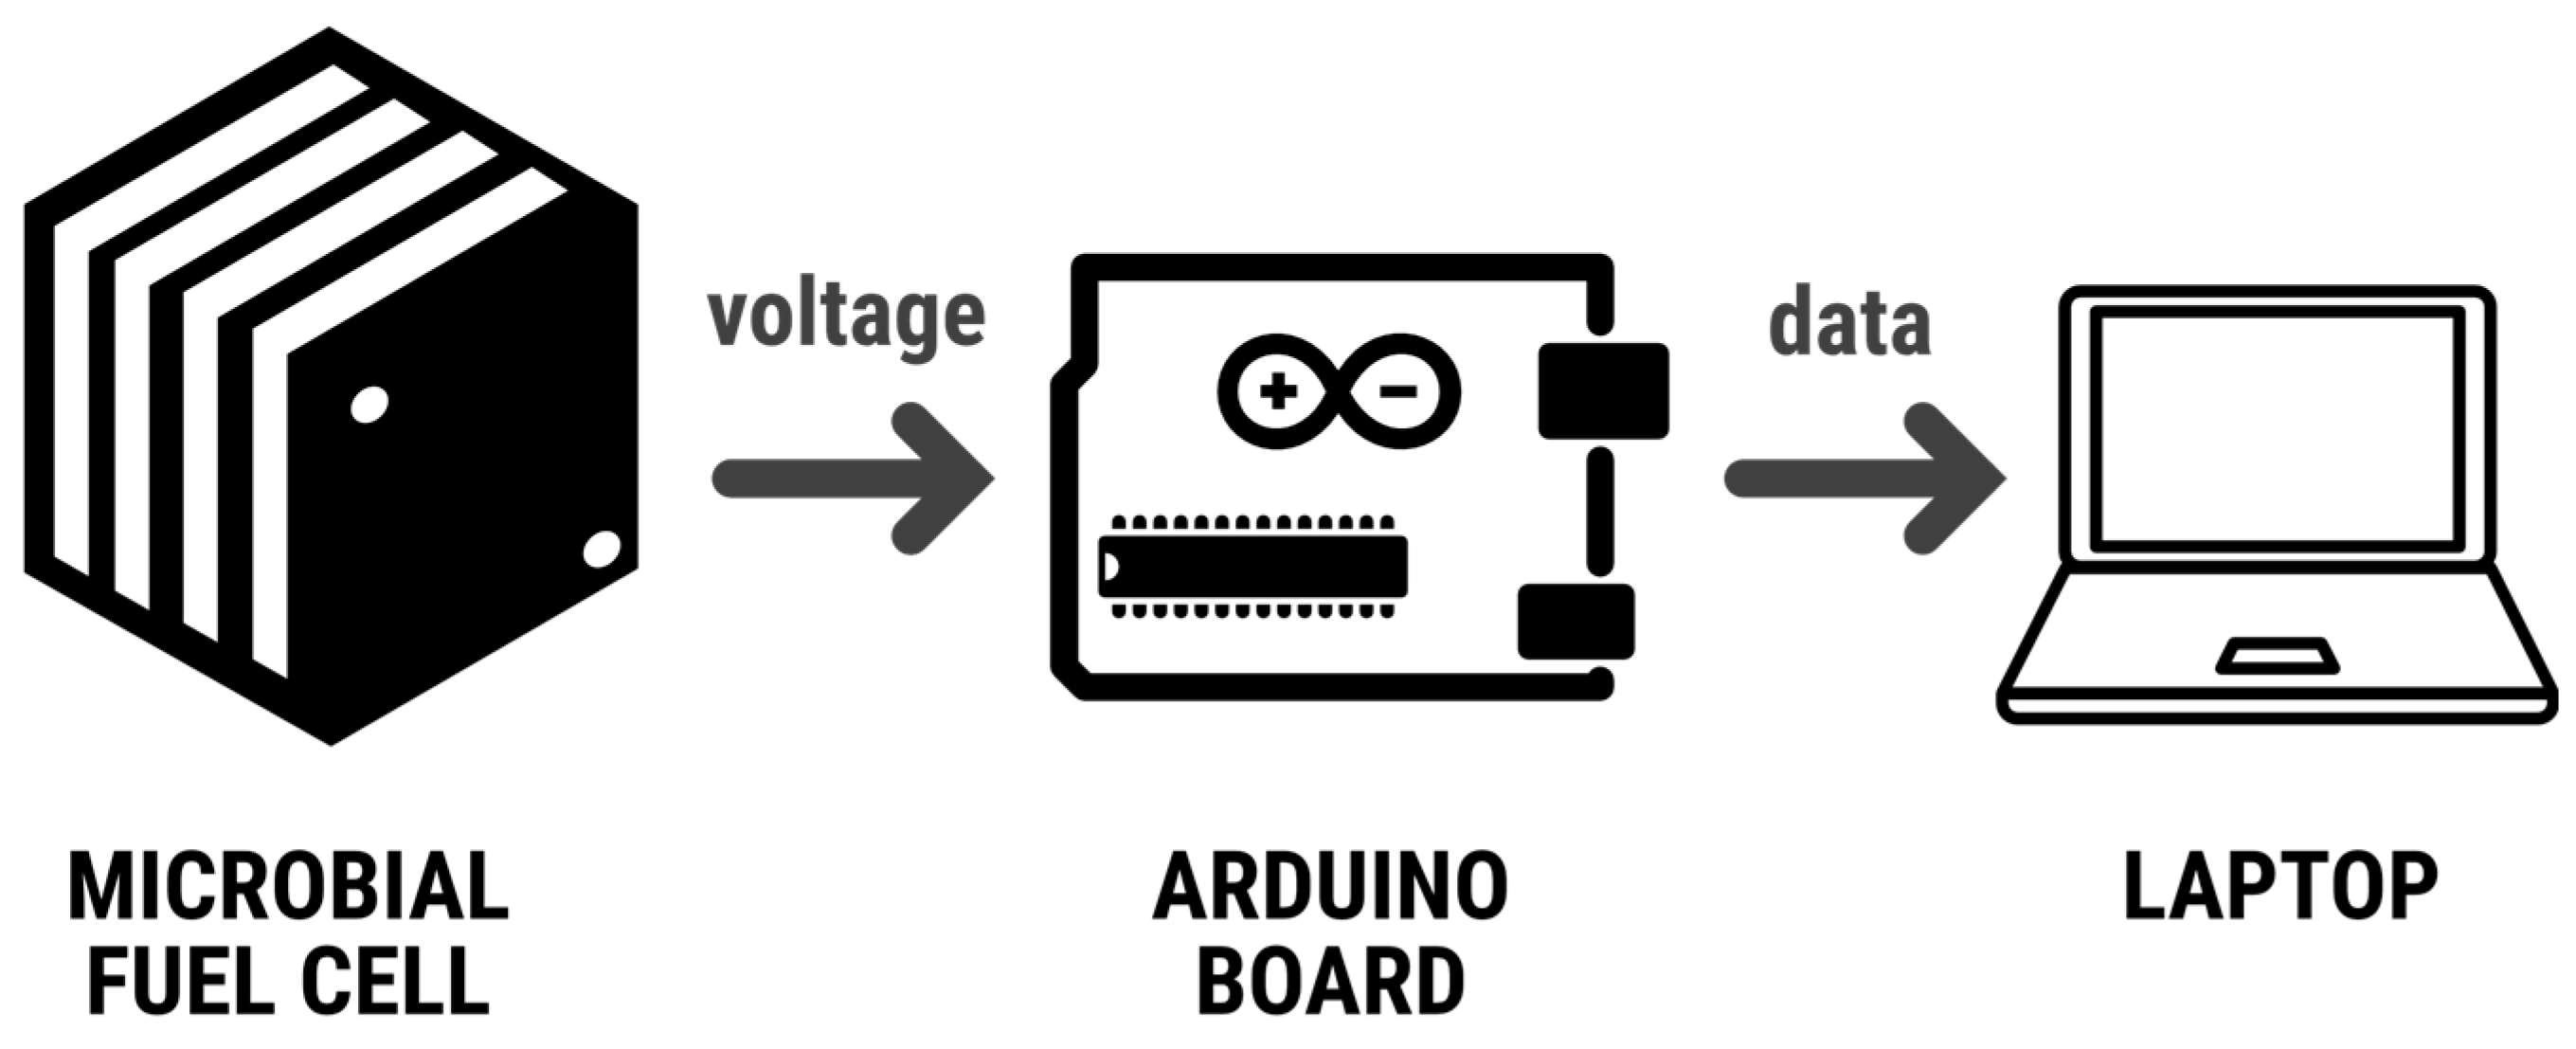
Figure 3.
Scheme of the cell used in this study, using copper and zinc as cathode and anode and stillage as electrolyte. The data was collected continuously by programming with Arduino.
Figure 3.
Scheme of the cell used in this study, using copper and zinc as cathode and anode and stillage as electrolyte. The data was collected continuously by programming with Arduino.
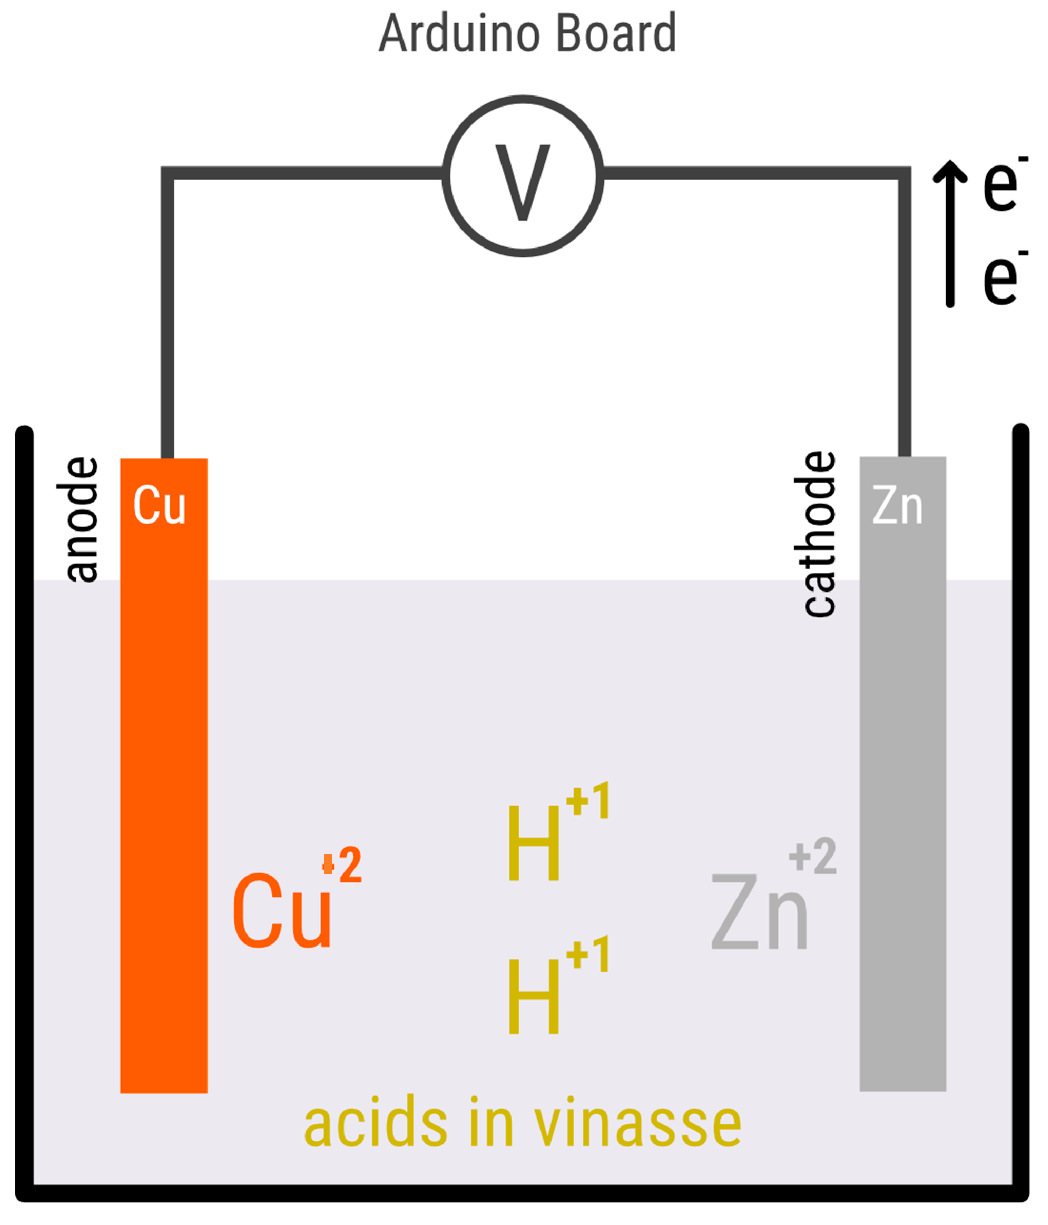
Figure 4.
Voltage decline over time for Exp 2.
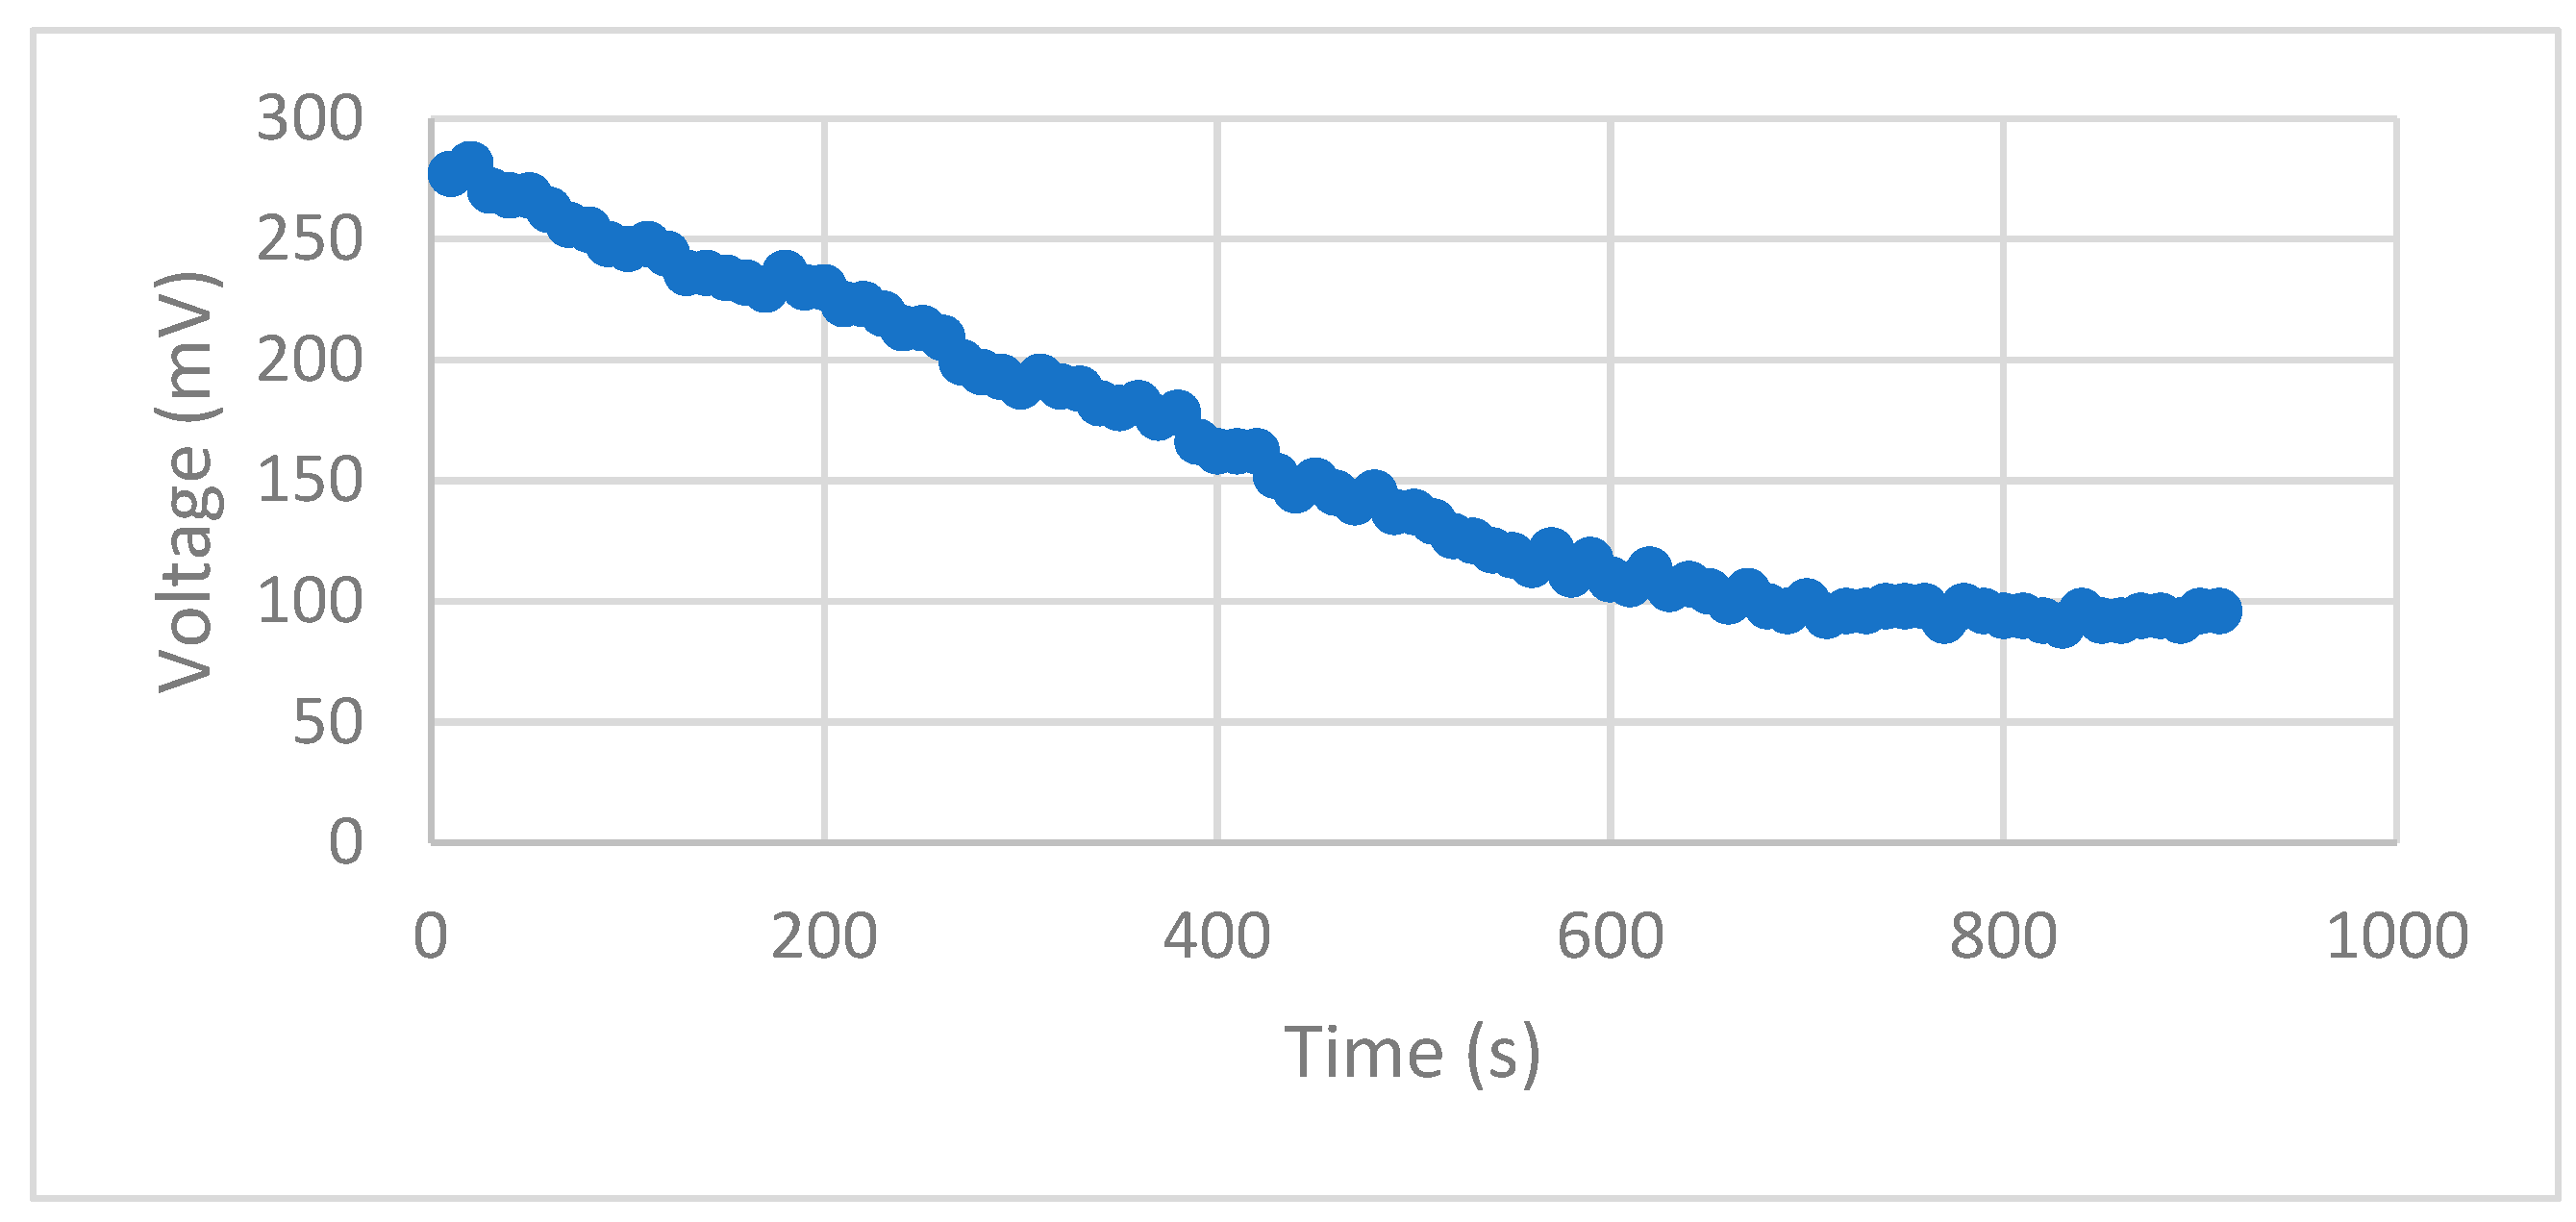
Figure 5.
Pareto charts depicting the frequency distribution of the data are presented for the different time intervals: a) 1 minute, b) 5 minutes, c) 10 minutes, and d) 15 minutes.
Figure 5.
Pareto charts depicting the frequency distribution of the data are presented for the different time intervals: a) 1 minute, b) 5 minutes, c) 10 minutes, and d) 15 minutes.
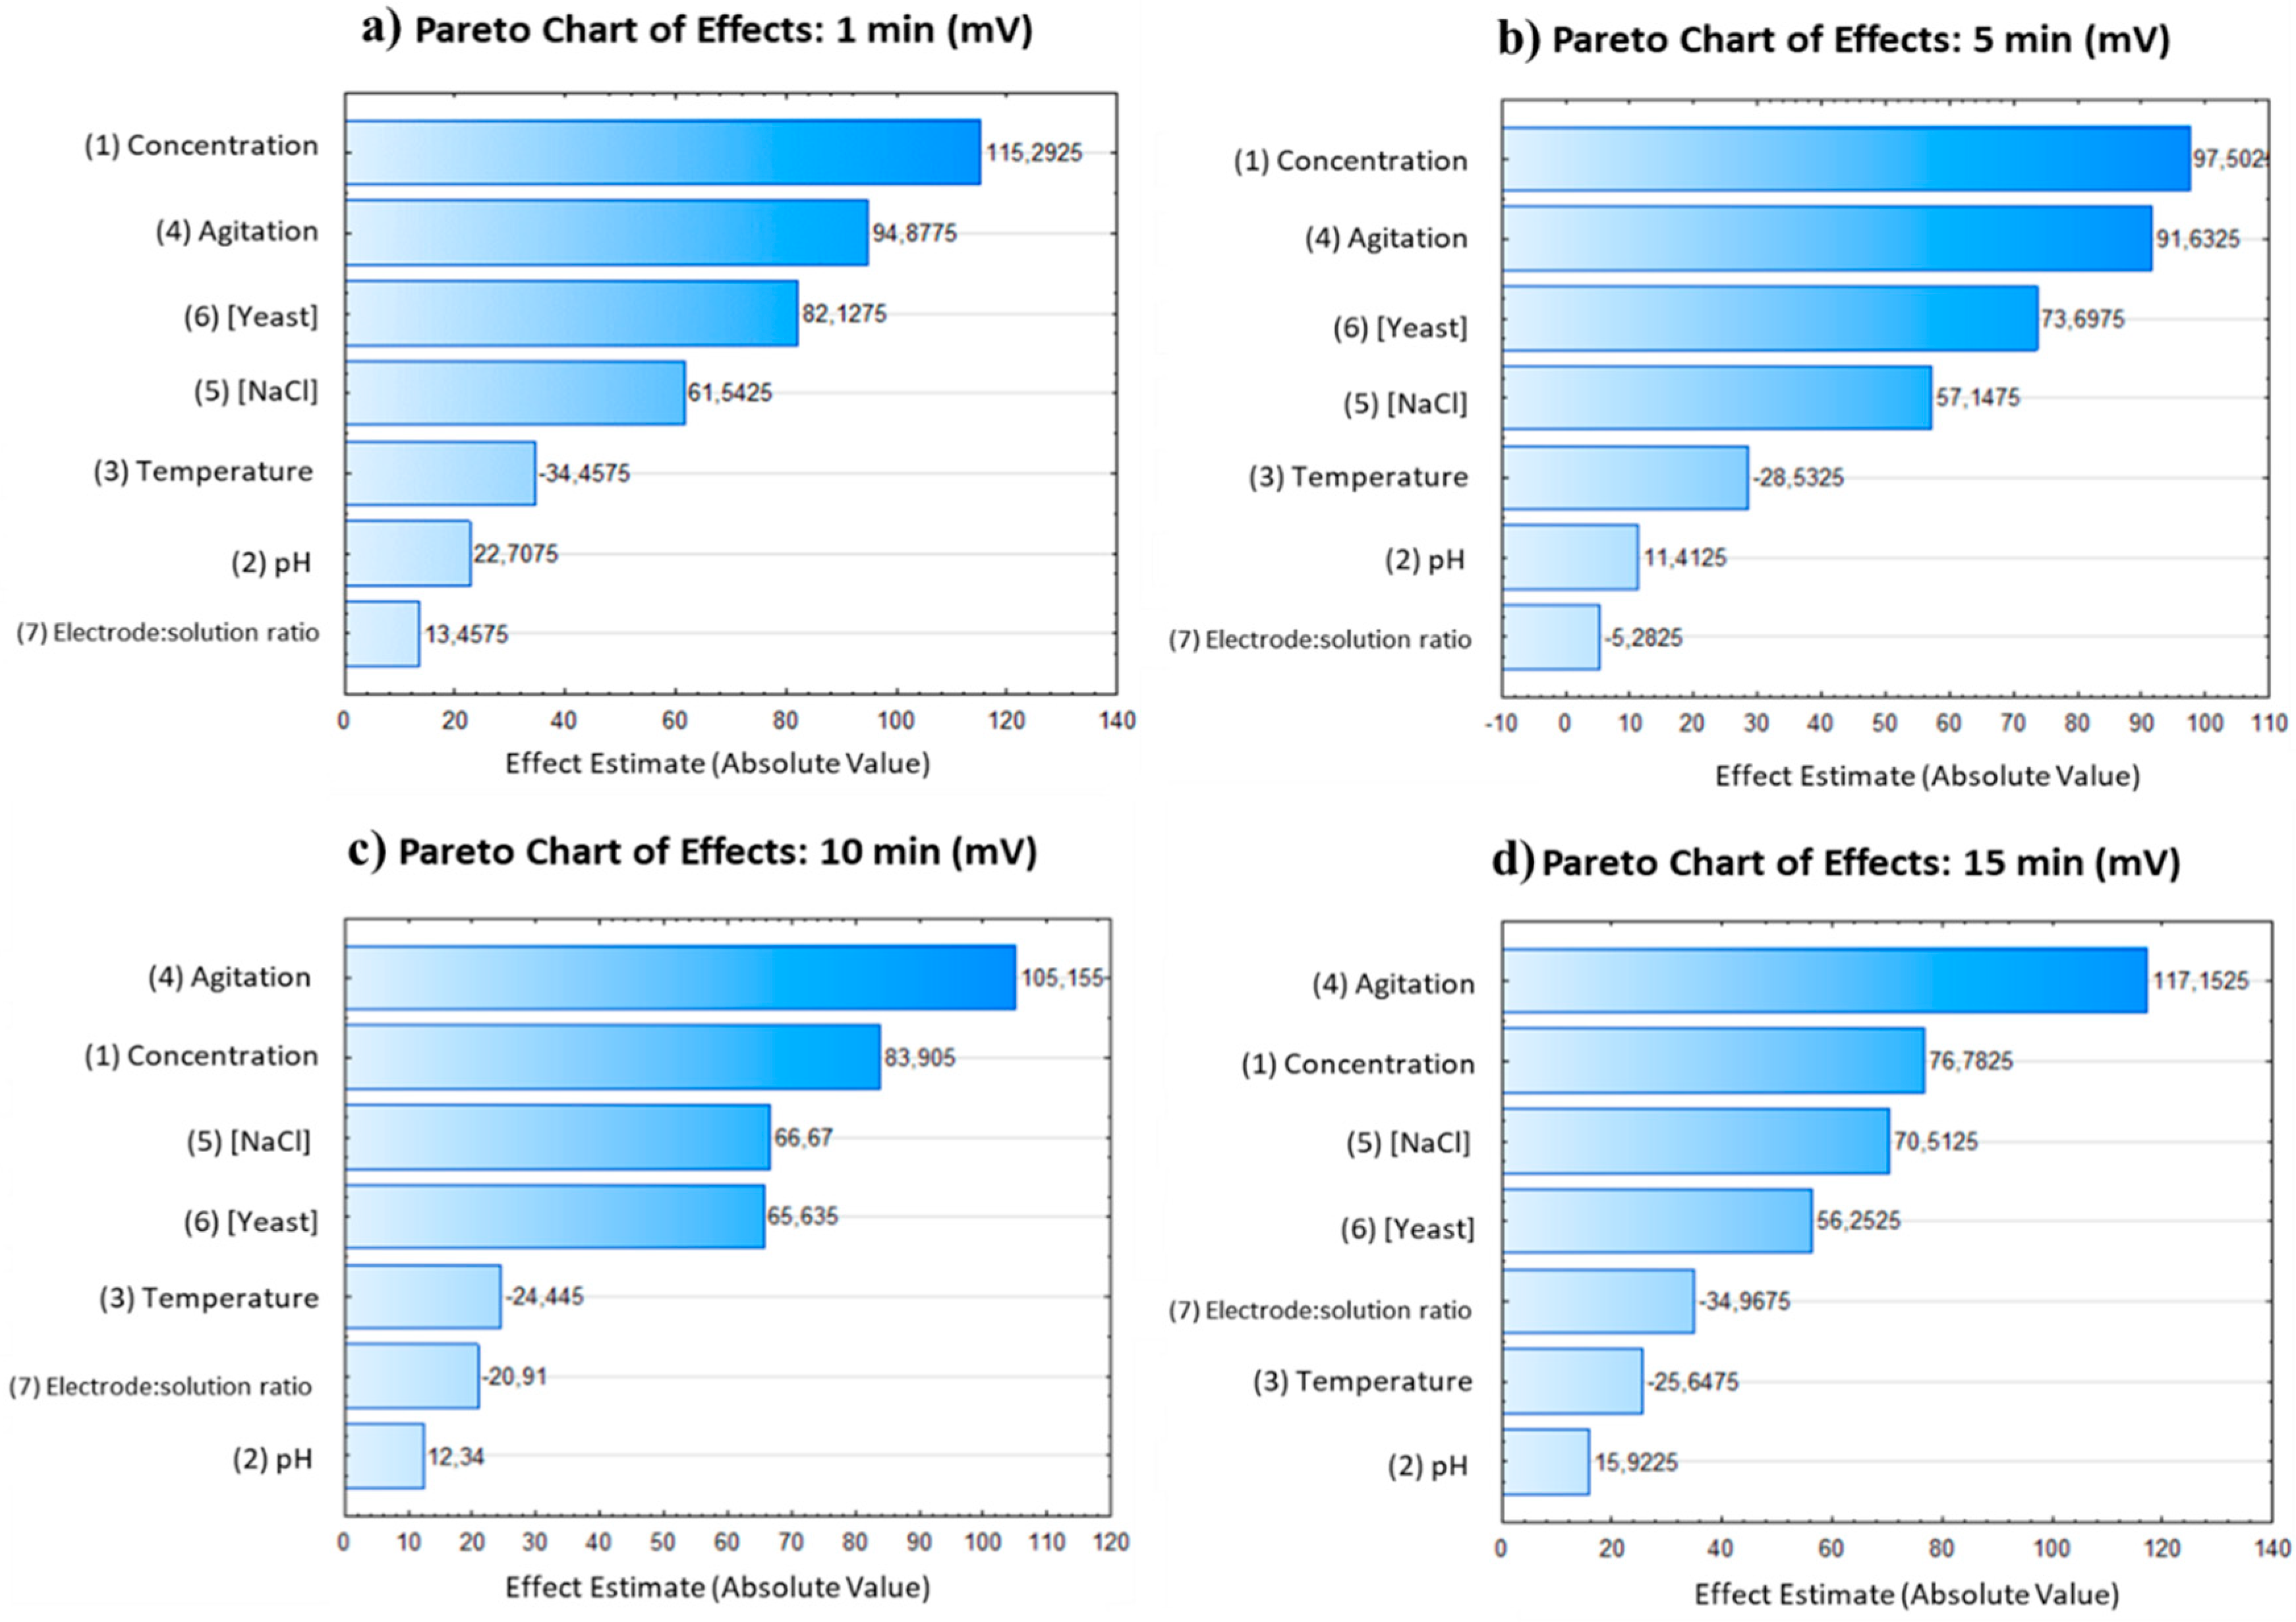
Figure 6.
Pareto charts for Box-Behnken design, depicting the frequency distribution of the data are presented for four-time intervals: a) 1 minute, b) 5 minutes, c) 10 minutes, and d) 15 minutes.
Figure 6.
Pareto charts for Box-Behnken design, depicting the frequency distribution of the data are presented for four-time intervals: a) 1 minute, b) 5 minutes, c) 10 minutes, and d) 15 minutes.
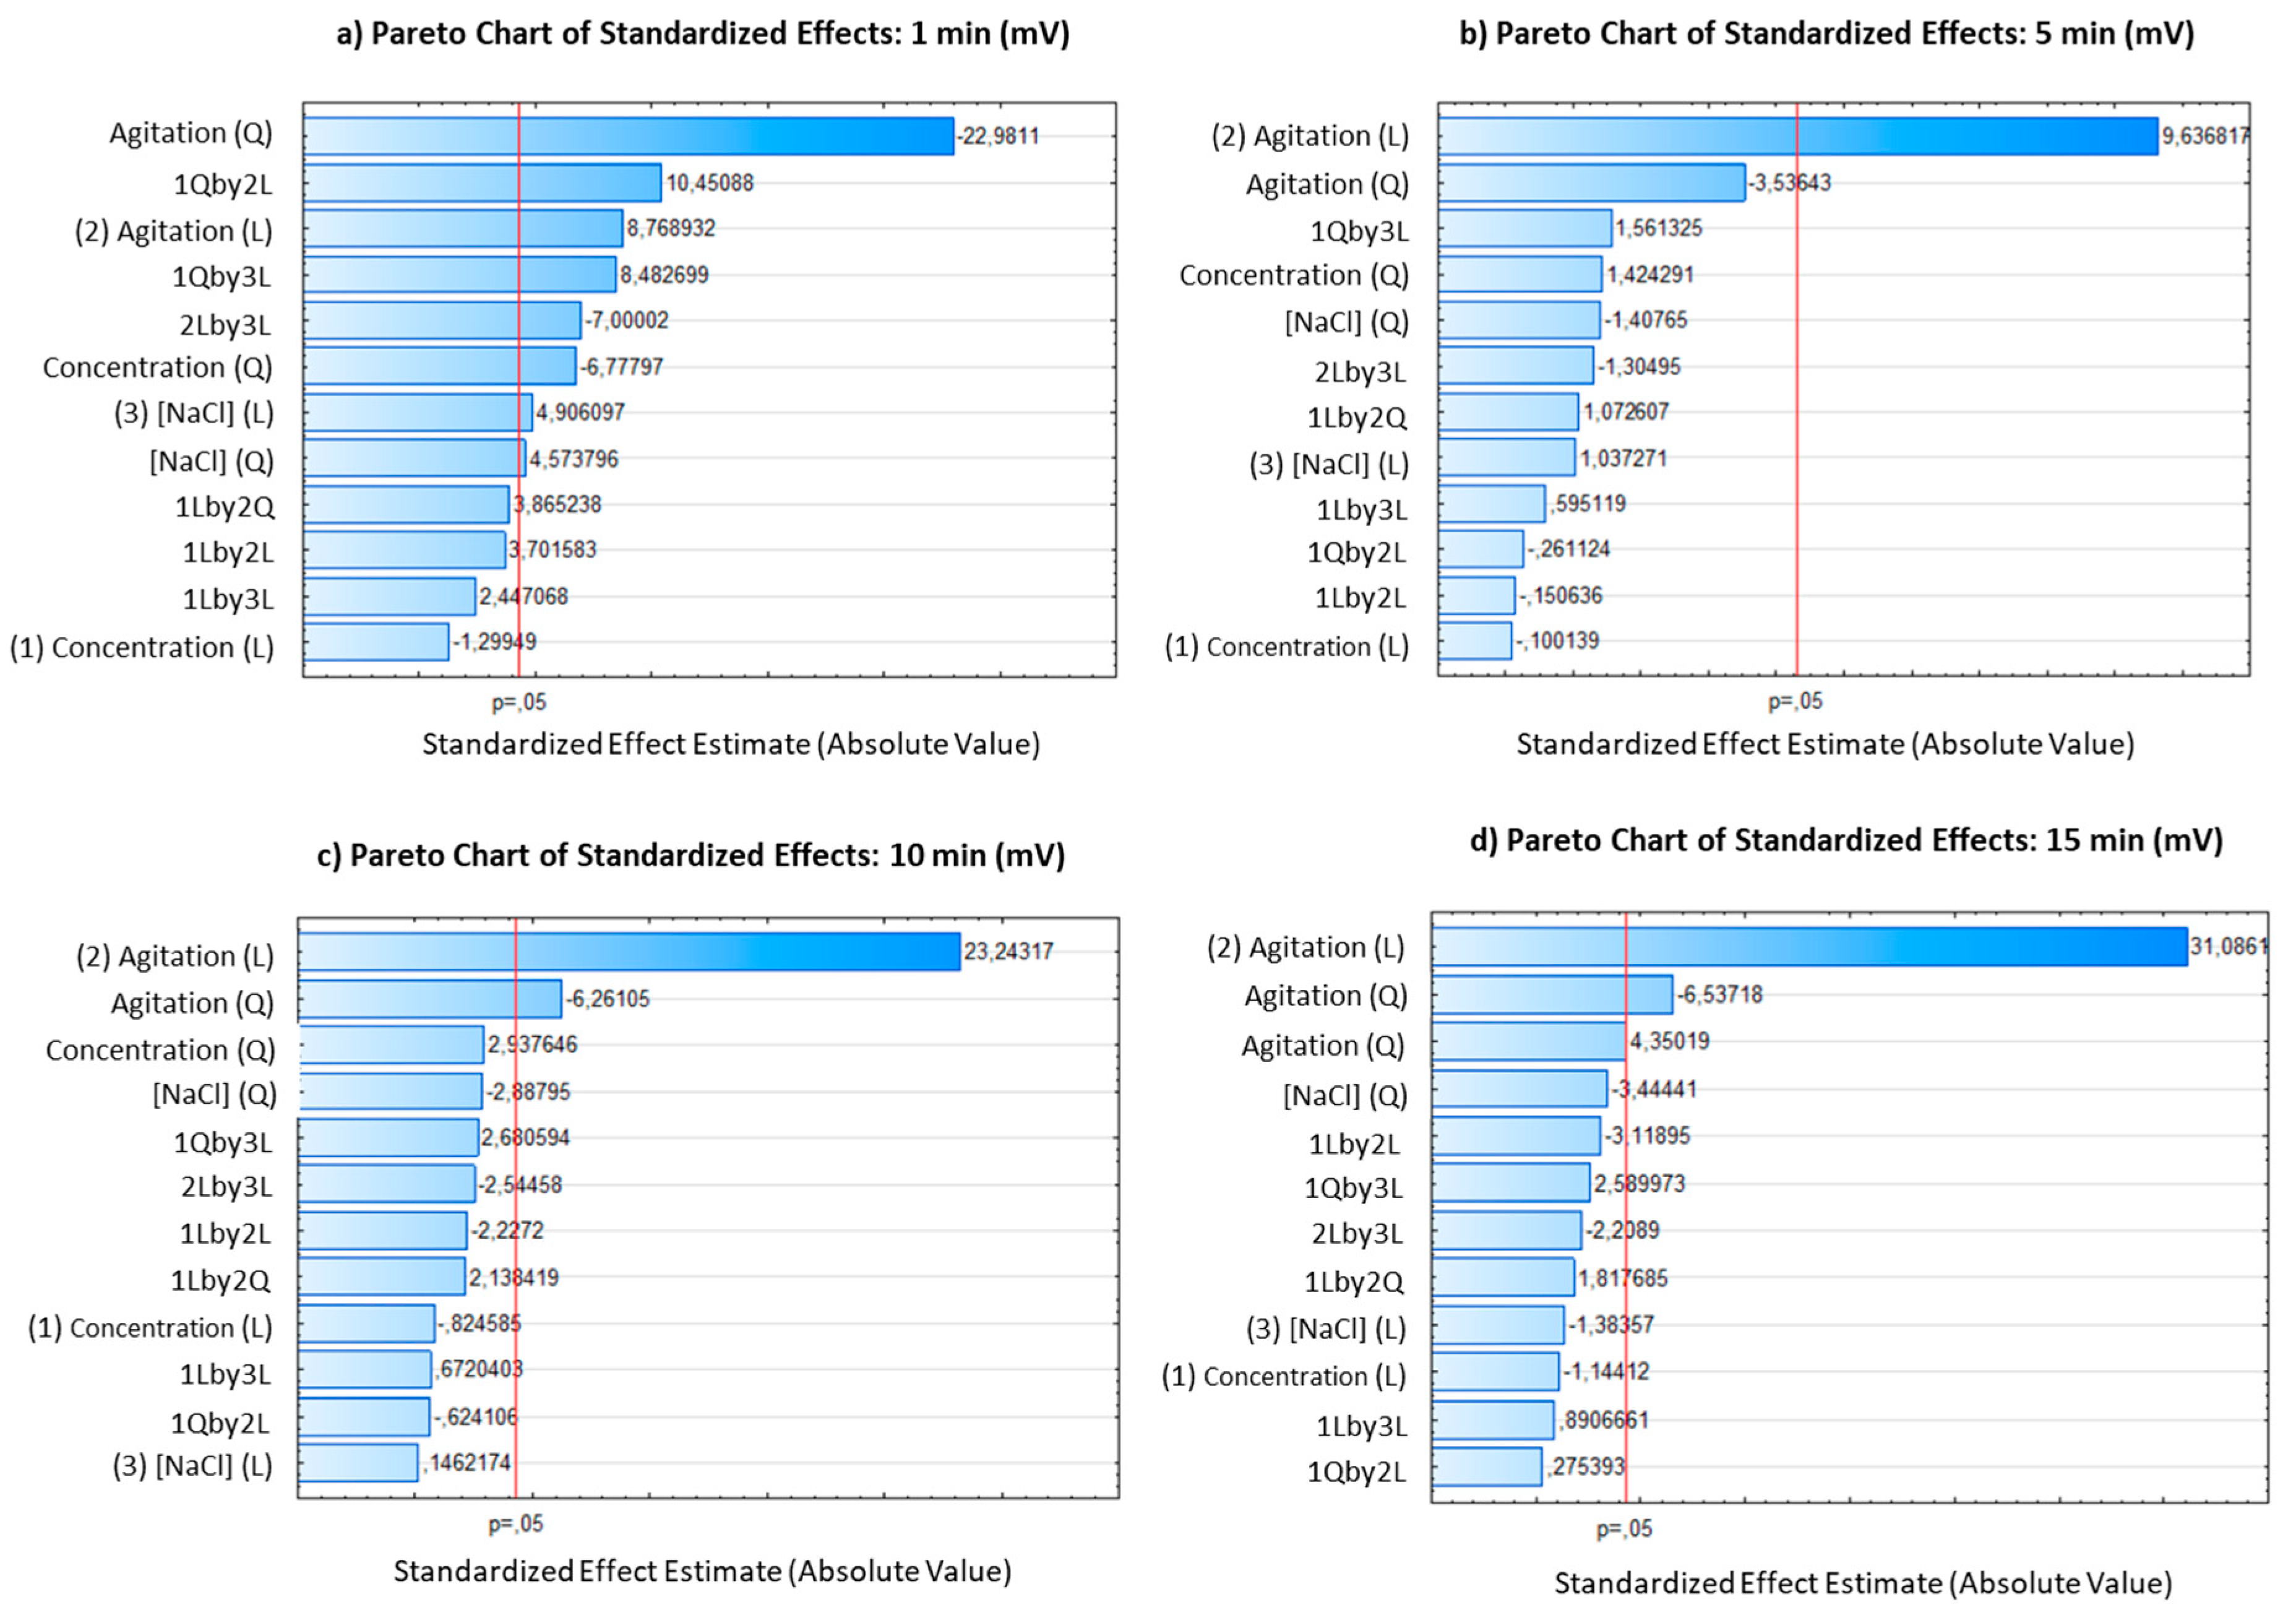
Figure 7.
Surface response obtained, depicting the influence of concentration, and stirring on the millivolts production, with NaCl at middle value. a) 1 minute, b) 5 minutes, c) 10 minutes, and d) 15 minutes.
Figure 7.
Surface response obtained, depicting the influence of concentration, and stirring on the millivolts production, with NaCl at middle value. a) 1 minute, b) 5 minutes, c) 10 minutes, and d) 15 minutes.
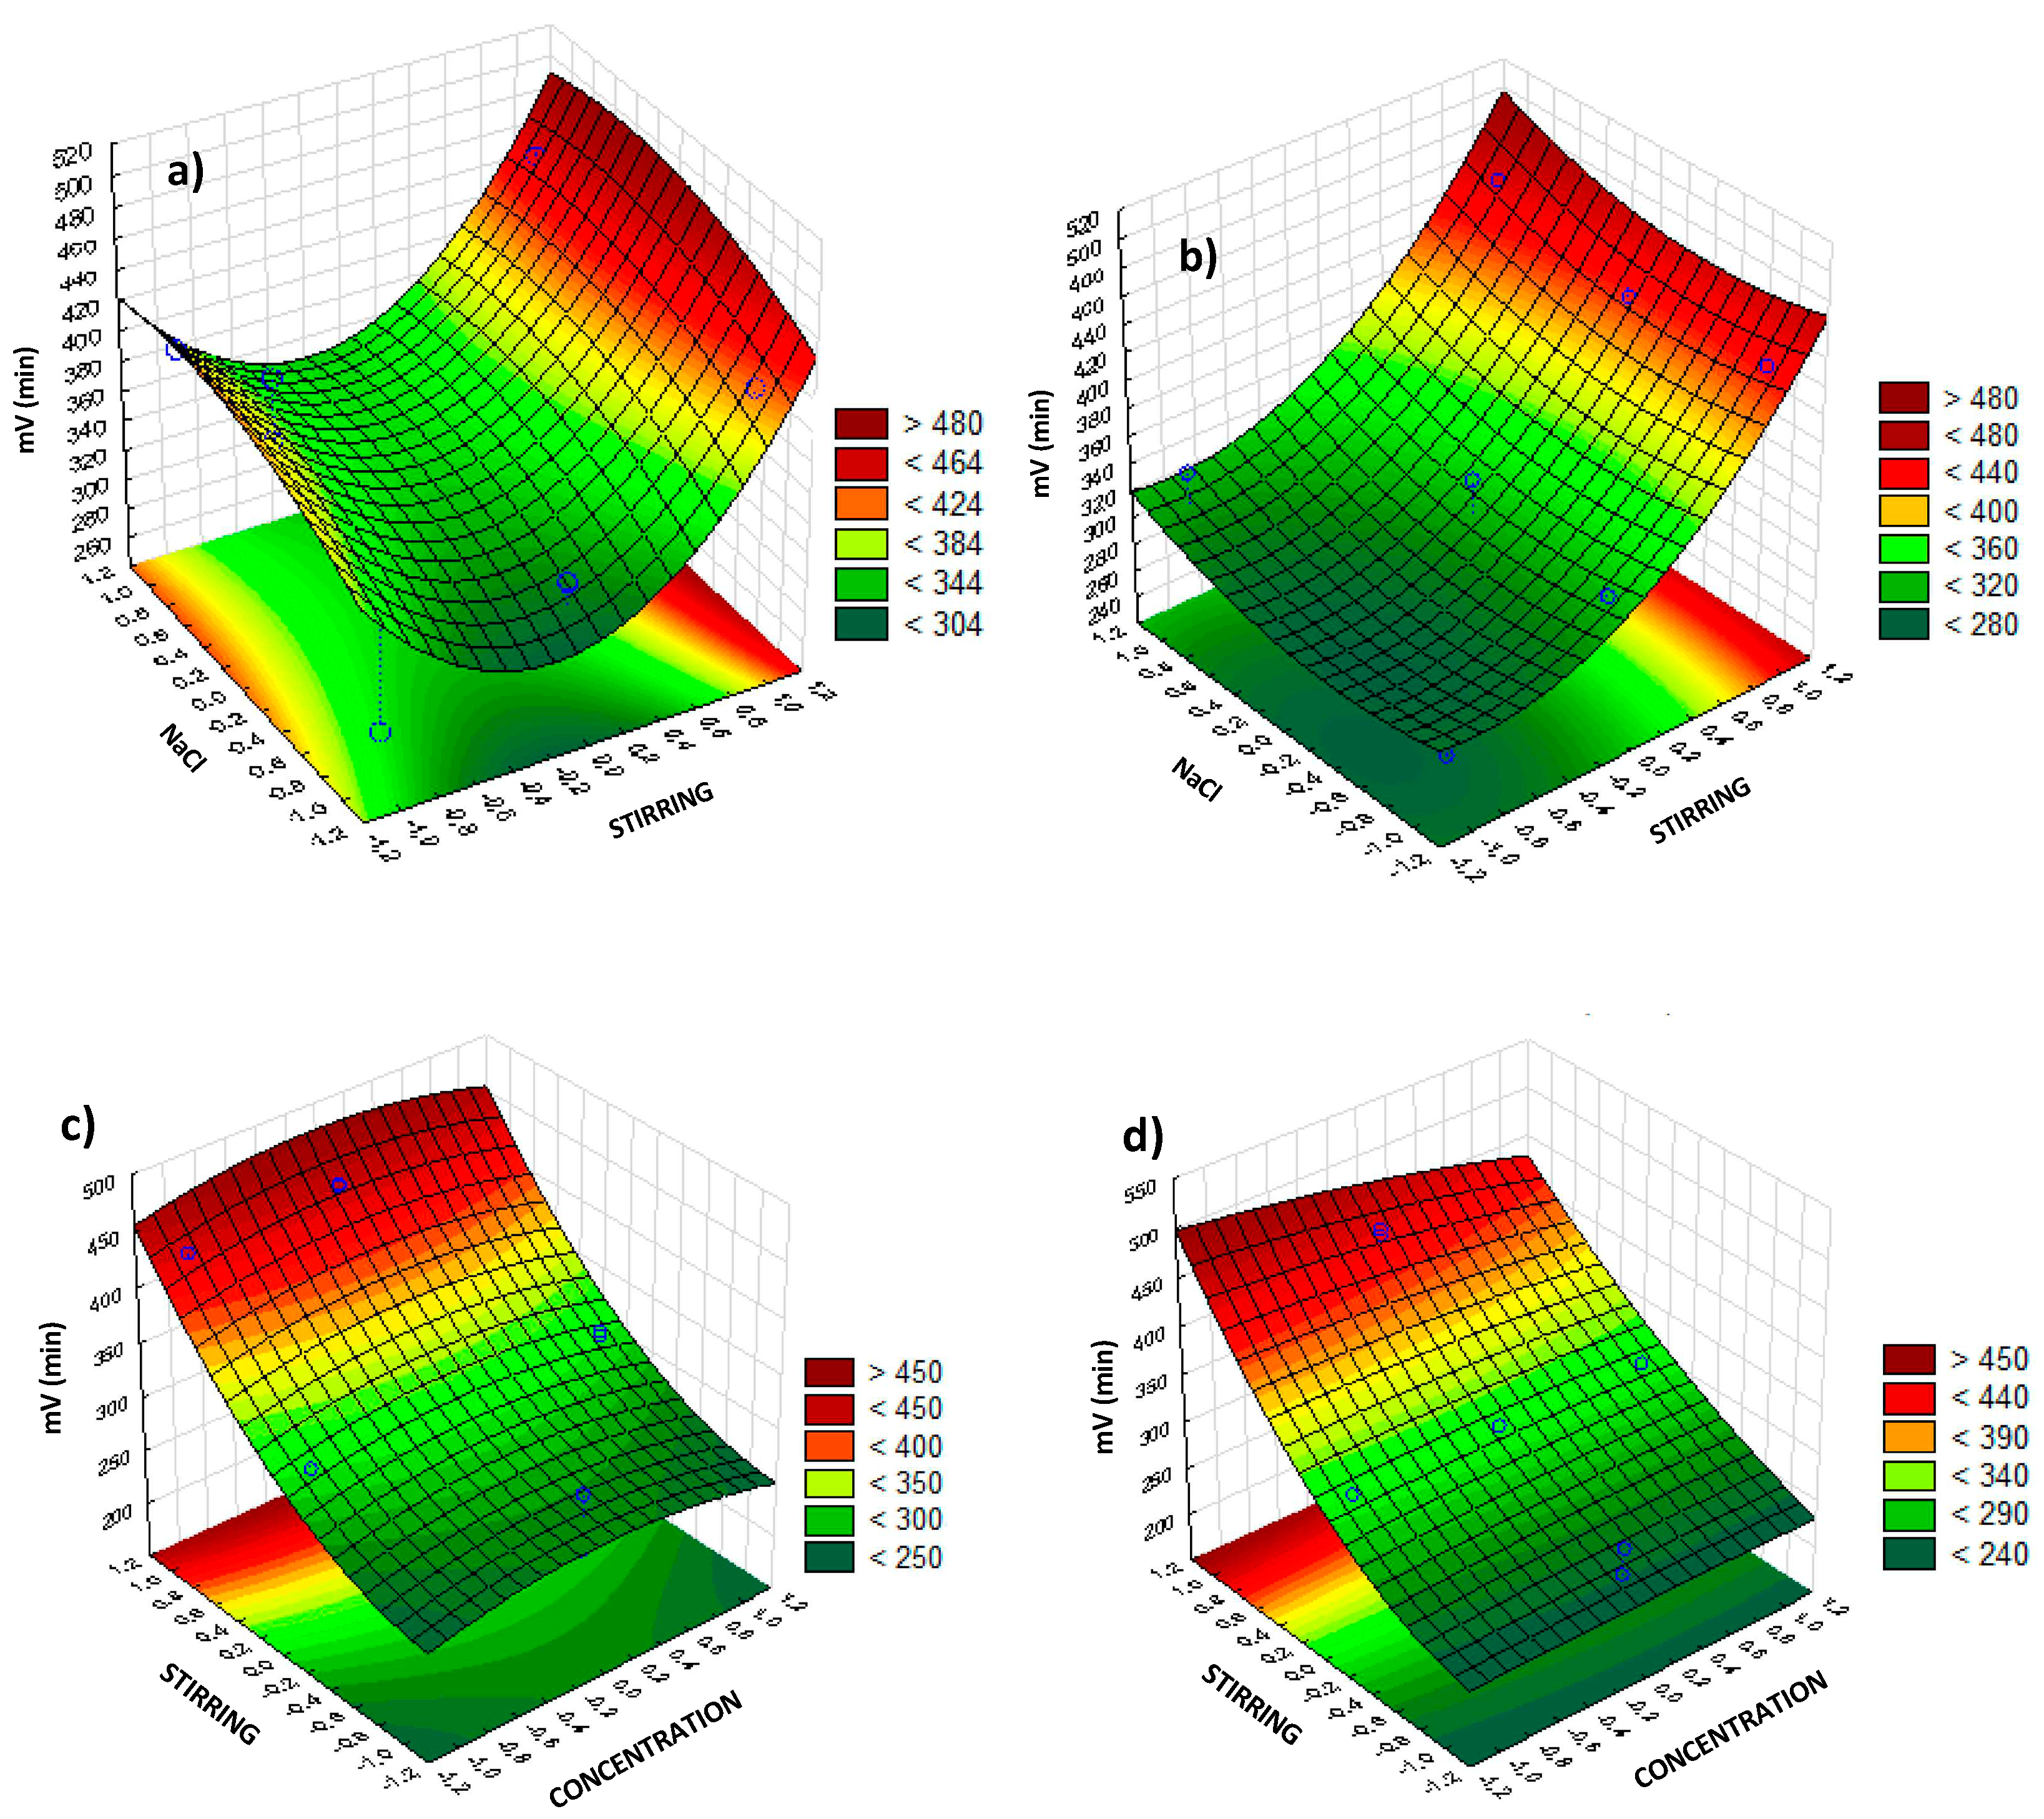
Table 1.
Placket-Burman design including 7 variables (A to G) and 6 experiments. The range of variation is indicated as +1 (maximum value assayed) or -1 (minimum value assayed).
Table 1.
Placket-Burman design including 7 variables (A to G) and 6 experiments. The range of variation is indicated as +1 (maximum value assayed) or -1 (minimum value assayed).
| A | B | C | D | E | F | G | |
|---|---|---|---|---|---|---|---|
| 1 | -1 | 1 | -1 | 1 | -1 | 1 | -1 |
| 3 | 1 | -1 | 1 | -1 | -1 | 1 | -1 |
| 2 | -1 | 1 | 1 | 1 | -1 | -1 | 1 |
| 5 | -1 | -1 | -1 | 1 | 1 | -1 | 1 |
| 4 | -1 | 1 | -1 | -1 | 1 | 1 | 1 |
| 7 | 1 | -1 | -1 | 1 | 1 | 1 | -1 |
| 8 | 1 | 1 | 1 | -1 | 1 | -1 | 1 |
| 6 | 1 | -1 | 1 | -1 | -1 | 1 | -1 |
Table 2.
Placket-Burmann design including seven variables and minimum (-1) and maximum (+1) coded values assayed for each.
Table 2.
Placket-Burmann design including seven variables and minimum (-1) and maximum (+1) coded values assayed for each.
| A | B | C | D | E | F | G | |
| 1 | -1 | 1 | -1 | 1 | -1 | 1 | -1 |
| 3 | 1 | -1 | 1 | -1 | -1 | 1 | -1 |
| 2 | -1 | 1 | 1 | 1 | -1 | -1 | 1 |
| 5 | -1 | -1 | -1 | 1 | 1 | -1 | 1 |
| 4 | -1 | 1 | -1 | -1 | 1 | 1 | 1 |
| 7 | 1 | -1 | -1 | 1 | 1 | 1 | -1 |
| 8 | 1 | 1 | 1 | -1 | 1 | -1 | 1 |
| 6 | 1 | -1 | 1 | -1 | -1 | 1 | -1 |
A (Concentration); B (pH); C (Temperature); D (Stirring); E ([NaCl]); F ([Yeast]); G (Electrode:solution ratio).
Table 3.
Box-Behnken design including three (A: concentration), D (Stirring), E ([NaCl]) variables and minimum (-1), medium (0) and maximum (+1) coded values assayed for each.
Table 3.
Box-Behnken design including three (A: concentration), D (Stirring), E ([NaCl]) variables and minimum (-1), medium (0) and maximum (+1) coded values assayed for each.
| 1 | 2 | 3 | 4 | 5 | 6 | 7 | 8 | 9 | 10 | 11 | 12 | 13 | 14 | 15 | |
|---|---|---|---|---|---|---|---|---|---|---|---|---|---|---|---|
| A | 0 | 0 | 0 | 0 | -1 | -1 | 1 | 1 | -1 | -1 | 1 | 1 | 0 | 0 | 0 |
| D | -1 | 1 | -1 | 1 | -1 | 1 | -1 | 1 | 0 | 0 | 0 | 0 | 0 | 0 | 0 |
| E | -1 | -1 | 1 | 1 | 0 | 0 | 0 | 0 | -1 | 1 | -1 | 1 | 0 | 0 | 0 |
Table 4.
Values of mV obtained for Placket-Burmann experiments. Results are expressed as mean values±coefficient of variation (%).
Table 4.
Values of mV obtained for Placket-Burmann experiments. Results are expressed as mean values±coefficient of variation (%).
| Exp 1 | Exp 2 | Exp 3 | Exp 4 | Exp 5 | Exp 6 | Exp 7 | Exp 8 | |
|---|---|---|---|---|---|---|---|---|
| 1 min | 280,1±3,4 | 265,6±3,5 | 150,0±6,0 | 291,3±3,2 | 132,4±3,7 | 195,0±13,5 | 127,6±3,5 | 403,4±5,1 |
| 5 min | 293,6±3,8 | 231,2±11,2 | 129,5±11,6 | 269,1±5,3 | 123,6±5,1 | 193,5±6,4 | 124,9±4,3 | 363,3±7,0 |
| 10 min | 301,9±3,9 | 188,1±27,1 | 119,8±12,9 | 264,3±4,4 | 121,3±4,7 | 188,2±5,8 | 116,1±9,1 | 349,6±6,6 |
| 15 min | 306,9±4,1 | 158,6±37,8 | 113,0±14,3 | 272,6±6,7 | 117,7±6,1 | 183,2±6,5 | 108,4±13,4 | 337,1±7,8 |
Disclaimer/Publisher’s Note: The statements, opinions and data contained in all publications are solely those of the individual author(s) and contributor(s) and not of MDPI and/or the editor(s). MDPI and/or the editor(s) disclaim responsibility for any injury to people or property resulting from any ideas, methods, instructions or products referred to in the content. |
© 2023 by the authors. Licensee MDPI, Basel, Switzerland. This article is an open access article distributed under the terms and conditions of the Creative Commons Attribution (CC BY) license (http://creativecommons.org/licenses/by/4.0/).
Copyright: This open access article is published under a Creative Commons CC BY 4.0 license, which permit the free download, distribution, and reuse, provided that the author and preprint are cited in any reuse.


