Submitted:
25 July 2023
Posted:
26 July 2023
Read the latest preprint version here
Abstract
Polycystic ovary syndrome (PCOS) is a complex, but relatively common endocrine disorder associated with chronic anovulation, hyperandrogenism, and micro-polycystic ovaries [1]. In addition to reduced fertility, people with PCOS have a higher risk of obesity, insulin resistance, and metabolic disease [1], all comorbidities that are associated with mitochondrial dysfunction. This review summarizes human and animal data that report mitochondrial dysfunction and metabolic dysregulation in PCOS to better understand how mitochondria impact reproductive organ pathophysiology. This in-depth review considers all the elements regulating mitochondrial quantity and quality, from mitochondrial biogenesis under transcriptional regulation of both the nuclear and the mitochondrial genome, to the ultrastructural and functional complexes that regulate cellular metabolism and reactive oxygen species production, to dynamics which regulate subcellular interactions that are key to mitochondrial quality control. When any of these mitochondrial functions are disrupted the energetic equilibrium within the cell changes, cell processes can fail, and cell death can occur. If this process is ongoing, it affects tissue and organ function to cause disease. The objective of this review is to consolidate and classify a broad number of PCOS studies to understand how various mitochondrial processes impact reproductive organs including the ovary (oocyte and granulosa cell), uterus, placenta, and circulation to cause reproductive pathophysiology. A secondary objective is to uncover the potential role of mitochondria in transgenerational transmission of PCOS and metabolic disorders.
Keywords:
polycystic ovary syndrome (PCOS)
; ovary
; uterus
; placenta
; mitochondria
; biogenesis
; mtDNA
; metabolism
; mitochondrial dynamics
; oxidative stress
1. Introduction
Polycystic ovary syndrome (PCOS) is a complex disease resulting from a variety of reproductive, endocrine, and metabolic abnormalities. The prevalence of PCOS is between 4 and 18% worldwide [2,3] and affects as many as 5 million people in the US [4]. The Rotterdam criteria are widely used to clinically diagnose PCOS [5]. Using this tool, patients are required to meet at least two of the three criteria, which include oligo-anovulation, hyperandrogenism, and presence of polycystic ovaries by ultrasound [6,7,8]. Based on which characteristics are present, PCOS can be further categorized into four subtypes, although the naming of these subtypes varies within the literature. The classical subtype includes all three Rotterdam criteria, while the other subtypes are characterized by variations of the diagnostic criteria [7,9,10]. These subtypes are helpful diagnostic tools but have not been associated with specific outcomes [9]. Importantly, many cases of PCOS go undiagnosed or diagnosis is significantly delayed, an indicator that there is a much higher prevalence than reported [9].
The lifestyle management of PCOS focuses on weight management, regular testing of glycated hemoglobin A1c (HbA1c), first and third trimester oral glucose tolerance testing during pregnancy, and preventing comorbidities though screening for hypertension, dyslipidemia, and psychological disorders [11]. The recommendation for medical management of PCOS alongside lifestyle modifications for both adults and adolescents includes combined oral contraceptives for irregular cycles, hirsutism, and acne combined with metformin to improve glucose levels and adiposity [12]. Metformin’s low cost and availability has set it apart as the first-line treatment for PCOS symptoms, however, many studies are also investigating the efficacy of anti-obesity drugs like glucagon-like peptide-1 agonists as additional therapy [13]. For reproductive outcomes, letrozole has been shown to improve pregnancy rates and live births as well as reduce time-to-pregnancy [14]. Letrozole may have benefits in combination with metformin, although more studies are needed to better understand the periconceptual and fetal effects of metformin [9].
Key features in the pathophysiology of PCOS are hyperandrogenism due to ovarian androgen hypersecretion [15] and insulin resistance [16], however the connections and underlying mechanisms linking these features are not well understood. PCOS has heritable phenotypes but with variability that may be related to maternally inherited mitochondria or epigenetic programming [17,18]. In rodent models, there is even evidence of transgenerational transmission of PCOS due to the changes in epigenetics and mitochondrial function in oocytes related to dihydrotestosterone (DHT) [19].
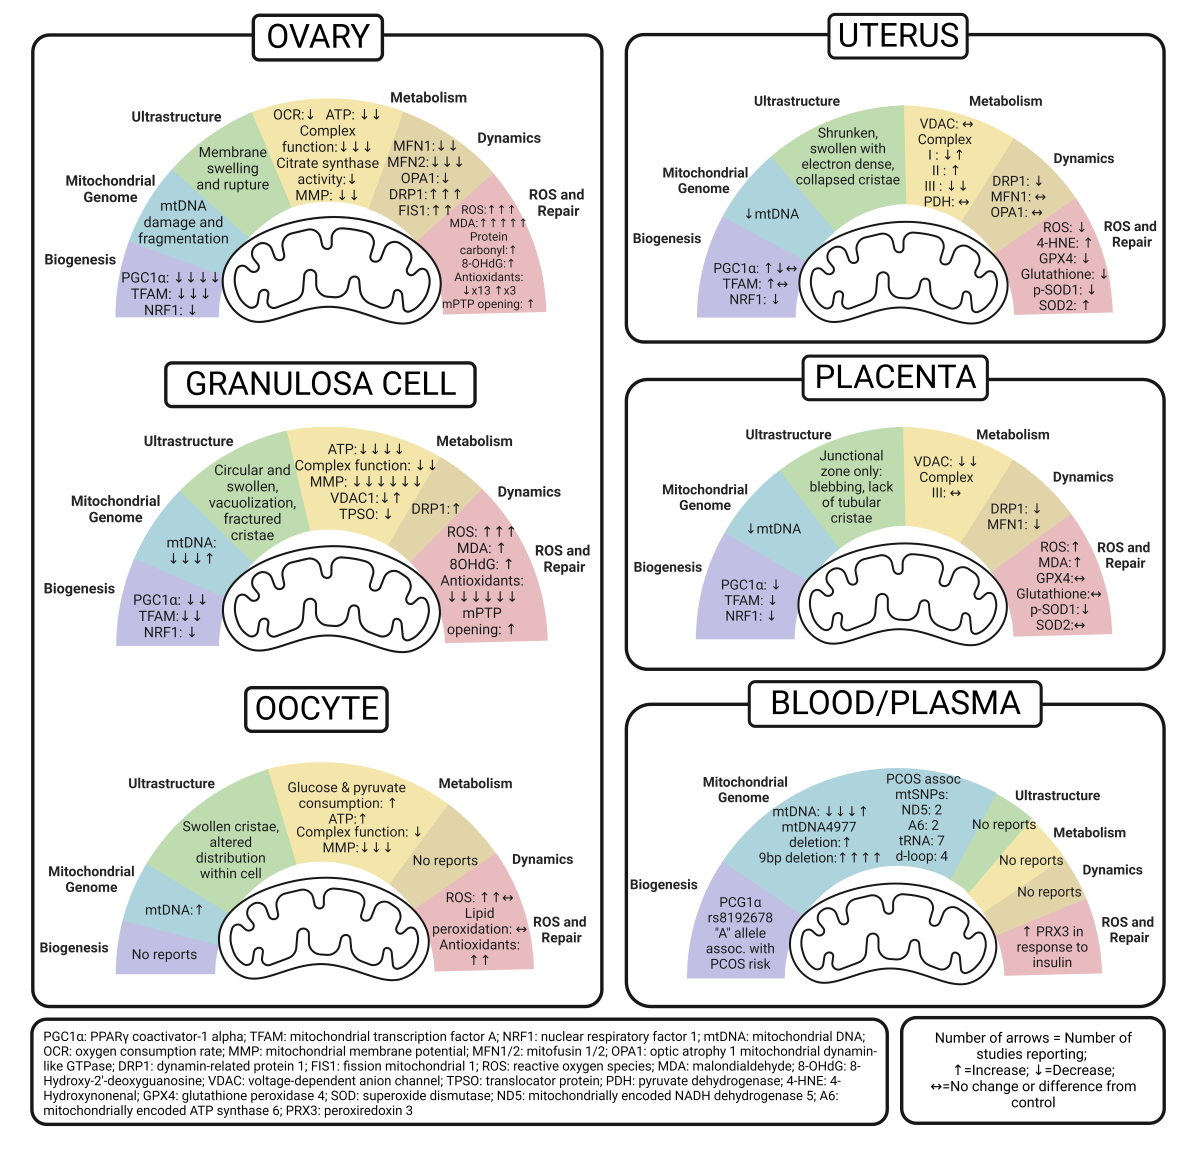
Although the constellation of symptoms associated with PCOS was first documented in 1721 [20,21], the underlying mechanisms remain poorly understood, and the prevalence of PCOS continues to rise. Even with lifestyle and medical treatment, patients experience substantial consequences of PCOS across their lifetime. Moreover, with evidence suggesting PCOS affects multiple generations, it is crucial to uncover inheritable factors related to the pathogenesis and develop preventative and therapeutic measures to decrease both reproductive consequences and metabolic co-morbidities in this growing population. Mitochondrial dysfunction has been reported in PCOS, but studies working to uncover mitochondria-mediated mechanisms of PCOS are limited. The objective of this review is to compile data and examine patterns of mitochondrial dysfunction reported in PCOS to better understand the role of mitochondria on reproductive health and developmental programming. To do this, we review six predefined mitochondrial functions as shown in Figure 1, and then summarize PCOS-related findings in the ovary (granulosa cell and oocyte), uterus, placenta, and peripheral circulation. Emerging patterns are illustrated in Figure 2. We hope this compilation will set the groundwork needed to develop new diagnostic and therapeutic interventions for people with PCOS and mitigate transgenerational consequences for their progeny.
2. Methods
EvidenceHunt [22] and PubMed were used to search articles published before July 2023 using search terms “PCOS”, “polycystic ovary syndrome”, “mitochondria” and/or “antioxidant”. Authors reviewed search results to include studies that investigated 6 predefined mitochondria roles in PCOS models as outlined in Figure 1. Finally, these studies’ results were summarized in Figure 2 with a thorough compilation in Table 1, Table 2, Table 3 and Table 4. The outcomes of studies related to measurements of SIRT1/3 and cellular apoptosis that did not also measure predetermined mitochondrial functions were outside of the scope of this study. Additionally, studies not examining one of the selected reproductive organs were not included within this review. Because gene symbol capitalization varies between species, unless specifically written, this review reports genes and their functional proteins with the protein symbol in all capital letters for consistency across outcomes [23].
3. Animal and Cellular Models of PCOS
Animal models are necessary to understand the impact of PCOS on the reproductive system, namely the ovary, uterus, and placenta, as well as inheritance for offspring. The three most common methods of PCOS induction in animal models include: dehydroepiandrosterone (DHEA), DHT, or letrozole injections. Both letrozole and DHEA are typically given daily for 20-21 days, whereas DHT administration is more variable with some studies using daily injections, implantation of controlled-release pellets, or three consecutive injections after confirmation of pregnancy to investigate in utero exposures. In addition, some studies use these agents in combination with high fat diet and/or other methods of inducing insulin resistance, primarily because of the strong association with human PCOS. Interestingly, one study induced PCOS symptoms of anovulation, obesity, and metabolic disorder in a mouse model through high fat/high glucose diet alone [24].
Cellular models are also used to understand PCOS pathogenesis. Isolation of primary granulosa cells (GCs), oocytes, and whole organs from PCOS-induced animals are commonly used. Collecting primary tissue like ovaries from humans is not usually feasible however, PCOS patients undergoing oocyte retrieval in a fertility clinic have both oocytes and GCs collected from the ovaries. This offers an opportunity to study two types of primary cells for the translational study of human disease, albeit in a slightly biased patient population that is seeking fertility treatment. There are also immortalized GC lines, with the most common one in this review being KGN, which is a steroidogenic human ovarian cell line derived from a GC tumor. Some in vitro studies in this review added various concentrations of DHEA and DHT to cell culture systems to mimic androgen exposure. In addition, one study incorporated palmitic acid to recapitulate a high fat or lipotoxic environment [24]. Overall, these in vitro models are important tools used to understand the role of mitochondria on cellular metabolism, energetic processes, and cell fate.
4. Mitochondrial Function and Cell Fate
Both the quantity and quality of mitochondria influence cell function and fate. These vary widely between cell types primarily because of varying metabolic demands. Mitochondrial biogenesis relies on intact mitochondrial DNA (mtDNA) and robust nuclear and mitochondrial cross-talk to generate new regulatory proteins. Quality is influenced by the ultrastructure of the organelle and the ability to efficiently produce ATP through oxidative phosphorylation (OXPHOS). Dynamics, or fission and fusion, influences mitochondrial quality by facilitating turnover of damaged mitochondria. As primary producers of reactive oxygen species (ROS), mitochondria rely on cellular antioxidants to prevent oxidative damage to lipids, proteins, and DNA that can set up a vicious cycle of further mitochondrial damage and eventual cell death. These six functions, shown in Figure 1 and detailed below, all impact mitochondrial health and disease risk.
4.1. Mitochondrial Biogenesis
Mitochondria biogenesis refers to the collaborative effort between the nucleus and existing mitochondria to generate new proteins that contribute to the cellular network of mitochondria. Biogenesis usually increases in response to rising energetic demands including proliferation, but it may also increase to replace damaged mitochondria following environmental stressors and/or oxidative stress [25]. For this reason, increased biogenesis may represent a positive or a negative cellular response. The generation of new mitochondria through biogenesis is held in balance with mitophagy, the removal of damaged mitochondria. Mitophagy is critical for quality control of mitochondria and an imbalance of a high number of dysfunctional mitochondria impairs efficient energy production and creates ROS which can incite inflammation and signal cell death.
Biogenesis is under the influence of nuclear and mitochondrial transcriptional regulation. Peroxisome proliferator-activated receptor-gamma coactivator (PGC-1α), the master regulator of mitochondria biogenesis, resides in the nucleus. Its activation by phosphorylation stimulates a series of transcription factors including nuclear respiratory factor-1 (NRF-1), NRF-2, estrogen-related receptor-a (ERR-a), and transcription factor A (TFAM). NRF-1 increases the transcription of nuclear encoded genes that regulate mitochondrial function and NRF-2 increases the transcription of genes important for redox homeostasis. TFAM is the final transcription factor that begins the transcription and replication of mtDNA [25]. The translation of mtDNA in combination with a variety of nuclear genes generates new mitochondrial preproteins in the cytosol which are transported into the mitochondrial matrix for sorting and assembly. Because the quantity of mitochondria in cells is not due exclusively to synthesis, it is important to acknowledge that solely measuring expression of these nuclear transcription factors cannot equate to mitochondrial mass. This is also true because protein activity is also regulated by post-translational modification (phosphorylation). Moreover, increased expression can occur in response to metabolic cues or mitochondrial turnover (mitophagy) related to dysfunctional or damaged mitochondria [26]. It is important to consider the structural and functional aspects that follow initial transcription of nuclear and mitochondrial genes, protein translation, and mitochondrial localization and assembly to understand the results of biogenesis studies on mitochondrial physiology and pathophysiology.
4.2. Mitochondrial Genome
Measuring mtDNA copy number can serve as a marker of mitochondria quantity within a cell, especially when assessed in combination with imaging and expression of mitochondrial proteins. For this reason, it is often used as a surrogate marker of biogenesis. Importantly, sequencing mtDNA can identify polymorphisms of 37 genes specific to the mitochondria [27]. Specifically, genetic mutations and heteroplasmy contribute to disease processes. Because mtDNA is maternally inherited, identifying polymorphisms and other mutations in mtDNA may predict disease risk for offspring, especially when considering family history [28,29]. Moreover, mtDNA damage and mutations increase with ageing and after environmental exposures, so they can be followed longitudinally to assess health and disease risk over a time [30,31]. While mtDNA is important, it should be recognized that mtDNA encodes only 37 genes and many mitochondrial functions are regulated by proteins encoded by the nuclear genome.
4.3. Ultrastructure
The assessment of mitochondrial ultrastructure is also a useful tool for assessing mitochondrial quality. Some studies estimate the integrity and abundance of mitochondria by measuring the expression of the translocase of the outer membrane (TOMM20). This is the most highly expressed protein complex in the outer membrane system [32]. The advent of electron microscopy in the 1950s has advanced understanding significantly. It not only allowed the visualization of mitochondria [33], but also a better understanding of the wide range of structural variations exhibited by different tissues and pathologies [34]. The conformation of the inner and outer membrane which make up the mitochondria’s cristae are crucial for the organelle’s bioenergetics function. Abnormal ultrastructure can lead to ROS production, mitophagy, and ultimately, cellular processes like apoptosis. A multitude of structural abnormalities in cristae have been reported through the use of electron microscopy, many of which are also linked to impaired bioenergetics. Because the inner mitochondria membrane (IMM) houses the components of the electron transport chain, its surface area and integrity are important for generating the driving force for ATP production [35]. Disease processes such as diabetes are associated with altered cristae structure or a loss of cristae altogether. While there are other reviews that explore electron microscopy to uncover complex and crucial protein structures within the inner and outer mitochondrial membrane [36,37], this review aims to leverage studies’ conclusions on mitochondrial ultrastructure to identify patterns that impact metabolism, dynamics, and oxidative stress in PCOS.
4.4. Metabolism
There are many ways to assess the role of mitochondria in cellular bioenergetics and ATP production in PCOS. Measuring mRNA or protein expression of the mitochondria-specific protein complexes that participate in OXPHOS, ATP synthase, fatty acid oxidation and the Krebs cycle can be measured to estimate their abundance. However, it is crucial to also measure these protein complexes’ activities. There are tools to measure activity of Complexes I-IV of the electron transport chain as well as citrate synthase and pyruvate dehydrogenase that are necessary for the Kreb’s cycle [38,39]. While protein measurements and activity assays are often carried out in mitochondria isolates, it is important to remember that isolating mitochondria disrupts access to stored fuels such as glycogen and lipid droplets. It also disrupts the cellular mitochondrial network and interactions with other organelles. Therefore, measuring respiration in isolated mitochondria may not fully recapitulate the cell’s metabolic capacity [40]. For this reason, extracellular flux analysis which measures cellular bioenergetics in intact cells, in real time has advantages [41]. Finally, generating ATP also requires maintenance of an electrochemical gradient across the IMM. The voltage-dependent anion channel (VDAC) is a protein on the outer mitochondrial membrane (OMM) that facilitates communication between the mitochondria and rest of the cell; it can serve as a useful marker of maintenance of the membrane potential [42]. Measuring mitochondria membrane potential (MMP) not only gives insight to the cells ability to generate ATP, but also its ability to carry out other energy-dependent processes such as transport of mitochondrial proteins, mitophagy, and ultimately, cell viability [43].
4.5. Dynamics
Mitochondrial dynamics refers to fission and fusion events across the networks of mitochondria. The balance of fission and fusion in a cell regulates number, volume, and position within the cell [44]. Fission may play a role in replication during cell division and marking damaged mitochondria for mitophagy. Fusion to other subcellular organelles, such as lysosomes, is also important for mitochondria quality control. Therefore, a balance of fission and fusion is necessary for maintaining normal mitochondrial function. An imbalance or pro-fission state is associated with pathophysiological conditions and human disease. For example, under stress mitochondria become more fragmented, small and dysfunctional which makes them more prone to mitophagy [45].
More and more human diseases are associated with mutations in proteins governing fission and fusion, so it is important to understand how PCOS influences dynamics in the context of disease risk. The proteins involved in mitochondrial fusion are mitofusins 1 and 2 (MFN1 and MFN2) which drive OMM fusion and optic atrophy 1 mitochondrial dynamin-like GTPase (OPA1) which facilitates IMM fusion [46]. Mitochondrial fission is primarily carried out by dynamin-related/-like protein 1 (DRP1 or also known as DMN1L), which, under the influence of phosphorylation, binds to partners like mitochondrial fission 1 protein (FIS-1) to constrict the organelle [47]. In this review, we report altered dynamics as changes in the abundance or expression of these five proteins or any imaging modalities to track mitochondria network fusion or fission.
4.6. Reactive Oxygen Species and Repair
Many studies report oxidative stress in PCOS. Mitochondria are the primary producers of ROS and ROS generation increases with mitochondrial dysfunction. While ROS generation is crucial for intracellular redox signaling, excess ROS production causes lipid, protein and DNA oxidation which can damage mtDNA and proteins leading to a vicious cycle of worsening mitochondrial function, oxidative damage, and cell death [48,49]. Ultimately, an imbalance of ROS production and antioxidant capacity leads to multiple human diseases [50].
There are a variety of ways to measure ROS and downstream oxidative stress including mitochondrial permeability transition pore (mPTP) opening, direct or indirect measurements of ROS, and lipid, protein, and DNA oxidation. Most commonly, lipid peroxidation is measured using malondialdehyde (MDA) or 4-hydroxynonenal (4-HNE) assays. Protein carbonylation and 8-Hydroxy-2'-deoxyguanosine (8-OHdG) are used to measure protein and DNA oxidation, respectively. Additionally, measuring antioxidant expression and activity can estimate the response to increasing levels of ROS and inform about the cell’s ability to prevent oxidative damage. Common assays include measuring superoxide dismutase (SOD), glutathione peroxidase (GPX), and catalase (CAT).
On their own, elements of mitochondrial biogenesis, genetics, ultrastructure, metabolism, dynamics, or oxidative stress do not provide a complete understanding of how disease processes impact cell and organ function. Taken together, it can provide a clearer picture of how mitochondria function in a cyclical and dynamic fashion to impact disease pathogenesis. Often the difficulty of utilizing all these modalities simultaneously to assess mitochondria function limits the conclusions made by studies in isolation. This review will investigate the many facets of mitochondrial function in PCOS models to better understand the role of mitochondria and oxidative stress in various reproductive organs.
5. Ovary Mitochondria in PCOS
The ovary is a vital female reproductive endocrine organ which consists of both somatic cells and germ cells (oocytes) that influence the health of both the parent and the offspring. It is also the organ primarily affected by PCOS. Because of this dual role, we will examine the effect of PCOS on ovarian mitochondria as a whole, and we will also take a closer look at the granulosa cells (GC) and oocytes separately. Study methods and results are detailed in Table 1, Table 2 and Table 3. Figure 2 summarizes emerging patterns of mitochondrial dysfunction in the PCOS ovary to better understand the impact on fertility and generational consequences.
5.1. Whole Ovary
As a whole, mitochondrial biogenesis and downstream mitochondria quantity and quality have been evaluated in a wide variety of PCOS models. Even with diverse methods of PCOS induction, rodent models evaluating biogenesis in whole ovary uniformly show decreased levels of PGC-1α, NRF-1, and TFAM [51,52,53,54]. Metformin treatment increased PGC-1α, NRF-1, and TFAM expression, as did a traditional Chinese medicine, cangfudaotan decoction [51], neurokinin-B antagonist [53], 2 different carnitine formulations [54], and overexpression of SIRT3, an NAD-dependent deacetylase [55].
Only one study directly evaluated mtDNA in ovarian tissue [51]. Jiang et al. reported more damaged and fragmented mtDNA in the ovaries of a letrozole-induced rat model of PCOS that was also given a high fat diet, but administration of either cangfudaotan or metformin significantly decreased mtDNA damage and fragmentation [51].
There was little reporting of mitochondria ultrastructure within the ovary as a whole, and most studies examined this within specific cell types, like the GCs and oocytes. These are detailed in subsequent sections. One study reported mitochondrial membrane swelling and rupture in ovarian tissue, and that cangfudaotan or metformin decreased the total percentage of damaged mitochondria, although not as low as in control groups [51].
Many studies assessed ATP levels, complex proteins, and citrate synthase in order to better understand the functional role of ovarian mitochondria in PCOS. In general, ATP levels were lower in PCOS exposed ovaries [51,56]. However, neonatal ovaries exposed to PCOS in utero had ATP levels similar to controls [57]. Uniformly, all rodent PCOS studies, excluding the in utero exposed models, reported lower complex I, III, IV, and total complex enzyme activity [51,56,58]. While the in utero exposed model did not report complex enzymatic activity, they did report lower expression of a specific subunit within complex IV compared to controls [57]. Impaired complex activity was rescued by cangfudaotan, Bushen Huatan Granules, or selenium delivered by nanoparticle [51,56,58]. One study found PCOS was associated with lower citrate synthase activity, but this increased with administration of metformin or sodium selenite [59]. Furthermore, two similar studies uniformly reported that PCOS lowers the MMP in rat ovaries [51,56]. In both cases, cangfudaotan and selenium nanoparticle, along with metformin alone, improved MMP.
Only a couple studies measured real-time cellular bioenergetics to assess mitochondrial respiration. One study found PCOS led to a lower oxygen consumption rate (OCR) and respiratory control rate (RCR) in isolated mitochondria [51]. The other study examined bioenergetics by extracellular flux analyses in whole neonatal ovaries from an in utero PCOS-exposed rat model. PCOS-exposed neonatal ovaries had increased basal, maximal and ATP-linked OCR along with increased proton leak [57].
In studies evaluating the mitochondrial dynamics in the whole ovary, a common theme of imbalance emerges, specifically with impaired fusion and increased fission. For fusion, rodent studies found lower levels of MFN1, MFN2, and OPA1, but expression increased with interventions of cangfudaotan, sodium selenite, or metformin [51,52,59]. Fission genes DRP1 and FIS1 were higher in in rat PCOS models, but decreased with cangfudaotan, sodium selenite, or metformin [51,52,59].
Many studies evaluated oxidative stress in PCOS ovaries. Overall, PCOS increased mitochondrial superoxide [52,58], lipid peroxidation (MDA), protein oxidation, and DNA oxidation [52,56,59,60,61]. Cangfudaoton reversed elevated ROS production [51]. Selenium, sodium selenite, metformin, and genistein all successful decreased MDA levels [52,56,59,60,61], and metformin and sodium selenite decreased protein carbonyls [51,59]. Genistein treatment reversed DNA oxidation in DHEA-induced PCOS [61].
In addition to oxidative damage, some studies evaluated whether PCOS could alter the antioxidant capacity in the ovary, which would significantly influence its ability to respond to oxidative stress. Overall, the studies suggest that PCOS lowers antioxidant capacity, specifically SOD1 mRNA expression and SOD activity in ovary tissue [52,53,56,59,60,61]). In contrast, two other studies found increased levels of SOD2 protein [52,54], which may be a cellular response to oxidative stress. Others reported impaired GSH, GPx, GR, and GSH:GSSG ratio, while one study opposed this with reports of increased GSH-Px [52,56,59,61]. Three different studies found decreased CAT activity, which was rescued with both genistein and neurokinin-B antagonist [53,60,61]. Studying both ROS production and antioxidant capacity is important because when ROS is in excess of antioxidant capacity, oxidative damage and cell death occurs. This is highlighted by two studies that also looked at mitochondrial permeability transition pore (mPTP) opening and levels of cytochrome C in the cytosol, both of which are primary regulators of cell death. PCOS increased these markers in rat ovaries but were significantly reduced with cangfudaotan and metformin, or Bushen Huatan Granules, respectively [51,58].

Table 1.
Effects of PCOS on mitochondrial function in the ovary.
| Mitochondrial Function | Effect of PCOS Condition on Mitochondrial Function | Model - Species | PCOS Model/Diagnosis | Treatment timeframe | Method | Therapeutic Intervention | Reference |
|---|---|---|---|---|---|---|---|
| Biogenesis | Decreased PGC1 |
Rat | IP Letrozole + HFD | 21 days, 21 days, 35 days, 12 weeks | qPCR, WB | Cangfudaotan (IG) and metformin (IG) increased PGC1 to control levels | [1] |
| Rat | IG Letrozole | 21 days | WB | [2] | |||
| Mouse | SQ DHT | 35 days | WB | Overexpressing SIRT3 in vivo increased PGC1 back to control levels | |||
| Mouse | HF/HGD (58% kcal fat + sucrose) | 12 weeks | qPCR | Neurokinin-B antagonist increased PGC1 back to control levels | [3] | ||
| Decreased TFAM | Mouse | SQ DHEA | 20 days | WB | 1) L-carnitine (LC) + acetyl-L-carnitine (ACL) 2) LC and ACL plus propionyl-L-carnitine Both formulations increased TFAM compared to DHEA alone and controls |
[4] | |
| Rat | IG Letrozole | 21 days | WB | [2] | |||
| Mouse | HF/HGD (58% kcal fat + sucrose) | 12 weeks | qPCR | Neurokinin-B antagonist increased TFAM back to control levels | [3] | ||
| Decreased NRF1 | Mouse | HF/HGD (58% kcal fat + sucrose) | 12 weeks | qPCR | Neurokinin-B antagonist increased NRF1 back to control levels | [3] | |
| Mitochondrial Genome | Increased mtDNA fragmentation | Rat | On day 22 of HFD (46% fat), OG letrozole | 21 days | qPCR | Cangfudaotan (IG) and metformin (IG) decreased mtDNA damage and fragmentation | [1] |
| Ultrastructure | Membrane swelling & ruptures | Rat | IP Letrozole + HFD | 21 days | EM | % of total damaged mitochondria decreased with both metformin (IG) or cangfudaotan (IG) but were still higher than control levels | [1] |
| Metabolism | Increased basal, maximal and ATP-linked OCR, proton leak | Mice - offspring | DHT injection in dams post coitus, assessed pup neonatal ovaries | GD 16.5, 17.5, 18.5 | XF (Agilent) of whole neonatal ovaries | [5] | |
| Decreased OCR, RCR | Rat | IP letrozole + HFD | 21 days | Oxytherm Clark-type electrode on isolated mitochondria | Cangfudaotan (IG) increased OCR, RCR | [1] | |
| Decreased ATP | Rat | On day 22 of HFD (46% fat), OG letrozole | 21 days | Colorimetric ATP assay | SeNP alone and in combination with metformin increased ATP (most increase in combination) | [6] | |
| Rat | IP letrozole + HFD | 21 days | ATP assay | Cangfudaotan (IG) increased ATP levels | [1] | ||
| No difference in ATP | Mice - offspring | DHT injection in dams post coitus, assessed pup neonatal ovaries | GD 16.5, 17.5, 18.5 | XF (Agilent) of whole neonatal ovaries | [5] | ||
| Decreased activity of mitochondrial complex enzymes | Rat | IP letrozole + HFD | 21 days | Complex enzymes activity assay | Cangfudaotan (IG) increased mitochondrial complex activity | [1] | |
| Decreased Complex I activity | Rat | On day 22 of HFD (46% fat), OG letrozole | 21 days | Complex I enzyme activity assay | SeNP alone and in combination with metformin increased Complex 1 activity (most increase in combination) | [6] | |
| Rat | SQ DHEA | 20 days | Bushen Huatan Granules (OG) increased activity of complex I | [7] | |||
| Decreased Complex III, IV activity | SQ DHEA | 20 days | Complex III, IV enzyme activity assays | Bushen Huatan Granules (OG) increased activity of complex III and IV | [7] | ||
| Decreased Complex IV (Cox6a2 subunit) | Mice - offspring | DHT injection in dams post coitus, assessed pup neonatal ovaries | GD 16.5, 17.5, 18.5 | RNAseq | [5] | ||
| Decreased citrate synthase activity | Rat | Letrozole (OG) | 21 days | Citrate synthase activity assay | Metformin (OG) and sodium selenite (OG) increased mitochondrial citrate synthase activity but was still lower than control group | [8] | |
| Decreased MMP | Rat | On day 22 of HFD (46% fat), OG letrozole | 21 days |
JC-1 staining | SeNP alone and in combination with metformin increased MMP (most increase in combination) | [6] | |
| Rat | IP letrozole + HFD | Cangfudaotan (IG) or metformin (IG) increased MMP | [1] | ||||
| Dynamics | Decreased MFN1 | Rat | IP letrozole + HFD | 21 days | qPCR/WB | Cangfudaotan (IG) or metformin (IG) increased MFN1 | [1] |
| Rat | IG Letrozole | 21 days | WB | [2] | |||
| Decreased MFN2 | Rat | IP letrozole + HFD | 21 days | qPCR/WB | Cangfudaotan (IG) or metformin (IG) increased MFN2 | [1] | |
| Rat | Letrozole (OG) | 21 days | qPCR/ELISA kit | Metformin (OG) and sodium selenite (OG) increased MFN2, but still lower than control group | [8] | ||
| Rat | IG Letrozole | 21 days | WB | [2] | |||
| Decreased OPA1 | Rat | IP letrozole + HFD | 21 days | qPCR/WB | Cangfudaotan (IG) or metformin (IG) increased OPA1 | [1] | |
| Increased DRP1 | Rat | IP letrozole + HFD | 21 days | qPCR/WB | Cangfudaotan (IG) or metformin (IG) decreased DRP1 | [1] | |
| Rat | Letrozole (OG) | 21 days | qPCR/ELISA kit | Metformin (OG) and sodium selenite (OG) decreased DRP1, but still higher than control group | [8] | ||
| Rat | IG Letrozole | 21 days | WB | [2] | |||
| Increased FIS1 | Rat | IP letrozole + HFD | 21 days | qPCR/WB | Cangfudaotan (IG) or metformin (IG) decreased FIS1 | [1] | |
| Rat | IG Letrozole | 21 days | WB | [2] | |||
| ROS & Repair | Increased ROS | Rat | IP letrozole + HFD | 21 days | DCF staining | Cangfudaotan (IG) or metformin (IG) decreased ROS | [1] |
| Rat | IG Letrozole | 21 days | Activity to produce superoxide anion assay | [2] | |||
| Increased mitochondrial superoxide | Rat | SQ DHEA | 20 days | MitoSOX staining | Bushen Huatan Granules (OG) decreased mitochondrial superoxide | [7] | |
| Increased lipid peroxidation | Rat | On day 22 of HFD (46% fat), OG letrozole | 21 days | MDA assay | SeNP alone or in combination with metformin decreased lipid peroxidation | [6] | |
| Rat | Letrozole (OG) | 21 days | Metformin (OG) and sodium selenite (OG) decreased lipid peroxidation, but still higher than control group | [8] | |||
| Rat | SQ DHEA | 21 days | [9] | ||||
| Rat | IG Letrozole | 21 days | [2] | ||||
| Mouse | SQ DHEA | 20 days | Genistein decreased lipid peroxidation | [10] | |||
| Increased protein oxidation | Rat | Letrozole (OG) | 21 days | DNPH reaction assay | Metformin (OG) and sodium selenite (OG) decreased protein oxidation, but still higher than control group | [8] | |
| Increased DNA oxidation | Mouse | SQ DHEA | 20 days | 8-OHdG ELISA | Genistein decreased DNA oxidation levels | [10] | |
| Decreased antioxidant capacity | Rat | Letrozole (OG) | 21 days | Ferric reducing antioxidant power assay | Metformin (OG) and sodium selenite (OG) increased antioxidant capacity, but still lower than control group | [8] | |
| Decreased SOD activity | Rat | On day 22 of HFD (46% fat), OG letrozole | 21 days | SOD enzyme activity assay | SeNP alone or in combination with metformin increased SOD levels | [6] | |
| Rat | SQ DHEA | 21 days | [9] | ||||
| Mouse | SQ DHEA | 20 days | Genistein increased SOD | [10] | |||
| Decreased SOD1 | Mouse | HF/HGD (58% kcal fat + sucrose) | 12 weeks | qPCR | Neurokinin-B antagonist increased SOD1 | [3] | |
| Increased SOD2 (MnSOD) | Mouse | SQ DHEA | 20 days | WB | 1) LC + ACL & 2) LC, ACL + propionyl-L-carnitine both decreased SOD2 | [4] | |
| Rat | IG Letrozole | 21 days | WB | [2] | |||
| Decreased GSH | Rat | On day 22 of HFD (46% fat), OG letrozole | 21 days | GSH level | SeNP alone or in combination with metformin increased GSH levels | [6] | |
| Decreased GSH-Px (GPx) | Rat | Letrozole (OG) | 21 days | GPx enzyme activity assay | Metformin (OG) and sodium selenite (OG) increased GPx activity, but still lower than control group | [8] | |
| Mouse | SQ DHEA | 20 days | GSH-Px level | Genistein increased GSH-Px | [10] | ||
| Increased GSH-Px | Rat | IG Letrozole | 21 days | GSH-Px enzyme activity assay | [2] | ||
| Decreased GR | Mouse | SQ DHEA | 20 days | GR enzyme activity assay | [10] | ||
| Decreased GSH:GSSG ratio | Mouse | SQ DHEA | 20 days | GSH and GSSG level | Genistein increased GSH:GSSG ratio | [10] | |
| Decreased CAT activity | Mouse | SQ DHEA | 20 days | CAT enzyme activity assay | Genistein increased CAT activity | [10] | |
| Rat | SQ DHEA | 21 days | [9] | ||||
| Mouse | HF/HGD (58% kcal fat + sucrose) | 12 weeks | qPCR | Neurokinin-B antagonist increased CAT expression | [3] | ||
| Increased opening of mPTP | Rat | IP letrozole + HFD | 21 days | Mitochondrial Membrane Pore Channel Colorimetric Assay | Canfudaton (IG) or metformin (IG) decreased opening of mPTP | [1] | |
| Increased levels of Cytochrome C in cytosol than in mitochondria | Rat | SQ DHEA | 20 days | WB | Bushen Huatan Granules (OG) decreased levels of Cytochrome C in cytosol fraction compared to mitochondrial fraction | [7] |
Footnotes for Table 1, Table 2 and Table 3: GC: Granulosa Cell, PGC1α: Peroxisome proliferator-activated receptor gamma coactivator 1-alpha, TFAM: mitochondrial transcription factor A, NRF1: nuclear respiratory factor 1, OCR: oxygen consumption rate, RCR: respiratory control ratio, MMP: mitochondrial membrane potential, MFN1: mitofusion 1, MFN2: mitofusion 2, OPA1: optic atrophy 1 mitochondrial dynamin-like GTPase, DRP1: dynamin-related protein 1, FIS1: fission 1, SOD: superoxide dismutase, SOD1: superoxide dismutase 1, SOD2: superoxide dismutase 2, MnSOD: manganese superoxide dismutase, GSH: reduced glutathione, GSH-Px: glutathione peroxidase, GPx: glutathione peroxidase, GR: glutathione reductase, GSSG: oxidized glutathione, CAT: catalase, mPTP: mitochondrial permeability transition pore, NDUFB8: NADH:Ubiquinone Oxidoreductase Subunit B8, ATP5j: ATP Synthase Peripheral Stalk Subunit F6, VDAC1: Voltage-dependent anion-selective channel 1, TSPO: translocator protein, UPR-MT: mitochondrial unfolded protein response, ND1: NADH dehydrogenase 1, ND2: NADH dehydrogenase 2, ND5: NADH dehydrogenase 5, ND6: NADH dehydrogenase 6, CO1: Cytochrome c oxidase subunit 1, CO2: Cytochrome c oxidase subunit 2, CO3: Cytochrome c oxidase subunit 3, IP: intraperitoneal, HFD: high fat diet, IG: intragastric, SQ: subcutaneous, DHT: dihydrotestosterone, HGD: high glucose diet, kcal: kilocalories, DHEA: dehydroepiandrosterone, OG: oral gavage, EV: extracellular vesicle, GD: gestational day, EM: electron microscopy, TEM: transmission electron microscopy, XF: Extracellular Flux analysis, JC-1: mitochondrial membrane potential probe, DCF: Dichlorofluorescein, DCHF-DA: 2'-7'-Dichlorodihydrofluorescein diacetate, MDA: malondialdehyde BAT: brown adipose tissue, TMRE: Tetramethylrhodamine, ethyl ester, ICC: immunocytochemistry, SIRT3: sirtuin 3, SeNP: selenium nanoparticle, 8-OHdG: 8-hydroxy-2’-deoxyguanosine, si-NK3R: small interfering RNA, targeting human NK3R, eCG: equine chorionic gonadotropin.
5.2. Granulosa Cell
Similar to the ovary, PCOS-exposed GC studies reported lower levels of the key biogenesis transcription factors, PGC-1α, NRF-1, and TFAM [53,55,62]. Treating GCs with either vitamin D3, small interfering RNA targeting human neurokinin 3 (si-NK3R), or overexpressing SIRT3 increased these transcription factors [53,55,62].
Upon investigation of the mitochondrial genome in GCs, three studies (a mouse, rat, and human model) reported lower mtDNA copy number, while one study reported higher mtDNA copy number in the KGN cell line incubated with DHT [24,55,62,63]. Vitamin D3 rescued a low mtDNA copy number in a mouse PCOS model [62], whereas overexpression of SIRT3 lowered the high mtDNA copy number in the KGN PCOS model [55].
Many GC studies characterized the ultrastructure of mitochondria primarily through transmission electron microscopy within ovarian tissue. Although each study had unique findings related to ultrastructure, the overall conclusion is that PCOS is associated with abnormal mitochondria ultrastructure. Specific findings included disorganized and fractured cristae and cristae dissolution, mitochondria that were less electron dense, swollen, less rod-shaped, more circular and constricted, had membrane defects, aggregated distribution, and vacuolization [24,57,64,65]. Interestingly, some of these ultrastructural abnormalities were also seen in neonatal ovaries that were exposed to PCOS in utero [57]. Melatonin or equine chorionic gonadotropin rescued some of these abnormalities [64,65]. In addition to electron microscopy, one study used nonyl-acridine orange analyzed by flow cytometry to evaluate mitochondria amount, and pLV-mitoDsRed plasmid transfection, which tags ATP synthase complex, to evaluate mitochondria by microscopy. Using these techniques, Sreerangaraja et al. reported an overall decrease in number of mitochondria and mitochondrial mass along with an increase in fragmentation and constrained cell expansion in human GCs from PCOS patients [66].
Evaluating metabolism in GCs showed many similarities across studies. Four groups which included rodent, human and the KGN cells reported lower ATP levels [24,55,61,63]. There were six studies that reported MMP to be decreased with representation from each type of model species [55,61,63,64,66]. Treatment with genistein increased ATP and MMP, and treatment with an Nrf2 inhibitor decreased ATP and MMP compared to the genistein group, although they were still higher than the PCOS group [61]. In addition, overexpressing SIRT3 in GCs increased ATP and MMP, but addition of PGC-1α inhibitor reversed these effects [55]. PCOS decreased complex activity (complex I, III, IV) as well as mRNA and protein levels of NDUFB8, a complex I subunit, and ATP5j, a subunit of ATP synthase [24,58]. Incubating GCs with serum from PCOS rats treated with Bushen Huatan Granules improved complex I, III and IV activities [58]. One study reported lower levels of a translocator protein located on the outer mitochondrial membrane, TSPO. The only discrepancies in metabolic outcomes came from two reports on VDAC1. One study using a rat PCOS model reported higher VDAC1 protein levels, whereas another study using GCs from PCOS patients reported lower VDAC mRNA levels and immunocytochemical staining [52,67].
Only one study evaluated proteins regulating mitochondrial dynamics in GCs. Salehi et al used a rat PCOS model to show DRP1 protein levels were higher in primary isolated GCs [65].
Numerous methods were used to assess oxidative stress in both animal and human PCOS studies. One mouse model and one human study found PCOS increased ROS levels in GCs and genistein decreased ROS in the mouse model [61,63]. They also reported more lipid and DNA oxidative damage that was rescued with genistein treatment [61]. One study also reported an upregulation of mitochondrial unfolded protein response (UPR-MT) proteins, which suggests an increase in the amount of damaged or misfolded proteins due to oxidative stress [68]. When examining antioxidant capacity, some reported decreased SOD, SOD1, GSH-Px, GR, GSH:GSSG ratio, and CAT in PCOS models, some improved with either genistein or si-NK3R [53,61]. Like the ovary, PCOS increased the opening of the mPTP in the KGN cell and melatonin reversed this [64]. Overall, PCOS appears to affect mitochondria in GCs similar to those in the whole ovary.
Table 2.
Effects of PCOS on mitochondrial function in the granulosa cells.
| Mitochondrial Function | Effect of PCOS on Mitochondrial Function | Model - Species | PCOS Model/Diagnosis | Treatment timeframe | Method | Therapeutic Intervention | Reference |
|---|---|---|---|---|---|---|---|
| Biogenesis | Decreased PGC1 | Cell line KGN | 500mM DHT | 24 hours | WB | Overexpression of SIRT3 (cell transfection) increased PGC1 levels comparable to controls | [11] |
| Cell line KGN | Palmitic Acid + DHT | Various | qPCR | si-NK3R increased PGC1 | [3] | ||
| Decreased TFAM | Mouse | SQ DHEA | 20 days prior to puberty | qPCR | Vitamin D3 (100mM for 24 hours) increased TFAM | [12] | |
| Cell line KGN | Palmitic Acid + DHT | Various | qPCR | si-NK3R increased TFAM | [3] | ||
| Decreased NRF1 | Cell line KGN | Palmitic Acid + DHT | Various | qPCR | si-NK3R increased NRF1 | [3] | |
| Mitochondrial Genome | Decreased mtDNA copy number |
Mouse | SQ DHT | 20 days prior to puberty | qPCR | Vitamin D3 (100mM for 24 hours) increased mtDNA copy number | [12] |
| Rat | SQ DHEA | 20 days | qPCR (mtND1:beta-globin) | [13] | |||
| Human | Rotterdam | qPCR (mtND1:beta-actin) | [14] | ||||
| Increased mtDNA copy number | Cell line KGN | 500nM DHT | 24 hours | qPCR | Overexpression of SIRT3 decreased mtDNA copy number, but increased back to DHT-exposed levels with PGC1a inhibitor | [11] | |
| Ultrastructure | Disorganized cristae, vacuoles, less electron dense | Mouse - offspring | DHT injection post coitus, assessed pup neonatal GCs | GD 16.5, 17.5, 18.5 | TEM | [5] | |
| Mitochondrial aggregated distribution, cristae dissolution and fracture, presence of vacuoles (66.66% abnormal mitochondria compared to 0% in controls) | Rat | SQ DHEA | 20 days | TEM | [13] | ||
| Mitochondrial swelling and membrane defects | Mouse | SQ DHT | 35 days | TEM | Melatonin reduced mitochondrial swelling and membrane defects | [15] | |
| Mitochondrial swelling and membrane defects | Human | Rotterdam | TEM | [15] | |||
| Less rod-shaped mitochondria, more circular/constricted mitochondria | Rat | Continuous-release DHT pellet implant | 1 month (83μg/day) | TEM | eCG increased rod-shaped mitochondria & decreased circular/constricted mitochondria | [16] | |
| Decreased mitochondria amount | Human | Rotterdam | Nonyl acridine orange (NAC) flow cytometry | [17] | |||
| Decreased mitochondrial mass, increased mitochondrial fragmentation, constrained cell expansion | Human | Rotterdam | pLV-mitoDsRed plasmid transfection (tags ATP synthase) and imaging | [17] | |||
| Metabolism | Decreased ATP levels | Mouse | 100 μM DHEA | 12 hours | ATP assay | Genistein increased ATP levels but still lower than controls. Additional treatment with NRF2 inhibitor ML385 decreased ATP levels compared to genistein alone, but was still higher than DHEA group | [10] |
| Rat | SQ DHEA | 20 days | [13] | ||||
| Cell line KGN | 500nM DHT | 24 hours | Overexpression of SIRT3 increased ATP, but addition of PGC1a inhibitor reversed this effect | [11] | |||
| Human | Rotterdam | [14] | |||||
| Decreased Complex I, III, IV activity | Rat | Testosterone (10-5 M) | 24 hours | Complex I/III/IV activity assay | 6 hour incubation with serum from rats receiving Bushen Huatan Granules treatment led to increased activity of complex I, III, IV | [7] | |
| Decreased NDUFB8 (Complex I subunit) and ATP5j (ATP synthase subunit) | Rat | SQ DHEA | 20 days | qPCR/WB | [13] | ||
| Decreased MMP | Mouse | SQ DHEA | 20 days | JC-1 flow cytometry | Genistein increased MMP but still lower than controls. Additional treatment with NRF2 inhibitor ML385 had similar MMP to DHEA group | [10] | |
| Cell line KGN | 500nM DHT | 24 hours | JC-1 staining | Overexpression of SIRT3 increased MMP, but addition of PGC1a inhibitor reversed this effect | [11] | ||
| Cell line KGN | 500nM DHT | 24 hours | Melatonin (1000pM for 24 hrs) increased MMP | [15] | |||
| Human | Rotterdam | TMRE flow cytometry | [17] | ||||
| Human | Rotterdam | Mitotracker Red flow cytometry |
[17] | ||||
| Human | Rotterdam | JC-1 Mitochondrial Membrane Potential Kit | [14] | ||||
| Increased VDAC1 | Rat | IG letrozole | 21 days | WB | [2] | ||
| Decreased VDAC1 | Human | Rotterdam | qPCR/ICC | [18] | |||
| Decreased TSPO | Human | Rotterdam | qPCR/ICC | [18] | |||
| Dynamics | Increased DRP1 | Rat | Continuous-release DHT pellet implant | 1 month (83μg/day) | WB | [16] | |
| ROS & Repair | Increased ROS | Mouse | 100 μM DHEA | 12 hours | DCFH-DA flow cytometry | Genistein decreased ROS | [10] |
| Human | Rotterdam | DCFH-DA | [14] | ||||
| Increased mitochondrial superoxide | Cell line KGN | 500nM DHT | 24 hours | MitoSOX staining | Overexpression of SIRT3 decreased mitochondrial superoxide, but addition of PGC1-a inhibitor reversed this outcome | [11] | |
| Increased lipid peroxidation | Mouse | SQ DHEA | 20 days | MDA assay | Genistein decreased lipid peroxidation | [10] | |
| Increased DNA oxidation | Mouse | SQ DHEA | 20 days | 8-OHdG ELISA | Genistein decreased 8-OhdG levels | [10] | |
| Decreased SOD, GSH-Px, GR, GSH:GSSG ratio | Mouse | SQ DHEA | 20 days | SOD, GR enzyme activity assays/GSH-Px, GSH:GSSG content assays | Genistein increased SOD, CAT, GSH-Px, GSH:GSSG ratio | [10] | |
| Decreased SOD1 | Cell line KGN | Palmitic Acid + DHT | Various | qPCR | si-NK3R increased SOD1 | [3] | |
| Decreased CAT | Mouse | SQ DHEA | 20 days | CAT enzyme activity assay | Genistein increased CAT | [10] | |
| Cell line KGN | Palmitic Acid + DHT | Various | qPCR | si-NK3R increased CAT | [3] | ||
| Upregulation of UPR-MT (mitochondrial unfolded protein response) proteins | Human | Rotterdam | qPCR | [19] | |||
| Increased opening of mPTP | Cell line KGN | 500nM DHT | 24 hours | Mitochondrial permeability transition pore assay | Melatonin (1000pM for 24 hrs) decreased opening of mPTP | [15] |
5.3. Oocyte
Evaluating the oocyte in PCOS models provides a unique opportunity to understand the pathogenesis of infertility as well as consequences for preimplantation embryos and generational disease risk. Both mitochondrial quantity and quality are important for oocyte development and maturation. Because mitochondria are maternally inherited, passing on dysfunctional or damaged mitochondria can lead to detrimental lifelong health outcomes in the developing offspring. The very earliest stage of oocyte development, the primordial germ cell, contains the least amount of mitochondria, but undergoes significant amplification during oocyte maturation so that the mature oocyte contains about 100,000 mitochondria. This high number of mitochondria are essential for fertilization, proliferation and implantation, which are all high energy events.
In studies evaluating oocytes exposed to PCOS, there were no reports focused on mitochondrial biogenesis, but two studies assessed the mitochondria genome. The first study collected oocytes from a mouse model of PCOS and found an increased mtDNA copy number, while another study looked at multigenerational outcomes and found no differences in mtDNA copy number in oocytes from post-pubertal female rats exposed to PCOS in utero [69,70].
Multiple studies assessed the ultrastructure of oocyte mitochondria, which are unique in that they have a more circular appearance and less complex cristae due to their naïve state [71]. PCOS causes disorganized, malformed and swollen cristae, less or no electron dense contents and vacuolization [57,69,70]. Interestingly, one study also showed an abnormal mitochondrial distribution in murine oocytes that had been co-cultured with extracellular vesicles from patients with the non-hyperandrogenic phenotype of PCOS according to Rotterdam criteria [72].
Alterations in cellular metabolism were also found at the oocyte level. One human study used an ultra-microfluorometric assay to show that PCOS caused increased glucose and pyruvate consumption in oocytes [73]. Multiple studies showed a decrease in MMP in rodent models of PCOS, which was found to be increased in a mouse model of PCOS study with a rat-to-mouse brown adipose tissue xenotransplant [69,70,74]. Studies reporting ATP levels and complex protein expression were vastly different. Oocytes collected from a PCOS mouse model had higher ATP levels and lower mitochondrial complex I gene expression (Nd1, Nd2, and Nd5) [69]. Conversely, young adult offspring exposed to PCOS in utero had no changes in oocyte ATP levels despite increased mitochondrial complex I and IV gene expressions (Nd6 and Co1, Co2, Co3 respectively) [70].
We found no studies that reported mitochondrial dynamics in PCOS exposed oocytes, but multiple studies evaluated oxidative stress. Overall ROS production was increased in three studies, one of which showed an improvement when rat-to-mouse brown adipose tissue xenotransplant was used [74]. Conversely, one study reported no differences in ROS or lipid peroxidation [69]. However, oocytes co-incubated with PCOS patient extracellular vesicles had an increase in both CAT and GSS [72]. When taken together, PCOS is associated with increased ROS and a likely responsive increase in antioxidants in exposed oocytes.
Table 3.
Effects of PCOS on mitochondrial function in oocytes.
| Mitochondrial Function | Effect of PCOS on Mitochondrial Function | Model - Species | PCOS Model/Diagnosis | Treatment timeframe | Method | Therapeutic Intervention | Reference |
|---|---|---|---|---|---|---|---|
| Biogenesis | No Reports | ||||||
| Mitochondrial Genome | Increased mtDNA copy number | Mouse | Controlled-release DHT pellet implant | 90 days (2.75μg/day) | qPCR (mtCO1:tubulin) | [20] | |
| No difference in mtDNA copy number | Mouse – offspring | DHT injection in dam post coitus, assessed post pubertal pup oocytes | GD 16.5, 17.5, 18.5 | qPCR (mtCO1:tubulin) | [5] | ||
| Ultrastructure | Disorganized cristae, vacuoles, less electron dense | Mouse – offspring | DHT injection in dam post coitus, assessed post pubertal pup oocytes | GD 16.5, 17.5, 18.5 | TEM | [5] | |
| Mitochondria with malformed cristae with concentric circles, swollen or loss of cristae | Mouse | Controlled-release DHT pellet implant | 90 days (2.75μg/day) | SEM | [20] | ||
| Mitochondria have swollen cristae, no electron dense contents and are vacuolated | Mice – offspring | DHT injection in dams post coitus, assessed post pubertal pup oocytes | GD 16.5, 17.5, 18.5 | TEM | [21] | ||
| Abnormal mitochondria distribution | Human/ Mouse | EVs isolated from PCOS patients with non-hyperandrogenic phenotype were co-cultured with control murine oocytes | Mitochondrial Red Fluorescent Probe | [22] | |||
| Metabolism | Increased glucose, pyruvate consumption | Human | Rotterdam | Ultra-microfluorometric assay | [23] | ||
| Increased ATP levels | Mice | Controlled-release DHT pellet implant | 90 days (2.75μg/day) | ATP assay | [20] | ||
| No difference in ATP levels | Mice – offspring | DHT injection in dams post coitus, assessed post pubertal pup oocytes | GD 16.5, 17.5, 18.5 | [21] | |||
| Decreased mitochondrial complex I genes (ND1,ND2,ND5) | Mice | Controlled-release DHT pellet implant | 90 days (2.75μg/day) | qPCR | [20] | ||
| Increased mitochondrial complex I and IV genes (ND1, ND6 & CO1, CO2, CO3) | Mice – offspring | DHT injection in dams post coitus, assessed post pubertal pup oocytes | GD 16.5, 17.5, 18.5 | [21] | |||
| Decreased MMP | Mice | Controlled-release DHT pellet implant | 90 days (2.75μg/day) | JC-1 staining | [20] | ||
| Rat | DHEA injection (interscapular region) | 20 days | Rat-to-mouse BAT xenotransplant increased MMP | [24] | |||
| Mice – offspring | DHT injection in dams post coitus, assessed post pubertal pup oocytes | GD 16.5, 17.5, 18.5 | [21] | ||||
| ROS & Repair | Increased ROS | Rat | DHEA injection (interscapular region) | 20 days | ROS assay using DCFH-DA | Rat-to-mouse BAT xenotransplant decreased ROS level | [24] |
| Human | EVs isolated from PCOS patients with non-hyperandrogenic phenotype were co-cultured with control murine oocytes | DCHF-DA staining | [22] | ||||
| Mice – offspring | DHT injection in dams post coitus, assessed post pubertal pup oocytes | GD 16.5, 17.5, 18.5 | CellROX staining | [21] | |||
| No differences in ROS | Mice | Controlled-release DHT pellet implant | 90 days (2.75μg/day) | [20] | |||
| No differences in lipid peroxidation | Mice | Controlled-release DHT pellet implant | 90 days (2.75μg/day) | BODIPYC11® 581/591 staining | [20] | ||
| Increased CAT | Human | EVs isolated from PCOS patients with non-hyperandrogenic phenotype were co-cultured with control murine oocytes | qPCR | [22] | |||
| Increased GSS | Human | EVs isolated from PCOS patients with non-hyperandrogenic phenotype were co-cultured with control murine oocytes | qPCR | [22] |
6. Uterus Mitochondria in PCOS
Despite advances in oocyte retrieval and assisted reproductive therapy, poor uterine receptivity and implantation rates continue to be a barrier facing patients with PCOS [75]. Studies investigating uterine mitochondria function in humans with PCOS are limited. One study found that cultured endometrium from patients with PCOS had increased mitochondria TFAM [76]. Multiple rodent studies measured the effect of PCOS on mitochondria function in the uterus. These studies are summarized in Table 4.
The current literature investigating mitochondrial biogenesis in the PCOS-exposed uterus of rodent models is limited and presents contrasting results. In non-pregnant mice treated with subcutaneous DHEA, PGC-1α was higher [77]. However, the gravid uterus from rats treated with DHT and insulin had no change in or lower Pgc1a expression [78,79]. Counter to the human study, Hu et al. found that these pregnant rats do not have higher Tfam expression and Nrf1 expression is also lower [79]. Flutamide administered alongside DHT and insulin increased the expression of Nrf1 in these rats [78].
Hu et al. also found that mtDNA copy number was lower in gravid rats treated with both DHT and insulin, but individual treatment had no effect on copy number [79]. This was the only study we found that reported mtDNA copy number in the uterus and no study reported on mutations or fragmentations.
Multiple studies used transmission electron microscopy to assess the ultrastructure of mitochondria in gravid rat uteruses exposed to DHT and insulin. All studies found ultrastructural abnormalities that included “collapsed,” “poorly formed,” or “absent” cristae and small, swollen mitochondria [78,80,81]. Treatment with flutamide reduced the number of small, swollen mitochondria but disorganized cristae were still present [78]. Treatment with n-acetyl-cysteine (NAC) did not rescue ultrastructural changes associated with PCOS, and interestingly, NAC altered mitochondria structure, even in control rats [81]. This study also measured the abundance of prohibitin I, a chaperone protein important for mitochondria integrity. They found DHT and insulin increased prohibitin I in the pregnant rat uterus that was not changed with NAC treatment [81].
Four studies examined metabolic differences in PCOS exposed uteruses. One was a human study and three used a similar DHT and insulin treated rat uterus. Despite using similar models, the rat studies demonstrated conflicting results. One study found increased complex I and complex II protein expression [78], while others found decreased complex I and III expression [79,81]. High-dose NAC normalized complex I and III levels in PCOS uteruses, but also decreased complex I and V abundance in control rats [81]. Flutamide treatment eliminated the overabundance of complex I and II in the former study [78]. The only human study reported pyruvate dehydrogenase (PDH) expression in control and PCOS uterus samples; no significant difference was found. No identified studies measured cellular bioenergetics or complex activity.
Only one study reported mitochondria dynamics in the PCOS-exposed uterus. They found that DHT + insulin-exposed pregnant rats had decreased Drp1 expression while Mfn1 and Opa1 expression was not different from controls [79]. Because fission is primarily regulated by post translational modification (phosphorylation) of DRP1, the significance of this finding in the uterus is unknown. Mitochondrial ultrastructure was not examined and mtDNA copy number was lower, but transcriptional regulators of biogenesis were also lower [79].
Like the ovary, DHEA treated mouse models of PCOS demonstrate more oxidative stress in the uterus. Specifically, they have higher levels of 4-HNE, alongside increased SOD2 which likely increases in response to higher levels of ROS [77]. In these models, L-carnitine and acetyl-L-carnitine returned 4-HNE levels to that of controls and propionyl-L-carnitine reduced the abundance of SOD2 [77]. Interestingly, contrasting results were found in pregnant rats exposed to both DHT and insulin. Their uteruses had less ROS, phosphorylated SOD1, GPX4, and glutathione [79,80]. The conflicting biogenesis and ROS outcomes in DHEA treated mouse models and DHT plus insulin treated gravid rat models may be attributed to differences among species, pregnancy, insulin treatment, the length and type of androgen exposure, and method of measuring ROS and oxidative regulators. Overall, no strong conclusion can be drawn from compiled studies of mitochondria in the PCOS-exposed uterus.
Table 4.
Effects of PCOS on mitochondrial function in the uterus.
| Mitochondrial Function | Effect of PCOS on Mitochondrial Function | Model/ Species | PCOS Model/ Diagnosis | Treatment timeframe | Method | Reference | Therapeutic Intervention | Reference |
|---|---|---|---|---|---|---|---|---|
| Biogenesis | Increased PGC-1α | Mouse | SQ DHEA | 20 days | WB | [1] | ||
| No change in PGC-1α | Rat | IP DHT+INS | GD 0.5 - GD 13.5 | qPCR | [2] | |||
| Decreased PGC-1α | Rat | IP DHT+INS | GD 7.5 - GD 13.5 | qPCR | [3] | |||
| Increased TFAM | Human | Rotterdam Criteria | WB | [4] | ||||
| No change in TFAM | Rat | IP DHT+INS | GD 7.5 - GD 13.5 or GD 14.5 | qPCR | [2,3] | |||
| Decreased NRF1 | Rat | IP DHT+INS | GD 7.5 - GD 13.5 | qPCR | [3] | |||
| Mitochondrial Genome | Decreased mtDNA copy number | Rat | IP DHT+INS | GD 7.5 - GD 13.5 | qPCR | [3] | ||
| Ultrastructure | Decreased TOMM20 | Mouse | SQ DHEA | 20 days | IHC | [1] | L-carnitine/acetyl-L-carnitine returned levels closer to control | [1] |
| Increased prohibitin I | Rat | IP DHT+INS | GD 7.5 - GD 14.5 | WB | [5] | |||
| Shrunken mitochondria | Rat | IP DHT+INS | GD 7.5 - GD 13.5 | TEM | [6] | |||
| Swollen mitochondria | Rat | IP DHT+INS | GD 7.5 - GD 13.5 or GD 14.5 | TEM | [2,5] | N-acetyl-cysteine improved but didn't fully rescue morphology but also impaired mitochondria in controls; flutamide decreased number of small swollen mitochondria but cristae remained disorganized | [2,5] | |
| Electron dense and collapsed cristae | Rat | IP DHT+INS | GD 7.5 - GD 13.5 or GD 14.5 | TEM | [2,5,6] | |||
| Metabolism | No difference in VDAC | Rat | IP DHT+INS | GD 7.5 - GD 14.5 | WB | [5] | N-acetyl-cysteine didn't change VDAC but did decrease it in controls | [5] |
| Decreased Complex I | Rat | IP DHT+INS | GD 7.5 - GD 14.5 | WB | [5] | N-acetyl-cysteine normalized | [5] | |
| Increased Complex I | Rat | IP DHT+INS | GD 0.5 - GD 13.5 | WB | [2] | Flutamide normalized | [2] | |
| Increased Complex II | Rat | IP DHT+INS | GD 0.5 - GD 13.5 | WB | [2] | Flutamide normalized | [2] | |
| Decreased Complex III | Rat | IP DHT+INS | GD 7.5 - GD 13.5 | WB | [3,5] | N-acetyl-cysteine normalized | [5] | |
| No difference in PDH | Human | Rotterdam Criteria | WB | [4] | ||||
| Dynamics | Decreased DRP1 (Fission) | Rat | IP DHT+INS | GD 7.5 - GD 13.5 | qPCR | [3] | ||
| No change in MFN1 (Fusion) | Rat | IP DHT+INS | GD 7.5 - GD 13.5 | qPCR | [3] | |||
| No change in OPA1 (Fusion) | Rat | IP DHT+INS | GD 7.5 - GD 13.5 | qPCR | [3] | |||
| ROS and Repair | Increased 4-HNE adducts | Mouse | SQ DHEA | 20 days | IHC | [1] | L-carnitine/acetyl-L-carnitine returned levels closer to control | [1] |
| Reduced ROS levels | Rat | IP DHT+INS | GD 7.5 - GD 13.5 | OxiSelect In Vitro ROS/RNS assay | [3] | |||
| Reduced GPX4 | Rat | IP DHT+INS | GD 7.5 - GD 13.5 | WB, IHC | [6] | |||
| Reduced glutathione | Rat | IP DHT+INS | GD 7.5 - GD 13.5 | Glutathione/ glutathione + glutathione disulfide assay | [6] | |||
| Reduced phosphorylated SOD1 | Rat | IP DHT+INS | GD 7.5 - GD 13.5 | WB | [3] | |||
| Increased SOD2 | Mouse | SQ DHEA | 20 days | WB | [1] | Propionyl-L-carnitine altered levels | [1] |
(Table 4 footnote)PGC1: Peroxisome proliferator-activated receptor gamma coactivator 1-alpha, TFAM: mitochondrial transcription factor A, NRF1: nuclear respiratory factor 1, TOMM20: translocase of the outer membrane, VDAC: voltage-dependent anion channel, PDH: pyruvate dehydrogenase, DRP1: dynamin-related protein 1, MFN1: mitofusion 1, OPA1: optic atrophy 1 mitochondrial dynamin-like GTPase, 4-HNE: 4-hydroxynonenal, GPX4: glutathione peroxidase 4, SOD: superoxide dismutase, SQ: subcutaneous, IP: intraperitoneal, DHEA: dehydroepiandosterone, DHT: dihydrotestosterone, INS: insulin, GD: gestational day, WB: western blot, IHC: immunohistochemistry, TEM: transmission electron microscopy.
7. Placenta Mitochondria in PCOS
It is important to consider the influence of PCOS on the placenta as it relates to pregnancy and fetal health. The placenta’s role in the growth and development of the fetus and its programming of health and disease risk cannot be underestimated [82]. Mitochondria are crucial for nutrient uptake and transport across the placenta and to the fetus. Many PCOS studies focus on hormonal and inflammatory imbalances in the placenta [83,84,85,86,87,88], however few studies, especially of humans, focus on mitochondria. This may be due to limited research of PCOS in pregnancy. Nonetheless, we summarize the role of placental mitochondria in influencing outcomes of PCOS pregnancies in Table 5.
Only one study measured markers of mitochondrial biogenesis. They found placental Pgc1a, Tfam, and Nrf1 mRNA expression was lower in pregnant rats exposed to DHT and insulin. This was associated with lower mtDNA copy number, a result that did not occur when rats were exposed to only DHT or only insulin [80].
Studies investigating mitochondrial ultrastructure showed DHT and insulin impact mitochondria in the trophoblasts of the junctional zone, but not the labyrinth zone [80,81]. Ultrastructural changes reported include blebbing and a loss of tubular cristae [80,81,89]. Disrupted membranes [81], decreased mitochondria count [80], and increased space between cristae with decreased electron dense material [80] were also reported. Contrary to its effects in the uterus, high dose NAC abolished ultrastructural changes in the junctional trophoblasts. However, NAC had no impact on mitochondria in the labyrinth [81].
Only one study measured metabolic function in PCOS placentas. Pregnant rats exposed to DHT and insulin had lower levels of VDAC [81], but there was no difference in complex III expression by western blot. Treatment with high-dose NAC improved VDAC levels in affected rats [81].
Only one PCOS placental study measured markers of fusion and fission. DHT and insulin treated pregnant rats had lower Mfn1 and fission-associated Drp1 measured by qPCR [80].
Two studies using DHT and insulin-exposed gravid rat models measured ROS and antioxidant systems. Similar to the ovary and uterus, PCOS increased ROS and lipid peroxidation [80]. There was also increased cytosolic NRF2 and IHC localized NRF2 to the basal zone [80]. Looking at SOD family expression and activity, they found that there was less phosphorylated SOD1 and a lower p-SOD1:SOD1 ratio while there was no change in SOD2 [80]. GPX4 expression was also lower in the junctional and labyrinth zones, however no differences were reported in whole tissue GPX4 or glutathione [89].
Table 5.
Effects of PCOS on mitochondrial function in the gravid rat placenta.
| Mitochondrial Function | Effect of PCOS on Mitochondrial Function | Treatment timeframe | Method | Therapeutic Intervention | Reference |
|---|---|---|---|---|---|
| Biogenesis | Decreased PGC-1α | GD 7.5 - GD 13.5 | qPCR | [80] | |
| Decreased TFAM | GD 7.5 - GD 13.5 | qPCR | [80] | ||
| Decreased NRF1 | GD 7.5 - GD 13.5 | qPCR | [80] | ||
| Mitochondrial Genome | Decreased mtDNA copy number | GD 7.5 - GD 13.5 | qPCR | [80] | |
| Ultrastructure | Mitochondrial blebbing | GD 7.5 - GD 13.5 and GD 14.5 | TEM | [80,81,89] | |
| Lack of tubular cristae | GD 7.5 - GD 13.5 or GD 14.5 | TEM | [81,89] | ||
| Decreased intracristal dilatation | GD 7.5 - GD 13.5 | TEM | [80] | ||
| Morphology changes limited to junctional zone; little change in the labyrinth zone | GD 7.5 - GD 13.5 or GD 14.5 | TEM | High dose NAC abolished damaged morphology in junctional zone but had no effect in labyrinth zone | [81,89] | |
| Metabolism | No change in Complex III expression | GD 7.5 - GD 14.5 | WB | Low dose NAC decreased Complex I abundance | [81] |
| Decreased VDAC | GD 7.5 - GD 14.5 | WB | High dose NAC increased VDAC abundance | [80,81] | |
| Dynamics | Decreased MFN1 (Fusion) | GD 7.5 - GD 13.5 | qPCR | [80] | |
| Decreased DRP1 (Fission) | GD 7.5 - GD 13.5 | qPCR | [80] | ||
| ROS and Repair | Increased ROS | GD 7.5 - GD 13.5 | OxiSelect In Vitro, ROS/RNS assay | [80] | |
| Increased MDA | GD 7.5 - GD 13.5 | MDA ELISA | [80] | ||
| Increased cytosolic NRF2 and decreased nuclear NRF2 in basal zone | GD 7.5 - GD 13.5 | WB, IHC | [80] | ||
| Reduced phosphorylated SOD1 and p-SOD1:SOD1 ratio | GD 7.5 - GD 13.5 | WB | [80] | ||
| No difference in SOD2 abundance | GD 7.5 - GD 13.5 | WB | [80] | ||
| No difference in GPX4 abundance | GD 7.5 - GD 13.5 | WB | [89] | ||
| Less GPX4 in junctional and labyrinth zones | GD 7.5 - GD 13.5 | IHC | [89] | ||
| No GPX4 in nuclei of spongiotrophoblasts, cytotrophoblasts, and synctiotrophoblasts | GD 7.5 - GD 13.5 | IHC | [89] | ||
| No difference in glutathione | GD 7.5 - GD 13.5 | Glutathione/ glutathione + glutathione disulfide assay | [89] |
PGC1: Peroxisome proliferator-activated receptor gamma coactivator 1-alpha, TFAM: mitochondrial transcription factor A, NRF1: nuclear respiratory factor 1, VDAC: voltage-dependent anion channel, MFN1: mitofusion 1, DRP1: dynamin-related protein 1, MDA: malondialdehyde, NRF2: nuclear respiratory factor 2, SOD: superoxide dismutase, GPX4: glutathione peroxidase 4, IP: intraperitoneal, DHT: dihydrotestosterone, INS: insulin, GD: gestational day, WB: western blot, IHC: immunohistochemistry, TEM: transmission electron microscopy, NAC: n-acetyl-cysteine.
8. Peripheral Markers of Mitochondrial Dysfunction in PCOS
Many studies of PCOS utilize rodent models to investigate organ-specific impacts and mitochondrial mechanisms of the disease, however, a growing body of research has investigated markers of mitochondrial function in humans using blood and plasma. These studies are summarized in Table 6. Identifying peripheral blood markers associated with mitochondrial quality and quantity offers a translatable and clinically relevant tool to gain insights into the diagnosis, prognosis, and pathophysiology of PCOS. While more studies utilize blood and plasma to identify perturbations in the nuclear and mitochondrial genome, how they cause disease and guide potential therapy remains understudied.
To date, only one study investigated genetic variations in the drivers of mitochondrial biogenesis [90]. Reddy et al. identified a polymorphism of the Pgc-1α gene that might confer a higher risk of developing PCOS. Specifically, 118 South Indian PCOS patients had a higher frequency of an “A” allele in the rs8192678 PGC-1α Gly482Ser polymorphism, and carriers of the “AA” allele had lower mtDNA copy number [90]. This finding aligns with other studies discussed below. In contrast, a previously reported rs1937 single nucleotide polymorphisms (SNP) in the gene that encodes a missense mutation in Tfam was not found to be different in PCOS [90].
Studies reporting mtDNA copy number in peripheral blood of PCOS patients compared to controls had mixed results. Only one study reported a higher mtDNA copy number [91], while multiple studies including a robust meta-analysis reported significantly lower mtDNA copy number [49,92,93,94]. The former study used a multiplex assay that paired mtDNA copy number with the common mtDNA 4977 bp (mtDNA4977) deletion and the copy number was calculated using a minor arc segment [91]. The investigators also adjusted findings for BMI and hormone levels which negated the significance [91]. Stronger conclusions are found in a contrasting meta-analysis by Moosa, et al. which more convincingly demonstrates a lower circulating mtDNA copy number in women with PCOS (n=267 vs 262 controls) [49]. Moreover, this finding is further supported by animal and tissue studies discussed previously.
Several studies report inverse correlations between mtDNA copy number and insulin resistance, waist circumference, and triglyceride levels and a positive correlation with sex hormone-binding globulin levels [49,94]. Conversely, Yang et. al. [95] investigated associations in mtDNA copy number with anthropometric measures and 8-OHdG in PCOS patients. They did not find any correlation with mtDNA copy number and anthropometric measures at baseline but reported decreased mtDNA copy number at 6 and 12 months after metformin treatment [95]. Overall, these findings suggest mitochondrial copy number in peripheral blood is a useful tool to identify and track co-morbidities in patients with PCOS.
Peripheral blood was also used to identify SNPs within mtDNA that were associated with PCOS. One study found that PCOS was associated with a higher deletion rate of mtDNA4977, the most common deletion of the mitochondrial genome [91]. Others found PCOS was associated with up to a 3-fold increase in a 9bp deletion in the mitochondria genome [49,96,97,98,99]. Specifically, unique variants T12811C and T12338C in the Nd5 gene [97,100,101] and G8584A and C8684T in the A6 genes [97,98,100] seem to be specific to PCOS cases and do not appear in control patients. The coding regions for mitochondrial tRNAs in PCOS patients also had variants in the tRNACys and tRNALeu genes appearing more frequently than in control patients as well as unique variants in the tRNAGlu, tRNAGln, tRNALys, tRNAArg, and tRNAAsp genes that weren’t present in control patients [49,92,97,100]. Others show that mtDNA mutations, especially in the D-loop loci which regulates replication, may be pathogenic and influence co-morbidities such as BMI and insulin resistance [102]. A meta-analysis conducted by Moosa et. al. compiled polymorphisms present in noncoding D-Loop and determined that PCOS patients had lower odds than controls of having the C150T and T146C polymorphisms and about the same odds as having the A263G polymorphism [49]. In a South Indian cohort, one of these studies sequencing the D-loop of the mitochondrial genome found two SNPs significantly different in PCOS (A189G and D310) [93]. Carriers of these SNPs additionally had significantly lower mtDNA copy number [93]. The presence of multiple SNPs at various coding and non-coding regions of mtDNA in peripheral blood warrants investigation of the impacts of these mutations and downstream mechanisms in the pathophysiology of PCOS.
We found no peripheral blood studies that investigated mitochondrial ultrastructure, metabolism, or dynamics. Only one study utilized human plasma to assess systemic response to reactive oxygen species in PCOS patients. Peroxiredoxin 3 (PRX3), an antioxidant enzyme, was measured alongside glucose and insulin levels following an oral glucose tolerance test (OGTT). As expected, PCOS patients had consistently higher levels of glucose and insulin and a positive correlation was found between insulin at one hour and PRX3 at two hours in PCOS cases. This suggests insulin surges are followed by oxidative stress in PCOS patients [103].
While studies investigating peripheral blood markers of mitochondrial dysfunction in PCOS can leverage human patients, more work is necessary to understand how these correlate with the mechanisms of the disease. Nevertheless, this crucial work can help identify polymorphisms associated with PCOS that might be used as biomarkers that are accessible by minimally invasive techniques. Additionally, studies that assess mitochondrial dysfunction peripherally aid in our understanding of the systemic effects of not only PCOS, but other metabolic and endocrine disorders that impact the entire body.
Table 6.
Effects of PCOS on mitochondrial function in the peripheral blood and plasma of humans diagnosed by Rotterdam criteria.
Table 6.
Effects of PCOS on mitochondrial function in the peripheral blood and plasma of humans diagnosed by Rotterdam criteria.
| Mitochondrial Function | Effect of PCOS on Mitochondrial Function | Method | Therapeutic Intervention | Reference |
|---|---|---|---|---|
| Biogenesis | Reduced "GG"(WT) frequency of PGC-1α rs8192678 polymorphism | PCR, RFLP Analysis | [90] | |
| No difference in TFAM genotype or allele frequency | PCR, RFLP Analysis | [90] | ||
| Mitochondrial Genome | Lower mtDNA copy number | qPCR | [92,93,94] | |
| Higher mtDNA copy number | qPCR | [91] | ||
| Negative association between mtDNA copy number and fasting insulin, HOMA-IR, waist circumference, and triglycerides | Pearson correlation coefficient | [94] | ||
| Positive association between mtDNA copy number and quantitative insulin-sensitivity check index (QUICKI) and sex hormone binding globulin (SHBG) | Pearson correlation coefficient | [94] | ||
| No correlation between mtDNA copy number and anthropometric measure nor 8-OHdG | qPCR, 8OH-dG ELISA kit | Metformin decreased mtDNA copy number at 6 and 12 months of treatment | [95] | |
| Higher mtDNA4977 deletion rate | qPCR | [91] | ||
| Higher frequency of a 9bp deletion | qPCR | [49,96,97,98,99] | ||
| ND5 gene polymorphisms: T12811C, T12338C | qPCR | [97,100,101] | ||
| A6 gene polymorphisms: G8584A, C8684T | qPCR | [97,98,100] | ||
| Unique tRNA variants and higher frequency of variants for Cys and Leu tRNAs | qPCR | [92,97,100] | ||
| Greater frequency of D-loop SNPs C150T, T146C, A189G, and D310 | PCR, Mitomap and mtDB mitochondria databases | [49,93] | ||
| Carriers of AA genotype of PGC1a polymorphism rs8192678 and D-loop SNPs A189G and D310 had lower mtDNA | PCR, Mitomap and mtDB mitochondria databases | [90,93] | ||
| Ultrastructure | No Reports | |||
| Metabolism | No Reports | |||
| Dynamics | No Reports | |||
| ROS and Repair | Decreased PRX3 2-3h post-OGTT | ELISA | [103] | |
| Positive correlation between PRX3 at 2h post-OGTT and insulin at 1h post-OGTT | Spearman correlation analysis | [103] |
PGC1: Peroxisome proliferator-activated receptor gamma coactivator 1-alpha, TFAM: mitochondrial transcription factor A, HOMA-IR: Homeostatic Model Assessment for Insulin Resistance, PRX3: peroxiredoxin 3, OGTT: oral glucose tolerance test, RFLP: restriction fragment length polymorphism.
9. Conclusion
Across reproductive organs, many studies have demonstrated PCOS-induced changes in mitochondrial health. The evidence summarized suggests that PCOS alters both mitochondrial quantity and quality which is likely to contribute to both reproductive and transgenerational consequences. This in-depth review brings insight about the role of mitochondria in PCOS pathophysiology and sets a foundation of knowledge needed to develop diagnostic, intervention, and prevention strategies that will improve reproductive and metabolic health for people with PCOS and their progeny.
Author Contributions
Conceptualization, K.S., A.K., and M.B.; Methodology, K.S., A.K., and M.B.; Investigation, K.S., A.K., and M.B.; Writing – Original Draft Preparation, K.S. and A.K.; Writing – Review & Editing, , K.S., A.K., and M.B.; Visualization, K.S.; Supervision, M.B.; Project Administration, M.B.; Funding Acquisition, M.B.
Funding
This research was funded by NIH NHLBI grant number R01HL160980.
Institutional Review Board Statement
Not applicable.
Informed Consent Statement
Not applicable.
Data Availability Statement
Not applicable.
Conflicts of Interest
The authors declare no conflict of interest.
References
- Genazzani, A.D.; Genazzani, A.R. Polycystic Ovary Syndrome as Metabolic Disease: New Insights on Insulin Resistance. touchREV Endocrinol 2023, 19, 71–77. [Google Scholar] [CrossRef] [PubMed]
- Joham, A.E.; Norman, R.J.; Stener-Victorin, E.; Legro, R.S.; Franks, S.; Moran, L.J.; Boyle, J.; Teede, H.J. Polycystic ovary syndrome. The Lancet Diabetes & Endocrinology 2022, 10, 668–680. [Google Scholar] [CrossRef]
- The Lancet Regional Health –, E. Polycystic ovary syndrome: What more can be done for patients? The Lancet Regional Health - Europe 2022, 21, 100524. [CrossRef] [PubMed]
- CDC. PCOS (Polycystic Ovary Syndrome) and Diabetes. Available online: (accessed on July 12 2023).
- Deswal, R.; Narwal, V.; Dang, A.; Pundir, C.S. The Prevalence of Polycystic Ovary Syndrome: A Brief Systematic Review. J Hum Reprod Sci 2020, 13, 261–271. [Google Scholar] [CrossRef] [PubMed]
- Coutinho, E.A.; Kauffman, A.S. The Role of the Brain in the Pathogenesis and Physiology of Polycystic Ovary Syndrome (PCOS). Med Sci (Basel) 2019, 7. [Google Scholar] [CrossRef]
- Crespo, R.P.; Bachega, T.; Mendonça, B.B.; Gomes, L.G. An update of genetic basis of PCOS pathogenesis. Arch Endocrinol Metab 2018, 62, 352–361. [Google Scholar] [CrossRef]
- Ajmal, N.; Khan, S.Z.; Shaikh, R. Polycystic ovary syndrome (PCOS) and genetic predisposition: A review article. Eur J Obstet Gynecol Reprod Biol X 2019, 3, 100060. [Google Scholar] [CrossRef]
- Hoeger, K.M.; Dokras, A.; Piltonen, T. Update on PCOS: Consequences, Challenges, and Guiding Treatment. The Journal of Clinical Endocrinology & Metabolism 2020, 106, e1071–e1083. [Google Scholar] [CrossRef]
- Khan, M.J.; Ullah, A.; Basit, S. Genetic Basis of Polycystic Ovary Syndrome (PCOS): Current Perspectives. Appl Clin Genet 2019, 12, 249–260. [Google Scholar] [CrossRef]
- Teede, H.J.; Misso, M.L.; Costello, M.F.; Dokras, A.; Laven, J.; Moran, L.; Piltonen, T.; Norman, R.J. Recommendations from the international evidence-based guideline for the assessment and management of polycystic ovary syndrome. Fertil Steril 2018, 110, 364–379. [Google Scholar] [CrossRef]
- Naderpoor, N.; Shorakae, S.; de Courten, B.; Misso, M.L.; Moran, L.J.; Teede, H.J. Metformin and lifestyle modification in polycystic ovary syndrome: systematic review and meta-analysis. Human Reproduction Update 2016, 22, 408–409. [Google Scholar] [CrossRef] [PubMed]
- Wang, F.F.; Wu, Y.; Zhu, Y.H.; Ding, T.; Batterham, R.L.; Qu, F.; Hardiman, P.J. Pharmacologic therapy to induce weight loss in women who have obesity/overweight with polycystic ovary syndrome: a systematic review and network meta-analysis. Obes Rev 2018, 19, 1424–1445. [Google Scholar] [CrossRef] [PubMed]
- Wang, R.; Li, W.; Bordewijk, E.M.; Legro, R.S.; Zhang, H.; Wu, X.; Gao, J.; Morin-Papunen, L.; Homburg, R.; König, T.E.; et al. First-line ovulation induction for polycystic ovary syndrome: an individual participant data meta-analysis. Hum Reprod Update 2019, 25, 717–732. [Google Scholar] [CrossRef] [PubMed]
- Legro, R.S.; Driscoll, D.; Strauss, J.F., 3rd; Fox, J.; Dunaif, A. Evidence for a genetic basis for hyperandrogenemia in polycystic ovary syndrome. Proc Natl Acad Sci U S A 1998, 95, 14956–14960. [Google Scholar] [CrossRef]
- Stepto, N.K.; Cassar, S.; Joham, A.E.; Hutchison, S.K.; Harrison, C.L.; Goldstein, R.F.; Teede, H.J. Women with polycystic ovary syndrome have intrinsic insulin resistance on euglycaemic-hyperinsulaemic clamp. Hum Reprod 2013, 28, 777–784. [Google Scholar] [CrossRef]
- Oestreich, A.K.; Moley, K.H. Developmental and Transmittable Origins of Obesity-Associated Health Disorders. Trends in genetics 2017, 33, 399–407. [Google Scholar] [CrossRef]
- Franks, S.M.D.F.M.S.; Berga, S.L.M.D. Does PCOS have developmental origins? Fertility and sterility 2012, 97, 2–6. [Google Scholar] [CrossRef]
- Risal, S.; Pei, Y.; Lu, H.; Manti, M.; Fornes, R.; Pui, H.P.; Zhao, Z.; Massart, J.; Ohlsson, C.; Lindgren, E.; et al. Prenatal androgen exposure and transgenerational susceptibility to polycystic ovary syndrome. Nat Med 2019, 25, 1894–1904. [Google Scholar] [CrossRef]
- Insler, V.; Lunenfeld, B. Polycystic ovarian disease: a challenge and controversy. Gynecol Endocrinol 1990, 4, 51–70. [Google Scholar] [CrossRef]
- Azziz, R.; Adashi, E.Y. Stein and Leventhal: 80 years on. American Journal of Obstetrics and Gynecology 2016, 214, 247.e241–247.e211. [Google Scholar] [CrossRef]
- EvidenceHunt. Available online: https://evidencehunt.com/ (accessed on).
- International Protein Nomenclature Guidelines. Available online: https://www.ncbi.nlm.nih.gov/genome/doc/internatprot_nomenguide/ (accessed on 2004 - 2023 Jul 19).
- Song, L.; Yu, J.; Zhang, D.; Li, X.; Chen, L.; Cai, Z.; Yu, C. Androgen Excess Induced Mitochondrial Abnormality in Ovarian Granulosa Cells in a Rat Model of Polycystic Ovary Syndrome. Front Endocrinol (Lausanne) 2022, 13, 789008. [Google Scholar] [CrossRef] [PubMed]
- Popov, L.D. Mitochondrial biogenesis: An update. J Cell Mol Med 2020, 24, 4892–4899. [Google Scholar] [CrossRef] [PubMed]
- Miller, B.F.; Hamilton, K.L. A perspective on the determination of mitochondrial biogenesis. American Journal of Physiology-Endocrinology and Metabolism 2012, 302, E496–E499. [Google Scholar] [CrossRef]
- Taylor, R.W.; Turnbull, D.M. Mitochondrial DNA mutations in human disease. Nat Rev Genet 2005, 6, 389–402. [Google Scholar] [CrossRef] [PubMed]
- Weigl, S.; Paradiso, A.; Tommasi, S. Mitochondria and familial predisposition to breast cancer. Curr Genomics 2013, 14, 195–203. [Google Scholar] [CrossRef]
- Liu, Y.; Zhou, K.; Guo, S.; Wang, Y.; Ji, X.; Yuan, Q.; Su, L.; Guo, X.; Gu, X.; Xing, J. NGS-based accurate and efficient detection of circulating cell-free mitochondrial DNA in cancer patients. Molecular Therapy - Nucleic Acids 2021, 23, 657–666. [Google Scholar] [CrossRef]
- Bisserier, M.; Shanmughapriya, S.; Rai, A.K.; Gonzalez, C.; Brojakowska, A.; Garikipati, V.N.S.; Madesh, M.; Mills, P.J.; Walsh, K.; Arakelyan, A.; et al. Cell-Free Mitochondrial DNA as a Potential Biomarker for Astronauts' Health. J Am Heart Assoc 2021, 10, e022055. [Google Scholar] [CrossRef]
- Trecarichi, A.; Duggett, N.A.; Granat, L.; Lo, S.; Malik, A.N.; Zuliani-Álvarez, L.; Flatters, S.J.L. Preclinical evidence for mitochondrial DNA as a potential blood biomarker for chemotherapy-induced peripheral neuropathy. PLOS ONE 2022, 17, e0262544. [Google Scholar] [CrossRef]
- Pfanner, N.; Warscheid, B.; Wiedemann, N. Mitochondrial proteins: from biogenesis to functional networks. Nature Reviews Molecular Cell Biology 2019, 20, 267–284. [Google Scholar] [CrossRef]
- Rasmussen, N. Mitochondrial Structure and the Practice of Cell Biology in the 1950s. Journal of the History of Biology 1995, 28, 381–429. [Google Scholar] [CrossRef]
- Joshua, R.C.B. The Structure of Mitochondria. Transactions of the American Microscopical Society 1975, 94, 303–304. [Google Scholar] [CrossRef]
- Zick, M.; Rabl, R.; Reichert, A.S. Cristae formation—linking ultrastructure and function of mitochondria. Biochimica et Biophysica Acta (BBA) - Molecular Cell Research 2009, 1793, 5–19. [Google Scholar] [CrossRef] [PubMed]
- Kühlbrandt, W. Structure and function of mitochondrial membrane protein complexes. BMC Biology 2015, 13, 89. [Google Scholar] [CrossRef] [PubMed]
- Perkins, G.A.; Frey, T.G. Recent structural insight into mitochondria gained by microscopy. Micron 2000, 31, 97–111. [Google Scholar] [CrossRef] [PubMed]
- Spinazzi, M.; Casarin, A.; Pertegato, V.; Salviati, L.; Angelini, C. Assessment of mitochondrial respiratory chain enzymatic activities on tissues and cultured cells. Nature Protocols 2012, 7, 1235–1246. [Google Scholar] [CrossRef] [PubMed]
- Else, A.J.; Barnes, S.J.; Danson, M.J.; Weitzman, P.D. A new spectrophotometric assay for citrate synthase and its use to assess the inhibitory effects of palmitoyl thioesters. Biochem J 1988, 251, 803–807. [Google Scholar] [CrossRef]
- Benard, G.; Bellance, N.; James, D.; Parrone, P.; Fernandez, H.; Letellier, T.; Rossignol, R. Mitochondrial bioenergetics and structural network organization. J Cell Sci 2007, 120, 838–848. [Google Scholar] [CrossRef]
- Muller, B.; Lewis, N.; Adeniyi, T.; Leese, H.J.; Brison, D.R.; Sturmey, R.G. Application of extracellular flux analysis for determining mitochondrial function in mammalian oocytes and early embryos. Scientific Reports 2019, 9, 16778. [Google Scholar] [CrossRef]
- Shoshan-Barmatz, V.; De Pinto, V.; Zweckstetter, M.; Raviv, Z.; Keinan, N.; Arbel, N. VDAC, a multi-functional mitochondrial protein regulating cell life and death. Mol Aspects Med 2010, 31, 227–285. [Google Scholar] [CrossRef]
- Zorova, L.D.; Popkov, V.A.; Plotnikov, E.Y.; Silachev, D.N.; Pevzner, I.B.; Jankauskas, S.S.; Babenko, V.A.; Zorov, S.D.; Balakireva, A.V.; Juhaszova, M.; et al. Mitochondrial membrane potential. Analytical Biochemistry 2018, 552, 50–59. [Google Scholar] [CrossRef]
- Tilokani, L.; Nagashima, S.; Paupe, V.; Prudent, J. Mitochondrial dynamics: overview of molecular mechanisms. Essays Biochem 2018, 62, 341–360. [Google Scholar] [CrossRef] [PubMed]
- Zemirli, N.; Morel, E.; Molino, D. Mitochondrial Dynamics in Basal and Stressful Conditions. International Journal of Molecular Sciences 2018, 19, 564. [Google Scholar] [CrossRef]
- Pernas, L.; Scorrano, L. Mito-Morphosis: Mitochondrial Fusion, Fission, and Cristae Remodeling as Key Mediators of Cellular Function. Annual Review of Physiology 2016, 78, 505–531. [Google Scholar] [CrossRef] [PubMed]
- Kraus, F.; Ryan, M.T. The constriction and scission machineries involved in mitochondrial fission. Journal of Cell Science 2017, 130, 2953–2960. [Google Scholar] [CrossRef] [PubMed]
- Murphy, M.P. How mitochondria produce reactive oxygen species. Biochem J 2009, 417, 1–13. [Google Scholar] [CrossRef]
- Moosa, A.; Ghani, M.; O'Neill, H.C. Genetic associations with polycystic ovary syndrome: the role of the mitochondrial genome; a systematic review and meta-analysis. J Clin Pathol 2022, 75, 815–824. [Google Scholar] [CrossRef]
- Balaban, R.S.; Nemoto, S.; Finkel, T. Mitochondria, oxidants, and aging. Cell 2005, 120, 483–495. [Google Scholar] [CrossRef]
- Jiang, X.L.; Tai, H.; Xiao, X.S.; Zhang, S.Y.; Cui, S.C.; Qi, S.B.; Hu, D.D.; Zhang, L.N.; Kuang, J.S.; Meng, X.S.; et al. Cangfudaotan decoction inhibits mitochondria-dependent apoptosis of granulosa cells in rats with polycystic ovarian syndrome. Front Endocrinol (Lausanne) 2022, 13, 962154. [Google Scholar] [CrossRef]
- Wang, F.; Han, J.; Wang, X.; Liu, Y.; Zhang, Z. Roles of HIF-1α/BNIP3 mediated mitophagy in mitochondrial dysfunction of letrozole-induced PCOS rats. J Mol Histol 2022, 53, 833–842. [Google Scholar] [CrossRef]
- Guo, F.; Fernando, T.; Zhu, X.; Shi, Y. The overexpression of neurokinin B-neurokinin 3 receptor system exerts direct effects on the ovary under PCOS-like conditions to interfere with mitochondrial function. Am J Reprod Immunol 2023, 89, e13663. [Google Scholar] [CrossRef]
- Di Emidio, G.; Rea, F.; Placidi, M.; Rossi, G.; Cocciolone, D.; Virmani, A.; Macchiarelli, G.; Palmerini, M.G.; D'Alessandro, A.M.; Artini, P.G.; et al. Regulatory Functions of L-Carnitine, Acetyl, and Propionyl L-Carnitine in a PCOS Mouse Model: Focus on Antioxidant/Antiglycative Molecular Pathways in the Ovarian Microenvironment. Antioxidants (Basel) 2020, 9. [Google Scholar] [CrossRef] [PubMed]
- Pang, X.; Cheng, J.; Wu, T.; Sun, L. SIRT3 ameliorates polycystic ovary syndrome through FOXO1/PGC-1α signaling pathway. Endocrine 2023, 80, 201–211. [Google Scholar] [CrossRef] [PubMed]
- Rabah, H.M.; Mohamed, D.A.; Mariah, R.A.; Abd El-Khalik, S.R.; Khattab, H.A.; AbuoHashish, N.A.; Abdelsattar, A.M.; Raslan, M.A.; Farghal, E.E.; Eltokhy, A.K. Novel insights into the synergistic effects of selenium nanoparticles and metformin treatment of letrozole - induced polycystic ovarian syndrome: targeting PI3K/Akt signalling pathway, redox status and mitochondrial dysfunction in ovarian tissue. Redox Rep 2023, 28, 2160569. [Google Scholar] [CrossRef] [PubMed]
- Barsky, M.; Merkison, J.; Hosseinzadeh, P.; Yang, L.; Bruno-Gaston, J.; Dunn, J.; Gibbons, W.; Blesson, C.S. Fetal programming of polycystic ovary syndrome: Effects of androgen exposure on prenatal ovarian development. J Steroid Biochem Mol Biol 2021, 207, 105830. [Google Scholar] [CrossRef]
- Xu, Y.; Pan, C.S.; Li, Q.; Zhang, H.L.; Yan, L.; Anwaier, G.; Wang, X.Y.; Yan, L.L.; Fan, J.Y.; Li, D.; et al. The Ameliorating Effects of Bushen Huatan Granules and Kunling Wan on Polycystic Ovary Syndrome Induced by Dehydroepiandrosterone in Rats. Front Physiol 2021, 12, 525145. [Google Scholar] [CrossRef]
- Atef, M.M.; Abd-Ellatif, R.N.; Emam, M.N.; Abo El Gheit, R.E.; Amer, A.I.; Hafez, Y.M. Therapeutic potential of sodium selenite in letrozole induced polycystic ovary syndrome rat model: Targeting mitochondrial approach (selenium in PCOS). Arch Biochem Biophys 2019, 671, 245–254. [Google Scholar] [CrossRef]
- Wang, Y.; Li, N.; Zeng, Z.; Tang, L.; Zhao, S.; Zhou, F.; Zhou, L.; Xia, W.; Zhu, C.; Rao, M. Humanin regulates oxidative stress in the ovaries of polycystic ovary syndrome patients via the Keap1/Nrf2 pathway. Mol Hum Reprod 2021, 27. [Google Scholar] [CrossRef]
- Luo, M.; Zheng, L.W.; Wang, Y.S.; Huang, J.C.; Yang, Z.Q.; Yue, Z.P.; Guo, B. Genistein exhibits therapeutic potential for PCOS mice via the ER-Nrf2-Foxo1-ROS pathway. Food Funct 2021, 12, 8800–8811. [Google Scholar] [CrossRef]
- Safaei, Z.; Bakhshalizadeh, S.H.; Nasr Esfahani, M.H.; Akbari Sene, A.; Najafzadeh, V.; Soleimani, M.; Shirazi, R. Effect of Vitamin D3 on Mitochondrial Biogenesis in Granulosa Cells Derived from Polycystic Ovary Syndrome. Int J Fertil Steril 2020, 14, 143–149. [Google Scholar] [CrossRef]
- Wang, J.; Wu, X. The effects of mitochondrial dysfunction on energy metabolism switch by HIF-1α signalling in granulosa cells of polycystic ovary syndrome. Endokrynol Pol 2020, 71, 134–145. [Google Scholar] [CrossRef]
- Zheng, B.; Meng, J.; Zhu, Y.; Ding, M.; Zhang, Y.; Zhou, J. Melatonin enhances SIRT1 to ameliorate mitochondrial membrane damage by activating PDK1/Akt in granulosa cells of PCOS. J Ovarian Res 2021, 14, 152. [Google Scholar] [CrossRef] [PubMed]
- Salehi, R.; Mazier, H.L.; Nivet, A.L.; Reunov, A.A.; Lima, P.; Wang, Q.; Fiocco, A.; Isidoro, C.; Tsang, B.K. Ovarian mitochondrial dynamics and cell fate regulation in an androgen-induced rat model of polycystic ovarian syndrome. Sci Rep 2020, 10, 1021. [Google Scholar] [CrossRef] [PubMed]
- Sreerangaraja Urs, D.B.; Wu, W.H.; Komrskova, K.; Postlerova, P.; Lin, Y.F.; Tzeng, C.R.; Kao, S.H. Mitochondrial Function in Modulating Human Granulosa Cell Steroidogenesis and Female Fertility. Int J Mol Sci 2020, 21. [Google Scholar] [CrossRef] [PubMed]
- Mazloomi, S.; Sanoeei Farimani, M.; Tayebinia, H.; Karimi, J.; Amiri, I.; Abbasi, E.; Khodadadi, I. The Association of Mitochondrial Translocator Protein and Voltage-Dependent Anion Channel-1 in Granulosa Cells with Estradiol Levels and Presence of Immature Follicles in Polycystic Ovary Syndrome. J Reprod Infertil 2022, 23, 148–159. [Google Scholar] [CrossRef]
- Cozzolino, M.; Herraiz, S.; Cakiroglu, Y.; Garcia-Velasco, J.A.; Tiras, B.; Pacheco, A.; Rabadan, S.; Kohls, G.; Barrio, A.I.; Pellicer, A.; et al. Distress response in granulosa cells of women affected by PCOS with or without insulin resistance. Endocrine 2023, 79, 200–207. [Google Scholar] [CrossRef]
- Chappell, N.R.; Zhou, B.; Hosseinzadeh, P.; Schutt, A.; Gibbons, W.E.; Blesson, C.S. Hyperandrogenemia alters mitochondrial structure and function in the oocytes of obese mouse with polycystic ovary syndrome. F S Sci 2021, 2, 101–112. [Google Scholar] [CrossRef]
- Chappell, N.R.; Zhou, B.; Schutt, A.K.; Gibbons, W.E.; Blesson, C.S. Prenatal androgen induced lean PCOS impairs mitochondria and mRNA profiles in oocytes. Endocr Connect 2020, 9, 261–270. [Google Scholar] [CrossRef]
- Babayev, E.; Seli, E. Oocyte mitochondrial function and reproduction. Curr Opin Obstet Gynecol 2015, 27, 175–181. [Google Scholar] [CrossRef]
- Liu, C.; Wang, M.; Yao, H.; Cui, M.; Gong, X.; Wang, L.; Sui, C.; Zhang, H. Inhibition of Oocyte Maturation by Follicular Extracellular Vesicles of Nonhyperandrogenic PCOS Patients Requiring IVF. J Clin Endocrinol Metab 2023, 108, 1394–1404. [Google Scholar] [CrossRef]
- Harris, S.E.; Maruthini, D.; Tang, T.; Balen, A.H.; Picton, H.M. Metabolism and karyotype analysis of oocytes from patients with polycystic ovary syndrome. Hum Reprod 2010, 25, 2305–2315. [Google Scholar] [CrossRef]
- Du, L.; Wang, Y.; Li, C.R.; Chen, L.J.; Cai, J.Y.; Xia, Z.R.; Zeng, W.T.; Wang, Z.B.; Chen, X.C.; Hu, F.; et al. Rat BAT xenotransplantation recovers the fertility and metabolic health of PCOS mice. J Endocrinol 2021, 248, 249–264. [Google Scholar] [CrossRef] [PubMed]
- Lopes, I.M.; Baracat, M.C.; Simões Mde, J.; Simões, R.S.; Baracat, E.C.; Soares, J.M., Jr. Endometrium in women with polycystic ovary syndrome during the window of implantation. Rev Assoc Med Bras (1992) 2011, 57, 702–709. [Google Scholar] [CrossRef] [PubMed]
- Wang, T.; Zhang, J.; Hu, M.; Zhang, Y.; Cui, P.; Li, X.; Li, J.; Vestin, E.; Brännström, M.; Shao, L.R.; et al. Differential Expression Patterns of Glycolytic Enzymes and Mitochondria-Dependent Apoptosis in PCOS Patients with Endometrial Hyperplasia, an Early Hallmark of Endometrial Cancer, In Vivo and the Impact of Metformin In Vitro. Int J Biol Sci 2019, 15, 714–725. [Google Scholar] [CrossRef] [PubMed]
- Palmerini, M.G.; Macchiarelli, G.; Cocciolone, D.; Mascitti, I.A.; Placidi, M.; Vergara, T.; Di Emidio, G.; Tatone, C. Modulating Morphological and Redox/Glycative Alterations in the PCOS Uterus: Effects of Carnitines in PCOS Mice. Biomedicines 2023, 11. [Google Scholar] [CrossRef]
- Zhang, Y.; Hu, M.; Yang, F.; Zhang, Y.; Ma, S.; Zhang, D.; Wang, X.; Sferruzzi-Perri, A.N.; Wu, X.; Brännström, M.; et al. Increased uterine androgen receptor protein abundance results in implantation and mitochondrial defects in pregnant rats with hyperandrogenism and insulin resistance. J Mol Med (Berl) 2021, 99, 1427–1446. [Google Scholar] [CrossRef] [PubMed]
- Hu, M.; Zhang, Y.; Guo, X.; Jia, W.; Liu, G.; Zhang, J.; Li, J.; Cui, P.; Sferruzzi-Perri, A.N.; Han, Y.; et al. Hyperandrogenism and insulin resistance induce gravid uterine defects in association with mitochondrial dysfunction and aberrant reactive oxygen species production. Am J Physiol Endocrinol Metab 2019, 316, E794–e809. [Google Scholar] [CrossRef]
- Zhang, Y.; Zhao, W.; Xu, H.; Hu, M.; Guo, X.; Jia, W.; Liu, G.; Li, J.; Cui, P.; Lager, S.; et al. Hyperandrogenism and insulin resistance-induced fetal loss: evidence for placental mitochondrial abnormalities and elevated reactive oxygen species production in pregnant rats that mimic the clinical features of polycystic ovary syndrome. J Physiol 2019, 597, 3927–3950. [Google Scholar] [CrossRef]
- Hu, M.; Zhang, Y.; Ma, S.; Li, J.; Wang, X.; Liang, M.; Sferruzzi-Perri, A.N.; Wu, X.; Ma, H.; Brännström, M.; et al. Suppression of uterine and placental ferroptosis by N-acetylcysteine in a rat model of polycystic ovary syndrome. Mol Hum Reprod 2021, 27. [Google Scholar] [CrossRef]
- Siemers, Kyle M.; Baack, Michelle L. The importance of placental lipid metabolism across gestation in obese and non-obese pregnancies. Clinical Science 2023, 137, 31–34. [CrossRef]
- Kirtana, A.; Seetharaman, B. Comprehending the Role of Endocrine Disruptors in Inducing Epigenetic Toxicity. Endocr Metab Immune Disord Drug Targets 2022, 22, 1059–1072. [Google Scholar] [CrossRef]
- Szczuko, M.; Kikut, J.; Komorniak, N.; Bilicki, J.; Celewicz, Z.; Ziętek, M. The Role of Arachidonic and Linoleic Acid Derivatives in Pathological Pregnancies and the Human Reproduction Process. Int J Mol Sci 2020, 21. [Google Scholar] [CrossRef] [PubMed]
- Sartori, C.; Lazzeroni, P.; Merli, S.; Patianna, V.D.; Viaroli, F.; Cirillo, F.; Amarri, S.; Street, M.E. From Placenta to Polycystic Ovarian Syndrome: The Role of Adipokines. Mediators Inflamm 2016, 2016, 4981916. [Google Scholar] [CrossRef] [PubMed]
- Sun, M.; Sun, B.; Qiao, S.; Feng, X.; Li, Y.; Zhang, S.; Lin, Y.; Hou, L. Elevated maternal androgen is associated with dysfunctional placenta and lipid disorder in newborns of mothers with polycystic ovary syndrome. Fertil Steril 2020, 113, 1275–1285.e1272. [Google Scholar] [CrossRef] [PubMed]
- Medina, G.; Maliqueo, M.; Crisosto, N.; Echiburú, B.; Sir-Petermann, T.; Lara, H.E. Metformin increases norepinephrine transporter expression in placenta of patients with polycystic ovary syndrome. Eur Rev Med Pharmacol Sci 2017, 21, 3482–3489. [Google Scholar]
- Kelley, A.S.; Smith, Y.R.; Padmanabhan, V. A Narrative Review of Placental Contribution to Adverse Pregnancy Outcomes in Women With Polycystic Ovary Syndrome. J Clin Endocrinol Metab 2019, 104, 5299–5315. [Google Scholar] [CrossRef]
- Zhang, Y.; Hu, M.; Jia, W.; Liu, G.; Zhang, J.; Wang, B.; Li, J.; Cui, P.; Li, X.; Lager, S.; et al. Hyperandrogenism and insulin resistance modulate gravid uterine and placental ferroptosis in PCOS-like rats. J Endocrinol 2020, 246, 247–263. [Google Scholar] [CrossRef]
- Reddy, T.V.; Govatati, S.; Deenadayal, M.; Shivaji, S.; Bhanoori, M. Polymorphisms in the TFAM and PGC1-α genes and their association with polycystic ovary syndrome among South Indian women. Gene 2018, 641, 129–136. [Google Scholar] [CrossRef]
- Ye, M.; Hu, B.; Shi, W.; Guo, F.; Xu, C.; Li, S. Mitochondrial DNA 4977 bp Deletion in Peripheral Blood Is Associated With Polycystic Ovary Syndrome. Front Endocrinol (Lausanne) 2021, 12, 675581. [Google Scholar] [CrossRef]
- Saeed, N.; Hamzah, I.H.; Al-Gharrawi, S.A.R. Polycystic ovary syndrome dependency on mtDNA mutation; copy Number and its association with insulin resistance. BMC Res Notes 2019, 12, 455. [Google Scholar] [CrossRef]
- Reddy, T.V.; Govatati, S.; Deenadayal, M.; Sisinthy, S.; Bhanoori, M. Impact of mitochondrial DNA copy number and displacement loop alterations on polycystic ovary syndrome risk in south Indian women. Mitochondrion 2019, 44, 35–40. [Google Scholar] [CrossRef]
- Lee, S.H.; Chung, D.J.; Lee, H.S.; Kim, T.J.; Kim, M.H.; Jeong, H.J.; Im, J.A.; Lee, D.C.; Lee, J.W. Mitochondrial DNA copy number in peripheral blood in polycystic ovary syndrome. Metabolism 2011, 60, 1677–1682. [Google Scholar] [CrossRef]
- Yang, P.K.; Chou, C.H.; Chang, C.H.; Chen, S.U.; Ho, H.N.; Chen, M.J. Changes in peripheral mitochondrial DNA copy number in metformin-treated women with polycystic ovary syndrome: a longitudinal study. Reprod Biol Endocrinol 2020, 18, 69. [Google Scholar] [CrossRef] [PubMed]
- Hu, Z.-p.; Wang, Y.; Mao, W.-w.; Zhang, X.-w.; Qiao, J.; Zhang, Q.-f. Single Nucleotide Polymorphisms (SNPs) and Variable Number Tandem Repeats (VNTRs) in mtDNA D-loop and CO II- tRNALys Intergenic Region with PCOS. Journal of reproduction and contraception 2011, 22, 129–138. [Google Scholar] [CrossRef]
- Zhuo, G.; Ding, Y.; Feng, G.; Yu, L.; Jiang, Y. Analysis of mitochondrial DNA sequence variants in patients with polycystic ovary syndrome. Archives of gynecology and obstetrics 2012, 286, 653–659. [Google Scholar] [CrossRef] [PubMed]
- Zhuo, G.; Feng, G.; Leng, J.; Yu, L.; Jiang, Y. 9-bp Deletion Homoplasmy in Women with Polycystic Ovary Syndrome Revealed by Mitochondrial Genome-Mutation Screen. Biochemical genetics 2010, 48, 157–163. [Google Scholar] [CrossRef]
- Ding, Y.; Xia, B.-H.; Zhang, C.-J.; Zhuo, G.-C. Mitochondrial tRNALeu(UUR) C3275T, tRNAGln T4363C and tRNALys A8343G mutations may be associated with PCOS and metabolic syndrome. Gene 2018, 642, 299–306. [Google Scholar] [CrossRef] [PubMed]
- Ding, Y.; Xia, B.-H.; Zhang, C.-J.; Zhuo, G.-C. Mutations in mitochondrial tRNA genes may be related to insulin resistance in women with polycystic ovary syndrome. American journal of translational research 2017, 9, 2984–2996. [Google Scholar]
- Ding, Y.U.; Zhuo, G.; Zhang, C.; Leng, J. Point mutation in mitochondrial tRNA gene is associated with polycystic ovary syndrome and insulin resistance. Molecular medicine reports 2016, 13, 3169–3172. [Google Scholar] [CrossRef]
- He, S.; Ji, D.; Liu, Y.; Deng, X.; Zou, W.; Liang, D.; Du, Y.; Zong, K.; Jiang, T.; Li, M.; et al. Polymorphisms of mtDNA in the D-loop region moderate the associations of BMI with HOMA-IR and HOMA-β among women with polycystic ovary syndrome: a cross-sectional study. J Assist Reprod Genet 2023. [Google Scholar] [CrossRef]
- Liu, H.L.; Li, T.T.; Yu, A.Q.; Li, J.; Li, X.; Li, L.; Kaifu, T. Plasma level of peroxiredoxin 3 in patients with polycystic ovarian syndrome. BMC Endocr Disord 2019, 19, 32. [Google Scholar] [CrossRef]
Figure 1.
Key elements that regulate mitochondria number and function to influence cell processes and fate. Created with BioRender.com.
Figure 1.
Key elements that regulate mitochondria number and function to influence cell processes and fate. Created with BioRender.com.
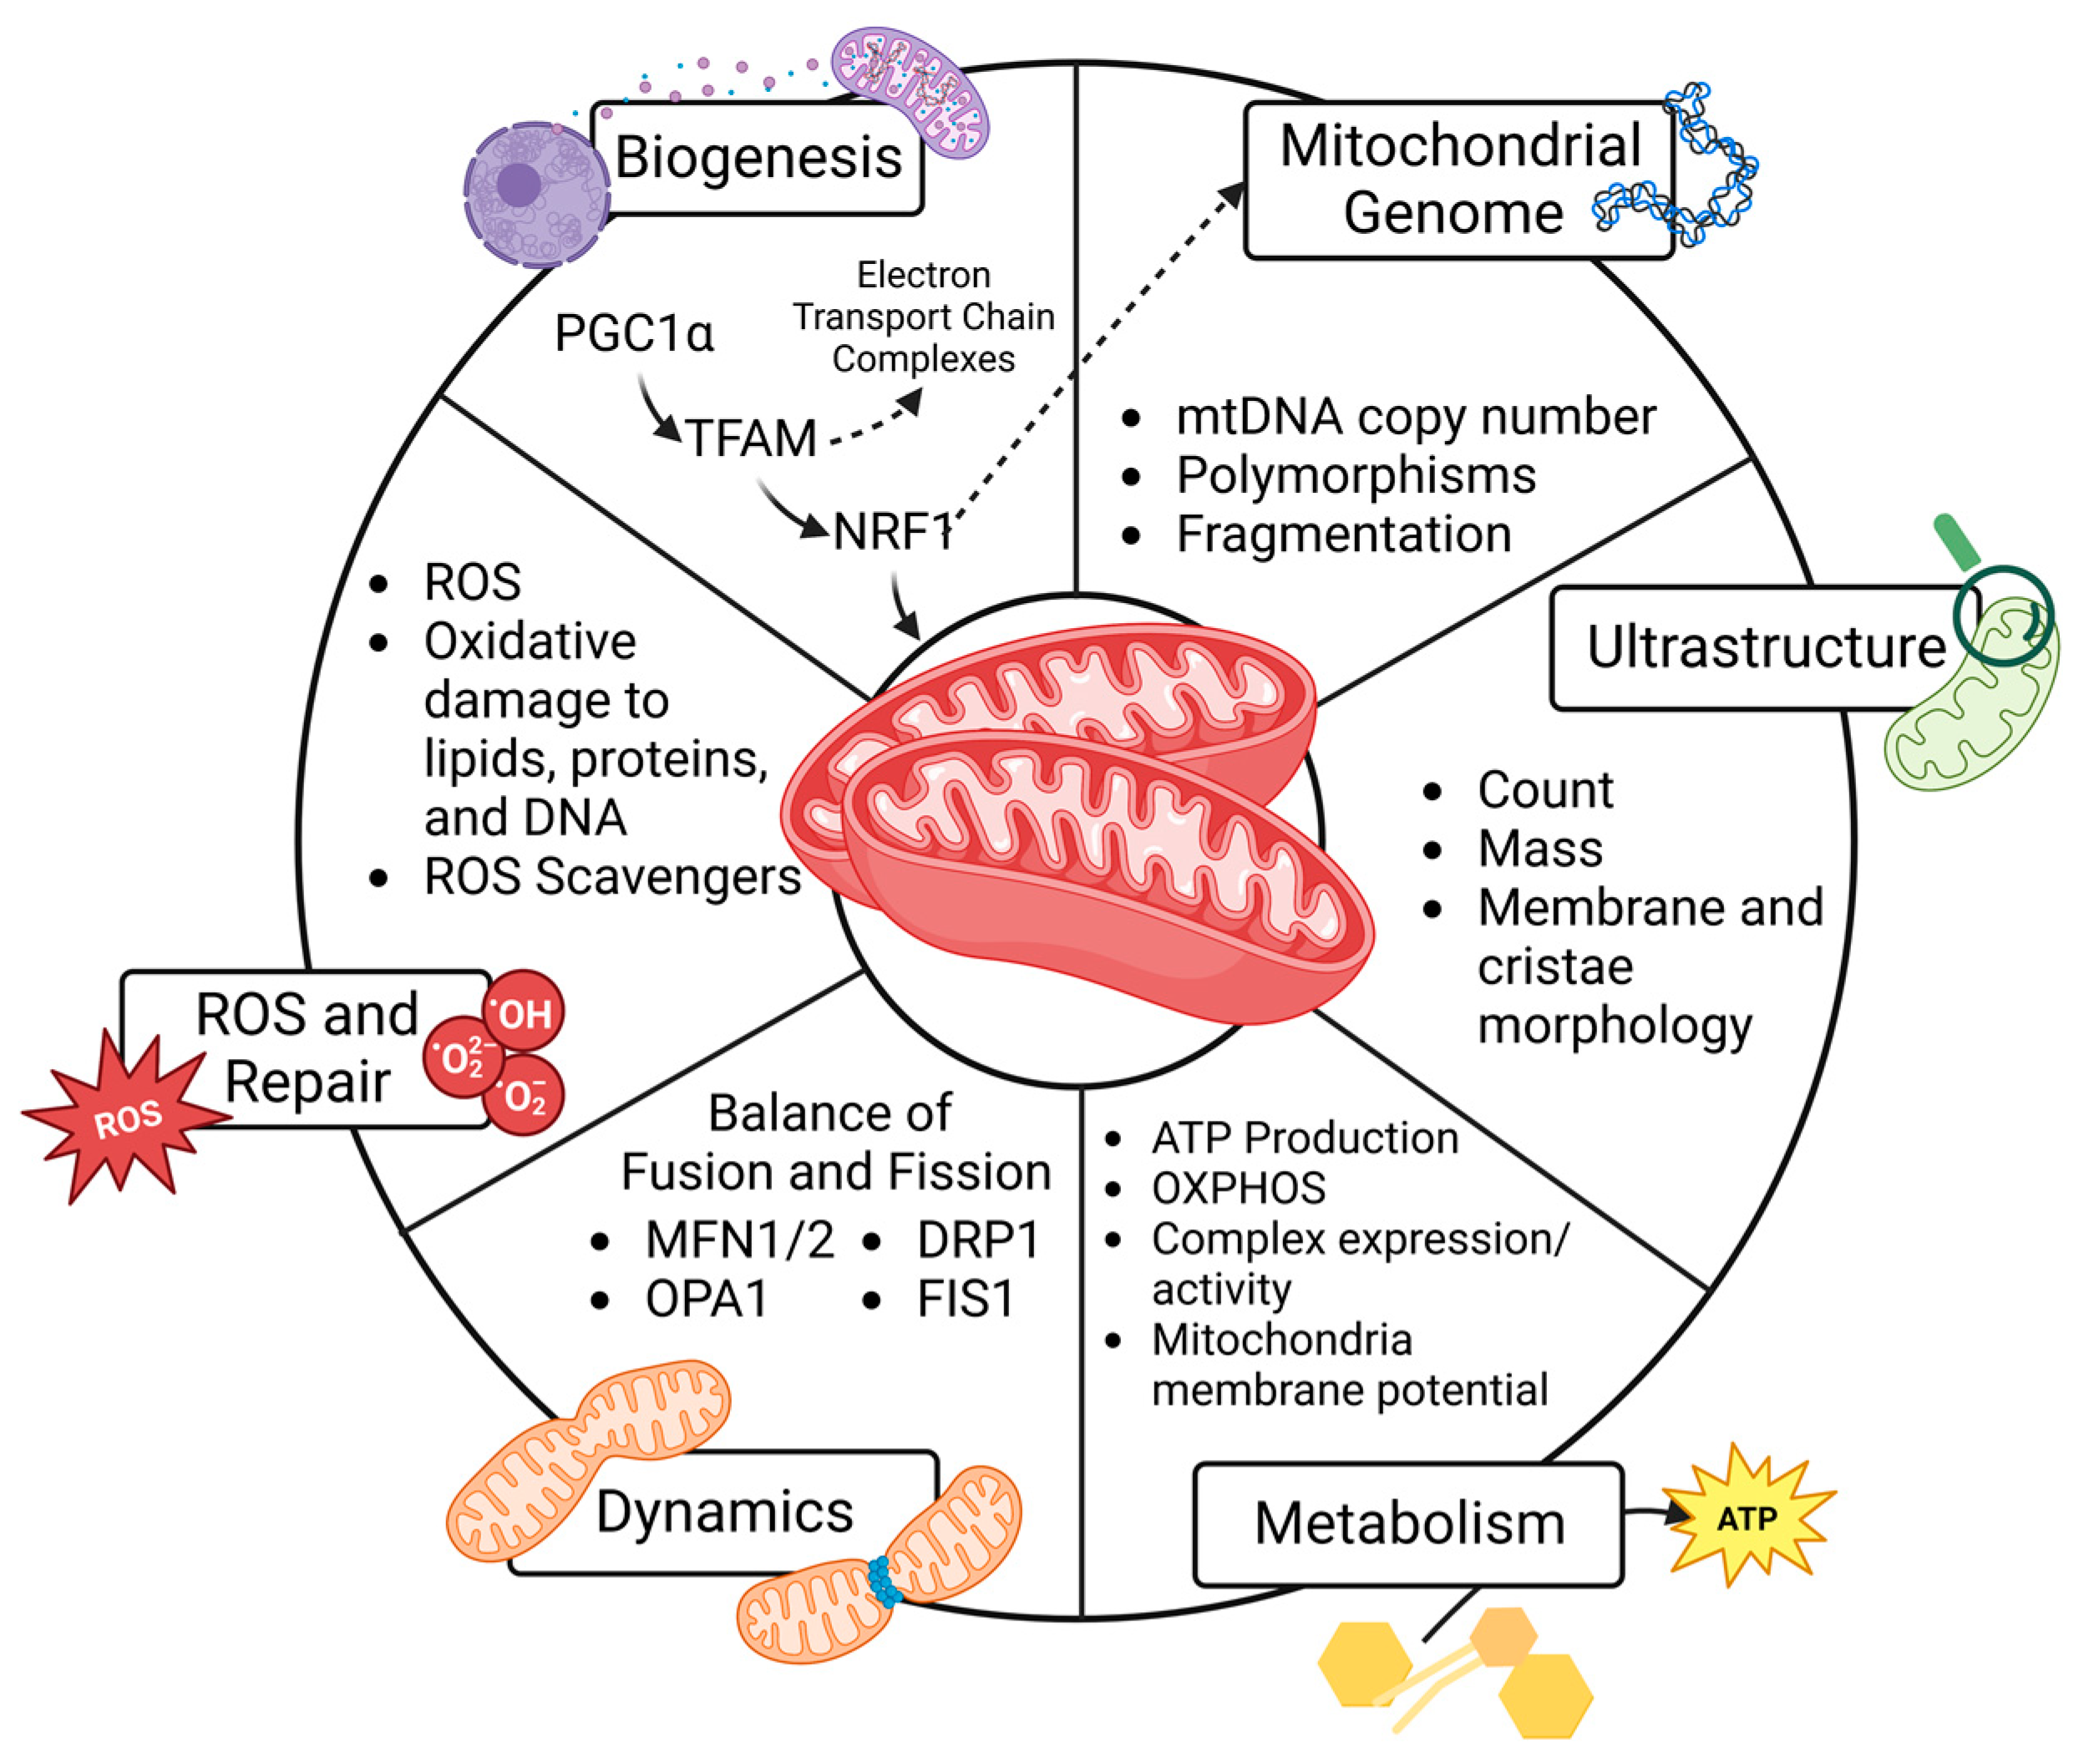
Figure 2.
Summary of reported alterations in mitochondrial biogenesis, genome, ultrastructure, metabolism, dynamics, and ROS in the ovary, oocyte, granulosa cells, uterus, placenta, and peripheral blood and plasma of PCOS. Offspring exposure studies were excluded. Created with BioRender.com.
Figure 2.
Summary of reported alterations in mitochondrial biogenesis, genome, ultrastructure, metabolism, dynamics, and ROS in the ovary, oocyte, granulosa cells, uterus, placenta, and peripheral blood and plasma of PCOS. Offspring exposure studies were excluded. Created with BioRender.com.
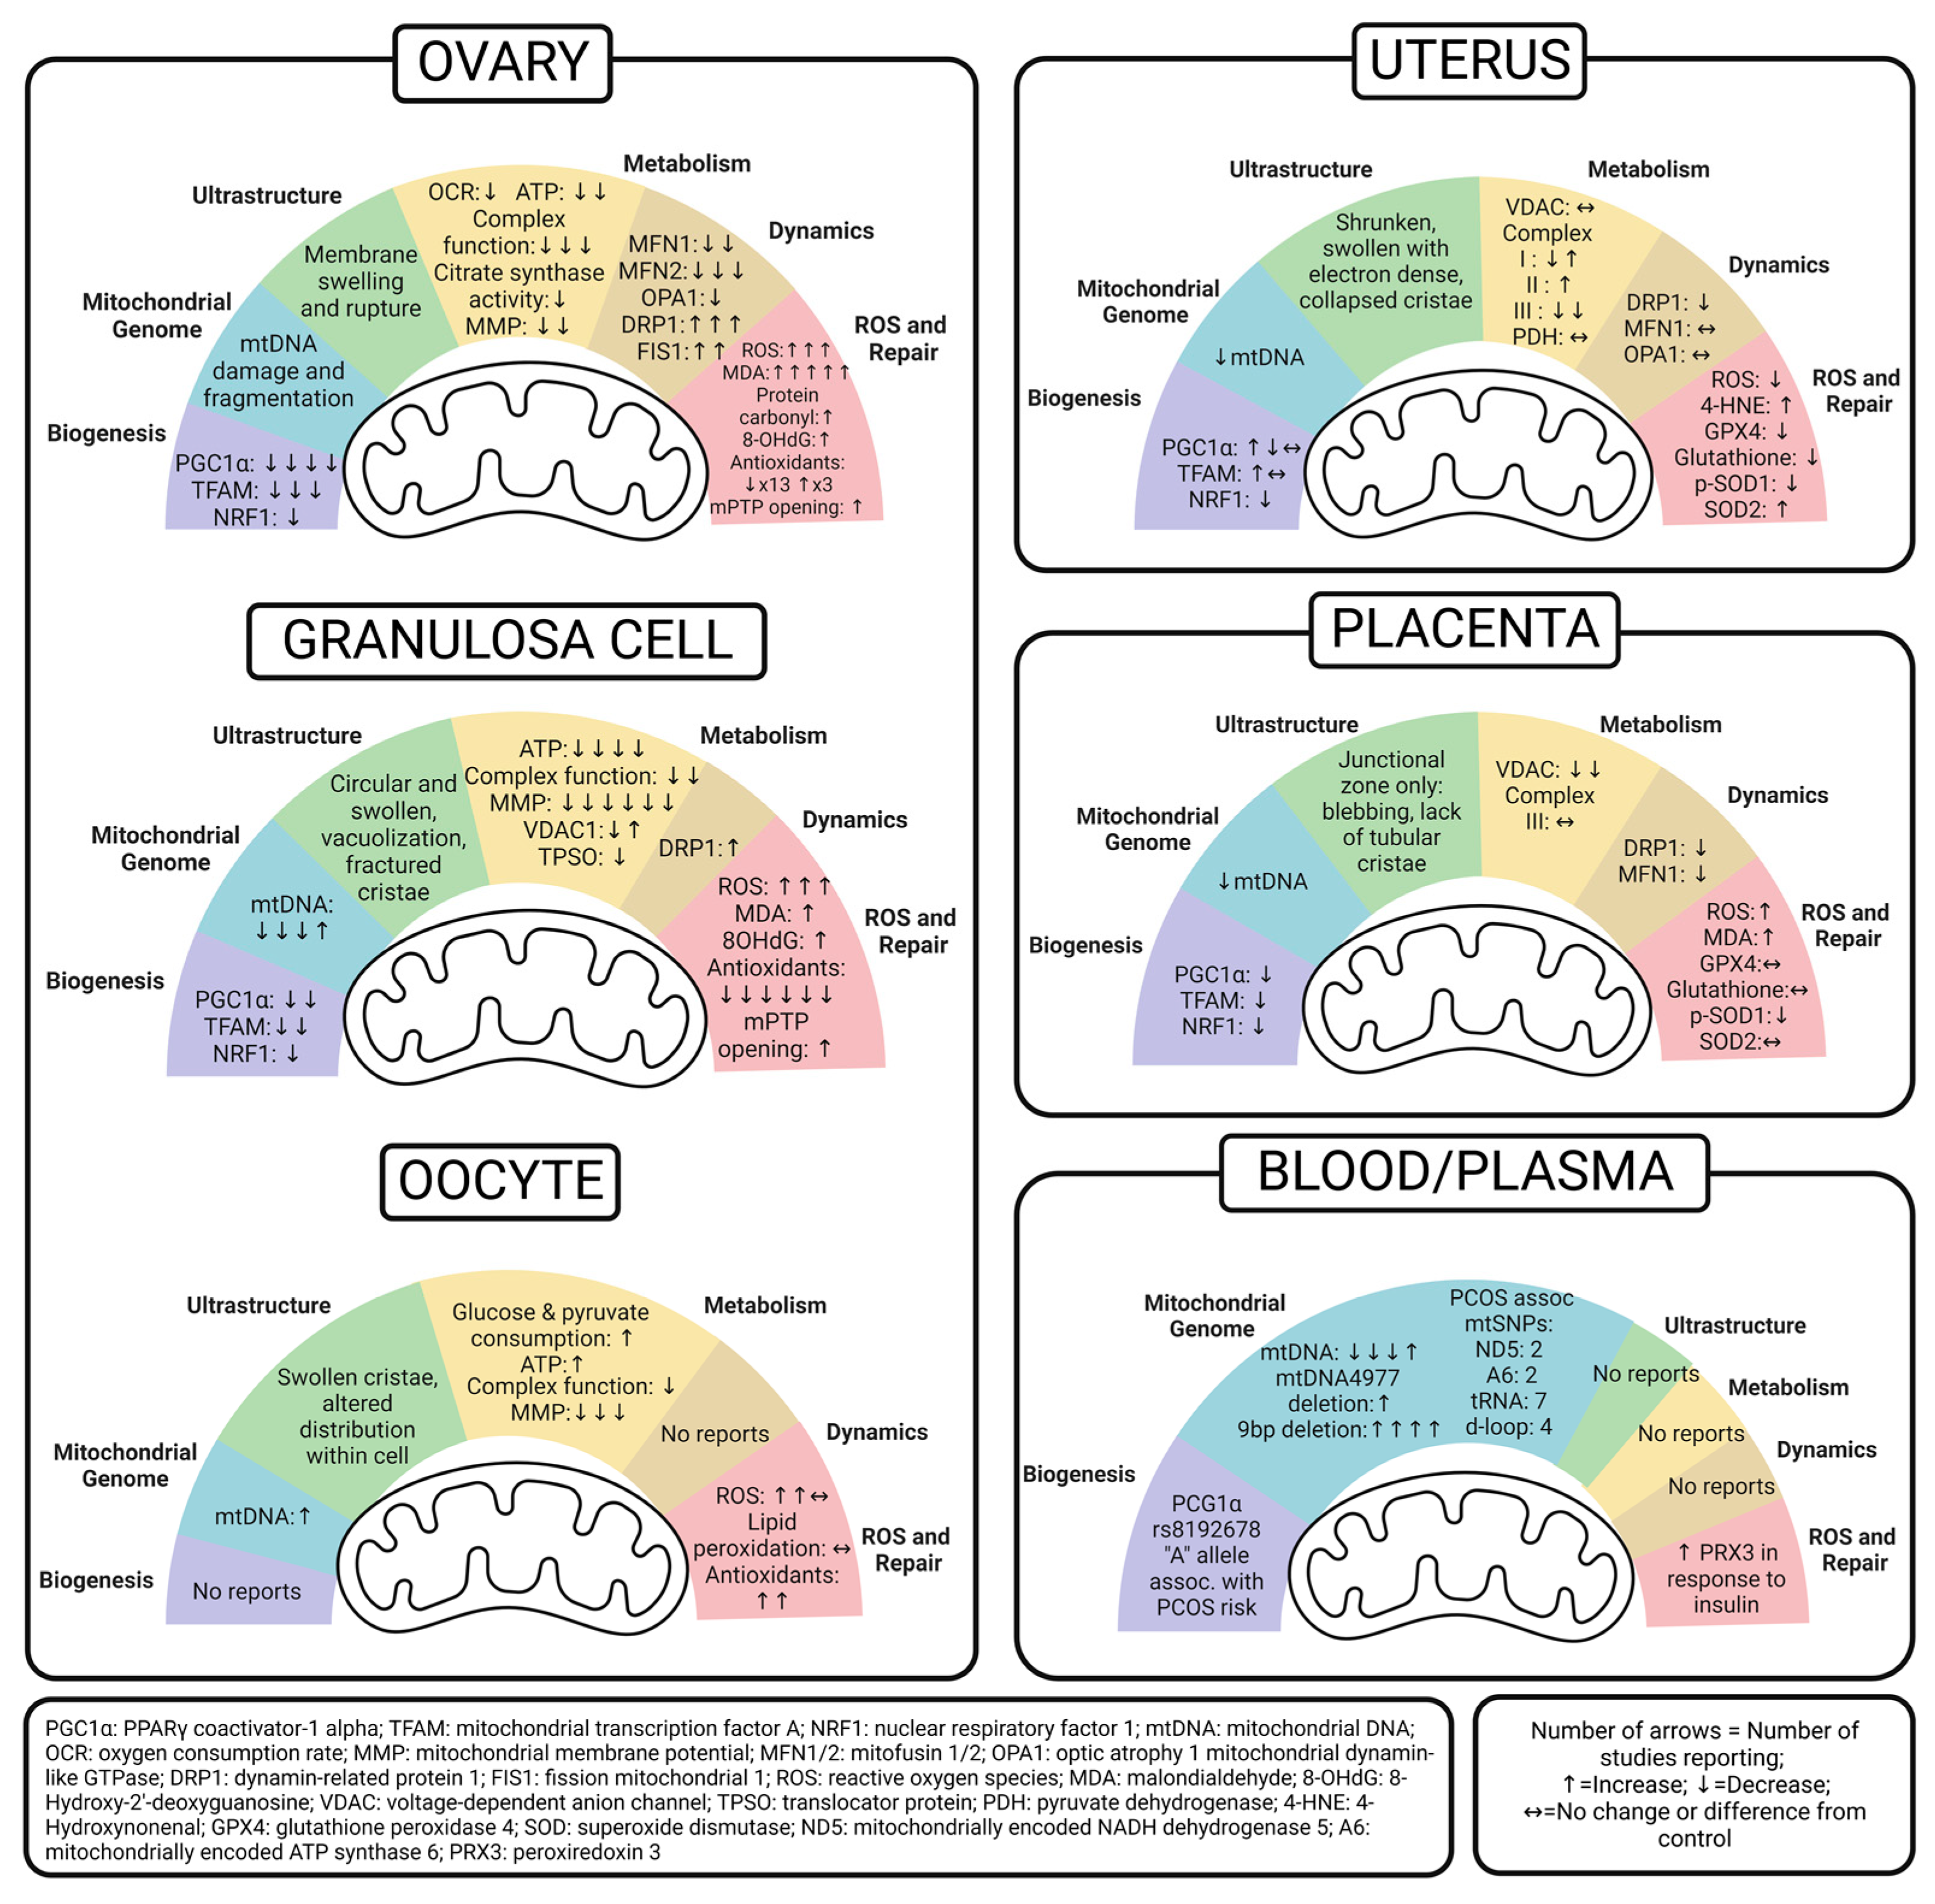
Disclaimer/Publisher’s Note: The statements, opinions and data contained in all publications are solely those of the individual author(s) and contributor(s) and not of MDPI and/or the editor(s). MDPI and/or the editor(s) disclaim responsibility for any injury to people or property resulting from any ideas, methods, instructions or products referred to in the content. |
© 2023 by the authors. Licensee MDPI, Basel, Switzerland. This article is an open access article distributed under the terms and conditions of the Creative Commons Attribution (CC BY) license (http://creativecommons.org/licenses/by/4.0/).
Copyright: This open access article is published under a Creative Commons CC BY 4.0 license, which permit the free download, distribution, and reuse, provided that the author and preprint are cited in any reuse.


