
Submitted:
25 July 2023
Posted:
27 July 2023
You are already at the latest version
Abstract
This study, which was supported by a quantitative research paradigm with two experiment and two control groups of 4x4 quasi-experimental design, aimed to find out the impact of a sustainable progressive STEAM (SP-STEAM Model) application model on 5th grade primary school students critical thinking dispositions and mathematic achievements in Northern Cyprus. The treatment model was applied to experimental groups for 14 weeks of time. Split-plot multiple group analysis of variance (Split-plot ANOVA) statistical technique was used to calculate between and within group significances regarding exogenous variable. SPSS24 software package was used for the analysis. Pre-test and post-test results derived from experiment and control groups revealed significant effect of SP-STEAM Model on 5th grade primary school students’ critical thinking dispositions as measured with CCTDI and mathematic achievements as measured with a dedicated ex-am. The results were discussed in detail under the light of related literature and suggestions for further studies were proposed.
Keywords:
Sustainable progressive STEAM model
; critical thinking disposition
; thinking culture
; academic achievement
; effective sustainable primary school education.
1. Introduction
Over the last years, the demand for improving critical thinking dispositions (CTDs) of primary school students led educators, researchers, and program developers consider issues related to developing and adapting effective intervention strategies high on their agenda [1,14,20,24]. The basic premise behind this movement is related to the notion that the earlier students were encountered with opportunities to gain critical thinking dispositions the more effective and successful will they be in critical thinking and academic achievement in their future careers [1,8]. For this reason, studies have accumulated to propose different strategies to nurture or enhance CTDs of students at different levels of education. The most intriguing strategy to foster CTDs of primary school students was proposed to be the application of STEAM (Science, Technology, Engineering, Mathematics) oriented educational programs [12,13,21]. STEAM oriented educational programs are considered as inevitable parts for helping primary school students gain CTDs [32].
STEAM, by many researchers, is defined to be an educational approach that aims to provide students with interdisciplinary cooperation, openness to communication, having ethical values, research, production, and problem-solving skills using their creativity by focusing on the engineering design of knowledge and skills in the fields of science-technology-engineering and mathematics [1,2,3,4,6,7,12,19,22,26,29,30,31,32]. There are many different studies that revealed the strong bound between STEAM education and critical thinking, yet most of them are theoretical supports that need to be empirically tested [18,29]. Lately, some studies conducted on the phenomenon of critical thinking and STEAM education tented to show some empirical support for the strong tie between the application of STEAM education and improvement in CTDs [4,14,15,17]. These studies, however, carried out correlational effects, which are valuable in supporting the proposed theory, yet insufficient in supporting the true causal differences that STEAM education programs possibly made on students’ CTDs and their academic achievements. With respect to the specified lack of the related literature on the possible casual comparative effects of STEAM applications on primary school students’ CTDs and academic achievements, the current research aimed to test the impacts of a sustainable progressive STEAM model on primary school students’ CTDs and their academic achievements regarding mathematic.
2. Statement of the Problem and Aim of the Study
North Cyprus (NC) is one of those countries that is pregnant for an upcoming drastically missing change in its educational sySTEAM. Although it is known that STEAM education has some rigid principles in application, it also does have some flexible sides to be embedded to an existing educational sySTEAM [13]. Besides the need for STEAM education, researchers question the way it is administered and practiced [13,29]. This is crucial because every society has its own dynamics, mimics, and cultural realms. For the time being, the optimum way of practice of STEAM education in the current educational sySTEAM of NC and its effects on academic achievement and thinking quality of individuals are unknown. The extraneous factors that might possibly affect the process of administration of this approach are unknown and, there is no experimental results supporting the success of such an administration. This is quite important because not every practice gives the same results and not every culture holds and responds to a new design the same way. For that very reason, it has long been an urgent need to design a STEAM education approach to be embedded in the educational context of the NC and to elicit empirical evidence regarding its effects on the targeted audiences’ academic achievements and thinking qualities. The vision of NC Education for 2030 strategic aims, which were determined by the Ministry of National Education, underline the importance of appropriate application models of STEAM education [33].
If a country wants to have a say in scientific, economic, or technological fields, STEAM education must be considered in their education sySTEAMs [30]. However, when a deep research was carried out, it is seen that studies on STEAM applications for primary school students are quite limited in NC. Therefore, STEAM application in the classroom at the primary school level were deemed necessary. One of the results of Vision 2030 Education Strategic Plan Workshop Report, as announced by the Ministry of National Education of North Cyprus, was about the call for researches to study for various adaptable applications of STEAM education models.
Based on a developed framework and as a part of a larger study, the current research, which is supported by a quantitative empirical paradigm and aims to figure out possible effects of a sustainable progressive STEAM education model on groups of 5th grade primary school students’ CTDs and their academic achievements in the NC, asks the following research questions:
Research Question 1: Will groups of 5th grade primary school students who are instructed by a sustainable progressive STEAM education model show statistically significant differences in comparison to similar groups of 5th grade primary school students who are instructed with a traditional education model in terms of their critical thinking dispositions?
Research Question 2: Will groups of 5th grade primary school students who are instructed by a sustainable progressive STEAM education model show statistically significant difference in comparison to similar groups of 5th grade primary school students who are instructed with a traditional education model in terms of their mathematic achievements?
3. Sustainable Progressive STEAM Model
When the Ministry of Education of North Cyprus clearly explained the long term objectives of national-education, a special quotation opened for sustainability of problem solving skills for children. For this reason, SP-STEAM Model was developed especially for primary school students to help and guide them nurture their critical thinking dispositions and develop their academic achievements in mathematic.
Starting with the term sustainability, we not only expect our children develop positive attitudes toward critical thinking and elicit high academic grades but also want them maintain these skills throughout their academic careers and succeed in life in the long term. The term sustainability in our research is two level. Sustainability is thought at macro and micro levels. At micro level, it refers to the sustainability of sySTEAMic approach at schooling level whereas at macro level it refers to successes of individuals graduated from an educational sySTEAM. For the later, it is too early to make inferences but for the former, this research will create a basis for further negotiations.
Sustainability of any gained positive experience is understood to be crucial for further educational and professional careers of children and youth [3,15]. That is to say, a treatment model, which is not sustainable, will fail in following stages of life, which in turn, children will fail to think critically and to solve problems. The core element for sustainability of any given positive experience is characterized by a paradigm shift in the way children think [17,32]. This is also known as habit of mind. If a certain way of thinking has become a habit of mind then it becomes an inevitable part of a person’s thinking, which is where a person begins to establish unique characterological profile to question the universe around them in a totally unique way [20,22]. This is especially true if such a decent education is provided to children as early as possible and this establishes the soul of sustainability. In our application of SP-STEAM model, a great importance was given to sustainability. Specifically, a dedicated STEAM instruction approach was developed according to the needs of particular group of students. We believe that we could not escape from rote learning unless otherwise we do not develop a specific approach for specific group of children.
SP-STEAM Model has also a progressive dimension, which refers to gradual tracking of each person’s performance on a dedicated scale. For each child, a detailed 10-point dichotomous scale to keep track of performance was developed. As discussed in detail in the following sections of this manuscript, a detailed in-service education was given to teachers to use this assessment tool. As explained in great detail, teachers, who are the applicators of any given school of thought, need to be continuously developed to keep themselves fresh [27]. For each of the subject matter and unit in mathematics, this tool was used as a supplementary material to guide teachers in the process. Teachers had opportunities to guide children’s learning, especially where teachers noticed any obstacles, misconceptions, and struggles that children can possibly experience. Children, by this way, have expected to self-screen their improvements and gain confidence in scientific thinking. Teachers on the other hand believed to better monitor children’s improvements and provide better feedback in turn. This cyclic progressive approach would enable children build experience on experience, where they are going to find opportunities to practice and gain a scientific thinking culture. The classroom atmosphere was designed, for experiment groups, in such a way that student-student, student-teacher, groups-groups, and groups-teacher interactions were enhanced. Research based collaborative techniques were expected to be used by teachers to promote problem solving, which in turn, was expected students practice critical thinking. The detailed schematic expression of such a classroom atmosphere was mimicked in the Figure 1 below.
A school, which is denoted with hi-tech science laboratories, technology laboratories, mathematic practice tools, robotic applications, and updated contents for subject matters, is not enough alone to build a decent critical thinking culture for children and youth [30]. Highly trained teachers with philosophical perspectives are required to become a good role model for children [27]. Apart from the scientific part, artistic dimension of becoming an effective teacher plays a significant role in this experiment [20,32]. That is why a detailed and dedicated training program was developed for teachers in prior to the application of this dedicated SP-STEAM Model.
4. Methodology
4.1. Research Design
Based on the cause and effect and causal comparative nature of the study, quasi-experimental research with experiment and control groups were designed to test the effects of the defined exogenous variable (A Sustainable Progressive STEAM Model) on the defined endogenous variables (CTDs and Mathematic Achievement). As an exogenous variable a sustainable progressive STEAM education model was taken as the main treatment strategy. Since a relatively newly designed approach was being tested, applicators, who were teachers of 5th graders, were enrolled in an in-service teacher training program prior to any application of pre-test and post-test applications. The ingredients of so-called in-service teacher training program aimed to prepare applicator teachers for the experiment via denoting them with all necessary knowledge and experience regarding the progressive STEAM education model, preparation of lessons, measurement and evalution. This research was designed in such a way that ensures to control of most variables that might possibly be affecting the results of the experiment. For this reason, most of the extraneous variables were extracted and evaluated carefully. For an experiment to be truly valid and reliable, selection of participants and research settings played crucial roles [5]. In order not to cause any deficiencies regarding the reliability and validity of the experiment, all precautions suggested by the pioneers of the field were followed inclusively [5].
4.2. Population and Sample
The population for which the results of this study would be generalized is composed of all 5th grade primary government school students in the NC (N=1200-1500). With respect to the mainframe of this population, a research setting might have been any government school which could have been randomly selected from the list of schools. In this scenario, all the schools in the list had equal chance to be selected as a research setting, and in relation to that, every student in that randomly selected school had equal chance to be selected as a participant for both experiment and control groups. This is also valid for the applicators, who were the teachers in this case. However, for the current research, pre-existing groups of 5th grade students were selected for control and treatment groups because of limited research conditions, which turned the experiment into a quasi-experiment research design.
Sampling procedure, for this experiment, yielded two experimental groups and two control groups (4x4 pre-post experiment design). Participants were randomly selected to establish the experimental and control groups from all the 5th graders in a public school in the NC with 26 students in each group with total number of 104 students. Groups were coded as experiment group 1 (n=26 with 15 girls and 11 boys), experiment group 2 (n=26 with 19 girls and 7 boys), control group 1 (n=26 with 16 girls and 10 boys) and control group 2 (n=26 with 16 girls and 10 boys).
4.3. Data Collection Tools
The California Critical Thinking Disposition Inventory (CCTDI) [11] was used to measure 5th grade primary school students’ critical thinking dispositions. This tool was selected because of its grounding in the APA Delphi Report (American Philosophical Association), which has achieved cross-consensus on the conceptualization of critical thinking, its conceptual clarity [9], and its design in measuring different aspects of critical thinking disposition [10]. As the CCTDI originated in the United States, care was taken to ensure that it was a suitable instrument to assess the same dimensions for Turkish speaking students. A Turkish translation of the CCTDI was tested in the TRNC by İskifoğlu [16] and found to be equivalent with the English original in its validity and reliability. The Turkish version of the CCTDI was also adapted with a second form to be suitable for primary school students by İskifoğlu [16]. The CCTDI is composed of 75 items rated on a 6 point, forced choice scale (1=totally disagree, 2=disagree, 3=partially disagree, 4= partially agree, 5=agree, 6=totally agree) and intends to measure 7 dimensions of critical thinking dispositions with 7 sub-scales. The scores for each of the seven subscales range from a possible minimum of 10 to a possible maximum of 60. Scores of 30 or below indicates a negative tendency toward that subscale; scores of 31-39 suggest ambivalence; scores of 40 or higher are evidence of a positive inclination and scores between 50 and 60 indicate a strong positive tendency. The CCTDI total score is the sum of the seven subscale scores and can range from 70 to 420; a total score of 280 or higher indicates a positive disposition toward critical thinking in samples [10,16]. The translated Turkish version and the original English version of the CCTDI displayed positive psychometric properties, thus supporting the applicability of the CCTDI in a Turkish educational context with alpha coefficient ranging from .81 and .90 for the sub-scales of the CCTDI Turkish. Results also supported high content validity indicates of .81 and .97 [16] and high reliability scores for the sub-scales of the CCTDI; (1) Truth-seeking (12 items, α=.72), (2) Open mindedness (12 items, α=.73), (3) Analyticity (11 items, α=.72), (4) SySTEAMaticity (11 items, α=.74), (5) Critical thinking self-confidence (9 items, α=.78) , (6) Inquisitiveness (10 items, α=.80), and (7) Maturity of judgment (10 items, α=.75).
The second measurement tool utilized was the Mathematical achievement test that was composed of 25 items specifically developed for this experiment. The development of the achievement test included several distinct processes such as preparation of item pool from the related content domains, content validity check with subject matter experts, pilot study, and reliability analysis. The initial item pool included 75 items. 28 items were then removed by two independent experts consistently as they were considered either too difficult or too easy for the targeted audience. More importantly, every single item was checked agaist to related content domain in terms of their relevance. Content validity indices (CVIs) for the rest of the 47 items ranged from 0.83 to 1 which symbolizes high acceptability for content validity [5]. Though, after content validity check, items were first used to collect initial data from a similar group of students (n=200). The collected data were processed to make inferences for the reliability of items and for the entire test itself. Since there was only one correct answer for each multiple-choice items, the Kuder-Richardson 20 formula was used as shown below.
KR20 [k/k-1] * [1-(Σpj*qj)/σ2]
KR20 was calculated in Excel software and used to assess the degree of reliability for each item of the mathematic achievement test. When the results of analysis were interpreted, 20 items were found to be lower in terms of their reliability. Therefore, items with KR20 score of .85 and above were selected to establish the final form of the test. Finally, 25 items with high content validity indices ranging from 0.9 to 1 and with high KR20 scores ranging from 0.85 to 0.89 were chosen as the items to be used in the experiment to assess the mathematical achievements of 5th grade primary school students. The detailed item content validity indicies and KR20 values of each question in the mathematic achievement test is shown in Table 1 below.
4.4. Data Collection Procedures
Prior to any data collection attempt, all the necessary permissions were collected from the Ministry of Education in North Cyprus (NC), from the parents of students and students themselves, administrators, and applicator teachers. They were eventually informed about the aim of the research and informed about their rights in the study. They were also given the information that they can withdraw from the study any time they want without showing any reason for their withdrawal.
After eliciting acceptance from all parties, the next procedure was to invite teachers for an in-service training program because they needed to be informed in advance about the SP-STEAM education model. The training included STEAM procedures (those procedures are explained in detail in a specially prepared booklet), materials and technology and assessment procedures. Following the completion of the teacher training program, data collection tools were administered to both defined control and experiment groups (pre-tests) in two distinct sessions. The first session included the demographic data collection and the administration of the CCTDI, and the second session included the administration of mathematical academic achievement test. The former and the second sessions were administered at different days. In addition, participants were re-informed of their rights in the study and informed on how they were going to take the tests and response to each item in the inventory. After eliciting the initial data from groups, treatment has begun to be applied in experiment groups as soon as the settings were ready, but the control groups remained with the same procedures as they have always been through.
A progressive STEAM education model was administered to 5th grade primary school students in a primary school setting in two separate experimental groups for 14 weeks of time with an expectation of positive changes both in their mathematic achievements and their dispositions toward seven defined critical thinking facets. Following the completion of the treatment, the achievement test and the CCTDI were re-given to both control and experiment groups to check on any positive increments and or improvements in their scores. The most important part of the data collection procedure was to maintain the consistency between and among administration of the test and inventory in order not to cause any bias regarding data collection.
4.5. Data Analysis Procedures
To conduct any analysis to answer the first and the second research questions, a preliminary analysis was conducted to ensure of the homogeneity of the distributions of the data sets for both control and experiment groups. The mean scores, standard deviations, lower and upper boundaries in the 95 percent of confidence interval, minimum and maximum observations, skewness levels, kurtosis levels, standard errors for mean and deviation scores and normality statistics were conducted to make further decisions for which type of inferential statistics need to be considered for which variables and data sets. The first and the second research questions are the ones that directly question the effect of the treatment model. In such group wise comparisons, the most important facets to be cared are the entry levels of these groups in terms of so-called endogenous variables. Therefore, as an initial analysis, entry levels of experiment and control groups were analysed and compared to each other in terms of the defined endogenous variables. This comparison was done by independent samples t-test rather than Mann Whitney U test because Kolmogorov-Smirnov test and Shapiro-Wilk tests showed no significant difference between the distributions of research data and the hypothetical normal distribution. Our expectation here was to elicit a non-significant difference, which is a sign that no covariate is needed for further groupwise analysis. Once the prerequisite analyses were satisfied, the effect of treatment model on the defined endogenous variables were tested via multiple groups split-plot ANOVA. This analysis was safely done with SPSS 24 software. The reason behind selecting split-plot ANOVA was because the analysis involved two sets of scores within two independent groups for several endogenous variables (pre-test and post-test scores for two control and two experiment groups). In such a complex design where control over variables is hard to manage, a dedicated approach for analysis is essential [5], as is for this case.
5. Results
The one-sample Kolmogorov-Smirnov test was used to determine if the data for pretest and posttest across experimental and control groups distributed normally. The results gave non-significant sig (For 2-tailed bi-nominal distribution) values. For experimental groups, the alpha values showed to be 0.563 and 0.198 for each, and for control groups the results also showed 0.110 and 0.174 for each variable. Based on the evidence that the results derived from these data sets came from a normally distributed populations, parametric difference tests were preferred to test the hypothesis because the research satisfied the preconditions of F-test suggested for experimental researches in social sciences [5].
5.1. Split-Plot ANOVA Results
5.1.1. Impact of SP-STEAM Model on Critical Thinking Dispositions
Research Question 1: Will groups of 5th grade primary school students who are instructed by a progressive STEAM education model show statistically significant differences in comparison to similar groups of 5th grade primary school students who are instructed with a traditional education model in terms of their critical thinking dispositions?
Results Regarding Research Question 1: Before using split-plot ANOVA to compare pre-post test results across experiment and control groups, one-way ANOVA was conducted to compare only pre-test results between experiment and control groups. The results showed no statistically significant difference between groups with Sig. scores ranging from 0.741 to 0.117, which meant that all groups are equal in terms of their CTDs.
Using split-plot ANOVA, cross-sectional analysis differences were tested to figure out if there was any statistically significant difference between groups across pre-post-test administrations. The results of analysis showed that the experiment groups where the progressive STEAM program was applied performed better (see Table 2 for means and standard deviations) in all sub-dimensions of the CCTDI in comparison to control groups where the progressive STEAM program was not applied.
Specifically, the empirical evidence supported that experiment group 1 and experiment group 2 performed significantly better in post-test results in comparison to the post-test results of control group 1 and control group 2 in all sub-scales of the CCTDI (see Table 2 for means and standard deviations; Table 3 for post-hoc Tukey F-test results and significance levels).
When the F test results were interpreted with Tukey groupwise comparison result, it is vivid that the sustainable progressive STEAM program made a considerable difference on the CTDs of 5th grade primary school students. Pofile plots also showed the intercepts for better visual interpretation of the results since interpreting split-plot ANOVA results are complicated (see Figure 2 for profile plots for each facet of the CCTDI across pre-post-test design for experiment and control groups below).
5.1.2. Impact of SP-STEAM Model on Mathematic Achievements
Research Question 2: Will groups of 5th grade primary school students who are instructed by a progressive STEAM education model show statistically significant difference in comparison to similar groups of 5th grade primary school students who are instructed with a traditional education model in terms of their mathematical achievements?
Results Regarding Research Question 2: Cross-sectional split-plot ANOVA result yielded that experiment group 1 and experiment group 2 displayed statistically significant differences F(3,100) 40.581, p<0.001 in comparison to control group 1 and control group 2 across pre-post test results in terms of mathematical achievement (see Table 4 for descriptive data). No significant difference observed in favor of control groups.
Group wise comparison carried out with Tukey post-hoc test to see between which groups the significant differences existed. The test results yielded that the significant differences only existed between experiment groups and control groups in favor of experiment groups as shown in Table 5 below.
6. Discussion
It is a well-known fact that establishing a set to graduate individuals who are keen to question, solve problems, be a world citizen, and be a good person is a difficult task [7,16,28,29]. The far aims of education determines aims of schools, lessons, and students. Educational policies are the determinants of the quality of education [25]. Education, on the other hand, within the era of globalization, is trying to achieve its goals. Various different strategies are being tested and used to create a culture of critical thinking [2,4,18,23]. However, very few of them succeed and very few of them are sustainable. The excitement which motivated this research was rooted to the call of research for 2030 vision of North Cyprus that was announced by the Cyprus Ministry of Education [33]. After longitudinal seminars and workshops, with the inclusion of many academicians, researchers, teachers and educators, some critical decisions were made at the governmental level in North Cyprus. One of the decisions was to embed STEAM applications into the current educational sySTEAM to produce individuals who can think critically and solve problems. And, for the time being, the optimum way of practice of STEAM education in North Cyprus and its effects on academic achievement and thinking quality of primary school students were unknown.
This quasi-experimental research aimed to test the impact of a sustainable progressive STEAM education design on 5th grade primary school students’ CTDs and mathematic achievements. When the results were evaluated, it was vivid that STEAM application had significant effects on students’ CTDs and mathematical achievements. As measured with CCTDI, both experimental groups scored significantly high in post-test results in comparison to pre-test results, and in comparison to post test results of control groups whereas control groups either remained same or displayed non-significant change in terms of the seven facets of CCTDI. Similar effects were recorded for mathematic achievement too.
The bulk of the literature had theoretically supported the possible effects of STEAM education on critical thinking and academic achievement [1,2,3,4,7,9,10,14,17,25,28,30,31], however, no empirical evidence existed to prove this hypothesis, especially in the context of North Cyprus. A recent research on enhancing mathematics critical thinking skills have revealed that STEAM plays crucial roles for the development of CTDs [25,28]. However, this study only mentioned the spirit of Mathematic. The current research deliberately tented to figure out the sole impact of STEAM on mathematics achievement.
One other important dimension that needs to be discussed is about the applicator teachers who were provided with in-service training regarding the correct application of STEAM in experiment groups. This opens up another discussion point, which is where applicators begin to be subjected to the sole contribution role regarding the effects of STEAM. As many researches explained, any successful result would be obtained from applications where applicators were well trained [2,3,4,23]. It is delightful that this research obeyed the suggestions of the related literature and the results were shockingly and fruitfully parallel to what has been proposed by the pioneers of the field [1,2,3,4,6,8,12,14,15,20,23,29,30].
What we have learnt from the results of this research is that children can achieve well if they are provided with opportunities to use their potentials. Collaboration, joy of learning, teacher motivation, within the framework of STEAM applications, also play key roles.
7. Conclusion
STEAM, which forms an integrated model with the combination of different disciplines, enables students to look at the problems they face in a wider perspective. STEAM also includes 21st century skills that education sySTEAMs aim to transfer to students [18]. For this reason, using the activities prepared within the scope of STEAM education approach will enable students to develop the skills of science-technology-mathematics and engineering disciplines [1] and increase their readiness [17]. For countries to have a voice in the international arena, to compete and grow economically, STEAM approach should be included in the education sySTEAM [7]. In North Cyprus, the Ministry of National Education published "Science, Engineering and Entrepreneurship applications," which says the subject field is added [33]. The results of the current research can be considered invaluable in terms of underlining the positive impact of STEAM integration.
8. Suggestions for Further Studies
This experiment had some limitations that can be taken into consideration for further implications. Empirical studies, especially the experimental ones, are quite valuable because they can be repeated as they are in different settings with similar group of students. This experiment, though, considered mathematic achievement only. However, STEAM includes engineering, science, and technology applications as well. A further study may include these endogenous variables to test the complete effect of STEAM on other subject matters.
In addition, conducting a further experiment with 4th, 6th, and 7th grade students could be fruitful to see the effects of STEAM for different educational levels. Moreover, this research design can be turned into a true-experimental design with completely random sampling procedure with more participants enrolled in an experiment. In our research, to increase the validity of the results, two experimental groups were used against two control groups. A follow up study may include more than two experimental groups so that results would be more generalizable. Finally, factors associated with the application of STEAM, perceptions of students and applicators views on possible obstacles can be studied with a survey. The results of such studies have the potential to bring deeper insights into STEAM applications and its effects on various different exogenous variables.
Author Contributions
“Conceptualization, H.K and G.İ; methodology, G.İ. and H.K; software, G.İ; validation, C.P.Z., H.C. and G.İ.; formal analysis, G.İ.; investigation, H.K., C.P.Z., G.İ and H.C.; resources, G.İ.; data curation, G.İ.; writing—original draft preparation, H.K., G.İ.; writing—review and editing, G.İ. and C.P.Z..; visualization, G.İ.; supervision, C.P.Z.; project administration, H.K. All authors have read and agreed to the published version of the manuscript.”.
Funding
“This research received no external funding”.
Informed Consent Statement
“Informed consent was obtained from all subjects involved in the study.”.
Conflicts of Interest
“The authors declare no conflict of interest.”
References
- Afdareza, M.Y.; Yuanita, P.; Maimunah, M. Development of learning device based on 21st century skill with implementation of problem based learning to increase critical thinking skill of students on polyhedron for grade 8th junior high school. Journal of Educational Sciences 2020, 4, 273–284. [Google Scholar] [CrossRef]
- Aini, N.R.; Syafril, S.; Netriwati, N.; Pahrudin, A.; Rahayu, T.; Puspasari, V. Problem-based learning for critical thinking skills in mathematics. Journal of Physics: Conference Series 2019, 1, 1155. [Google Scholar] [CrossRef]
- Bybee, R.W. K-12 engineering education standards: Opportunities and barriers. Technology and Engineering Teacher 2011, 70, 21–29. [Google Scholar]
- Carroll, M.C. Shoot for the moon! The mentors and the middle schoolers explore the intersection of design thinking and STEAM. Journal of Pre-College Engineering Education Research 2014, 4, 14–30. [Google Scholar]
- Cash, P.; Stanković, T.; Štorga, M. Experimental design research: Approaches, perspectives, applications. Springer: Switzerland, 2016.
- Çelik İskifoğlu, T.; Çerkez, Y.; İskifoğlu, G. Thinking culture and critical thinking dispositions of high school students in Turkish Republic of Northern Cyprus. Frontiers in Psychology 2022, 13. [Google Scholar] [CrossRef] [PubMed]
- Çiftçi, A.; Topçu, M.S.; Foulk, J.A. Pre-service early childhood teachers’ views on STEAM education and their STEAM teaching practices. Research in Science & Technological Education, 2022 40, pp. 207-233. [CrossRef]
- English, L.D.; King, D. STEAM integration in sixth grade: Designing and constructing paper bridges. International Journal of Science and Mathematics Education 2018. [Google Scholar] [CrossRef]
- Facione, P.A. Critical thinking: A Statement of expert consensus for purposes of educational assessment and instruction. 1990.
- Facione, P.A. The disposition toward critical thinking: its character, measurement, and relation to critical thinking skill. Informal Logic 2000, 20, 61–84. [Google Scholar] [CrossRef]
- Facione, P.A.; Facione, N.C.; Giancarlo, C.A. The California Critical Thinking Disposition Inventory: Test manual, California Academic Press: Oakland, CA, USA, 1992.
- Gillies, A. “Where are the ‘T’ and ‘E’ in STEAM education. ” Techniques 2015, 90, pp .60–61. [Google Scholar]
- Gomez, A.; Albrecht, B. True STEAM education. Technology and Engineering Teacher 2014, 73, pp .8–16. [Google Scholar]
- Gulhan, F.; Sahin, F. The effects of science technology engineering math (STEAM) integration on 5th grade students’ perceptions and attitudes towards these areas. International Journal of Human Sciences 2016, 13, pp .602–620. [Google Scholar]
- Hacıoğlu, Y.; Gülhan, F. The effects of STEAM education on the students’ critical thinking skills and STEAM perceptions. Journal of Education in Science Environment and Health 2021, 7, pp. 139–155. [Google Scholar]
- İskifoğlu, G. Cross-cultural equivalency of the California critical thinking disposition inventory. Educ. Sci.: Theory Pract. 2014 14, 159–178.
- Li, Y. Six years of development in promoting identity formation of STEAM education as a distinct field. IJ STEAM Ed, 2020, 7. [Google Scholar] [CrossRef]
- Lin, K.Y.; Yeh, Y.F.; Hsu, Y.S; et al. STEAM education goals in the twenty-first century: Teachers’ perceptions and experiences. Int J Technol Des Educ, 2023, 33, pp. 479–496. [Google Scholar] [CrossRef]
- Murphy, S.; MacDonald, A.; Danaia, L.; Wang, C. An analysis of Australian STEAM education strategies. Policy Futures in Education 2019 17, pp. 122–139. [CrossRef]
- Nurwahyunani, A. Literature review: A STEAM approach to improving the quality of science learning in Indonesia. J. Edu. Gift. Young Sci. 2021, 9, pp. 11-17. [CrossRef]
- Priatna, N.; Lorenzia, S.; Widodo, S.A. STEAM education at junior high school mathematics course for improving the mathematical critical thinking skills. Journal for the Education of Gifted Young Scientists 2020, 8, pp. 1173–1184,. [Google Scholar] [CrossRef]
- Smith, C.; Watson, J. Does the rise of STEAM education mean the demise of sustainability education? Australian Journal of Environmental Education 2019, 35, pp. 1–11. [Google Scholar] [CrossRef]
- Stein, B.; Haynes, A.; Redding, M.; Ennis, T.; Cecil, M. Assessing critical thinking in STEAM and beyond. In: Iskander, M. (eds) Innovations in E-learning, Instruction Technology, Assessment, and Engineering Education. Springer: Dordrecht, 2007. [CrossRef]
- Sullivan, J.F. Broadening engineering’s participation-A call for K-16 engineering education. The Bridge 2006, 36, National Academies Press: Washington, DC, USA.
- Syafril, S.; Aini, N.R.; Netriwati, Pahrudin, A. ; Yaumas, N.E. Spirit of mathematics critical thinking skills (CTS). Journal of Physics: Conference Series 2020, 1467. [Google Scholar] [CrossRef]
- Tekin Poyraz, G.; Genç Kumtepe, E. An Example of STEAM Education in Turkey and Distance Education for Sustainable STEAM Learning. ENAD, 2019, 7. [Google Scholar] [CrossRef]
- Thi To Khuyen, N.; Van Bien, N.; Lin, P.-L.; Lin, J.; Chang, C.-Y. Measuring Teachers’ Perceptions to Sustain STEAM Education Development. Sustainability 2020, 12, 1531. [Google Scholar] [CrossRef]
- Wendell, K.B.; Connolly, K.G.; Wright, C.G.; Jarvin, L.; Rogers, C.; Barnett, M.; Marulcu, I. Incorporating engineering design into elementary school science curricula. American Society for Engineering Education Annual Conference & Exposition, Louisville, KY, 2010.
- White, D.W. What is STEAM education and why is it important? Florida Association of Teacher Educators Journal 2014, 1, pp. 1–11. [Google Scholar]
- Yasin, M.; Fakhri, J.; Siswadi Faelasofi, R.; Safi’i, A.; Supriadi, N.; Syazali, M.; & Wekke, I.S. The effect of SSCS learning model on reflective thinking skills and problem solving ability. European Journal of Educational Research 2020, 9, pp. 743–752. [CrossRef]
- Yasin, M.; Jauhariyah, D.; Madiyo, M.; Rahmawati, R.; Farid, F.; Irwandani, I.; Mardana, F.F. The guided inquiry to improve students mathematical critical thinking skills using student’s worksheet. Journal for the Education of Gifted Young Scientists 2019, 7, pp. 1345–1360. [Google Scholar] [CrossRef]
- Zeid, I.; Chin, J.; Duggan, C.; Kamarthi, S. Engineering based learning: A paradigm shift for high school STEAM teaching. International Journal of Engineering Education 2014, 30, pp. 1-12.
- National Report of Ministry of National Education. Vision 2030 Education Strategic Plan Workshop Report, Ministry of National Education, Nicosia, North Cyprus, 2019, retrieved from https://www.google.com/search?q=google+translate&rlz=1C1GCEA_en__973__973&oq=google+translate&gs_lcrp=EgZjaHJvbWUqBggAEEUYOzIGCAAQRRg7Mg0IARAAGIMBGLEDGIAEMgoIAhAAGLEDGIAEMgcIAxAAGIAEMgcIBBAAGIAEMg0IBRAAGIMBGLEDGIAEMg0IBhAAGIMBGLEDGIAEMgQIBxAF0gEIMjMzMGowajeoAgCwAgA&sourceid=chrome&ie=UTF-8.
Figure 1.
Core rationale of SP-STEAM model.
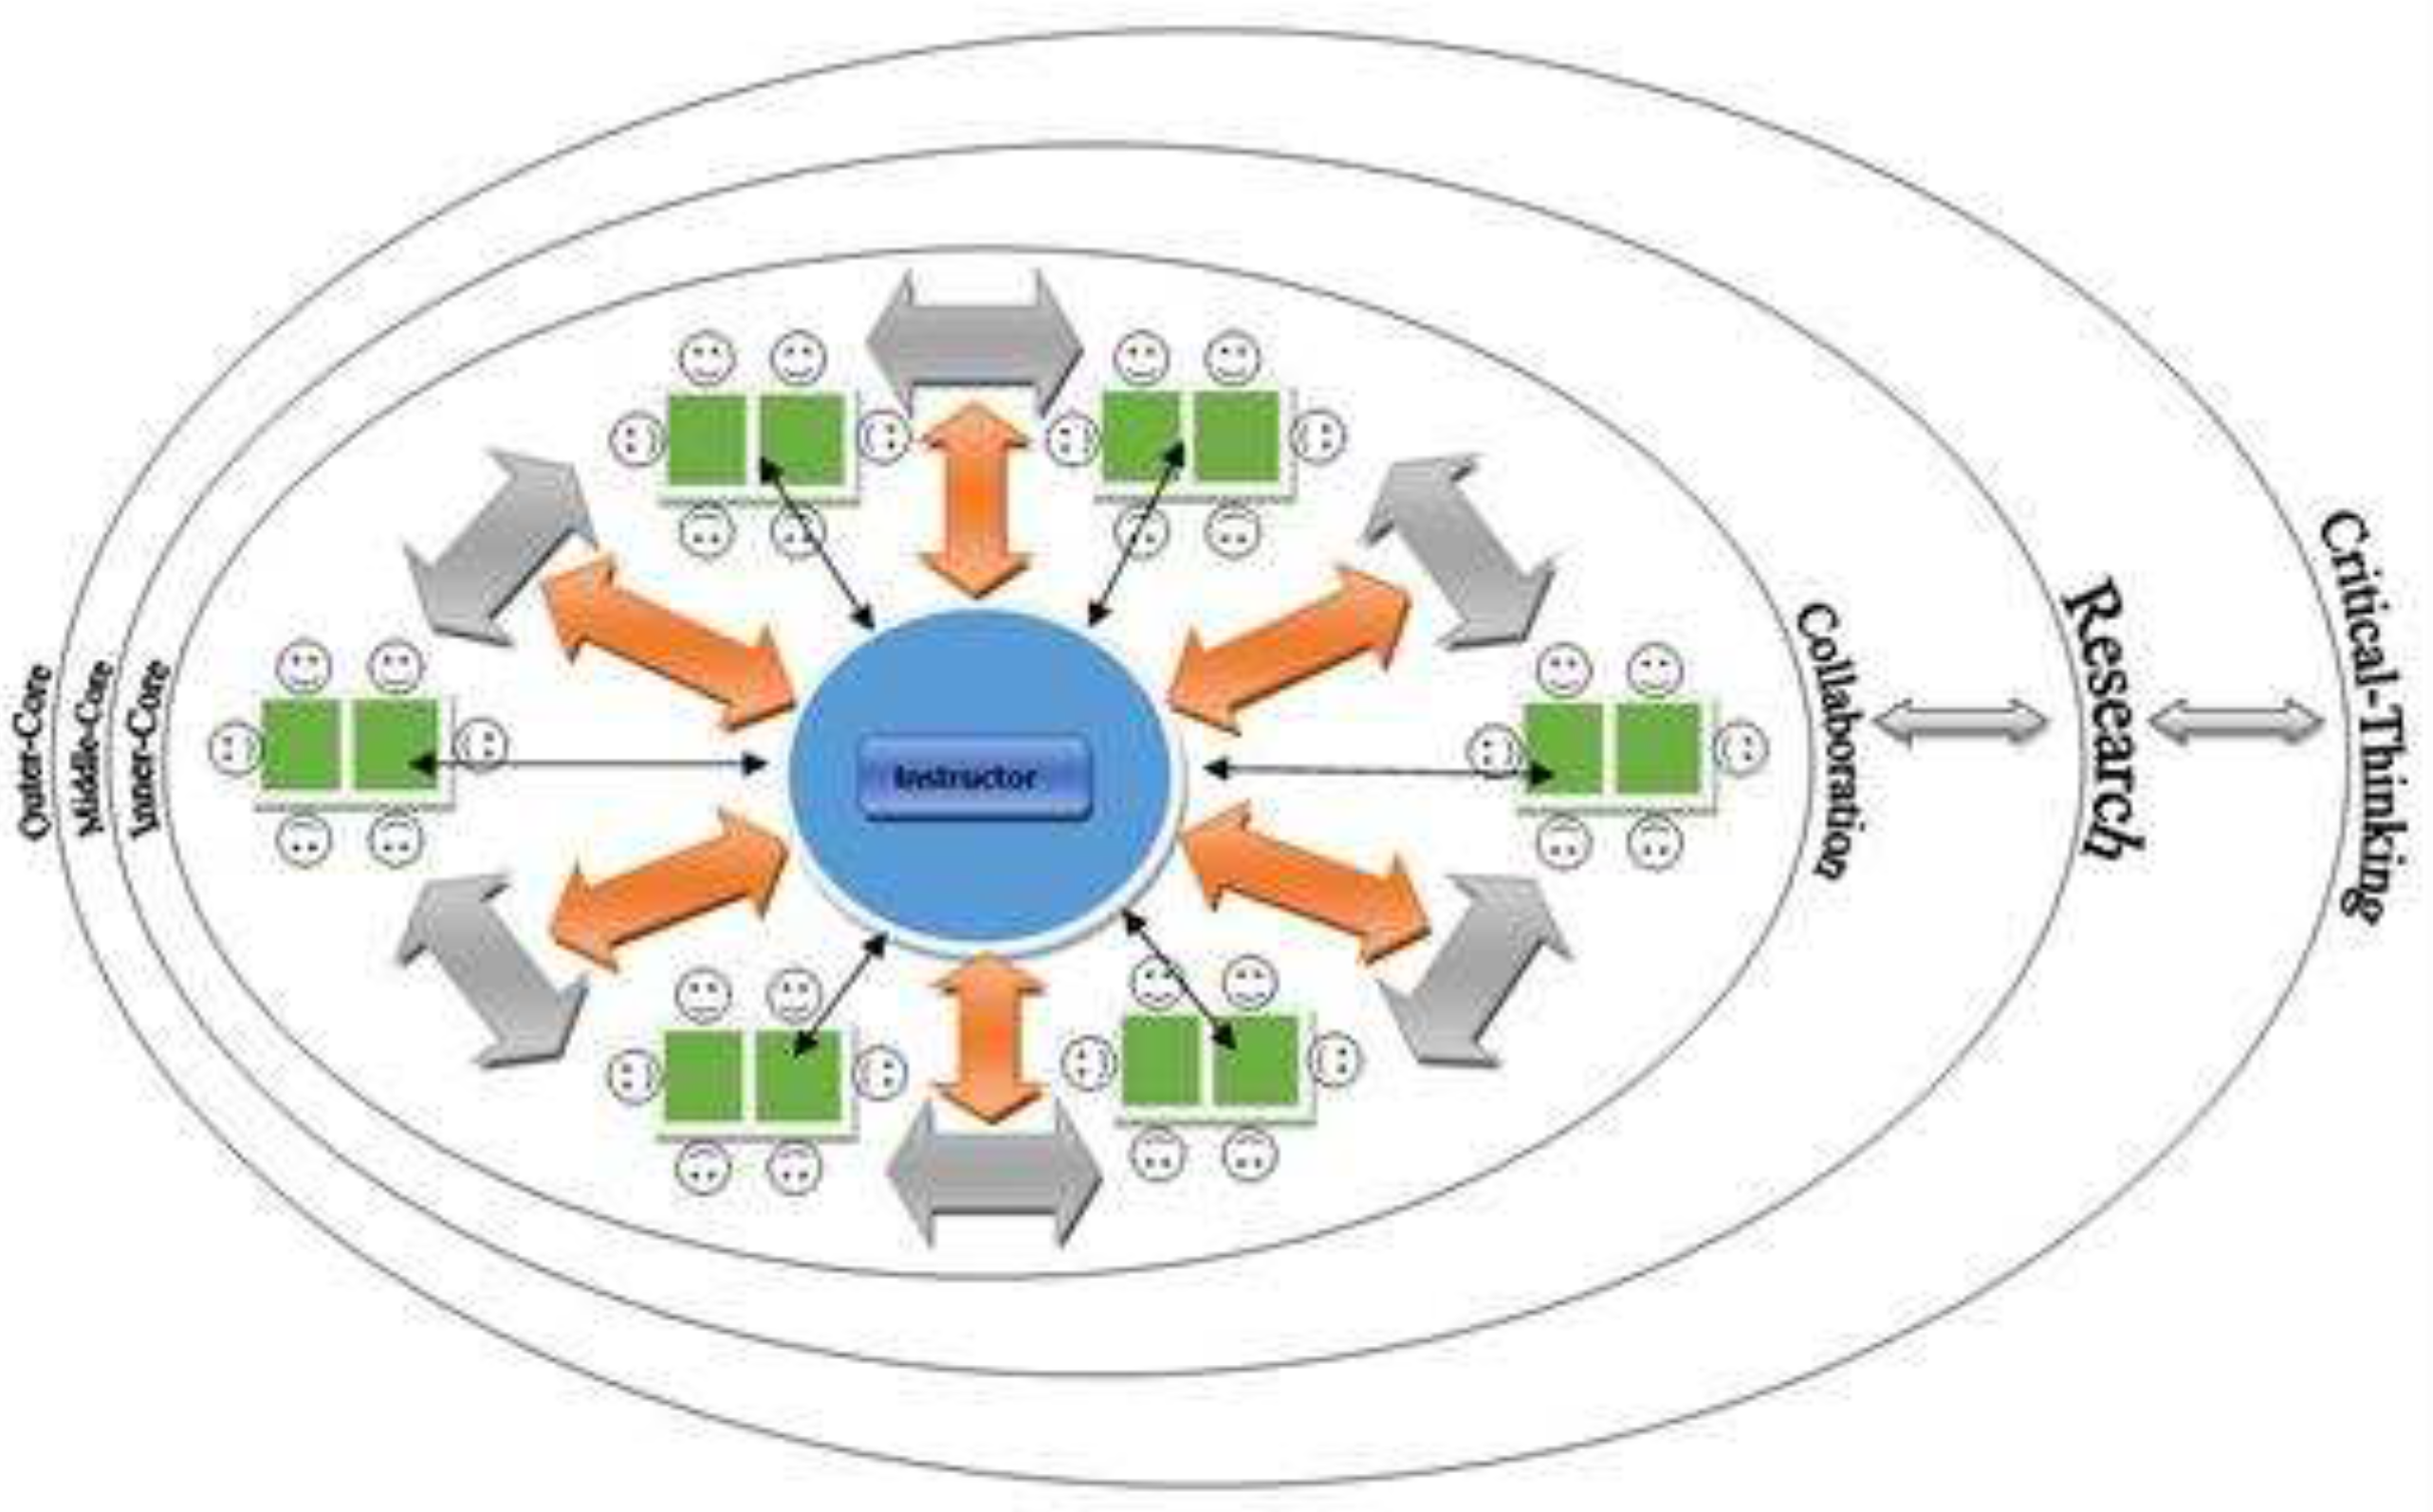
Figure 2.
Profile plots of pre-post measurement design across groups regarding CCTDI subscales.
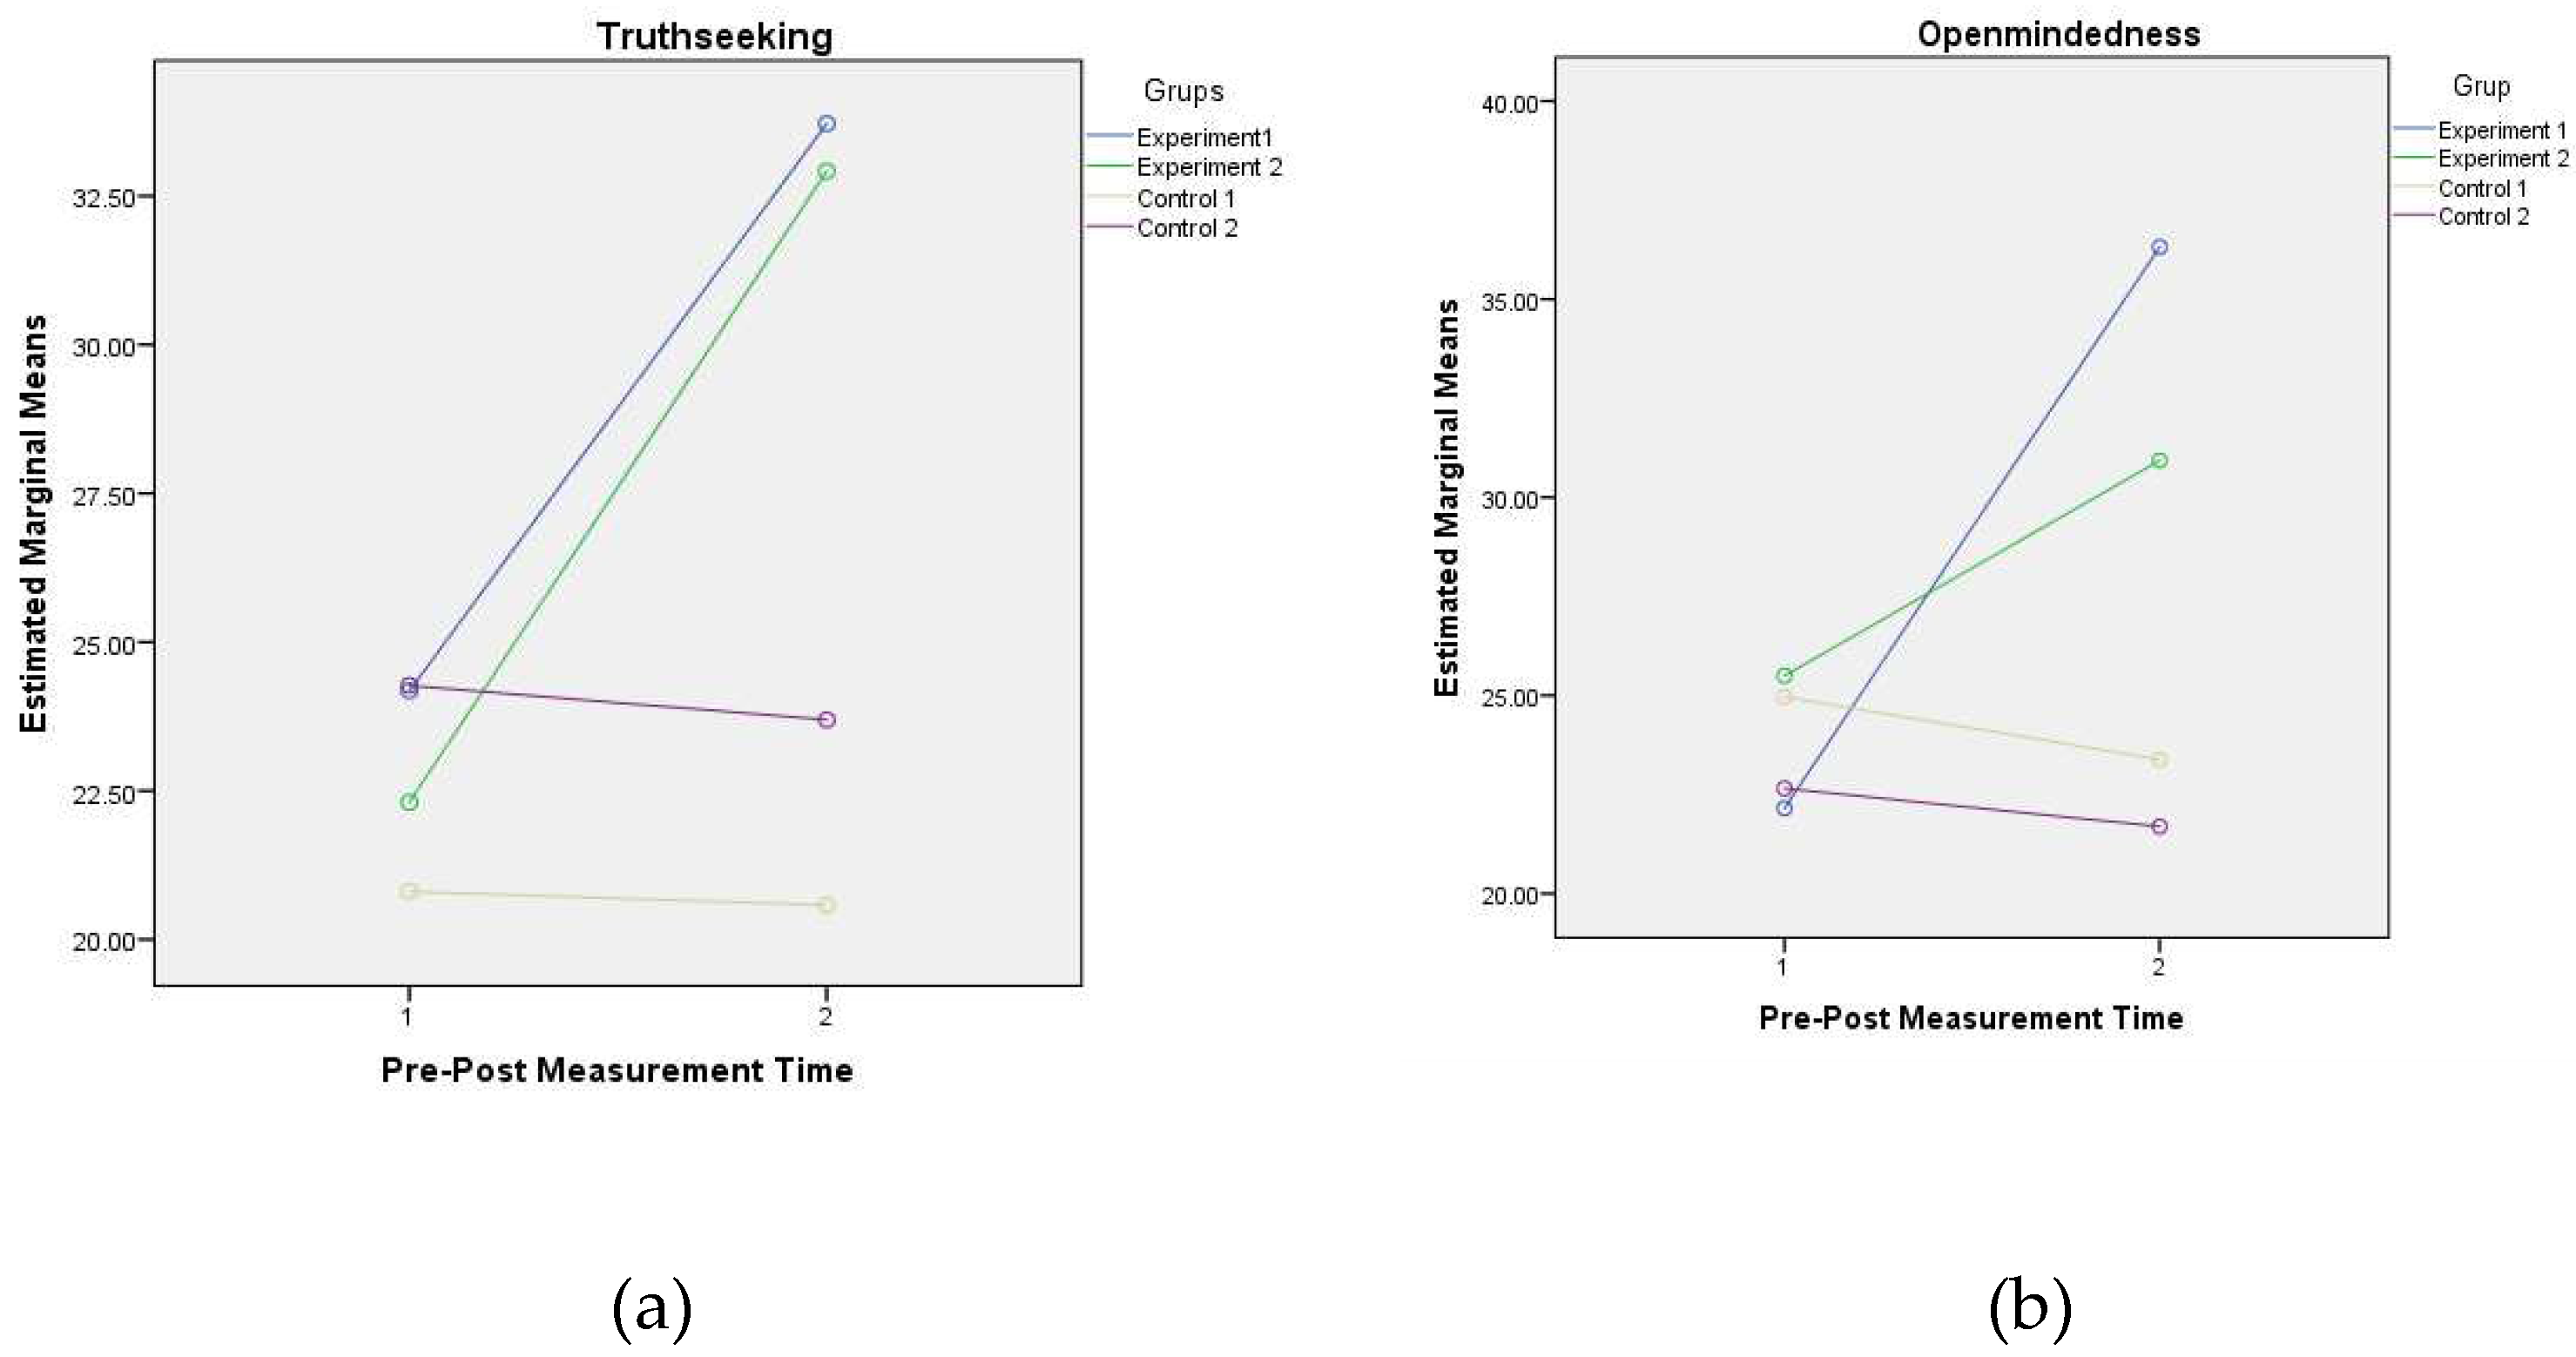
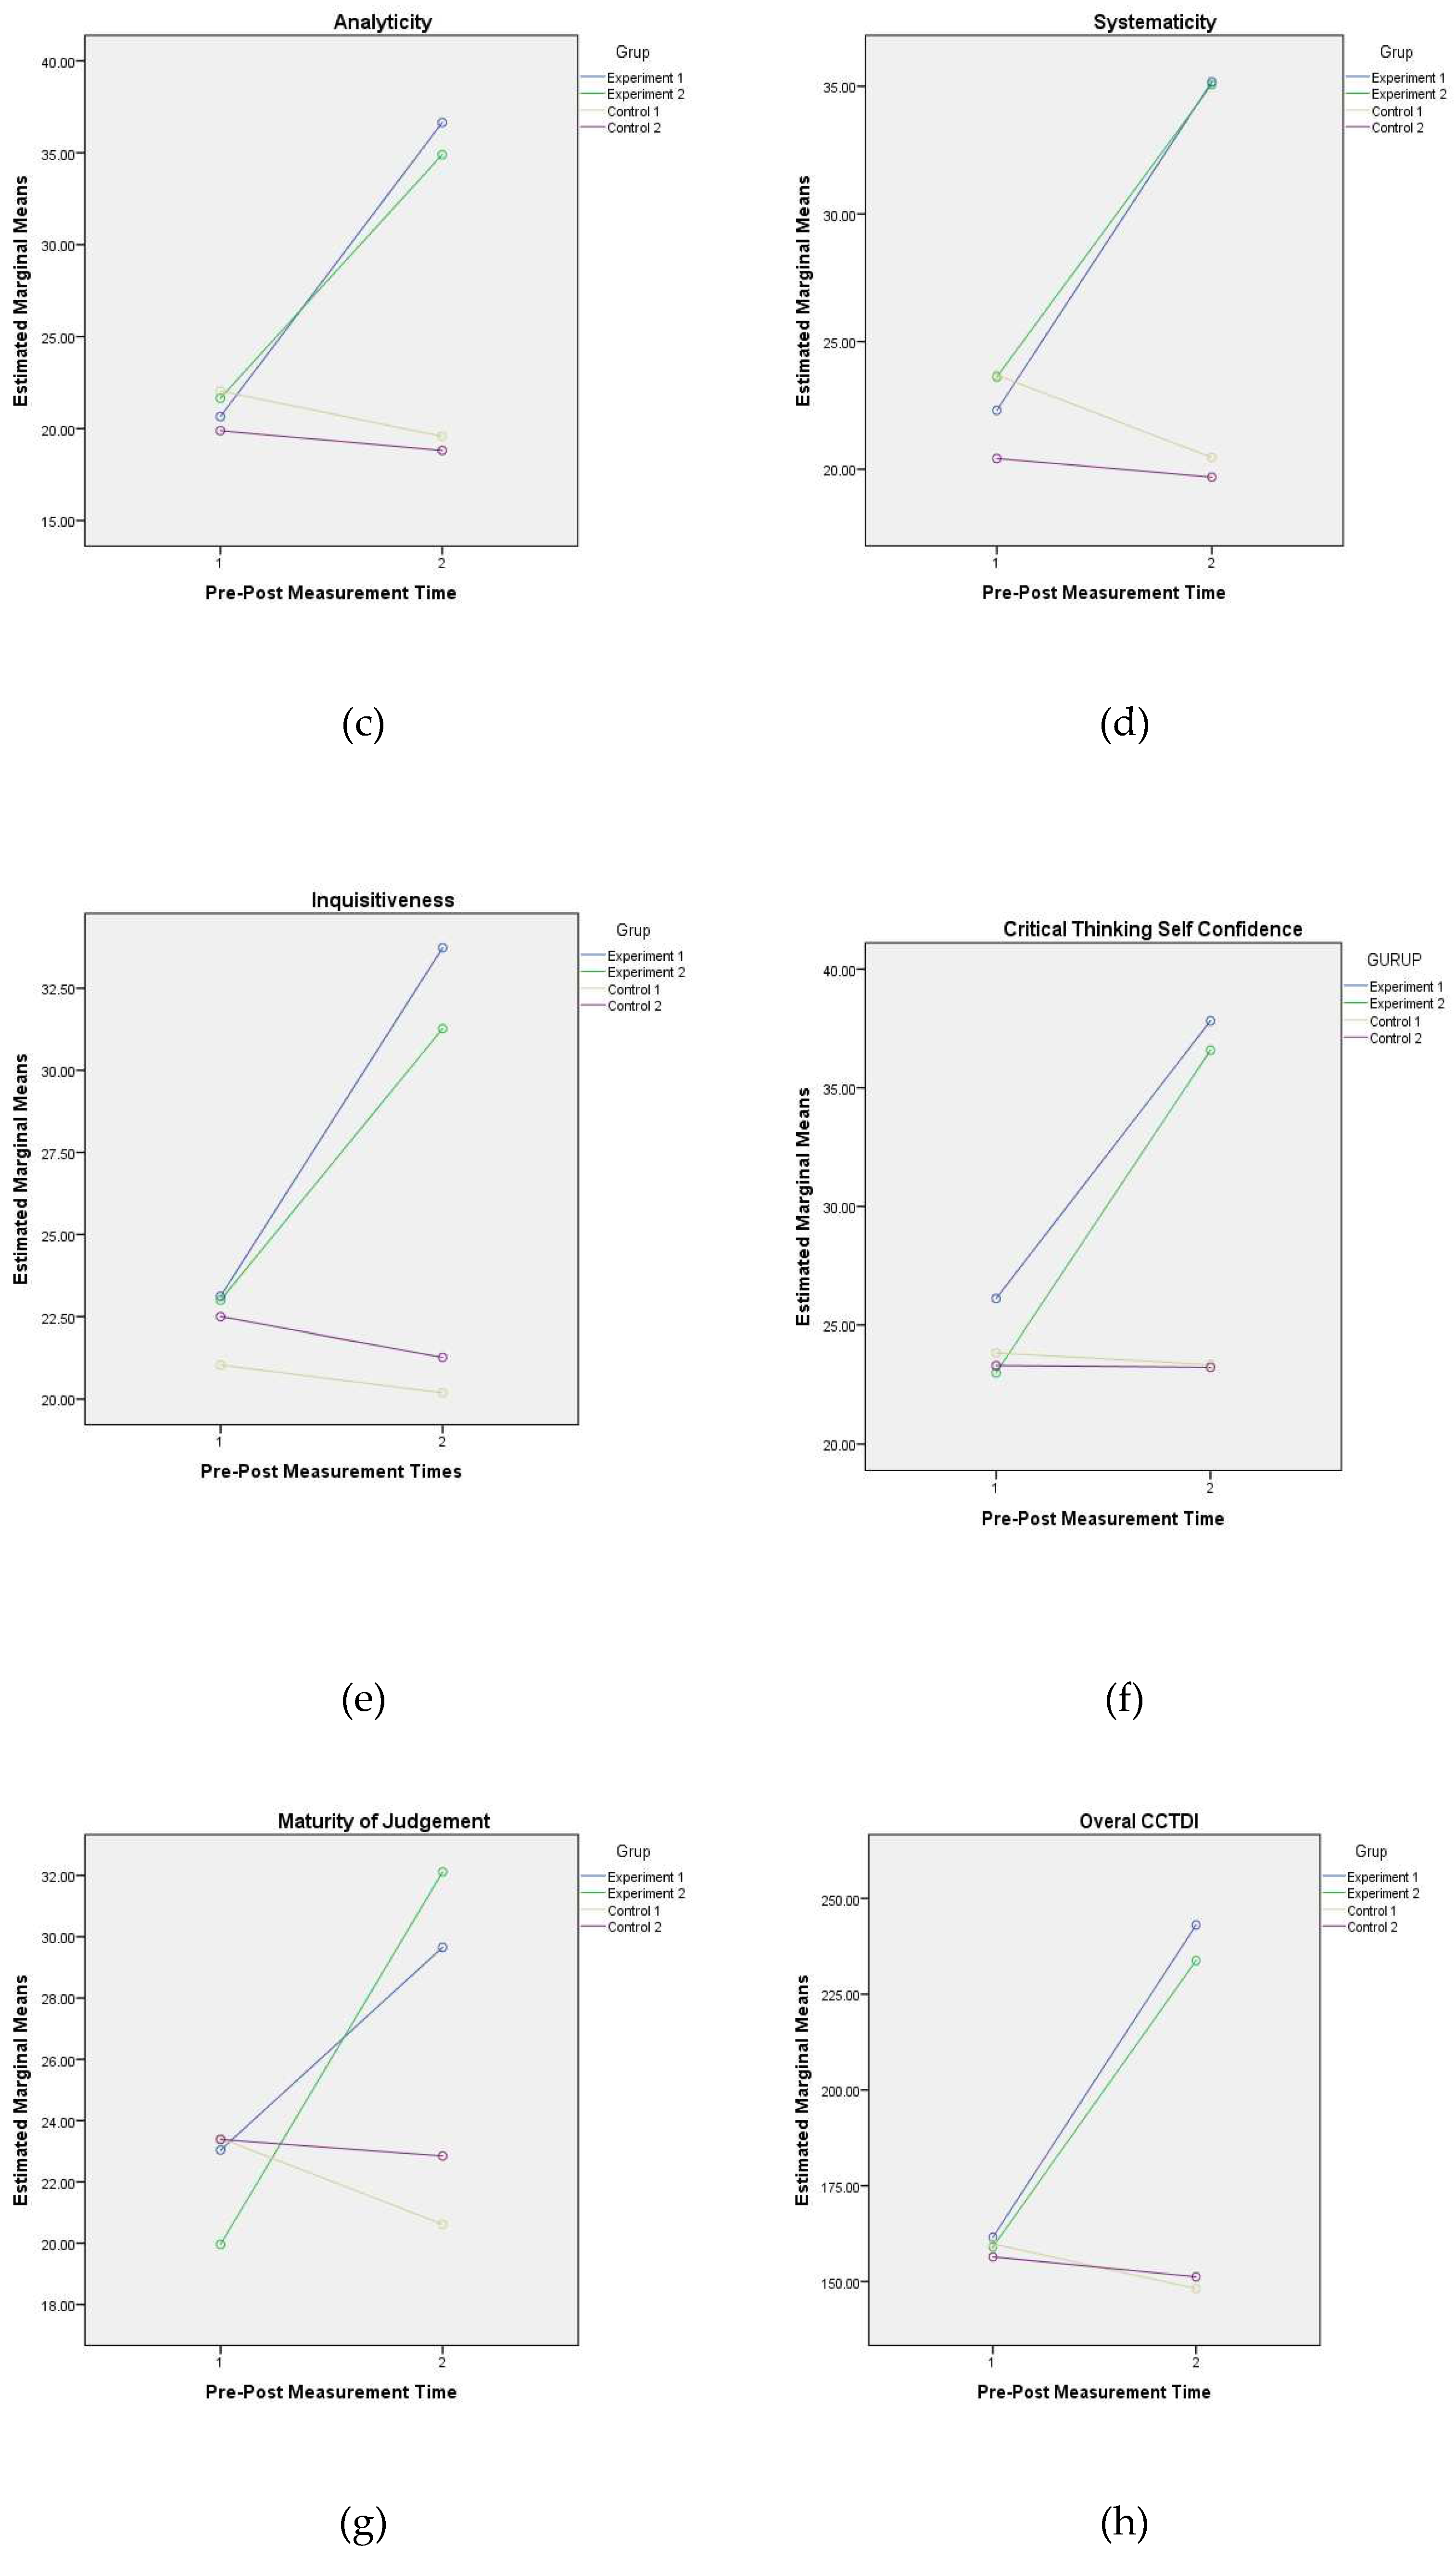

Table 1.
Item content validity indices and KR20 scores of mathematic achievement test.
| Question Number | I-CVI1 | KR20 |
|---|---|---|
| Question 1 | 1 | 0.85 |
| Question 2 | 0.9 | 0.89 |
| Question 3 | 0.9 | 0.85 |
| Question 4 | 0.9 | 0.88 |
| Question 5 | 0.9 | 0.87 |
| Question 6 | 1 | 0.85 |
| Question 7 | 0.9 | 0.85 |
| Question 8 | 1 | 0.85 |
| Question 9 | 1 | 0.88 |
| Question 10 | 0.9 | 0.85 |
| Question 11 | 1 | 0.86 |
| Question 12 | 1 | 0.85 |
| Question 13 | 0.9 | 0.86 |
| Question 14 | 1 | 0.85 |
| Question 15 | 0.9 | 0.89 |
| Question 16 | 0.9 | 0.85 |
| Question 17 | 0.9 | 0.85 |
| Question 18 | 0.9 | 0.88 |
| Question 19 | 1 | 0.85 |
| Question 20 | 0.9 | 0.86 |
| Question 21 | 0.9 | 0.85 |
| Question 22 | 0.9 | 0.86 |
| Question 23 | 0.9 | 0.88 |
| Question 24 | 0.9 | 0.85 |
| Question 25 | 0.9 | 0.88 |
Table 2.
Descriptive statistics regarding seven facets of critical thinking dispositions across pre-posttest design of control and experiment groups.
Table 2.
Descriptive statistics regarding seven facets of critical thinking dispositions across pre-posttest design of control and experiment groups.
| Variables | Design | Groups | Mean | Std. Deviation | n |
|---|---|---|---|---|---|
| Truth-seeking | Pre-Test | Experiment 1 | 24.1795 | 4.09035 | 26 |
| Experiment 2 | 22.3077 | 4.02760 | 26 | ||
| Control 1 | 20.8077 | 2.19124 | 26 | ||
| Control 2 | 24.2692 | 3.51634 | 26 | ||
| Total | 22.8910 | 3.77422 | 104 | ||
| Post-Test | Experiment 1 | 33.7179 | 7.12285 | 26 | |
| Experiment 2 | 32.9167 | 5.43778 | 26 | ||
| Control 1 | 20.5769 | 2.11987 | 26 | ||
| Control 2 | 23.6923 | 3.56392 | 26 | ||
| Total | 27.7260 | 7.51916 | 104 | ||
| Open-mindedness | Pre-Test | Experiment 1 | 22.1538 | 2.94879 | 26 |
| Experiment 2 | 25.5000 | 2.59615 | 26 | ||
| Control 1 | 24.9615 | 3.97473 | 26 | ||
| Control 2 | 22.6538 | 4.89034 | 26 | ||
| Total | 23.8173 | 3.93334 | 104 | ||
| Post-Test | Experiment 1 | 36.3141 | 3.48148 | 26 | |
| Experiment 2 | 30.9295 | 4.25785 | 26 | ||
| Control 1 | 23.3846 | 4.34582 | 26 | ||
| Control 2 | 21.6923 | 5.34991 | 26 | ||
| Total | 28.0801 | 7.34182 | 104 | ||
| Inquisitiveness | Pre-Test | Experiment 1 | 23.1154 | 2.86115 | 26 |
| Experiment 2 | 23.0000 | 2.28035 | 26 | ||
| Control 1 | 21.0385 | 2.40800 | 26 | ||
| Control 2 | 22.5000 | 3.40881 | 26 | ||
| Total | 22.4135 | 2.85783 | 104 | ||
| Post-Test | Experiment 1 | 33.7308 | 4.37774 | 26 | |
| Experiment 2 | 31.2692 | 5.43734 | 26 | ||
| Control 1 | 20.1923 | 2.65359 | 26 | ||
| Control 2 | 21.2692 | 4.38687 | 26 | ||
| Total | 26.6154 | 7.35416 | 104 | ||
| SySTEAMaticity | Pre-Test | Experiment 1 | 22.3077 | 3.51874 | 26 |
| Experiment 2 | 23.6154 | 2.57801 | 26 | ||
| Control 1 | 23.6923 | 3.72848 | 26 | ||
| Control 2 | 20.4231 | 2.53256 | 26 | ||
| Total | 22.5096 | 3.36456 | 104 | ||
| Post-Test | Experiment 1 | 35.1748 | 4.30083 | 26 | |
| Experiment 2 | 35.0699 | 4.99370 | 26 | ||
| Control 1 | 20.4615 | 3.30128 | 26 | ||
| Control 2 | 19.6923 | 2.60414 | 26 | ||
| Total | 27.5997 | 8.48825 | 104 | ||
| Analyticity | Pre-Test | Experiment 1 | 24.1795 | 4.09035 | 26 |
| Experiment 2 | 22.3077 | 4.02760 | 26 | ||
| Control 1 | 20.8077 | 2.19124 | 26 | ||
| Control 2 | 24.2692 | 3.51634 | 26 | ||
| Total | 22.8910 | 3.77422 | 104 | ||
| Post-Test | Experiment 1 | 33.7179 | 7.12285 | 26 | |
| Experiment 2 | 32.9167 | 5.43778 | 26 | ||
| Control 1 | 20.5769 | 2.11987 | 26 | ||
| Control 2 | 23.6923 | 3.56392 | 26 | ||
| Total | 27.7260 | 7.51916 | 104 | ||
| Maturity of Judgement | Pre-Test | Experiment 1 | 23.0385 | 5.86843 | 26 |
| Experiment 2 | 19.9615 | 3.91388 | 26 | ||
| Control 1 | 23.4231 | 3.63509 | 26 | ||
| Control 2 | 23.3846 | 3.71028 | 26 | ||
| Total | 22.4519 | 4.55363 | 104 | ||
| Post-Test | Experiment 1 | 29.6538 | 7.00253 | 26 | |
| Experiment 2 | 32.1154 | 6.59289 | 26 | ||
| Control 1 | 20.6154 | 5.26176 | 26 | ||
| Control 2 | 22.8462 | 3.84388 | 26 | ||
| Total | 26.3077 | 7.43656 | 104 | ||
| CT-Self Confidence | Pre-Test | Experiment 1 | 26.1154 | 3.79818 | 26 |
| Experiment 2 | 23.0000 | 3.40588 | 26 | ||
| Control 1 | 23.8462 | 2.52495 | 26 | ||
| Control 2 | 23.3077 | 2.42931 | 26 | ||
| Total | 24.0673 | 3.28653 | 104 | ||
| Post-Test | Experiment 1 | 37.8205 | 6.17027 | 26 | |
| Experiment 2 | 36.5812 | 6.97029 | 26 | ||
| Control 1 | 23.3462 | 3.74104 | 26 | ||
| Control 2 | 23.2308 | 2.61240 | 26 | ||
| Total | 30.2447 | 8.66837 | 104 | ||
| Overall Disposition | Pre-Test | Experiment 1 | 161.5641 | 10.28171 | 26 |
| Experiment 2 | 159.0385 | 10.86455 | 26 | ||
| Control 1 | 159.8077 | 8.37147 | 26 | ||
| Control 2 | 156.4231 | 6.57372 | 26 | ||
| Total | 159.2083 | 9.23389 | 104 | ||
| Post-Test | Experiment 1 | 243.0554 | 14.79129 | 26 | |
| Experiment 2 | 233.7770 | 14.92111 | 26 | ||
| Control 1 | 148.1538 | 6.86843 | 26 | ||
| Control 2 | 151.2308 | 7.69575 | 26 | ||
| Total | 194.0542 | 46.17483 | 104 |
Table 3.
Tukey F Post-hoc results regarding mean differences for experiment and control groups across pre-posttest design.
Table 3.
Tukey F Post-hoc results regarding mean differences for experiment and control groups across pre-posttest design.
| Variables | Groups | df | F | Mean Difference | Std. Error | Sig. | |
|---|---|---|---|---|---|---|---|
| Truth seeking | Experiment 1 | Experiment 2 | 3,100 | 32.541 | 1.3365 | .92407 | .474 |
| Control 1 | 8.2564 | .92407 | .000 | ||||
| Control 2 | 4.9679 | .92407 | .000 | ||||
| Experiment 2 | Experiment 1 | -1.3365 | .92407 | .474 | |||
| Control 1 | 6.9199 | .92407 | .000 | ||||
| Control 2 | 3.6314 | .92407 | .001 | ||||
| Control 1 | Experiment 1 | -8.2564 | .92407 | .000 | |||
| Experiment 2 | -6.9199 | .92407 | .000 | ||||
| Control 2 | -3.2885 | .92407 | .003 | ||||
| Control 2 | Experiment 1 | -4.9679 | .92407 | .000 | |||
| Experiment 2 | -3.6314 | .92407 | .001 | ||||
| Control 1 | 3.2885 | .92407 | .003 | ||||
| Open mindedness | Experiment 1 | Experiment 2 | 3,100 | 90.636 | 1.0192 | .99117 | .733 |
| Control 1 | 5.0609* | .99117 | .000 | ||||
| Control 2 | 7.0609* | .99117 | .000 | ||||
| Experiment 2 | Experiment 1 | -1.0192 | .99117 | .733 | |||
| Control 1 | 4.0417* | .99117 | .001 | ||||
| Control 2 | 6.0417* | .99117 | .000 | ||||
| Control 1 | Experiment 1 | -5.0609* | .99117 | .000 | |||
| Experiment 2 | -4.0417* | .99117 | .001 | ||||
| Control 2 | 2.0000 | .99117 | .188 | ||||
| Control 2 | Experiment 1 | -7.0609* | .99117 | .000 | |||
| Experiment 2 | -6.0417* | .99117 | .000 | ||||
| Control 1 | -2.0000 | .99117 | .188 | ||||
| Inquisitiveness | Experiment 1 | Experiment 2 | 3,100 | 42.618 | 1.2885 | .75952 | .331 |
| Control 1 | 7.8077* | .75952 | .000 | ||||
| Control 2 | 6.5385* | .75952 | .000 | ||||
| Experiment 2 | Experiment 1 | -1.2885 | .75952 | .331 | |||
| Control 1 | 6.5192* | .75952 | .000 | ||||
| Control 2 | 5.2500* | .75952 | .000 | ||||
| Control 1 | Experiment 1 | -7.8077* | .75952 | .000 | |||
| Experiment 2 | -6.5192* | .75952 | .000 | ||||
| Control 2 | -1.2692 | .75952 | .344 | ||||
| Control 2 | Experiment 1 | -6.5385* | .75952 | .000 | |||
| Experiment 2 | -5.2500* | .75952 | .000 | ||||
| Control 1 | 1.2692 | .75952 | .344 | ||||
| SySTEAMaticity | Experiment 1 | Experiment 2 | 3,100 | 95.069 | -.6014 | .77982 | .867 |
| Control 1 | 6.6643* | .77982 | .000 | ||||
| Control 2 | 8.6836* | .77982 | .000 | ||||
| Experiment 2 | Experiment 1 | .6014 | .77982 | .867 | |||
| Control 1 | 7.2657* | .77982 | .000 | ||||
| Control 2 | 9.2850* | .77982 | .000 | ||||
| Control 1 | Experiment 1 | -6.6643* | .77982 | .000 | |||
| Experiment 2 | -7.2657* | .77982 | .000 | ||||
| Control 2 | 2.0192 | .77982 | .053 | ||||
| Control 2 | Experiment 1 | -8.6836* | .77982 | .000 | |||
| Experiment 2 | -9.2850* | .77982 | .000 | ||||
| Control 1 | -2.0192 | .77982 | .053 | ||||
| Analyticity | Experiment 1 | Experiment 2 | 3,100 | 32.541 | 1.3365 | .92407 | .474 |
| Control 1 | 8.2564* | .92407 | .000 | ||||
| Control 2 | 4.9679* | .92407 | .000 | ||||
| Experiment 2 | Experiment 1 | -1.3365 | .92407 | .474 | |||
| Control 1 | 6.9199* | .92407 | .000 | ||||
| Control 2 | 3.6314* | .92407 | .001 | ||||
| Control 1 | Experiment 1 | -8.2564* | .92407 | .000 | |||
| Experiment 2 | -6.9199* | .92407 | .000 | ||||
| Control 2 | -3.2885* | .92407 | .003 | ||||
| Control 2 | Experiment 1 | -4.9679* | .92407 | .000 | |||
| Experiment 2 | -3.6314* | .92407 | .001 | ||||
| Control 1 | 3.2885* | .92407 | .003 | ||||
| Maturity of Judgement | Experiment 1 | Experiment 2 | 3,100 | 28.019 | .3077 | 1.09623 | .992 |
| Control 1 | 4.3269* | 1.09623 | .001 | ||||
| Control 2 | 3.2308* | 1.09623 | .020 | ||||
| Experiment 2 | Experiment 1 | -.3077 | 1.09623 | .992 | |||
| Control 1 | 4.0192* | 1.09623 | .002 | ||||
| Control 2 | 2.9231* | 1.09623 | .044 | ||||
| Control 1 | Experiment 1 | -4.3269* | 1.09623 | .001 | |||
| Experiment 2 | -4.0192* | 1.09623 | .002 | ||||
| Control 2 | -1.0962 | 1.09623 | .750 | ||||
| Control 2 | Experiment 1 | -3.2308* | 1.09623 | .020 | |||
| Experiment 2 | -2.9231* | 1.09623 | .044 | ||||
| Control 1 | 1.0962 | 1.09623 | .750 | ||||
| CT-Self Confidence | Experiment 1 | Experiment 2 | 3,100 | 43.891 | 2.1774 | .87161 | .066 |
| Control 1 | 8.3718* | .87161 | .000 | ||||
| Control 2 | 8.6987* | .87161 | .000 | ||||
| Experiment 2 | Experiment 1 | -2.1774 | .87161 | .066 | |||
| Control 1 | 6.1944* | .87161 | .000 | ||||
| Control 2 | 6.5214* | .87161 | .000 | ||||
| Control 1 | Experiment 1 | -8.3718* | .87161 | .000 | |||
| Experiment 2 | -6.1944* | .87161 | .000 | ||||
| Control 2 | .3269 | .87161 | .982 | ||||
| Control 2 | Experiment 1 | -8.6987* | .87161 | .000 | |||
| Experiment 2 | -6.5214* | .87161 | .000 | ||||
| Control 1 | -.3269 | .87161 | .982 | ||||
| Overall Disposition | Experiment 1 | Experiment 2 | 3,100 | 378.754 | 5.9020 | 2.27898 | .053 |
| Control 1 | 48.3290* | 2.27898 | .000 | ||||
| Control 2 | 48.4828* | 2.27898 | .000 | ||||
| Experiment 2 | Experiment 1 | -5.9020 | 2.27898 | .053 | |||
| Control 1 | 42.4270* | 2.27898 | .000 | ||||
| Control 2 | 42.5808* | 2.27898 | .000 | ||||
| Control 1 | Experiment 1 | -48.3290* | 2.27898 | .000 | |||
| Experiment 2 | -42.4270* | 2.27898 | .000 | ||||
| Control 2 | .1538 | 2.27898 | 1.000 | ||||
| Control 2 | Experiment 1 | -48.4828* | 2.27898 | .000 | |||
| Experiment 2 | -42.5808* | 2.27898 | .000 | ||||
| Control 1 | -.1538 | 2.27898 | 1.000 | ||||
Table 4.
Descriptive statistics regarding mathematic achievement test across pre-posttest design of control and experiment groups.
Table 4.
Descriptive statistics regarding mathematic achievement test across pre-posttest design of control and experiment groups.
| Variable | Design | Groups | Mean | Std. Deviation | n | |
| Mathematic Achievement | Pre-Test | Experiment 1 | 71.1538 | 8.16182 | 26 | |
| Experiment 2 | 74.6154 | 10.09189 | 26 | |||
| Control 1 | 72.1154 | 8.38726 | 26 | |||
| Control 2 | 71.7308 | 8.93782 | 26 | |||
| Total | 72.4038 | 8.89477 | 104 | |||
| Post-Test | Experiment 1 | 89.2308 | 6.58670 | 26 | ||
| Experiment 2 | 81.1538 | 9.72704 | 26 | |||
| Control 1 | 71.7308 | 6.62455 | 26 | |||
| Control 2 | 74.6154 | 8.35740 | 26 | |||
| Total | 79.1827 | 10.33682 | 104 | |||
Table 5.
Tukey F Post-hoc results regarding mean differences of mathematic achievements for experiment and control groups across pre-posttest design.
Table 5.
Tukey F Post-hoc results regarding mean differences of mathematic achievements for experiment and control groups across pre-posttest design.
| Groups | df | F | Mean Difference | Std. Error | Sig. | |
| Experiment 1 | Experiment 2 | 1,3 | 7.649+ | .3077 | 1.09623 | .992 |
| Control 1 | 4.3269 | 1.09623 | .001 | |||
| Control 2 | 3.2308 | 1.09623 | .020 | |||
| Experiment 2 | Experiment 1 | -.3077 | 1.09623 | .992 | ||
| Control 1 | 4.0192 | 1.09623 | .002 | |||
| Control 2 | 2.9231 | 1.09623 | .044 | |||
| Control 1 | Experiment 1 | -4.3269 | 1.09623 | .001 | ||
| Experiment 2 | -4.0192 | 1.09623 | .002 | |||
| Control 2 | -1.0962 | 1.09623 | .750 | |||
| Control 2 | Experiment 1 | -3.2308 | 1.09623 | .020 | ||
| Experiment 2 | -2.9231 | 1.09623 | .044 | |||
| Control 1 | 1.0962 | 1.09623 | .750 | |||
Disclaimer/Publisher’s Note: The statements, opinions and data contained in all publications are solely those of the individual author(s) and contributor(s) and not of MDPI and/or the editor(s). MDPI and/or the editor(s) disclaim responsibility for any injury to people or property resulting from any ideas, methods, instructions or products referred to in the content. |
© 2023 by the authors. Licensee MDPI, Basel, Switzerland. This article is an open access article distributed under the terms and conditions of the Creative Commons Attribution (CC BY) license (http://creativecommons.org/licenses/by/4.0/).
Copyright: This open access article is published under a Creative Commons CC BY 4.0 license, which permit the free download, distribution, and reuse, provided that the author and preprint are cited in any reuse.


