Submitted:
25 July 2023
Posted:
26 July 2023
You are already at the latest version
Abstract
Nowadays, people like to travel to alleviate the stress and depression in their busy lives, and if they can do so at a low cost, it will be even more beneficial to them. The usual way for a traveler to book a ticket or to contact a travel agency is to book a ticket. It becomes more expensive for travelers. Due to the lack of vehicle management, travel agencies don’t get their appropriate profit. In this journal, we have provided proficient solutions for vehicle optimization to minimize travel costs. However, when travelers want to travel, they don’t find a proper tour guide, and it is sometimes expensive to arrange a proper tour guide. Moreover, travelers often don’t find a suitable package, and occasionally they do not know the place where they may want to visit. In this paper, we have discussed how we used effective methods to reduce vehicle costs for tour purposes. Further, we have developed a solution where bus seats are optimally occupied, and the package system and tour guide are included in it. We have also added a blog portal to our web-based software to introduce all tourist places and their information. In this journal, the proposed optimal vehicle usage system has been developed using Hypertext Markup Language (HTML), Cascading Style Sheets (CSS), the Tailwind Framework, React, and Node.js.
Keywords:
Travel agency
; Optimize
; Vehicle
; Tourist
; Tour
1. Introduction
Recently, we have observed that the craziness of tourism is rising day by day in Bangladesh. For this reason, tourists have been interested in visiting those beautiful spots. But they must learn the proper process and details for visiting any place. Thus, our main aim has been to reduce travel and agency costs. When they first thought of traveling, travelers wanted good agencies and a low cost to arrive at their destination. Likewise, travel agencies seek good profits from their services. Our main focus is on how travel agencies have achieved their profit goals.
Many research papers and developments have been done using machine learning in recent years. When the tourist season is running, many tourists visit the tourist spots. The documents and development have been done in this area, giving them a leisurely tour. In the previous research paper, we discussed how many tourists make use of group trip planning, package, and blog systems, mobile tourist guides, etc.
In previous research papers and systems, the author and developer worked only for travelers; they don’t work for tour agencies. We know that tour agencies are the biggest part of the tourism system. For these things, the previous author and developer didn’t get success.
We developed a system that is better than previous implementations. Let’s assume that locations A and B have the same routes: 52 travelers travel to location A, while only 20 travel to location B. But there are only 36 seats per bus. Therefore, in this situation, two buses are needed for location A and one bus for location B. Here, we look at all the bus seats that have yet to be occupied. Travel costs have been too high because we must utilize our optimized system. We have aimed to maximize vehicle costs for travel agencies and travelers.
There are some new features in our system. Travel agencies can optimize their vehicles using our system, which is a unique feature of our system. On the other hand, for this optimization, the traveler’s cost is also reduced. We proposed our service as Static Group Trip Planning (SGTP).
Our result is good for both travel agencies and travelers. Because of this system, travelers can travel easily at a low cost, and travel agencies can earn more profit.
To optimize vehicle usage for tour purposes, we utilized a database table. This table contained information such as the number of passengers, the distance of the trip, the route, and the type of vehicle needed. Using this information, we determined the optimal vehicle for each tour and minimized the number of empty seats on each trip.
Our findings have been segmented into the blog, booking, and package segments. In the blog segment, we discuss the tourist spot. In the booking segment, we provide customers with information on how they can book tours. Finally, in the packaging segment, we offer tour packages.
Our research has shown that optimizing vehicle usage for tour purposes can lead to cost savings and improved customer satisfaction. By utilizing a database table and segmenting our findings into blog, booking, and package segments, we have provided valuable insights and tools for tour agencies and customers alike.
The main contributions of this paper are as follows:
- To develop a system that allows travel agencies to minimize vehicle usage.
- To optimize the costs of providing low-cost, high-value services to travel agency customers.
- To develop an optimization process, it will be allowed to reduce the environmental carbon footprint.
- To analyze the graphical representation can understand quality attributes.
The journal has been organized as follows: Section II introduces the literature reviews. Section III describes the methodology of our proposed system. Section IV shows the experimental analysis. Section V mentions the performance evaluation. Section VI describes the limitation and future works of our proposed method. Finally, Section VII describes the conclusion.
2. Related Works
In paper [1], they have provided the concept of a "dynamic group." Their main approach is to provide a dynamic group trip. As a result, they provided two approaches: the Naive approach and the Fast approach. Finally, they have selected the FAST approach for their work because it is efficient. The extensive experiments and synthetic data sets show that their approach is, on average, 99.74 % faster and requires 94 % less I/Os than the naive approach.
An entirely web-based tour and trip management system are presented by the author in this paper [2]. Here, they have raised the issue that it is more difficult for travelers to look for additional packages, contact them for information, and communicate with them to make travel arrangements. Therefore, the author has developed a website where visitors can browse all products according to location. A traveler can also see a description of the location. Additionally, they offer a Google Map with the location’s distance, lodging, and travel choices.
The author of this paper has suggested group travel preparation (GTP) [3]. A group trip planning (GTP) search returns points of interest (POIs) for various establishments, including a mall, eatery, and theatre. Occasionally, a group member who lives a long distance away from another must determine the collection of POIs that minimizes the group’s total journey distance. The author creates approximate methods for GTP inquiries for road networks and Euclidean space in this article. They presented unique strategies to expand the POI search space for the GTP question based on the geometric features of ellipses. It will greatly lower the overall mileage of trips.
In their paper [4], they addressed the problem of routing a fleet of vehicles from a central depot to customers with known demand. Routes originate and terminate at the central depot and obey vehicle capacity restrictions. Typically, they have assumed that all vehicles are identical. In their work, they have relaxed the homogeneous fleet assumption. The objective is to determine the optimal fleet size and mix by minimizing a total cost function that includes fixed and variable cost components. They also have described several efficient heuristic solution procedures, techniques for generating a lower bound, and an underestimate of the optimal solution. Finally, they have presented some encouraging computational results and suggestions for further study.
They have found that the significant issue for the shared use of autonomous vehicles is how to project serving routes efficiently [5]. From another perspective, they have seen that this issue could be understood as segmenting the maximum number of passengers into groups. Therefore, in their paper, they intended to investigate passengers’ similarities instead of directly matching autonomous vehicles and passengers. They aim to determine the minimum number of groups and assign each group autonomous vehicles. So, they have proposed a cluster-based algorithm to classify passengers. Numerical experiments with both small and large demands have been performed to present the validity of the proposed algorithm. Also, they have shown that the cluster-based algorithm could minimize the number of vehicles and total travel distance. At last, they have shown that vehicle capacity will have little impact when the number of seats exceeds four, and time windows could continuously influence gathering passengers using sensitivity analysis of critical parameters.
In their paper [6], they find out that mobile tourist guides have assisted travelers in choosing places to visit. The author has shown interest in this study considering the attraction of mobile tourist guides. In this paper, they extend collaborative travel recommendation systems by utilizing filtering techniques to save information such as the current user’s location, time, weather conditions, and places already visited. They also work on context-aware ratings from the wireless sensor network.
Tourism is a government priority because it is the potential largest contributor to national foreign exchange, so the government’s management of the tourism sector needs improvement [7]. Travel agencies handle tour and traveler registration, booking, payment, trip packaging, cancellation, etc. This is a common issue in many processing and recording errors. So, in this paper, the author wants to solve this problem by using the waterfall approach used to build the information system. UML is used for design, PHP is used as a programming language, and they used SQL to connect servers, set databases, and store data.
In this paper [8], they proposed that the internet today has achieved tremendous time and financial savings that have allowed it to alter its name to "e-commerce" in the web-based world. It offers travel services, including ticket bookings and hotel reservations. The Tours and Travels System is a web-based application project that allows you to manage multiple booking types from a single application.
We have found some works from the web portal, GitHub projects, Facebook pages, and Play Store. We have found some web-based software [9,10,11]. In [9], this web-based software, has provided tour packages, booking systems, blogs, and descriptions of many tourist places in Bangladesh and abroad. They also provide a special service for visas and passports. Further, in [10], this web portal offered information about ticket prices, available transportation, and an online booking option for all bus travelers. They have introduced this facility for the first time in Bangladesh. Online ticket booking is only one part of their service; they have also automated the front-office e-ticketing operations and the back-office accounting systems of transportation companies. In [11], this web-based software provides bus, train, and launch tickets. In just a few minutes, users discover hundreds of operators and routes, compare prices, and enjoy the best deals and safeguards.
In [12,13], the developer has proposed their work as a Facebook page-based. In [12], there are several reasons to travel, according to the page’s admin, including adventure, leisure, budget, new discoveries, and moving on. Whether one needs inspiration, information, planning advice, or just plain escapism, ”Travelers of Bangladesh” is there to help. The admin has proposed the main objectives of the group, which are inhumane low-cost travel and profitable tours [13]. People should be given the courage and intelligence to travel on their own so that they don’t have to compete with hundreds of groups in the market. It’s fun to discover the joys of travel (on the roof of a bus, on the deck of a ship, on the roof of a chariot, or sitting on the ground). Many people occasionally experience life as boring. Give them a tour, tell them something, and keep them amused (within limits, of course). Many people desire to save money by selecting inexpensive tours. People who give Alisan tours or are used to giving should come and share the most fun at the lowest price.
In [14], the developer proposed their work via a mobile application. In mobile application [14], they have provided several bus transport services. Bus Ticket BD is a free Android application. When someone wanted to go on a vacation, this one-of-a-kind application provided some of the most important features. It might be extremely challenging to find terminals, online travel agencies, schedules, preferred seats, and arrival and departure locations. To solve these kinds of problems, it introduced an Android application named “Bus Ticket BD." This application is very helpful for finding their favorite bus services, nearest bus terminals, schedules, and even their favorite seats. They can even contact them using their cell numbers.
This paper [15], describes a new framework for preserving user privacy in location-based services when conducting group nearest neighbor (GNN) queries. GNN queries involve finding a meeting place that minimizes the aggregate distance from a group of users. The proposed framework uses a decentralized architecture and has users provide their locations as regions instead of exact points to a location service provider (LSP) to protect their privacy. The LSP returns a set of candidate answers that includes the actual GNN, and a private filter is developed to determine the actual GNN without revealing user locations to any party, including the LSP. An efficient algorithm to evaluate GNN queries with respect to imprecise locations is also proposed. The effectiveness of the proposed technique is demonstrated through an extensive experimental study.
The article [16] discusses a new type of query in Spatial Databases, called the Trip Planning Query (TPQ). TPQ retrieves the best trip that starts at a given starting point, passes through at least one point from each category of points of interest in space, and ends at a given destination. The paper presents fast approximation algorithms for TPQ in a metric space, addressing the difficulty of the query due to the multiple choices per category. The approximation algorithms have varying ratios that depend on either the number of categories, the maximum number of points per category, or both, and all run in polynomial time. The paper also proposes efficient heuristics for large data sets stored in external memory using some of the proposed algorithms. An experimental evaluation of the proposed algorithms is conducted using synthetic and real data sets.
This paper [17] presents a novel spatial-social optimization problem, called Optimal Group Route, for multi-user itinerary planning in location-based applications. The problem formulation allows users to specify individual sources, destinations, preferences on Point-of-Interest (POI) categories, and distance constraints. The goal is to find an itinerary that can be traversed by all users while maximizing the group’s preference of POI categories in the itinerary, considering the agreement and disagreement among group members. The article proposes two efficient greedy algorithms with bounded approximation ratios, an exact solution that computes the optimal itinerary by exploring a limited number of paths in the road network, and a scaled approximation algorithm to speed up the dynamic programming employed by the exact solution. The proposed solutions are evaluated on two real-world road network/POI data sets, and the results confirm their effectiveness and efficiency. The article contributes to advancing existing group trip planning studies by maximizing the group’s social experience.
This paper [18] proposes a new type of trip planning query, called Subgroup Trip Planning (SGTP) query, which allows a group to identify the subgroup and points of interest (POIs) from each required type (e.g., restaurant, shopping center, movie theater) that have the minimum aggregate trip distance for any subgroup size. The paper highlights that the computation of POI sets for all possible subgroups using group trip planning (GTP) algorithms is prohibitively expensive. Therefore, the paper proposes an algorithm to compute answers for different subgroup sizes concurrently with less query processing overhead. The paper focuses on both minimizing the total and maximum trip distance of the subgroup. The proposed algorithms are evaluated on real and synthetic datasets, and the experiments show their efficiency.
In [19], discusses the growth of location-based social networks and the emergence of a new query type called group trip planning (GTP) query. GTP query involves a group of individuals trying to minimize the total travel distance for all members when planning a trip to different locations, such as a restaurant and a movie theater. The passage also mentions the development of efficient algorithms to answer GTP queries, which were tested through extensive experiments.
This paper [20], discusses the integration of social networks and spatial road networks to create a spatial-social network, which can be used for various applications such as trip recommendations. The paper focuses on a new query type called group planning query over spatial-social networks (GP-SSN), which retrieves a group of friends with common interests on social networks and spatially close points of interest (POIs) on spatial road networks that match the group’s preferences and have the smallest traveling distances. The paper proposes effective pruning methods and indexing mechanisms to facilitate the GP-SSN query processing and develops efficient GP-SSN query answering algorithms. The proposed approaches are evaluated through extensive experiments.
In this paper [21] introduces a new type of trip planning query called subgroup trip planning (SGTP) query, which enables a group to identify the subgroup and the points of interest (POIs) from each required type that have the minimum aggregate trip distance for any subgroup size. The paper proposes an algorithm to compute answers for different subgroup sizes concurrently, which reduces the query processing overhead. The algorithm aims to minimize both the total and maximum trip distance of the subgroup. The efficiency of the algorithm is demonstrated through experiments using both real and synthetic datasets.
This paper [22] authors discusses the importance of the tourism sector in many countries, including Bangladesh, as a vital sector that contributes to foreign exchange earnings and employment creation. The paper observes the overall situation of strategic management of the tourism sector and its contribution to the economy. The authors suggest that by improving the efficiency and effectiveness of tourism services and providing better facilities, both local and foreign tourists will be encouraged to tour for different reasons. They argue that a holistic approach, through public and private sector partnerships and strategic leadership, can create new opportunities, strengthen capacity building, and minimize weaknesses and threats. Overall, the paper emphasizes the potential for the tourism sector to contribute to the Gross Domestic Product (GDP) of the country.
3. Methodology
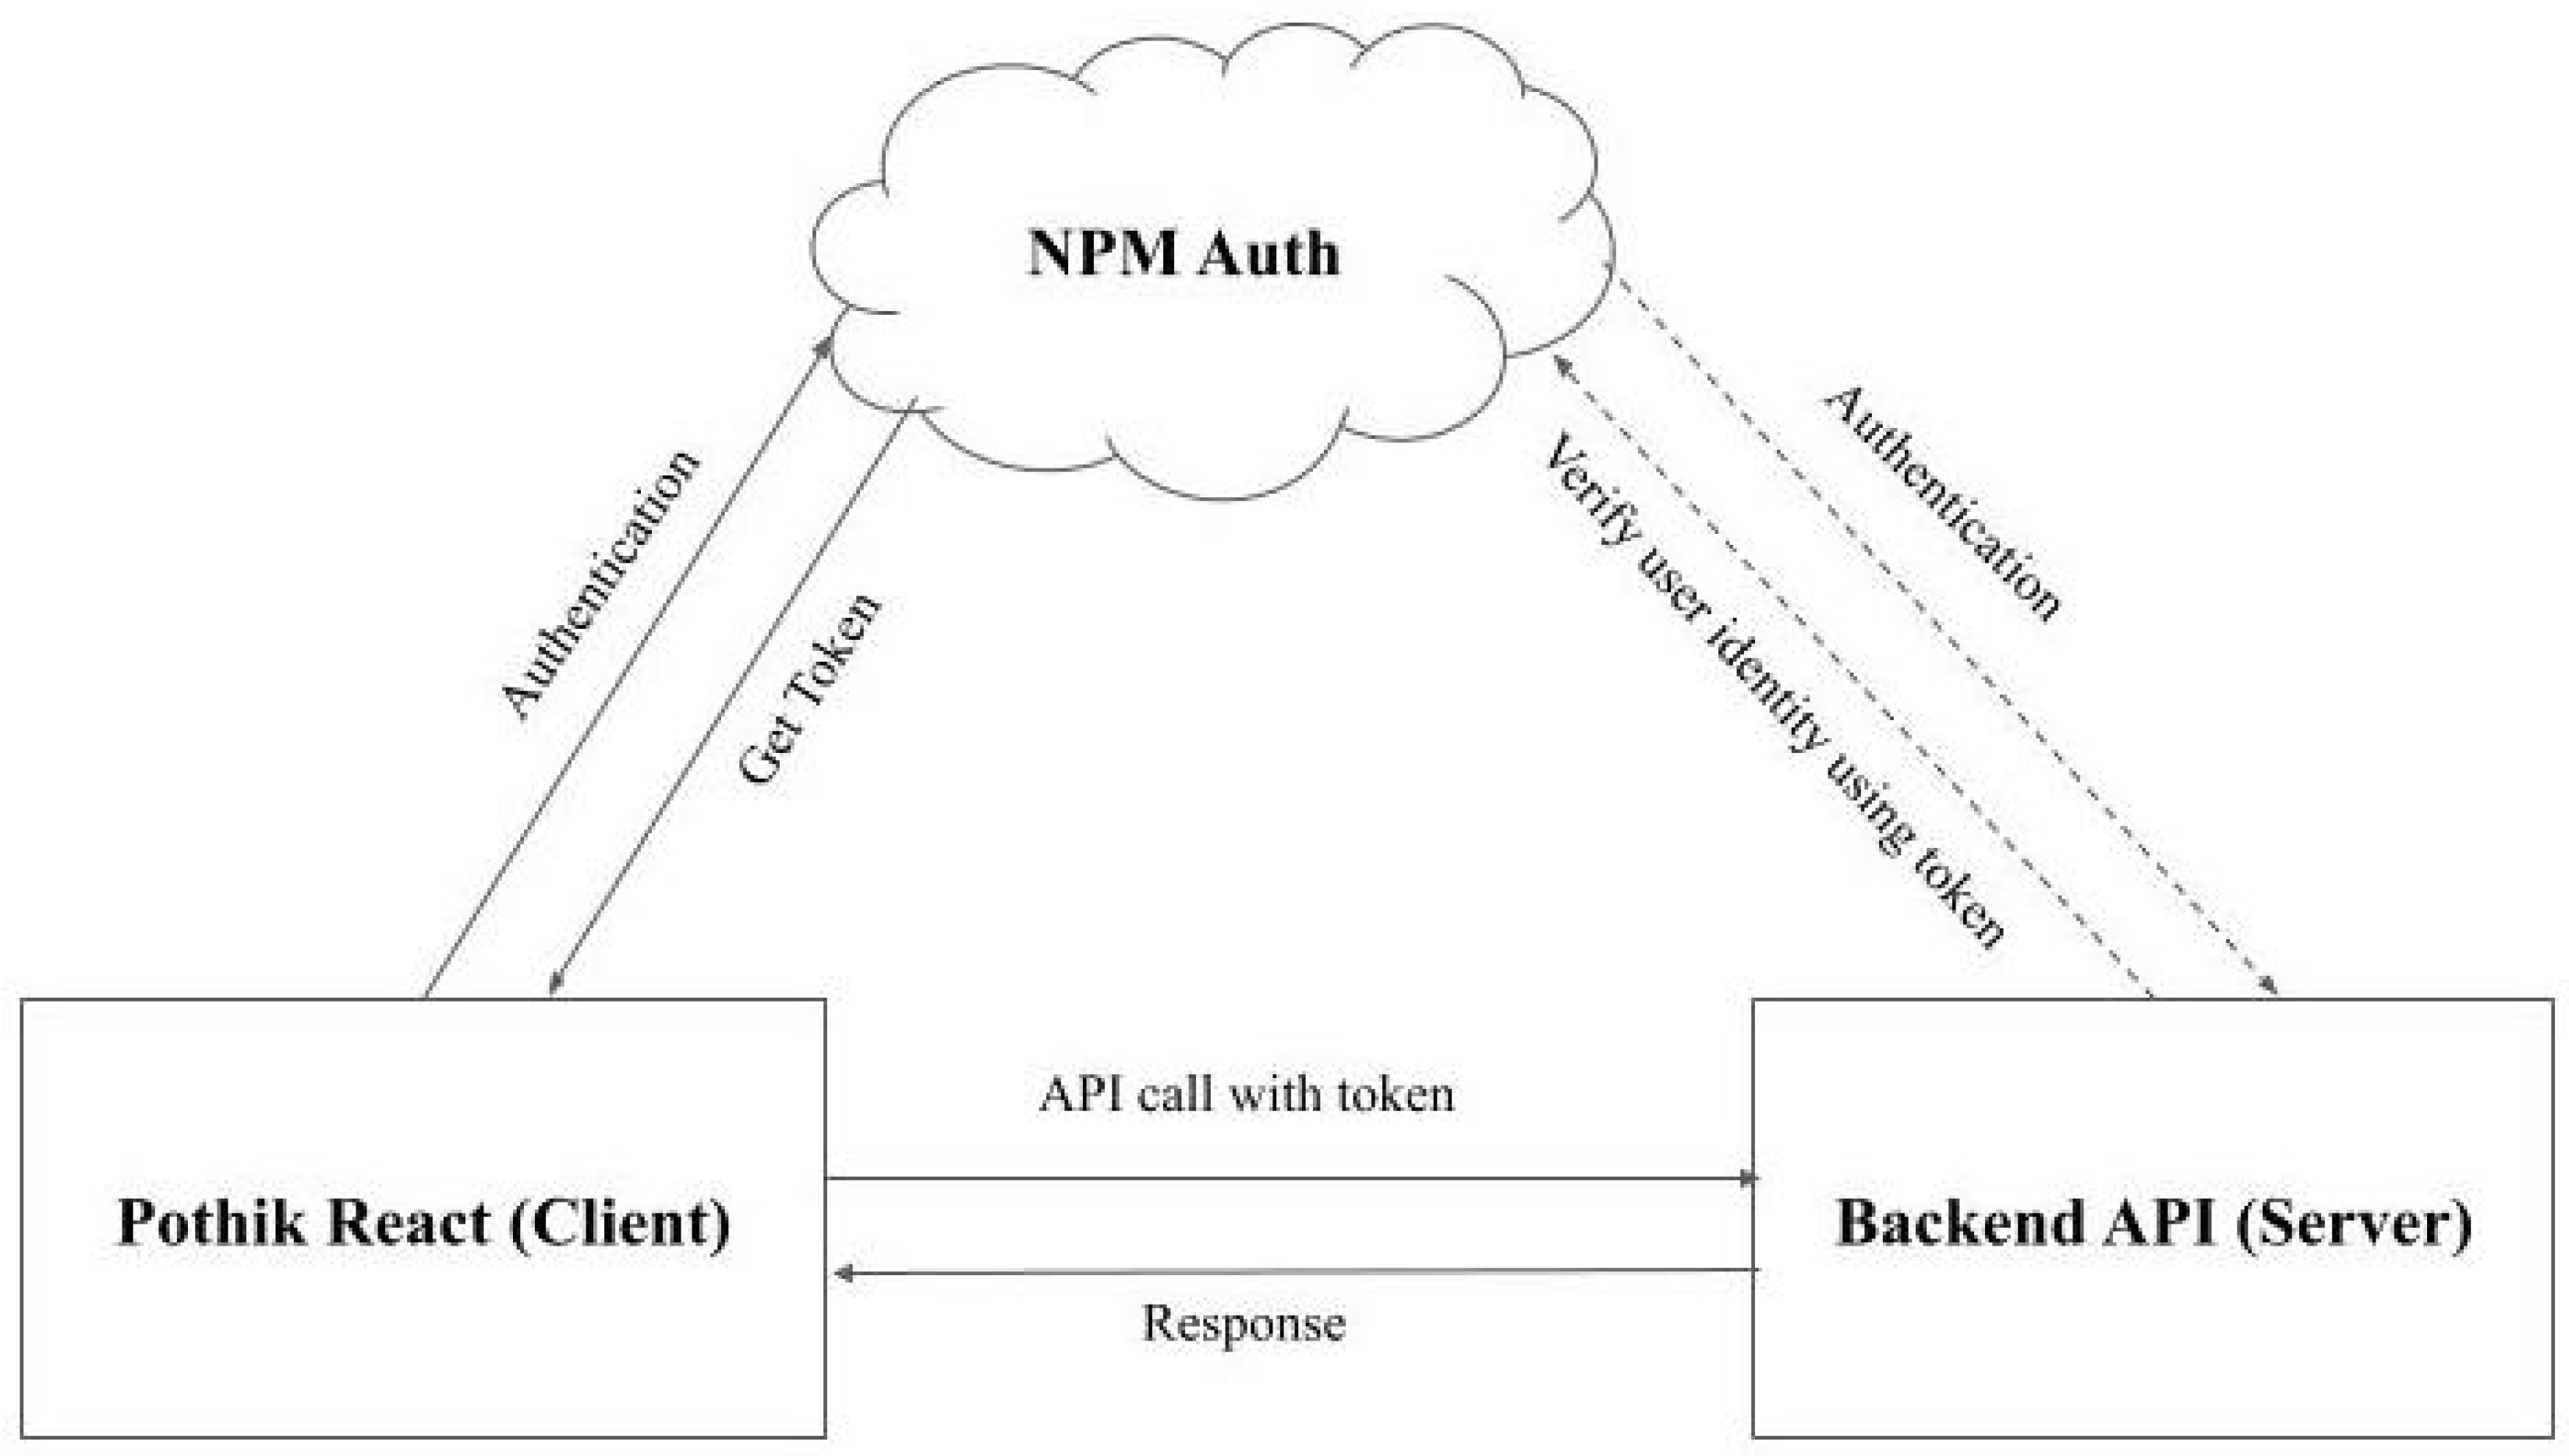
We considered a system where travelers could solve their travel problems. Sometimes travelers do not find their proper destination or a low-budget tour package. For this reason, they face a high budget problem. In our system, they can find the package at a low cost. When he clicks on the package option, they find out the details of the package and also finds out about the booking option. Then they can choose their package and book it. Besides, they can see the blog about tourist spots. If they click these, they can see the blog. On the other hand, travel agencies can increase their profits by optimizing their vehicles. On our admin page, we created an optimization button. Here we use the database in our back end, which can help with optimization. So, when the administrator clicks this button, the vehicle will be optimized.
Figure 1.
Client Server Communication.
3.1. Database Model
Here is our database table design for optimizing vehicles.
In Figure 2, we can introduce our database table, where we can see the package table and full database table as well. Here, the K city package sends a request to the database table including package id, package name, route, all passengers of this package, and the bus’s total seats. Then the database table sends the K city package as a response with all information of 2 packages for which buses will be optimized. On the other hand, optimization (OP) sends a request using a like search query for searching a route, and then the database table sends a response to a similar route package.
In this section, we mention an algorithm for the database table.
| Algorithm 1 pseudo-code for seat optimization. |
| single package data const K city = [ {} ] const closeRoute = [ {} ] const ReleventRoute = closestRoute.filter () if (ReleventRoute.Passengers.length > ReleventRoute.Seat) then if (ReleventRoute.Passengers.map(P)= >) then if (!P.group) then K.passenger.push(p)) end if break end if end if |
Here we write down the pseudo-code for single package data. This code initializes two arrays: "K city" and "closeRoute" which contain objects. It then filters the "closestRoute" array and assigns the result to a new array called "ReleventRoute".
The code then checks if the number of passengers in the "ReleventRoute" array is greater than the number of available seats. If this condition is true, it proceeds to iterate through each passenger in the "Passengers" array and checks if they belong to a group. If a passenger does not belong to a group, it adds the passenger to the "K city" array and breaks out of the loop.
In summary, this code filters a "closestRoute" array to find a relevant route, then checks if there are enough available seats to accommodate all the passengers. If there are not, it adds individual passengers who are not part of a group to the "K city" array.
We can see here another problem which is the distance mapping problem. For solving this problem we can use Dijkstra’s algorithm and Bellman-Ford’s algorithm.
Dijkstra’s algorithm is commonly used to find the shortest path in a graph. In this case, we need to modify the algorithm slightly to find the closest route in the RC to route i using the distance function d(i, j).
Step 1: Initialize
Create a set of unvisited nodes U and set it to contain all the routes in RC. Create a map of distances dist, where dist[i] represents the distance from route i to the starting route.Set dist[i] = infinity for all routes i except the starting route, where dist[starting_ route] = 0.Create a map of previous nodes prev, where prev[i] represents the previous route on the shortest path from the starting route to route i.
Step 2: While U is not empty
Find the route u in U with the smallest distance dist[u].
Remove u from U.
Step 3: For each neighboring route v of u
| Algorithm 2 pseudo-code for tentative distance from the starting route to v. |
| distance _ through _ u = dist[u] + d(u, v) if (distance _ through _ u < dist[v]) then Update dist[v] = distance _ through _ u Update prev[v] = u Return prev end if |
We also can use the Bellman-Ford algorithm. Here’s a standard implementation of the Bellman-Ford algorithm for finding the closest route in RC to route i using the distance function d(i, j).
Step 1: Initialize
Create a list of distances dist, where dist[i] represents the distance from route i to the starting route. Set dist[i] = infinity for all routes i except the starting route, where dist[starting _ route] = 0. Create a list of previous nodes prev, where prev[i] represents the previous route on the shortest path from the starting route to route i.
Step 2: Repeat the following steps for RC -1 times
For each route u in RC
For each neighboring route v of u
| Algorithm 3 pseudo-code for distance from the starting route to v through u. |
| distance _ through _ u = dist[u] + d(u, v) if (distance _ through _ u < dist[v]) then Update dist[v] = distance _ through _ u Update prev[v] = u end if |
Step 3: Check for negative-weight cycles
Repeat the following steps for each route u in RC
For each neighboring route v of u
| Algorithm 4 pseudo-code for distance from the starting route to v through u. |
| distance _ through _ u = dist[u] + d(u, v) if (distance _ through _ u < dist[v]) then Report the presence of a negative-weight cycle Return prev end if |
3.2. Mathematical Model
We have defined several variables to represent different aspects of a transportation system.
Firstly, SK represents the total number of seats available in the city buses operating in K city. This variable helps us understand the capacity of the buses in K city, allowing us to determine the maximum number of passengers that can be accommodated in the buses at any given time.
Secondly, SC represents the total number of seats available in the city buses operating in B city. Similar to SK, this variable provides us with information about the seating capacity of the buses in B city. It helps us gauge the maximum number of passengers that can be transported in the buses in B city.
Moving on, PC represents the passenger list for the destination in B city. This variable contains the details of the passengers who intend to travel to B city. It may include information such as passenger names, contact details, and specific travel requirements. By referencing the passenger list, transportation authorities can efficiently manage passenger bookings and ensure a smooth travel experience for everyone.
Next, PK represents the passenger list for the destination in K city. Similar to PC, this variable comprises the details of passengers who are planning to travel to K city. It assists in organizing and coordinating passenger information for a seamless journey.
Then, RK represents the route list for the destination in K city. This variable encompasses the various routes available within K city, along with specific information such as bus stops, schedules, and distances. The route list is crucial for bus operators and passengers alike, as it provides essential guidance and aids in planning the most efficient and convenient travel routes within K city.
RC represents the route list for the destination in B city. This variable contains information about the available routes within B city, including bus stops, schedules, and distances. It helps both bus operators and passengers in planning the most efficient and convenient travel routes within B city.
Lastly, d(i, j) represents the distance between route I in K city and route j in B city. This variable quantitatively measures the distance between specific routes in K and B cities. It allows transportation authorities to assess and compare the distances between different routes, aiding in decision-making processes related to route planning and optimization.

Table 1.
Symbol & Notation.
| Symbol | Meaning |
|---|---|
| number of seats in K city buses | |
| number of seats in B city buses | |
| passenger list in B city destination | |
| passenger list in K city destination | |
| route list in K city destination | |
| route list in B city destination | |
| distance between route i in K city and route j in B city |
Then, the algorithm can be represented as follows:
- 1.
-
For each route i in :
- (a)
- Find the closest route j in to route i using .
- (b)
- If there are vacant seats in K city buses, then search for potential passengers in B city destination.
- (c)
-
If potential passengers are found:
- i.
- Check the passenger list for the total number of passengers.
- ii.
- If the total number of passengers is greater than the total number of vacant seats in K city buses, then add the passengers to the K city passenger list .
- iii.
- Otherwise, do nothing.
- 2.
- Return the updated passenger list .
This mathematical model outlines the steps involved in searching for potential passengers in B city destination to fill up vacant seats in K city buses. The distance between routes is used to find the closest route in B city destination. The passenger list is checked to ensure that the number of passengers does not exceed the number of vacant seats in K buses.
3.3. Matrix Representation
A matrix is a structured arrangement that consists of rows, columns, and individual elements. The size or dimensions of a matrix are determined by the number of rows and columns it possesses.
Here,
Now,
D be a matrix of distances between all routes in K city and B city, where D(i, j) represents the distance between route I in K and route i in B city. The size of D is RK x RC.
PC be a row vector representing the passenger list in B city destination, where PC(j) represents the number of potential passengers on route j in B. The size of the PC is 1 x RC.
PK be a row vector representing the passenger list in K city destination, where PK(i) represents the number of passengers on route I in K. The size of PK is 1 x RK.
SK be a scalar representing the number of vacant seats in K city buses.
Now, let’s go through the algorithm steps using the given matrices:
Step 1: Find the closest route in B city to each route in K city using the distances in D:
For Route 1 in K city: Closest route in B city is Route 3 (D(1,:) = [10, 20, 30], closest distance is 30)
For Route 2 in K city: Closest route in B city is Route 3 (D(2,:) = [15, 25, 35], closest distance is 35)
For Route 3 in K city: Closest route in B city is Route 1 (D(3,:) = [12, 22, 32], closest distance is 12)
So, j* = [3, 3, 1]
Step 2: Check if there are vacant seats in K city buses (SK > 0):
Assuming SK = 4 (4 vacant seats)
Step 3: Search for potential passengers in B city destination:
For Route 1 in K city: PC(3) = 2 (potential passengers on Route 3 in B city)
For Route 2 in K city: PC(3) = 2 (potential passengers on Route 3 in B city)
For Route 3 in K city: PC(1) = 5 (potential passengers on Route 1 in B city)
Step 4: Check the passenger list PC for the total number of passengers (sum(PC) > 0):
sum(PC) = 2 + 2 + 5 = 9
Step 5: If the total number of passengers is greater than the total number of vacant seats in K city buses, then add the passengers to the K passenger list PK:
Since sum(PC) = 9 > SK = 4, we add passengers to PK.
Step 6: Update the passenger list PK:
For Route 1 in K city: PK(1) += PC(3) = 2 + 2 = 4
For Route 2 in K city: PK(2) += PC(3) = 1 + 2 = 3
For Route 3 in K city: PK(3) += PC(1) = 3 + 5 = 8
Step 7: Update the passenger list PC:
For Route 1 in K city: PC(3) -= SK = 2 - 4 = -2 (assuming negative values represent no passengers)
For Route 2 in K city: PC(3) -= SK = 2 - 4 = -2
For Route 3 in K city: PC(1) -= SK = 5 - 4 = 1
The updated matrices would be:
4. Experimental Analysis
We conduct the experiments and execute HTML, CSS, the Tailwind Framework, React, and Node.js in different software to successfully our website. By using this language we design our front-end and back-end design. This website includes package options for tourists, blogs, booking options, etc. For our experiment purpose, we set an optimization option on our website. Here we show the final result of our website.
4.1. Result
In this section, we show some UI designs of our website. Here we find out the user page and the admin page both. First of all, we will describe the user page of UI design in a tabular form. Then we will show the admin page as a picture.
Table 2.
Tabular form of User Page.
| Name of feature in User Page | Short Description |
|---|---|
| Navigation Bar | In this section, we provide our software name and logo. Besides, we mention the home, profile, package, blog, and about us. We also mention the search option and notification option. |
| Slider | Here users see the book option. Tourists can book their tour by clicking here. |
| Package | In This section, we mention all of the blogs of tourist spots. Users can see the package details by clicking this option. They can also book their tour by clicking "Book Your Tour" which we mention here. |
| Blog | User can see the blog of tour spots details. They can also book their tour by clicking "Book Your Tour" which we mention here. |
| Payment | When users want to book a package, they should pay some amount as advance payment. |
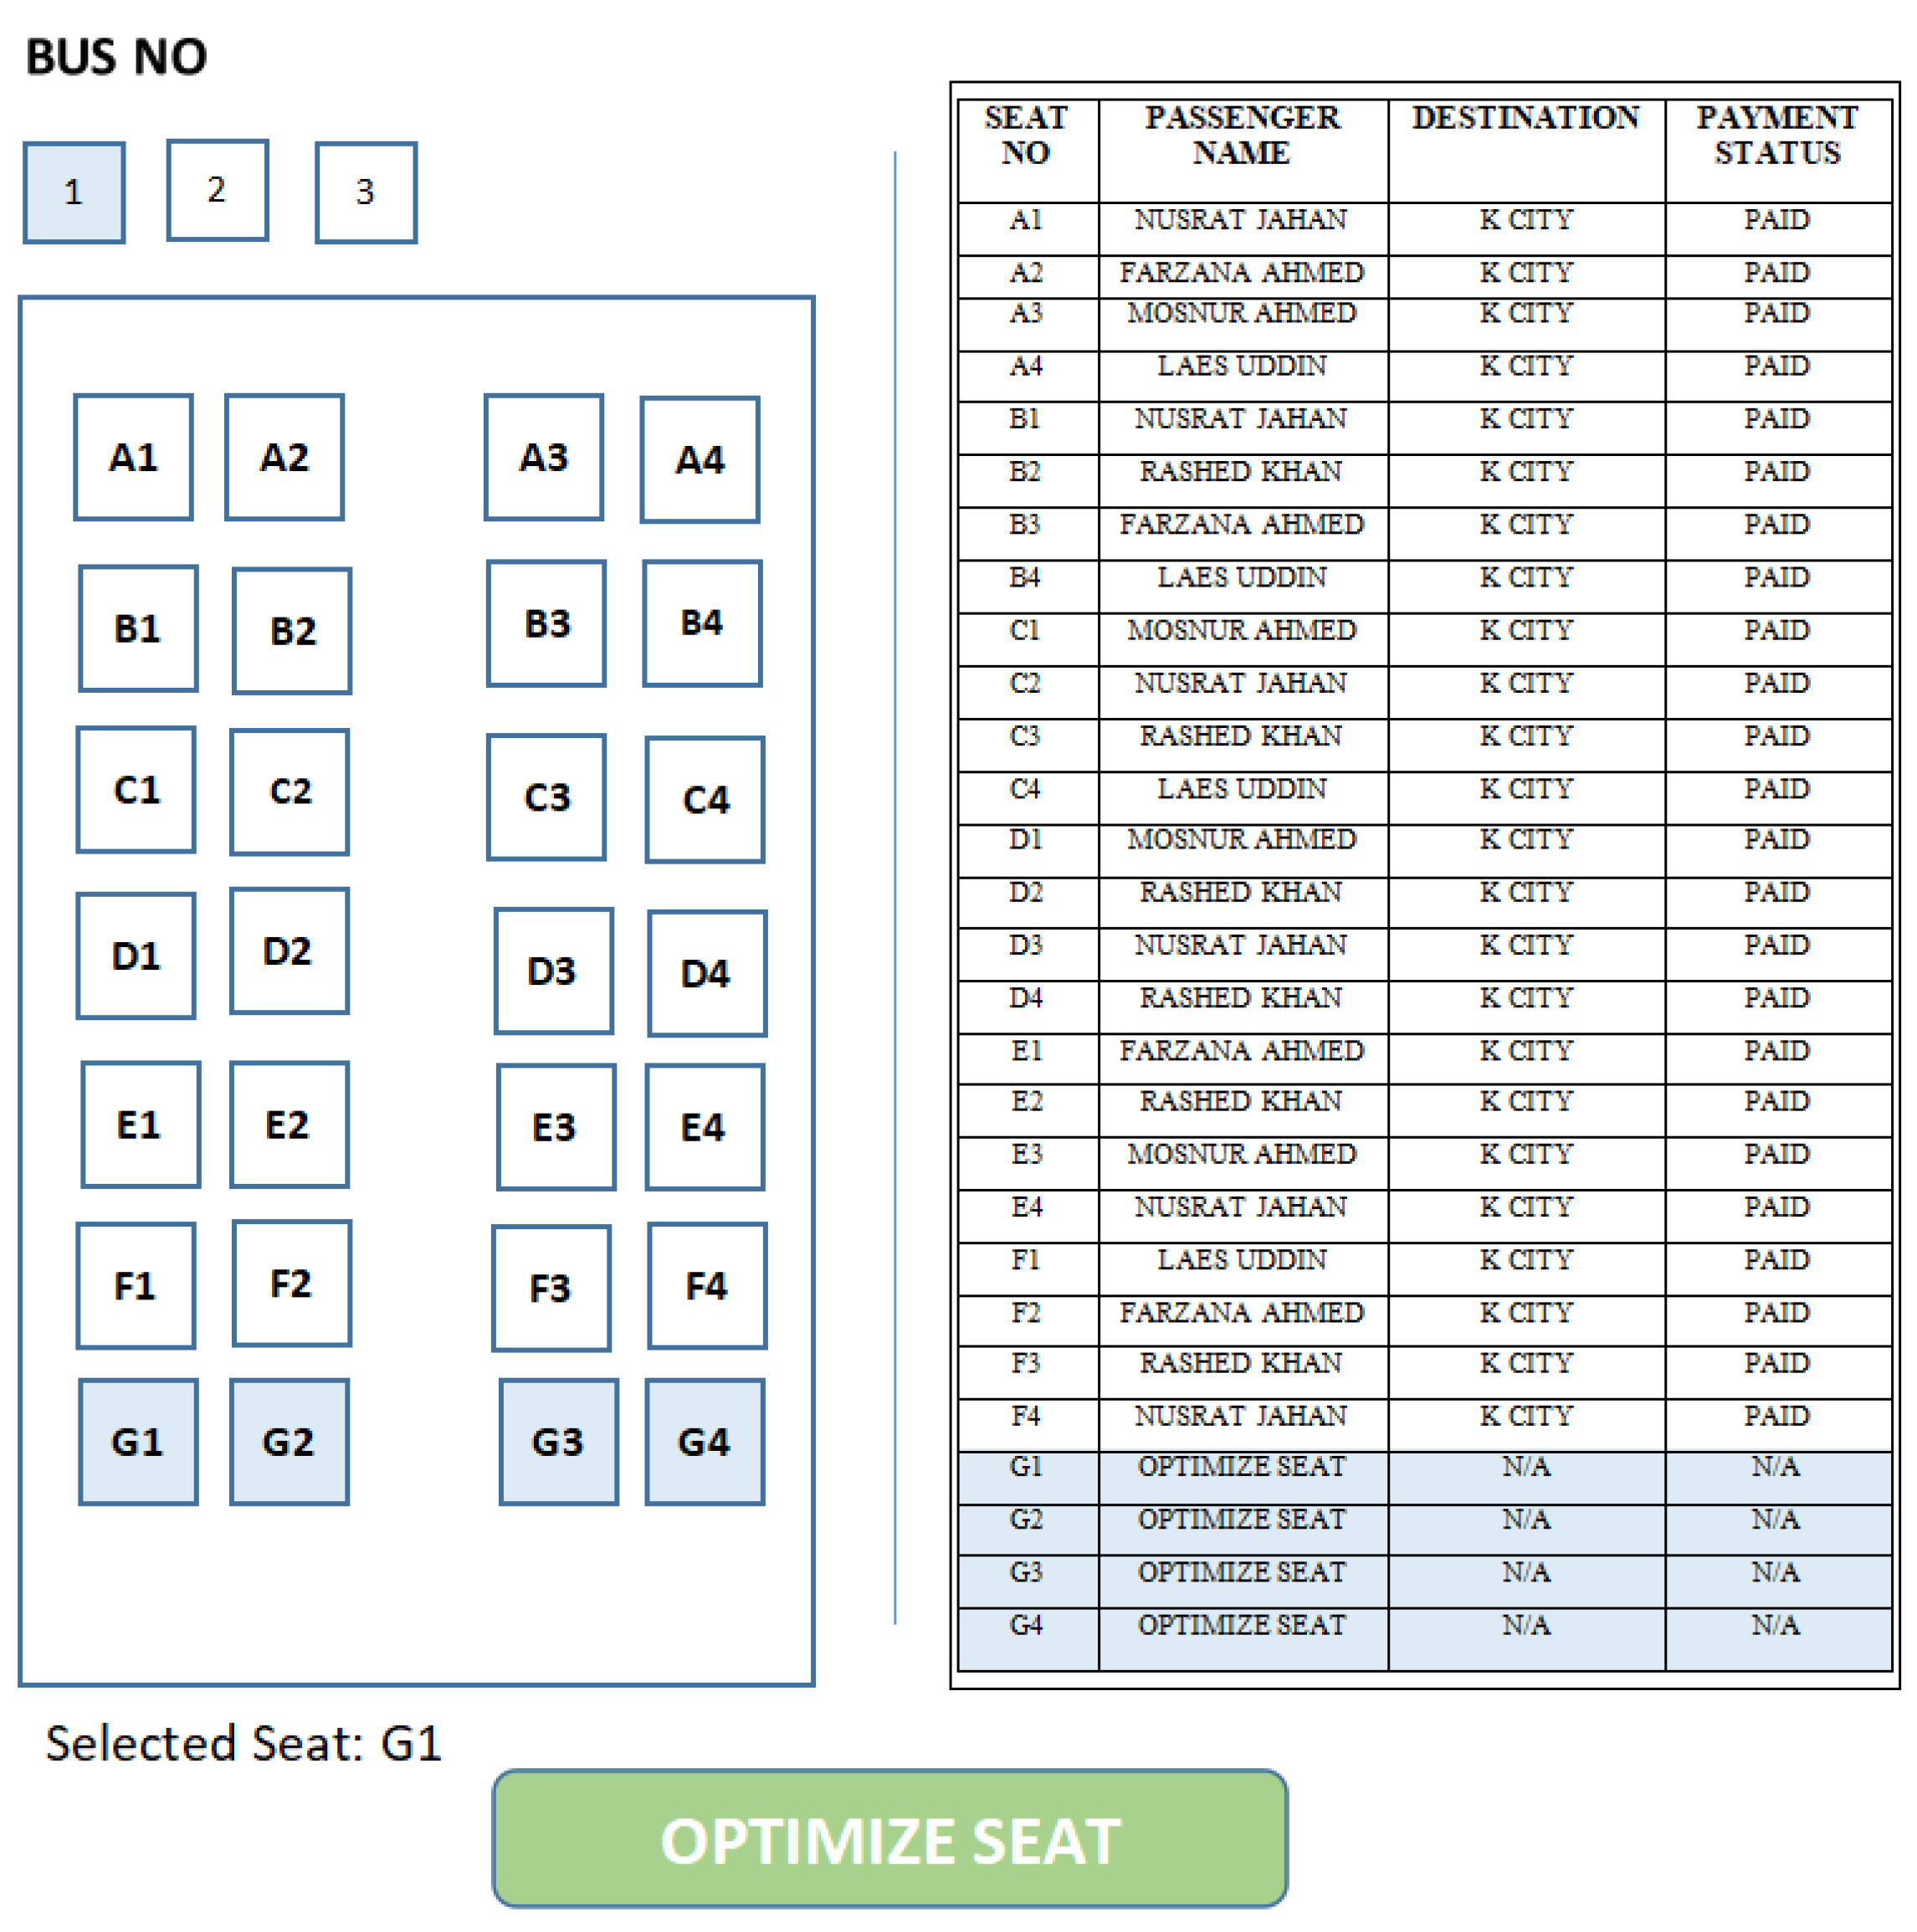
Using this interface admin can optimize the bus for every city. Besides, here we mention the seat number, tourist list also with his destination, and also payment status. On this page admin also can see the navigation bar, search option, and notification option.
Figure 3.
Admin Page.
5. Performance Evaluation
The methodology section discusses the database and mathematical models with a matrix. We can implement our project in these two ways, but we decide on an efficient approach for the final work. A database model is an efficient approach from our side.
A database model is efficient for our project because it allows for the organization, storage, and retrieval of large amounts of data related to the project, which can be difficult to manage with a mathematical model alone.
A mathematical model may be useful for analyzing and optimizing specific aspects of the project, such as the routing or scheduling of vehicles. However, a mathematical model typically relies on limited input data, assumptions, and simplifications to make predictions and recommendations. This can make it challenging to incorporate all relevant factors and real-world complexities affecting vehicle usage for tour purposes, such as traffic patterns, weather conditions, and customer preferences.
On the other hand, a database model can store and integrate a wide range of data sources and variables related to the project, including customer profiles, vehicle capacities, and availability. This can enable a more comprehensive and accurate analysis of vehicle usage factors and the generation of custom reports and insights based on specific user queries. In addition, a database model can allow for greater flexibility and scalability in managing and updating project data over time. New data sources and variables can be added as needed, and data can be easily modified or deleted as circumstances change.
Overall, while a mathematical model can be useful for analyzing specific aspects of the project, a database model provides a more comprehensive and flexible approach to managing and analyzing the data needed for this project.
In this section, we write down the performance evaluation of our project in tabular format and also show the graphical representation of quality attributes.
Table 3.
Tabular form of performance evaluation.
| Name | Short Description |
|---|---|
| Website name and framework | The website is called Pothik and has been built using the React and Redux frameworks and the RTK Query library. |
| Core feature | This feature allows for quick and efficient shifting of passengers into different packages based on the route. |
| User-friendliness | The website offers straightforward navigation and booking process, enabling users to easily access information and book their travel. |
| Client-side data loading | The website optimizes speed and efficiency by loading client-side data only when required, minimizing server requests. |
| High-performance optimization | The combination of React, Redux, and RTK Query libraries and optimized server requests allow for speedy loading times and browsing experience. |
In summary, Pothik is a high-performance website that has been optimized for fast loading times and a smooth user experience. The website is built using the React and Redux frameworks along with the RTK Query library, and it has been designed to minimize server requests to ensure high performance. The core feature of the website is its seat optimization functionality, and the website is easy to navigate and user-friendly. Overall, Pothik is a great example of a well-optimized website that provides a great user experience.
Graphical Representation of Quality Attributes:
In this section, we have analyzed the quality attributes of our whole work with the help of graphical representation. These quality attributes characteristics help to decide whether the program fits the needs and requirements of the stakeholder users. The major attributes are we have selected performance, availability, usability, maintainability, security, testability, energy efficiency, renewable, adaptability, correctness, configurability, and scalability.
In Figure 4, performance and availability ensure that the software product performance is relative to the number of resources applied under predefined conditions, and availability refines as the degree to which a software system is accessed by the users when it is needed. In the following graph, we mention our system’s performance and availability. Here, we can see that the performance is 70 % at 0.25 seconds, 35 % at 0.50 seconds, and 20 % at 0.75 seconds approximately. Besides, the availability is 92 % at 0.25 seconds, 50 % at 0.50 seconds, and 25 % at 0.75 seconds approximately.
Other major quality attributes are usability and maintainability which we mention in the second graph. Usability is measured in terms of ease of use. This application assures that users should be friendly to use functionality and are easy to learn and maintainability helps to maintain the product easily within less time, easy to develop, and upgrade new features and technologies from time to time. Based on the information provided, it appears that usability has a score of 60 % at around 0.25 seconds, 30% at around 0.50 seconds, and 10% at around 0.75 seconds. Similarly, maintainability has a score of 80% at around 0.25 seconds, 40% at around 0.50 seconds, and 10% at around 0.75 seconds.
Figure 5.
Graphical representation of quality attributes between "Usability and Maintainability".
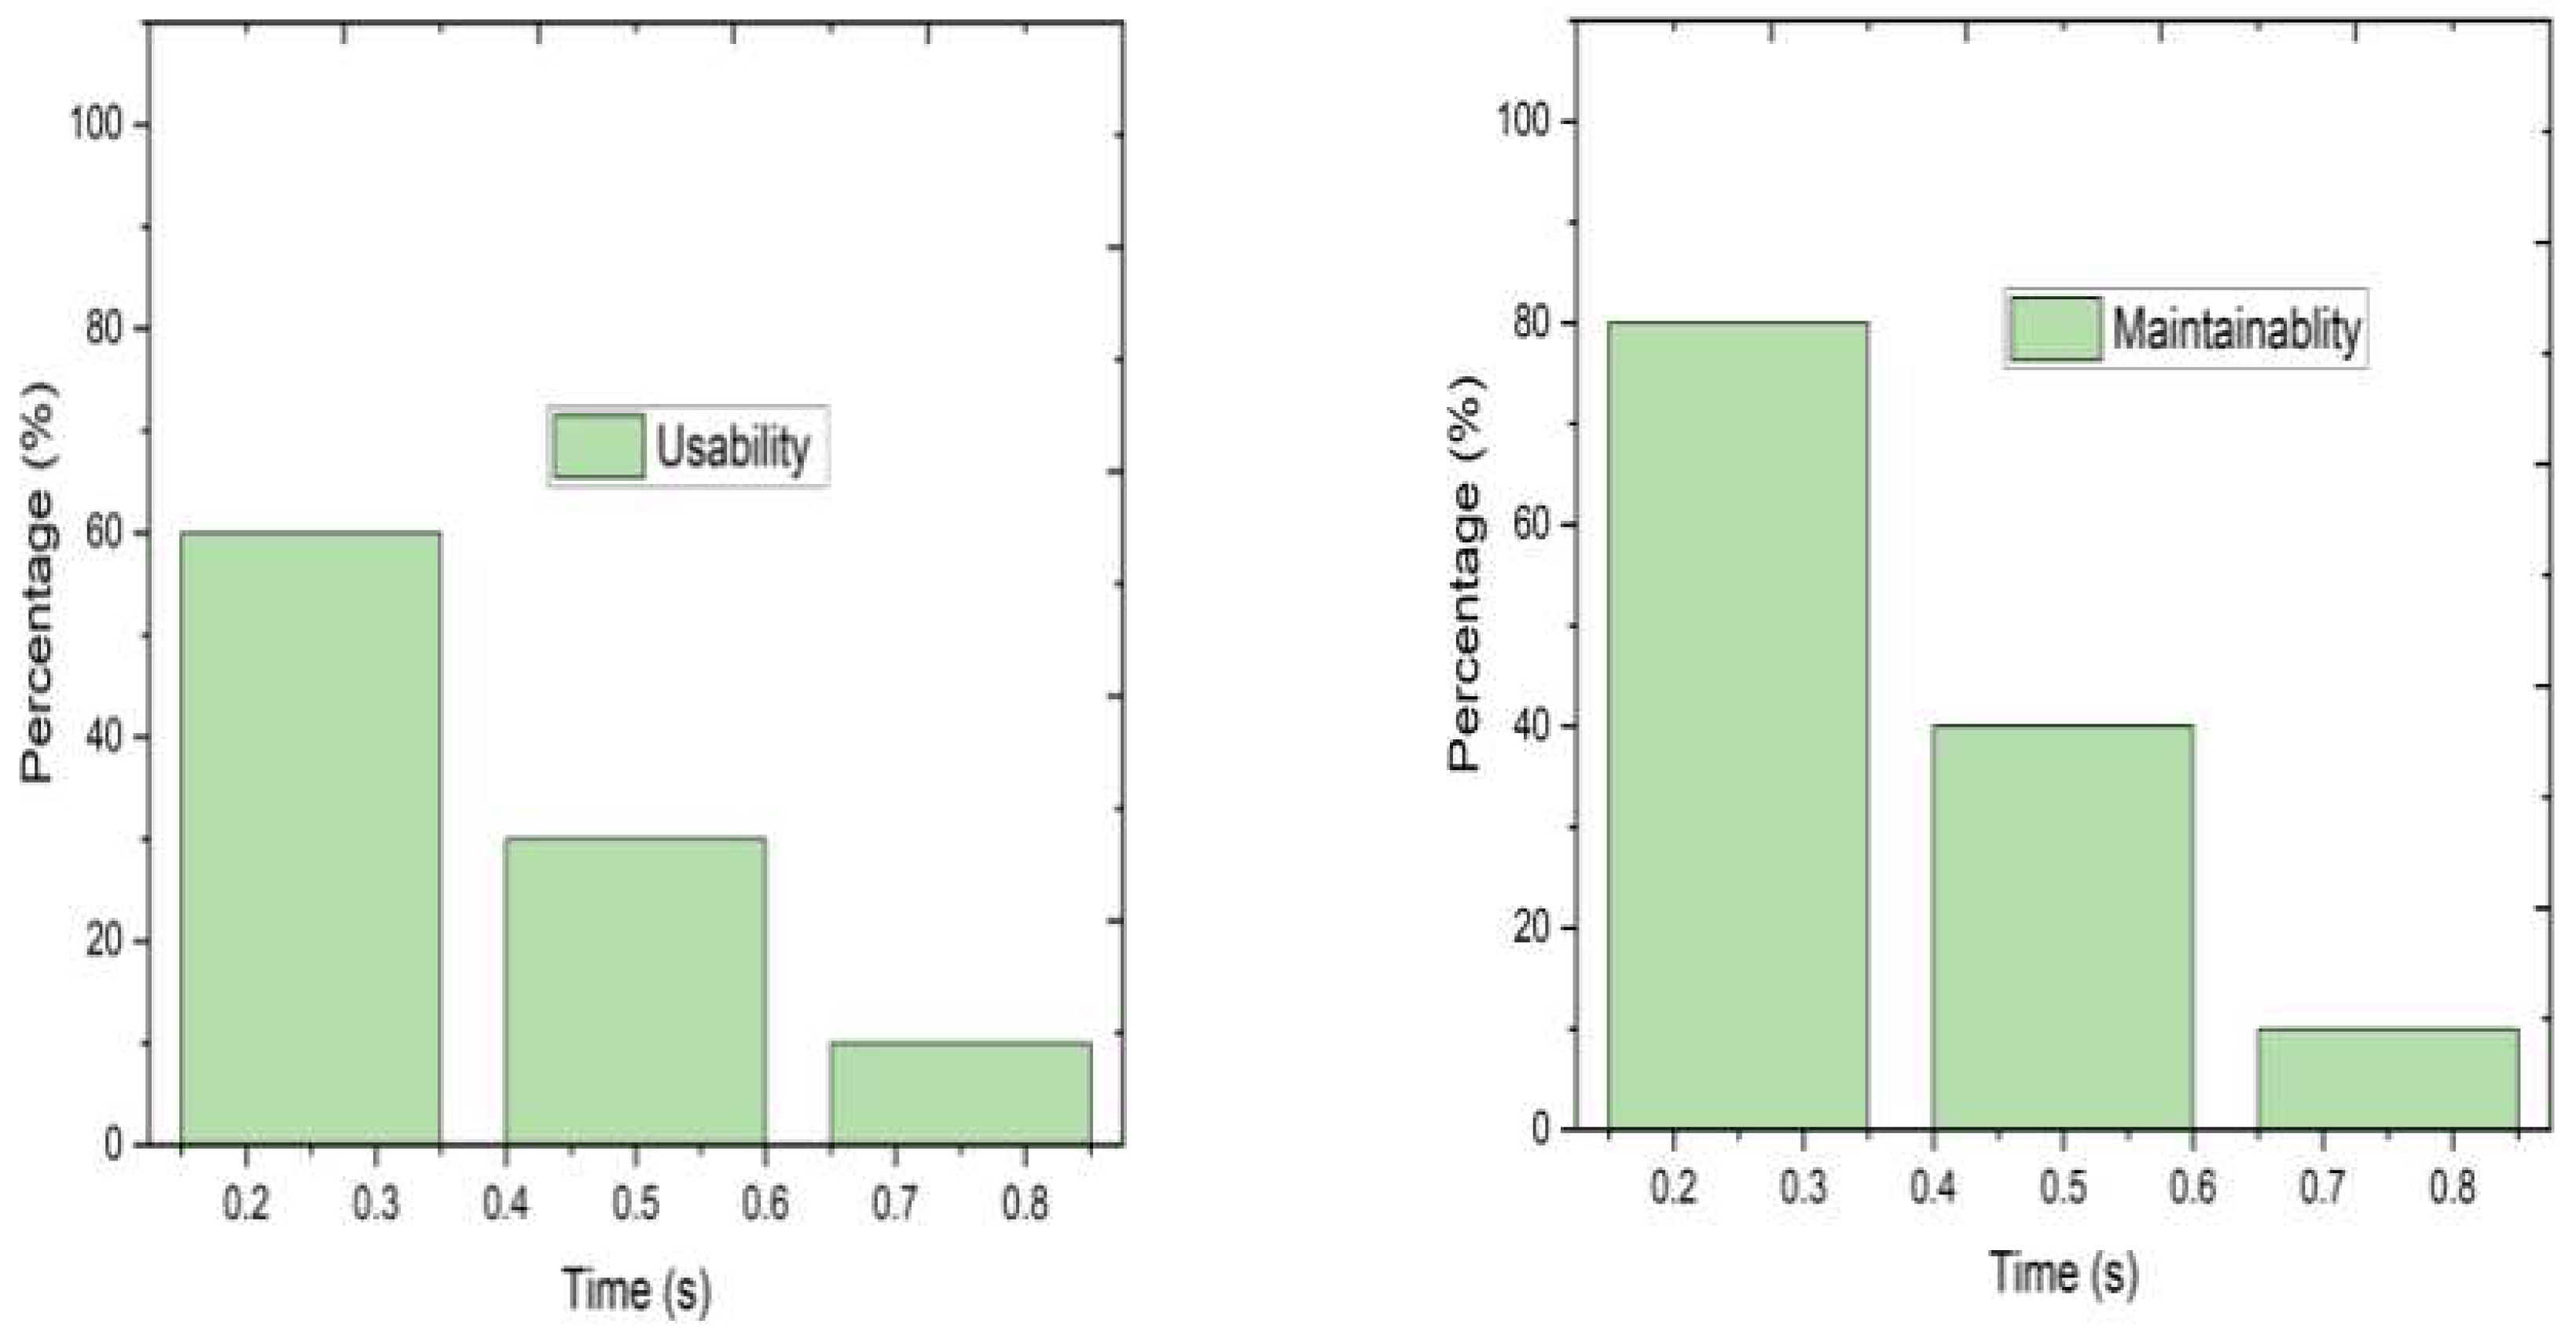
Figure 6, testability and security are emphasized and taken care of in our project. We have tried to achieve security and testability in less time as much as possible. Certainly, based on the given data, it seems that testability has achieved a score of 90% at approximately 0.25 seconds, 50% at around 0.50 seconds, and 30% at around 0.75 seconds. Additionally, the data suggest that security has attained a score of 80% at approximately 0.25 seconds, 40% at around 0.50 seconds, and 25% at around 0.75 seconds.
In Figure 7, we mention energy efficiency and renewable quality attributes. Energy efficiency and renewable energy are critical factors for vehicle optimization software, as they can help improve fuel efficiency and reduce emissions. These are showing us how much impact our project is on the environment. Here we also try to achieve the quality attributes very early. Based on the provided data, the energy efficiency metric has achieved a score of 90% at approximately 0.25 seconds, 60% at around 0.50 seconds, and 50% at around 0.75 seconds. Likewise, the data suggest that the metric of renewable has attained a score of 60% at approximately 0.25 seconds, 40% at around 0.50 seconds, and 30% at around 0.75 seconds.
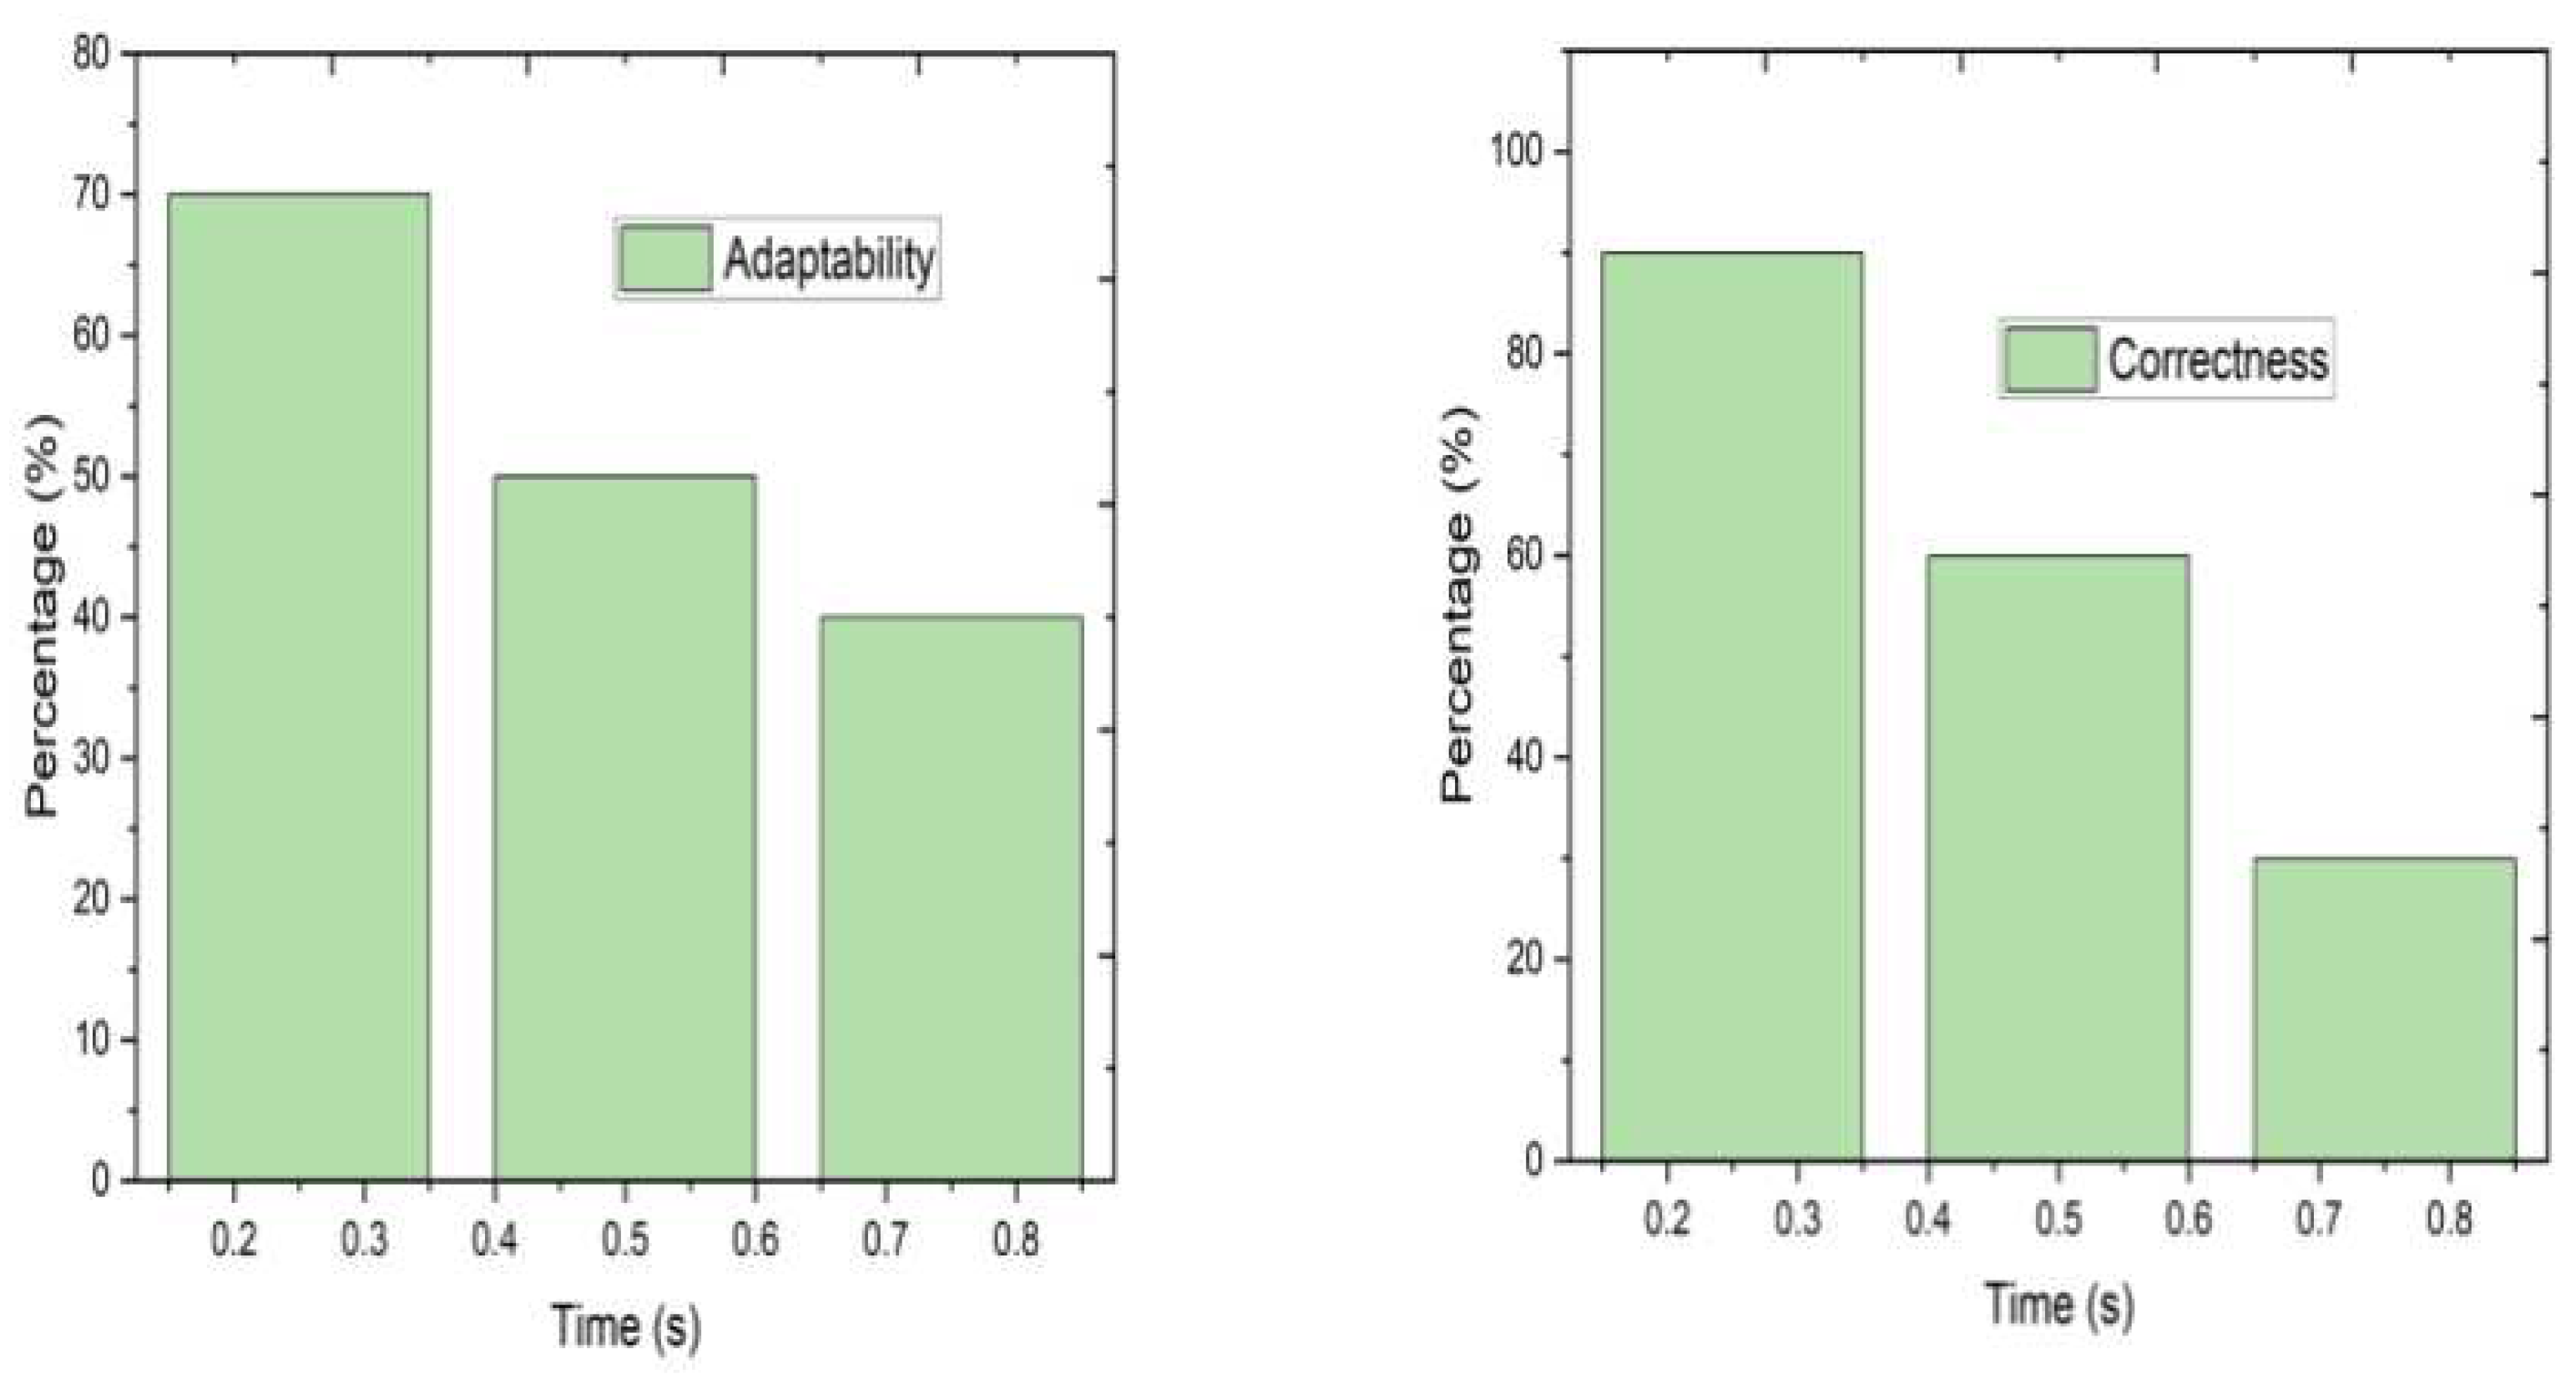
>Figure 8, adaptability refers to the ability of software to change or adapt to new circumstances or requirements. On the other hand, correctness refers to the ability of software to produce correct and accurate results. We want to achieve these in a short time. It seems that the metric of adaptability has obtained a score of 70% at approximately 0.25 seconds, 50% at around 0.50 seconds, and 40% at around 0.75 seconds. Additionally, the data suggest that correctness has achieved a score of 90% at approximately 0.25 seconds, 60% at around 0.50 seconds, and 30% at around 0.75 seconds.
Figure 8.
Graphical representation of quality attributes between "Adaptability and Correctness".
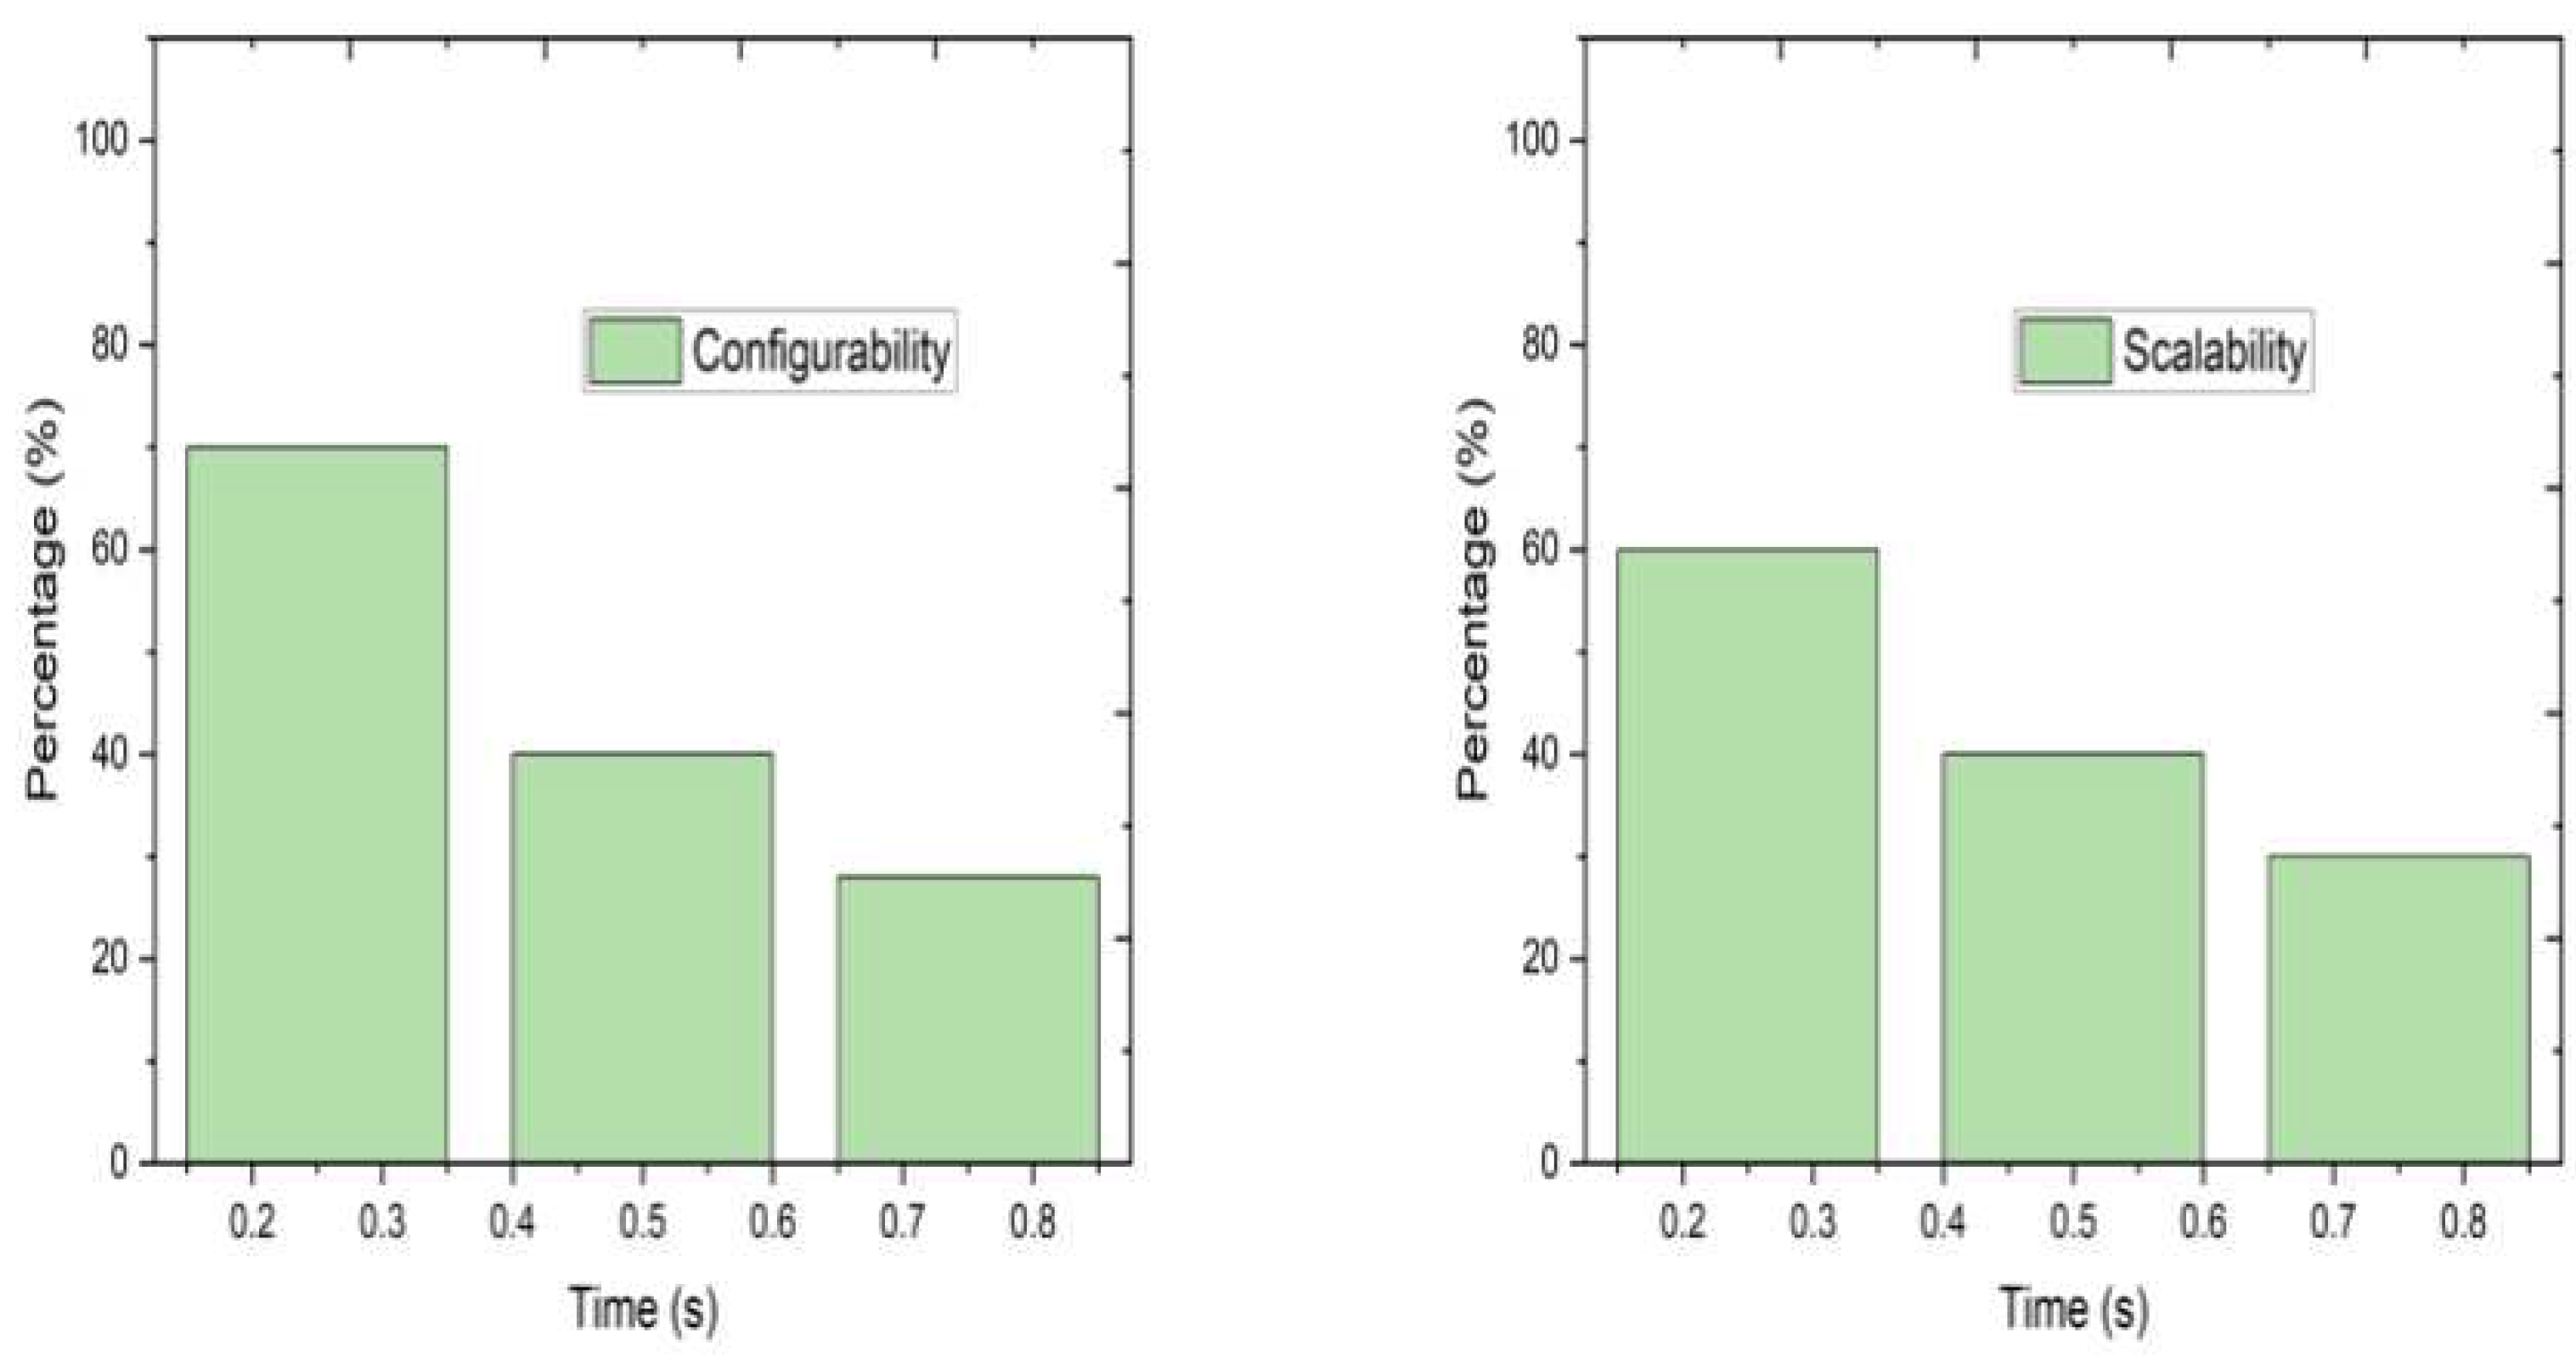
In Figure 9, configurability refers to the ability of software to be customized and configured to meet specific needs or preferences. On the other hand, scalability refers to the ability of software to handle increasing workloads or user demands without sacrificing performance or functionality. The configurability metric has scored 70% at around 0.25 seconds, 40% at around 0.50 seconds, and 25% at around 0.75 seconds. Moreover, the data indicate that the scalability metric has scored 60% at approximately 0.25 seconds, 40% at around 0.50 seconds, and 30% at around 0.75 seconds.
6. Limitations and Future Works
In this work, our main contribution is to introduce a plan that helps minimize vehicle costs by optimizing bus seat allocation. The major limitation we can underline is that it would have been better. If we can not only work with vehicle optimization but also seat optimization in our system, for example, passengers will not be able to choose the seats they want. Transferring the total number of group members from one bus to another would be difficult in our system. Consequently, our system is unable to track bus locations, and packages cannot be optimized.
7. Conclusion
A perfect travel agency is very important for every traveler. On the other hand, a good profit is also important for travel agencies. Otherwise, both travelers and travel agencies can’t get their benefits. We are developing a system where they can solve their problems. By seeing the package, blog, and description, a traveler can choose their correct destination. After choosing the destination, they can book their seat with an advance payment. On the other hand, travel agencies can optimize their vehicles. So, they can use the limited vehicle and earn more profit. So, we have created a common platform for both travelers and travel agencies.
References
- Tabassum, Anika and Barua, Sukarna and Hashem, Tanzima and Chowdhury, Tasmin, Dynamic group trip planning queries in spatial databases. Proceedings of the 29th international conference on Scientific and statistical database management, 1–6, 2017. [CrossRef]
- Sharma, Deeksha and Sharma, Saurabh KR and others, Tour and travels information management system. 2021, Galgotias University.
- Hashem, Tanzima and Barua, Sukarna and Ali, Mohammed Eunus and Kulik, Lars and Tanin, Egemen, Efficient computation of trips with friends and families, Proceedings of the 24th ACM International on Conference on Information and Knowledge Management, 931–940,2015. [CrossRef]
- Golden, Bruce and Assad, Arjang and Levy, Larry and Gheysens, Filip, The fleet size and mix vehicle routing problem, Computers & Operations Research, 11, 1, 49–66, 1984, Elsevier. [CrossRef]
- Li, Ming and Zheng, Nan and Wu, Xinkai and Li, Weihua and Wu, Jianhua, An Efficient solving method to vehicle and passenger matching problem for sharing autonomous vehicle system, Journal of Advanced Transportation, 2020, 2020, Hindawi. [CrossRef]
- Gavalas, Damianos and Kenteris, Michael,A web-based pervasive recommendation system for mobile tourist guides, Personal and Ubiquitous Computing, 15, 7, 759–770, 2011, Springer. [CrossRef]
- Nistrina, Khilda and Rusdianto, Denny and others, Web-based tour package information system on brader bus holiday bandung tour, Jurnal Mantik, 6, 1, 592–598, 2022.
- Alamine, Aboubakar and others, Travel and Tour System, 2016, IUT, TVE.
- Amazing tour bd, https://www.amazingtoursbd.com/, (accessed on 02 November, 2022 ).
- Paribahan.com, https://paribahan.com/, (accessed on 11 November, 2022).
- Shohoz, https://www.shohoz.com/bus-tickets, (accessed on 11 November, 2022).
- Travelers of Bangladesh, https://www.facebook.com/groups/647450768707652/?ref=share, (accessed on 11 November, 2022).
- Chologhuri Bangladesh, https://www.facebook.com/groups/chologhuribangladesh/?ref=share, (accessed on 11 November, 2022).
- Bus Ticket BD, https://play.google.com/store/apps/details?id=com.mrsoftbd.busticketbd, (accessed on 12 November, 2022).
- Hashem, Tanzima and Kulik, Lars and Zhang, Rui, Privacy preserving group nearest neighbor queries, Proceedings of the 13th International Conference on Extending Database Technology, 489–500, 2010. [CrossRef]
- Li, Feifei and Cheng, Dihan and Hadjieleftheriou, Marios and Kollios, George and Teng, Shang-Hua, On trip planning queries in spatial databases, Advances in Spatial and Temporal Databases: 9th International Symposium, SSTD 2005, Angra dos Reis, Brazil, August 22-24, 2005. Proceedings 9, 273–290, 2005, Springer. [CrossRef]
- Fan, Liyue and Bonomi, Luca and Shahabi, Cyrus and Xiong, Li, Optimal group route query: Finding itinerary for group of users in spatial databases, 6, 1, 592–598, 2022.
- Soma, Subarna Chowdhury and Hashem, Tanzima and Cheema, Muhammad Aamir and Samrose, Samiha, Trip planning queries with location privacy in spatial databases, World Wide Web, 20, 205–236, 2017, Springer. [CrossRef]
- Hashem, Tanzima and Hashem, Tahrima and Ali, Mohammed Eunus and Kulik, Lars, Group trip planning queries in spatial databases, Advances in Spatial and Temporal Databases: 13th International Symposium, SSTD 2013, Munich, Germany, August 21-23, 2013. Proceedings 13, 259–276, 2013, Springer. [CrossRef]
- Al-Baghdadi, Ahmed and Sharma, Gokarna and Lian, Xiang, Efficient processing of group planning queries over spatial-social networks, IEEE Transactions on Knowledge and Data Engineering, 34, 5, 2135–2147, 2020, IEEE. [CrossRef]
- Hashem, Tanzima and Hashem, Tahrima and Ali, Mohammed Eunus and Kulik, Lars and Tanin, Egemen, Trip planning queries for subgroups in spatial databases, Databases Theory and Applications: 27th Australasian Database Conference, ADC 2016, Sydney, NSW, September 28-29, 2016, Proceedings 27, 110–122, 2016, Springer. [CrossRef]
- Ali, Muhammad Mahboob and Parvin, Rehana and others, Strategic management of tourism sector in Bangladesh to raise gross domestic product: An analysis, AIUB Business and Economic Paper Series, July, American International University Bangladesh, 2010.
Figure 2.
Database Design.
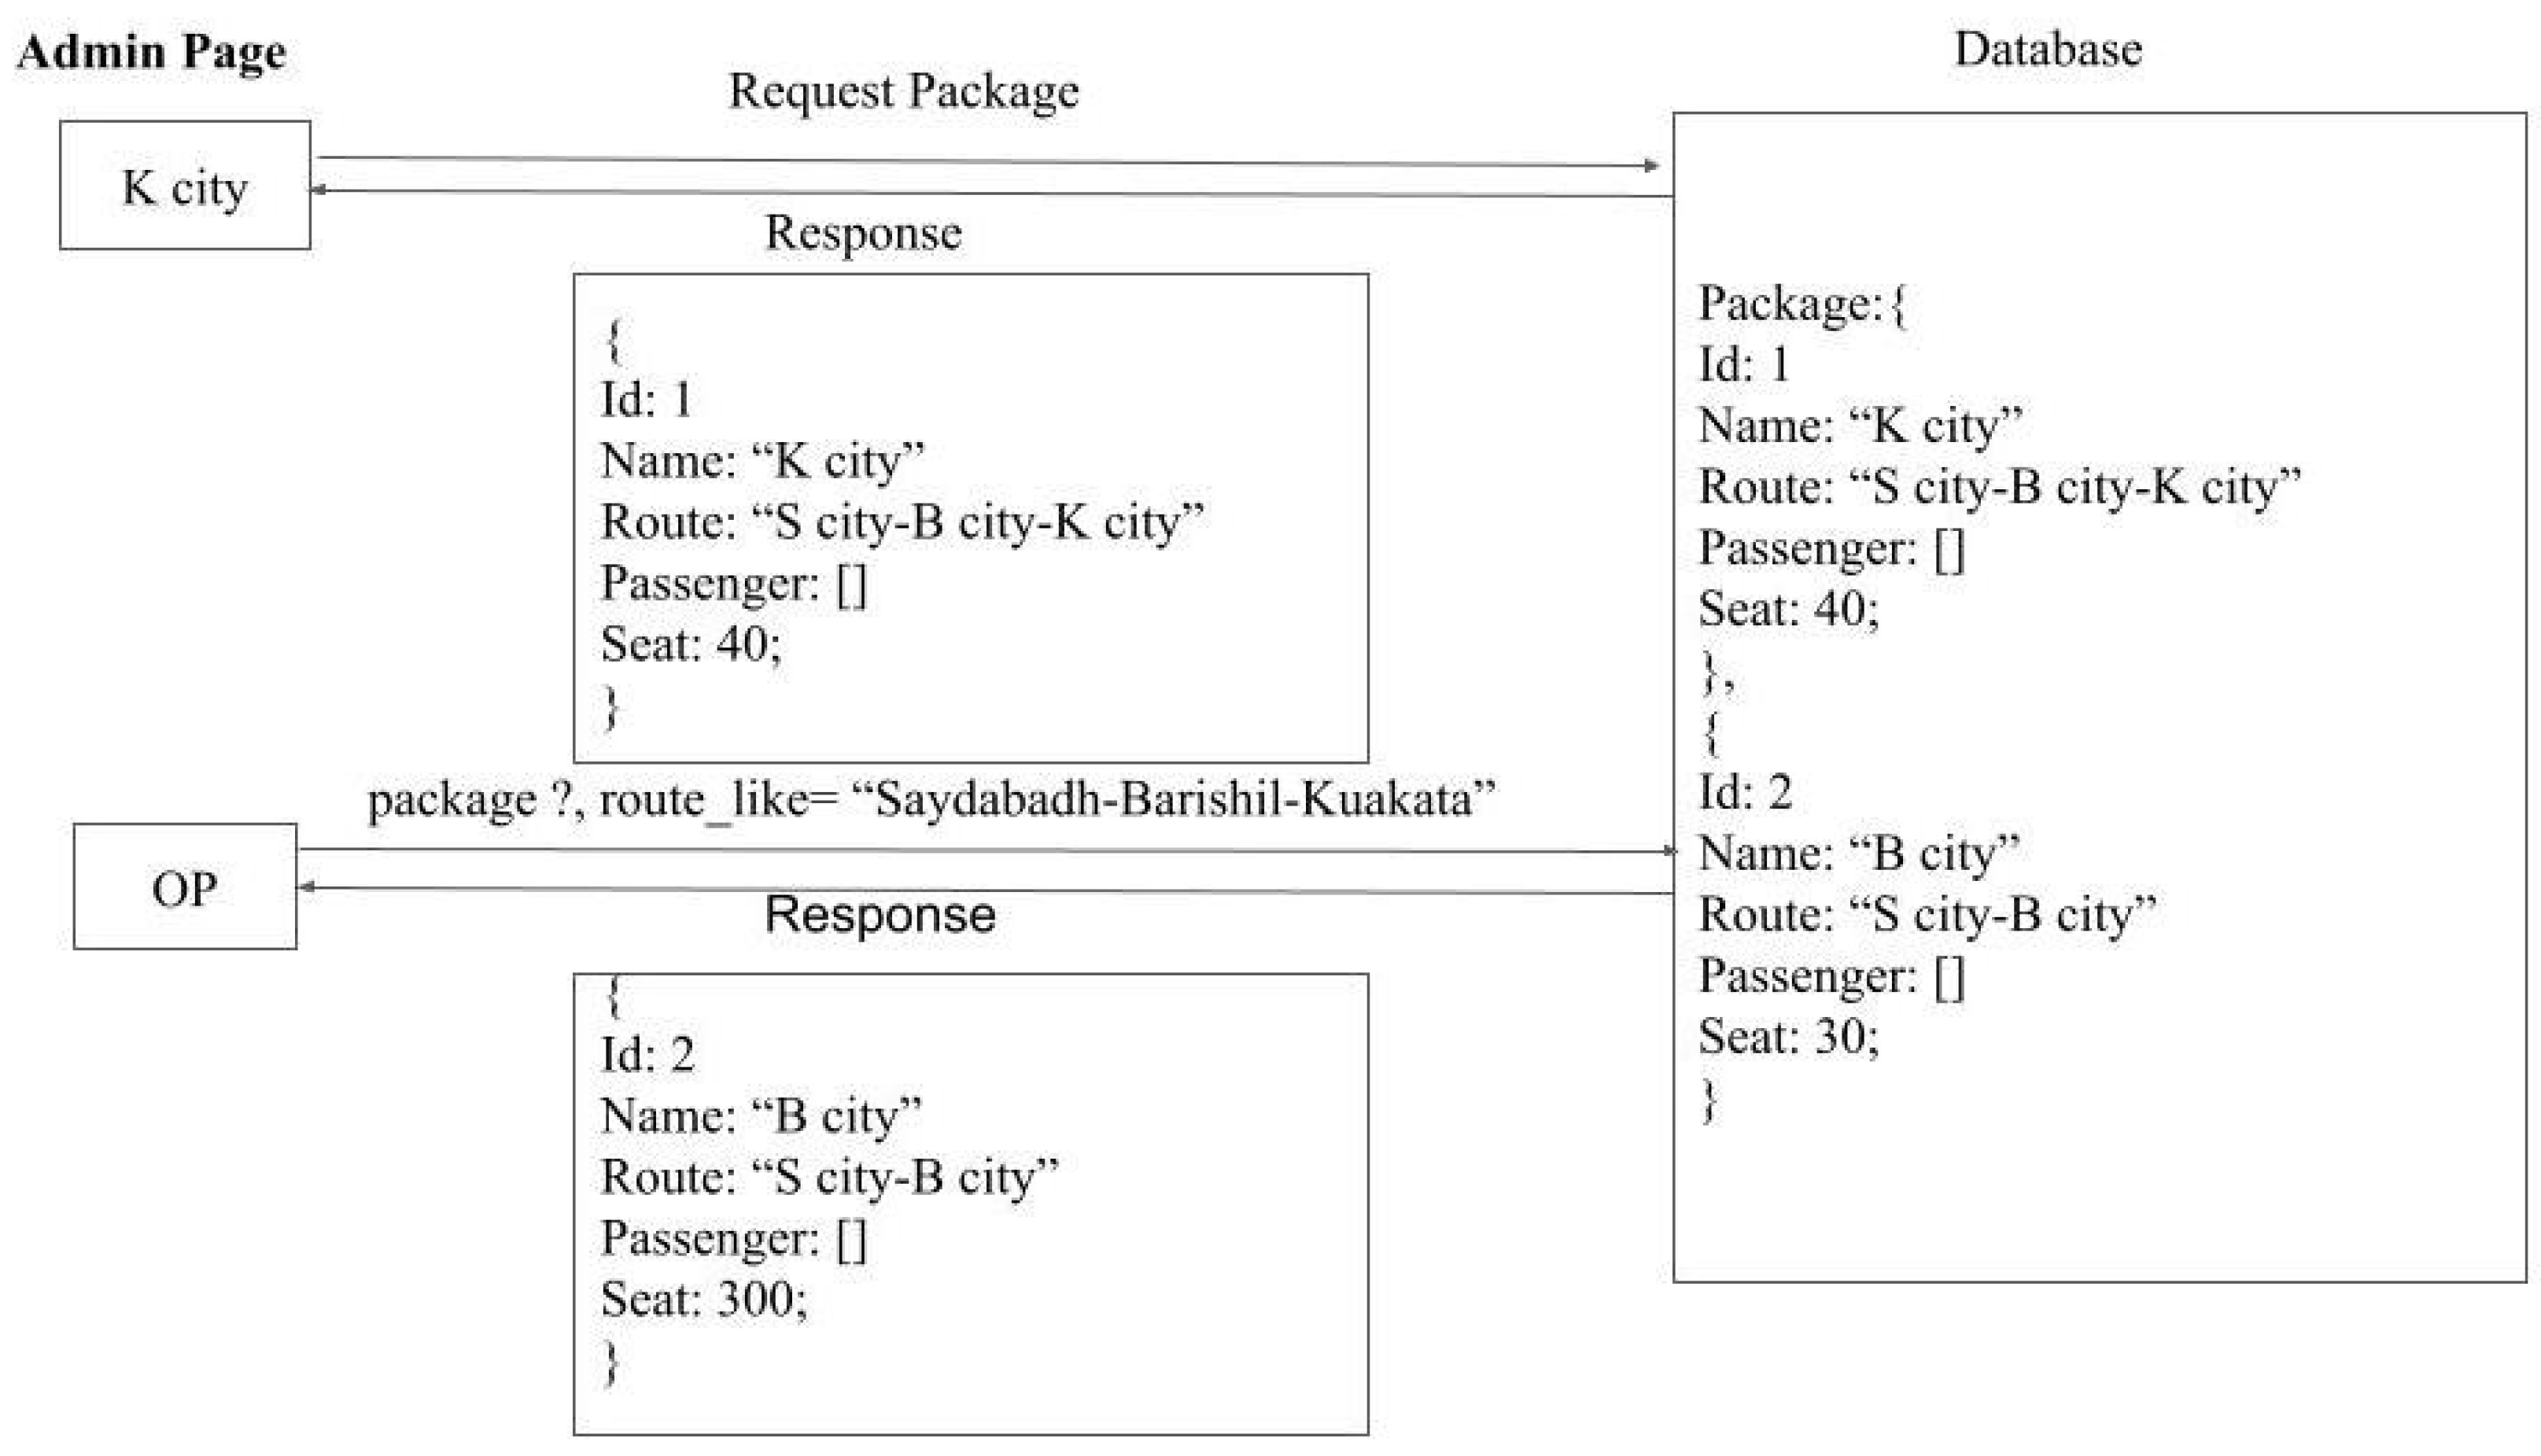
Figure 4.
Graphical representation of quality attributes between "performance and availability".
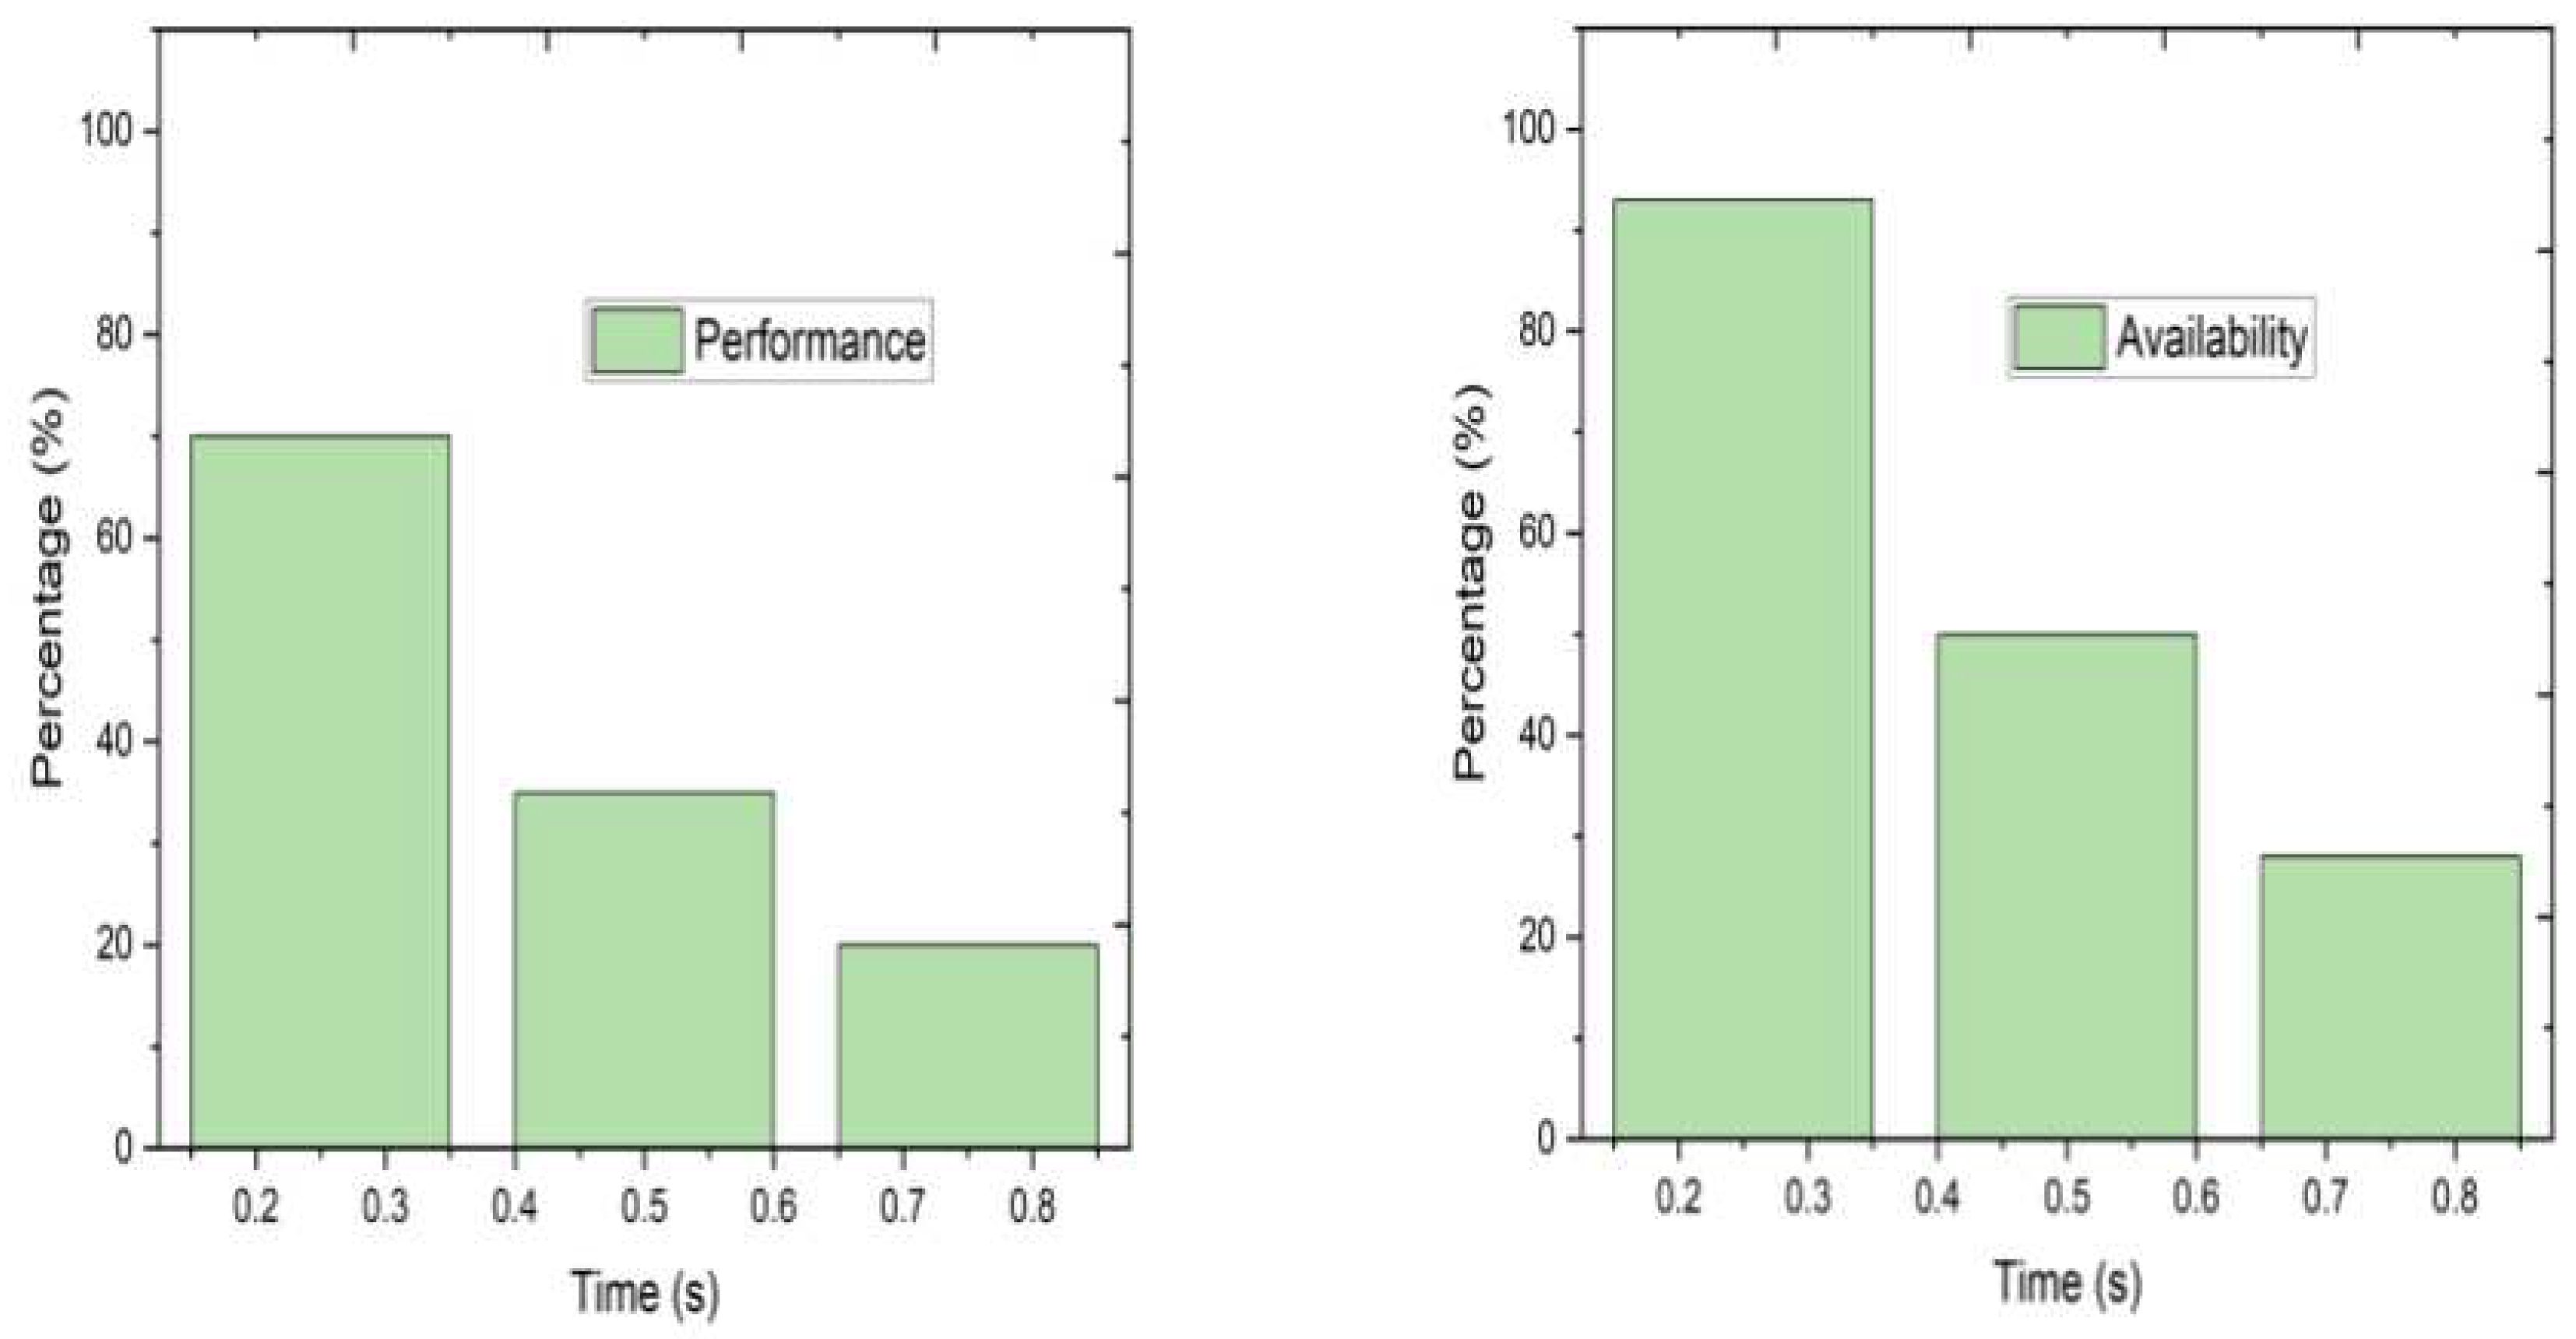
Figure 6.
Graphical representation of quality attributes between "Security and Testability".
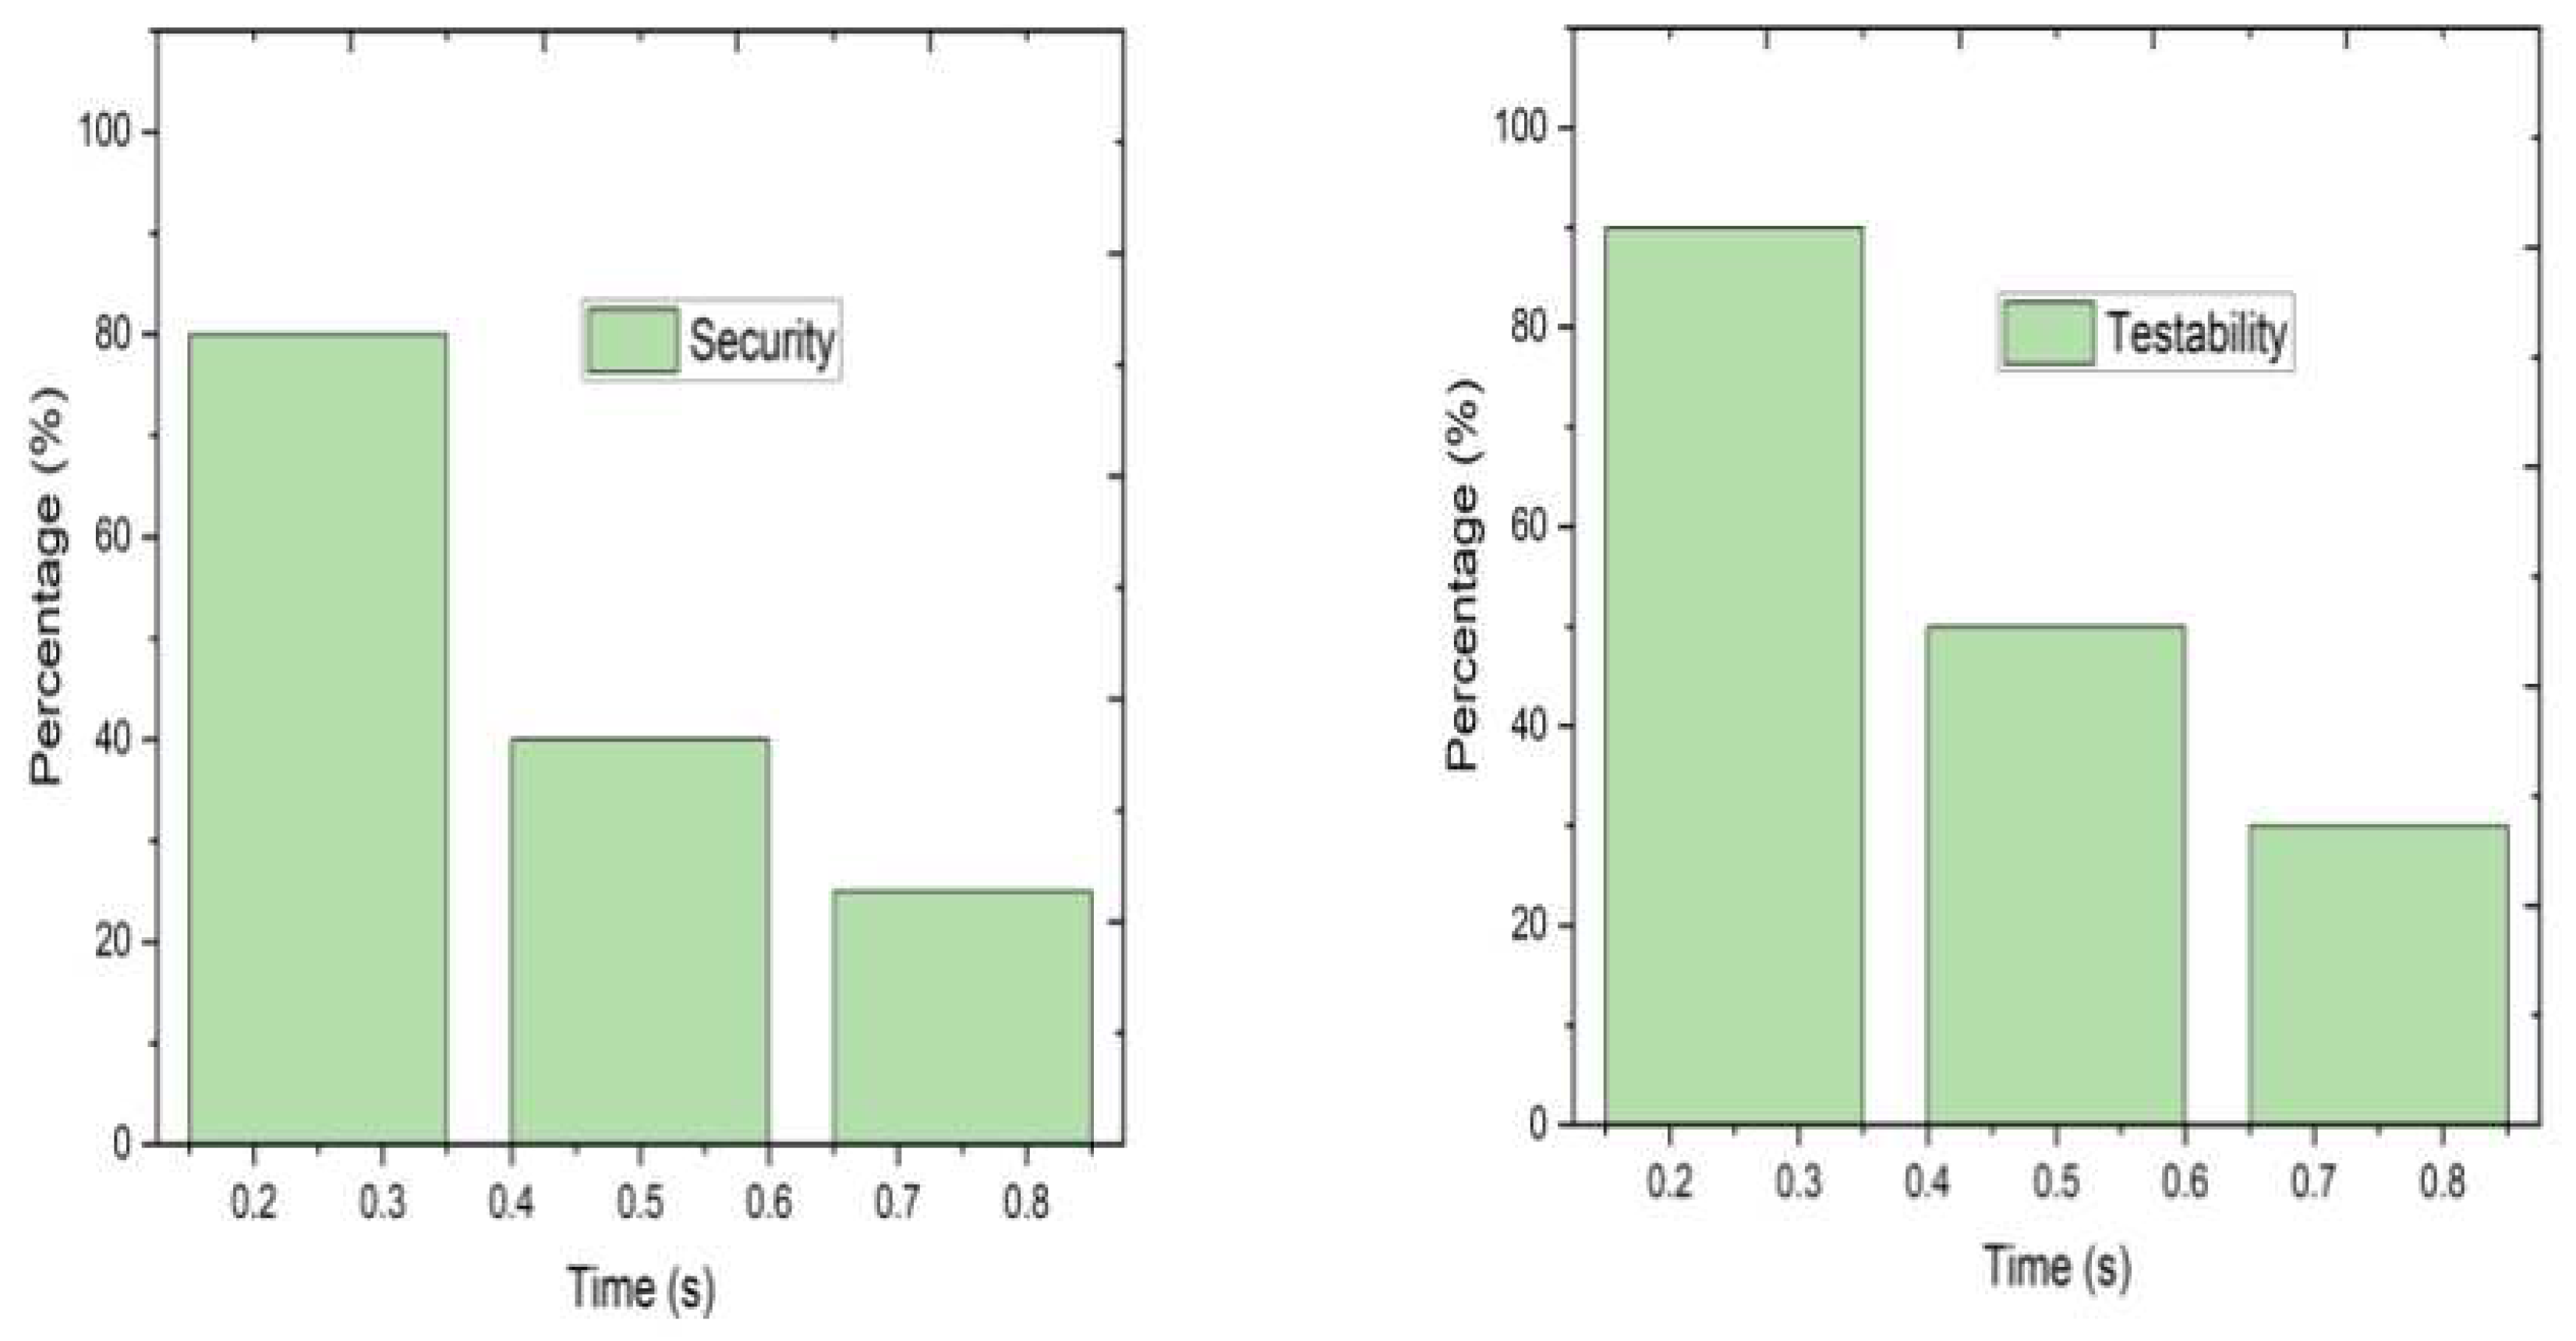
Figure 7.
Graphical representation of quality attributes between "Energy Efficiency and Renewable".
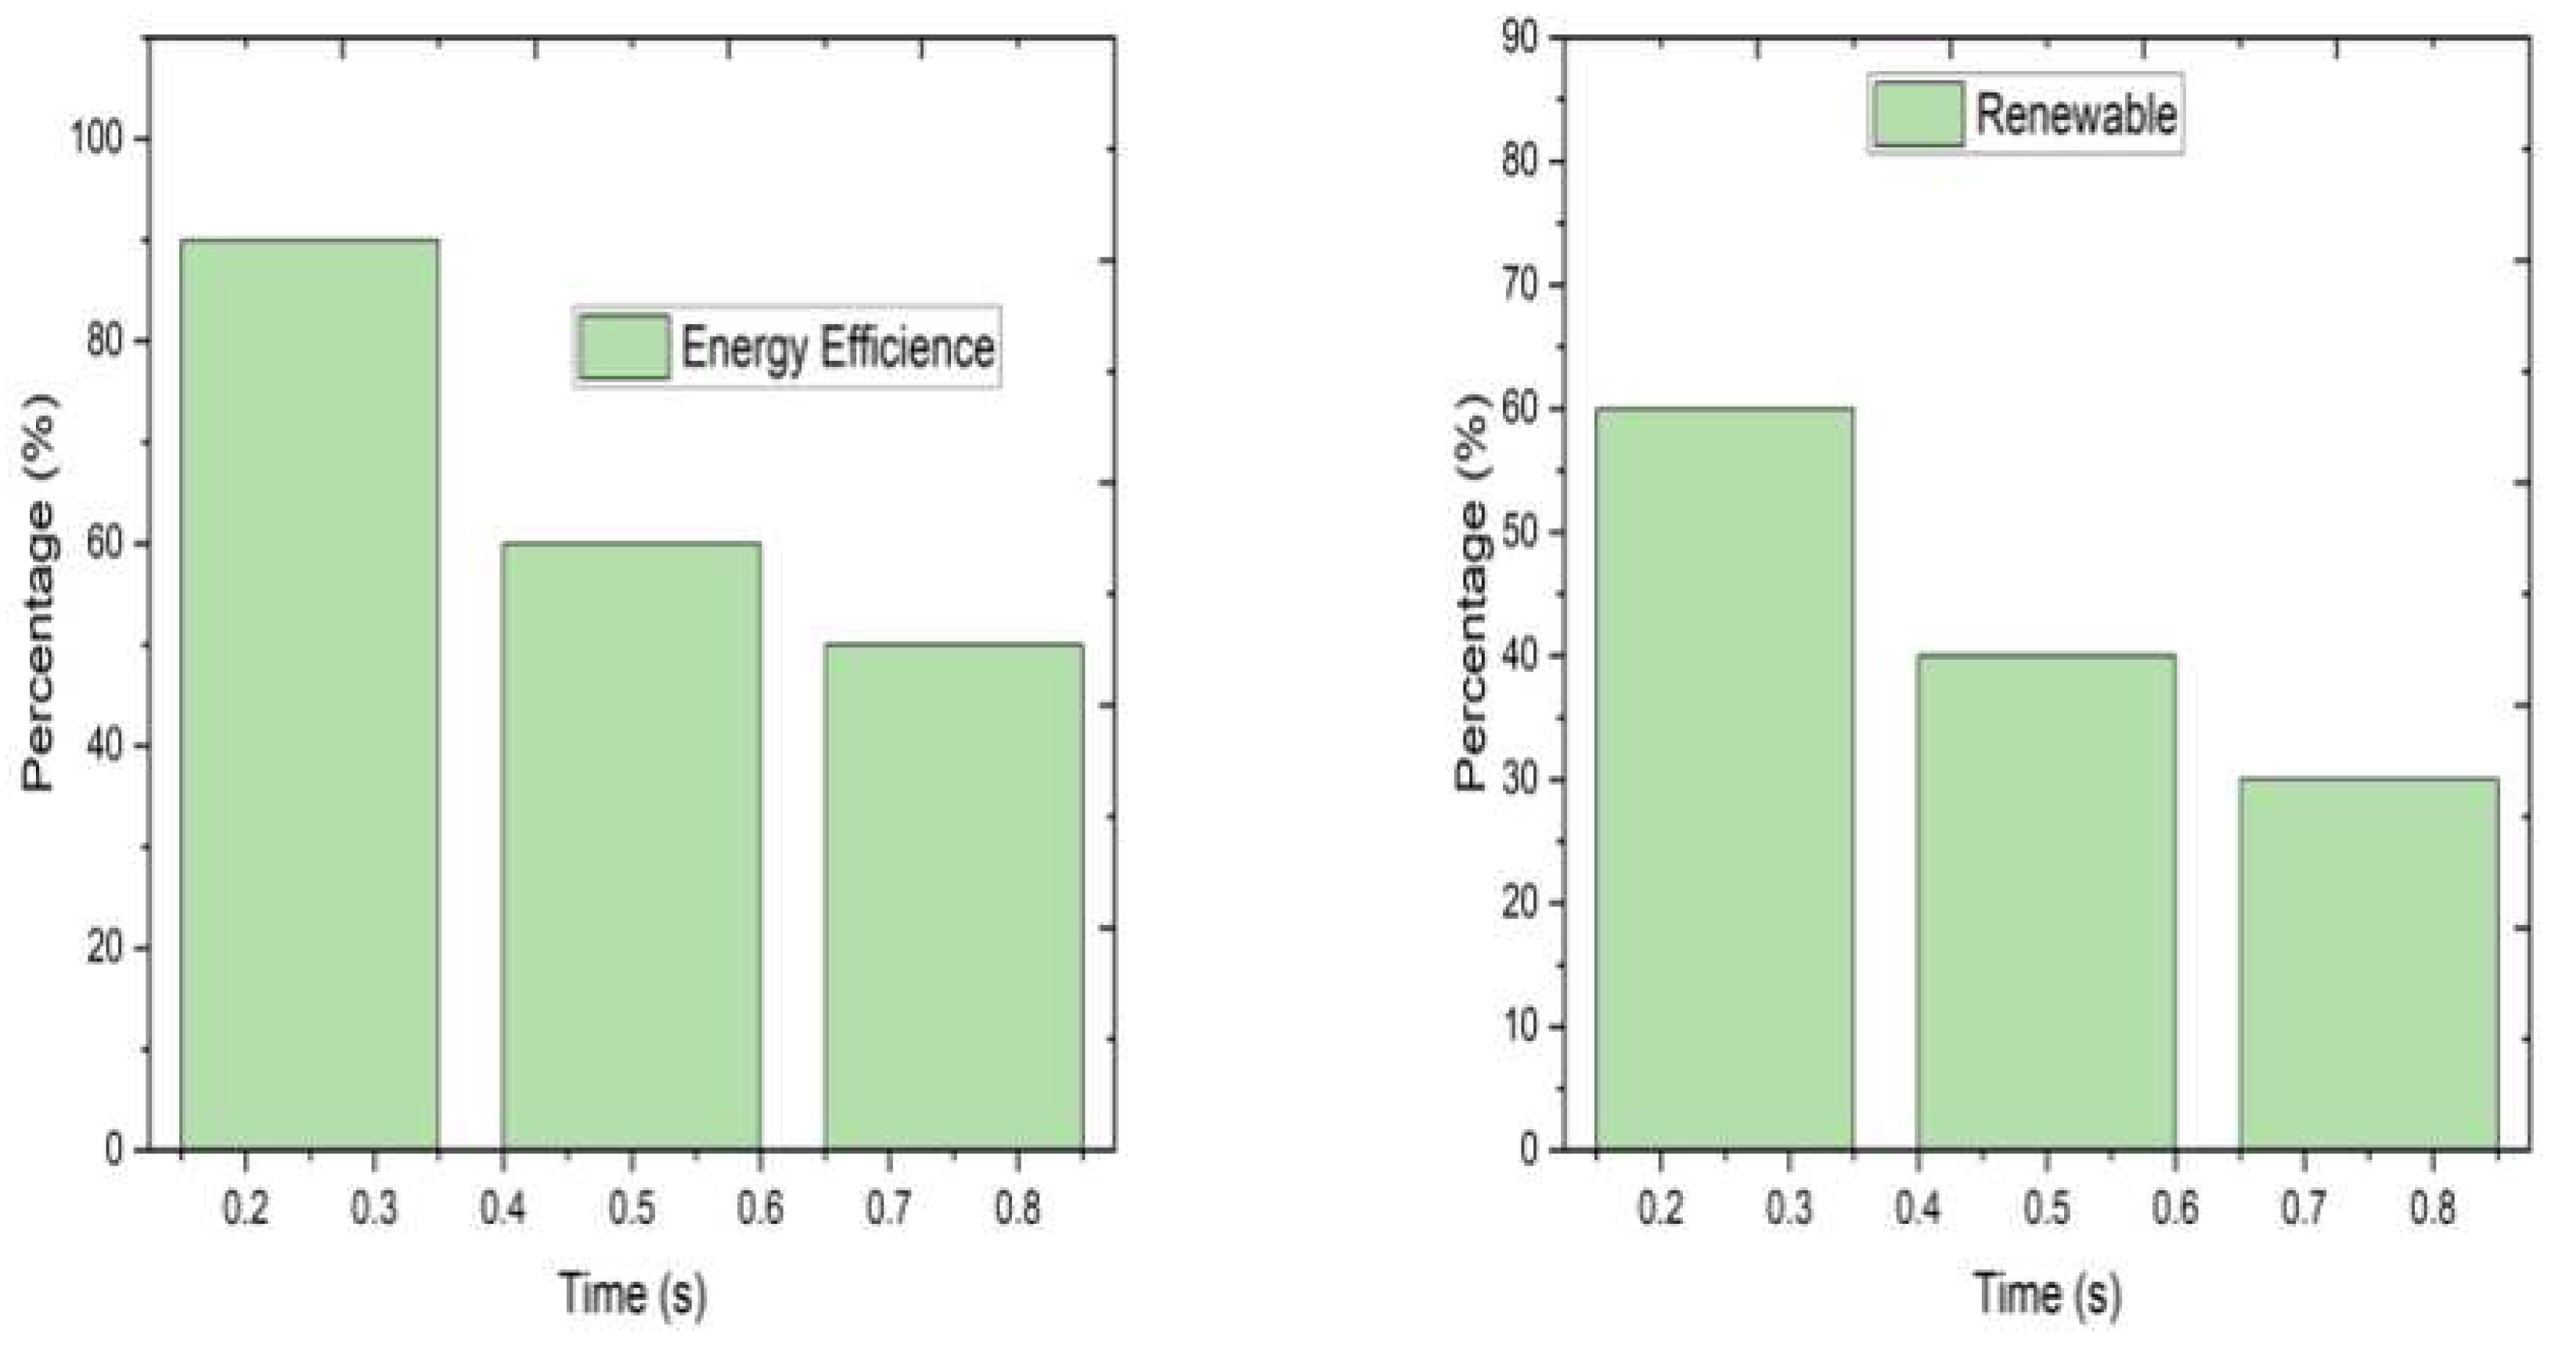
Figure 9.
Graphical representation of quality attributes between "Configurability and Scalability".
Disclaimer/Publisher’s Note: The statements, opinions and data contained in all publications are solely those of the individual author(s) and contributor(s) and not of MDPI and/or the editor(s). MDPI and/or the editor(s) disclaim responsibility for any injury to people or property resulting from any ideas, methods, instructions or products referred to in the content. |
© 2023 by the authors. Licensee MDPI, Basel, Switzerland. This article is an open access article distributed under the terms and conditions of the Creative Commons Attribution (CC BY) license (http://creativecommons.org/licenses/by/4.0/).
Copyright: This open access article is published under a Creative Commons CC BY 4.0 license, which permit the free download, distribution, and reuse, provided that the author and preprint are cited in any reuse.


