1. Introduction
The endometrium is the inner lining of the uterus essential for human reproduction. During women's life this unique tissue adopts to multiple physiological states, including premenarche, menstrual cycling, pregnancy, and postmenopause [
1,
2]. Among these states, menstrual cycling is almost continuous during fertile period of the women with exception for pregnancy and lactation. Menstrual cycles are governed by oscillating levels of oestrogen and progesterone, which results in cyclic growth, differentiation/decidualization, shedding and further regeneration of two-thirds of the endometrium [
1]. At the histological level endometrium is composed of a stromal cell layer invaginated by epithelial glands and covered by the luminal epithelium [
2]. The highly dynamic nature of this tissue contributes to the accumulation of somatic mutations in cancer-associated genes, what in turn poses risks for developing cancer in adult women [
3,
4]. Indeed, endometrial cancer is one of the most common gynecologic malignancies worldwide [
3]. Interestingly, despite the fact that both epithelial and stromal cells are affected by cyclic hormonal alterations, endometrial cancer is commonly referred to endometrial carcinoma, while endometrial stromal tumors seem to be rare and unusual types of tumor [
5,
6]. The latter raises the question regarding defense mechanisms that might underlie resistance of endometrial stromal cells (EnSC) against oncogenic transformation.
Senescence is well-established tumor-suppressive mechanism [
7]. At the cellular level, senescence is considered as an important intrinsic stress-reaction that prevents propagation of cells bearing damages via irreversible cell cycle block [
7]. Different types of senescence are commonly distinguished, including replicative and various stress-induced forms [
8]. More than 20 years ago, expression of oncogenes was also shown to trigger senescence [
9]. For now numerous oncogenes such as HRAS
G12V, NRAS
Q61R, BRAFV
600E are proved to trigger oncogene-induced senescence (OIS) in various types of cells [reviewed in 10]. OIS shares the same basic features as the replicative and the stress-induced forms of senescence, i.e. irreversible proliferation block, enhanced expression of the inhibitors of cyclin-dependent kinases p21
WAF/CIP and p16
INK4a, DNA damage, increased cell size, elevated intracellular reactive oxygen species levels, senescence-associated β-galactosidase (SA-β-gal) activity [
10]. A plenty of evidence provides strong arguments that OIS serves as the first barrier of defense against cancer development [
11,
12,
13,
14]. Indeed, cells with features of OIS have been detected in early neoplastic and premalignant lesions in different genetically engineered mouse models as well as in humans [
11,
12]. Interestingly, further progression of a subset of these lesions to more advanced cancer stages is associated with the loss of senescence features [
14].
Previously, we have shown that EnSC are prone to senescence triggered by various stresses including oxidative stress, heat shock, radiation, and treatment with genotoxic agents [
15,
16,
17]. However, the response of EnSC towards oncogenes expression remained uncovered. Within the present study, we tested the suggestion that OIS might form defense mechanism of EnSC against neoplastic transformation.
3. Discussion
The present study aimed to uncover defense mechanisms of EnSC against transformation. We revealed that EnSC are prone to OIS in response to HRAS
G12V oncogene expression. The first evidence of HRAS-induced senescence dates back to 1997, when the authors revealed stalled mitotic activity, enlarged and flattened morphology of human diploid fibroblasts expressing mutant HRAS
G12V [
9]. Later on this observation was significantly extended, and today OIS resulting from expression of different oncogenes is considered as the intrinsic antitumor mechanism common for various types of cells [
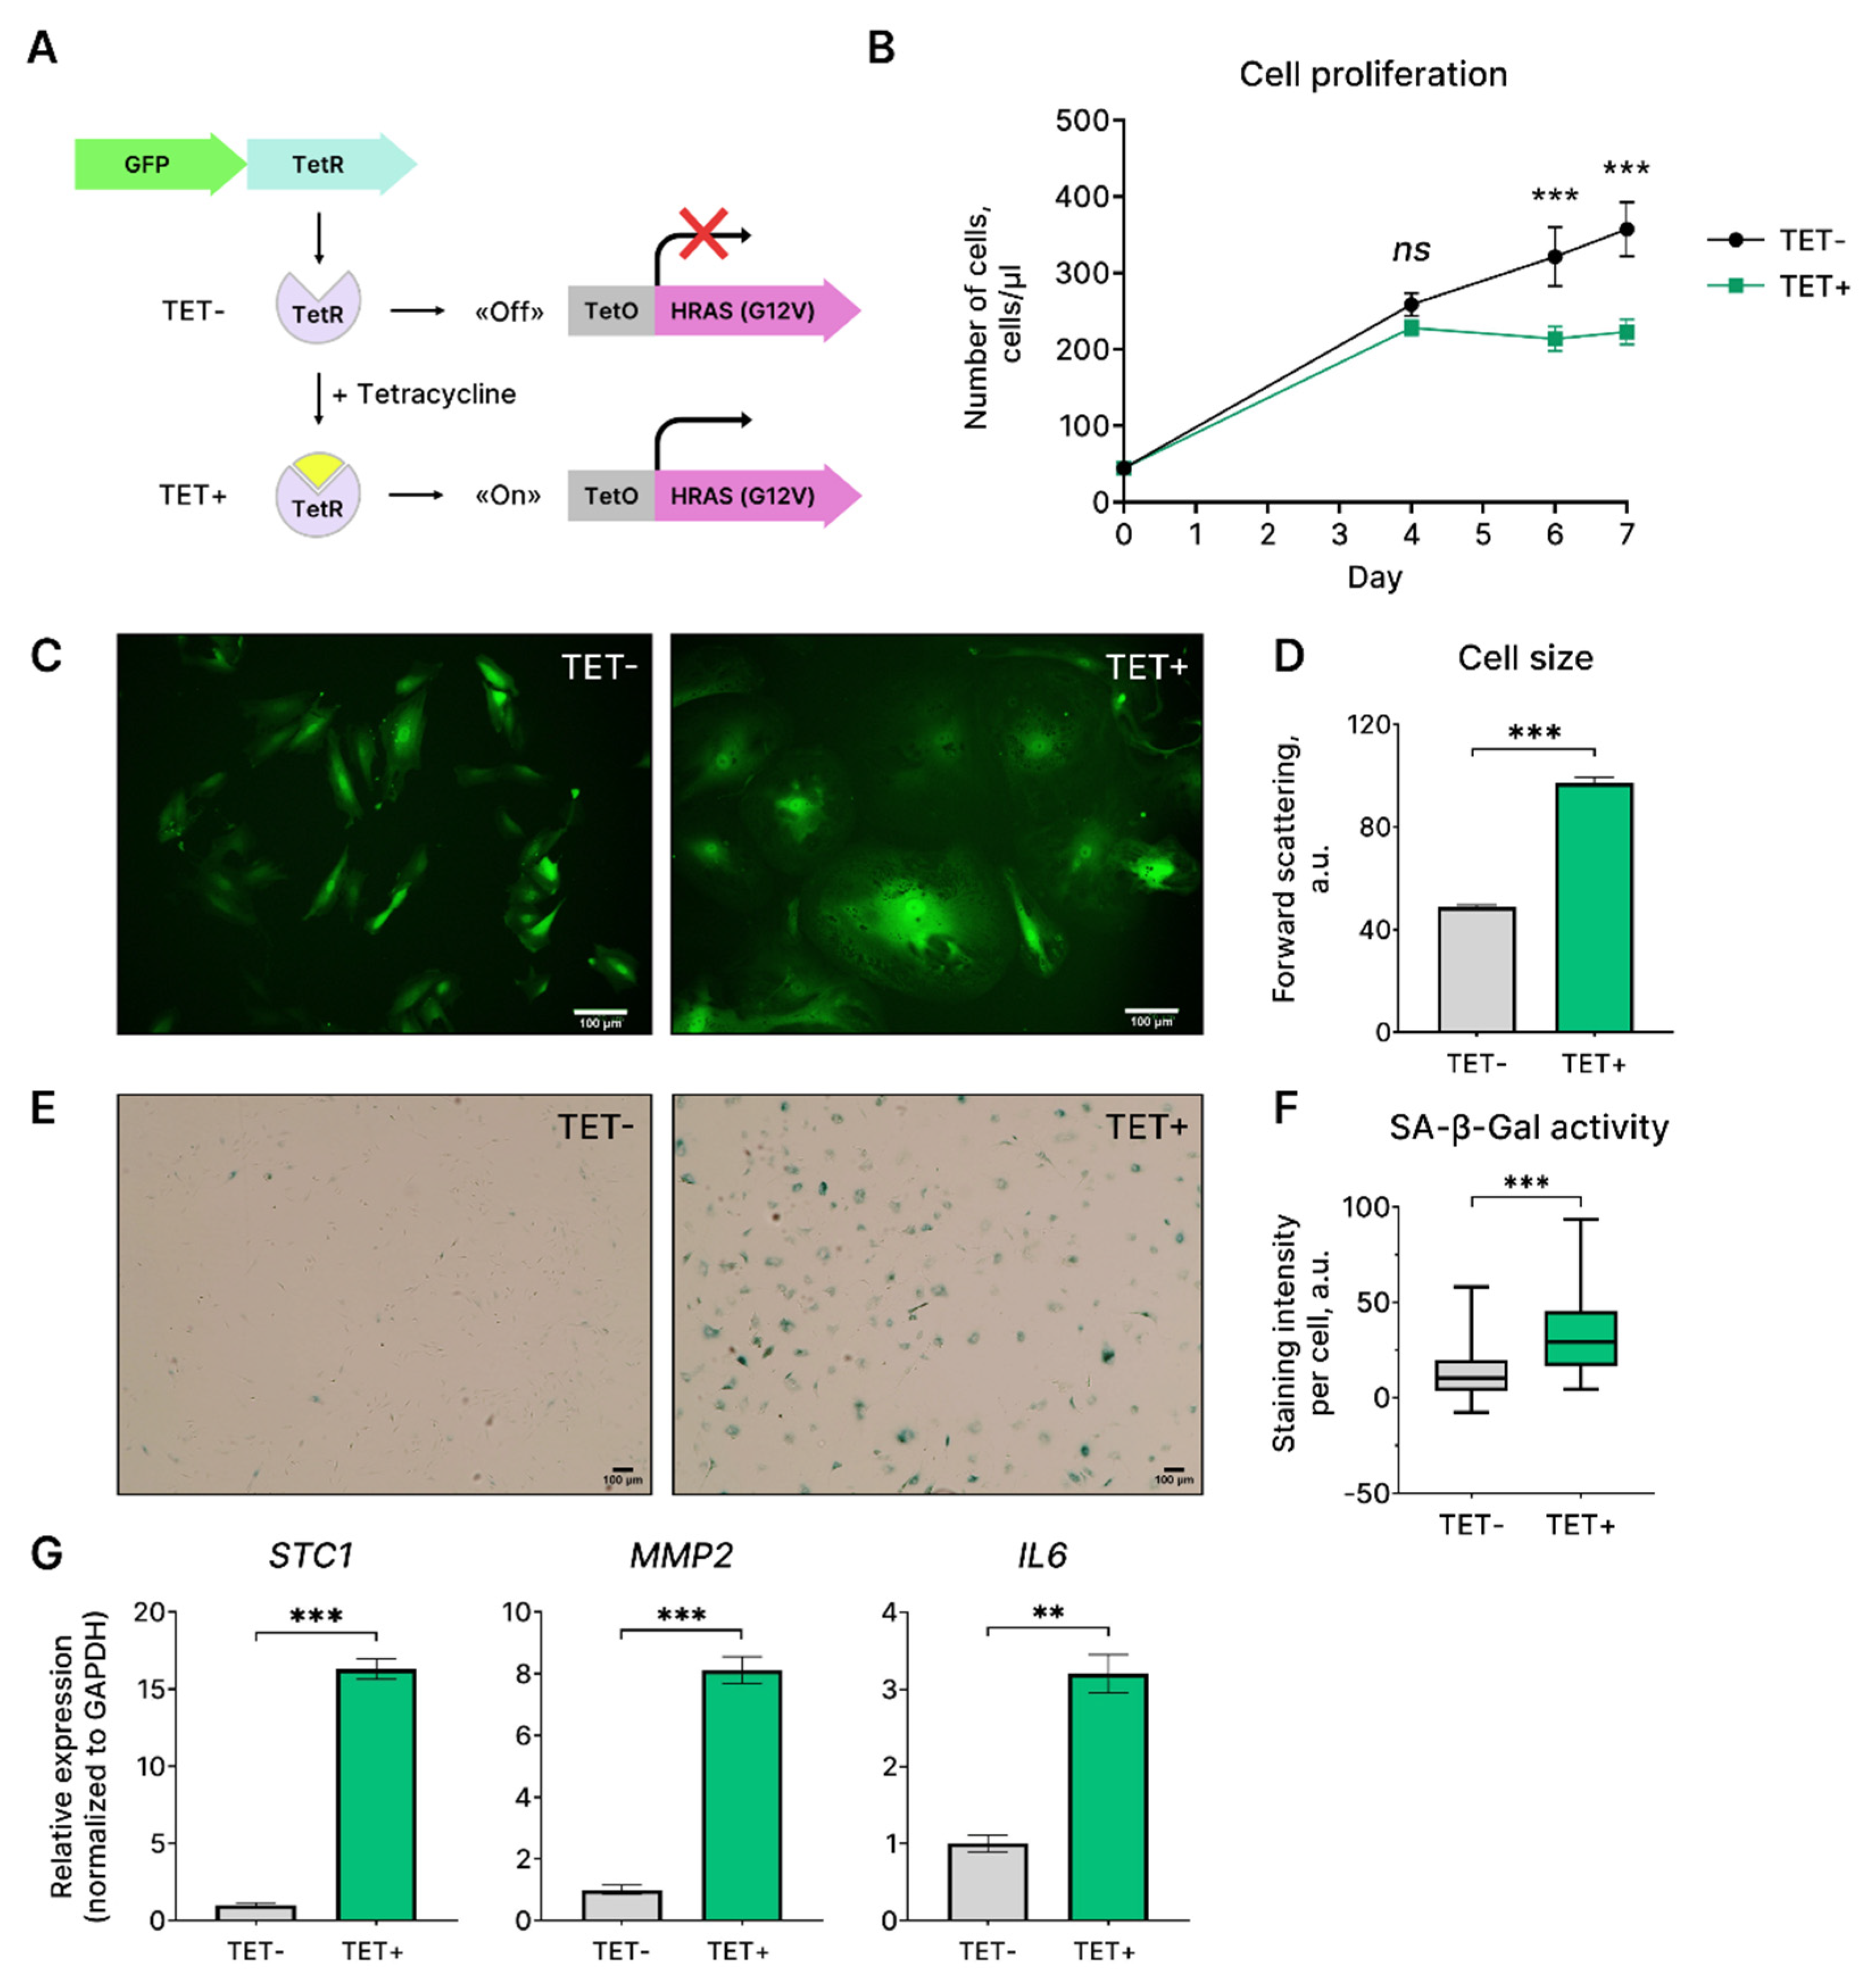
10]. Similar to other cell types, upon HRAS
G12V expression EnSC acquire all features typical for senescent cells, including proliferation block, altered morphology and SA-β-Gal activity. Commonly, complete proliferation loss and development of senescent phenotype are considered as the consequences of DDR resulting from hyperreplication of genomic DNA induced by the oncogene expression [
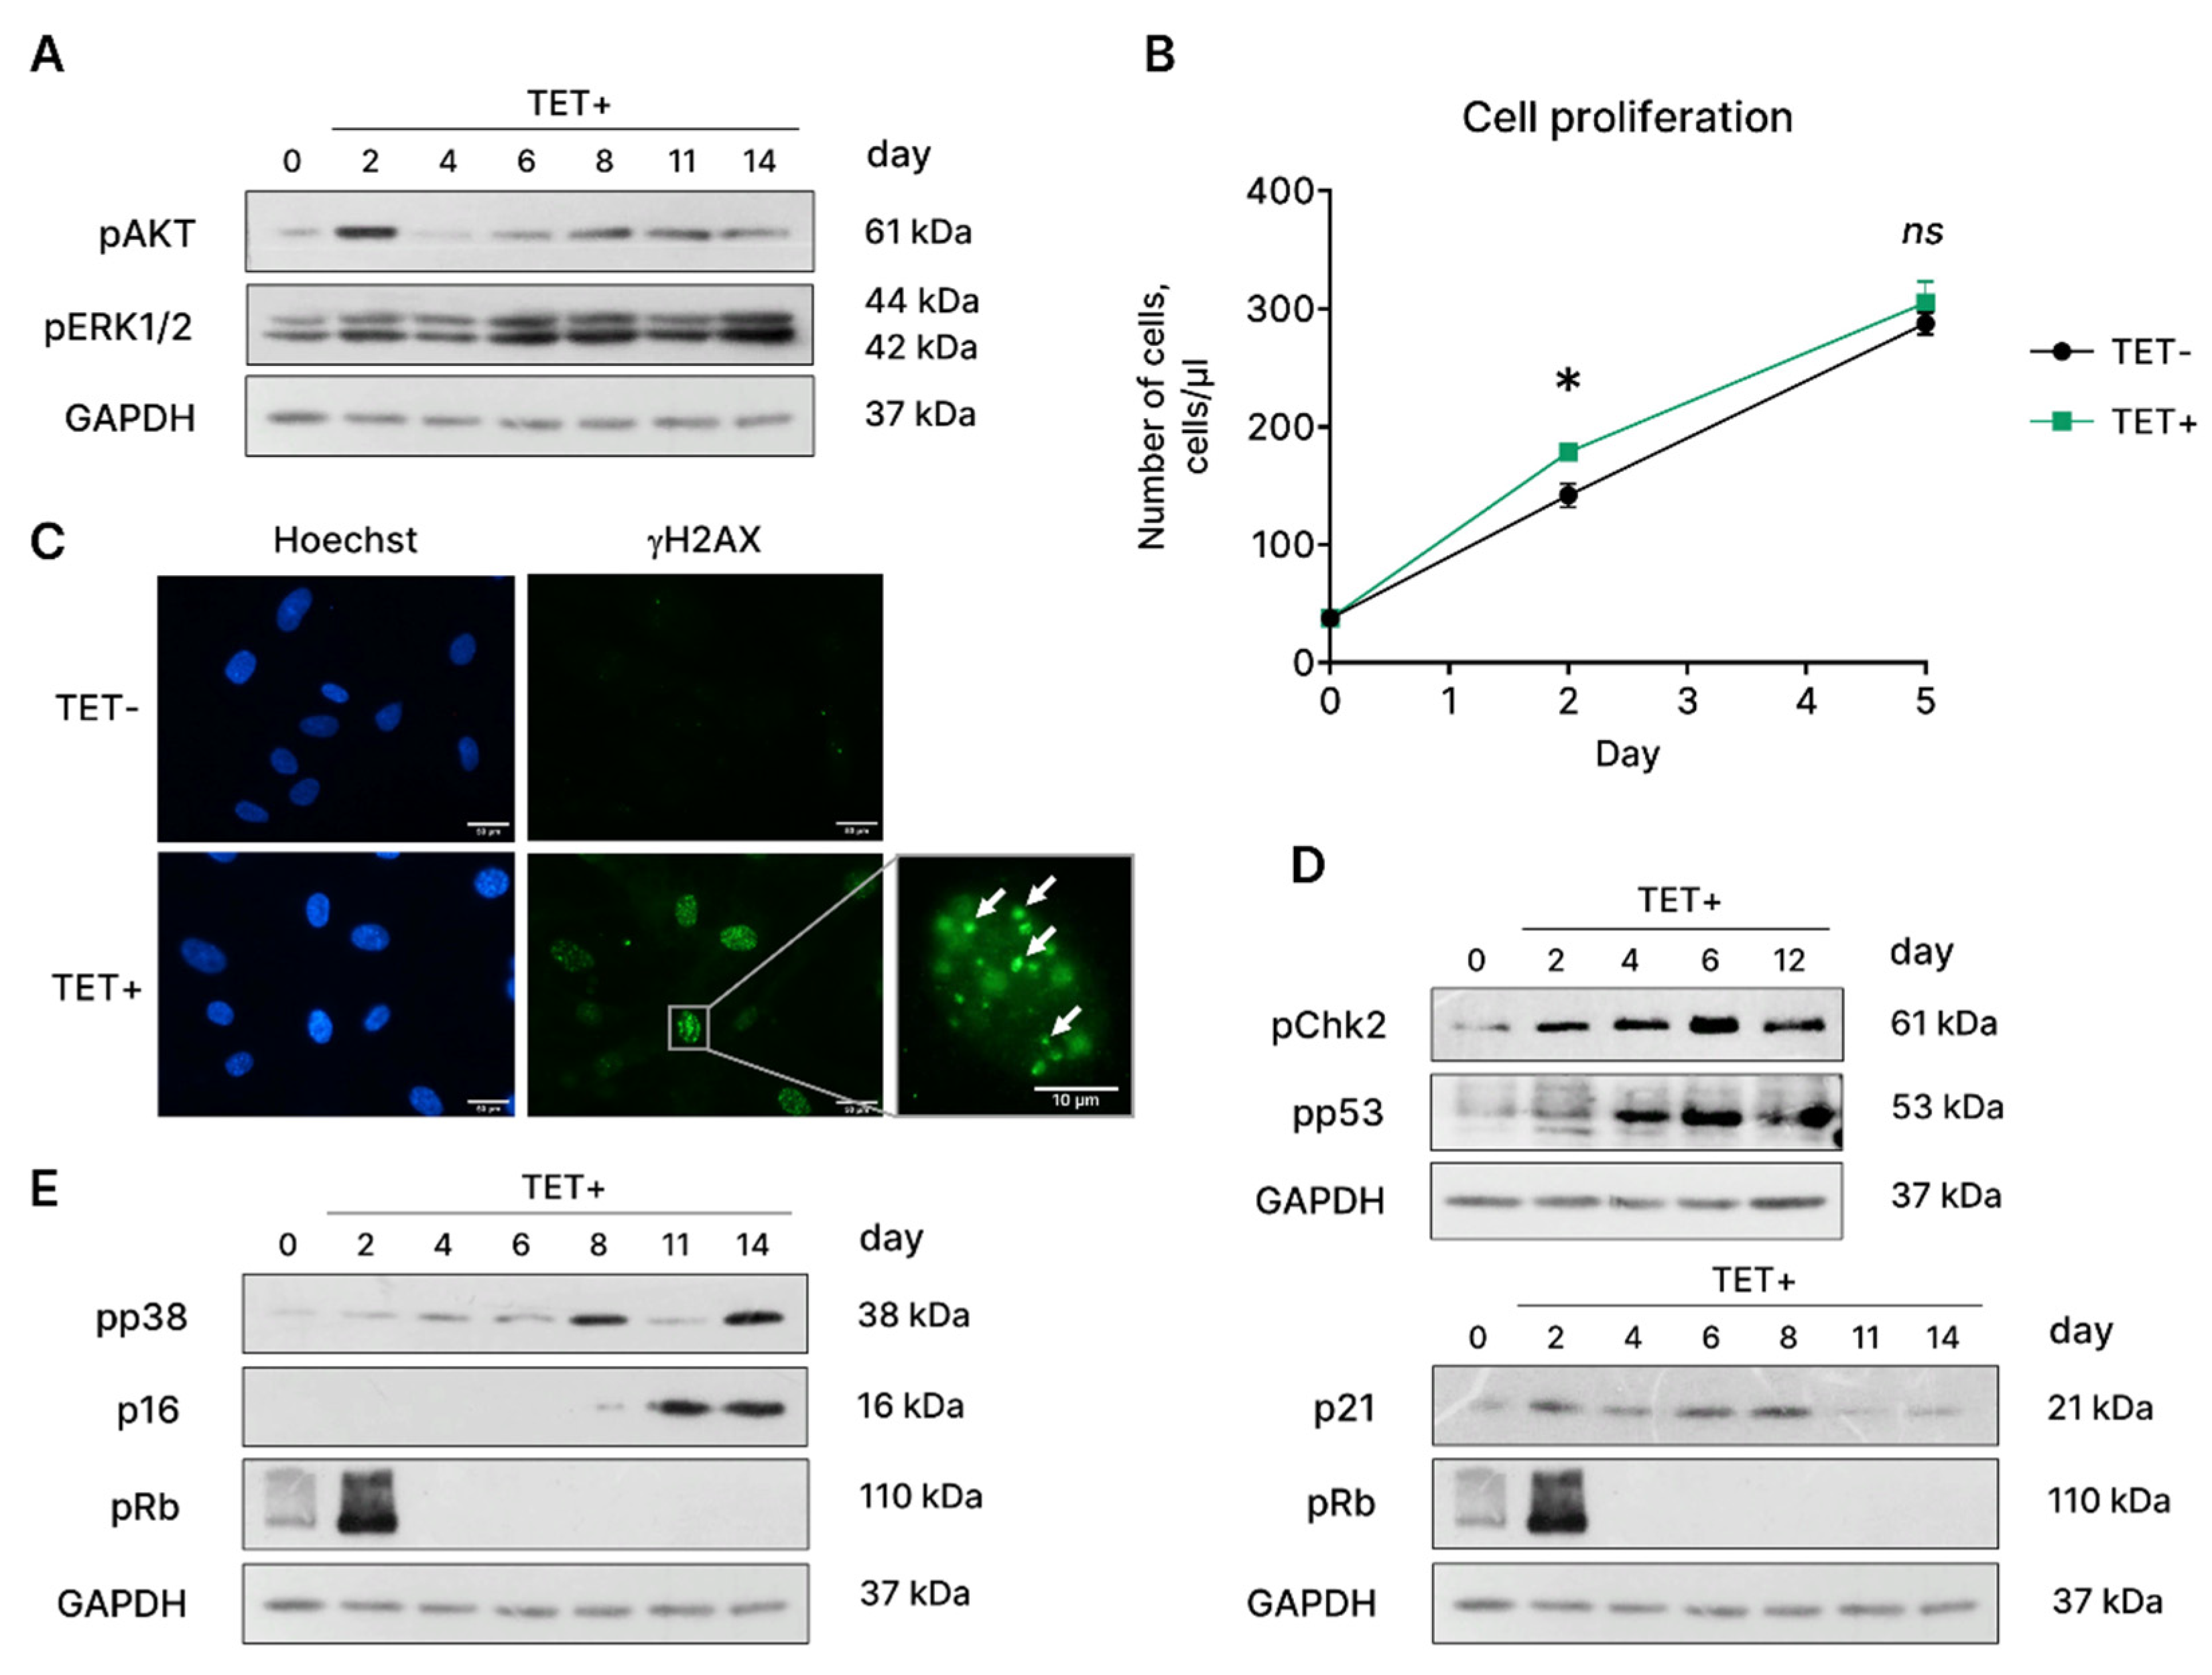
24]. In line with this notion, we revealed a brief period of hyperproliferation of HRAS
G12V-expressing EnSC followed by proliferation arrest and appearance of the DNA damage.
Despite the concrete mechanism of DNA damage upon oncogene expression, DDR further leads to cell cycle arrest via p53/p21
WAF/CIP/Rb and/or p38/p16
INK4a/Rb pathways [
17]. Although the senescence as the outcome of oncogene expression may seem cell type-independent, molecular mechanisms underlying cell cycle arrest establishment during OIS largely depend on the cellular context [
28]. For example, expression of p53 is crucial for HRAS
G12V-induced senescence development in normal human fibroblasts, since its depletion prevents proliferation arrest in oncogene-expressing cells [
9,
24,
29]. Contrarily, normal human mammary epithelial cells as well as esophageal keratinocytes undergo HRAS
G12V-induced senescence via p53-independent mechanism [
30,
31]. The same controversy is true for p16
INK4a involvement in HRAS
G12V-induced senescence: while progression of OIS in fibroblasts rely on p16
INK4a expression, in HRAS
G12V-expressing normal human melanocytes depletion of p16
INK4a had no effect on senescence progression [
32,
33]. Notably, recent study revealed that expression of oncogenic HRAS
G12V together with p16
INK4a knockdown in EnSC induced high-grade endometrial stromal sarcoma in mice [
34]. Here we detected activation of both signaling pathways p53/p21
WAF/CIP/Rb and p38/p16
INK4a/Rb in HRAS
G12V-expressing EnSC. However, neither inhibition of p53 nor downregulation of p38/p16
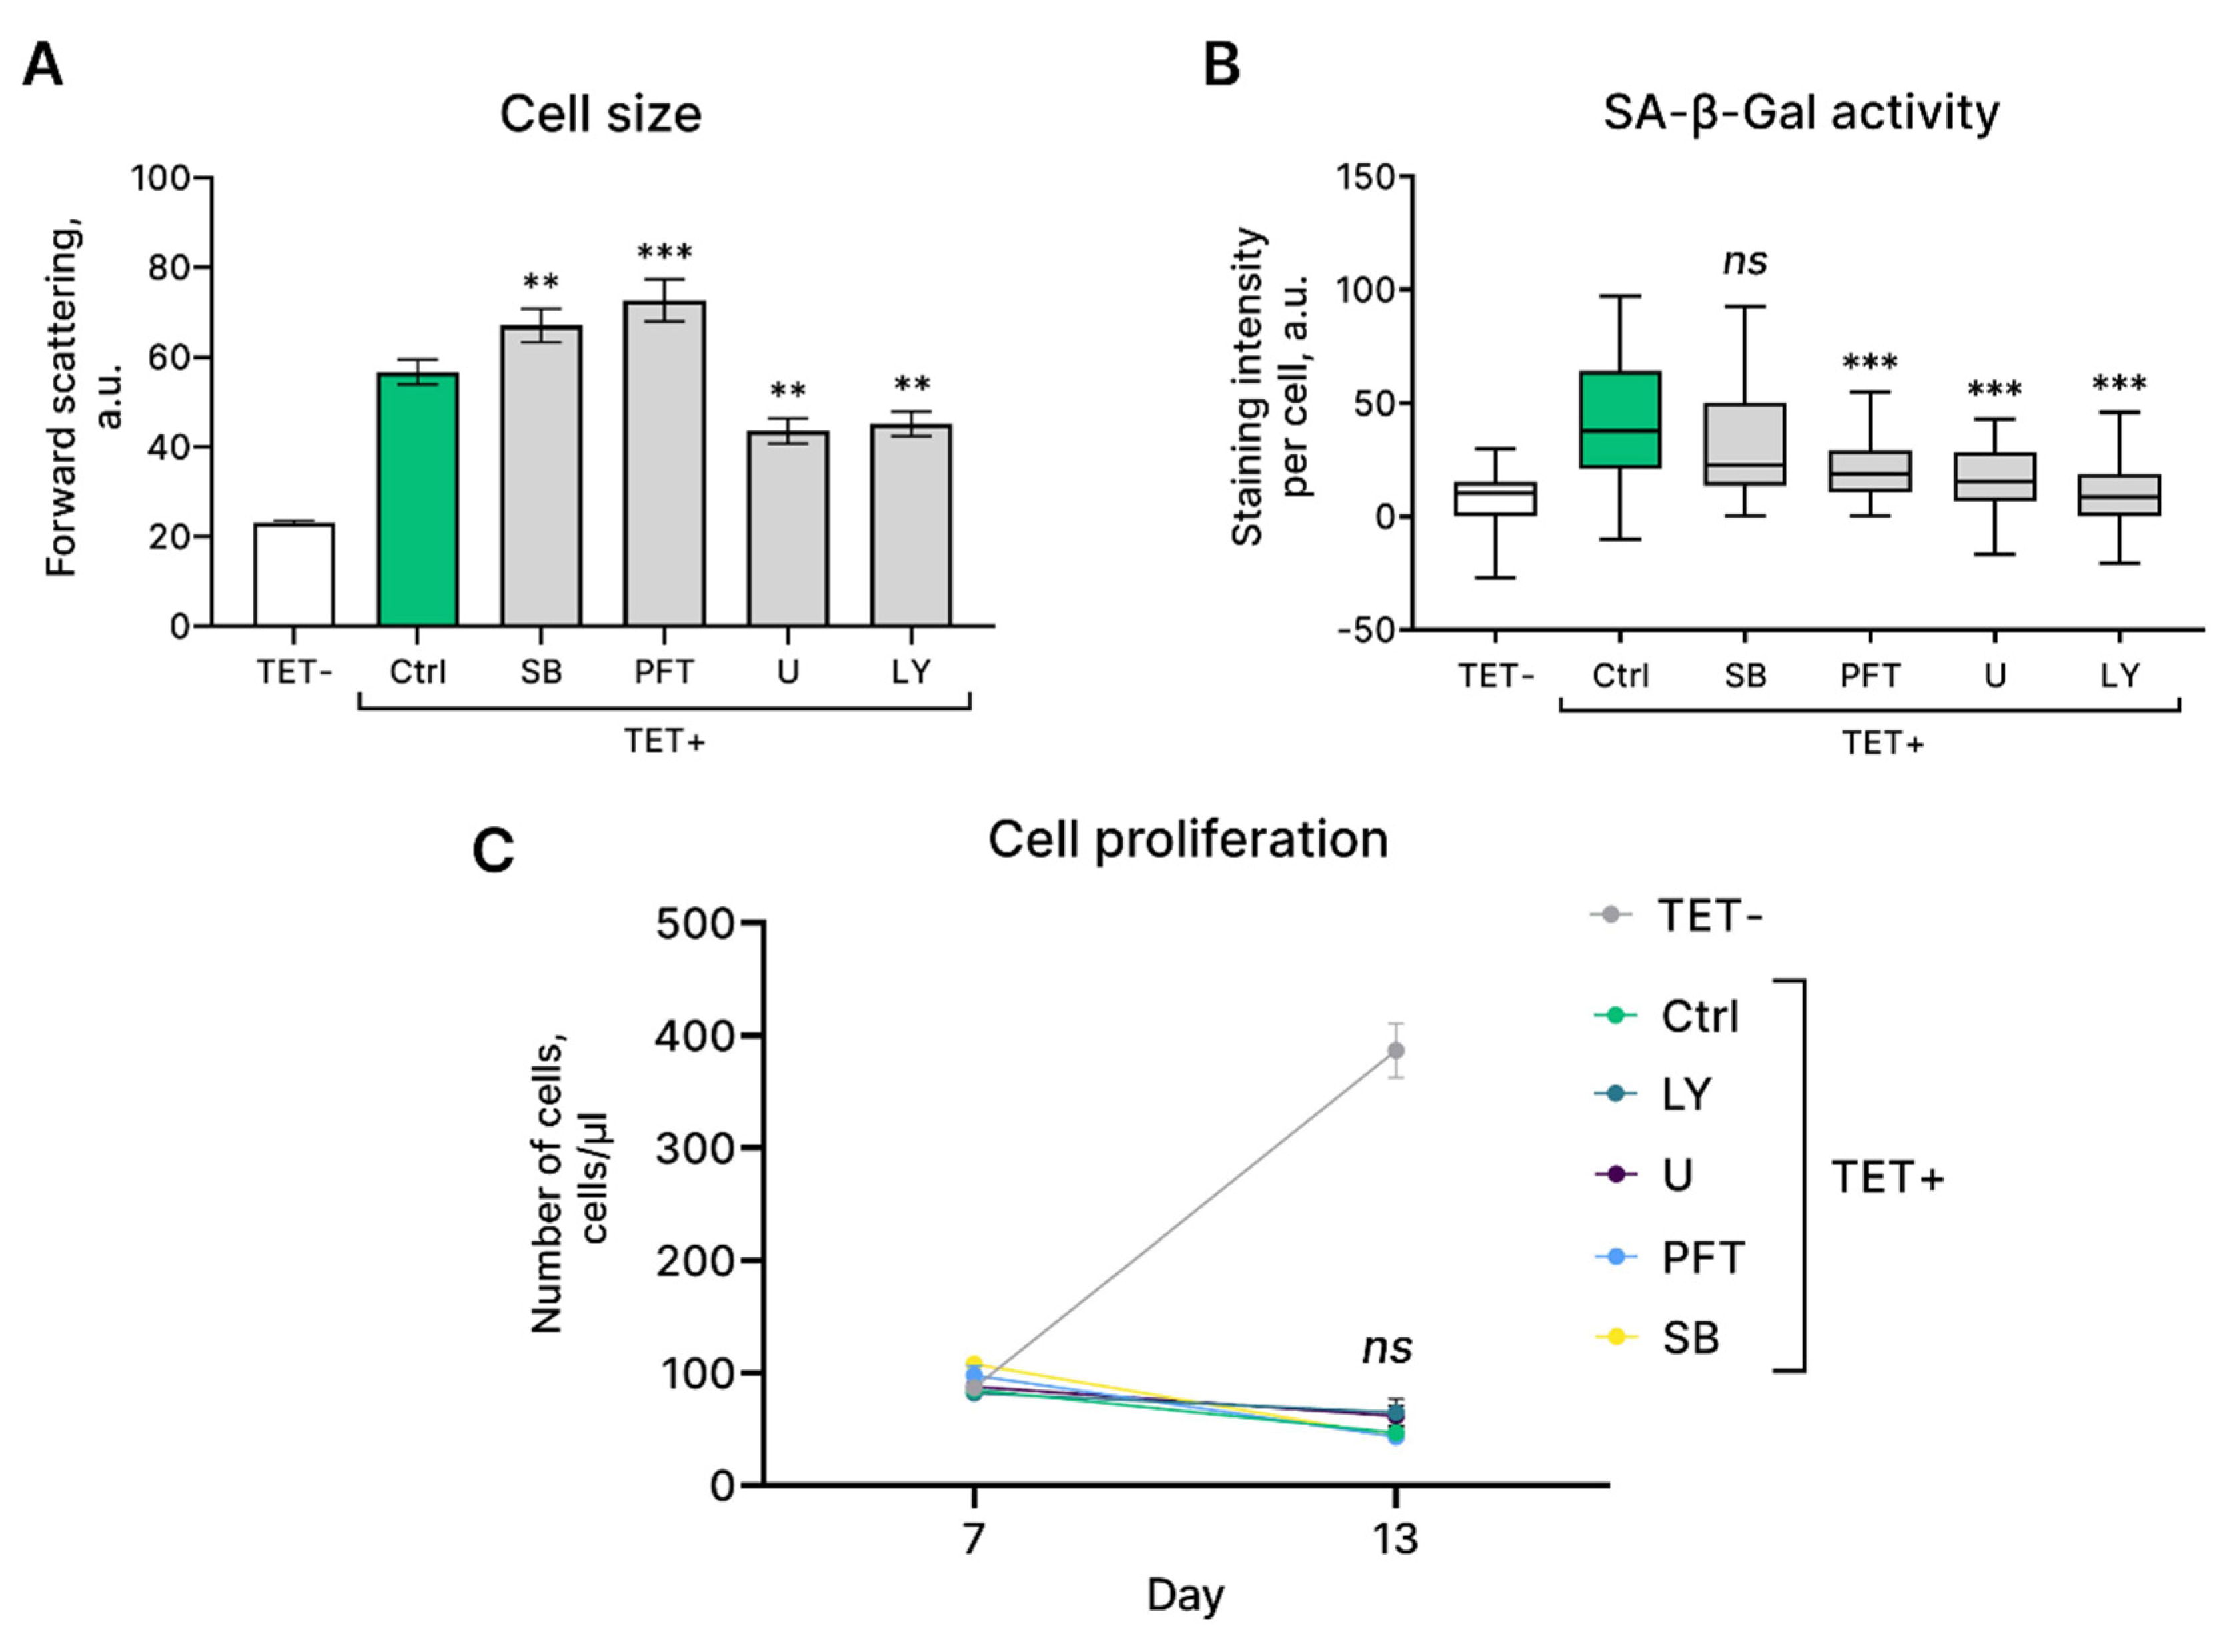
INK4a affected OIS progression in EnSC. Moreover, inhibition of ERK and AKT – downstream targets of the major signaling pathways directly activated by RAS – reduced senescent phenotype but also did not affect cell cycle block in oncogene-expressing EnSC. Together these data suggest the existence of compensatory pathways that regulate cell cycle arrest during OIS in EnSC.
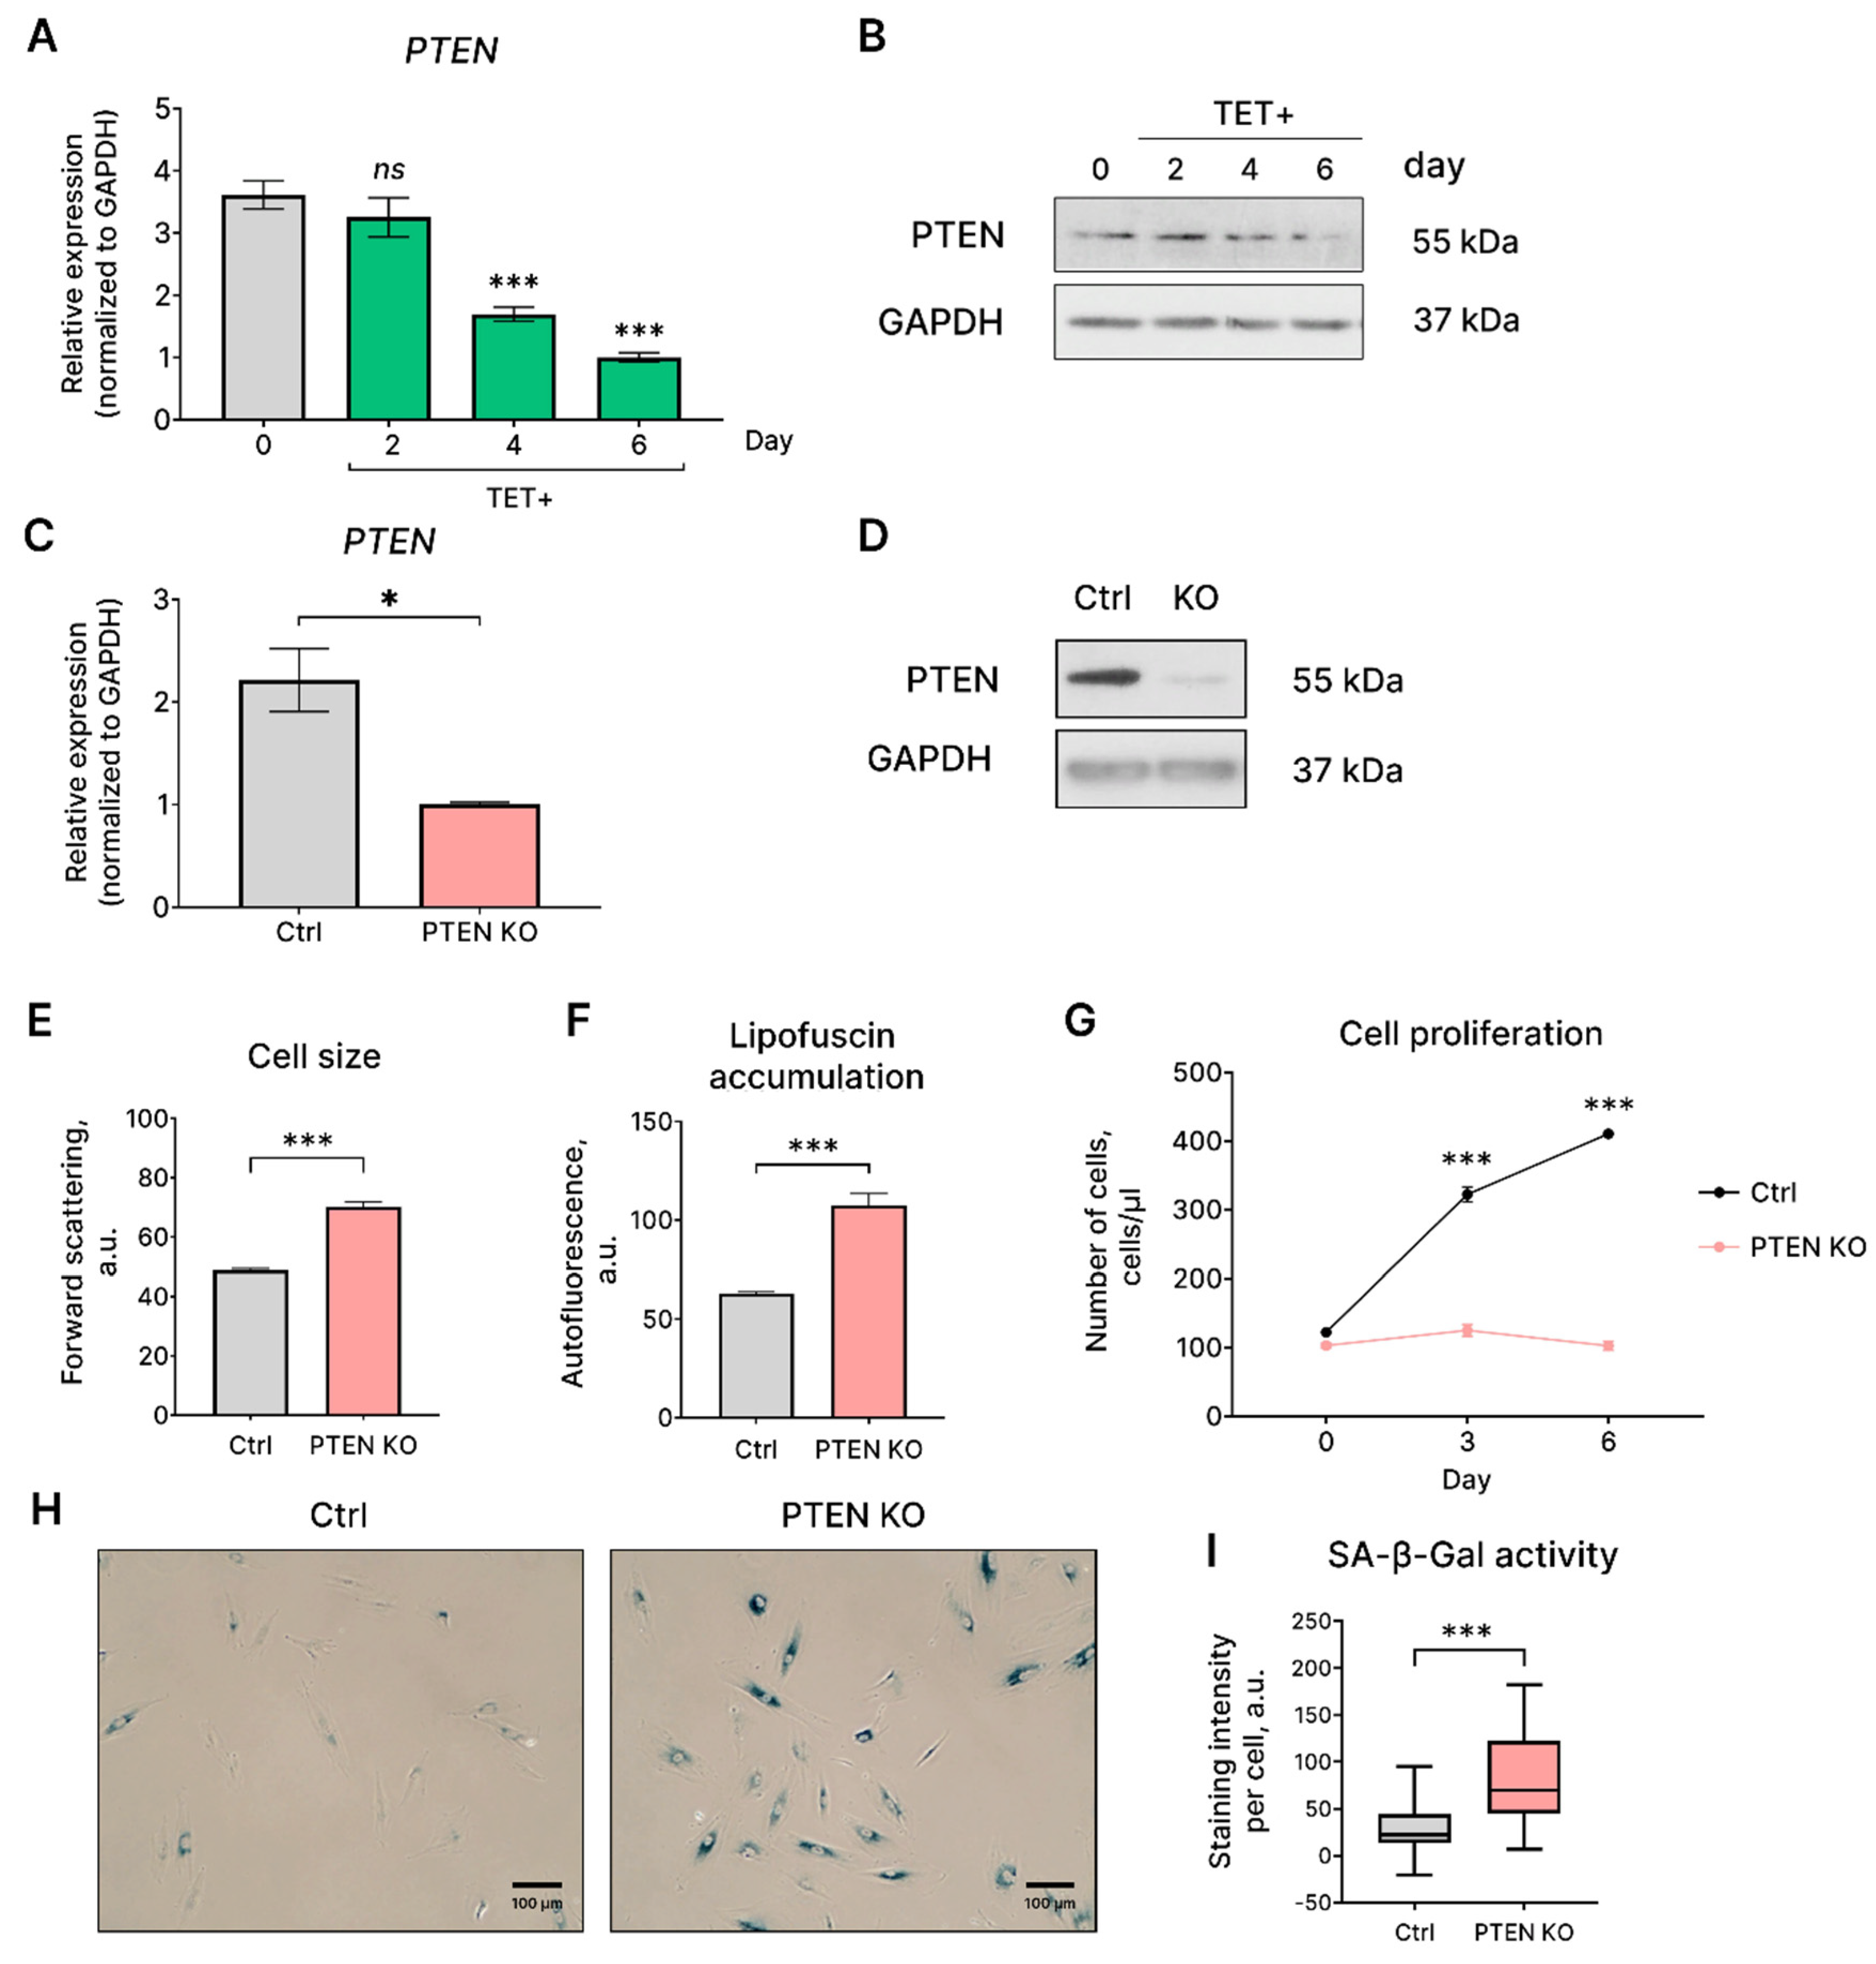
Further analysis of the molecular consequences of HRAS
G12V expression in EnSC uncovered gradual loss of PTEN expression. Earlier it was shown that oncogenic RAS down-regulates expression of the proapoptotic tumor suppressor PTEN in fibroblasts and epithelial cells via p53-independent pathway [
23]. The authors of the above study experimentally verified that oncogenic RAS might suppress PTEN expression via the RAF/MEK/ERK/c-Jun pathway leading to cellular transformation. However, in case of HRAS
G12V-expressing EnSC decreased expression of PTEN did not lead to cellular transformation. By performing additional set of experiments, we uncovered that PTEN loss itself is sufficient to trigger senescence in EnSC. This result is in line with the existing literary data uncovering tumor suppressor loss-induced form of senescence triggered by reduced expression of PTEN gene [
35,
36]. It should be highlighted that previous studies considered both HRAS
G12V- and PTEN-loss-induced forms of senescence separately, while the present study provides the first evidence of the possible intersection between these forms of senescence. Together the results obtained allow speculating that PTEN loss might form backup mechanism that additionally controls proliferation arrest during HRAS
G12V-induced senescence of EnSC.
Despite of the tight molecular control of proliferation arrest during OIS, a growing body of evidence demonstrates that cells might escape from OIS through cell-autonomus and cell-non-autonomus mechanisms, including derepression of hTERT locus, reorganization of topologically associated domains, stemness-associated reprogramming and downregulation of histone demethylases [
14,
19]. For example, previous study revealed that the population of the human diploid fibroblasts could spontaneously escape from OIS induced by HRAS
G12V [
19]. The authors demonstrated preserved proliferation and decreased expression of p16
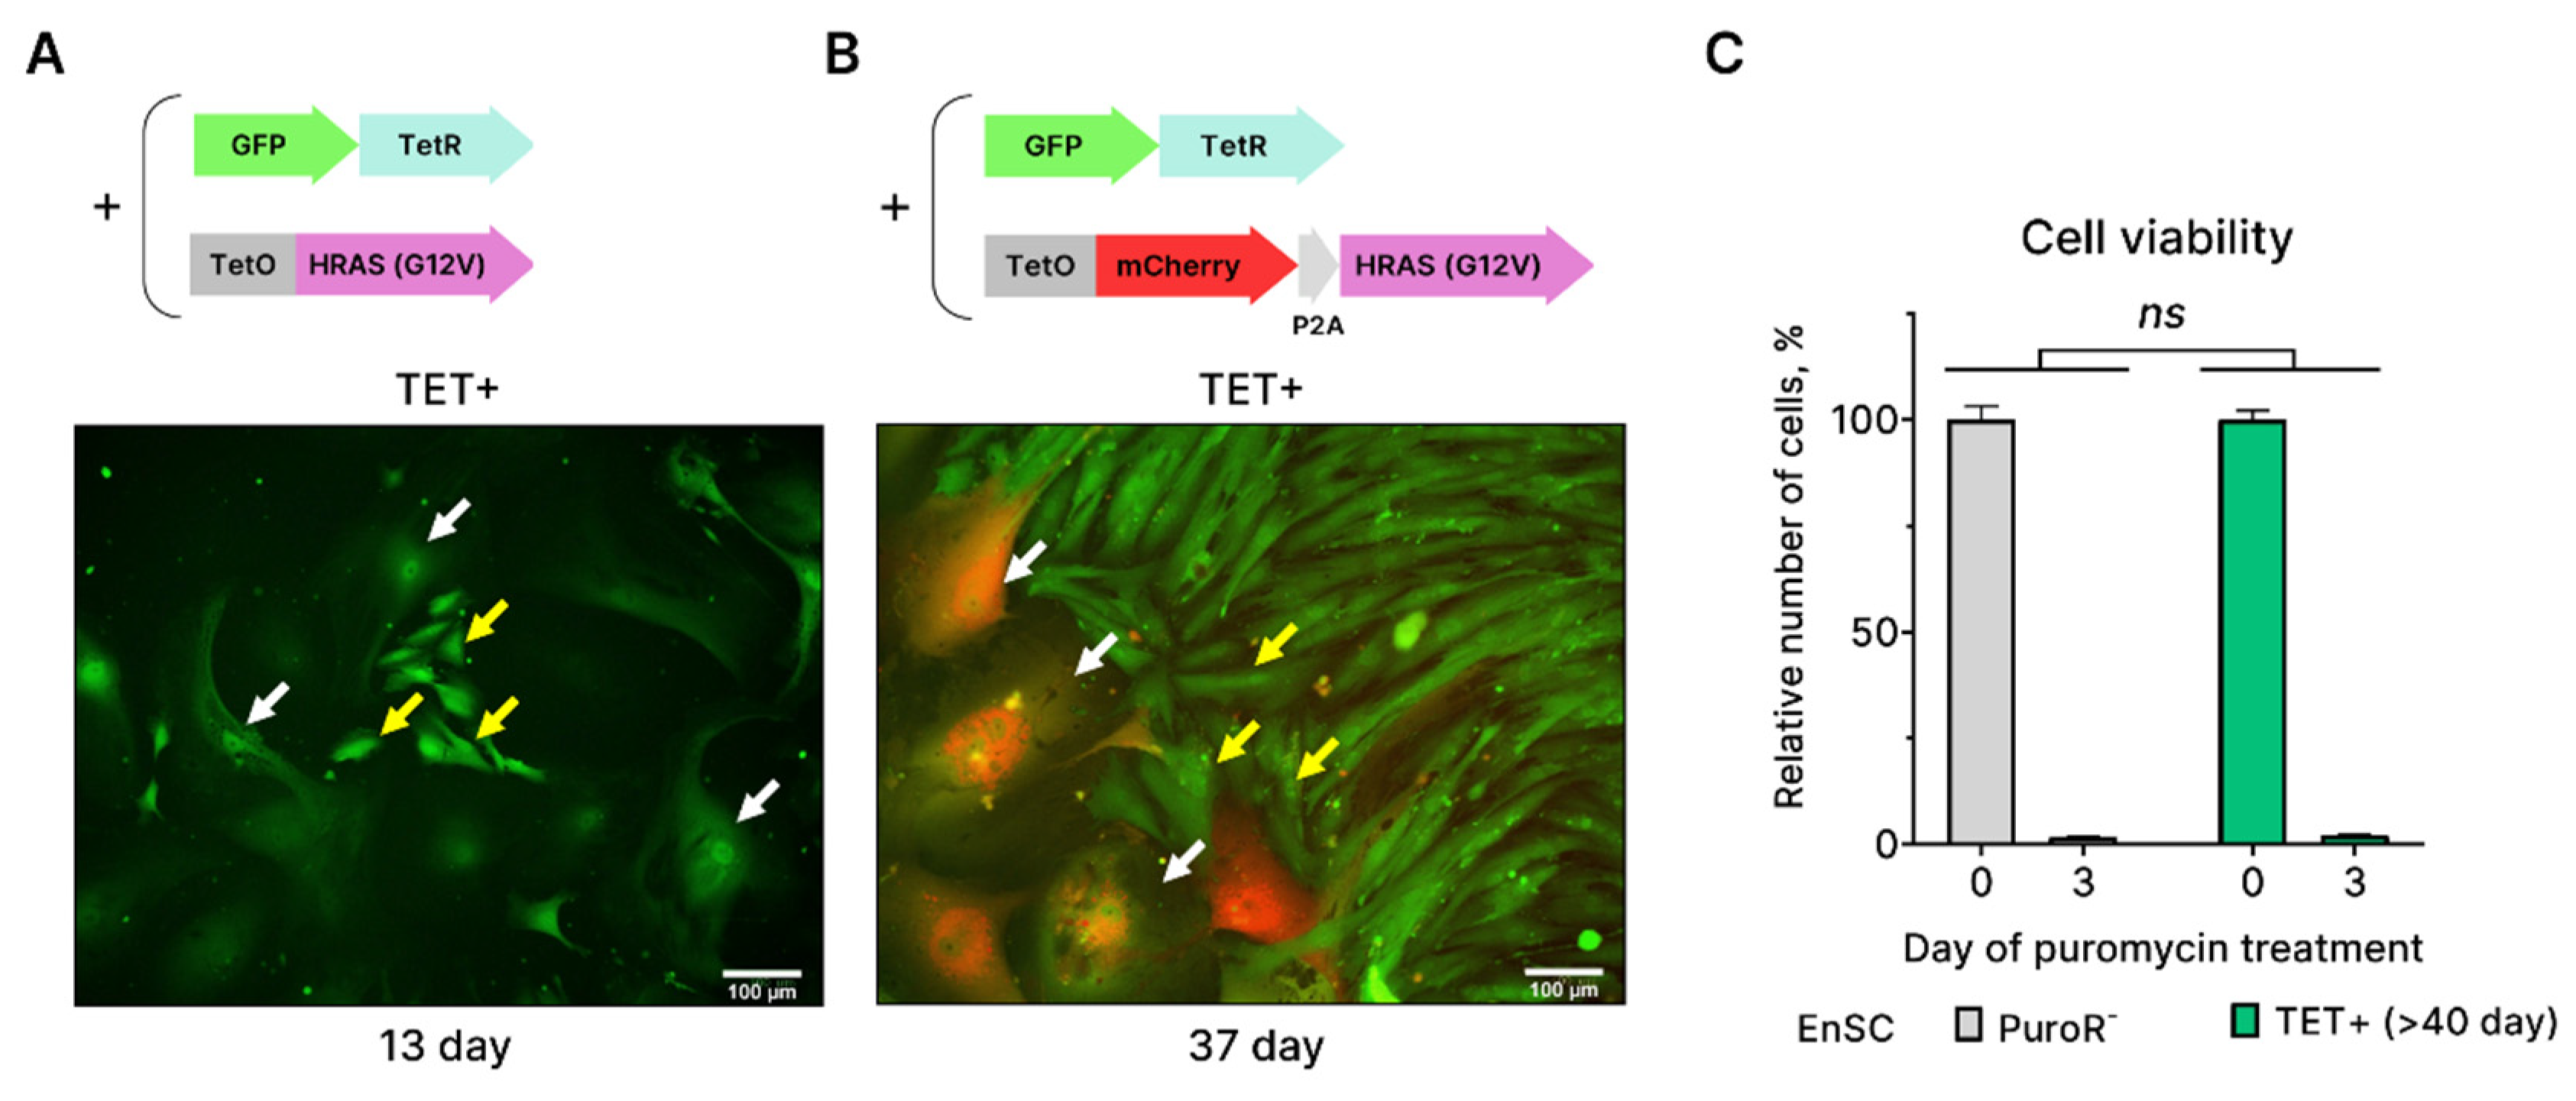
INK4a in OIS-escaped fibroblasts. Similarly to these findings, we detected the appearance of small proliferating EnSC, which later on completely replaced senescent EnSC from the population. However, we experimentally verified that these small cells originated from imperfect lentiviral transduction and further antibiotic selection. Probably, the results of the above study might also outcome from the technical batches of the transduction procedure, since OIS-escaped fibroblasts were prone to stress-induced senescence and were not able for anchorage-independent growth in soft-agar [
19]. According to our data, EnSC that expressed HRAS
G12V remained in senescent state for prolonged periods and were not able to overcome OIS and resume proliferation.
Another possibility to escape from OIS that should be taken into account might result from the physiological oestrogen-mediated regulation of EnSC proliferation within endometrium. This possibility is reinforced by the fact that oestrogen controls telomerase activity and hTERT expression in various estrogen targeted tissues, including endometrium [
37]. Indeed, oestrogen deficiency leads to telomere shortening, while, oestrogen hyperstimulation increases telomerase activity and maintains telomere length [
38]. Moreover, oestrogen supplementation turned out to be effective to reduce senescence of various types of cells [
20,
21,
22]. Notably, HRAS
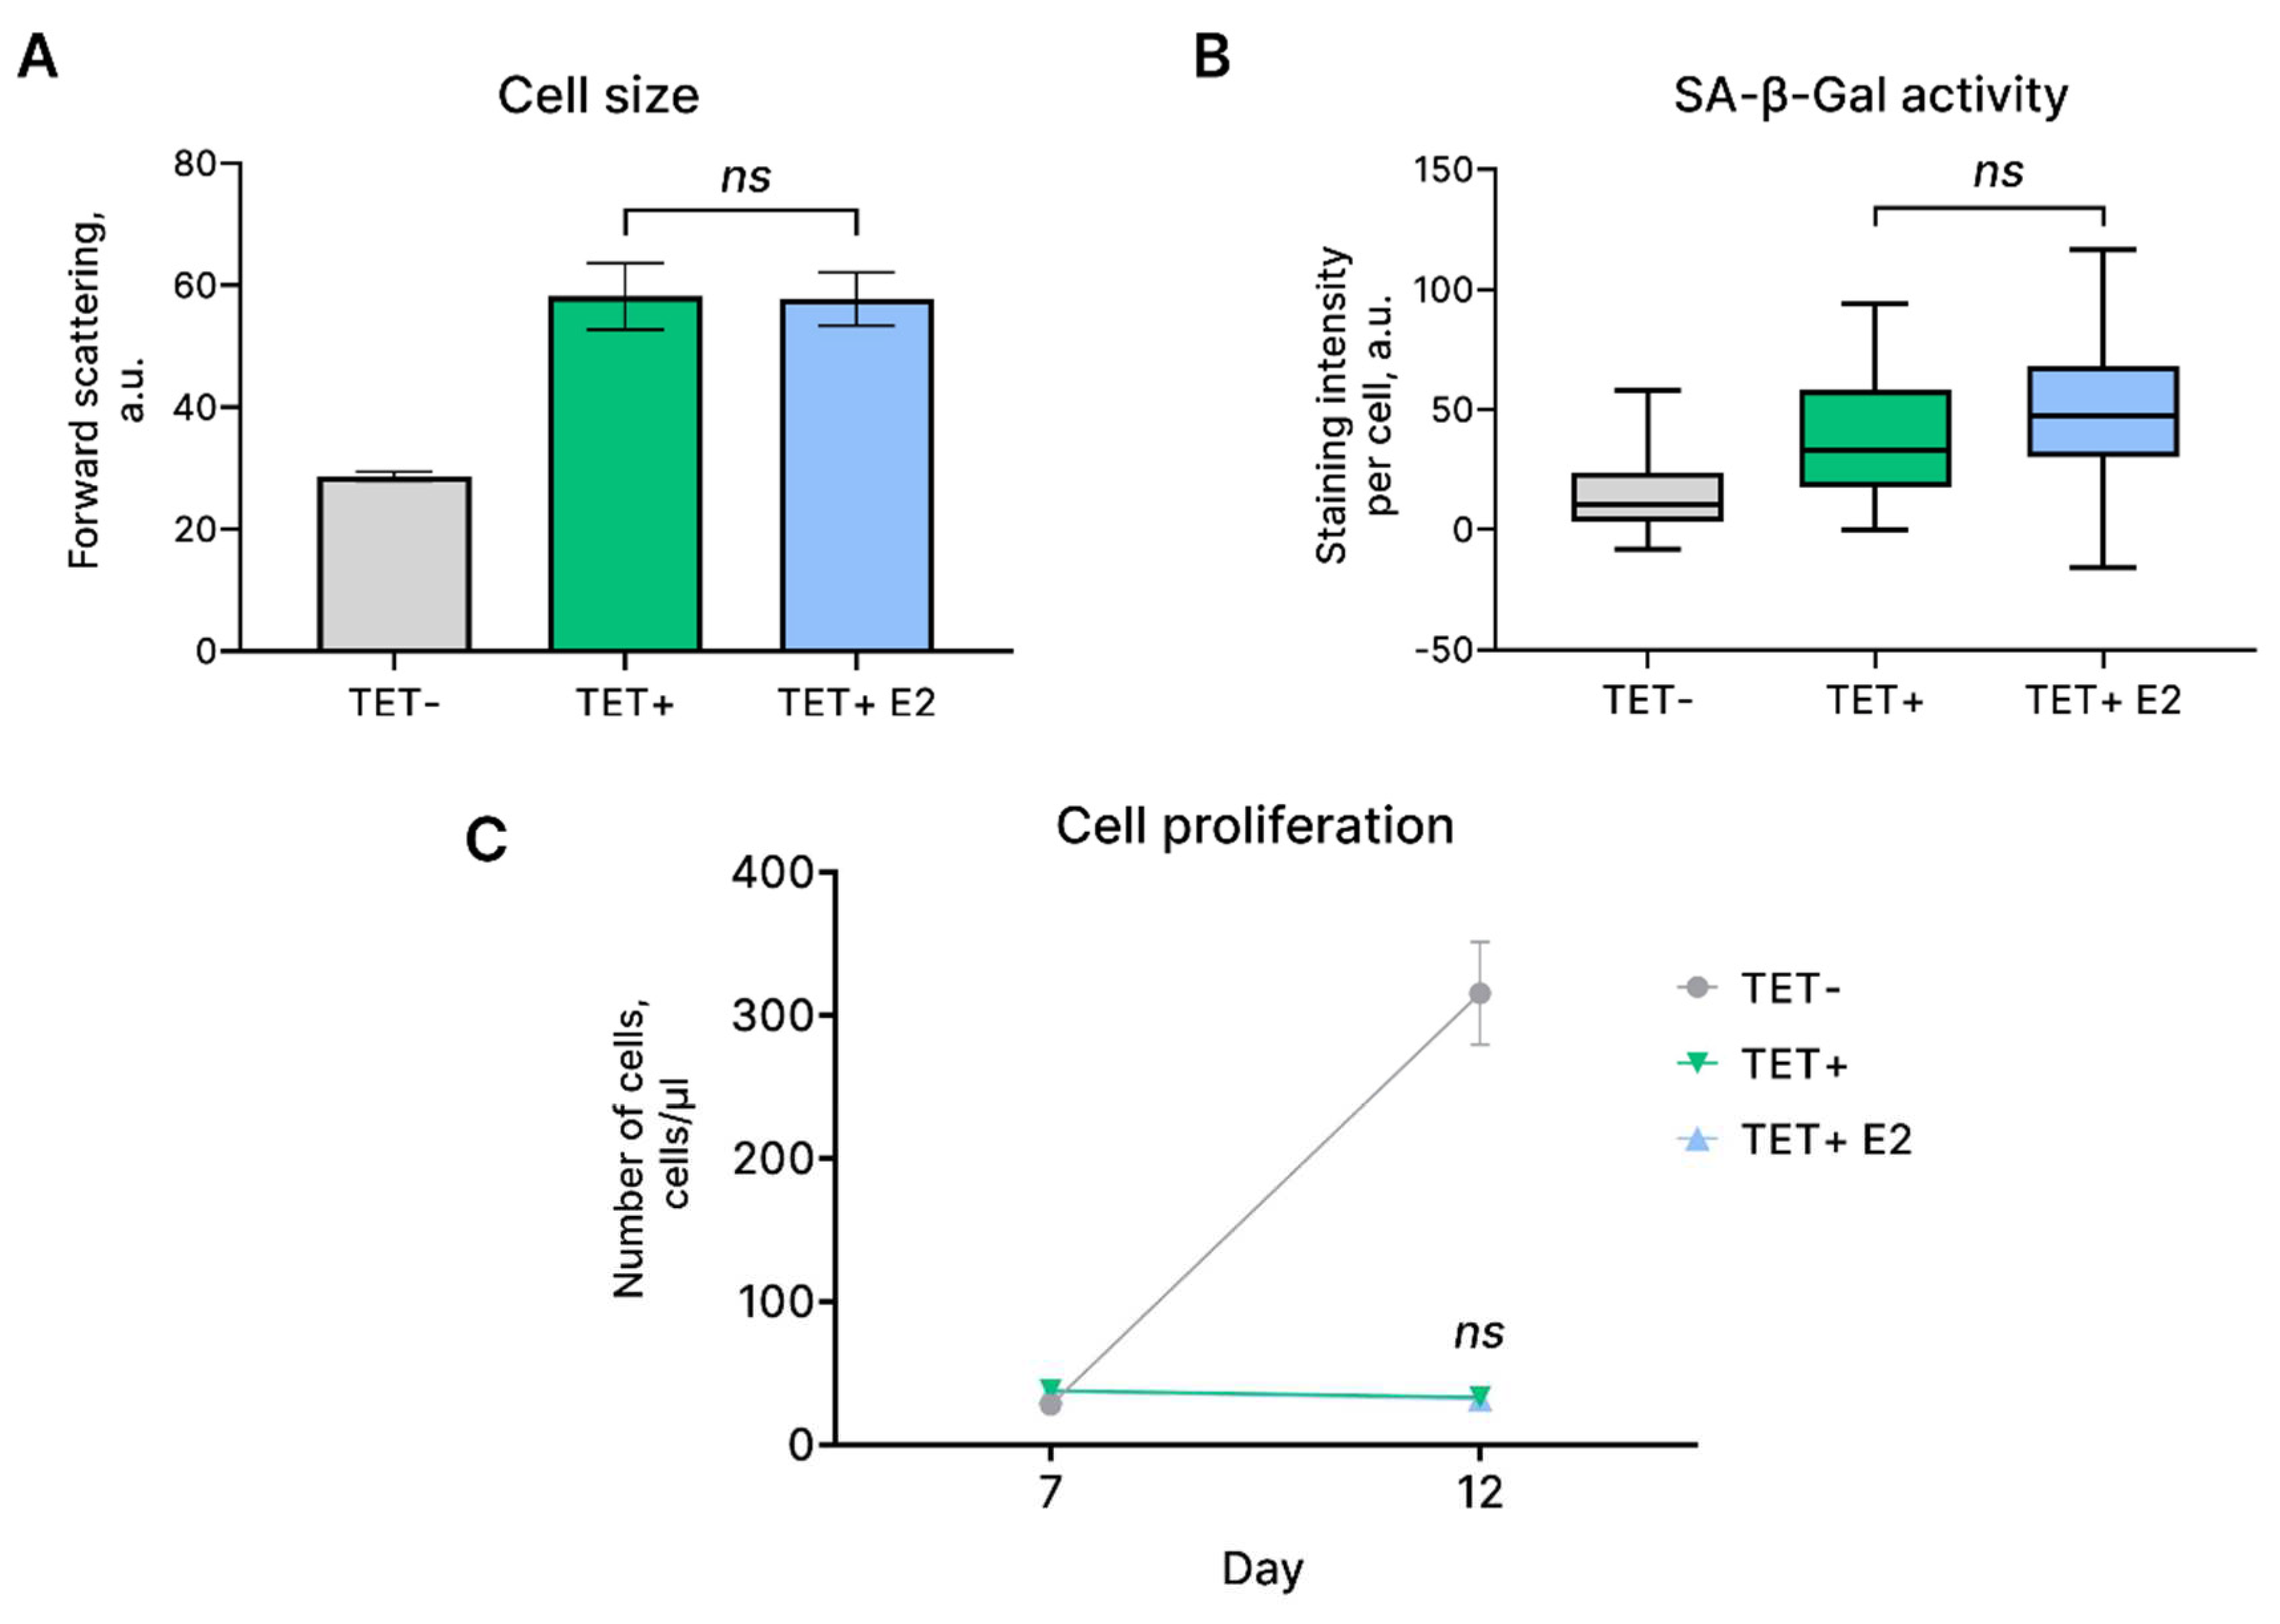
G12V-expressing EnSC remained stably arrested and preserved all the features of senescent cells despite of oestrogen addition.
4. Materials and Methods
4.1. EnSC culture conditions
EnSC line used in the present study was obtained from the shared research facility “Vertebrate cell culture collection” of the Institute of Cytology of the Russian Academy of Sciences (supported by the Ministry of Science and Higher Education of the Russian Federation, Agreement №075-15-2021-683). Cells were cultured in DMEM/F12 (Gibco BRL, USA) at 37 ˚C in humidified incubator containing 5% CO2. Cultural medium was supplemented with 10% FBS (HyClone, USA), 1% penicillin-streptomycin (Gibco BRL, USA) and 1% glutamax (Gibco BRL, USA). Serial passaging was performed when the cells reached 80% – 90% confluence. Cells at early passages (5 – 9) were used in all experiments.
4.2. Molecular cloning
Four-steps molecular cloning was performed to insert the sequence encoding the mCherry fluorescent protein into pLenti CMV/TO RasV12 Puro (w119-1) (Addgene #22262). Firstly, mCherry sequence together with P2A sequence were amplified from pUltra-hot lentivector (Addgene #24130) using specific primers listed in
Table 1. Secondly, HRAS
G12V sequence was amplified from pLenti CMV/TO RasV12 Puro (w119-1) using specific primers listed in
Table 1. Of note, mCherry reverse and HRAS
G12V forward primers contained complementary sites for further overlap. The obtained sequences were then combined by amplification using two primers – mCherry forward and HRAS
G12V reverse (annealing temperature 67 ˚С, 2 min elongation). Final product was inserted into pLenti CMV/TO RasV12 Puro (w119-1) by restriction using XbaI (New England Biolabs, USA) and BamHI (New England Biolabs, USA) and further ligation using Quick Ligation™ Kit (New England Biolabs, USA). The obtained lentivector was named HRAS-mCherry pLenti CMV/TO RasV12 Puro.
For CRISPR-mediated PTEN knockout pCC_01—hU6-BsmBI-sgRNA(EþF)-barcode-EFS-Cas9-NLS-2A-Puro-WPRE (Addgene #139086) was used. Oligonucleotide sequences of single guide RNAs (sgRNAs) for
PTEN were designed using the CCTop-CRISPR/Cas9 target online predictor and the CRISPR-ERA web applications, sequences are presented in
Table 1. SgRNA coding sequences were inserted into the indicated above lentivector using BsmBI-based cloning (Thermo Fisher Scientific, USA), following the protocols described in our previous study [
18]. Unmodified lentivector, containing non-targeting sgRNAs sequence, was used as non-targeting control.
All amplification procedures were performed using Encyclo Plus PCR kit (Evrogen, Russia). DNA products were cleaned up from PCR mix/agarose gels using Cleanup Standard kit (Evrogen, Russia). Plasmid DNA was extracted using Plasmid Miniprep kit (Evrogen, Russia). All procedures were performed according to manufacturer’s instructions. Plasmids were amplified using E.coli strain Stbl3.
4.3. Lentiviral transduction and tetracycline treatment
EnSC were transduced with the viruses produced with the use of the following lentivectors: (1) pLenti CMV/TO RasV12 Puro (w119-1) (Addgene #22262), (2) FgH1tUTG (Addgene #70183), (3) HRAS-mCherry pLenti CMV/TO RasV12 Puro, (4) pCC_01—hU6-BsmBI-sgRNA(EþF)-barcode-EFS-Cas9-NLS-2A-Puro-WPRE and (5) its variant for
PTEN knockout. Protocols of lentiviral particles production and EnSC lentiviral transduction are described in detail in our previous article [
18]. To induce HRAS
G12V expression EnSC transduced with the appropriate lentiviruses were cultured in medium containing 20 µM tetracycline (Sigma-Aldrich, USA). Tetracycline-containing medium was changed every two days.
4.4. Cells treatment conditions
All experimental treatments were performed in complete culture media; either inhibitor was added simultaneously with tetracycline every other day. The following inhibitors were used: 20 µM LY294002 (LY) (Sigma-Aldrich, USA), 10 µM U0126 (Sigma-Aldrich, USA), 5 µM SB203580 (SB) (Sigma-Aldrich, USA), 50 µM pifithrin-α (PFT) (Merck, Germany). For oestrogen treatment EnSC were treated with 10 nM β-Estradiol (Sigma-Aldrich, USA).
4.5. Flow cytometry
Measurements of proliferation, cell size, and autofluorescence (lipofuscin accumulation), were carried out by flow cytometry. Flow cytometry was performed using the CytoFLEX (Beckman Coulter, USA) and the obtained data were analyzed using CytExpert software version 2.0. Adherent cells were rinsed twice with PBS and harvested by trypsinization. Detached cells were pooled, resuspended in fresh medium and stained with 0.1 µg/mL 4′,6-diamidino-2-phenylindole (DAPI, Invitrogen, USA). DAPI-negative (living) cells were then counted and analyzed for autofluorescence and forward light scattering (reflecting cell size).
4.6. SA-β-Gal staining
SA-β-gal staining was performed using senescence β-galactosidase staining kit (Cell Signaling, USA) according to manufacturer’s instructions. Quantitative analysis of images was produced with the application of MatLab package. For each experimental point not less 50 randomly selected cells were analyzed.
4.7. Western blotting
Western blotting was performed as described previously [
15]. SDS-PAGE electrophoresis, transfer to nitrocellulose membrane and immunoblotting with ECL (Thermo Scientific, USA) detection were performed according to standard manufacturer’s protocols (Bio-Rad Laboratories, USA). Antibodies against the following proteins were used: glyceraldehyde-3-phosphate dehydrogenase (GAPDH) (clone 14C10) (Cell Signaling, USA), pp53 (Ser15) (clone 16G8) (Cell Signaling, USA), p21
WAF/CIP (clone 12D1) (Cell Signaling, USA), p16
INK4a (Affinity Biosciences, USA), pRb (Ser807/811) (Cell Signaling, USA), pChk2 (Thr68) (Cell Signaling, USA), pERK (Thr202/Tyr204) (Cell Signaling, USA), pAkt (Ser473) (Cell Signaling, USA), pp38 MAPK (Thr180/Tyr182) (clone D3F9) (Cell Signaling, USA), PTEN (clone 2F4C9) (Invitrogen, USA), horseradish peroxidase-conjugated goat anti-rabbit IgG (Cell Signaling, USA), and horseradish peroxidase-conjugated goat anti-mouse IgG (Cell Signaling, USA). Scans of uncropped blots presented in the study are available in
Supplementary Table S1.
4.8. Immunofluorescence
Cells grown on coverslips were fixed with 4% formaldehyde (15 min), permeabilized with 0.1% Triton X-100 (10 min) and blocked with 1% bovine serum albumin (1 h). Cells were incubated with primary anti-γH2AX antibodies (Abcam, USA) overnight at 4 ˚C, followed by the incubation with secondary antibodies — Alexa Fluor 488 goat anti-mouse (Invitrogen, USA) for 1 h at room temperature. The slides were counterstained with 1 µg/ml DAPI (DAPI, Invitrogen, USA), mounted using 2% propyl gallate and analysed using Zeiss LSM Pascal 5 laser scanning microscope (Carl Zeiss, Germany). ZOE Fluorescent Cell Imager (BioRad, USA) was used to acquire images of living cells expressing fluorescent reporter proteins.
4.9. RNA extraction, reverse transcription and real time PCR
RNA extraction, reverse transcription and real time PCR were performed as described in our previous study [
17]. Reagents for RNA extraction (ExtractRNA reagent), for reverse transcription (MMLV RT kit) and for real time PCR (HS SYBR kit) were obtained from Evrogen, Russia. Gene expression levels were assessed using the Realtime PCR BioRad CFX-96 amplifier (BioRad, USA), the following analysis of the obtained data was performed using the Bio-Rad CFX Manager software (BioRad, USA). Primer sequences and the corresponding annealing temperatures are listed in
Table 2.
4.10. Statistical analysis
All quantitative data are shown as mean ± SD. To get significance in the difference between two groups Welch’s t-test was applied. For multiple comparisons between groups, one-way ANOVA with Tukey honestly significant difference (HSD) was used. Statistical analysis was performed using GraphPad Prism version 8.0.5.
Author Contributions
Conceptualization, A.V.B.; methodology, A.V.B., P.I.D. and A.N.S.; software, A.L.T. and P.I.D.; validation, A.L.T.; formal analysis, A.L.T.; investigation, A.L.T., P.I.D. and A.N.S.; resources, A.V.B.; data curation, A.L.T. and P.I.D.; writing—original draft preparation, A.V.B.; writing—review and editing, A.V.B. and P.I.D.; visualization, A.L.T.; supervision, A.V.B.; project administration, A.V.B.; funding acquisition, A.V.B. All authors have read and agreed to the published version of the manuscript.
Figure 1.
Characteristics of EnSC expressing mutant oncogene HRASG12V. (A) Scheme of the applied two-component Tet-On system for inducible expression of HRASG12V under tetracycline (TET) stimulation. (B) Growth curves; (C) morphology, (D) cell size, (E) and (F) SA-β-Gal activity, and (G) mRNA levels of inflammatory factors STC1, MMP2, IL6 for the control (TET-) and HRASG12V-expressing (TET+) EnSC. Scale bars on the microphotographs are 100 μm. Data are presented as (B, D, G) mean ± SD, n = 3; or (F) median ± 1.5 IQR, n = 50. **p < 0.01, ***p < 0.005 by (B) two-way ANOVA with Tukey’s HSD or (D, F, G) Welch’s t-test.
Figure 2.
Identification of colonies of small proliferating cells that appear during long-term culturing of HRASG12V-expressing EnSC as an artefact of imperfect puromycin selection. (A) and (B) Schemes of the original and modified two-component Tet-On systems for inducible expression of HRASG12V under tetracycline (TET) stimulation. Modification resulted in expression of fluorescent protein mCherry under the same promoter with HRASG12V. Microphotographs show absence of mCherry fluorescence in colonies of small cells (indicated with yellow arrows) that appear during long-term culturing of HRASG12V-expressing EnSC (indicated with white arrows). Scale bars on the microphotographs are 100 μm. (C) Relative viability of long-term clonal culture of HRASG12V-expressing (TET+) EnSC and control non-transduced EnSC under puromycin selection. Data are presented as mean ± SD, n = 3, ns p > 0.05 by two-way ANOVA.
Figure 3.
Effects of oestogen stimulation of HRASG12V-expressing EnSC. (A) Cell size and (B) SA-β-Gal activity of the control (TET-), HRASG12V-expressing (TET+) EnSC, and HRASG12V-expressing (TET+ E2) EnSC additionally treated with oestrogen. (C) Growth curves. Data are presented as (A, C) mean ± SD, n = 3; or (B) median ± 1.5IQR, n = 50; ns p > 0.05 by one- or two-way ANOVA with Tukey’s HSD.
Figure 4.
Molecular features of EnSC’s OIS caused by HRASG12V expression. (A) Phosphorylation levels of AKT and ERK1/2 kinases, (B) growth curves, (C) DNA damage γH2A.X foci in the control (TET-) and HRASG12V-expressing (TET+) EnSC, and activity of (D) Chk2/p53/p21WAF/CIP/Rb and (E) p38/p16INK4a/Rb in HRASG12V-expressing (TET+) EnSC. Scale bars on the microphotographs are 50 μm or 10 μm. For blotting, GAPDH was used as loading control, representative blots are shown. Data are presented as mean ± SD; n = 3; ns p > 0.05, *p < 0.05 by two-way ANOVA with Tukey’s HSD.
Figure 5.
Modulation of activity of the molecular pathways mediating HRASG12V-induced senescence in EnSC. (A) Сell size, (B) SA-β-Gal activity and (C) growth curves of the control (TET-), HRASG12V-expressing (TET+) EnSC, and HRASG12V-expressing EnSC treated with AKT inhibitor LY294002 (TET+ LY), p53 inhibitor pifithrin-α (TET+ PFT), p38 inhibitor SB203580 (TET+ SB), and MEK1/2 inhibitor U0126 (TET+ U). Data are presented as (A) median ± 1.5IQR, n = 50; or (B, C) mean ± SD, n = 3; ns p > 0.05, **p < 0.01, ***p < 0.005 by one- or two-way ANOVA with Tukey HSD compared to control (TET+ Ctrl) cells.
Figure 6.
Evidence of PTEN loss-induced senescence of EnSC. (A) mRNA and (B) protein levels of PTEN expression in HRASG12V-expressing (TET+) EnSC. (C) and (D) verification of CRISPR/Cas9-mediated PTEN knockout in control EnSC at mRNA and protein levels. (E) Cell size, (F) lipofuscin intracellular level, (G) growth curves, and (H) and (I) SA-β-Gal activity in control and PTEN knockout (PTEN KO) EnSC. Scale bars on the microphotographs are 100 μm. For blotting, GAPDH was used as loading control, representative blots are shown. Data are presented as (A, C, E, F, G) mean ± SD, n = 3; or (I) median ± 1.5IQR, n = 50; *p < 0.05, ***p < 0.005 by (A) one-way ANOVA with Tukey HSD compared to control cells (at day 0), (G) two-way ANOVA with Tukey HSD or (C, E, F, I) Welch’s t-test.
Table 1.
Oligonucleotide sequences for mCherry and sgRNAs cloning.
Table 1.
Oligonucleotide sequences for mCherry and sgRNAs cloning.
| # |
Oligonucleotide |
Sequence |
Tm, °C |
| 1 |
mCherry forward |
5’-ATATTTGGATCCGGTCCGATCCACCGGTCGC-3’ |
63.0 |
| 2 |
mCherry reverse |
5’-CGTCATCGCTCCAGAAGGCCCGGGATTCTCCTCC-3’ |
63.0 |
| 3 |
HRASG12V forward |
5’-GGGCCTTCTGGAGCGATGACGGAATATAAGCTGGTGG-3’ |
64.0 |
| 4 |
HRASG12V reverse |
5’-GTCGAGCGGCCGCCACTGTG-3’ |
64.0 |
| 5 |
PTEN sgRNA forward |
5’-CACCGAAACAAAAGGAGATATCAAG-3’ |
- |
| 6 |
PTEN sgRNA reverse |
5’-AAACCTTGATATCTCCTTTTGTTTC-3’ |
- |
Table 2.
Primer oligonucleotide sequences.
Table 2.
Primer oligonucleotide sequences.
| # |
Oligonucleotide |
Sequence |
Tm, °C |
| 1 |
GAPDH forward |
5’-GAGGTCAATGAAGGGGTCAT-3’ |
57.0 |
| 2 |
GAPDH reverse |
5’-AGTCAACGGATTTGGTCGTA-3’ |
57.0 |
| 3 |
PTEN forward |
5’-TTGAAGACCATAACCCACCA-3’ |
58.0 |
| 4 |
PTEN reverse |
5’-CACATAGCGCCTCTGACTG-3’ |
58.0 |
| 5 |
STC1 forward |
5’-TGAGGCGGAGCAGAATGACT-3’ |
59.5 |
| 6 |
STC1 reverse |
5’-CAGGTGGAGTTTTCCAGGCAT-3’ |
59.5 |
| 7 |
IL6 forward |
5’-ATGTAGCCGCCCCACACA-3’ |
58.0 |
| 8 |
IL6 reverse |
5’-CCAGTGCCTCTTTGCTGCTT-3’ |
58.0 |
| 9 |
MMP2 forward |
5’-AGATCTTCTTCTTCAAGGACCGGTT-3’ |
59.5 |
| 10 |
MMP2 reverse |
5’-GGCTGGTCAGTGGCTTGGGGTA-3’ |
59.5 |
