
Submitted:
21 July 2023
Posted:
24 July 2023
You are already at the latest version
Abstract
Due to the irruption of new technologies in cities such as mobile applications, geographic infor-mation systems, Big Data, Internet of Things (IoT) or Artificial Intelligence (AI), new approaches to citizen management are being developed with the aim of adapting citizen services to this new en-vironment. These new services can enable city governments and businesses to offer their citizens a truly immersive experience that facilitates their day-to-day lives and ultimately improves their quality of life. In this sense, it is important to emphasize that all investments in infrastructure and technological developments in smart cities will be wasted if the citizens for whom they have been created eventually do not use them for whatever reason. To avoid these kinds of problems, the citizen's level of adaptation to the technologies should be evaluated. However, although much has been studied about new technological developments, studies to validate the actual impact and user acceptance of these technological models are much more limited. This paper tries to fill this gap presenting a new model of recommender system based in the most cited and used model in the scientific and academic literature: the Technology Acceptance Model (TAM) and using the most cited and agreed upon criteria in the existing literature. To accomplish the objective, this study in-troduces a novel recommender system that utilizes a fuzzy 2-tuple linguistic model in conjunction with the analytic hierarchy process (AHP) method to prioritize and personalize the relationship between tourists and smart cities. The methodology proposed in this paper was tested and validated in a case of study through different clusters to derive global recommendations tailored to each specific cluster. The main findings reveal that the use of technology is closely linked to the ability to enjoy personalized experiences in the realm of Smart Cities and Smart Tourism. As future works, authors recommend extending the recommender system model to any cluster of tourists using the proposed methodology and evaluate also other kind of disruptive technologies such as artificial intelligence (AI) in supporting the citizens.
Keywords:
smart cities
; TAM
; decision making
; fuzzy logic
; smart tourism
; customer journey
1. Introduction
In recent years, the world has witnessed constant and rapid changes occurring in an environment that has become increasingly volatile, uncertain, complex, and ambiguous. This fact, combined with the economic growth and the emergence of new technologies are bringing new opportunities to the cities and attracting more and more people from the countryside to the city [1].
Based on projections from the United Nations, it is anticipated that around 68% of the global populace will reside in urban regions by the year 2050, and in this context, new technologies together with the fact that the needs of the inhabitants are growing, suggest a new concept of city capable of responding to the new environmental, economic and sustainability challenges.
In this sense emerges the concept of Smart City, widely studied by the scientific community but without a clear consensus neither in its definition nor in the variables that should be measured to evaluate the degree of "intelligence" of a city [2].
In general terms, Smart Cities can be known as connected cities using technology and innovation to enhance the well-being and living standards of their inhabitants, optimizing the use of resources, and promoting sustainable development. These cities use interconnected infrastructures and information systems to collect real-time data, make informed decisions and offer efficient services to their citizens [1].
If we delve into the existing literature on the concept of Smart City, and as [3] reports in his work, we can find two different lines of definition of the idea of Smart City. The first line of argument defended by authors such as [4], defines the idea of Smart City as an interconnected city linked to new technologies and the massive use of data. The second line, defended by authors such as [5] defines the concept of Smart City as an urban space through variables such as accessibility, human capital, and sustainability among others.
These last variables, among others such the importance of new technologies, are very close with the definition of Smart Tourism. The concepts Smart City and Smart Tourism have been studied throughout the literature as different concepts and often almost as watertight concepts. However, both concepts have many aspects in common, based on the intensive use of data and new technologies, they share a very similar scope around the variables indicated above. Following the work [6], the separation of both concepts “makes little sense in a world where the everyday and the touristic increasingly overlap and smart technologies blur the lines between residential areas and tourism precincts.”
Smart Tourism seeks to use technology to offer personalized, efficient, and sustainable services to tourists, as well as to enhance the competitiveness of tourist destinations. This involves the use of different technologies such as mobile applications, geographic information systems, artificial intelligence (AI), internet of things (IoT) and virtual reality, among others. The most important goals of Smart Tourism focus on improving the tourist experience and optimizing the management of tourist destinations [7].
Smart destinations involve technologies used to improve the planning and management of tourist destinations, providing real-time information on traffic conditions, accommodation availability, local events, personalized recommendations, etc. [8]. On the other hand, tourist experience includes among others, mobile applications to provide personalized information and services during the trip, such as interactive guides, translators, restaurant recommendations, activity reservations, to better enjoy their customer journey [9].
In other words, Smart Tourism aims to improve the tourist experience, make destinations more accessible and sustainable, and enhance the competitiveness of tourist destinations through technological innovation. In this vein, the question to be considered: is it enough to use technology to talk about Smart City? And what is more important, is it the same to deploy disruptive technologies in a city and have the citizens themselves adopt them efficiently? Most of the published studies address and examine Smart Cities or Smart Tourism technologies but very few do so on the degree of acceptance of its citizens or tourists [10]. In this study [11] the following is formulated “Citizens are often considered as users, testers, or consumers rather than producers and sources of creativity and innovation”. We quickly realize that to address smart tourism in an optimal way, we must include the concept of Technology Acceptance Model (TAM) in the strategy.
TAM concept was first introduced by Davis F.D. [12] in 1989 and today is one of the most cited models affecting the adoption and use of technology with more than 78.000 citations according to Google Scholar data, Figure 1. The objective of the TAM is to define and comprehend the user's acceptance of a technological system by considering its cognitive, emotional, and behavioral components [13].
Despite the increasing interest in applying the TAM, there is still a notable absence of systematic applications of the model in the fields of tourism and hospitality. For this reason, this paper will consider, the most significant factors or benchmarks to consider for defining the TAM applied to tourism, and the multi-criteria decisions to adapt the technologies to each kind of tourists (segments of tourists) to enhance the tourist experience. To achieve these objectives, the utilization of mathematical models based on AHP, and fuzzy logic will be employed.
Numerous academic works and an abundance of literature exist concerning Smart Tourism and Smart Cities on one hand, and the TAM on the other. However, a noticeable void remains in the integration of these two concepts, with scarce studies exploring potential connections between TAM and the enhancement of the tourist journey process. Furthermore, a comprehensive analysis of these studies reveals that most of them solely adopt a qualitative approach, leaving an opportunity for future research to employ quantitative methodologies and mathematical models for a more comprehensive investigation.
The novel model presented in this paper offers several key contributions that deserve attention:
- Proposing a novel methodology that combines the AHP method and the fuzzy 2-tuple linguistic model to enhance decision-making processes.
- From the decision-making methodology, a novel model is proposed to enhance the tourist experience by integrating insights from the previous methodologies.
- Establish a new model of prioritization and personalization of interactions individually or according to the different types of clusters of tourists.
- Present a recommendation system of Customer Journey applied to the different clusters.
- The criteria for the new model are established through an exhaustive review of the literature, where the most frequently cited and relevant factors in the domain are identified and considered.
- Provide a concrete illustration of the new model's practical implementation by presenting a real-world scenario to validate and assess its efficacy. Furthermore, formulate a set of customized suggestions aimed at optimizing the decision-making process for individual tourist clusters.
- Identify and outline the limitations inherent in our study, as well as delineate potential directions for further research and development.
The rest of this article is structured in the following manner: In Section 2, we conduct an in-depth review of the existing literature pertaining to the fundamental concepts incorporated in our proposed model. Section 3 presents the detailed methodology employed in this study, outlining the procedures and techniques utilized. Moving forward, in Section 4, we introduce a novel model designed for calculating TAM (Technology Acceptance Model), building upon the groundwork laid in previous sections. Section 5 illustrates a practical application of the proposed model, demonstrating its effectiveness in a real-life scenario. Finally, in Sections 6, 7, and 8, we thoroughly discuss the obtained results, draw key conclusions, and address any limitations identified in our work. Additionally, we outline potential avenues for future research and development in this field.
2. Literature Review
2.1. Recommender Systems
A recommender system is a type of computer system designed to suggest or recommend items to users, such as products, services, movies, music, news, or any other type of content, based on their preferences, past behaviors, or user profiles. The main goal of a recommender system is to provide personalized and relevant recommendations, to help users discover new items that may be of interest to them [14].
The papers provide different perspectives on the definition of recommender systems. In [15] discusses how Linked Data can be used to provide recommendations of items from diverse domains. In [16] offers a comprehensive review of psychology-informed recommender systems, that incorporate human cognitive processes, personality and affective signals into recommendation models. In general, articles suggest that recommendation systems are computer tools that use machine learning techniques to model and predict user preferences based on behavioral data, and that there are ongoing efforts to improve their personalization, accuracy, and evaluation.
Recommendation systems applied to Smart Cities are tools that use data and algorithms to provide personalized and relevant recommendations in the context of smart city services and applications. These systems focus on improving the efficiency and quality of life of citizens by providing suggestions and guidance based on their preferences, needs and the urban environment [17].
Upon investigating the literature related to the search variable TS = (RECOMMENDER SYSTEMS) we found more than eight thousand publications evaluating this concept. The prominence of the field of recommender systems can be underscored by the considerable number of publications generated by academics and practitioners in this domain.
If we focus our search to analyze recommender systems in a smart city environment (TS = (RECOMMENDER SYSTEMS)) AND (TS = (SMART CITY) OR TS = (SMART CITIES)), we discovered only 91 articles, indicating a compelling gap worthy of exploration.
The aim is to showcase scientific publications linked to this concept. To accomplish this, we conducted research using the Web of Science Core Collection, employing specific criteria to select journal articles, covering the entire available period.
In the subsequent section, we will thoroughly explore the concepts of Smart Cities and Smart Tourism.
2.2. Smart Cities and Smart Tourism
As mentioned in the introduction section, the irruption of new technologies combined with the new challenges of civilization have impulse the growth of Smart Cities. In this context, the literature has extensively examined the fields of Smart Cities.
Smart City technology has a significant impact on the tourism industry. In the following study [18] is explored the strategic role of technology in smart tourist destinations. In this other study [19] examines the relationship between smart tourism technology and overall satisfaction in three South Korean cities. This study [20] argues that technology innovations bring stakeholders together in tourism service ecosystems and transform industry structures, processes, and practices. Overall, the papers suggest that smart city technology can enhance tourism competitiveness and create new opportunities for the industry.
When conducting research on publications and citations associated with the search variable TS = (SMART CITY), we discovered an extensive body of literature, consisting of over thirty thousand publications that delve into and study the concept of Smart Cities.
As mentioned, Smart Tourism closely relates to the concept of Smart City. To study the phenomenon of Smart Tourism, we can conduct research on the publications and citations related to the search variable TS = (SMART TOURISM).
Figure 3 provides a thorough summary of the research papers and references related to the search parameters, offering a comprehensive view of the literature in this area, TS = SMART TOURISM. To accomplish this objective, we performed research in the Web of Science Core Collection, employing specific criteria to select journal articles and considering the entire available period for analysis.
If we conduct research on both interconnected concepts, Smart Cities and Smart Tourism, the findings reveal the following results. Figure 4 shows an overview of the existent literature associated with the search variables, TS = (SMART TOURISM) AND TS = (SMART CITIES). The primary objective is to present the scientific publications relevant to this concept. To accomplish this objective, we performed research in the Web of Science Core Collection, employing specific criteria to select journal articles and considering the entire available period for analysis.
2.3. Smart Cities, Smart Tourism and Technology User Acceptance TAM
Having reviewed the literature on the concepts of Smart Tourism and Smart Cities, our research leads us to evaluate the studies that connect these terms with the Technology User Acceptance.
If we research about both concepts comminated (Smart Cities / Smart Tourism and TAM) we can found interesting results.
Figure 5 provides a thorough summary of the research papers and references related to the search parameters, TS = (SMART TOURISM)) AND ((TS = (TECHNOLOGY ACCEPTANCE MODEL) OR TS = (TAM)). The main objective is to showcase the scientific publications relevant to this concept. To accomplish this objective, we performed research in the Web of Science Core Collection, employing specific criteria to select journal articles and considering the entire available period for analysis.
As observed in these sections, a substantial amount of literature exists on smart cities, smart tourism, and Technology Acceptance Models. However, a review of the literature on the integration of these concepts exposes a distinct scarcity of scientific studies, as depicted in Table 1.
Given the existing gap in the literature, a functional methodology is presented to develop a recommendation system for categorizing tourists based on their digital proficiency and utilization of mobile technologies in Smart Cities.
2.5. Criteria for Measuring Technology User Acceptance (TAM)
Numerous studies in the literature have identified various criteria for measuring Technology User Acceptance models. For our work and model proposal, we have based our approach on the most frequently utilized TAM criteria, which form the foundation of our research:
- Frequency of Mobile Use (FMU): Many studies papers suggest that frequency of mobile use is an important factor in technology acceptance models. In this study [26] revealed that the perceived effectiveness and perceived convenience of mobile applications were positively impacted by crucial security elements. As a result, these factors had a favorable influence on individuals' attitudes towards usage and their intentions to engage with the applications. In this other study [27], the research discovered that both the perceived simplicity of usage and the portability aspects had a considerable impact on the perceived usefulness of mobile health services. In [28] revealed that the perceived level of physical risk and key factors from the Technology Acceptance Model (such as usefulness and ease of use) were strong indicators of individuals' intentions to use mobile applications for online transportation services. Finally, in [29] demonstrated that mobile social media usage exerted a substantial indirect influence on online business models. This influence was mediated by the Technology Acceptance Model, emphasizing its critical role in shaping the relationship between mobile social media use and the success of online business models.
- Mobile App Usage (MAU): After a deep analysis of the existent literature, we can highlight that the impact of mobile app usage has directly influenced on the Technology Acceptance Model (TAM). In [30] found that mobile app usage had a positive impact on teacher performance and learning capabilities. In [31] was observed that the perceived ease of use and perceived usefulness of mobile apps positively affected hotel consumers' experiences. Additionally, the study highlighted that perceived usefulness, along with user experience, played a significant role in influencing customers' acceptance of hotel apps. The papers suggest that TAM can be used to investigate the impact of mobile app usage in various contexts, such as education, hospitality, and conferences.
- Digital Competence (DC): Literature suggest that digital competence directly affects technology acceptance models. In [32], the study incorporates technology readiness into the TAM and identifies that the influence of technology readiness on use intention is mediated by perceptions of usefulness and ease of use. In other words, the impact of an individual's technology readiness on their intention to use a particular technology is influenced by how they perceive its usefulness and ease of use. In the same vein [33] extends the TAM by incorporating two types of perceived usefulness and reveals that perceived near-term usefulness has the most significant influence on the behavioral intention to use a technology. However, it's worth noting that perceived long-term usefulness also exerts a positive impact on the intention to use the technology, albeit to a lesser extent.
- Attitude towards Technology (ATT): This criterion is an important factor in technology acceptance models. In [34] found that awareness and perceived risk are external variables that affect the technology acceptance model for mobile banking in Yemen. On another hand, in this study [35], the research indicated that attitude served as a significant predictor of university students' intention to use e-learning, drawing from the Technology Acceptance Model (TAM).
- Perceived Usefulness (PU) and Perceived Ease of Use (PEU): These two variables have been deeply considered and analyzed by authors who collectively suggest that perceived usefulness is an important factor in the TAM. In [36] discovered that perceived usability holds crucial importance in the TAM and that its presence explains a greater amount of variance in the model compared to its absence. In [37] found that perceived ease-of-use (PEU) is strongly related to perceived usability, which is a component of the modified TAM (mTAM). However, in [38] proposed a theoretical model that suggests perceived ease of use is determined by control, intrinsic motivation, and emotion, and that it adjusts over time to reflect objective usability and perceptions of external control. This suggests that perceived usability may be more complex than simply incorporating it into the TAM. In this arena, many works suggest that perceived usefulness is a key factor in the TAM, but the relationship between perceived usability and TAM may require further investigation.
- Social Media Usage (SMU): After deeply analyze of the existent literature, many papers support this relation. The papers suggest that the Technology Acceptance Model (TAM) can be used to understand social media usage behavior. In this paper [39] found interesting results highlighting the relationship between TAM and social media usage. He found that individual adoption behavior of Facebook can be explained by perceived ease of use, critical mass, and social networking site capability. In the study conducted by Al-Qaysi [40], the author conducted a thorough systematic review, analyzing 57 research articles. The findings indicated that several factors significantly extended the TAM, among the most frequent factors were social media, perceived enjoyment, subjective norm, self-efficacy, perceived critical mass, perceived connectedness, perceived security, and perceived trust. These factors play pivotal roles in enhancing the understanding and application of the TAM in various contexts. In the same vein, in this other study [25] was delved into the digital gap that might exist across different generations and uncovered that age plays a significant role in influencing optimism, innovativeness, and perceived usefulness concerning the adoption of social media. Finally, in this study [41] constructed a comprehensive model to investigate the influence of social media use factors on electronic banking adoption. They observed a notable negative impact of the social media factor on the expected efforts, which, in turn, affected the use of electronic banking services. After our literature review, we can highlight that social media usage should be considered in technology acceptance models, as it can impact user behavior and attitudes towards technology adoption.
- Previous Experience (PE): The last criterion we have identified in our study is Previous Experience. We have also selected this criterion because there are many papers suggesting that previous experience can impact technology acceptance models. In this paper [42] a meta-analysis of TAM was conducted, founding that subjective norm (such as experience) has a significant influence on perceived usefulness and behavioral intention to use any technology. On the other hand, in this study [43] carried out a literature review of technology acceptance models, it was evident that these models play a vital role in comprehending the predictors of human behavior concerning the potential adoption or rejection of innovations and technologies. Finally, and in the same arena, in this study [44], outlined a research plan dedicated to exploring prospective interventions both before and after IT implementation, aiming to improve employees' acceptance and utilization of technology. Moreover, the study suggests that prior experiences could influence technology acceptance models, and leveraging this criterion can foster technology adoption and utilization.
In this section, we introduce the proposed methodology for creating a novel model, which stands as a significant milestone in the current literature.
3. Methodology
The objective of this section is to provide a comprehensive theoretical framework for the research. To achieve this aim, the study will incorporate the following models: the analytic hierarchy process (AHP) and the 2-tuple fuzzy linguistic model (LD2T), and strategies to effectively manage heterogeneous information in the decision-making process [45]. This integration of models will serve as the foundation for the proposed research, facilitating a deeper understanding and systematic analysis of the subject matter.
In certain scenarios, the data necessary for decision-making originates from diverse expression domains. In the specific case under investigation, the expression domains to be utilized encompass both numerical and categorical data. Therefore, it becomes vital to tackle the problem by employing a fuzzy linguistic domain, which enables the unification of information management in the proposed model. The utilization of a fuzzy linguistic approach allows for a more flexible and comprehensive handling of heterogeneous data, leading to more effective and accurate decision-making outcomes [46].
3.1. 2-Tuple Model (LD2T)
The 2-tuple linguistic model (LD2T) is a powerful tool in decision-making and information representation that enhances the precision of information representation. In traditional decision-making models, information is typically represented by crisp numbers or linguistic terms, which often fail to capture the uncertainties and ambiguities associated with human perception and language. However, the LD2T addresses this limitation by considering both the linguistic term and its associated membership function.
By combining linguistic terms and fuzzy sets, the LD2T provides a more accurate representation of information. It allows decision-makers to express their preferences and perceptions using linguistic terms while incorporating the inherent fuzziness and vagueness of human language. The membership function associated with each linguistic term captures the degree of membership or relevance of the term to a specific decision or context.
This approach not only improves the accuracy of information representation but also enables more effective decision-making. Decision-makers can evaluate and compare alternatives based on a comprehensive understanding of the uncertainties and preferences involved. The LD2T has been successfully applied in various domains, including risk assessment, project management, and supplier selection, demonstrating its effectiveness in capturing complex and uncertain information.
Overall, the LD2T offers a promising framework for decision-making, providing a more precise and realistic representation of information and supporting informed and robust decision-making processes.
The primary objective of this model is to improve the precision of information representation by compressing it into linguistic values (,, where and . The 2-tuple linguistic representation model commonly employs a triangular function to represent the selected membership function. A visual depiction of the domain within s5, utilizing this triangular function, can be found in Figure 6 as an illustrative representation.
Definition 1.
The linguistic domain in a 2-tuple linguistic model is a set denoted as S, which comprises linguistic terms used to represent information. In this context, the symbolic representation of a linguistic item, denoted as, is a numerical value falling within the interval [−0.5, 0.5). This value represents the difference between a given set of information, which is indicated by the numerical value, obtained through a calculation process, and its closest integer value, denoted as.
Definition 2.
Let a set of linguistic terms, and, andthat represents the result of an operation; the linguistic 2-tuple expressing the information equivalent to β is obtained using the expression:
In the given context, where denotes standard rounding operation, represents the label closest to , and α represents the outcome of the symbolic translation, the result is a 2-tuple within the set that corresponds to a value within the interval .
Definition 3.
Letbe a collection of linguistic terms, and corresponds to the linguistic value expressed in a 2-tuple format can be obtained by employing the following expression:
The computational model associated with this analysis can be thoroughly examined. The following operators are defined, which help to understand and apply the model:
Comparison operators: Given two 2-tuple linguistic values and :
- If , then is less than .
-
If , then
- (a)
- If , then and symbolize identical information.
- (b)
- If , then has a lower value than .
- (c)
- If , then is larger than .
Aggregation operators:Letbe a collection of 2-tuple linguistic values in, and letrepresent their respective weights, such that the sum of the weights. In this scenario, the weighted average of the 2-tuples is defined as
3.2. AHP Method
The method known as the Analytic Hierarchy Process (AHP) was devised by Thomas Saaty and serves as a decision-making technique [47]. It provides a systematic approach to solving complex problems by structuring and prioritizing multiple criteria. AHP is applicable to a wide range of decision-making contexts, including business, engineering, healthcare, and environmental planning.
One aspect to consider in applying AHP is the number of experts involved in the decision-making process. In certain cases, decisions can be made by a single expert, while in others, a group of experts may be involved. When multiple experts are engaged, the AHP process incorporates their diverse perspectives and knowledge, leading to a more comprehensive and robust decision outcome.
Another factor influencing the application of AHP is the decision environment. Decision-making problems can be classified into structured and unstructured environments. In structured environments, the decision criteria and their relationships are well-defined and can be quantitatively evaluated. AHP is particularly effective in structured environments as it enables the systematic comparison and weighting of criteria, facilitating decision-making.
On the other hand, unstructured decision environments involve subjective criteria and uncertain relationships between them. AHP can still be applied in these situations, but additional considerations such as expert judgment and qualitative assessments play a significant role in determining the relative importance of criteria and alternatives.
Additionally, the number of criteria in a decision problem affects the complexity of the AHP analysis. Problems with a small number of criteria are relatively simpler to handle, allowing for straightforward pairwise comparisons and deriving priority weights. As the number of criteria increases, the pairwise comparisons become more numerous and intricate, demanding additional effort in the analysis.
To address the challenges posed by large-scale problems, techniques such as hierarchical structuring and decomposition can be employed within the AHP framework. These techniques break down complex decision problems into manageable subproblems, facilitating the decision-making process.
The AHP method offers a versatile approach to decision-making that can be adapted to various scenarios, has been specially developed to address intricate decision scenarios involving multiple criteria [48]. The involvement of multiple experts, consideration of the decision environment, and the number of criteria are key factors in utilizing the AHP effectively. Understanding these aspects allows decision-makers to classify decision problems and apply the appropriate techniques to achieve informed and rational decisions.
Within the framework of the suggested model, the assessment of each criterion's weightage will play a crucial role in determining the level of digital maturity of tourists in a smart city setting.
Further details and elaboration on the entire process are provided in the following subsections.
3.2.1. Organizing the Decision Model in a Hierarchical Process
The AHP approach initiates by organizing the decision problem into a hierarchical structure, facilitating effective problem analysis and organization. This hierarchical representation categorizes the problem into different levels based on shared attributes, allowing for a thorough assessment of decision factors.
At the highest level of the hierarchy, the objective or target is situated, representing the primary goal that guides the decision-making process.
The second level comprises a set of criteria, . These criteria serve as the fundamental factors or dimensions for consideration in the decision. Each criterion can be further subdivided recursively into sub-criteria, , .
Finally, the lowest level of the hierarchy is comprised of alternatives or choices available for consideration in the decision-making process, .
Figure 7 presents a visual representation of the hierarchical structure of the decision problem, showcasing the connections and dependencies among the objective, criteria, sub-criteria, and alternatives. This graphical illustration provides a clear and concise overview of the relationships among these elements, aiding in the decision-making process.
3.2.2. Setting Criteria and Weighting
In the AHP model, criteria and their corresponding weights can be established by utilizing the pairwise comparison matrix (), Saaty's scale of values (Table 2), weight vector, and consistency ratio (CR).
To begin, the pairwise comparison matrix (), is constructed to compare each criterion against every other criterion, where the experts assign values to represent the relative importance or preference between criteria based on Saaty's scale, which ranges from 1 (indicating equal importance) to 9 (indicating extreme importance).
Next, the matrix is normalized by calculating the row geometric means or column sums to obtain the weight vector. The weight vector represents the relative importance of each criterion and serves as a basis for decision-making.
To ensure the consistency and reliability of the weights assigned, the consistency ratio is computed (CR). This ratio assesses the consistency of the pairwise comparisons made by experts. If the consistency ratio exceeds a predefined threshold, adjustments may be required to achieve more consistent judgments.
By considering the pairwise comparison matrix, Saaty's scale of values, weight vector, and consistency ratio, criteria and their corresponding weights can be established in the AHP model. This systematic approach enhances the decision-making process by incorporating expert opinions and quantifying the relative importance of criteria.
The vector representing the weights of criteria, denoted as , is calculated using the eigenvector method, involves the following:
The maximum eigenvalue of the pairwise comparison matrix is denoted as , and the corresponding normalized eigenvector linked to the principal eigenvalue of is represented by . These values play a crucial role in determining the weights of criteria in the decision-making process. The consistency ratio (CR) is a metric used to assess the reliability of the AHP method by evaluating the consistency of pairwise comparisons conducted by the decision-maker throughout the AHP process. It helps ensure that the decision-maker's judgments are consistent and reliable, contributing to the overall validity of the decision-making outcomes:
The consistency ratio (CR) is determined by dividing the consistency index (CI), which is calculated as , by the random consistency index (RI) as listed in Table 3.
When the calculated consistency ratio (CR) is equal to or lower than the predefined consistency limits specified in Table 4, it indicates that the results of the hierarchical comparisons meet the consistency criteria. In these instances, the pairwise comparison values are considered acceptable, ensuring a consistent decision-making process.
3.2.3. Evaluate each alternative against the established criteria
Similarly, employing a recursive approach, we can utilize the same methodology to assess the alternatives by establishing their relationships with each criterion. This process allows us to determine the weights and preferences of the alternatives, enabling a comprehensive evaluation and comparison to support the decision-making process. This involves constructing a comparison matrix for the alternatives, denoted as , with dimensions , where each element represents the weight assigned to one alternative concerning another alternative for a specific criterion.
In accordance with the previously outlined methodology, the weights of the alternatives can be determined by analyzing the pairwise comparisons within each criterion. This process entails finding the maximum eigenvalue () and its corresponding eigenvector () for each comparison matrix . The eigenvector provides the relative weights of the alternatives for the specific criterion.
By repeating this procedure for each criterion, a matrix of weights can be generated, incorporating the comparisons of each alternative with every other alternative, while considering all the criteria. This matrix of weights facilitates the ranking of alternatives based on the established weightings.
Afterwards, as previously explained, the subsequent stages of the process consist of utilizing the acquired weights to compute the overall contributions of each alternative in attaining the main objective. Consequently, a ranking of the alternatives can be derived based on their assigned weights.
This approach ensures that the decision model offers a systematic and comprehensive evaluation of the alternatives, considering multiple criteria and their respective weightings. As a result, decision-makers can prioritize alternatives based on their relative importance and make well-informed decisions.
3.2.4. Decision Making
In the final step of the decision-making process, the assigned weights to the alternatives, derived from evaluations of criteria by the experts, are utilized to establish the overall ranking. This ranking is critical in identifying the most suitable alternative that aligns with the research objective. By integrating expert assessments and criteria weightings, decision-makers can make well-informed choices, selecting the alternative that best meets the desired objectives and criteria.
3.3. Treatment of Heterogeneous Information
In this research project, our main aim is to bring together different types of information from diverse sources using a specialized linguistic information domain called the 2-tuple linguistic information domain [51]. To initiate this process, we establish a fundamental set of linguistic terms known as the basic set of linguistic terms (CBTL), which serves as the groundwork for all subsequent analyses and computations in our study.
The identification and selection of the CBTL domain, represented as , involve carefully determining the set of linguistic terms that offer the highest level of granularity within the diverse information framework [50]. By taking this careful approach, we ensure that we preserve the maximum amount of information encapsulated within the linguistic domain. Once the CBTL set is defined, we proceed to transform the different expression domains to align with this chosen CBTL set. It is essential to recognize that information can be expressed in various domains, such as numerical, interval, and linguistic, as depicted in Figure 8.
By adopting this approach, our primary objective is to create a comprehensive and cohesive representation of heterogeneous information. This will enable us to analyze and interpret the data effectively within a unified linguistic framework. Aligning different expression domains with the chosen CBTL set will facilitate seamless integration and comparison of information from diverse sources. This harmonization of data will lead to more accurate and meaningful insights, allowing us to gain a deeper understanding of the underlying patterns and relationships within the information. Ultimately, this unified representation will enhance our ability to make informed decisions based on a holistic view of the heterogeneous data.
3.3.1. Numerical Domain
Definition 4.
Given a numerical value and a set, that belongs to the CBTL domain, we define the numerical transformation function,:
with
where [0, 1] is the degree of association between the numerical value n and ∈.
3.3.2. Interval Domain
Definition 5.
Considering a given value
and a set
belonging to the CBTL domain, we define the interval transformation function
:
where;represent the membership functions corresponding to the intervaland the linguistic terms, respectively.
3.3.3. Linguistic Domain
Definition 6.
Considering the set and the set belonging to the CBTL domainwhere both sets represent linguistic terms, and, the function responsible for linguistic transformation,
is defined as:
where ; and identify the membership functions corresponding to each term.
After consolidating the diverse information into a 2-tuple linguistic domain, a variety of specific operations become possible within the LD2T domain. These operations lead to interpretable outcomes that merge the diverse evaluations within a unified domain, specific to each criterion.
4. Proposed Model
In this study, we established a set of criteria, guided by relevant literature, that directly measures the digital maturity level of the tourist (DMT) and facilitates the customization of the Customer Journey in Smart Cities. The complete process of determining the maturity level, based on a set of simulated data, is illustrated in Figure 9.
The new Digital Maturity Level of Tourist (DMT) measurement model proposed in this document is based on the following criteria (selected in Section 2):
- FMU (Mobile device usage frequency): This variable represents the frequency with which tourists use mobile devices (such as smartphones or tablets) in their daily lives.
- MAU (Usage of tourism mobile applications): This variable reflects tourists' willingness to use specific mobile applications to access tourism information, make reservations, obtain recommendations, etc.
- DC (Competence in technology use): These variable measures tourists' competence and ability to use digital technologies in general.
- ATT (Attitude towards technology adoption): This variable reflects tourists' attitude towards adopting technology in the tourism context.
- SMU (Social media usage and content sharing): This variable represents the level of tourists' engagement in social media and the frequency with which they share content related to their tourism experiences.
- PE (Previous experience with tourism technology): This variable indicates whether tourists have previous experience in using tourism technology, such as mobile applications, online bookings, digital travel guides, etc.
- PU (Perception of usefulness): This variable reflects the tourist's perception of the usefulness of technology in the tourism context, how technology enhances their tourism experience, provides useful information, and meets their needs and expectations.
- PEU (Perception of ease of use): This variable represents the tourist's perception of the ease of use of technology, how easy it is for them to use technology, navigate through mobile applications, access information, and perform actions.
The identified criteria are utilized to evaluate the digital maturity level of tourists. This assessment provides valuable information that contributes to the development of personalized and real-time Customer Journeys.
Therefore, the first of the assessments of the tourist's level of digital maturity is represented in terms of the parameters described: Mobile device usage frequency (FMU), Usage of tourism mobile applications (MAU), Competence in technology use (DC), Attitude towards technology adoption (ATT), Social media usage and content sharing (SMU), Previous experience with tourism technology (PE), Perception of usefulness (PU), Perception of ease of use (PEU); so that the assessment (DMT), can be expressed as.
All criteria defined in the model are derived from a thorough literature review conducted in section 2 of this study. The process described in Figure 9, is as follows:
- Data collection: This step, the process entails collecting pertinent data and information that are relevant to the variables or criteria being studied. All the variables that constitute the model are defined within a range of values from 0 to 4.
- Determine the CBTL domain of expression for each criterion: This involves defining linguistic terms or categories that represent the different levels or degrees of each criterion. In this study, and considering the specific use case, a scale consisting of five values will be employed. As this scale pertains to linguistic expressions, it will be modeled using the set S.
- Scores computation 2-tuple: The 2-tuple model, which is a fuzzy logic-based approach, can then be applied to the collected data to handle linguistic uncertainty and quantify the degree of membership for each linguistic term. For each evaluation, we must calculate the variable. To optimize the utilization of the computational model, we will convert this data domain into 2-tuple linguistic variables.
- Obtain the global score for each interaction using the AHP model: The AHP model is utilized to calculate a global score for each tourist based on the weighted of the different criteria. During this stage, the value of the 2-tuple , that characterizes the score of each evaluation is calculated using the Equation (3), so that .
Next, we will set up the decision problem using a hierarchical model (AHP). Subsequently, we will construct the pairwise comparison matrix, which can be represented by Equation (4), to obtain the weights vector for each variable, . This approach helps to weight the criteria for each of the variables that make up the model according to expert opinion.
- 5.
- Designate the clusters that identify the different levels of digital development: The interactions can be grouped into clusters based on their similarities and differences in terms of the identified levels of digital development.
- 6.
- Develop a customized Customer Journey process for each cluster: This involves designing tailored experiences, strategies, or interventions that cater to the specific characteristics, preferences, and needs of each cluster. This can help optimize the digital development and overall satisfaction of tourists within each cluster.
5. DMT Model, Practical Application
In this section, we will present an illustrative example of the application of the new DMT (Digital Maturity Tourism) model to four different segments of potential users, classified by age: 26 - 35 years, 36 - 45 years, 46 - 55 years and 56 - 75 years. The dataset used for this analysis comprises a total of 600 records. Using this dataset, we can effectively apply the developed methodology and extend its applicability to a variety of smart city environments. This approach allows us to emphasize the variables described in the model, thus improving the digital experience of tourists, and exploring the use of technology in the field of smart tourism.
5.1. Data Collection
The data collected to evaluate the performance of the proposed model is shown in Figure 10, Figure 11 and Figure 12.
It can be stated that all variables in the model exhibit a left-skewed or left-shifted Gaussian distribution. Figure 12 shows the distribution by age range of each of the variables that make up the model.
It can be observed that as age increases, the level of digitization and technology use among individuals tends to decrease. Consequently, the use of technology in Smart Cities is limited to certain age ranges. Through this exploratory data analysis (EDA), the need to establish different Customer Journeys linked to age groups in Smart Tourism becomes apparent.
5.2. CBTL Domain and Score Computation
After grouping the variables into a linguistic domain in , we obtained the following results, shown in Table 5. A representative set of data has been chosen, a total of 16 records. ID represents the identifier of each person who is part of the data sample.
5.3. DMT, Overall Score
At this stage, it is crucial to evaluate the relative importance of each feature of the DMT model before calculating the overall interaction score. To achieve this, we will utilize the AHP model.
To establish consensus, the group of consulted experts utilized the Saaty scale and created the following matrix (Table 2):
The individual hierarchical results have produced satisfactory outcomes, and the consistency is ensured when CR ≤ 0.10, as denoted in Equation (5). In this instance, CR equals 0.065, validating the accuracy of the model's results.
The final weightings obtained are as follows: .
Consequently, experts have assigned greater importance to Perceived Usefulness (PU) and Perceived Ease of Use (PEU), followed by Digital Competence (DC), Attitude towards Technology (ATT), Social Media Usage (SMU), Frequency of Mobile Use (FMU) and Mobile App Usage (MAU), and Previous Experience (PE). These variables, along with their respective weights obtained through the AHP model, contribute to the final score of the DMT model.
Table 6 present the global score of the DMT model, set out in the previous steps.
The outlined procedure enables the derivation of individual scores for each person based on the designated criteria. This establishes a recommendation, prioritization, and personalization model that assesses the tourist's potential for utilizing technology in Smart City environments. It is important to emphasize that the methodology is not confined solely to the selected criteria but can be extended to encompass a broader range of criteria, sub-criteria, and diverse areas of numerical and linguistic representation. Furthermore, the approach can involve multiple decision-makers in the decision-making process, providing a flexible and scalable framework to address a wide variety of complex decision problems. As a result, the assessment obtained for each tourist can guide the prioritization of interactions, facilitate the effective utilization of technology within Smart Cities, and contribute to optimizing the various touchpoints along the tourist's customized Customer Journey.
The criteria serve as a roadmap for tailoring the Customer Journey of tourists visiting Smart Cities.
5.4. DMT, Clustering
The variables in the extended DMT model are represented in a 2-tuple format, which facilitates straightforward interpretation and aggregation processes while retaining all relevant information. Traditional clustering methods typically operate within a numerical domain, and in our case, we will utilize the function as defined in Equation (2). This function enables effective analysis and clustering based on the given variables.
The correlation coefficient of -66 between age and DMT scoring indicates a moderate correlation, Figure 13. This correlation aligns with expectations, as it is commonly observed that as individuals grow older, their ability to adapt to technology tends to decrease. Therefore, in the context of Smart Tourism, there is a greater need for personalized guidance and assistance for older individuals to navigate and fully benefit from technology-enabled experiences.
Although the use of an algorithm such as k-means in this case is not advisable, it will help us to visually distinguish 3 main groups, which are also intuited within the exploratory data analysis carried out, Table 7.
Figure 14 shows a graphical representation of the clusters obtained.
6. Discussion
Through the implemented process, individual assessment scores can be generated, reflecting the digital maturity level of tourists in a specific smart city. The model incorporates a methodology that combines decision theory using AHP and Fuzzy Logic. This approach allows for the formulation of weights for each variable in the model, facilitating customization of the assignment process, the inclusion of new criteria, and enhancing decision-making through the involvement of multiple experts belonging to public and private entities [52]. The model's adaptability ensures its capability to be tailored to specific requirements and accommodate changes in the technological landscape within the smart city environment.
The obtained scores serve to classify each tourist individually, enabling the creation of Customer Journeys tailored to their technological background, adaptability to technology, and the integration of technology within smart cities. By utilizing the clusters defined in Table 7, users can be categorized into three distinct groups based on their technology usage within the smart city environment. Once a person is assigned to a specific profile, it becomes relatively straightforward to generate interactions that make the tourist feel welcomed throughout their stay in a smart city. In Table 8, recommendations are provided for each cluster.
While the classification into clusters is primarily influenced by the correlation between age and DMT, it is important to acknowledge that individual characteristics and preferences may vary within each age group. It is indeed possible for older individuals to exhibit a high level of digitization and, consequently, be assigned to a different cluster. Likewise, younger individuals may require personalization in recommendations despite their familiarity with technology. At this stage, the DMT classification governs the behavior of the clustering, guiding the relationships to be developed. It is crucial to consider individual variations and further refine the clustering approach to account for these nuances and better tailor the digital experiences and recommendations for each tourist.
The average assessment of digital maturity as a function of age is shown in Figure 15,
As evident, there is an inverse relationship between age range and the average level of digital maturity. As the age range increases, the average level of digital maturity tends to decrease, and vice versa. This observation aligns with the common trend where younger individuals tend to have a higher familiarity and comfort level with digital technologies compared to older individuals. It highlights the importance of considering age as a significant factor when assessing and addressing digital maturity levels in the context of Smart Tourism.
7. Conclusions
This study aimed to develop a tourist evaluation system within the context of a Smart City environment. A comprehensive working methodology was proposed, which can be expanded to incorporate a wider range of criteria, alternatives, and multiple decision-makers. The methodology leveraged the Analytic Hierarchy Process (AHP) as a decision-making tool and utilized fuzzy logic to establish a linguistic model with minimal information loss. Furthermore, a clustering process was applied in a subsequent phase to provide tailored global recommendations based on specific tourist clusters and segments, considering their level of digitization. This entire model contributes to the development of personalized communication processes in the relationship between customers (tourists) and public or private entities.
The results of the study revealed that the digital maturity level of the examined sample varied from low to medium. This finding emphasizes the need for targeted training programs focused on enhancing the perceived usefulness and ease of use of technology applications within the tourism sector. It is crucial to capitalize on the potential benefits that smart cities can offer to the tourism industry. Additionally, an essential observation is the significance of technological competency and attitudes towards technology among individuals. These factors must be supported by strategies that enhance the perception of the usefulness of technological applications and subsequently facilitate their ease of use.
It is worth noting that the developed model is not limited to the tourism sector; it can be extended to other sectors such as industry, finance, environment, sustainability, or any other applicable use case. The defined clusters exhibit a strong interrelation with each other, emphasizing the inherent correlations within the data.
Furthermore, fostering collaboration between the public and private sectors is essential to effectively communicate the importance of digitalization and the transformative benefits that the implementation of smart city technologies brings to citizens, specifically within the tourism sector. By working together, these sectors can jointly promote and advocate for the adoption of digital solutions, emphasizing how these advancements enhance the overall tourist experience and contribute to the sustainable growth of cities.
To operationalize the recommendations derived from the identified clusters, a multifaceted approach is required. Apart from focusing on personalized interactions between tourists and public or private entities, it is crucial to implement a customer-centric technological infrastructure. This involves deploying innovative digital tools, such as mobile applications, augmented reality guides, or interactive maps, which facilitate seamless communication, real-time information sharing, and personalized service delivery. By leveraging these technologies, tourists can enjoy customized experiences that align with their preferences, interests, and digital capabilities.
However, the successful implementation of such technological initiatives goes beyond deploying the systems alone. It necessitates a comprehensive and tailored training program that equips individuals with the necessary digital skills and knowledge. This training should be designed to address the varying levels of digital maturity and age groups within the target audience. By empowering citizens with the digital competencies needed to fully embrace and utilize the available technologies, cities can ensure inclusivity and maximize the benefits of smart tourism.
Furthermore, continuous evaluation and feedback loops should be established to monitor the effectiveness of the digitalization efforts and identify areas for improvement. By gathering insights from tourists, analyzing their preferences, and adapting the digital offerings accordingly, both the public and private sectors can refine their strategies, enhance the tourist experience, and foster a culture of continuous innovation.
In summary, a collaborative approach between the public and private sectors is essential to promote digitalization and the adoption of smart city technologies in the tourism sector. By prioritizing personalized experiences, leveraging advanced technologies, and providing tailored training programs, cities can create a digital ecosystem that enhances the overall tourist experience, fosters sustainable growth, and empowers citizens to fully embrace the digital transformation journey.
8. Future Works
The conclusions of this study, which integrate bibliographical knowledge, understanding, and expansion of the TAM model, as well as the measurement of customer value in relation to the use of technology applied to Smart Cities, several areas for improvement and potential avenues for future research can be highlighted. These include the following:
- Investigating the impact of digital maturity on the effectiveness of smart city technologies: Further studies can delve deeper into understanding how the level of digital maturity influences the adoption and utilization of smart city technologies among citizens. Examining the relationship between digital skills, attitudes, and technology acceptance can provide valuable insights into tailoring strategies to bridge the digital divide and enhance engagement.
- Designing personalized digital experiences for tourists in smart cities: Future research can focus on developing innovative approaches to create highly personalized digital experiences for tourists. This can involve leveraging emerging technologies such as artificial intelligence, machine learning, interpretable decision making [53], and personalized recommendation systems to deliver customized recommendations, interactive itineraries, and immersive digital content based on individual preferences and needs.
- Evaluating the long-term impacts of smart tourism initiatives: Longitudinal studies can be conducted to assess the long-term effects of implementing smart tourism initiatives within smart cities. This can involve analyzing the economic, social, and environmental outcomes of digitalization efforts, including the sustainability of smart tourism practices and their influence on local communities, cultural heritage, and the overall tourist experience.
- Examining the role of data privacy and security in smart tourism: As the collection and utilization of personal data become integral to smart tourism practices, future research can explore the ethical and legal considerations surrounding data privacy, security, and consent. Investigating ways to ensure transparency, trust, and data protection in smart tourism initiatives can help address privacy concerns and foster a positive perception of digitalization efforts.
- Assessing the scalability and transferability of the proposed model: The applicability and effectiveness of the developed model can be further evaluated across different smart city contexts and sectors. Conducting comparative studies in various geographic locations and industries can provide insights into the adaptability and transferability of the model, as well as identify sector-specific variations in digital maturity and criteria relevance.
- Examining the impact of smart tourism on destination competitiveness: Future research can focus on exploring how the adoption of smart tourism practices influences the competitive advantage of destinations. Evaluating the economic and strategic implications of smart city technologies on destination branding, marketing strategies, and visitor satisfaction can help guide decision-making and investment in smart tourism initiatives.
These future research directions aim to advance our understanding of the evolving landscape of smart tourism within smart cities and contribute to the development of effective strategies, frameworks, and technologies to enhance the digital experiences of tourists and maximize the benefits of digital transformation in the tourism sector.
Author Contributions
For research articles with several authors, a short paragraph specifying their individual contributions must be provided. The following statements should be used “Conceptualization, G.M.D. and J.L.G.S.; methodology, G.M.D.; software, G.M.D.; validation, G.M.D., J.L.G.S. and J.J.G.H.; formal analysis, G.M.D. and J.L.G; investigation, G.M.D., J.L.G.S and J.J.G.H.; resources, G.M.D., J.L.G.S. and J.J.G.H.; data curation, G.M.D.; writing—original draft preparation, G.M.D. and J.L.G.S.; writing—review and editing, G.M.D., J.L.G.S. and J.J.G.H.; visualization, G.M.D.; supervision, G.M.D., J.L.G.S. and J.J.G.H.; project administration, G.M.D.; funding acquisition. All authors have read and agreed to the published version of the manuscript.
Funding
This research received no external funding.
Data Availability Statement
Not applicable.
Conflicts of Interest
The authors declare no conflict of interest.
References
- Keshavarzi, G.; Yildirim, Y.; Arefi, M. Does scale matter? An overview of the “smart cities” literature. Sustain. Cities Soc. 2021, 74. [Google Scholar] [CrossRef]
- Kitchin, R. The real-time city? Big data and smart urbanism. GeoJournal 2014, 79, 1–14. [Google Scholar] [CrossRef]
- Ivars-Baidal, J.A.; Celdrán-Bernabeu, M.A.; Femenia-Serra, F.; Perles-Ribes, J.F.; Vera-Rebollo, J.F. Smart city and smart destination planning: Examining instruments and perceived impacts in Spain. Cities 2023, 137, 104266. [Google Scholar] [CrossRef]
- Mora, L.; Bolici, R.; Deakin, M. The First Two Decades of Smart-City Research: A Bibliometric Analysis. J. Urban Technol. 2017, 24, 3–27. [Google Scholar] [CrossRef]
- Caragliu, A.; Bo, C. Del; Nijkamp, P. Smart Cities in Europe. J. Urban Technol. 2011, 18, 65–82. [Google Scholar] [CrossRef]
- Gretzel, U.; Koo, C. Smart tourism cities: a duality of place where technology supports the convergence of touristic and residential experiences. Asia Pacific J. Tour. Res. 2021, 26, 1–13. [Google Scholar] [CrossRef]
- Femenia-Serra, F.; Neuhofer, B. 50 Asociación Española de Ciencia Regional España Smart tourism experiences: conceptualisation, key dimensions and research agenda. Investig. Reg. Reg. Res. 2018, 42, 129. [Google Scholar]
- Grossi, G.; Pianezzi, D. Smart cities: Utopia or neoliberal ideology? Cities 2017, 69, 79–85. [Google Scholar] [CrossRef]
- Jeong, M.; Shin, H.H. Tourists’ Experiences with Smart Tourism Technology at Smart Destinations and Their Behavior Intentions. J. Travel Res. 2020, 59, 1464–1477. [Google Scholar] [CrossRef]
- Dirsehan, T.; van Zoonen, L. Smart city technologies from the perspective of technology acceptance. IET Smart Cities 2022, 4, 197–210. [Google Scholar] [CrossRef]
- Capdevila, I.; Zarlenga, M.I. Smart city or smart citizens? The Barcelona case. J. Strateg. Manag. 2015, 8, 266–282. [Google Scholar] [CrossRef]
- Davis, F.D. Perceived usefulness, perceived ease of use, and user acceptance of information technology. MIS Q. Manag. Inf. Syst. 1989, 13, 319–339. [Google Scholar] [CrossRef]
- El Archi, Y.; Benbba, B. The Applications of Technology Acceptance Models in Tourism and Hospitality Research: A Systematic Literature Review. J. Environ. Manag. Tour. 2023, 14, 379–391. [Google Scholar] [CrossRef]
- Jannach, D.; Manzoor, A.; Cai, W.; Chen, L. A Survey on Conversational Recommender Systems. ACM Comput. Surv. 2021, 54. [Google Scholar] [CrossRef]
- Figueroa, C.; Vagliano, I.; Rocha, O.R.; Morisio, M. A systematic literature review of Linked Data-based recommender systems. Concurr. Comput. Pract. Exp. 2015, 27, 4659–4684. [Google Scholar] [CrossRef]
- Lex, E.; Schedl, M. Psychology-informed Recommender Systems Tutorial. In Proceedings of the Sixteenth ACM Conference on Recommender Systems; ACM; 2022; pp. 714–717. [Google Scholar]
- Quijano-Sánchez, L.; Cantador, I.; Cortés-Cediel, M.E.; Gil, O. Recommender systems for smart cities. Inf. Syst. 2020, 92. [Google Scholar] [CrossRef]
- Corte, V.; D’Andrea, C.; Savastano, I.; Zamparelli, P. Smart Cities and Destination Management: Impacts and Opportunities for Tourism Competitiveness. Eur. J. Tour. Res. 2017, 17, 7–27. [Google Scholar] [CrossRef]
- Um, T.; Chung, N. Does smart tourism technology matter? Lessons from three smart tourism cities in South Korea. Asia Pacific J. Tour. Res. 2021, 26, 396–414. [Google Scholar] [CrossRef]
- Buhalis, D. Technology in tourism-from information communication technologies to eTourism and smart tourism towards ambient intelligence tourism: a perspective article. Tour. Rev. 2020, 75, 267–272. [Google Scholar] [CrossRef]
- Tsai-Lin, T.-F.; Chang, Y.-Y. Framing a Smart Service with Living Lab Approach: A Case of Introducing Mobile Service within 4G for Smart Tourism in Taiwan. In Proceedings of the 2018 IEEE INTERNATIONAL CONFERENCE ON ENGINEERING, TECHNOLOGY AND INNOVATION (ICE/ITMC); 2018.
- Azevedo, J.N.; Alturas, B. The Augmented Reality in Lisbon Tourism Proposal for a AR Technology Adoption Model. In Proceedings of the 2019 14TH IBERIAN CONFERENCE ON INFORMATION SYSTEMS AND TECHNOLOGIES (CISTI); 2019.
- Van, N.T.T.; Vrana, V.; Duy, N.T.; Minh, D.X.H.; Dzung, P.T.; Mondal, S.R.; Das, S. The Role of Human-Machine Interactive Devices for Post-COVID-19 Innovative Sustainable Tourism in Ho Chi Minh City, Vietnam. SUSTAINABILITY 2020, 12. [Google Scholar] [CrossRef]
- Pinto, A.S.; Abreu, A.; Costa, E.; Paiva, J. Using UTAUT-3 to Understand the Adoption of Mobile Augmented Reality in Tourism (MART). In Proceedings of the ADVANCES IN TOURISM, TECHNOLOGY AND SYSTEMS, VOL 2; DeCarvalho, J. V, Liberato, P., Pena, A., Eds.; 2022; Vol. 284, pp. 373–384.
- Baldi, G.; Megaro, A.; Carrubbo, L. Small-Town Citizens’ Technology Acceptance of Smart and Sustainable City Development. SUSTAINABILITY 2023, 15. [Google Scholar] [CrossRef]
- Chi, Y.-L.; Tsai, Y.-C. The empirical study of impact critical security factors of mobile applications on technology acceptance model. J. Stat. Manag. Syst. 2017, 20, 245–273. [Google Scholar] [CrossRef]
- El-Wajeeh, M.; Galal-Edeen, P.G.H.; Mokhtar, D.H. Technology Acceptance Model for Mobile Health Systems. IOSR J. Mob. Comput. Appl. 2014, 1, 21–33. [Google Scholar] [CrossRef]
- Ikhsan, K. Technology Acceptance Model, Social Influence and Perceived Risk in Using Mobile Applications: Empirical Evidence in Online Transportation in Indonesia. J. Din. Manaj. 2020, 11, 127–138. [Google Scholar] [CrossRef]
- Tangri, K.; Joghee, S.; Kalra, D.; Shameem, B.; Agarwal, R. Assessment of Perception of Usage of Mobile Social Media on Online Business Model through Technological Acceptance Model (TAM) and Structural Equation Modeling (SEM). In Proceedings of the 2023 International Conference on Business Analytics for Technology and Security (ICBATS); IEEE, 2023; pp. 1–6.
- Saif, N.; Khan, I.U.; Khan, G.A. Investigating the Impact of Mobile Application on Learning Among Teachers Based on Technology Acceptance Model (TAM). Glob. Educ. Stud. Rev. 2020, V, 45–54. [Google Scholar] [CrossRef]
- Huang, Y.-C.; Chang, L.L.; Yu, C.-P.; Chen, J. Examining an extended technology acceptance model with experience construct on hotel consumers’ adoption of mobile applications. J. Hosp. Mark. Manag. 2019, 28, 957–980. [Google Scholar] [CrossRef]
- Lin, C.-H.; Shih, H.-Y.; Sher, P.J. Integrating technology readiness into technology acceptance: The TRAM model. Psychol. Mark. 2007, 24, 641–657. [Google Scholar] [CrossRef]
- Chau, P.Y.K. An Empirical Assessment of a Modified Technology Acceptance Model. J. Manag. Inf. Syst. 1996, 13, 185–204. [Google Scholar] [CrossRef]
- Isaac, O.; Mutahar, A.M.; Daud, N.M.; Ramayah, T.; Aldholay, A.H. The effect of awareness and perceived risk on the technology acceptance model (TAM): mobile banking in Yemen. Int. J. Serv. Stand. 2018, 12, 180. [Google Scholar] [CrossRef]
- Hussein, Z. Leading to Intention: The Role of Attitude in Relation to Technology Acceptance Model in E-Learning. Procedia Comput. Sci. 2017, 105, 159–164. [Google Scholar] [CrossRef]
- Holden, H.; Rada, R. Understanding the Influence of Perceived Usability and Technology Self-Efficacy on Teachers’ Technology Acceptance. J. Res. Technol. Educ. 2011, 43, 343–367. [Google Scholar] [CrossRef]
- Lah, U.; Lewis, J.R.; Šumak, B. Perceived Usability and the Modified Technology Acceptance Model. Int. J. Human–Computer Interact. 2020, 36, 1216–1230. [Google Scholar] [CrossRef]
- Venkatesh, V. Determinants of Perceived Ease of Use: Integrating Control, Intrinsic Motivation, and Emotion into the Technology Acceptance Model. Inf. Syst. Res. 2000, 11, 342–365. [Google Scholar] [CrossRef]
- Rauniar, R.; Rawski, G.; Yang, J.; Johnson, B. Technology acceptance model (TAM) and social media usage: an empirical study on Facebook. J. Enterp. Inf. Manag. 2014, 27, 6–30. [Google Scholar] [CrossRef]
- Al-Qaysi, N.; Mohamad-Nordin, N.; Al-Emran, M. Employing the technology acceptance model in social media: A systematic review; Education and Information Technologies, 2020; Vol. 25; ISBN 1063902010.
- Fedorko, I.; Fedorko, R.; Gavurova, B.; Bačík, R. Social media in the context of technology acceptance model. Entrep. Sustain. Issues 2021, 9, 519–528. [Google Scholar] [CrossRef] [PubMed]
- Schepers, J.; Wetzels, M. A meta-analysis of the technology acceptance model: Investigating subjective norm and moderation effects. Inf. Manag. 2007, 44, 90–103. [Google Scholar] [CrossRef]
- Al-Tarawneh, J.M. Technology Acceptance Models and Adoption of Innovations: A Literature Review. Int. J. Sci. Res. Publ. 2019, 9, p92116. [Google Scholar] [CrossRef]
- Venkatesh, V.; Bala, H. Technology Acceptance Model 3 and a Research Agenda on Interventions Subject Areas: Design Characteristics, Interventions. Decis. Sci. 2008, 39, 273–315. [Google Scholar] [CrossRef]
- Marín Díaz, G.; Carrasco, R.A.; Gómez, D. RFID: A Fuzzy Linguistic Model to Manage Customers from the Perspective of Their Interactions with the Contact Center. Mathematics 2021, 9, 2362. [Google Scholar] [CrossRef]
- Herrera, F.; Martinez, L. An approach for combining linguistic and numerical information based on the 2-tuple fuzzy linguistic representation model in decision-making. Int. J. Uncertainty, Fuzziness Knowlege-Based Syst. 2000, 8, 539–562. [Google Scholar] [CrossRef]
- Saaty, T.L. The analytic hierarchy process : planning, priority setting, resource allocation LK - https://ucm.on.worldcat.org/oclc/911278091; McGraw-Hill International Book Co: New York ; SE - xiii, 287 p. : illustrations ; 24 cm, 1980; ISBN 0070543712 9780070543713.
- Bernasconi, M.; Choirat, C.; Seri, R. "The Analytic Hierarchy Process and the Theory of Meausurement”, Working Paper No.24, Department of Economics Ca’Foscari Univ ersity of Venice. 2009.
- Thomas, L. Saaty Decision making with the analytic hierarchy process. J. Manuf. Technol. Manag. 2008, 26, 791–806. [Google Scholar] [CrossRef]
- Herrera, F.; Herrera-Viedma, E.; Martínez, L. A fusion approach for managing multi-granularity linguistic term sets in decision making. Fuzzy Sets Syst. 2000, 114, 43–58. [Google Scholar] [CrossRef]
- Herrera, F.; Martínez, L.; Sánchez, P.J. Managing non-homogeneous information in group decision making. Eur. J. Oper. Res. 2005, 166, 115–132. [Google Scholar] [CrossRef]
- Marín Díaz, G.; Carrasco González, R.A. Fuzzy Logic and Decision Making Applied to Customer Service Optimization. Axioms 2023, 12. [Google Scholar] [CrossRef]
- Marín Díaz, G.; Galán, J.J.; Carrasco, R.A. XAI for Churn Prediction in B2B Models: A Use Case in an Enterprise Software Company. Mathematics 2022, 10. [Google Scholar] [CrossRef]
Figure 1.
Technology Acceptance Model [12].
Figure 1.
Technology Acceptance Model [12].
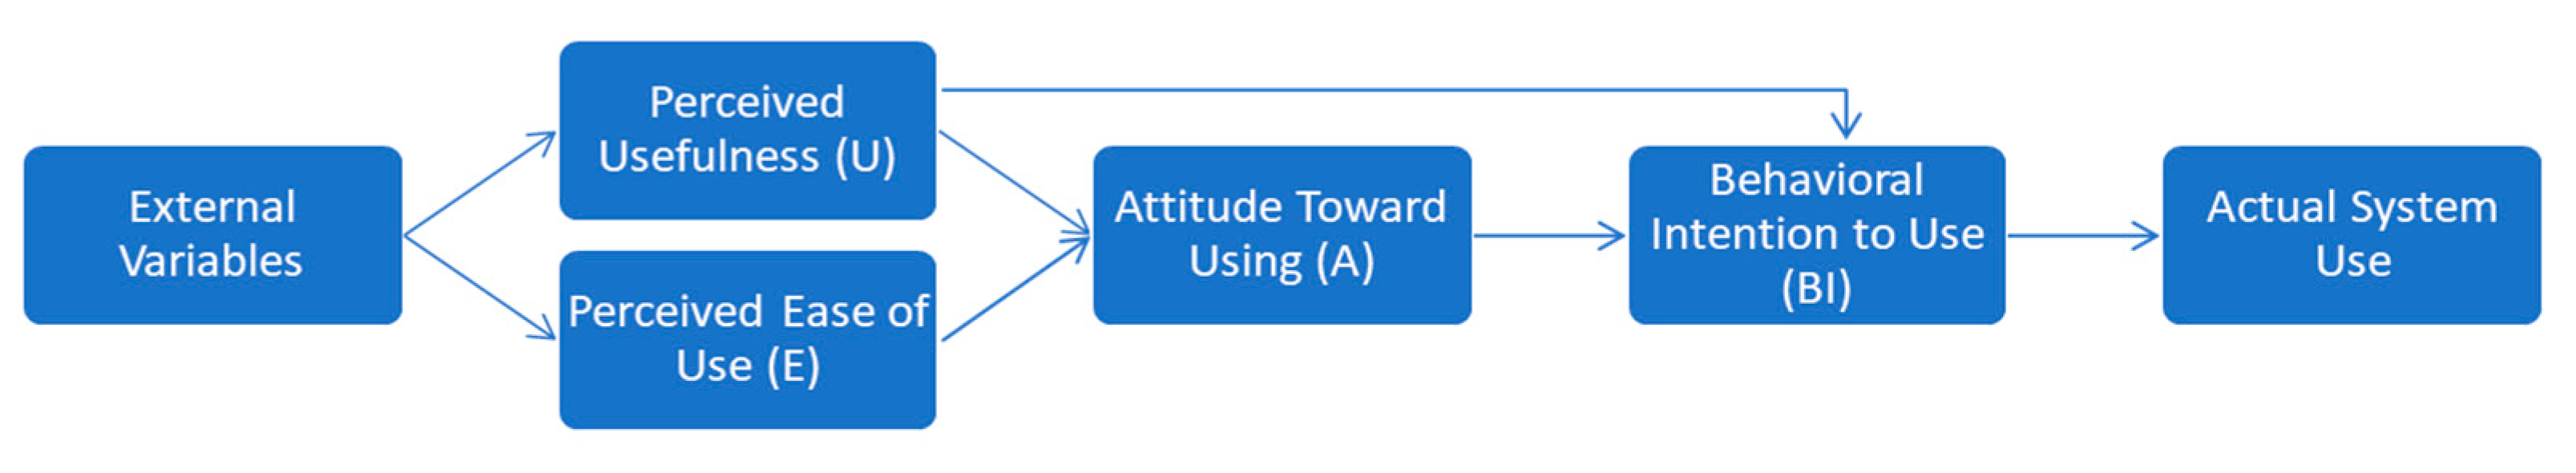
Figure 2.
Studies related to the recommender systems in the Smart Cities field.
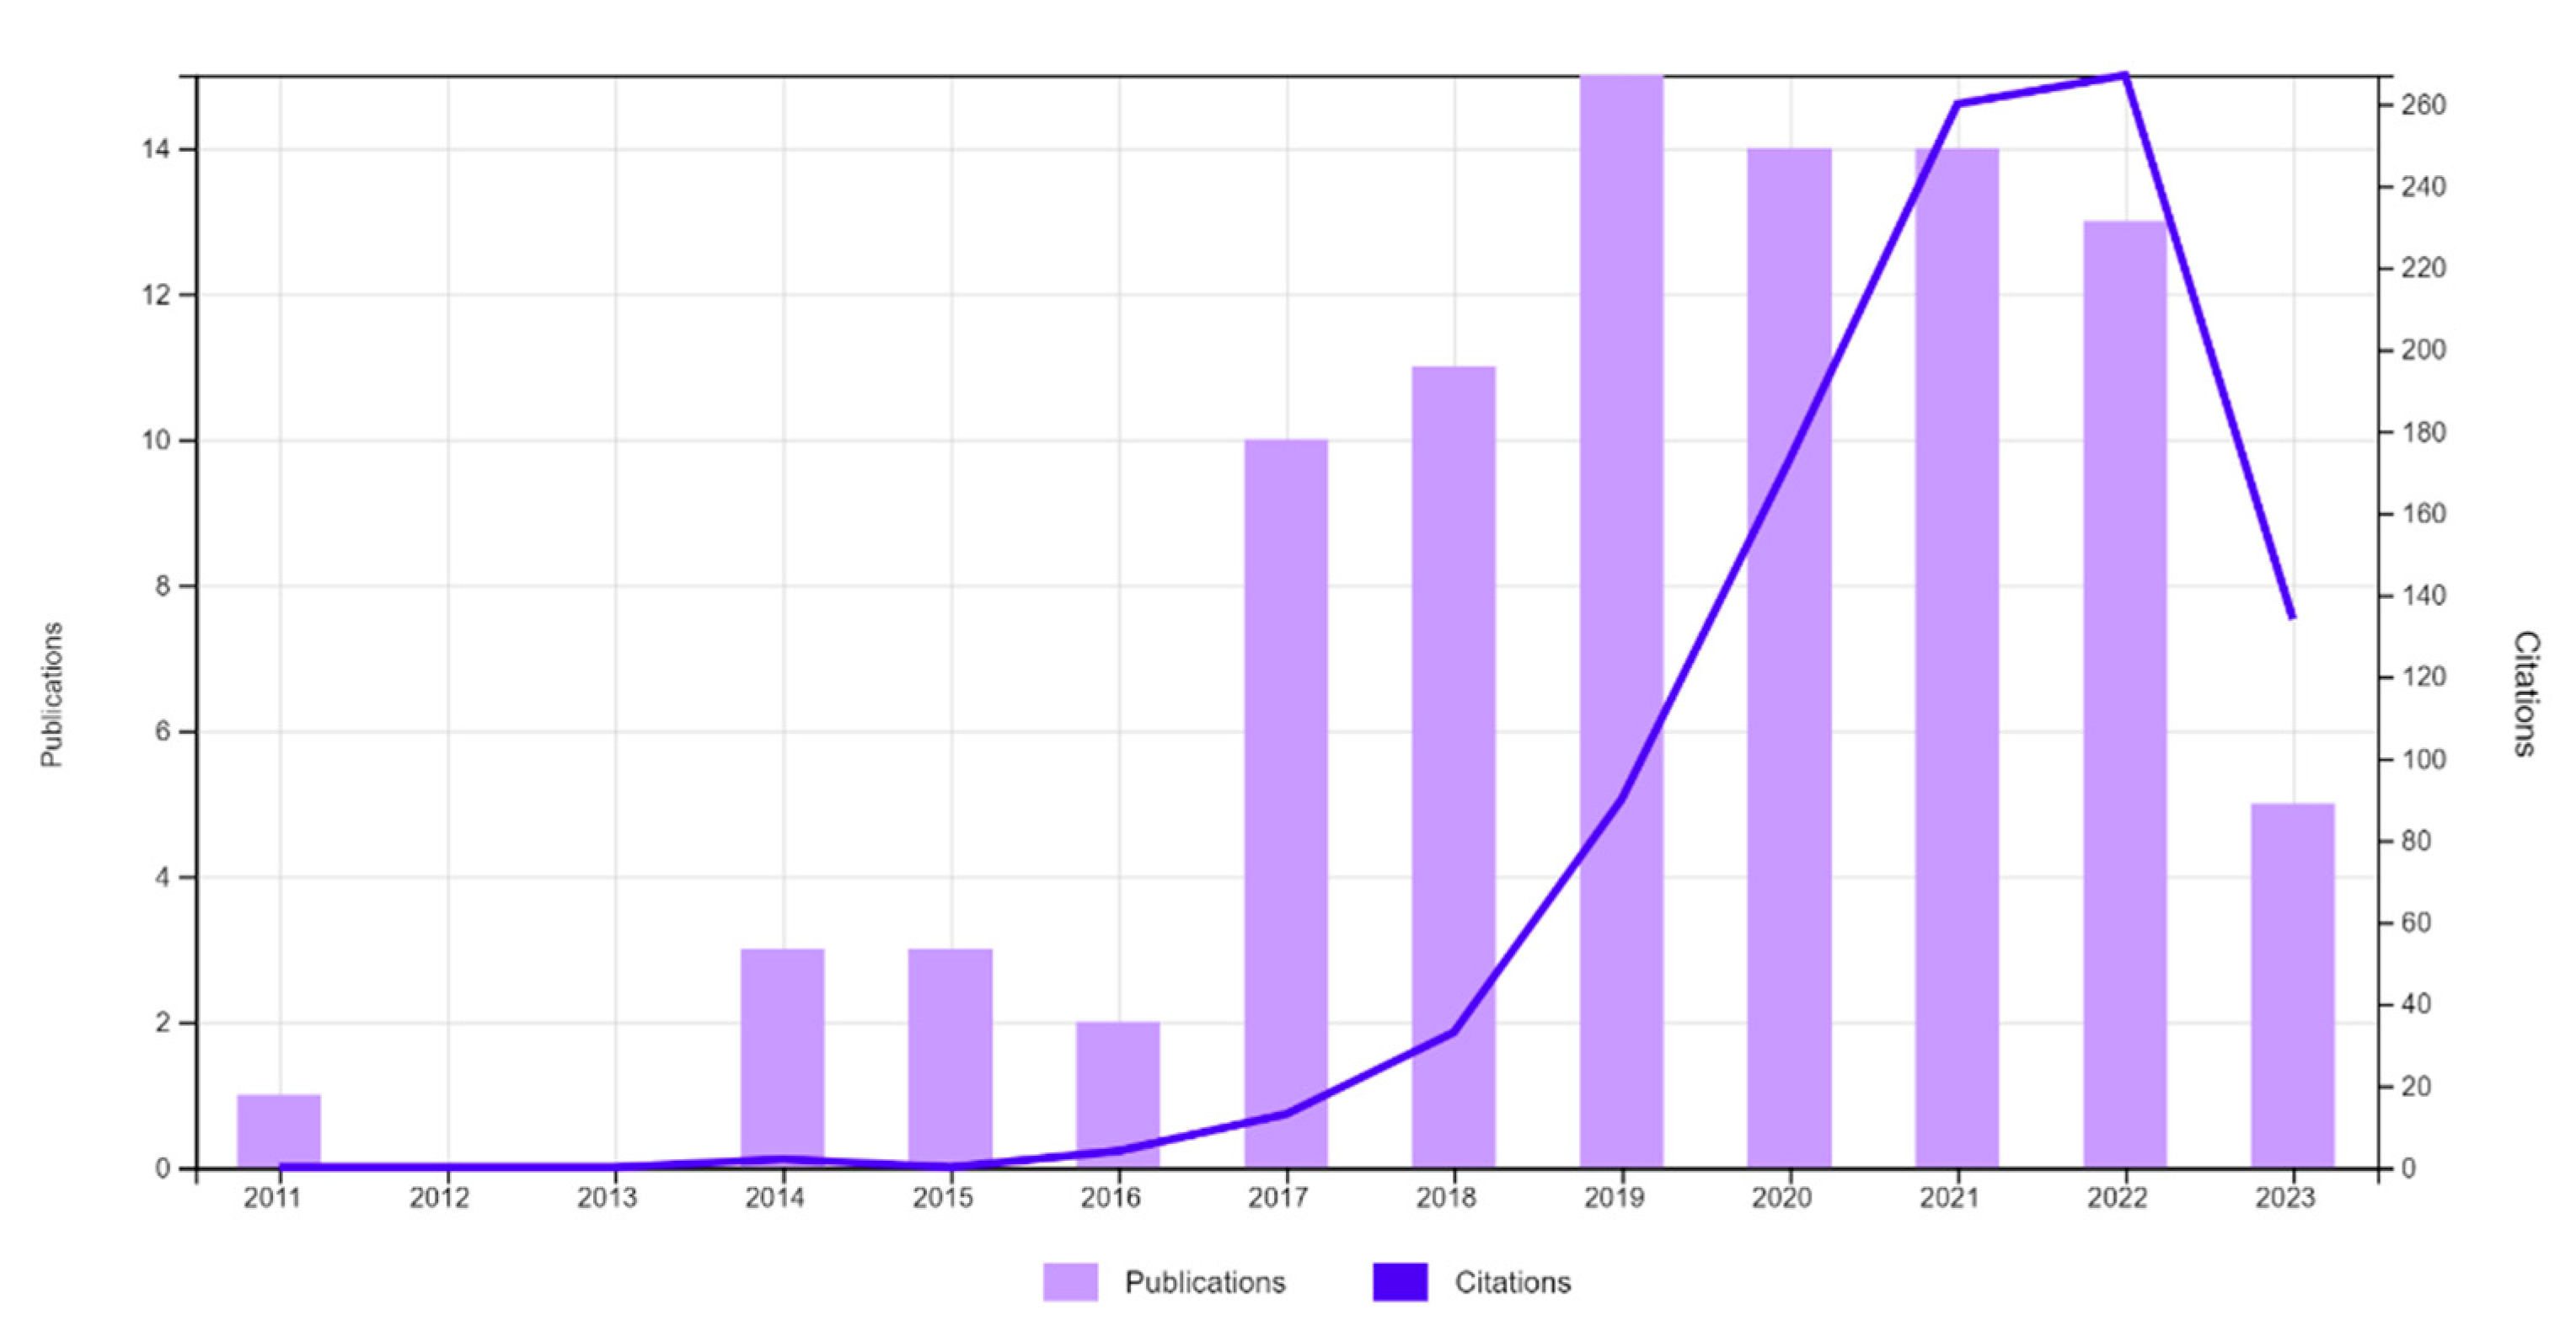
Figure 3.
Studies related to the Smart Tourism.
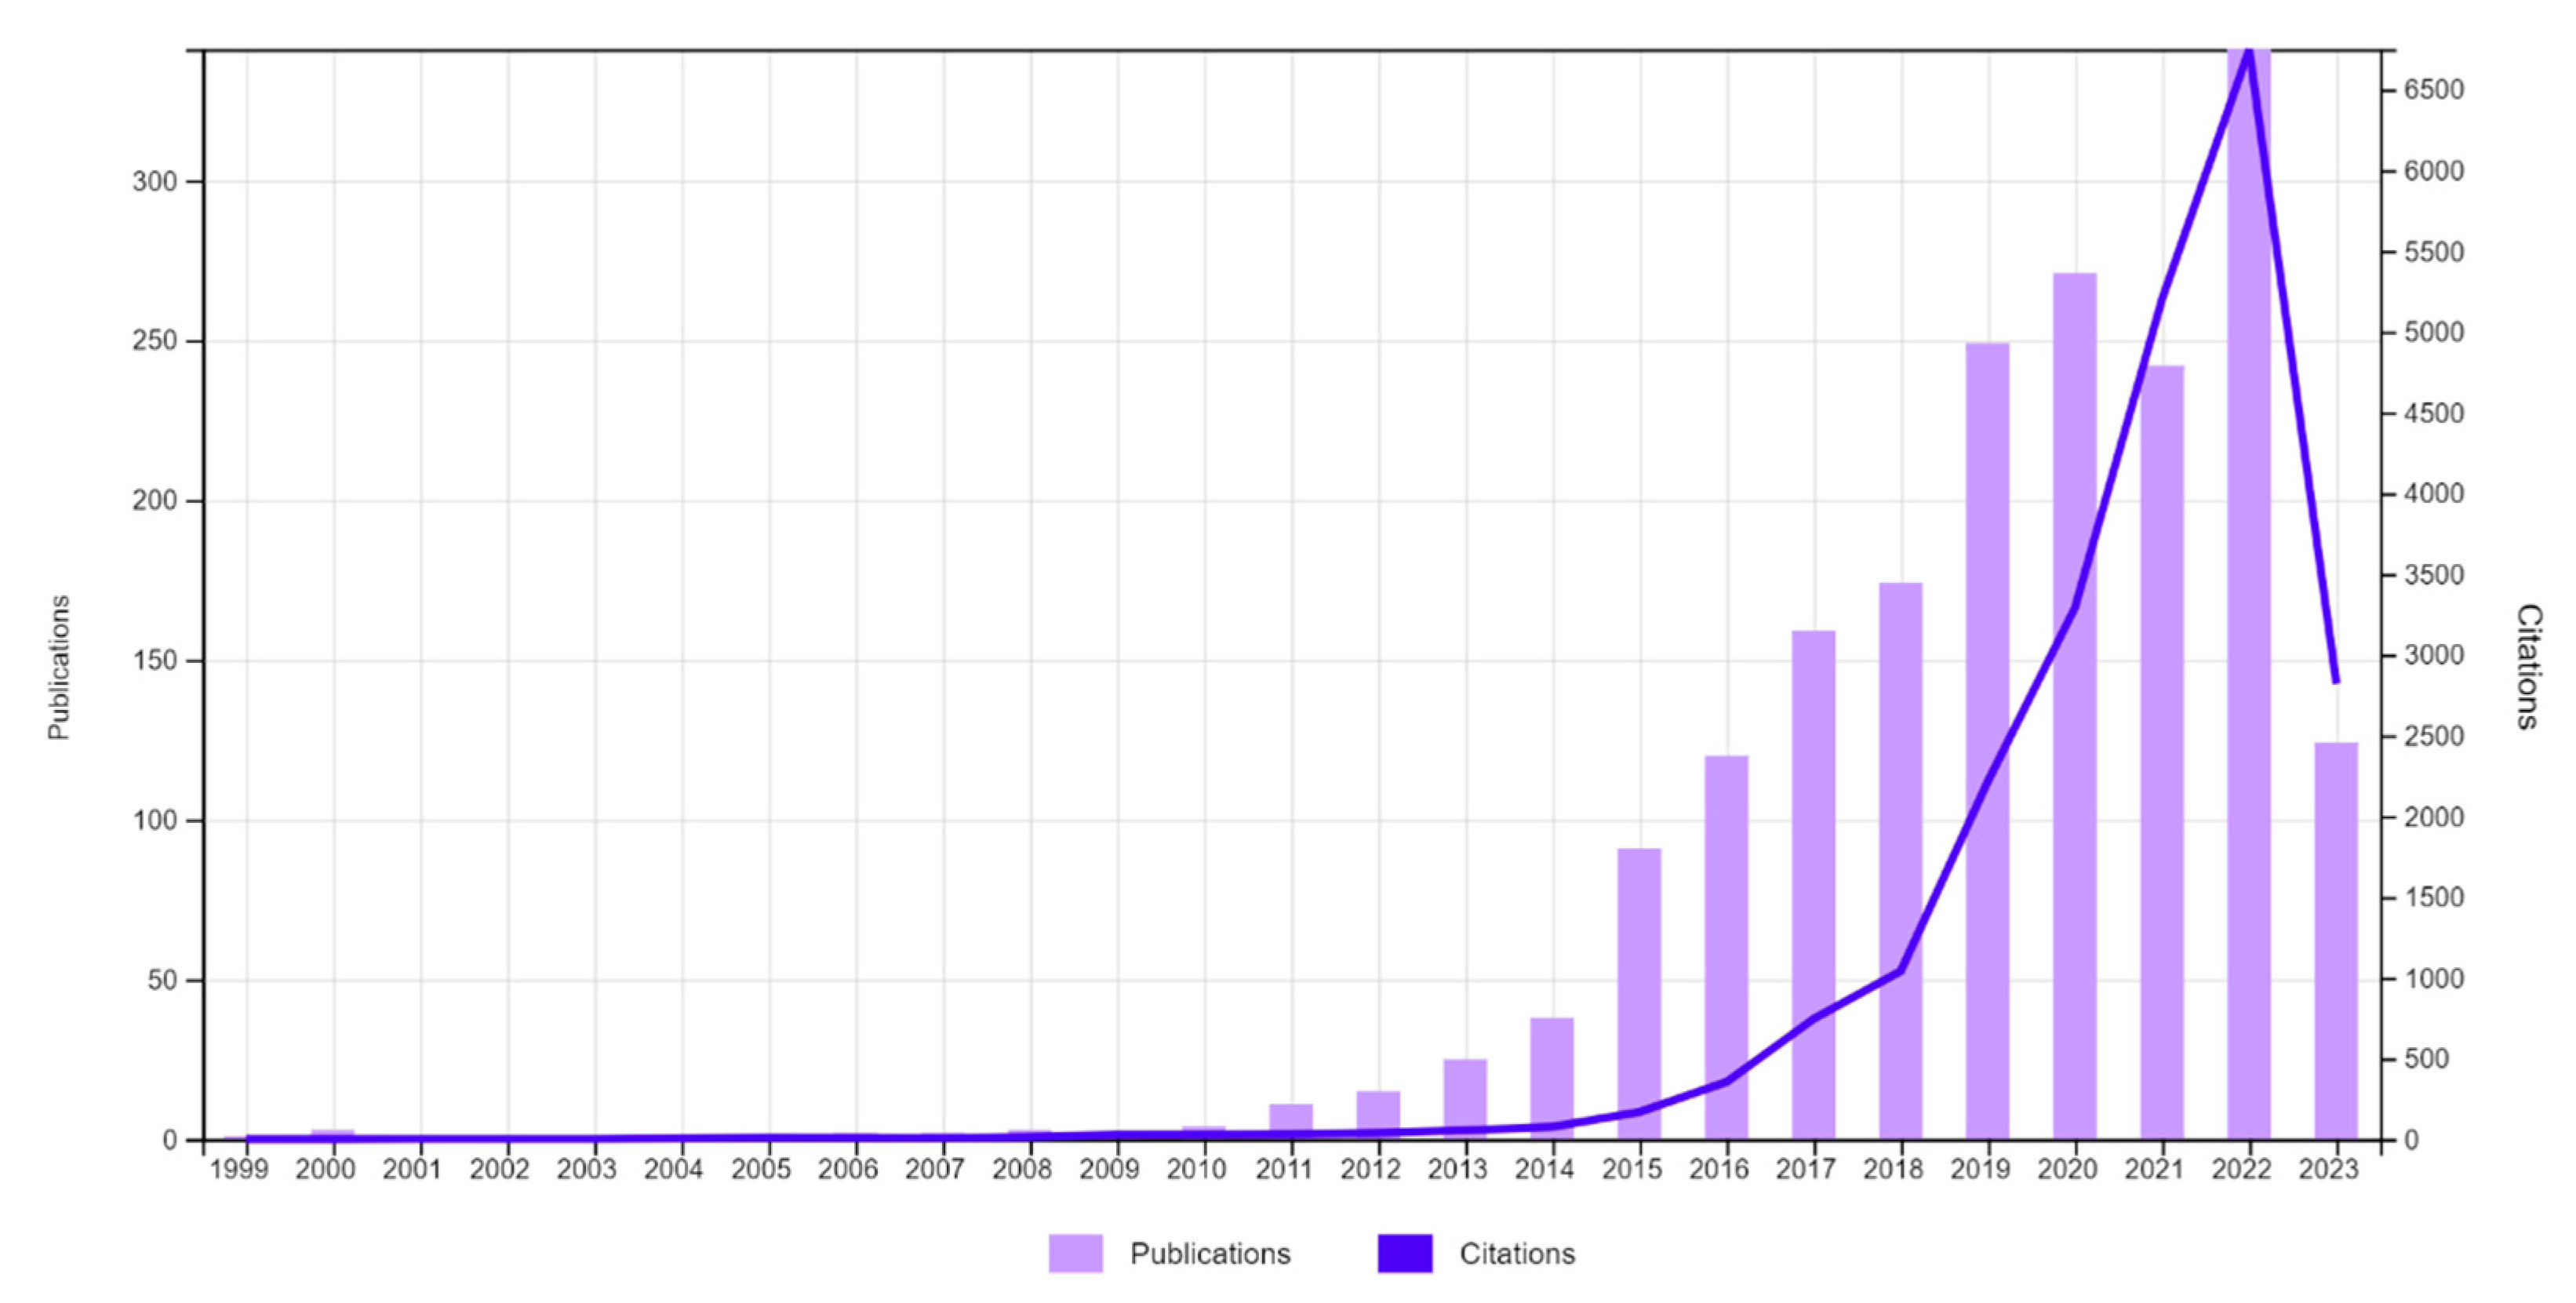
Figure 4.
Studies related to the Smart Cities and Smart Tourism.
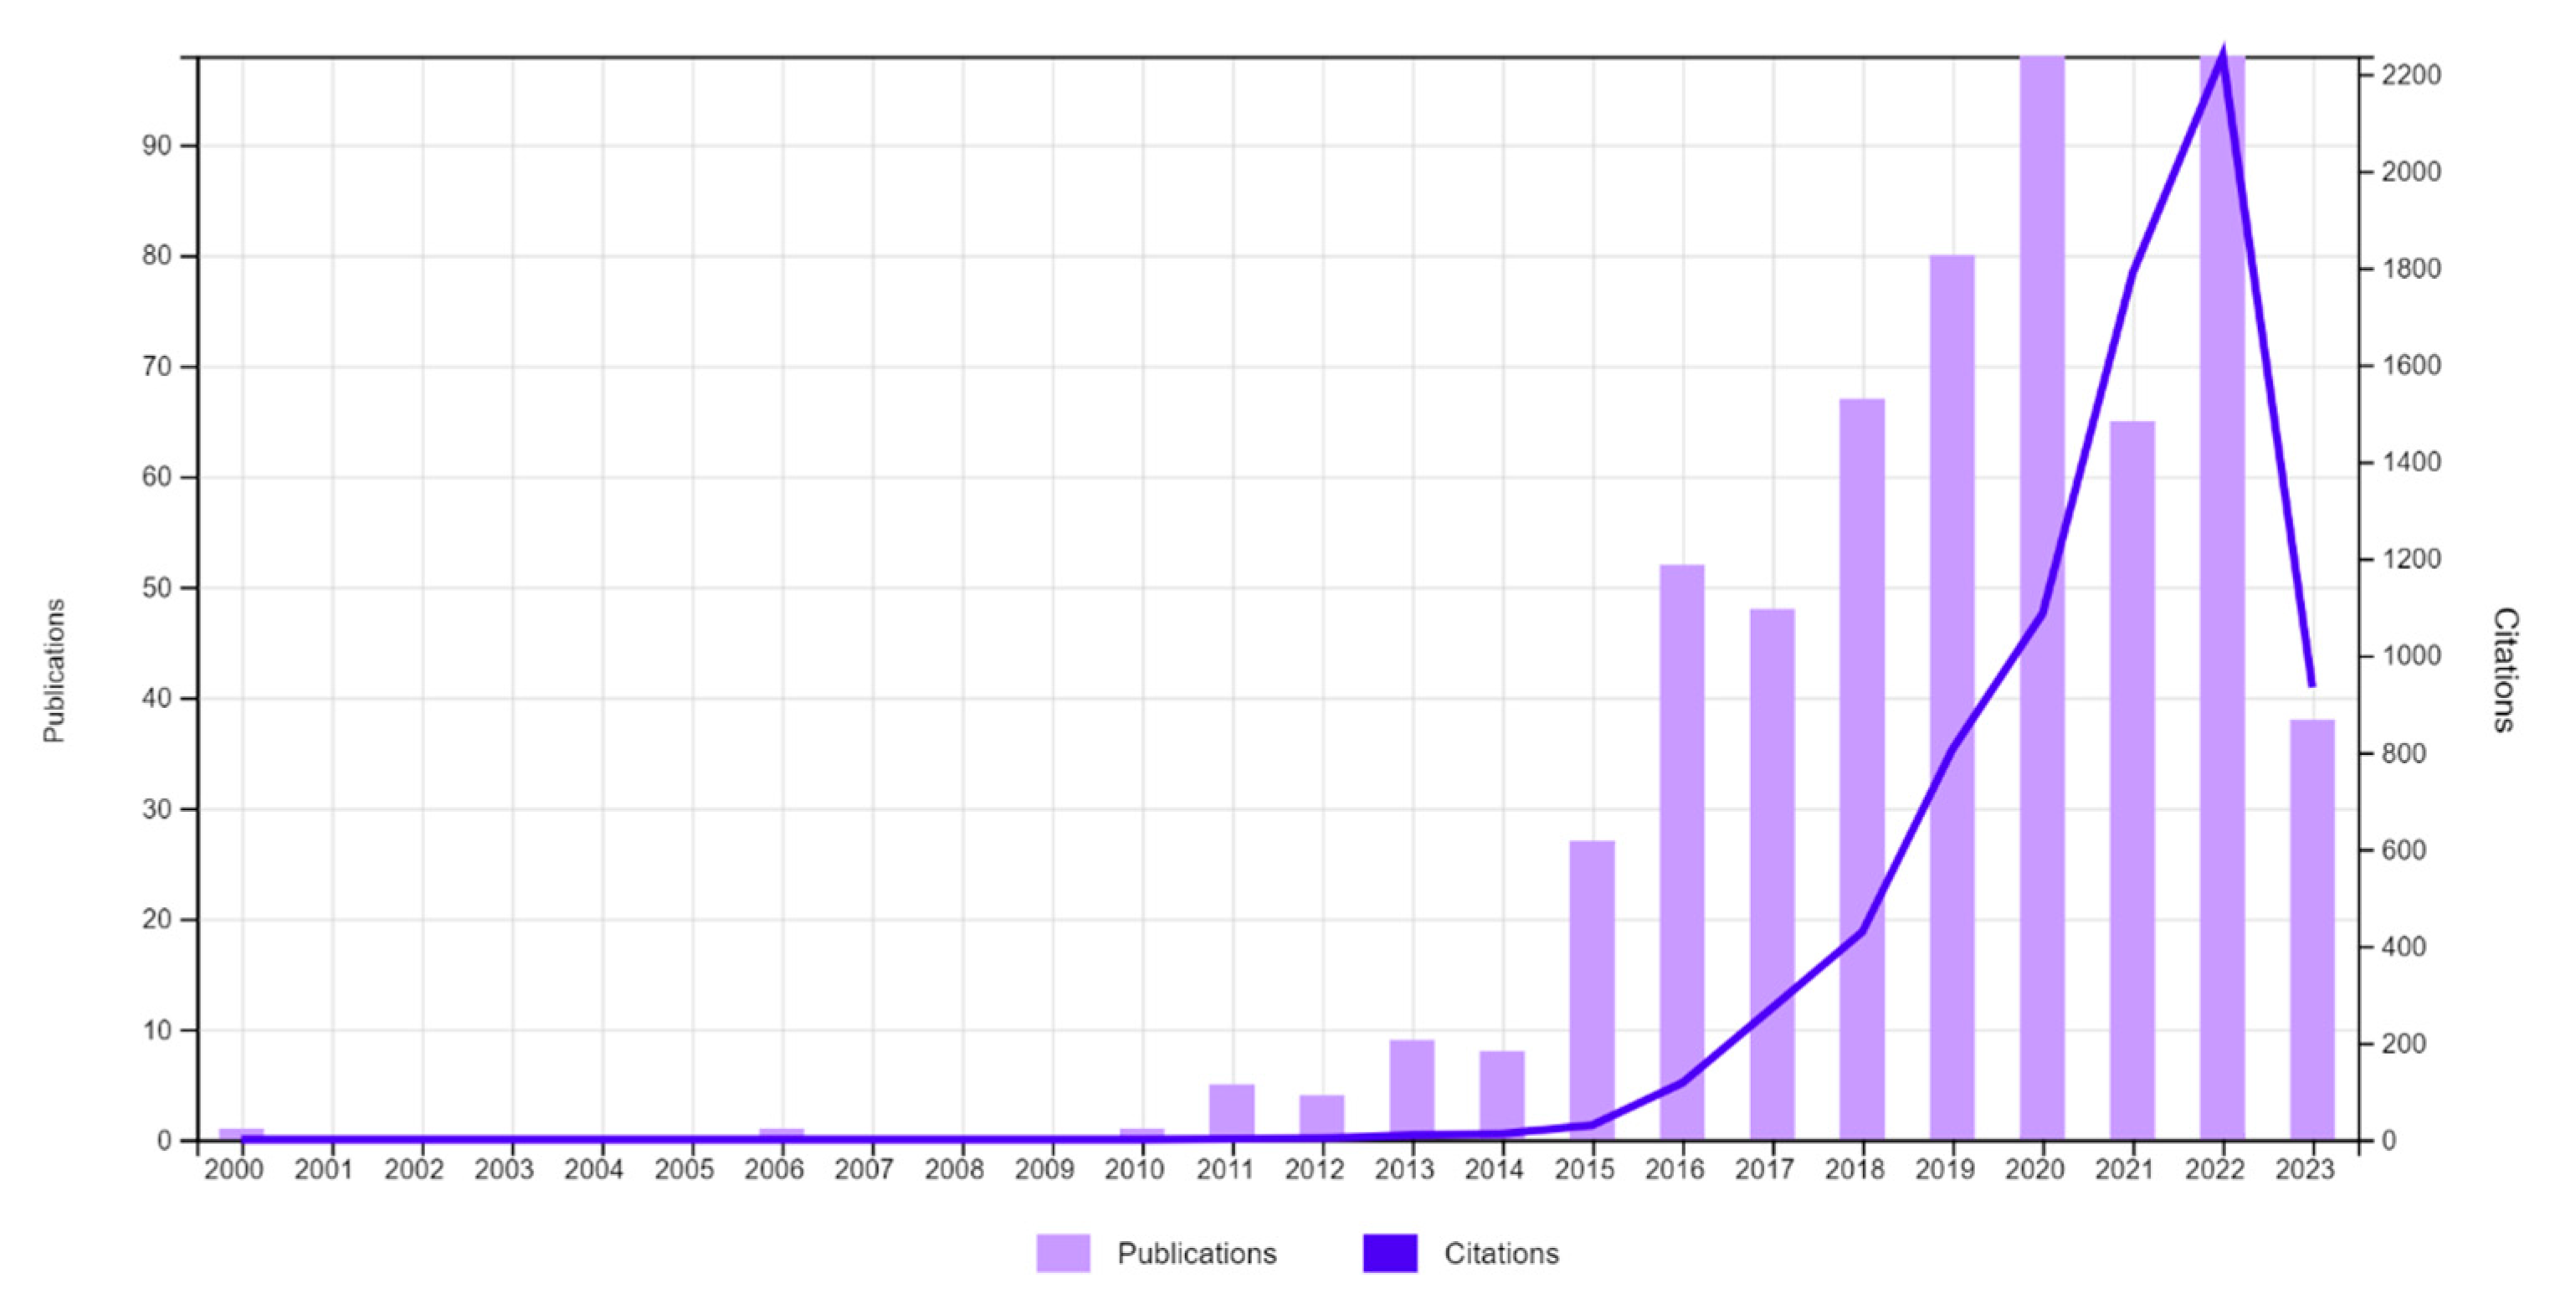
Figure 5.
Studies related to the Smart Tourism and TAM.
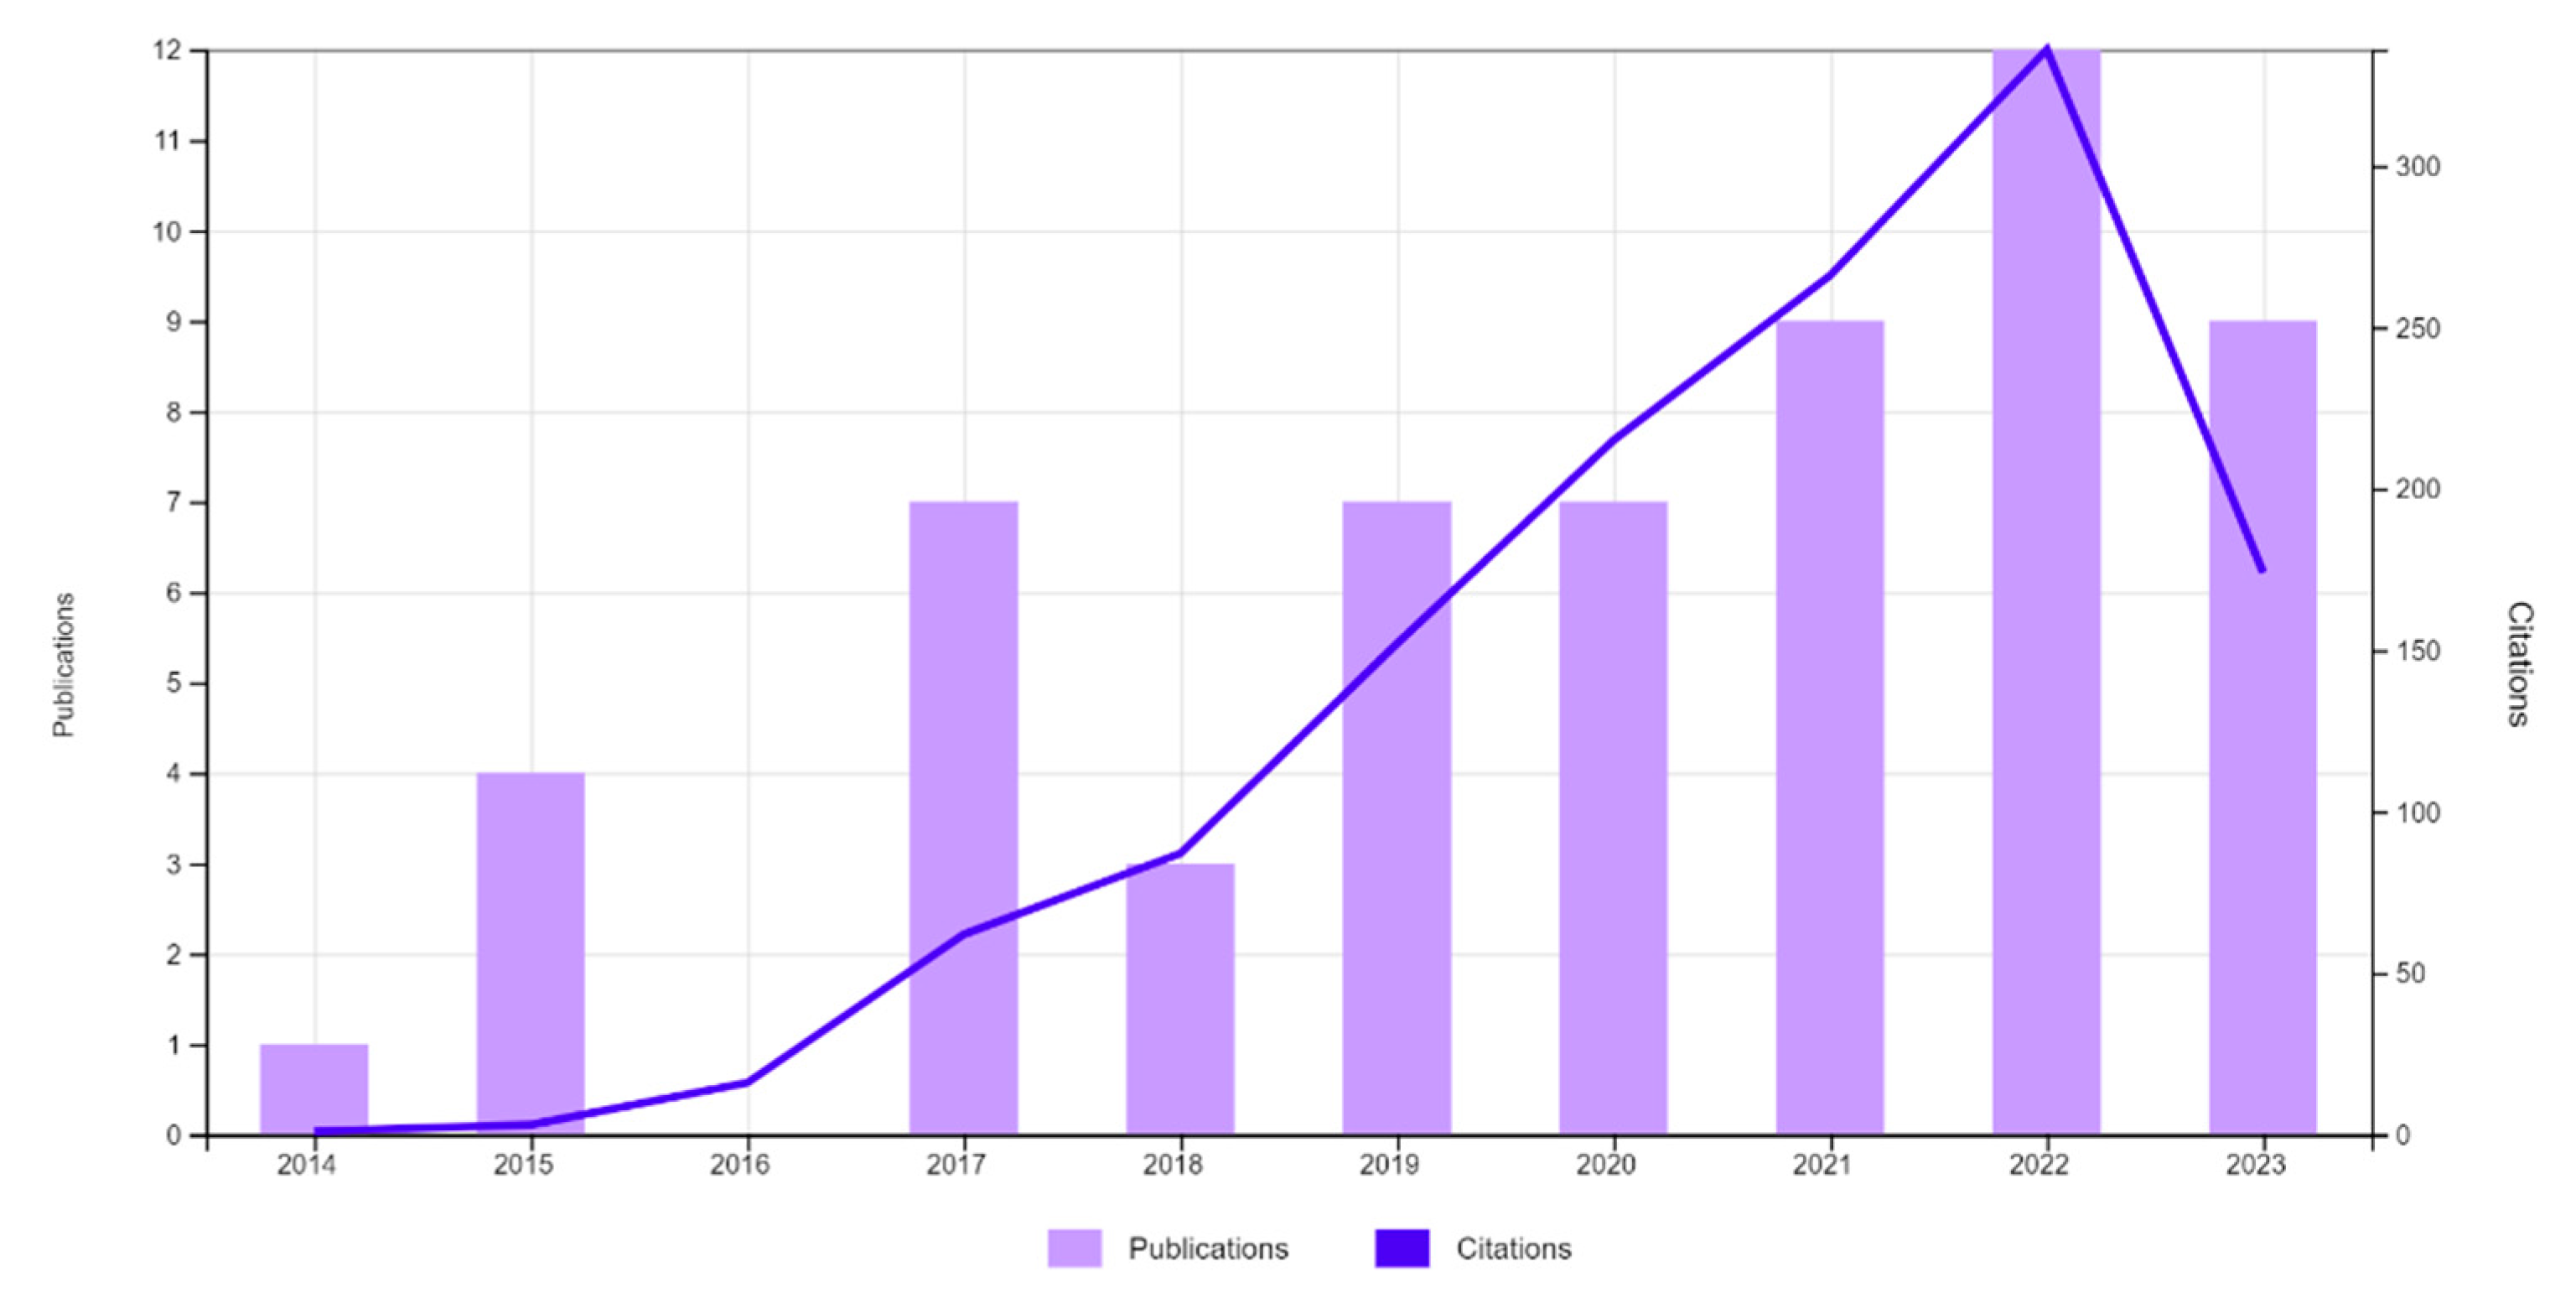
Figure 6.
Triangular linguistic representation in an s5 domain.
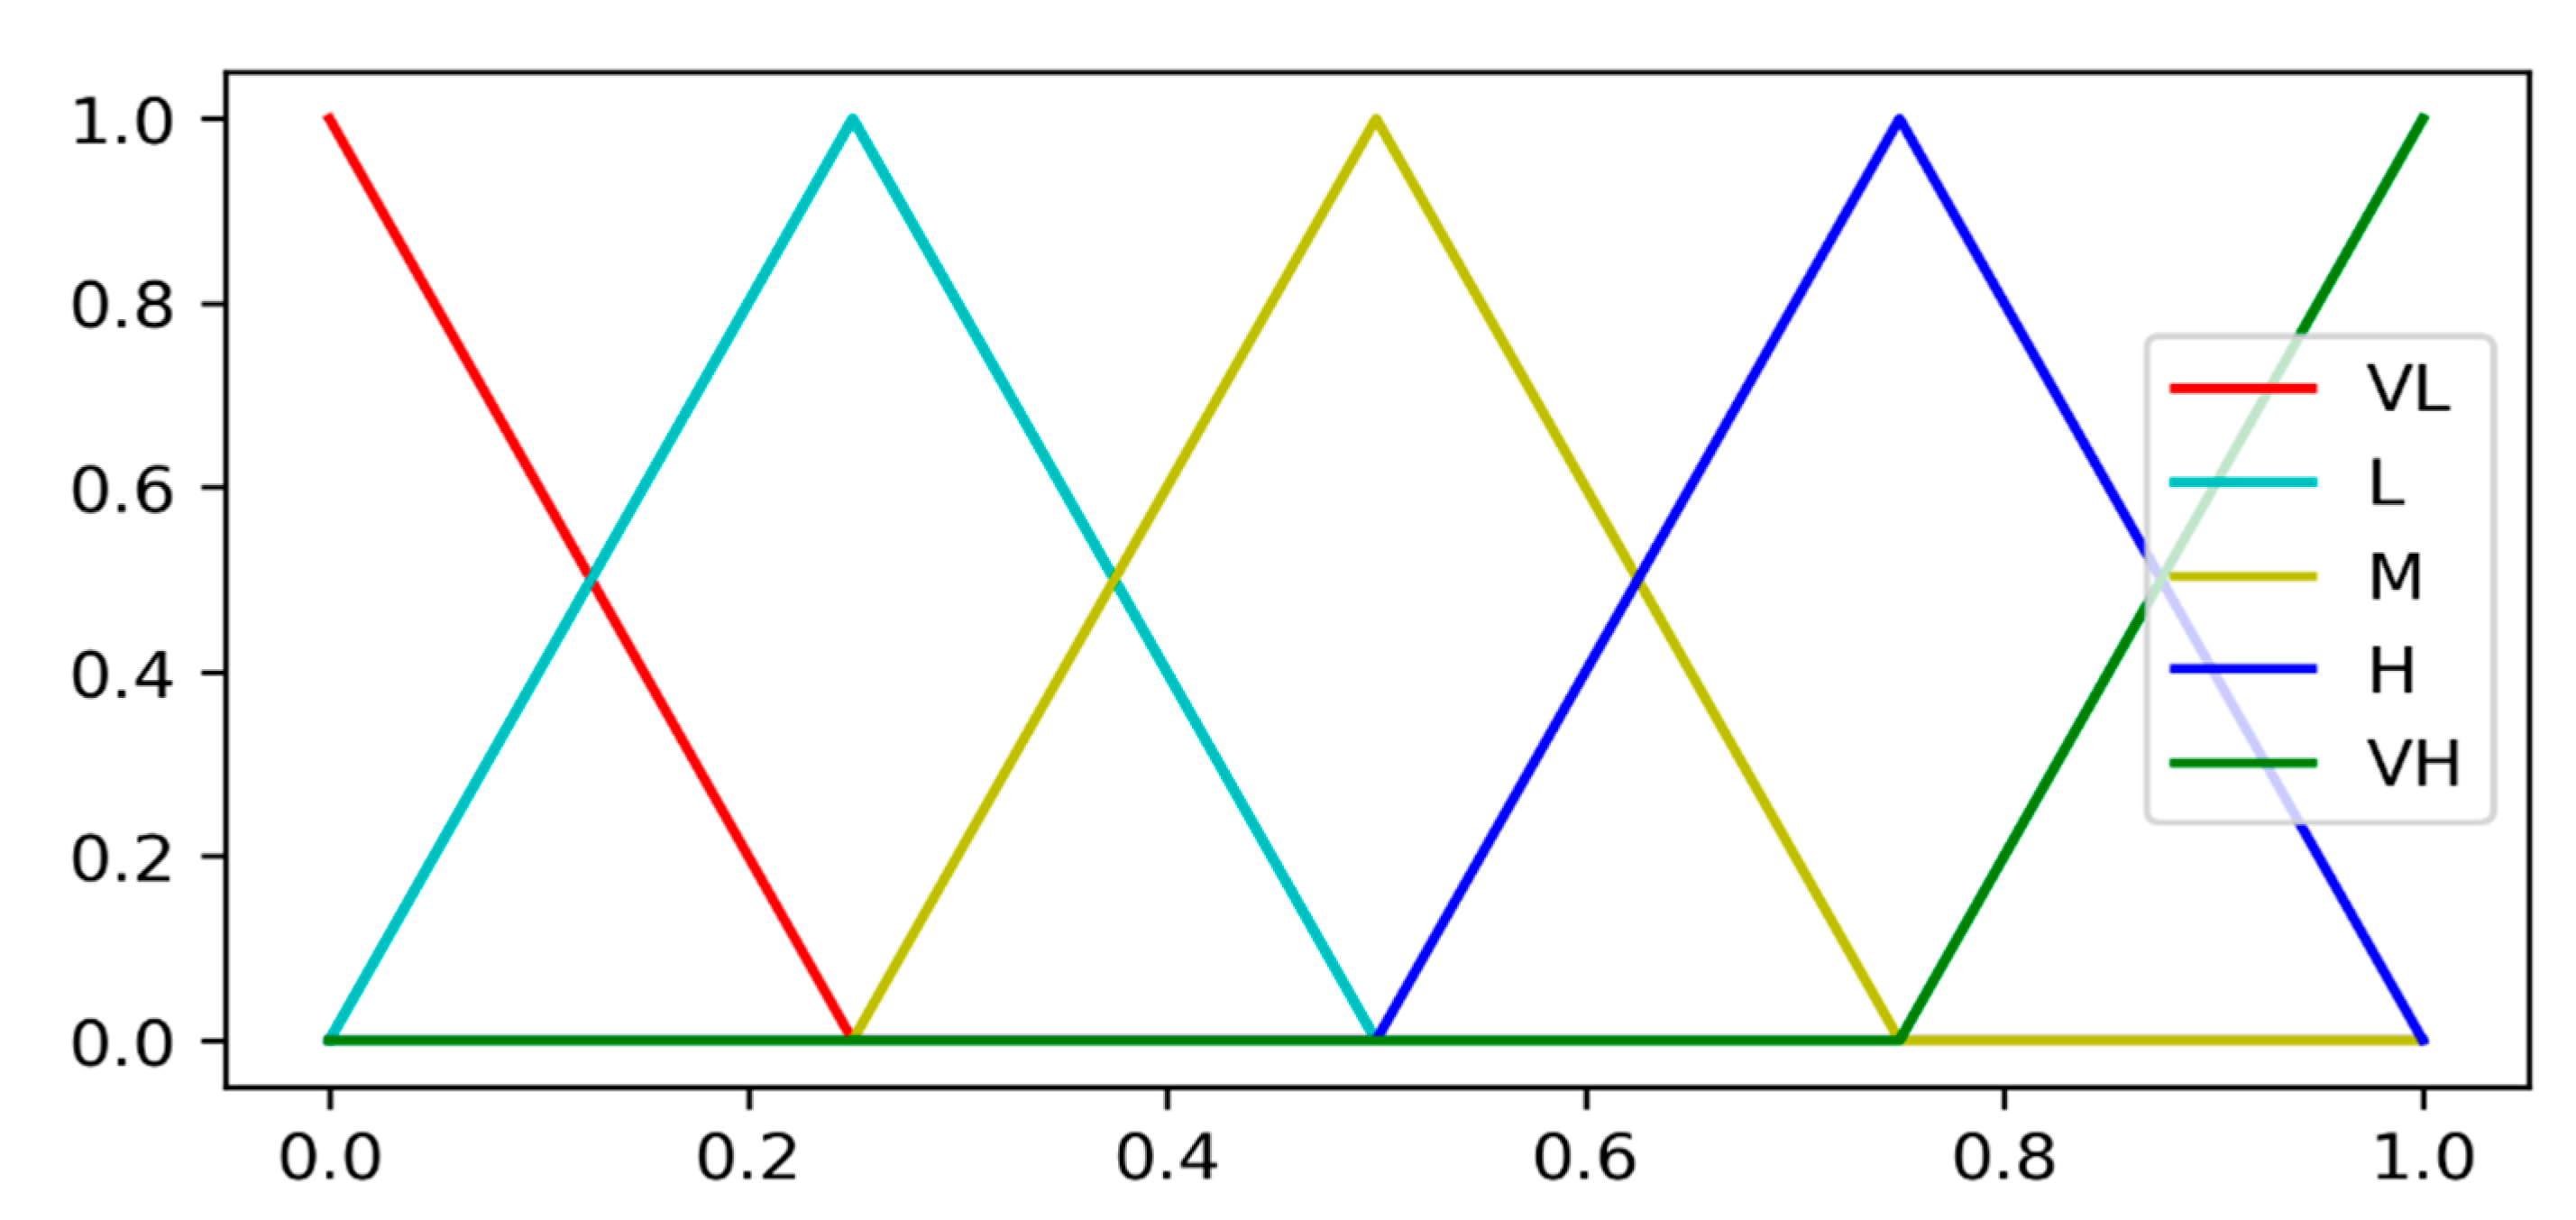
Figure 7.
Hierarchical structure of the decision problem.
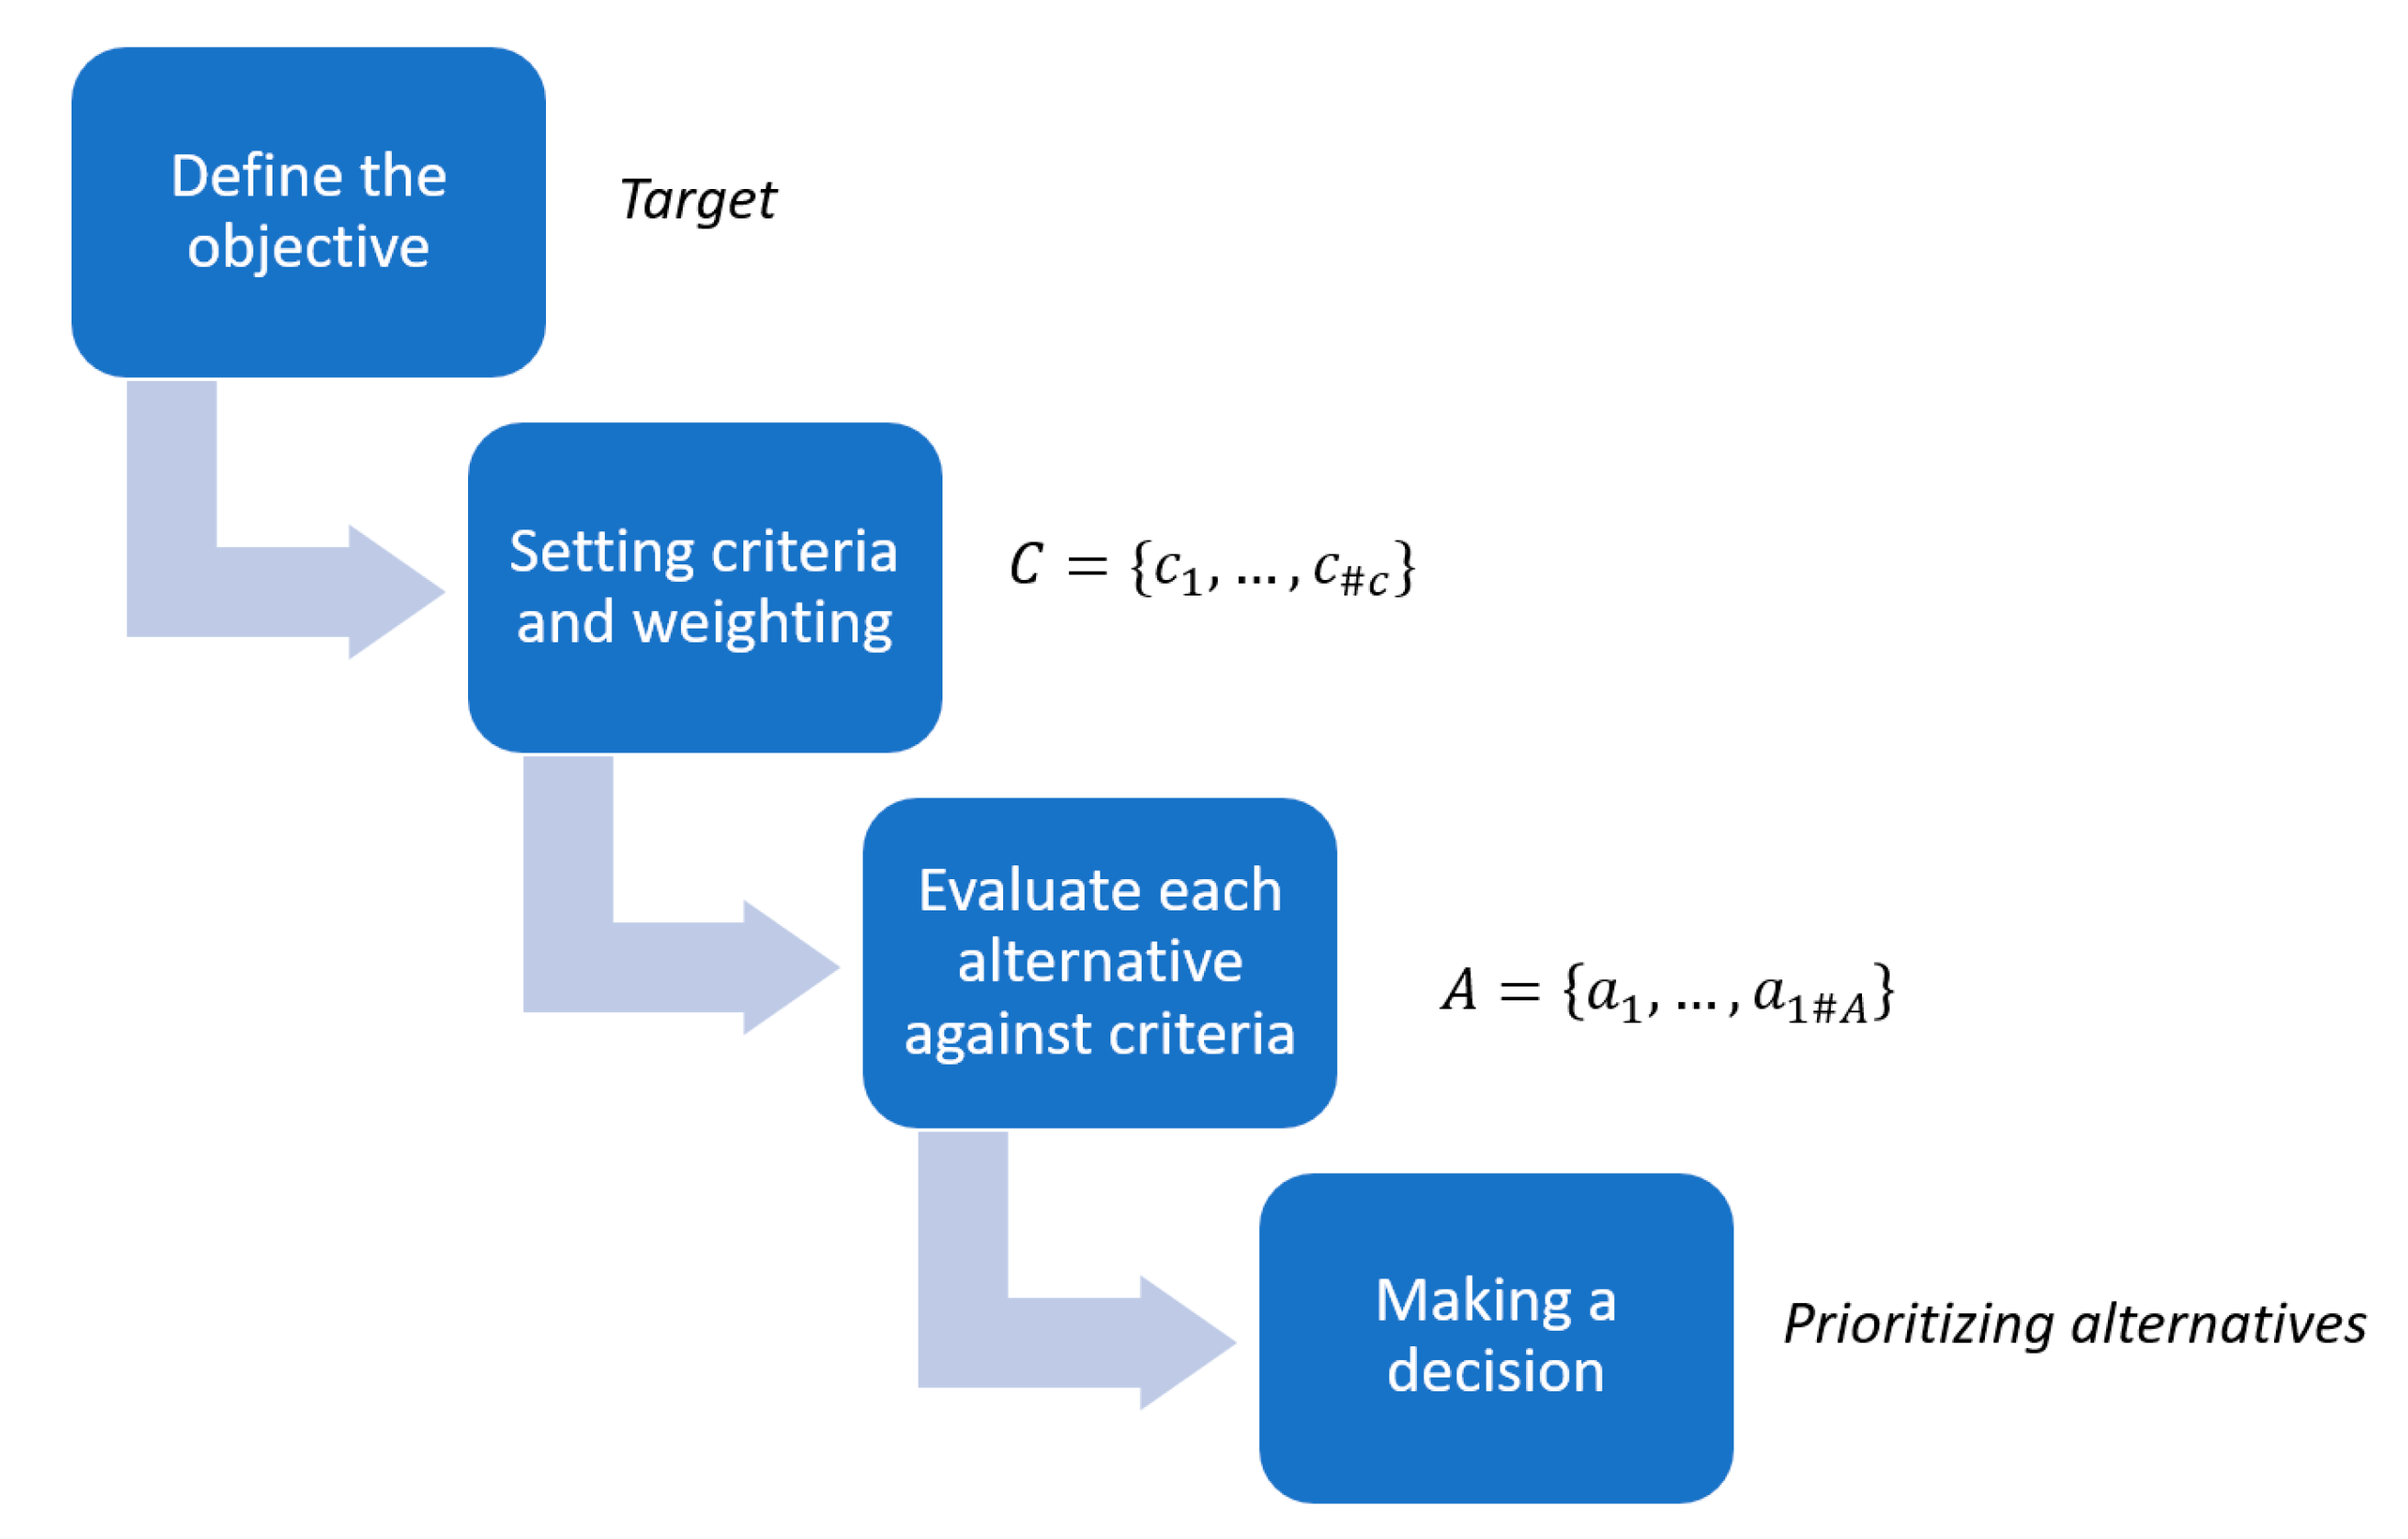
Figure 8.
The 2-tuple linguistic unification model [51].
Figure 8.
The 2-tuple linguistic unification model [51].
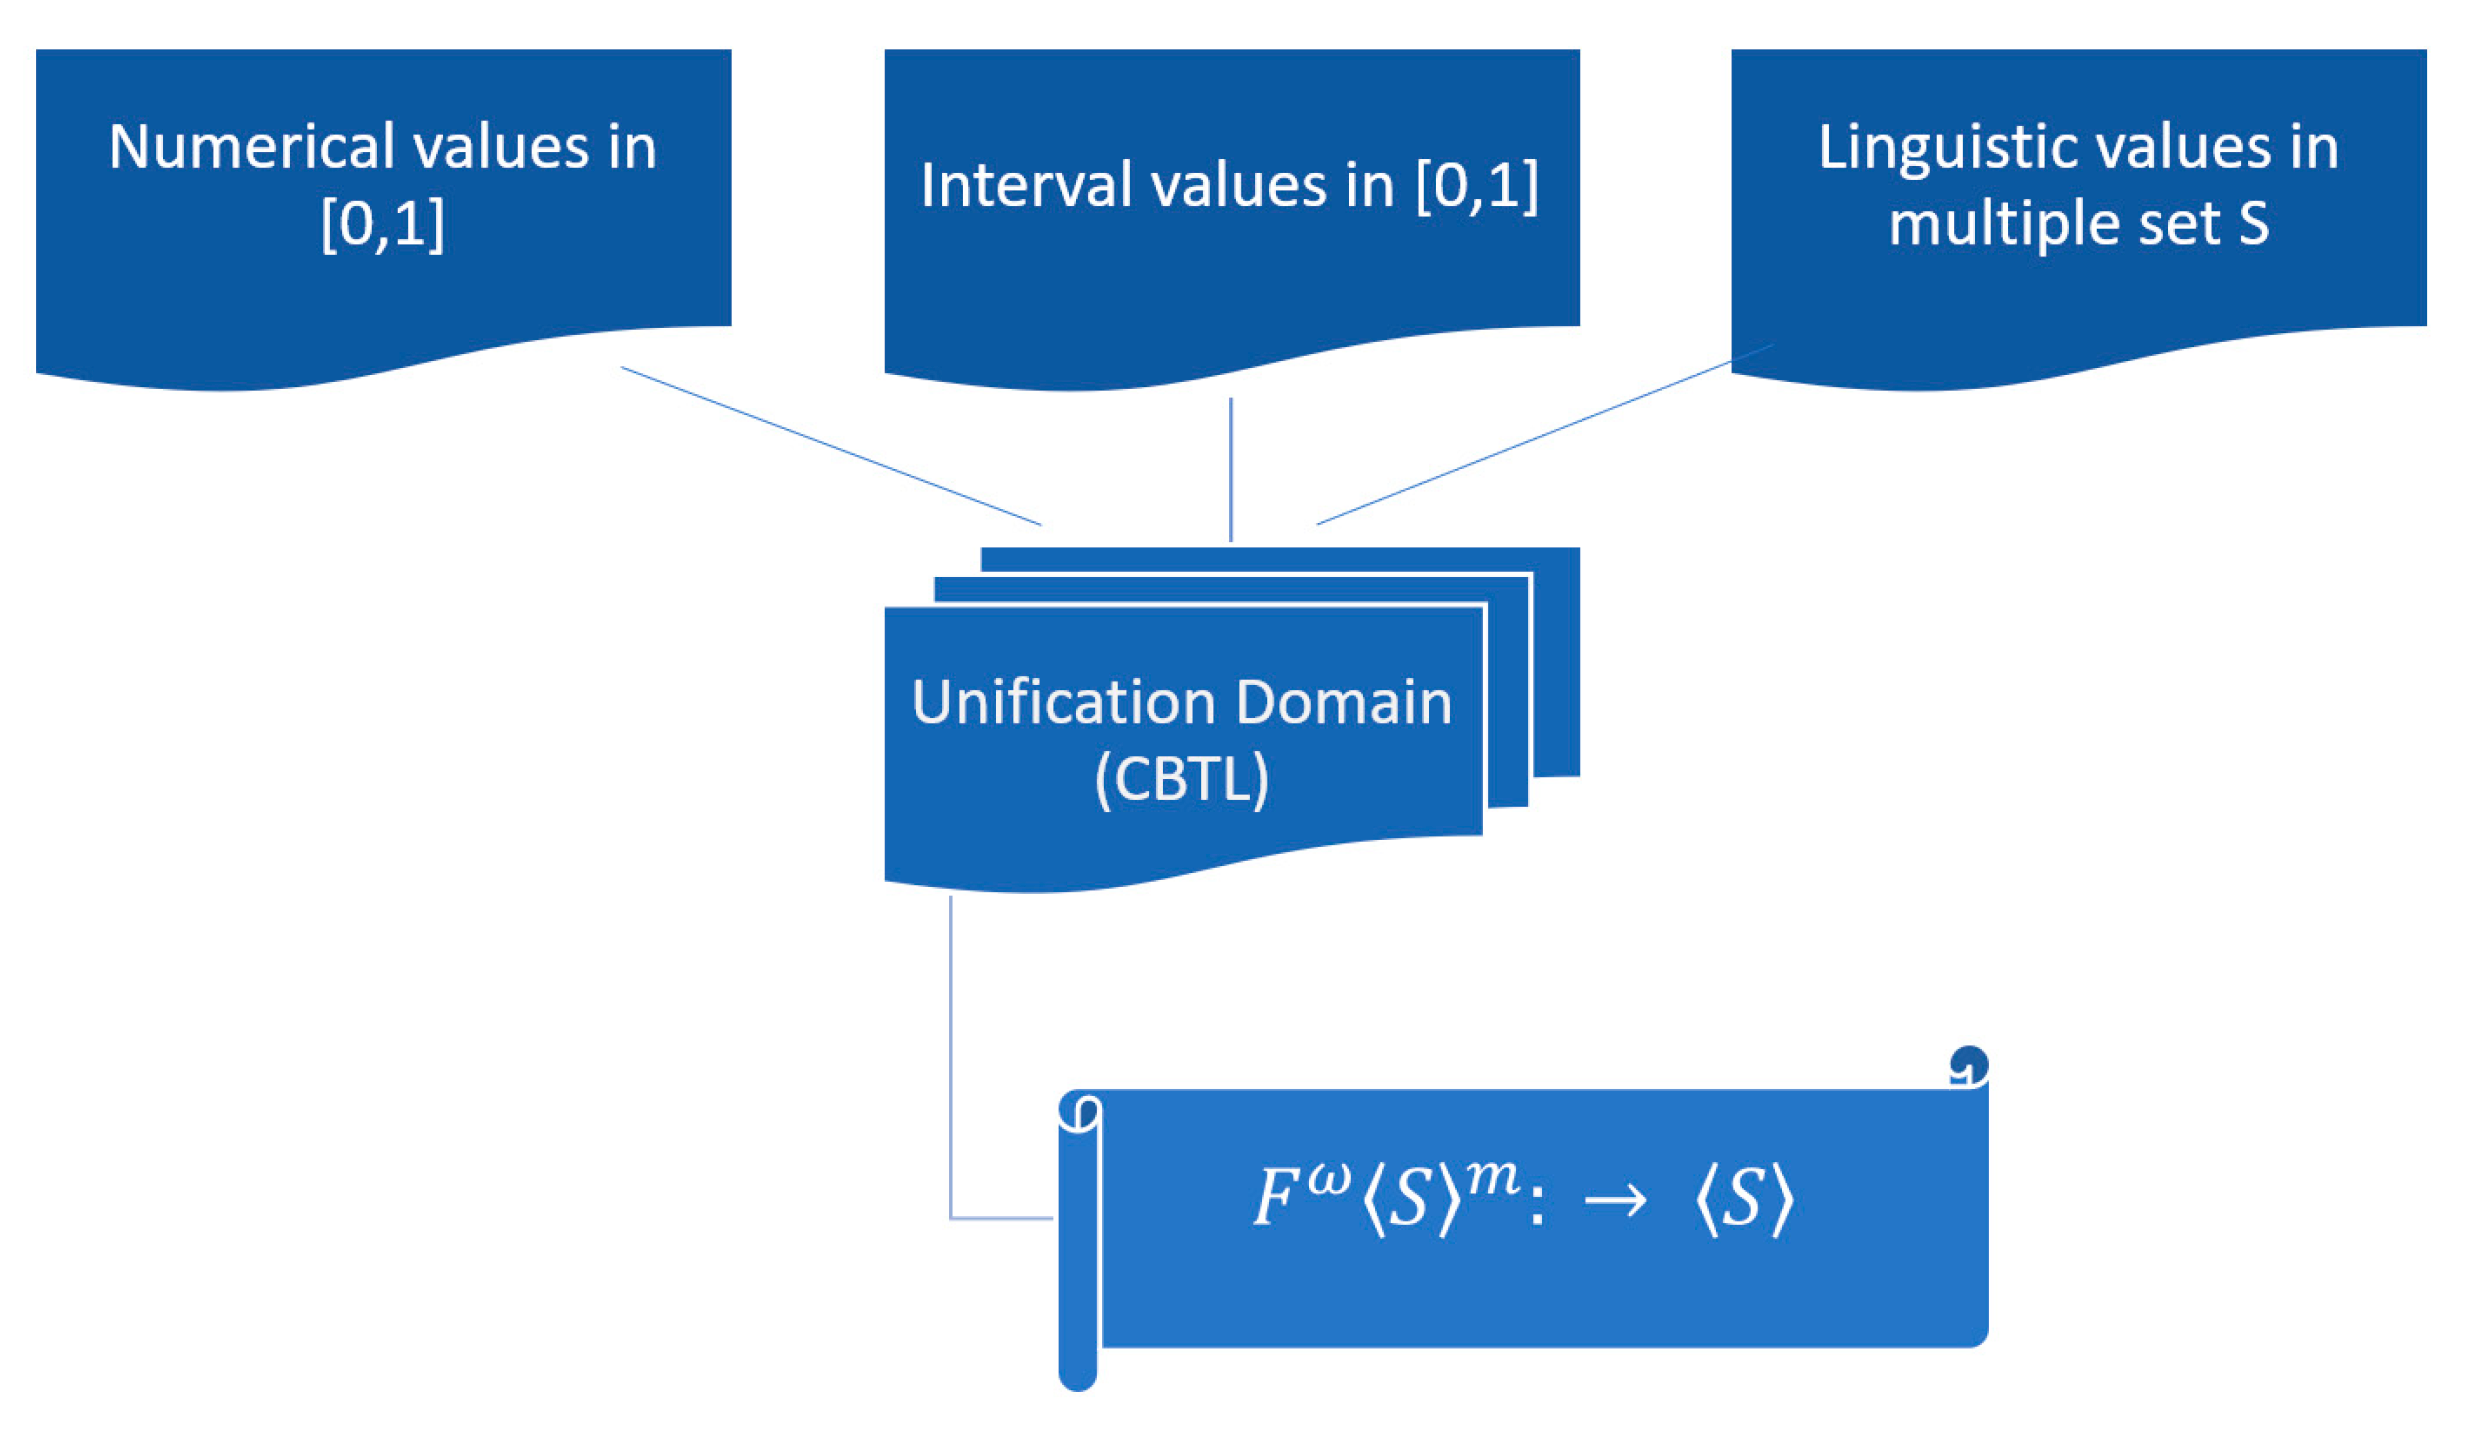
Figure 9.
DMT model.
Figure 10.
Frequency of age.
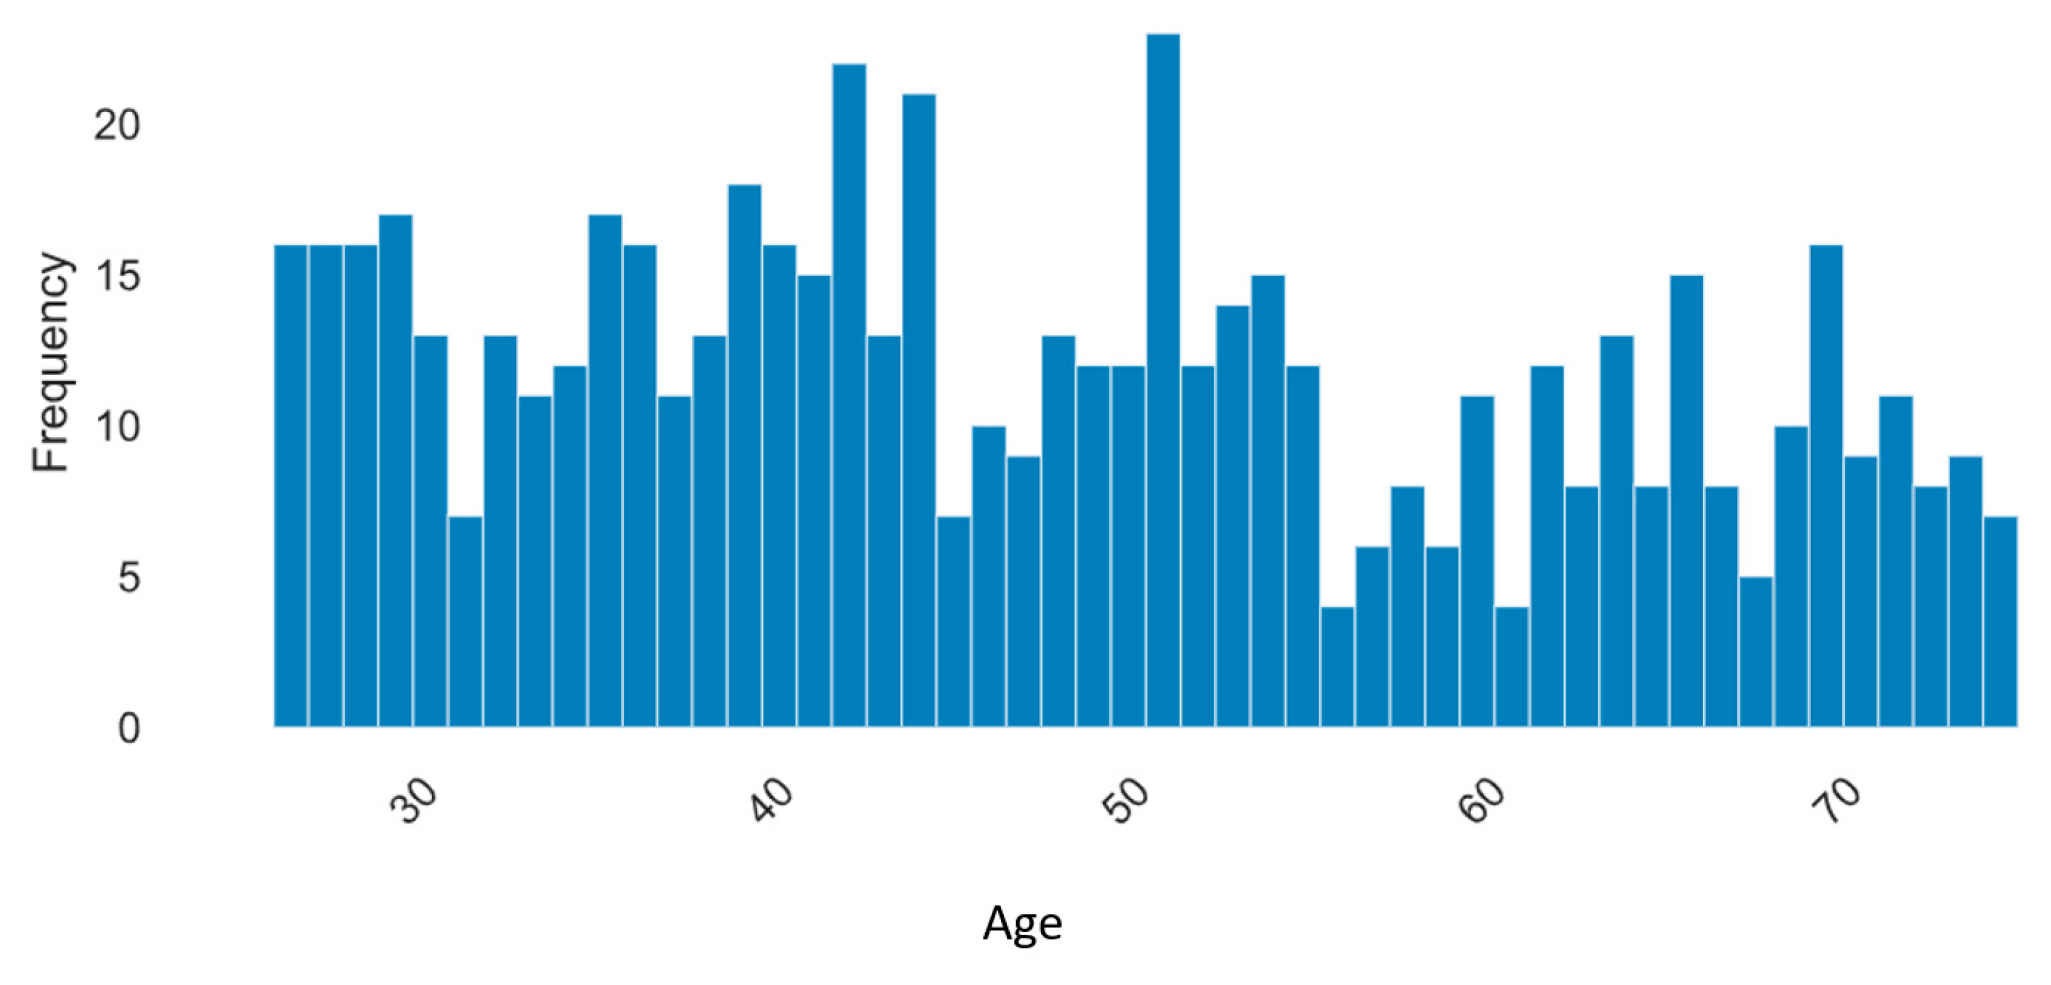
Figure 11.
Histograms for AGE, FMU, MAU, DC, ATT, SMU, PE, PU, PEU.
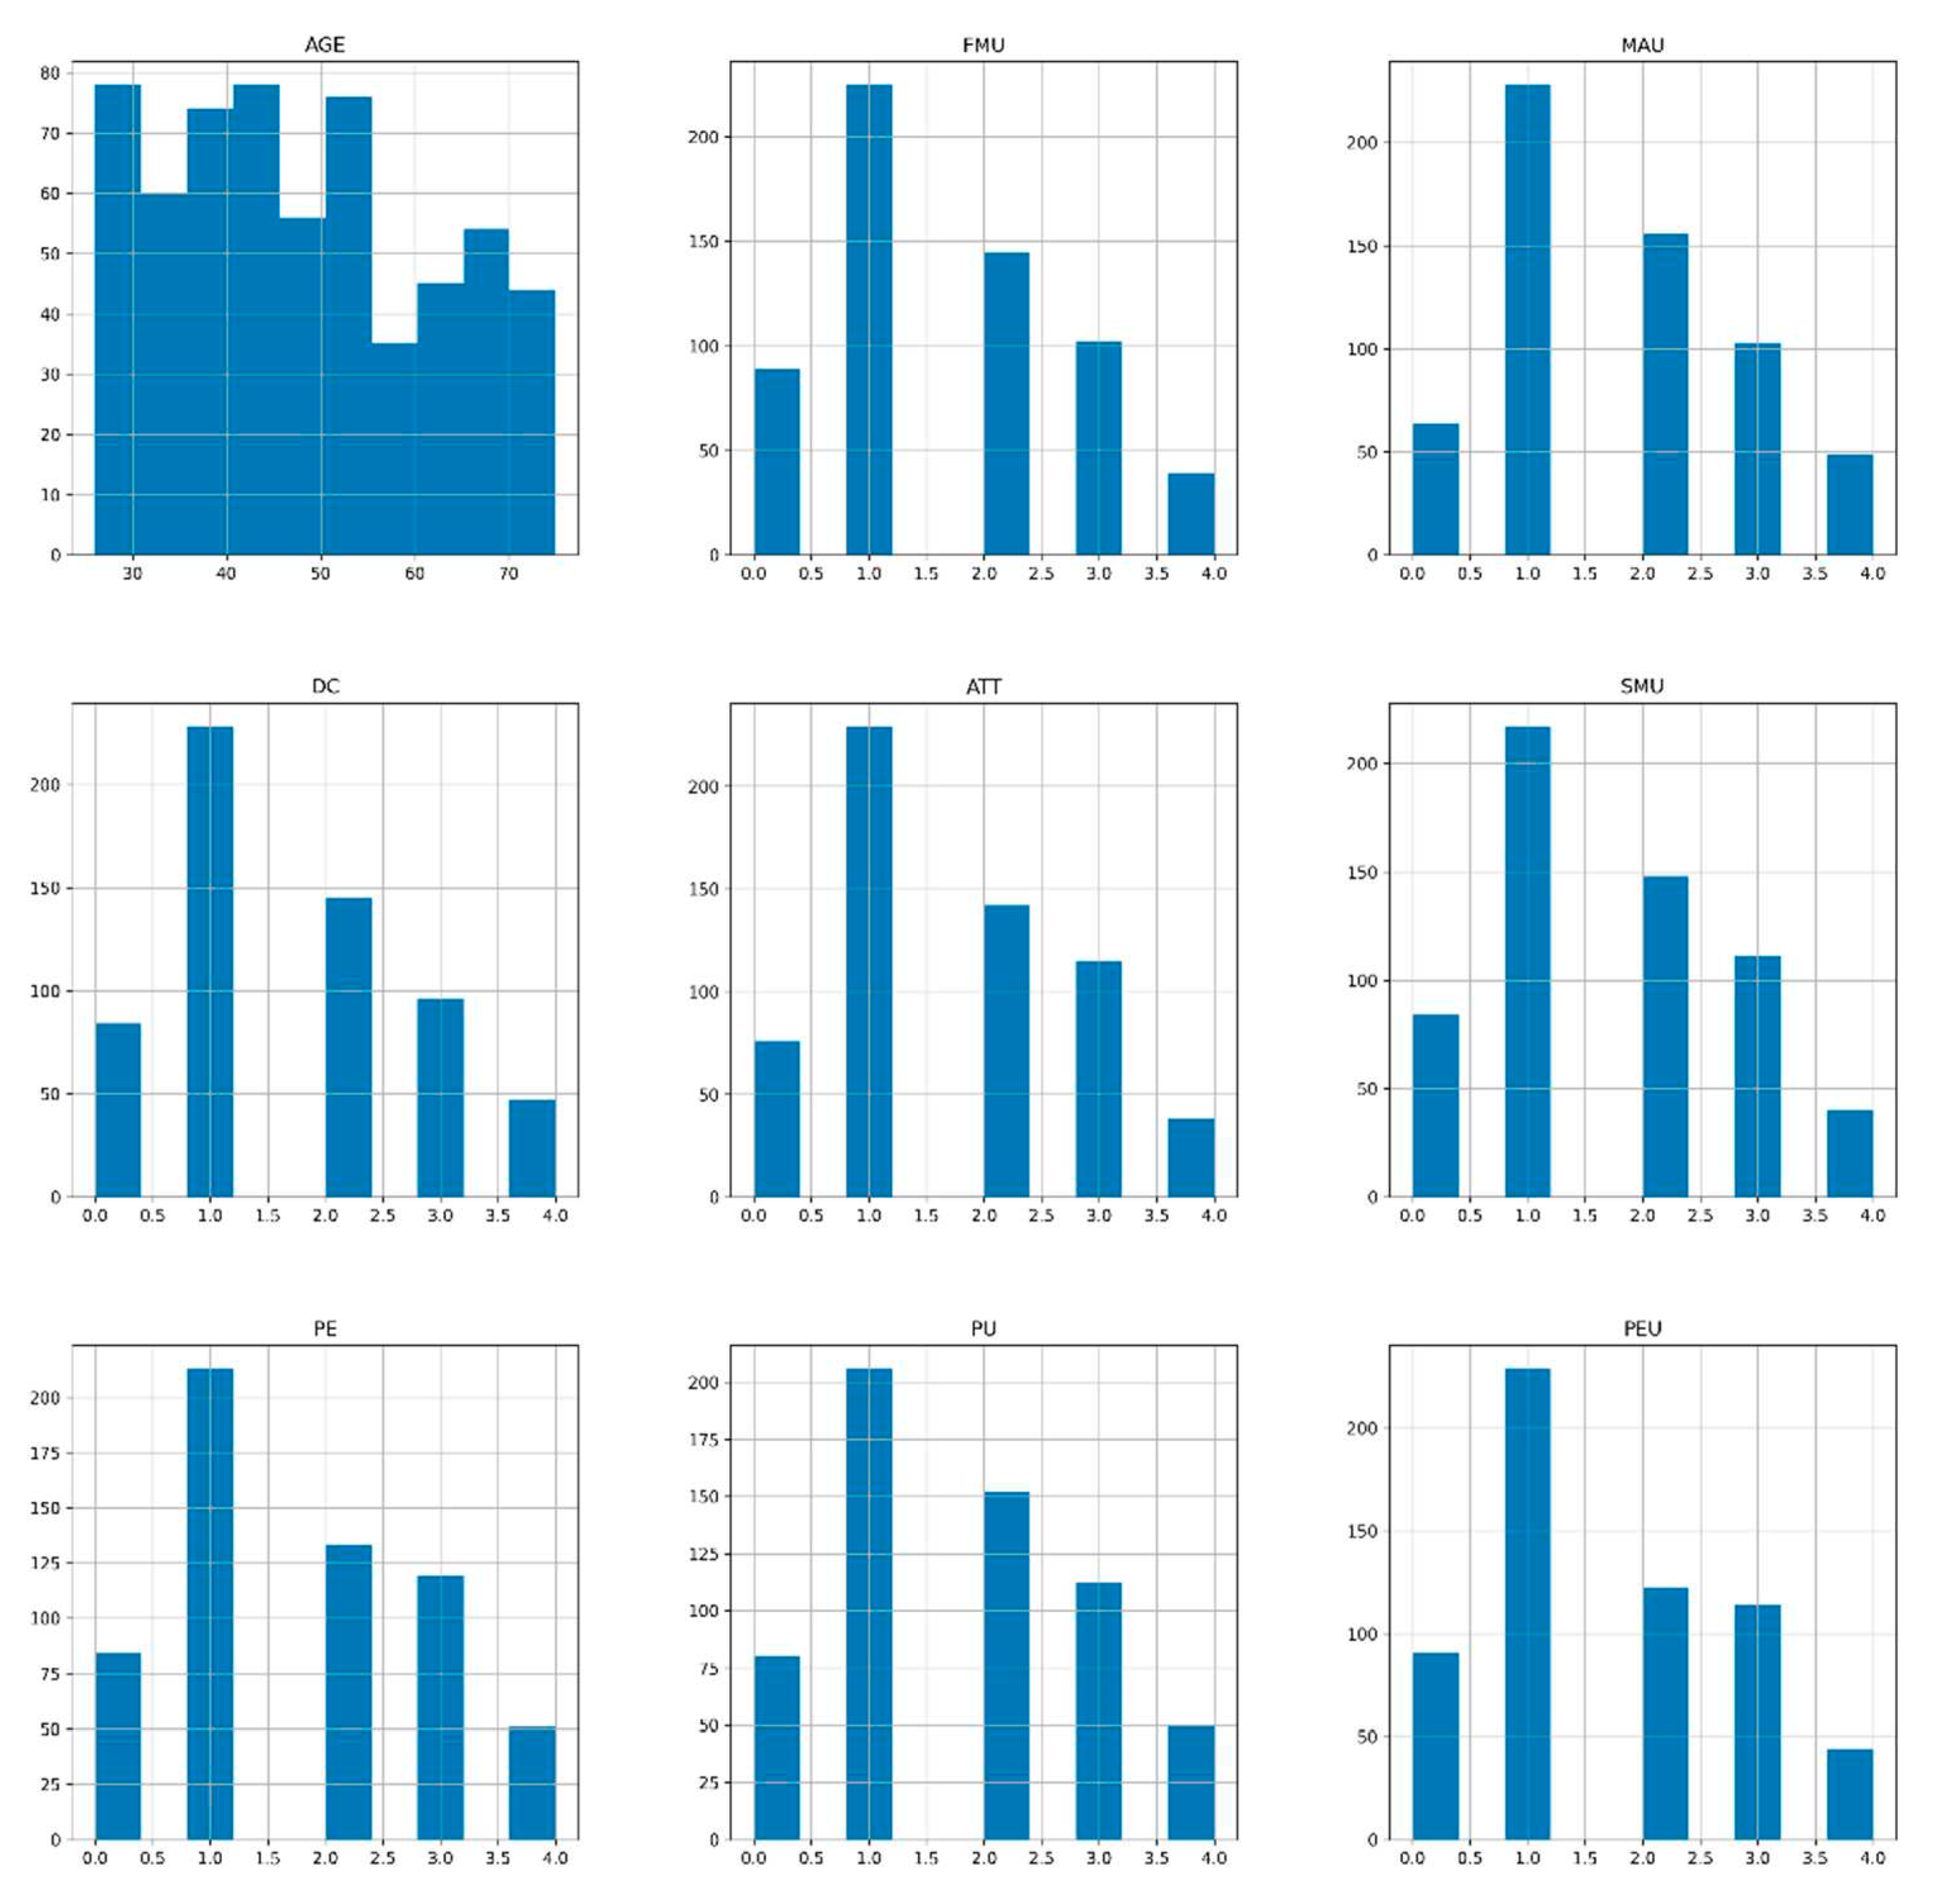
Figure 12.
Bivariate analysis.
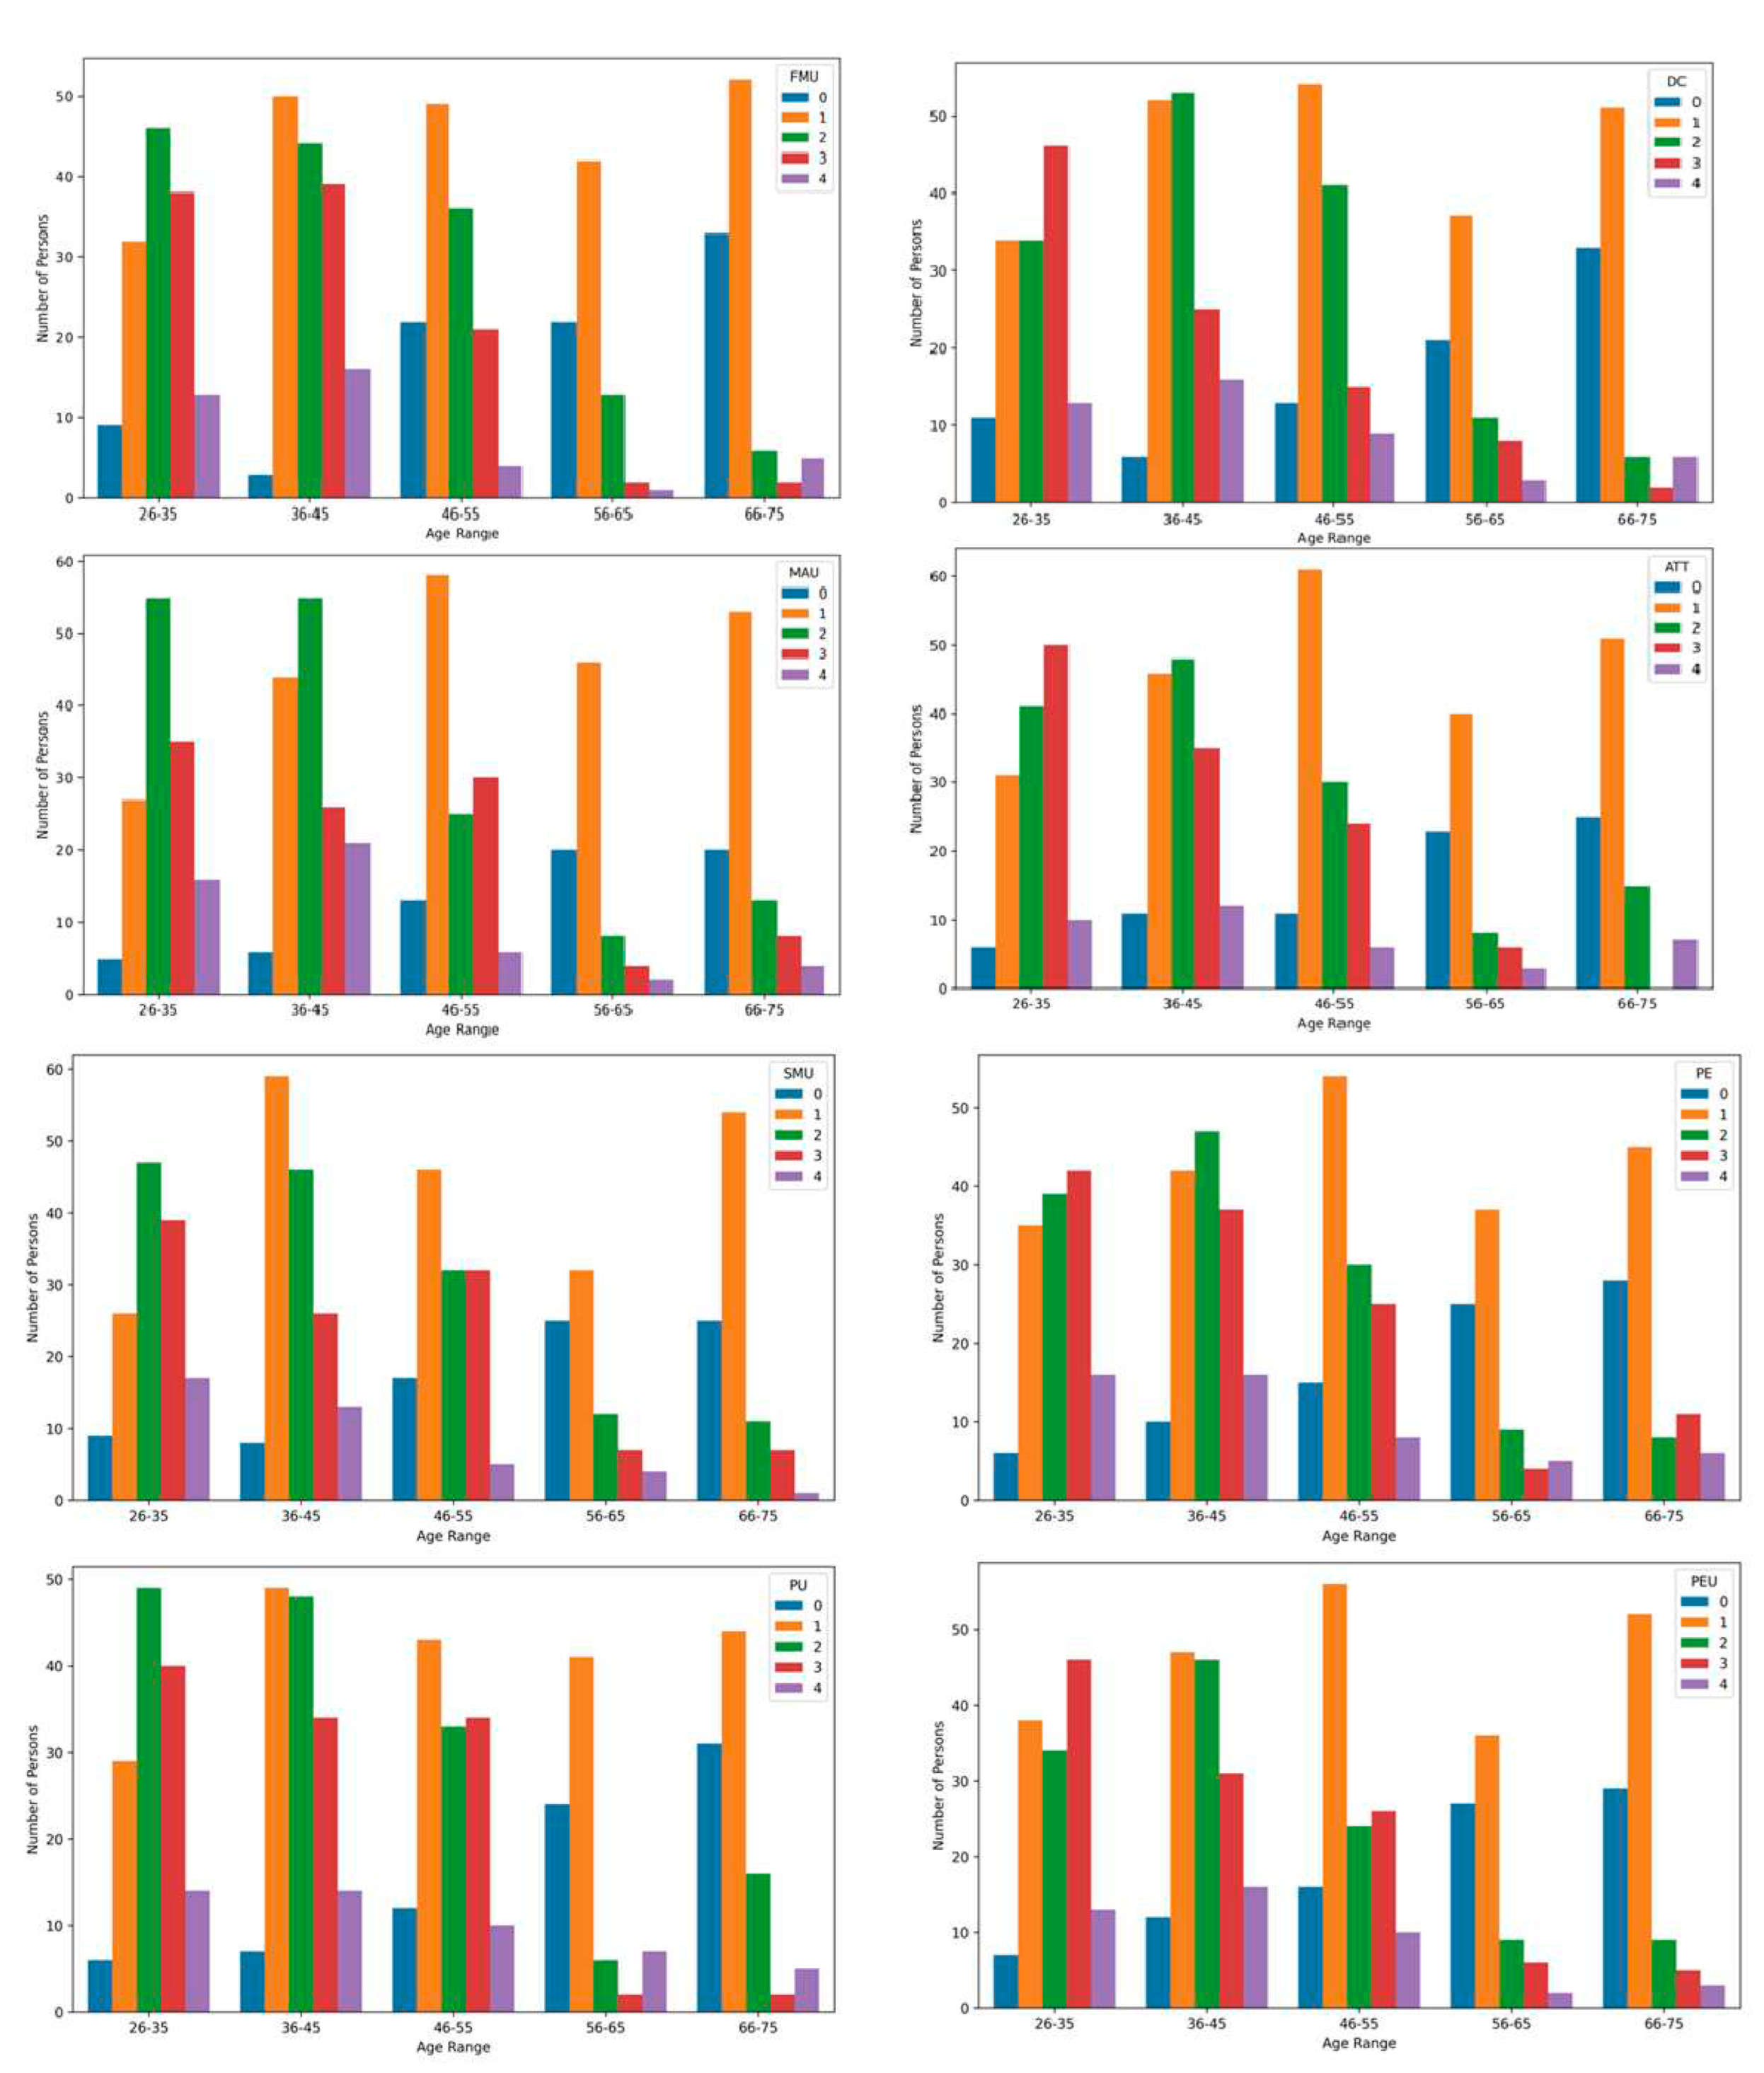
Figure 13.
Correlation matrix.
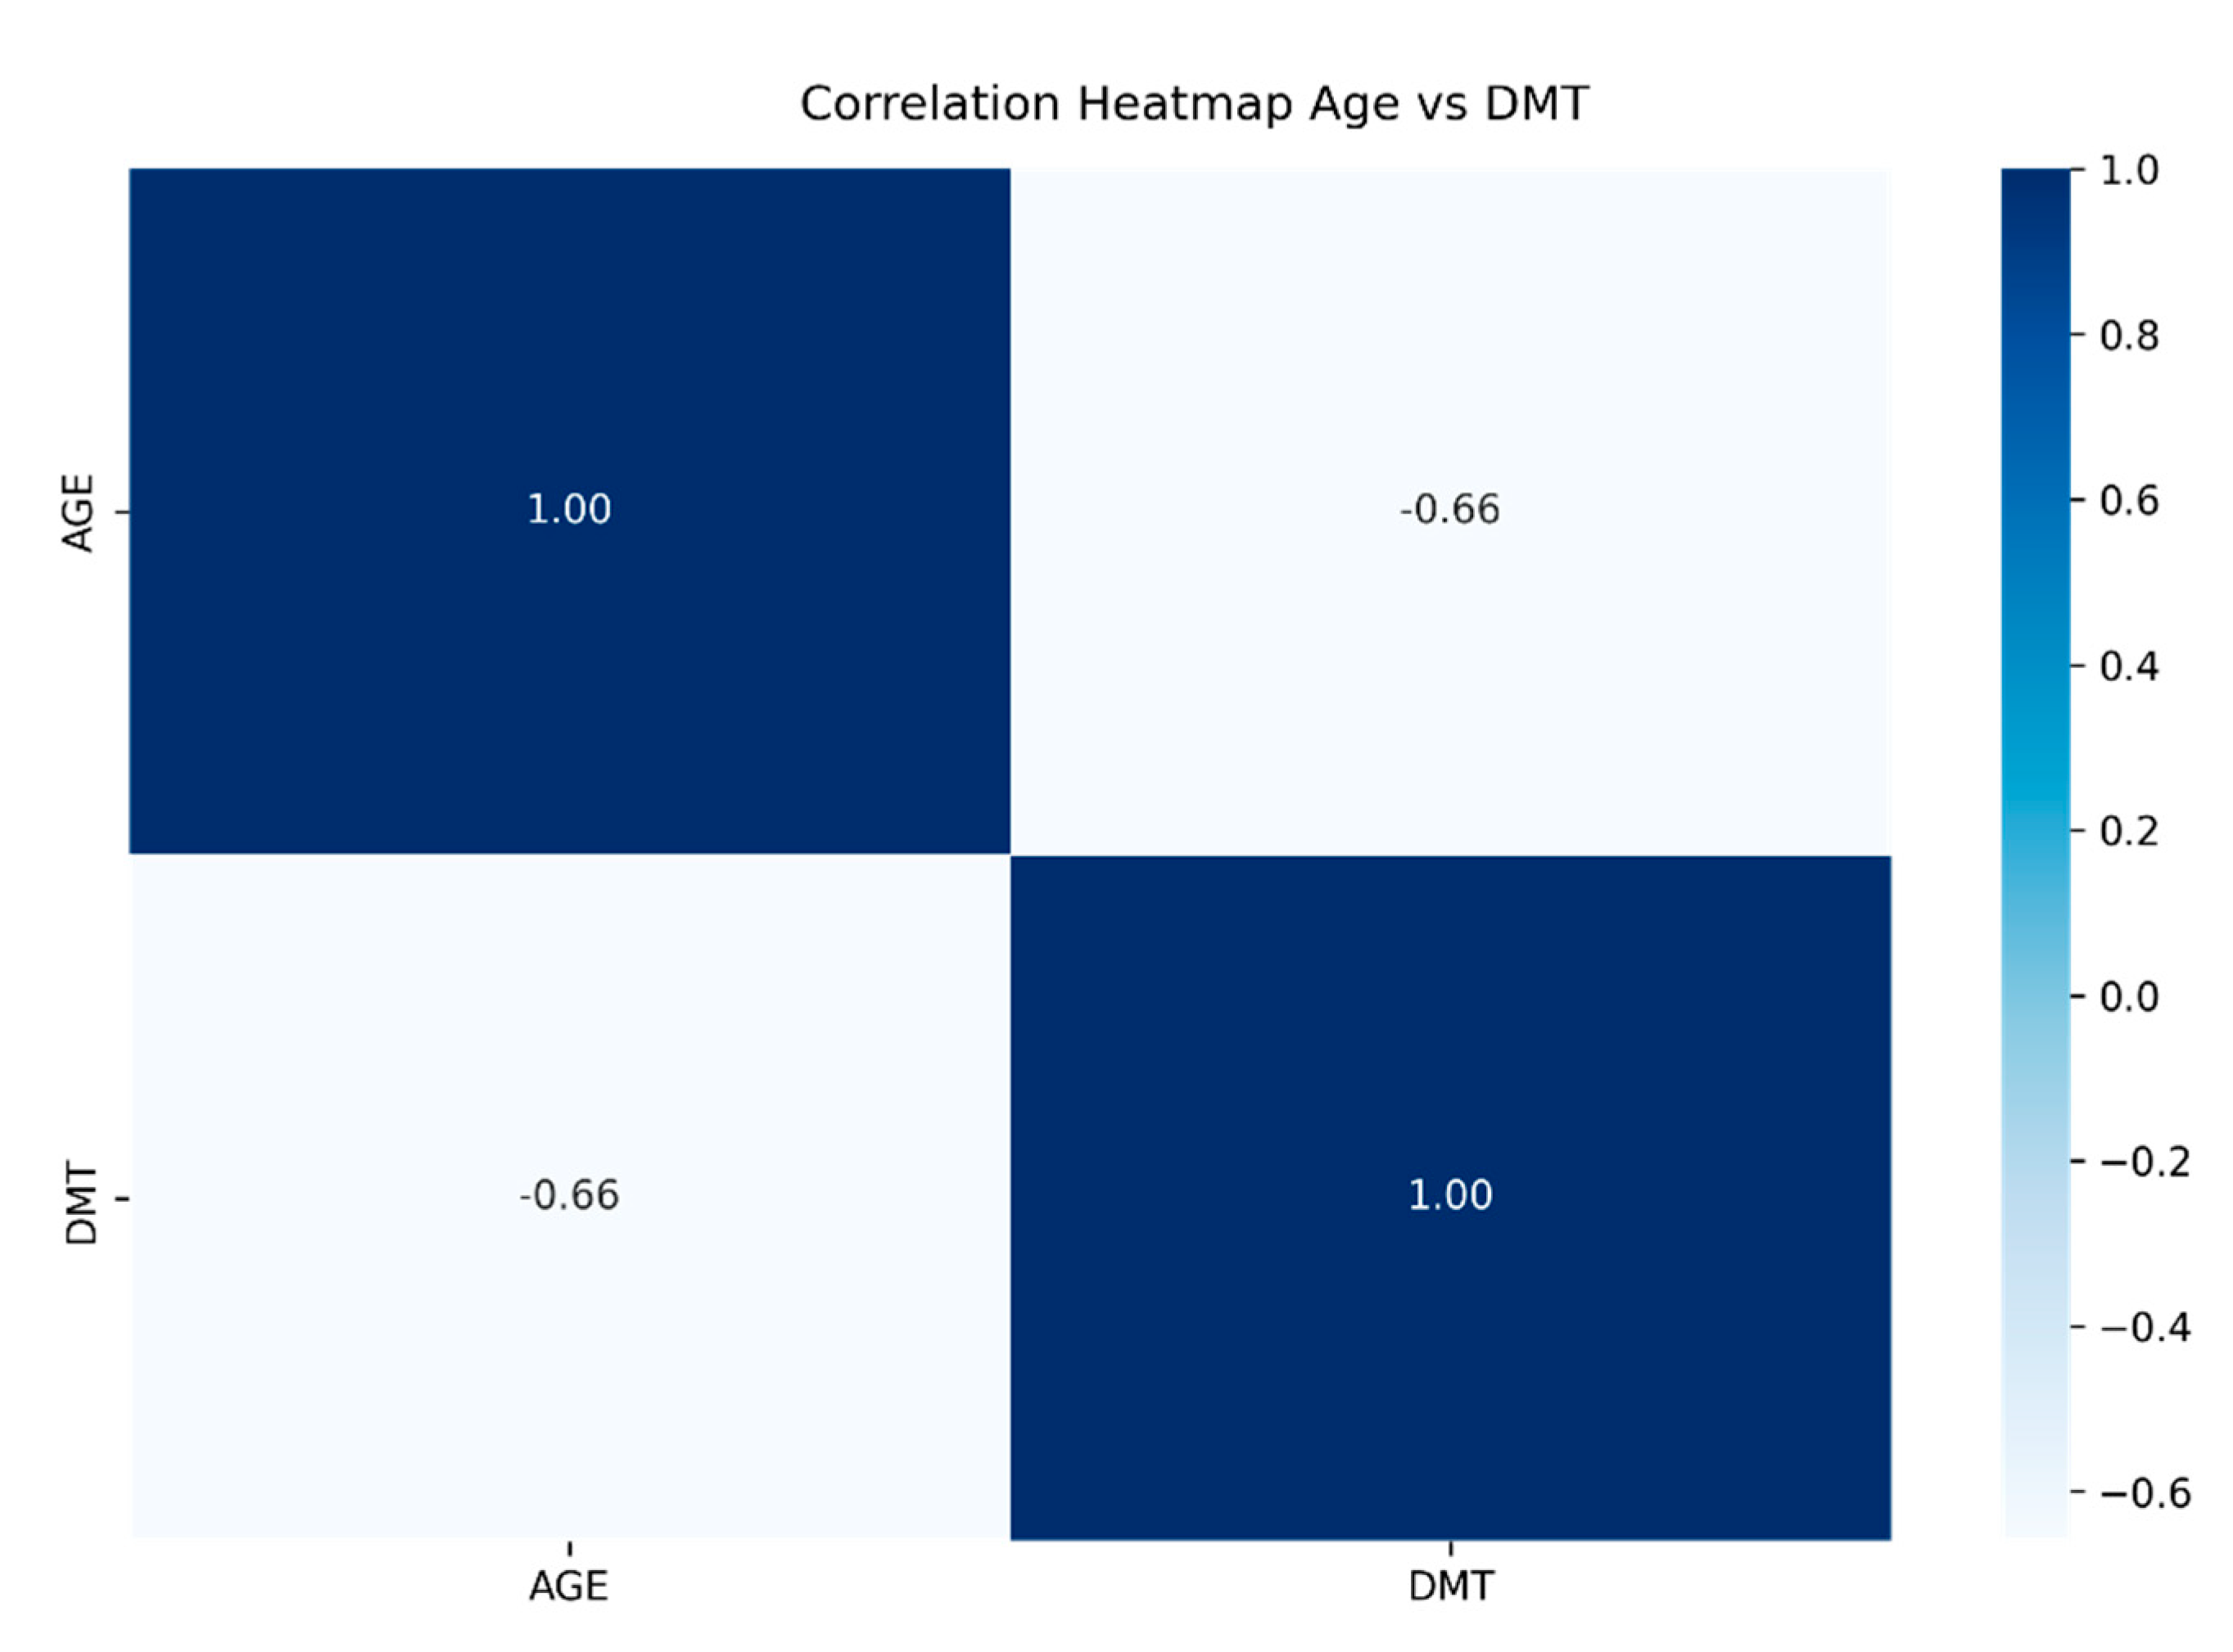
Figure 14.
Cluster Digital Maturity Tourism vs Age.
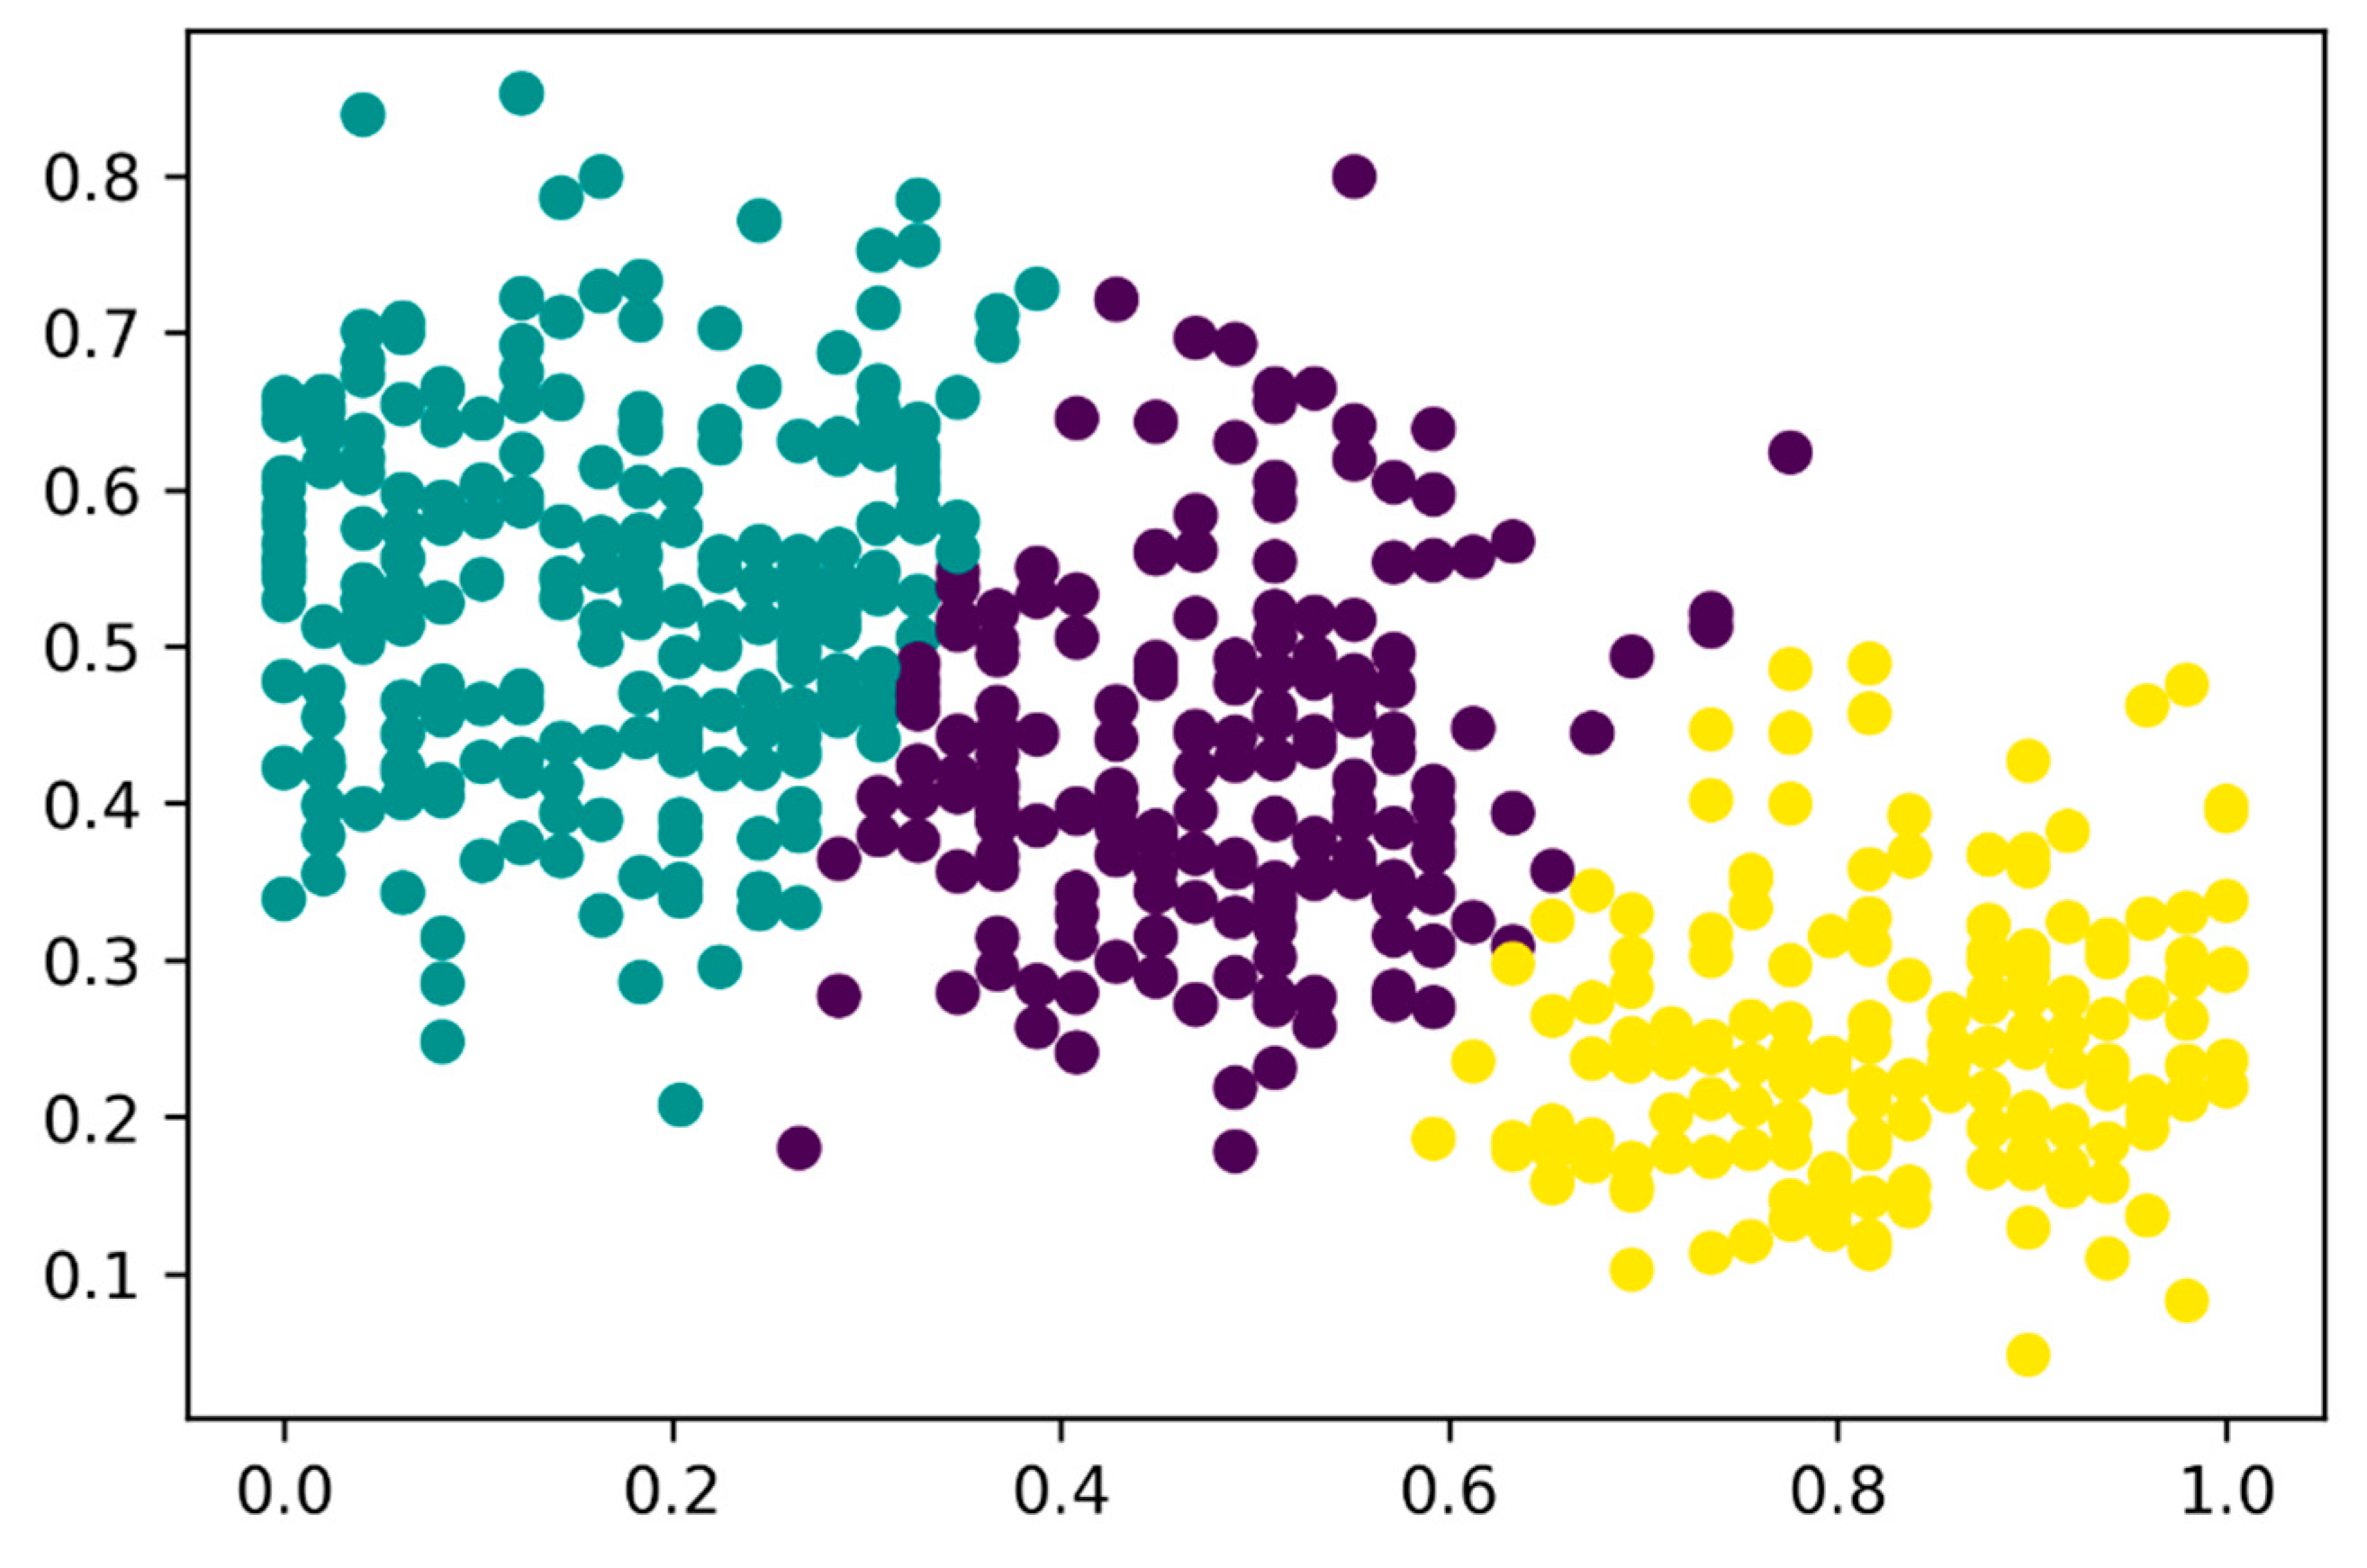
Figure 15.
Cluster Digital Maturity Tourism vs Age.
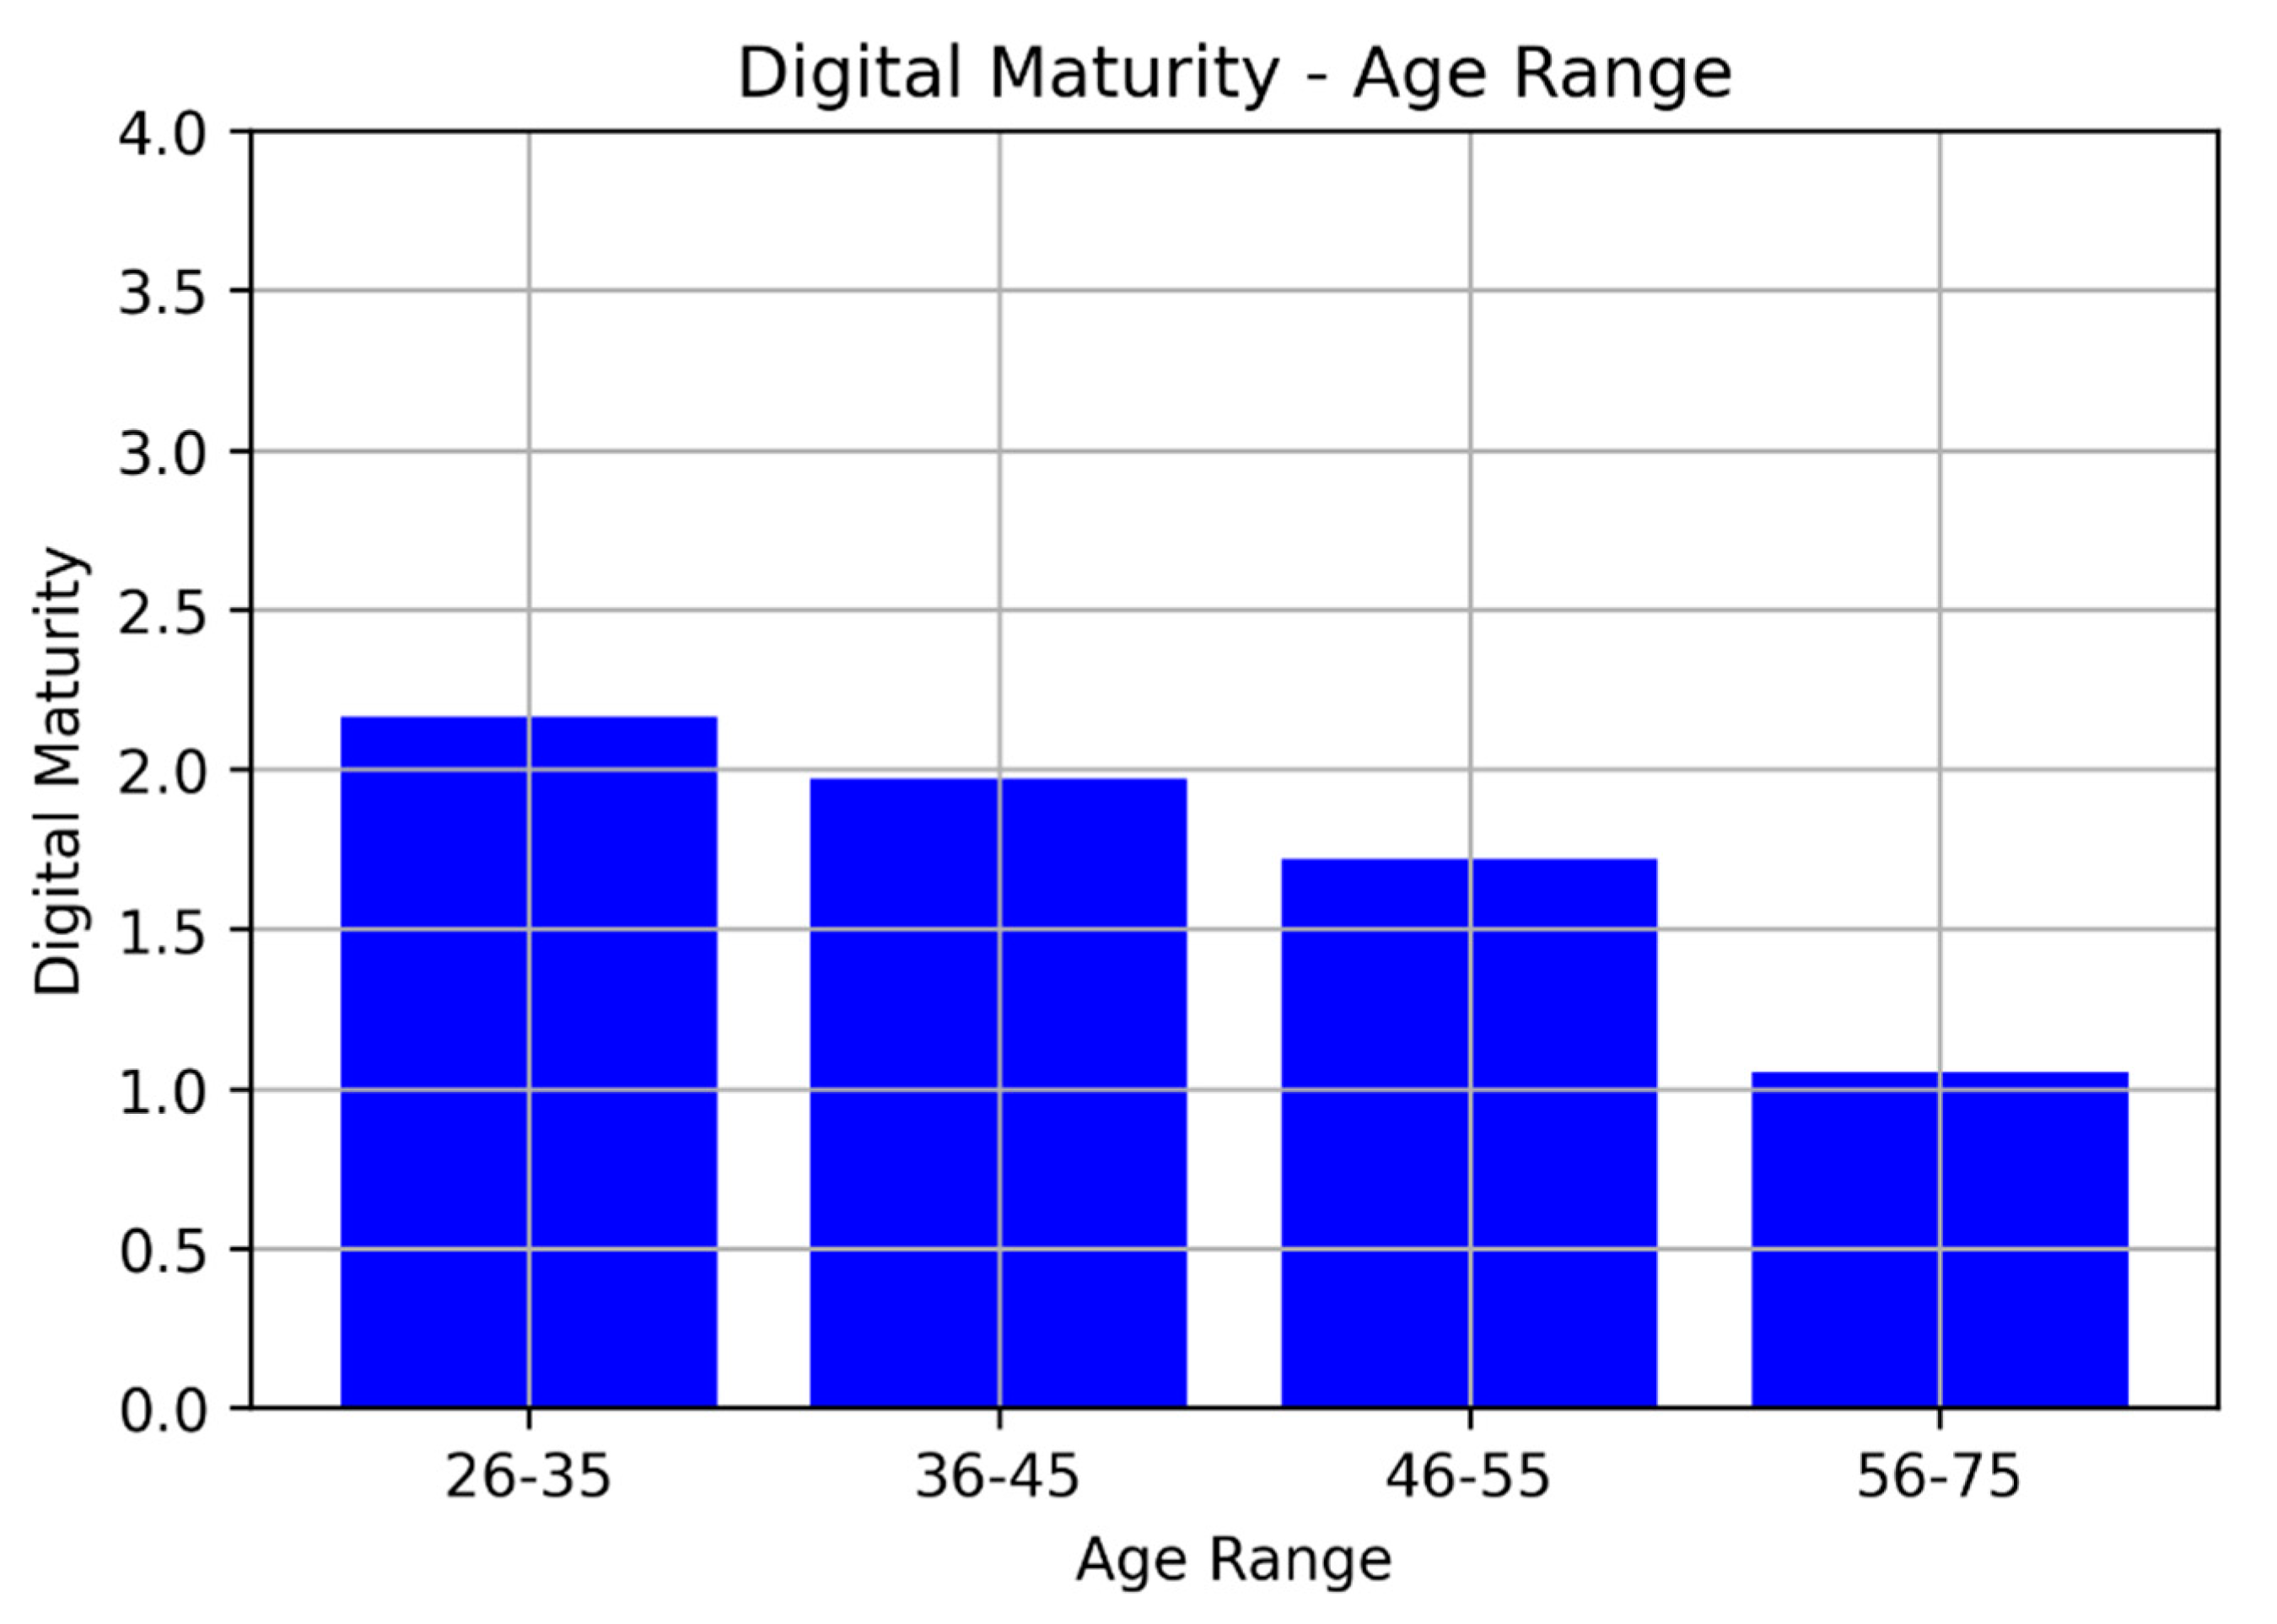

Table 1.
Studies related to the Smart Cities, Smart Tourism and TAM.
| Year | Title |
|---|---|
| 2018 2019 |
Framing a Smart Service with Living Lab Approach: A Case of Introducing Mobile Service within 4G for Smart Tourism in Taiwan [21]. The Augmented Reality in Lisbon Tourism Proposal for a AR Technology Adoption Model [22]. |
| 2020 | The Role of Human-Machine Interactive Devices for Post-COVID-19 Innovative Sustainable Tourism in Ho Chi Minh City, Vietnam [23]. |
| 2022 | Using UTAUT-3 to Understand the Adoption of Mobile Augmented Reality in Tourism (MART) [24]. |
| 2023 | Small-Town Citizens' Technology Acceptance of Smart and Sustainable City Development [25]. |
Table 2.
Saaty scale [49].
Table 2.
Saaty scale [49].
| Degree of Importance |
Definition |
|---|---|
| 1 | Criteria of equal importance |
| 3 | Criteria with a moderate preference over another |
| 5 | Criteria with a substantial or strong preference over another |
| 7 | Criteria with a very strong or demonstrated preference over another |
| 9 | Criteria with an extreme preference over another |
| 2, 4, 6, 8 | Intermediate values used to express the preference of importance between criteria Inverse values |
| Reciprocals |
Table 3.
Random consistency values [49].
Table 3.
Random consistency values [49].
| n | 1 | 2 | 3 | 4 | 5 | 6 | 7 | 8 | 9 | 10 |
|---|---|---|---|---|---|---|---|---|---|---|
|
Random Consistency Index (RI) |
0.00 | 0.00 | 0.58 | 0.9 | 1.12 | 1.24 | 1.32 | 1.41 | 1.45 | 1.49 |
Table 4.
Consistency limits [50].
Table 4.
Consistency limits [50].
| Size of the Consistency Matrix | Consistency Ratio |
|---|---|
| 3 | 5% |
| 4 | 9% |
| ≥5 | 10% |
Table 5.
DMT, matrix in the domain.
| ID | AGE | FMU | MAU | DC | ATT | SMU | PE | PU | PEU |
|---|---|---|---|---|---|---|---|---|---|
| 0011 | 28 | M | M | VH | H | VH | L | VH | H |
| 0092 | 33 | M | H | VH | H | M | VH | VH | M |
| 0143 | 40 | H | M | VH | L | L | L | H | VL |
| 0147 | 42 | H | H | VH | H | VH | M | M | H |
| 0170 | 42 | M | M | M | L | M | M | H | M |
| 0198 | 41 | M | H | H | L | H | VH | H | VH |
| 0292 | 46 | H | L | M | M | VL | H | VL | VL |
| 0327 | 50 | H | L | L | L | VL | L | H | H |
| 0348 | 52 | VL | M | L | L | H | L | M | VH |
| 0439 | 60 | VL | VL | VL | L | L | VL | L | VL |
| 0451 | 62 | VL | L | L | L | VL | VH | L | L |
| 0496 | 64 | L | L | L | L | L | VL | L | L |
| 0513 | 62 | M | VL | L | L | L | VL | M | VL |
| 0529 | 66 | M | VL | L | L | VL | L | VL | VL |
| 0577 | 58 | L | L | L | VL | VL | L | H | VL |
| 0580 | 66 | M | M | L | VL | L | L | L | L |
Table 6.
DMT, overall score.
| ID | AGE | FMU | MAU | DC | ATT | SMU | PE | PU | PEU | DMT |
|---|---|---|---|---|---|---|---|---|---|---|
| 0011 | 28 | M | M | VH | H | VH | L | VH | H | (H,0.089) |
| 0092 | 33 | M | H | VH | H | M | VH | VH | M | (H,0.036) |
| 0143 | 40 | H | M | VH | L | L | L | H | VL | (M,0.011) |
| 0147 | 42 | H | H | VH | H | VH | M | M | H | (H,0.006) |
| 0170 | 42 | M | M | M | L | M | M | H | M | (M,0.032) |
| 0198 | 41 | M | H | H | L | H | VH | H | VH | (H,0.002) |
| 0292 | 46 | H | L | M | M | VL | H | VL | VL | (L,−0.009) |
| 0327 | 50 | H | L | L | L | VL | L | H | H | (M,−0.008) |
| 0348 | 52 | VL | M | L | L | H | L | M | VH | (M,0.019) |
| 0439 | 60 | VL | VL | VL | L | L | VL | L | VL | (VL,0.103) |
| 0451 | 62 | VL | L | L | L | VL | VH | L | L | (L,−0.002) |
| 0496 | 64 | L | L | L | L | L | VL | L | L | (L,−0.009) |
| 0513 | 62 | M | VL | L | L | L | VL | M | VL | (L,−0.009) |
| 0529 | 66 | M | VL | L | L | VL | L | VL | VL | (VL,0.116) |
| 0577 | 58 | L | L | L | VL | VL | L | H | VL | (L,0.015) |
| 0580 | 66 | M | M | L | VL | L | L | L | L | (L,−0.002) |
Table 7.
Cluster k-means algorithm expressed in 2-tuple.
| Cluster c | AGE | DMT | Tourist |
|---|---|---|---|
| 0 | (M,−0.023) | (M, −0.071) | 220 |
| 1 | (L,−0.084) | (M, 0.036) | 212 |
| 2 | (H, 0.078) | (L,−0.002) | 168 |
Table 8.
Recommendation strategy for each cluster.
| Cluster c | Recommendation Strategy |
|---|---|
| 0 | Description: The cluster corresponds to tourists with a moderate level of digital maturity. The age range falls within the middle range (46-55 years), indicating tourists with a positive ability to adapt to technology and, consequently, potential users of technology associated with smart cities. Recommendation: This type of tourist can be guided throughout their visit by utilizing mobile technology as a key component of their digital journey. Primarily, a chatbot can be employed as a fundamental tool to provide recommendations based on the tourist's geographic location and personal preferences, which can be obtained through a prior survey. |
| 1 | Description: The cluster corresponds to tourists with a moderate level of digital maturity. The age range falls within a lower range, specifically 26-45 years old. Similar to the previous cluster, these tourists exhibit a positive ability to adapt to technology and therefore have the potential to be users of technology associated with smart cities. The younger age group implies greater possibilities for interaction and recommendations for guided visits. Recommendation: In this case, similar to the first cluster, mobile technology can be used as a fundamental component in the process of communication and building personalized Customer Journeys. Additionally, in this case, activities can be recommended through the use of chatbots, offering digital challenges to enhance the tourist's digital journey. Furthermore, it is possible to facilitate group interactions with other individuals who are interested, creating personalized and focused digital experiences centered around the achievement of challenges and interactions with similar profiles. The use of mobile technology and geolocation enables real-time individual and group recommendations. |
| 2 | Description: This final cluster corresponds to individuals aged 56 and older with a low level of digital literacy. Recommendation: For this segment, it is recommended to prioritize personalization through human interaction, leveraging factors such as geolocation and planning activities based on individual preferences. Additionally, organizing group activities with others in the same cluster who share similar interests and preferences is suggested. |
Disclaimer/Publisher’s Note: The statements, opinions and data contained in all publications are solely those of the individual author(s) and contributor(s) and not of MDPI and/or the editor(s). MDPI and/or the editor(s) disclaim responsibility for any injury to people or property resulting from any ideas, methods, instructions or products referred to in the content. |
© 2023 by the authors. Licensee MDPI, Basel, Switzerland. This article is an open access article distributed under the terms and conditions of the Creative Commons Attribution (CC BY) license (http://creativecommons.org/licenses/by/4.0/).
Copyright: This open access article is published under a Creative Commons CC BY 4.0 license, which permit the free download, distribution, and reuse, provided that the author and preprint are cited in any reuse.


