
Submitted:
18 July 2023
Posted:
19 July 2023
You are already at the latest version
Abstract
Our comprehension of fundamental cosmological principles hinges on a thorough understanding of the early universe. The Lambda Cold Dark Matter (ΛCDM) model has emerged as a valuable framework for elucidating various cosmic phenomena, uniting a cosmological constant (Λ) with cold dark matter (CDM). Nevertheless, recent observations, particularly data from the Planck, WMAP, and DES missions that probe the early universe, alongside local measurements of the Hubble constant, have unveiled significant inconsistencies. These inconsistencies have magnified the perplexing issue known as the Hubble Tension, thereby challenging our current understanding of the universe. To address this conundrum, we adopt a comprehensive approach encompassing a review of cosmological fundamentals, an exploration of the ΛCDM model, an examination of the cosmic microwave background (CMB), power spectrum, and perturbation theory, a thorough review of existing research, and finally, an investigation of real data. By undertaking these early universe processes, we aim to understand more about Hubble constant and its consequence in ΛCDM model.
Keywords:
Early Universe
; Cosmic Microwave Background
; Power Spectrum
; Anisotropy
; Scalar Fileds
; Data Analysis
1. Introduction
To effectively address the Hubble Tension problem, it is crucial to grasp some fundamental concepts in cosmology. By establishing a solid foundation of knowledge, we can gain a deeper understanding of the issue and devise more effective solutions. We will begin by exploring the fundamental equations utilized in cosmology, which will serve as the basis for our analysis. Next, we will delve into the CDM model, examining its components and implications.
In order to broaden our understanding, we will explore the Cosmic Microwave Background (CMB) and its significance. Within this context, we will discuss the Power Spectrum, which provides valuable insights into the distribution of cosmic structures. Furthermore, we will delve into perturbation theory, exploring the various perturbations and their evaluation in our universe. By comprehensively examining these concepts, we can better comprehend the complexities of our cosmological environment.
Having gained a firm grasp of these essential cosmological tools, we will proceed to review the different methods and techniques employed by various research groups to address the Hubble Tension. Through an extensive literature review, we will analyze the diverse approaches taken to tackle this issue.
Subsequently, we will utilize available data to compare the results with the predictions of the CDM model. By scrutinizing the disparities between the real data and the model’s projections, we can identify potential discrepancies. Our aim will be to provide a plausible physical explanation for the observed differences, contributing to the ongoing efforts in resolving the Hubble Tension.
The Evaluation of the universe is governed by the Friedmann equations describes the dynamics of the homogeneous and isotropic universe’s expansion rate (Hubble parameter), the energy content, and the curvature of space. They are derived within the framework of general relativity The two Friedmann equations are given below.
Here, (a) is the scale factor, (k) is curvature, (c) is the speed of light, (G) is the gravitational constant, () is energy density, () is the cosmological constant, (p) is pressure.
Einstein Field Equations or (Einstein Equation): It describes the relationship between the curvature of spacetime (Left-hand side of the equation) and the distribution of matter and energy (Right-hand side of the equation).
Here () is the Einstein tensor, () is the Metric tensor, () is the stress-energy tensor and () is einstein gravitational constant.
Boltzmann Equations: These are the set of equations that governs the evolution of perturbations in the universe. The Boltzmann equation is given by
Here the right-hand side contains all the collision terms. (f) represents the distribution function of the particle.
It is important to note that different particle species, such as photons, baryons (protons and neutrons), dark matter particles, and neutrinos, exhibit different types of interactions. As a result, the Boltzmann equation can have different forms for different particle species. This reflects the distinct physics and interaction rates associated with each particle species.
Figure 1 illustrates the various interactions between different particle species and the metric. Electrons and protons interact through Coulombic forces, commonly referred to as Coulombic scattering. On the other hand, electrons and photons interact through Compton scattering.
1.1. CDM Model
The Lambda Cold Dark Matter CDM model, describes the universe’s composition and evaluation. It is based on the Big Bang theory and puts forward that the universe is dominated by dark matter and dark energy. The CDM model incorporates the following set of parameters:
-
Hubble Constant(h): It represents the universe’s current pace of expansion. Its value is estimated to be around 0.68. It can be represented mathematically asrepresents the Hubble Constant.
-
Baryon Density (): It expresses the density of baryonic matter in the universe as a whole. It is the ratio of a baryon’s density to the universe’s critical density. critical density (), is the density necessary for the universe to remain flat, and its value is determined by the gravitational constant (G) and the Hubble constant (). It is written as follows:Now, is given by:is a proportion of the total energy provided by baryonic matter. We usually useIt is a unitless quantity as it is a density ratio.
-
Dark Matter Density (): It describes the density of cold dark matter in the universe. It is the ratio of a CDM’s density to the universe’s critical density. Now, is provided by:It depicts a fraction of the overall energy provided by dark matter (only exhibits interaction with the gravitational field). We usually useThe density of dark matter is also 5 times the density of baryons .
-
Spectral index of primordial density fluctuation (): It characterizes the early irregularities in matter distribution and states the features of the CMB and the emergence of large-scale structures. It describes ’how density fluctuations vary with scale’. A scalar index of ’1’ implies that the variance is the same in all directions. It can be expressed mathematically asIn this case, the power spectrum depicts the amplitude of density variations as a function of wave-number (k). We usually use
-
Scalar amplitude of primordial density fluctuation (): It indicates the magnitude of the oscillations in primordial density. It is commonly used to keep track of temperature fluctuations in the CMB. It is mathematically stated asThe equation determines the value of the power spectrum at a certain pivot scale, which is generally indicated as . Typically, we apply
- Optical depth due to the epoch of re-ionization (: It is a unitless number that measures the free electron opacity of the CMB radiation in the line of sight. A greater value of () indicates a higher potential for CMB photon scattering or absorption by free electrons. Typically, we use
The parameters listed above are determined through careful examination of numerous observations, including CMB radiation, large-scale structure formation, and other cosmological data. It is critical to recognize that the actual values of these parameters may change depending on the dataset used and the analysis methodology employed.
1.2. Cosmic Microwave Background (CMB)
The Cosmic Microwave Background (CMB) is a radiant glow that originated approximately 300,000 years after the Big Bang, during the epoch known as recombination1 This crucial event marked the transition of the universe from an early state characterized by ionized, dense, relativistic, and opaque conditions to a later state characterized by lower density, non-relativistic, and transparent conditions.
Since recombination, the temperature of the CMB has gradually decreased from around 3000 K to its current value of approximately 2.75 K. Remarkably, the CMB spectrum perfectly matches that of a blackbody radiation at a temperature of 2.73 K, as confirmed by the COBE/FIRAS experiment in 1990. The Figure 2 provides a visual representation that summarizes essential information about the Cosmic Microwave Background (CMB). Additionally, Figure 6 presents a CMB radiation map generated using the ’CLASS’ software with inputs based on the CDM model. It is important to note that while the CMB is a 2D representation, it represents information about the 3D space of the early universe. As depicted in Figure 6, the CMB exhibits anisotropies, which are variations or irregularities. These anisotropies arise from diverse perturbations that occurred during the early stages of the universe’s evolution. Studying these anisotropies is crucial as they contain valuable insights into the early period of the universe’s development. Below, we list some of the key aspects that can be derived from analyzing these anisotropies:
- Baryon-to-photon ratio (): This ratio represents the number density of baryons (subatomic particles like protons and neutrons) relative to the number density of photons. By accurately determining this ratio, we can derive important properties of the photon-baryon fluid, such as the sound speed and inertia. These properties play a significant role in understanding the behavior of the early universe.
- Matter-to-radiation ratio (): This ratio signifies the ratio of the matter density () to the density of radiation (). By determining this ratio, we can gain insights into the abundance of various components in the universe, including dark matter, neutrinos, and other relativistic particles.
- Power Spectrum: The power spectrum is a valuable tool for studying the anisotropies present in the CMB. It provides a detailed analysis of the fluctuations in the CMB temperature across different angular scales ℓ. By examining the power spectrum, researchers can extract information about the underlying structures and perturbations in the early universe. For a more comprehensive discussion on the power spectrum, please refer to Section 1.2.1.
1.2.1. Power Spectrum:
The power spectrum plays a significant role in cosmology, serving as a fundamental tool for investigating the distribution of different constituents in the universe, including baryonic matter, dark matter, and dark energy. By analyzing the power spectrum, we gain valuable insights into the fluctuations of these components, the growth of cosmic structures, and the determination of cosmological parameters. It allows us to unravel the properties and characteristics of the early universe, shedding light on its formation and evolution. One of the key aspects of the power spectrum lies in its ability to quantify the amplitude of density fluctuations across a range of scales. By examining the power spectrum, cosmologists can measure the strength of these fluctuations at different sizes, providing a comprehensive understanding of the clustering or dispersion of matter throughout the cosmos. By studying the power spectrum, we deepen our understanding of the early universe and its properties, unraveling the mysteries of its formation and evolution. Let us now discuss certain components of the Power spectrum:
-
Acoustic Peaks:The cosmic microwave background (CMB) power spectrum exhibits a distinct and characteristic series of peaks and troughs, commonly referred to as acoustic peaks. These peaks arise due to the oscillations present in the photon-baryon fluid (BAO) 2 during the early stages of the universe. These oscillations are a consequence of the delicate balance between the gravitational pull and the pressure forces at play. The interplay of gravity and pressure causes the photon-baryon fluid to undergo rhythmic compression and rarefaction, akin to sound waves propagating through a medium. These acoustic oscillations leave an imprint on the CMB radiation, resulting in the observed pattern of peaks in the power spectrum.Each peak in the power spectrum corresponds to a specific angular scale, reflecting the size of the sound horizon at the time of photon decoupling, marking the moment when photons and baryons became free to propagate independently.The positions and heights of these peaks carry valuable information about the geometry (curvature) of the universe and the density fluctuations present during the era of photon decoupling. By analyzing the properties of the acoustic peaks, cosmologists can glean insights into the curvature of spacetime, the matter and energy content of the universe, and the primordial fluctuations that ultimately gave rise to the large-scale structures we observe today.
-
First Peak:As mentioned earlier, different peaks in the power spectrum of the cosmic microwave background (CMB) convey distinct characteristics and provide valuable insights into the universe.The first peak also referred to as the fundamental or Doppler peak, holds particular significance. It corresponds to the largest angular scale and exhibits the highest amplitude among the peaks. This peak’s position is primarily determined by the density of baryonic matter or ordinary matter in the universe, offering a reference scale for measuring the angular size of the universe.Moreover, the first peak provides insights into the curvature of spacetime. Its location and shape yield valuable clues about the geometry of the universe. By studying the first peak, scientists can discern whether the universe is flat, positively curved (closed), or negatively curved (open), illuminating the overall shape of our universe.
-
Subsequent/ Higher moment Peaks:After the first peak, a series of smaller peaks follow up in the power spectrum. These peaks are the result of higher frequency oscillations of the photon-baryonic fluid and are associated with the harmonics of the fundamental mode.Second Peak: It indicates a substantial amount of baryons (baryon density), which is consistent with inferences drawn from nucleosynthesis3.Third Peak: It reflects the physical density of the dark matter in the cosmos.
-
Damping Tail:In addition to the prominent higher frequency peaks, the Cosmic Microwave Background (CMB) Power spectrum displays a distinctive feature called the damping tail, characterized by a gradual decrease in amplitude. This damping tail phenomenon emerges as a result of the diffusion of photons caused by two key factors: the free-streaming motion of electrons and the finite thickness of the photon-baryonic fluid4.The damping tail’s position contains significant information on the baryon-to-photon ratio as well as the total density of matter in the universe. This understanding helps us to better comprehend the basic cosmological constants by shedding light on the structure and dynamics of the early universe.Table 1. Power Spectrum Characteristics
Characteristic Significance First Peak Baryonic Density, Curvature Second Peak Baryonic Density Third Peak Dark Matter Density Damping Tail Total density of matter, Baryon-to-photon ratio. -
Polarization Spectrum:The polarization patterns observed in the Cosmic Microwave Background (CMB) provide valuable information about the early universe. They reveal details about the re-ionization5 process and density variations during that period. The polarization power spectrum, derived from analyzing the polarization patterns in the CMB, offers insights into the distribution of matter across space. It reveals density variations at different angular scales. There are two primary types of polarization: E-mode and B-mode. E-mode polarization arises from scalar (density) perturbations and represents a curl-free component without any rotation. B-mode polarization, on the other hand, arises from vector perturbations. It is divergence-free, meaning it lacks sources or sinks and does not form closed loops.Both E-mode and B-mode polarization can be produced by tensor perturbations. The observed polarization in the CMB results from a combination of E-mode and B-mode contributions. Figure 3 provides a visual representation of the properties of these modes.

Indeed, by studying the power spectrum, we could potentially able to find out a lot about the properties of the early universe, including its curvature, total matter/baryonic density, dark matter density, and dark energy content. There are some more infromation6 about Power Spectrum that would be worth noting:
- The odd peaks in this context represent the compression region, while the even peaks represent the rarefaction region. These regions of compression and rarefaction are a result of quantum fluctuations7, which arise from the interplay between the forces of photon pressure and baryon gravitational pull.
- All of the peaks positions and amplitude are affected by multiple parameters.
- When baryons are added to the plasma, the oscillations’ frequency is reduced, which causes the peaks to move to somewhat higher multipoles (ℓ).
- The total peak amplitude is diminished when the dark matter density is increased.
- Reducing the density of dark matter eliminates the baryons loading8 effect, which results in enhanced compression over rarefaction regions.
- Raising the baryon density shifts the damping tail to higher multipoles.
- Raising the matter density (baryonic matter and non-baryonic matter) ships the damping tail to lower multipoles.
1.3. Hubble Tension
Now let’s look into the problem that we want to encounter in this paper Hubble Tension, refers to the discrepancy in the measured value of the Hubble constant () obtained through various techniques and instruments employing both direct and indirect methods.The Hubble constant is a crucial parameter that quantifies the rate at which galaxies recede from each other due to the expansion of the universe.
The Hubble constant can be determined through two primary methods:
Direct Measurement: This method involves using observations of nearby objects, such as Cepheid variable stars or Type Ia supernovae, and measuring their distances and velocities. By comparing the observed velocities with the distances, scientists can estimate the value of . It signifies the use of Late (present) Universe for the measurements.
Indirect Measurement: This method involves studying the early universe’s properties and using various cosmological models to infer the present-day value of . Indirect measurements utilize the cosmic microwave background (CMB) radiation, and other cosmological probes. It Signifies using Early Universe to carry out the investigation.
The Hubble tension arises from the fact that the values obtained from these two different methods as shown in Table 2 and Figure 4 do not agree with each other. The direct measurements, primarily using the Hubble Space Telescope, tend to yield a higher value for , around 72.59 to 76 . On the other hand, the indirect measurements derived from observations of the early universe, such as the Planck satellite and WMAP data, suggest a lower value of around 67.27 to 68.53 .
This tension is significant because it implies that either one or both of the measurement methods contain systematic errors or that our current understanding of the universe’s expansion is incomplete. Resolving the Hubble Tension is of utmost importance as it holds implications for understanding the precise nature and dynamics of cosmic expansion, the age of the universe and the amount of dark energy present. By examining the disparities in measurements, this paper aims to shed light on the underlying causes and explore potential avenues to reconcile these differences.
1.4. Perturbation Theory
Perturbations represent small-scale fluctuations or modifications to the properties of the universe. These perturbations can arise in various characteristics of the universe, including matter and energy distribution, the spacetime metric, and cosmic microwave background radiation. Cosmic fluctuations are important for understanding the development and evolution of structures in the universe. There are three type of perturbations:
Scalar Perturbation: Scalar perturbations are characterized by fluctuations in the spacetime metric that involve changes in the volume of space, leading to density variations and gravitational potential fluctuations. Scalar perturbations can be scalar fields or scalar quantities that describe fluctuations in matter or energy density.
Scalar perturbations can arise from density fluctuations in the early universe. These fluctuations can be generated through processes like quantum fluctuations during inflation or other cosmological mechanisms. Scalar perturbations are responsible for the formation of structures in the universe, such as galaxies and galaxy clusters.
Scalar perturbations leave imprints on the cosmic microwave background radiation through temperature anisotropies. The observed temperature variations across the sky provide valuable information about the initial conditions and evolution of scalar perturbations.
The scalar field could have two components:
Adiabatic Perturbation: Adiabatic perturbations, also known as curvature perturbations, refer to density fluctuations that arise from variations in the overall energy density of the universe. These perturbations are characterized by the condition that the entropy per particle remains constant during their evolution. In other words, they preserve the ratio of different components of the cosmic fluid (such as dark matter and dark energy) while their amplitudes fluctuate.
Non-Adiabatic Perturbation: Non-adiabatic perturbations, also known as entropy perturbations or isocurvature perturbations, refer to density fluctuations that arise from variations in the relative abundance of different components of the cosmic fluid. These perturbations do not preserve the ratio of different components during their evolution, leading to variations in the entropy per particle.
Non-adiabatic perturbations can arise when there are interactions between different components of the cosmic fluid, such as dark matter and baryonic matter. They can also arise from the presence of additional fields or physical processes in the early universe. Non-adiabatic perturbations can have important effects on the growth and evolution of structures, altering the distribution of matter on small scales.
Vector Perturbation:
Vector perturbations arise from fluctuations in vector fields, such as the velocity field of matter or the electromagnetic field. These perturbations have a divergence-free nature, meaning they do not induce changes in the volume of space. Vector perturbations can originate from anisotropic processes or from the presence of magnetic fields in the early universe.
Tensor Perturbation:
Tensor perturbations are characterized by fluctuations in the gravitational field9 or the spacetime metric that exhibits two polarization states. These fluctuations are transverse and traceless, meaning they have no longitudinal component and do not leave any overall change in the volume of space.
Tensor perturbations have a unique effect on the polarization of light, known as the B-mode polarization pattern.
It is important to point out that all of these three perturbations don’t interact with each other. That is they evolve independently in linear regimes but when it comes to the reality that is much more complex non-linear regimes the three perturbations do interact with each other through different modes and also show interconversion among them. The primary modes of interactions are:
Gravitation
Tensor, scalar, and vector perturbations all interact through their gravitational effects. While tensor perturbations (gravitational waves) primarily affect the polarization of light and the large-scale structure of spacetime, scalar, and vector perturbations can influence the gravitational potential and the motion of matter. This gravitational interaction can lead to correlations and alterations between different perturbation modes.
Conversion:
Perturbations can undergo conversion. This means that a perturbation mode initially in one category can evolve and acquire characteristics of another category. This conversion can occur due to changes in the background cosmological conditions.
Nonlinear Interactions:
In a universe where perturbations become large and their equations of motion are nonlinear, interactions between different modes become more significant.
The evolution of perturbations is influenced by the dominant components of the universe. Perturbations in a radiation-dominated universe evolve at a faster pace due to the higher energy density and relativistic nature of radiation, while perturbations in a matter-dominated universe experience slower growth owing to the lower energy density and non-relativistic nature of matter.
Table 3.
Different Perturbations
| Perturbation Type | Significance |
| Scalar | Fluctuations in matter or energy density |
| Vector | Fluctuations in vector fields |
| Tensor | Fluctuations in the gravitational field |
1.5. Sound Horizon ()
Here we define the sound horizon (Schöneberg et al., 2022) at redshift z, where , is the distance travelled by an acoustic wave in the baryon-photon plasma in terms of the sound speed of the baryon-photon plasma . plays the role of a standard ruler that allows us to strongly constrain the angular diameter distance (and therefore the expansion rate) as a function of redshift .
where and are the speed of sound and Hubble constant at red-shift (z).
Also the angular diameter distance is given by
And the angle is given by
A comprehensive visualization of each of the following is given in Figure 5. The sound horizon also has some significance in perturbation as before sound horizon perturbations are tightly coupled and undergo acoustic oscillations and after the sound horizon they interact through gravitational potential.
2. Literature Review
Tanvi Karwal10 is among the prominent researchers investigating the Hubble tension problem. She proposes three essential requirements that need to be met for any potential approaches aimed at resolving the Hubble tension. These requirements are as follows:
-
Keeping fixed which means keeping CMB peaks fixed such that .Now following up on this idea we can do some mathematical manipulation to get the crucks of the given statement. Let us make use of the information given in section[1.5], we takeAlso, we know thatwhich states,Here, we find that for constant ;This implies that as the Hubble constant increases, the sound horizon decreases, and vice versa.Hence by keeping the sound horizon fixed while varying the Hubble constant, we can study the impact of different Hubble constant values on the properties of the CMB peaks. This analysis allows us to explore the effects of changes in the expansion rate of the Universe on the observed characteristics of the CMB radiation.
-
Decrease , which increase the pre-CMB expansion rate.The physical interpretation of the equationstates as the pre-CMB expansion rate is inversely proportional to the sound horizon that means to increase the pre-CMB expansion rate we have to consequently decrease the sound horizon , which results in shifting characteristics of the CMB peaks in the power spectrum.
- Leave unchanged, so modification must disappear at late times. The physical meaning of the equationmeans that the angular diameter distance () remains inversely proportional to the post-CMB expansion rate () while the modification disappears at late times.
Now we are familiarized with the ideal requirements to solve Hubble tension, it is safe to say that to run some analysis on Hubble constant we should have a good understanding of the sound horizon .
Multiple research groups are actively engaged in addressing the Hubble tension problem through a diverse range of perspectives and methodologies. Initially, systematic errors were considered as a possible cause for the tension, but recent studies [1,2,3] have definitively ruled out this explanation. To unravel the issue, scientists are employing cutting-edge technologies such as quasar lensing [4,5], Megamaser [6,7], gravitational waves (GW) [8,9], and Baryon Acoustic Oscillations (BAOs) [10,11]. These advanced techniques provide unprecedented precision and accuracy in observing and analyzing data.
A comprehensive investigation of various solutions for the Hubble tension is presented in the study by (Schöneberg et al., 2022), providing valuable insights into the underlying causes. Our discussion primarily focuses on the early universe solutions, emphasizing the phenomena that occurred during its formative stages of our universe. By studying the crucial events, we aim to gain a deeper understanding of the factors contributing to the observed tension in the Hubble constant.
One prominent strategy pursued by numerous research groups involves incorporating Early Dark Energy (EDE) during the early stages of the universe (redshifts z ≳ 3000), which gradually dissipates resembling radiation or even faster during subsequent periods. This intriguing concept offers a potential solution to the Hubble tension by enhancing the expansion rate during the early universe while preserving the unaltered later evolution. Two distinct mechanisms have been explored in the literature: the oscillating scalar field and the slowly rolling field, as described by Poulin et al. (2019)[12] . Additionally, an alternative variation of EDE, called New Early Dark Energy (NEDE), has been proposed by Niedermann & Sloth (2022)[13]. The NEDE model suggests a fast first-order phase transition triggered by a scalar field that becomes light and begins moving in the potential before matter-radiation equality. Addressing the fine-tuning issues of the old EDE model, the NEDE model also exhibits phenomenological differences at the perturbation level and presents distinct predictions for the Cosmic Microwave Background (CMB) and large-scale structure (LSS).
In addition to the EDE approach, researchers are exploring several other intriguing concepts. These include:
-
Recombination shifted by primordial magnetic field:The concept proposes the intriguing notion of small-scale, mildly non-linear inhomogeneities in the baryon density during the process of recombination, influenced by primordial magnetic fields (Schöneberg et al., 2022 [14]; Jedamzik & Saveliev, 2019 [15]). If these magnetic fields exist, they have the potential to alter the dynamics of charged particles during recombination, consequently leaving observable imprints on the cosmic microwave background (CMB) radiation. Although these small-scale inhomogeneities do not directly contribute to CMB temperature and polarization anisotropies, they significantly impact the CMB anisotropy spectra by modifying the ionization history of the Universe. Specifically, the recombination rate is directly proportional to the square of the electron density (). Therefore, the presence of an inhomogeneous plasma can induce modifications in the mean free electron fraction at a given epoch. This, in turn, leads to an earlier recombination of the clumpy plasma, resulting in a reduction of the sound horizon () at the time of recombination. Consequently, the CMB spectra display a noticeable shift in the positions of the peaks. This shift can be compensated by considering a larger value of the Hubble constant () (Jedamzik & Pogosian, 2021)[16]. Exploring the implications of these inhomogeneities driven by primordial magnetic fields adds another layer of complexity to our understanding of the recombination process and its impact on the CMB radiation.
- Recombination shifted by varying effective electron mass: This hypothesis postulates that variations in the effective mass of electrons may have an impact on the recombination process. The period of recombination in the early Universe can be altered in one of the most efficient ways through this (Schöneberg et al., 2022 [14]; Sekiguchi & Takahashi, 2021 [17]; J.-P. Uzan, 2003 [18]).
- Recombination shifted by varying effective electron mass in a curved universe: This model extends the previous theory that considers variations in electron mass during recombination by incorporating an additional parameter () to account for the effects of a curved or non-flat universe (Sekiguchi & Takahashi, 2021 [17]). By investigating the combined influence of spatial curvature and variations in electron mass, researchers aim to gain a deeper understanding of how these variables impact the recombination process and its observable manifestations. The inclusion of the curvature parameter () allows for a more comprehensive analysis of the recombination epoch within the context of a curved universe. By considering the spatial curvature alongside the variations in electron mass, researchers can explore how these combined factors shape the dynamics of recombination and its detectable signatures.
-
Self-interacting neutrinos plus free-streaming Dark Radiation: In this scenario, the behavior of neutrinos, which are weakly interacting (Park et al., 2019)[19] particles, is considered alongside the presence of free-streaming Dark Radiation. The large neutrino masses accommodate for larger values of (Ghosh et al., 2020)[20]. Neutrinos, being self-interacting, can affect the large-scale structure formation of the universe. (Archidiacono & Gariazzo, 2022)[21] has showcased the interaction between sterile neutrinos and dark radiation and given some account for hubble tension.In this model researchers explore the behavior of neutrinos, which are weakly interacting particles (Park et al., 2019)[19], in conjunction with the presence of free-streaming Dark Radiation. The consideration of large neutrino masses accommodates for larger values of (Ghosh et al., 2020)[20]. Neutrinos, despite their weak interactions, have a significant impact on the dynamics of the universe, especially at large scales. The consideration of sterile neutrinos, which do not participate in weak interactions, introduces an additional element that can influence the behavior of neutrinos and contribute to resolving the Hubble tension as demonstrated by Archidiacono & Gariazzo (2022)[21].
These various concepts and models are being explored by researchers to understand and address the Hubble tension from different perspectives. Continued investigations, incorporating observational data and theoretical developments, are essential to further refine and validate these proposals, ultimately leading to a deeper understanding of the universe’s fundamental properties.
3. Methodology
The methodology we employ consists of a comprehensive investigation of the predictions made by the standard CDM model, which serves as the baseline. We meticulously compare these predictions with the actual observed data, aiming to achieve the best possible agreement between theory and observation. To account for any deviations or discrepancies, we introduce additional parameters that extend the standard CDM model.
By incorporating these additional parameters, we aim to find the best fit for the observed data, ensuring that our model aligns as closely as possible with the actual observations. This process allows us to gain a deeper understanding of our universe by uncovering the underlying physical processes and phenomena that influence the observed data.
To explore the best fit further, we can vary the values of certain parameters, such as the Hubble constant (), within specific bounds. By systematically investigating different values within these bounds, we can evaluate the impact on the goodness of fit and assess the range of possible solutions that best describe the observed data.
By undertaking this rigorous analysis, we aim to refine our understanding of the universe and provide insights into the fundamental principles that govern its evolution. Through this iterative process of model refinement and comparison with observational data, we strive to uncover a more complete and accurate representation of the cosmos.
4. Results and Analysis
We begin the Results and Analysis section with an examination of the universe’s composition and development using the CDM model [4.1]. This commonly used model includes various parameters that have been thoroughly established and presented in Section [1.1]. Next, in the following subsection [4.1], we thoroughly examine the influence of varying values of the Hubble constant () on different components of the Power Spectrum. We have made use of CLASS11 software for simulating desired cosmological scenarios. All of the code is available on github12 repository for this whole project.
4.1. CDM Model Analysis
The cosmic microwave background (CMB) for the CDM model is shown in Figure 6, presenting a visual depiction of its attributes. The construction of the CMB map takes into account a maximum multipole moment (ℓ) of 2500, which successfully reflects the fundamental characteristics of CMB anisotropy and fluctuations. We further studied different Power Spectrum components in order to conduct a quantitative examination of the CMB anisotropy and fluctuations.
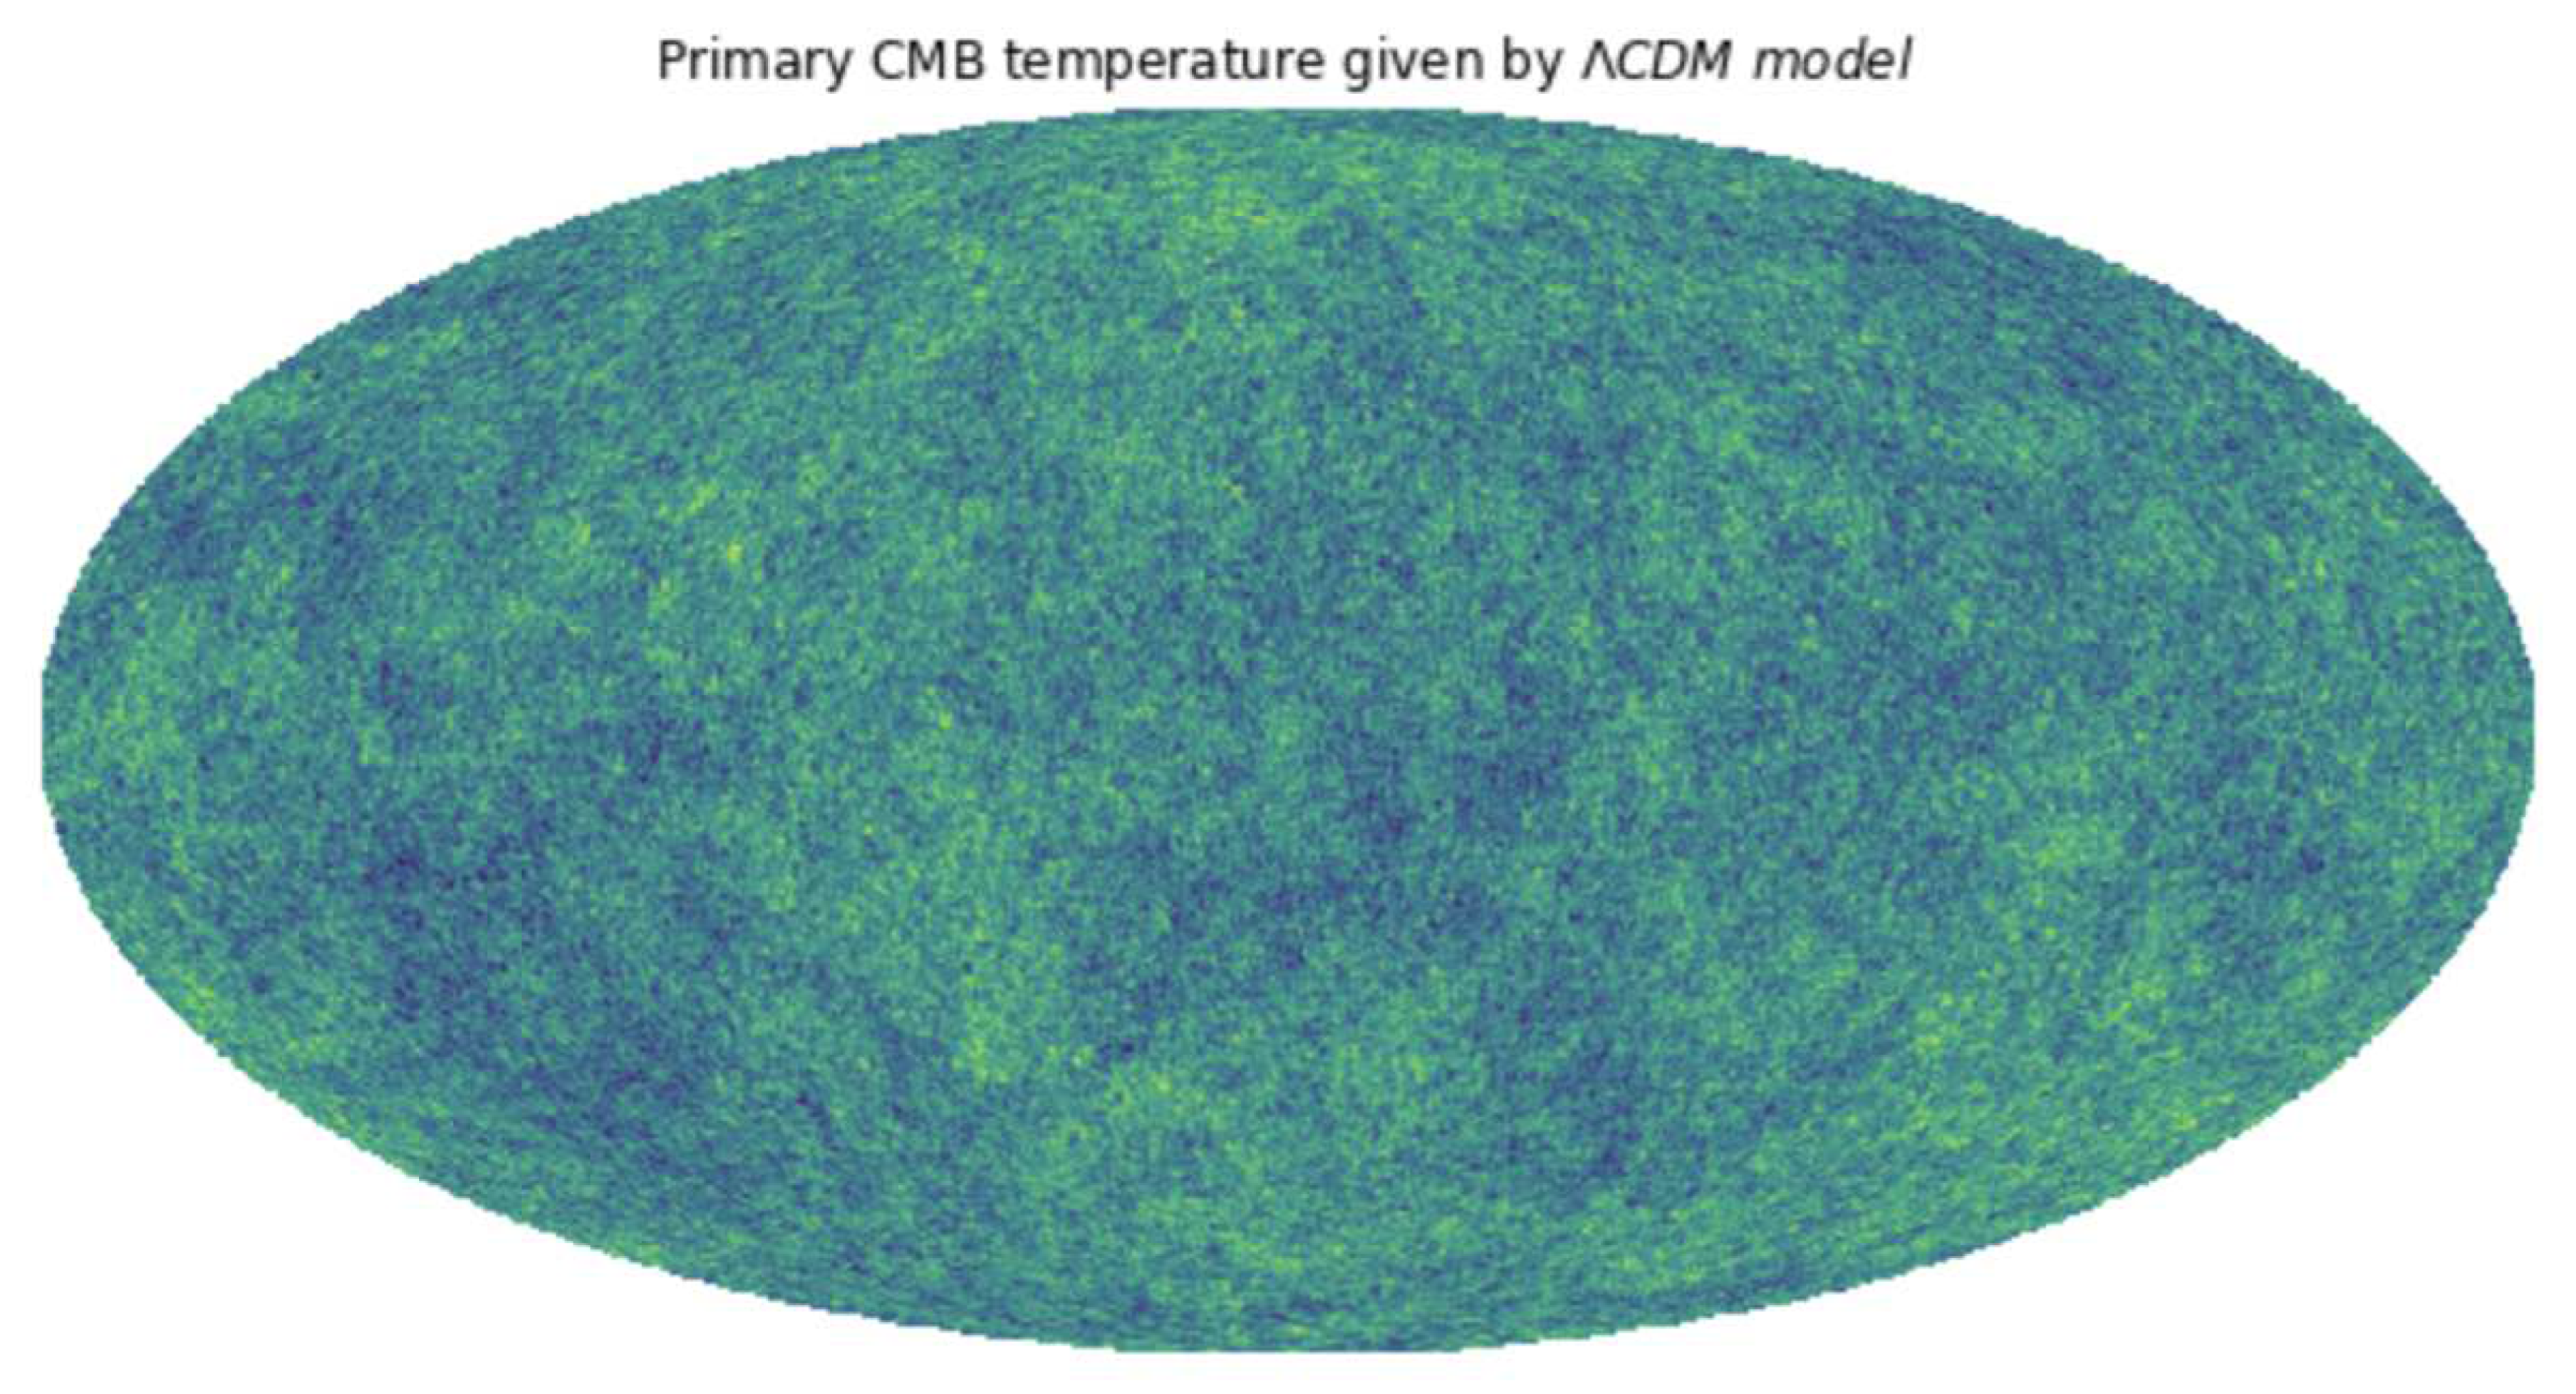
Figure 6.
Cosmic Microwave Background
TT Power Spectrum:
Figure 7a displays the TT (temperature-temperature) power spectrum, illustrating the statistical characteristics of temperature fluctuations in the cosmic microwave background (CMB) radiation. The x-axis is logarithmically scaled, while the y-axis follows a linear scale, maintaining the same scaling convention in Figure 7b–f as well.
The power spectrum exhibits distinctive peaks: the first peak is prominent around , followed by the second peak at , and the third peak at . The difference between the heights of the second and third peaks is minimal. Comparatively, the height magnitude difference between the first peak and the second peak is approximately 3150 units.
As we explore smaller angular scales (around ), the power spectrum starts losing amplitude, leading to a damping tail. The precise positions and heights of the power spectrum peaks are of utmost importance for our analysis, providing crucial insights into the underlying phenomena.
EE Power Spectrum:
The EE power spectrum, representing the statistical characteristics of E-mode polarisation fluctuations in the cosmic microwave background (CMB) radiation, which is depicted in Figure 7. In contrast to the linear nature of the TT power spectrum, the EE power spectrum exhibits intriguing oscillatory behavior. At larger angular scales or lower values of ℓ, the graph remains relatively flat until approximately 70. Around 150, a small peak emerges, followed by a dip at 225.
Upon further analysis, a remarkable pattern becomes evident in the EE power spectrum, where the peaks observed in the TT power spectrum align with valleys in the EE power spectrum. Specifically, at 535 and 820, valleys are observed in the EE power spectrum, whereas peaks manifest in the TT power spectrum. Notably, the global peak of the EE power spectrum materializes at 1000, corresponding to the damping tail observed in the TT power spectrum.
As we progress beyond 1000, the oscillatory profile persists but with diminishing amplitude. Eventually, this leads to a damping amplitude tail as we examine smaller angular scales and higher values of ℓ.
The intriguing relationship between the EE and TT power spectra, with valleys and peaks appearing at specific ℓ values, offers insights into the nature of primordial perturbations (scalar).
PP Power Spectrum:
The PP (polarization-polarization) power spectrum, illustrated in Figure 7, captures the statistical characteristics of polarization fluctuations in the cosmic microwave background (CMB) radiation. The profile of the graph exhibits a simple, exponential decay. The quantity is particularly significant for lower values of ℓ, corresponding to larger angular scales.
The PP power spectrum provides valuable insights into two main aspects: the presence of gravitational waves and the characteristics of primordial magnetic fields. It encompasses both the E-mode and B-mode polarization as the specific mode of polarization is not explicitly specified in PP polarization.
BB Power Spectrum:
The BB (B-mode polarization-B-mode polarisation) power spectrum, depicted in Figure 7, reveals the statistical characteristics of B-mode polarization fluctuations in the cosmic microwave background (CMB) radiation. Similar to the TT power spectrum, the profile of the plot exhibits a linear behavior. At larger angular scales or lower values of ℓ, the graph remains relatively flat until around 50. It then gradually rises, reaching a global peak at 900, followed by a valley at 1000. Subsequently, there is another peak at 1150, followed by a linear decrease in magnitude at higher ℓ values.
The linear nature of the BB power spectrum implies a different physical origin compared to the oscillatory behavior seen in the EE power spectrum. The B-mode polarization primarily arises from primordial gravitational waves generated during the epoch of cosmic inflation. These gravitational waves induce a distinct curl-like pattern in the polarization of the CMB radiation.
The flat region observed at lower ℓ values signifies the absence of significant B-mode polarization fluctuations on larger angular scales. As we move towards higher ℓ values, the B-mode power spectrum experiences an increase, peaking at 900, which corresponds to the typical scale at which primordial gravitational waves contribute significantly to the polarization signal. The subsequent valley at 1000 suggests a suppression of B-mode polarization at that scale, potentially caused by reionization.
The second peak observed at 1150 indicates a secondary contribution to the B-mode power spectrum, which could arise from sources such as lensing of the CMB by intervening large-scale structures or other astrophysical foregrounds.
At higher ℓ values, the magnitude of the B-mode power spectrum decreases linearly. This decreasing trend signifies the damping of polarization fluctuations on smaller angular scales, resulting from photon diffusion processes.
TE Power Spectrum:
The TE power spectrum, which captures the statistical relationship between temperature and E-mode polarization fluctuations in the cosmic microwave background (CMB) radiation, is illustrated in Figure 7. At lower values of ℓ, the TE power spectrum exhibits a steady behavior, remaining close to null until approximately 50. Beyond this point, the profile transitions into an oscillating pattern.
The oscillatory characteristic of the TE power spectrum begins with a negative value, signifying the region of inflation during the early universe. This negative segment represents the correlation between temperature and E-mode polarization fluctuations in this inflationary epoch. Subsequently, the power spectrum reaches its global peak at 310, indicating the maximum correlation between temperature and E-mode polarization at that scale.
Following the peak, the TE power spectrum experiences subsequent valleys and peaks, reflecting the intricate interplay between temperature and E-mode polarization fluctuations. These variations arise from the complex physical processes that occurred during the evolution of the universe, such as acoustic oscillations and the growth of large-scale structures.
As we examine higher values of ℓ, the TE power spectrum gradually dampens, leading to a null value. This damping effect is a consequence of photon diffusion which smooth out small-scale fluctuations in the CMB temperature and polarization fields.
TP Power Spectrum:
The TP (temperature-polarization) power spectrum, depicted in Figure 7, characterizes the correlation between temperature fluctuations and the various modes of polarization fluctuations (E-mode or B-mode) in the cosmic microwave background (CMB) radiation. The profile and trend of the TP power spectrum closely resemble that of the PP power spectrum, displaying an exponential decrease at higher values of ℓ.
Co-relation Power Spectrum:
In Figure 8, we present the variations of different components of the power spectrum (TT, EE, PP, BB, TP, TE). The x-axis and y-axis of the plot are both scaled logarithmically. At the beginning, PP and TP dominate the power spectrum until , after which their magnitudes decrease significantly. On the other hand, the TT component gradually increases and maintains a magnitude of approximately . The TE component starts with a magnitude of and remains stable until , exhibiting oscillating characteristics thereafter. For the EE component, it starts at around and then decreases to until . However, it subsequently experiences growth, reaching magnitudes of around .
Overall, this plot provides insights into the behavior of different power spectrum components, highlighting their varying magnitudes and oscillatory patterns across different angular scales.
Linear Matter Power Spectrum :
The matter power spectrum is derived from the statistical analysis of the spatial distribution of matter in the Universe. It quantifies the amplitude of density fluctuations at different spatial scales. The power spectrum, denoted as , represents the amplitude of fluctuations as a function of wavenumber k, which characterizes the spatial frequency of the density fluctuations.
In the plot shown in Figure 9, the horizontal axis represents the wavenumber k. The wavenumber is inversely proportional to the scale of the fluctuations, so large wavenumbers correspond to small-scale fluctuations, while small wavenumbers correspond to large-scale fluctuations. This means that the left side of the plot represents larger spatial scales, while the right side represents smaller spatial scales.
The vertical axis of the plot represents , which indicates the amplitude of the density fluctuations at each wavenumber. The values of describe the statistical properties of the matter distribution in the Universe. Specifically, a higher value of indicates a larger amplitude of fluctuations at that particular wavenumber.
Table 4.
Perturbations associated with different Power Spectrum Components (Linear System)
| Power Spectrum Component Type | Perturbation Associated |
| TT | Scalar |
| EE | Scalar |
| PP | Tensor |
| BB | Tensor |
| TE | Scalar |
| TP | Scalar |
4.2. CDM Model Vs Real Observation Measurements Analysis
Following a detailed examination of the CDM model, we now focus our attention on real experimental data acquired from important survey missions such as Planck, WMAP, and DES13. These missions give essential insights into the features and characteristics of our universe through their enormous observations and measurements. In the following sections, we analyze the experimental data obtained from these survey missions.
The datasets used to plot the TT14, BB15, TE and EE16. plots are taken from NASA’s Lambda Archives. The plots shown in Figure 10, Figure 11, Figure 12 and Figure 13, comprehensively provides the descriptions of Observed measurements with CDM model’s predicted measurements. These plots are really helpful to understand the condition of our universe. Here our main focus will be on the TT power spectrum shown in Figure 10, contains most of the information about the enegy density composition of the universe. In the plot we can cleary identify some deviations that are there in the actual measurements and the CDM model’s predicted measurements.
- The amplitude of each peak in the actual measured values is lower compared to the expected values predicted by the CDM model. Specifically, for the first peak, the difference amounts to approximately 2000 units.
- In the low ℓ region, the data points exhibit significantly higher levels of erroneous values compared to other data points along the ℓ spectrum. Additionally, these data points do not align with the expected trace of the CDM model, a discrepancy that persists across the entire curve.
The observed differences highlighted above strongly indicate that the existing CDM model falls short in comprehensively capturing all the physical processes or phenomena that impact the observed data. Consequently, it becomes necessary to introduce additional parameters that can more accurately describe our universe. These additional parameters hold the potential to provide insights and potentially resolve the observed Hubble tension.
TT Power Spectrum from Observational Data
The TT power spectrum, shown in Figure 10, presents real data points as small magenta dots, accompanied by error bars indicating the uncertainties in their values. The green dotted line represents the predictions of the CDM model. Upon observation, it becomes evident that the data points align well with the predictions of the CDM model, particularly for relatively higher values of ℓ.
However, in the lower value region of ℓ or larger angular scales, significant deviations from the green dotted line can be observed, along with higher uncertainties in the data values. This behavior at lower ℓ values becomes a critical focus for further study. Understanding the reasons behind these deviations is crucial for refining our understanding of the early universe and the physical processes that shaped the cosmic microwave background (CMB) radiation.
Additionally, a marginal difference can be identified between the position and height of the first peak in the real data compared to the CDM model’s prediction. The real peaks appear to be slightly higher and shifted slightly to the right when compared to the predicted values of the CDM model.
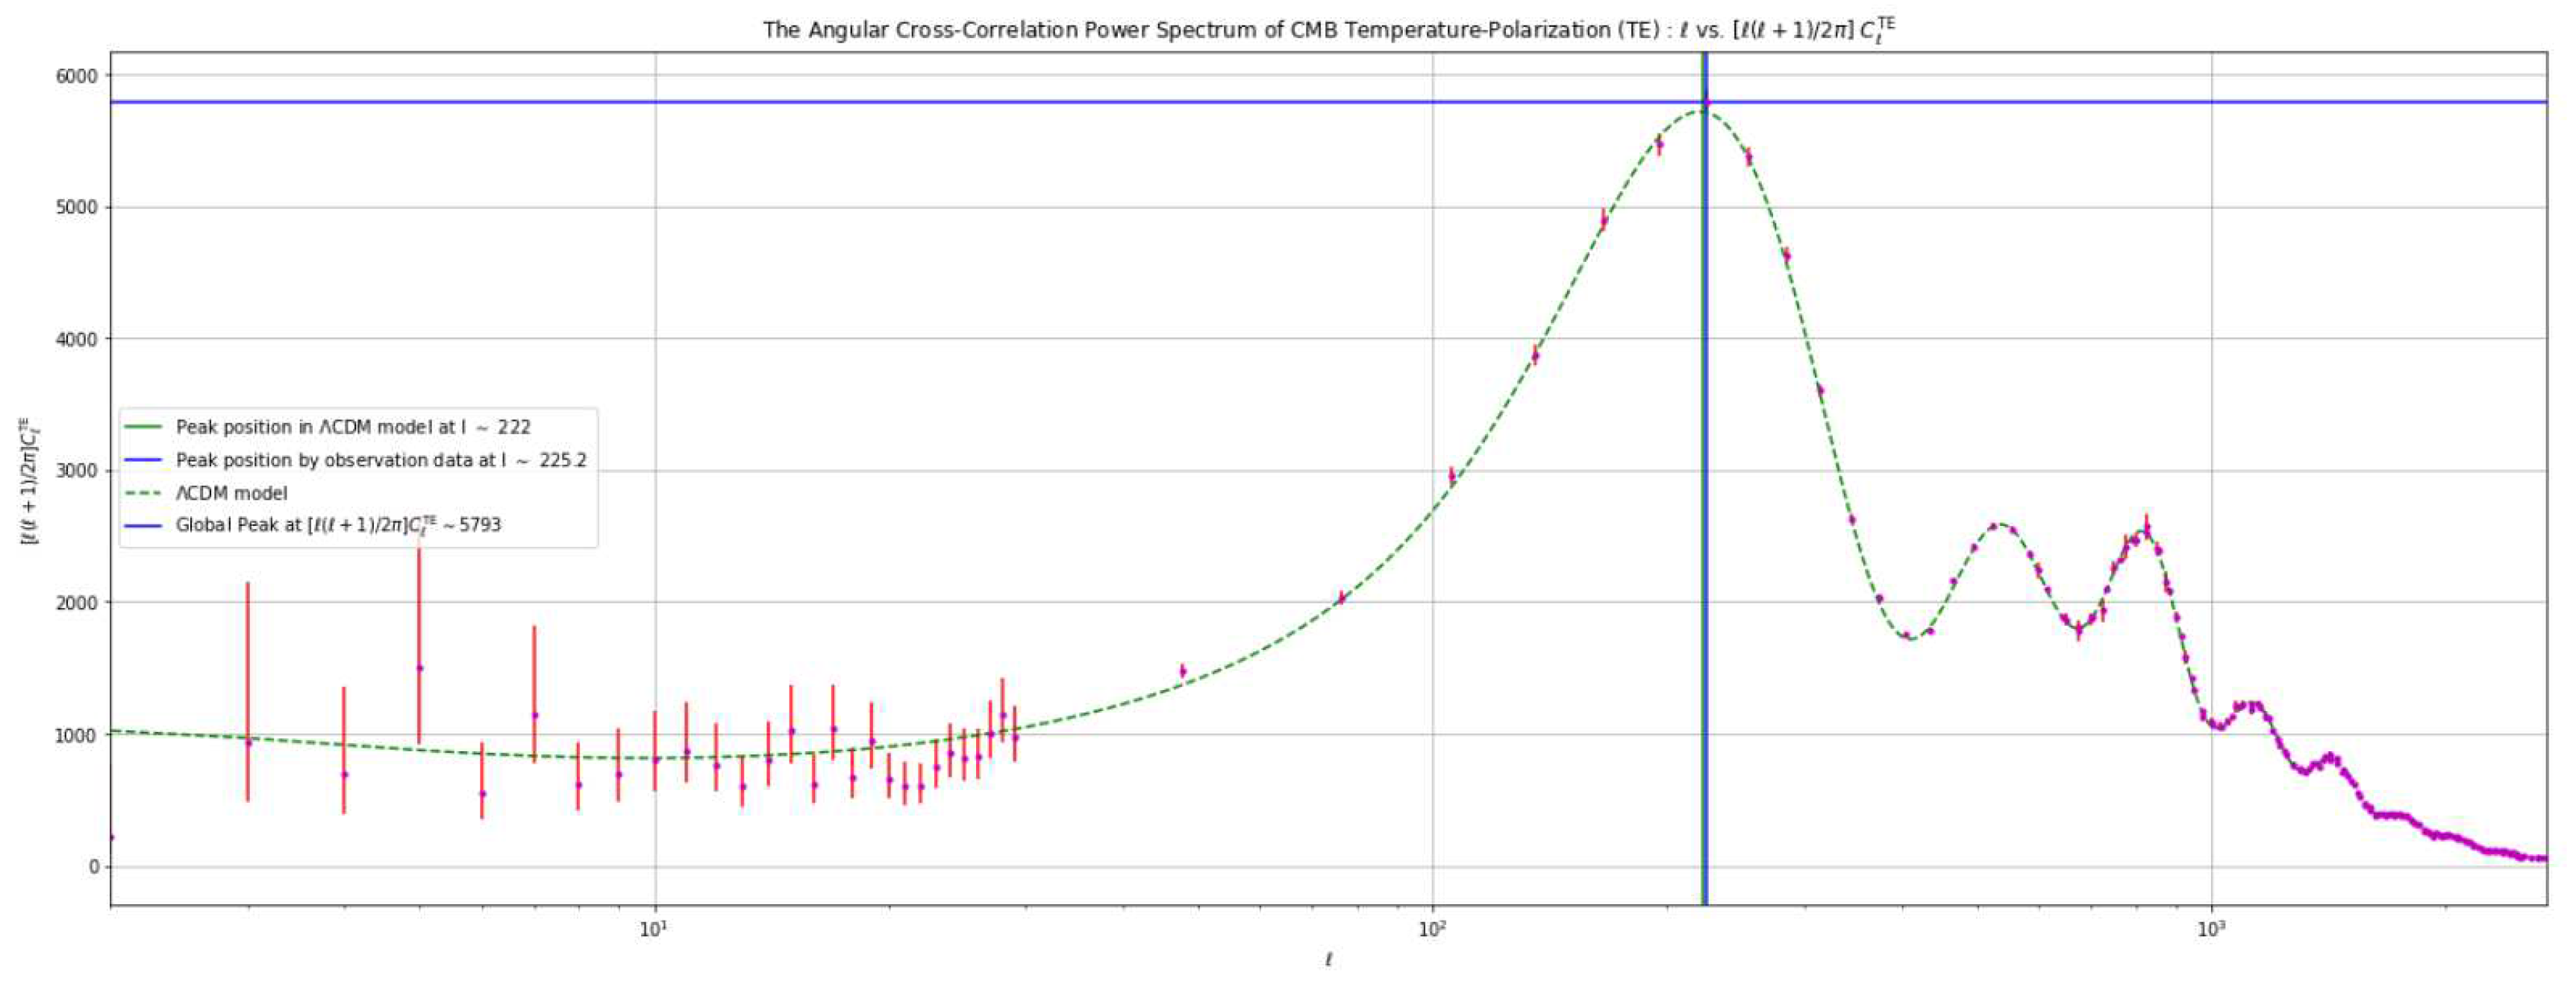
Figure 10.
TT Component Power Spectrum Plot
EE Power Spectrum from Observational Data
The power spectrum of the EE mode is depicted in Figure 11. The plot showcases the data points, represented by small magenta dots, along with their associated uncertainty bars denoted by the red line. The predicted values according to the CDM model are represented by the dotted green line. Upon closer inspection of the plot, it becomes evident that the CDM model aligns remarkably well with the real data, as most of the data points fall in close proximity to the dotted green line.
However, it is worth noting that a few data points deviate significantly from their expected positions and exhibit substantial uncertainty. These outliers primarily occur as we move towards higher ℓ values, particularly in the last two peaks. This discrepancy indicates a substantial level of disagreement and highlights the presence of high uncertainties in these regions. Consequently, it becomes crucial to gain a deeper understanding of the underlying physical processes at smaller scales or higher ℓ values.
Furthermore, it is worth mentioning that the global peak appears slightly shifted to the right of the expected position while maintaining a comparable height to the predicted value.
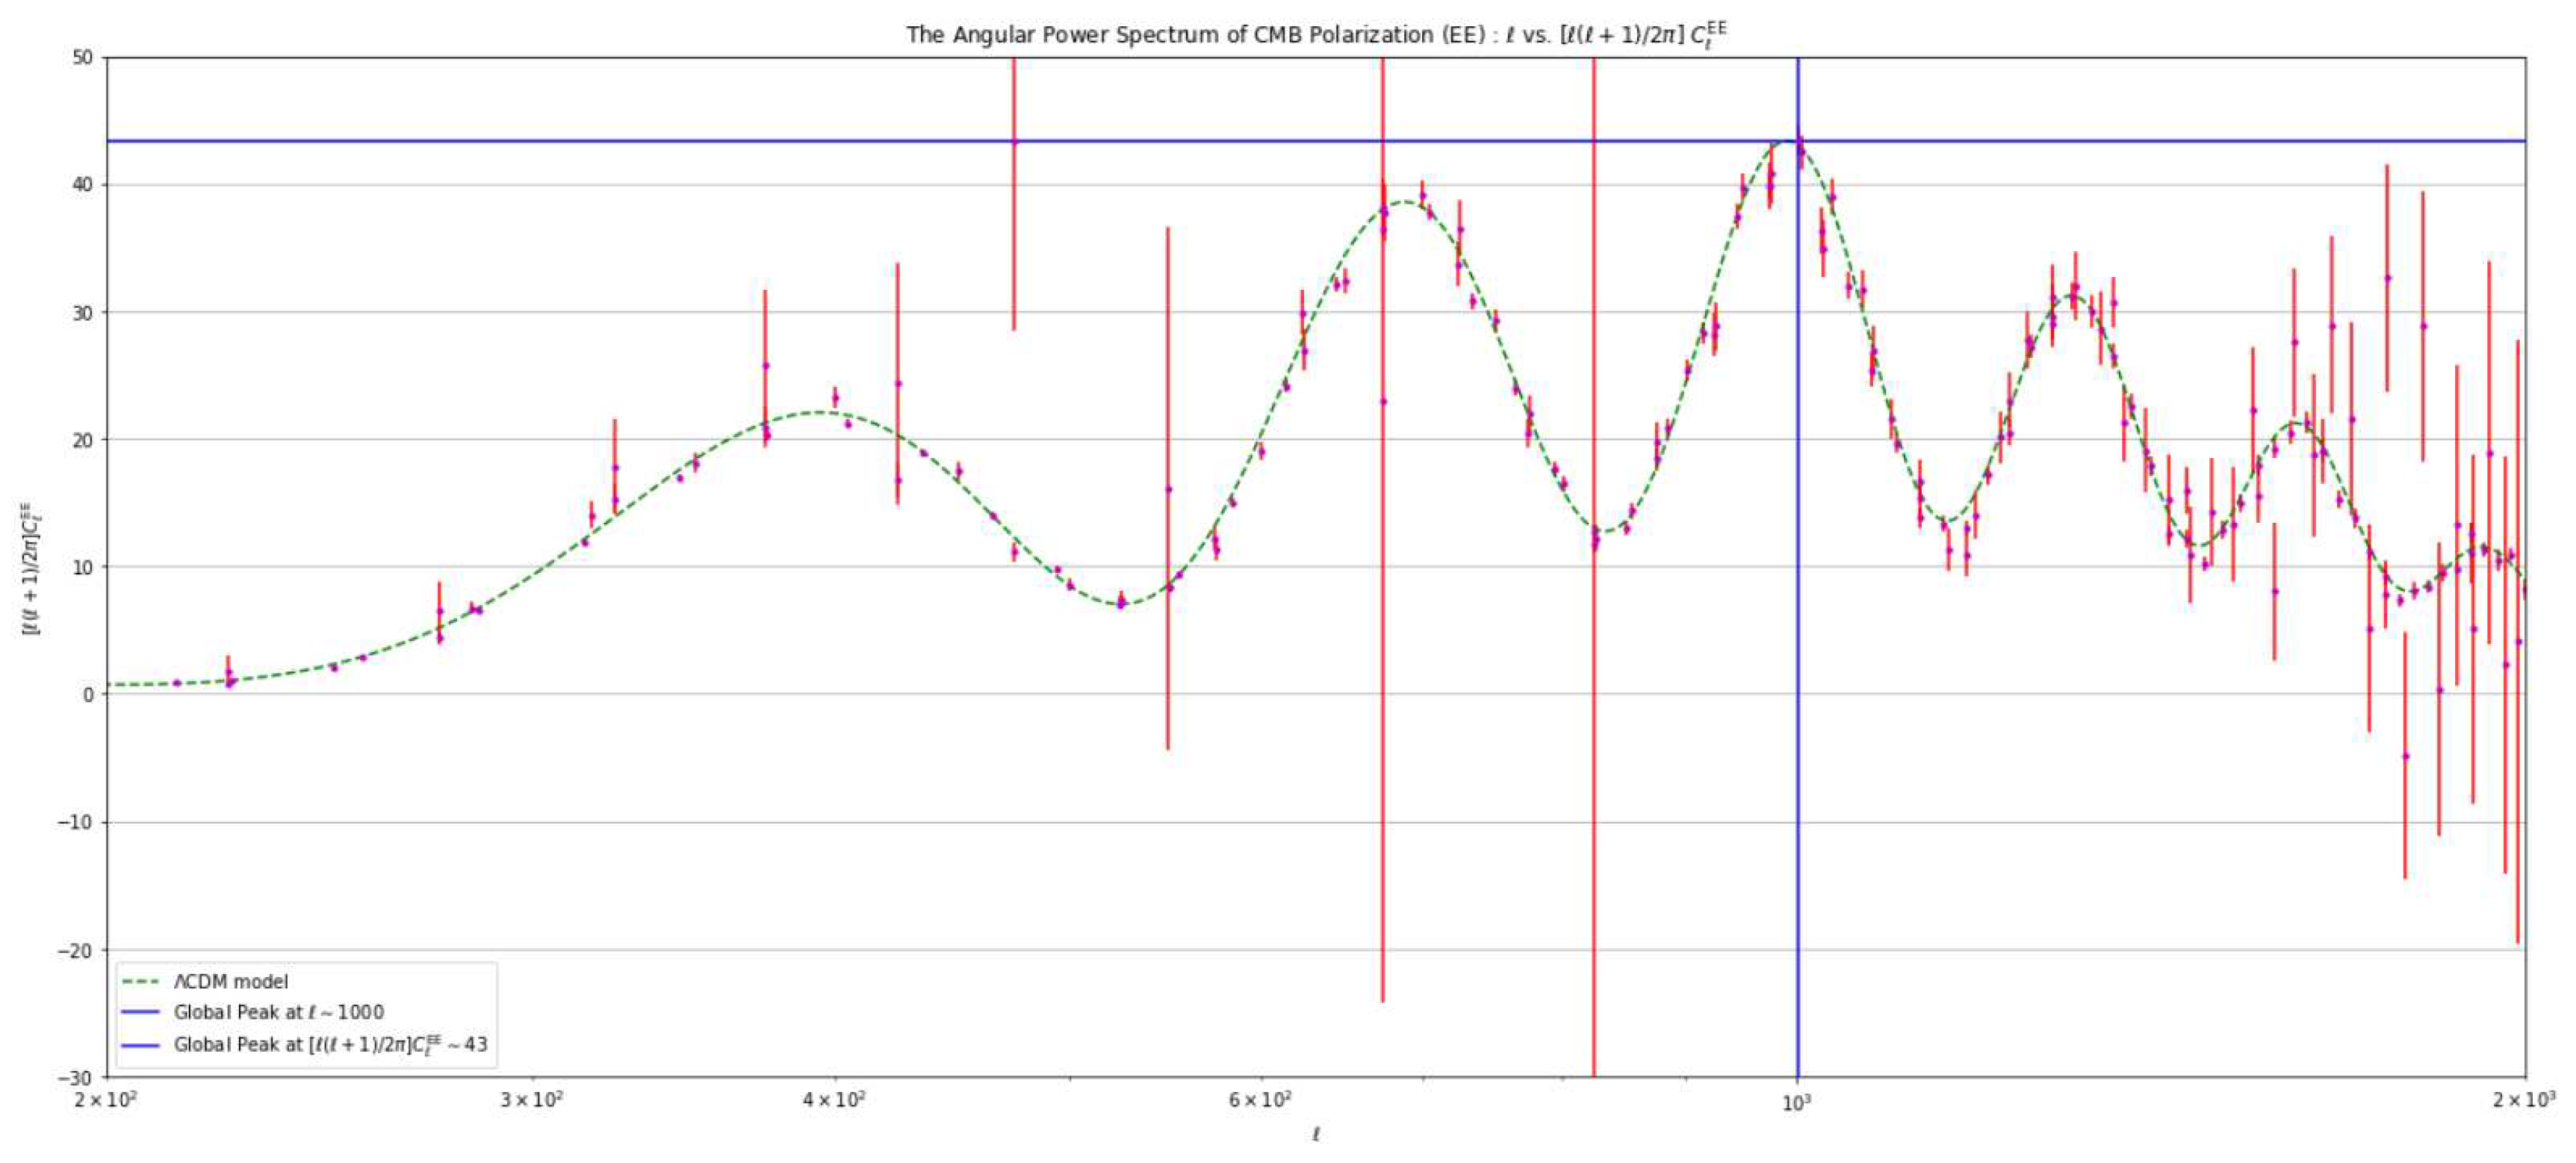
Figure 11.
EE Polarization Power Spectrum Plot
BB Power Spectrum from Observational Data
The power spectrum of the BB mode is displayed in Figure 12. The data points, representing the real observations, are depicted as small magenta dots, and their associated uncertainties are indicated by the red bars. The green line represents the values predicted by the CDM model. Overall, we observe a reasonably good agreement between the real data points and the CDM model, as most of the data points lie close to the green dotted line.
However, as we move to higher values of ℓ, the level of disagreement between the real data and the model increases, and the uncertainties also become more pronounced. It is important to note that the limited number of data points prevents us from obtaining a complete profile for the peaks and valleys in the real data, particularly in the higher ℓ range.
To improve our understanding of the BB power spectrum, further investigations are required to account for the higher ℓ discrepancies and to better characterize the peaks and valleys. Additional data points and a more comprehensive analysis could provide valuable insights into the behavior of the BB power spectrum at different scales and help validate or refine the CDM model.
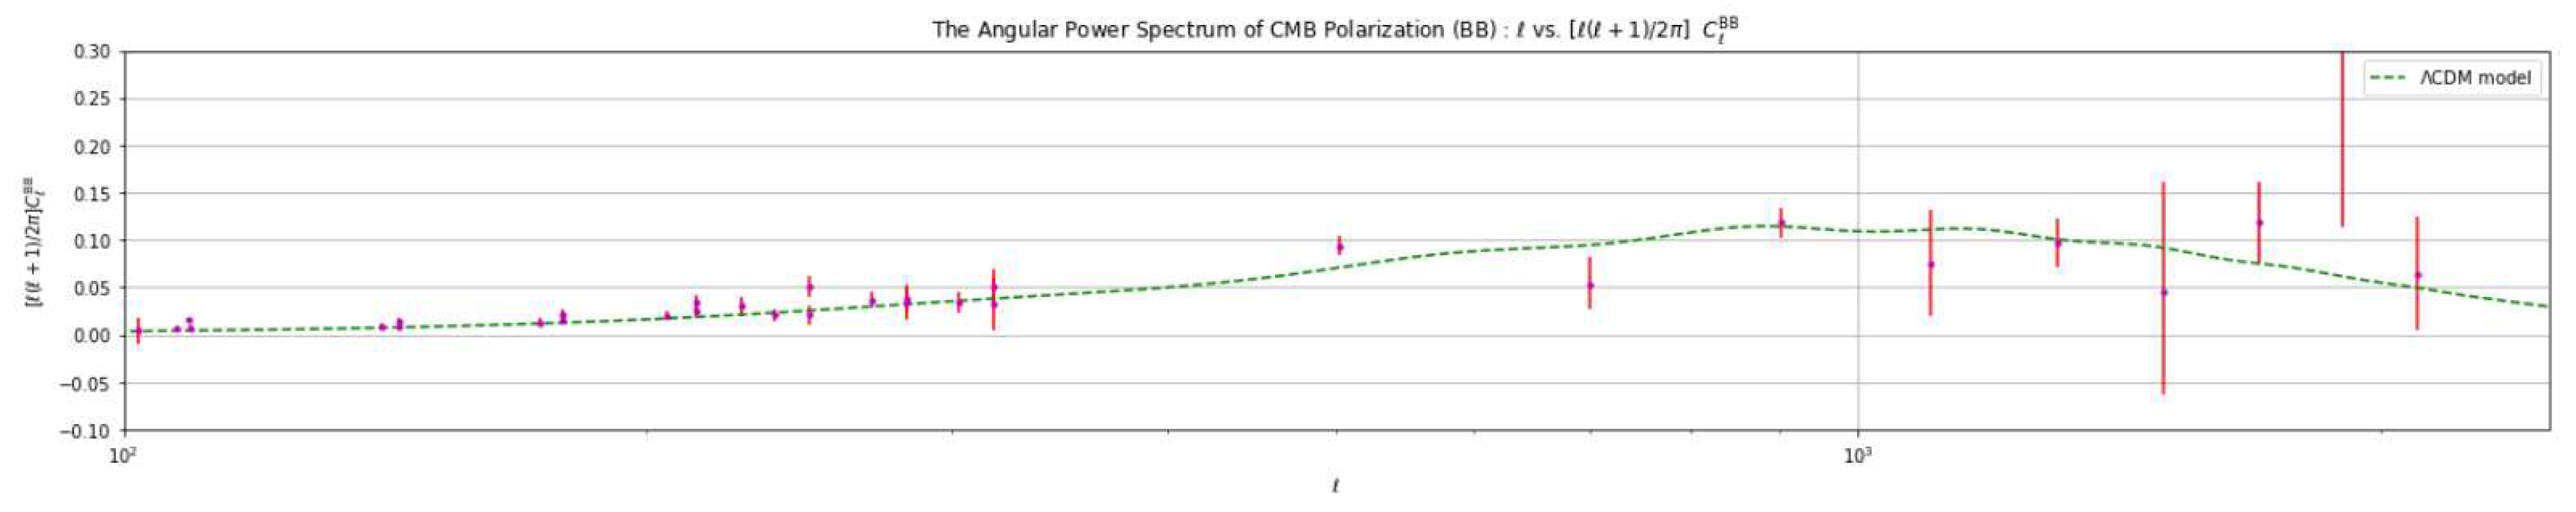
Figure 12.
BB Polarization Power Spectrum Plot
TE Power Spectrum from Observational Data
The TE power spectrum, as shown in Figure 13, presents the real observations, illustrated by small magenta dots, with associated uncertainty bars depicted in red. The green line corresponds to the predicted values derived from the CDM model. On the whole, we find a reasonably good agreement between the real data points and the CDM model, with a significant number of data points aligning closely with the green dotted line.
However, as we progress to higher values of ℓ, particularly in the range of 350 to 1000, discrepancies emerge between the real and predicted values. These higher ℓ regions exhibit increasing disagreements along with notable uncertainties, indicating that the CDM model may not fully capture the complexity of the observed data in these ranges.
It is important to investigate and address these discrepancies to gain a more comprehensive understanding of the underlying physical processes responsible for the power spectrum behavior in the specified ℓ range.
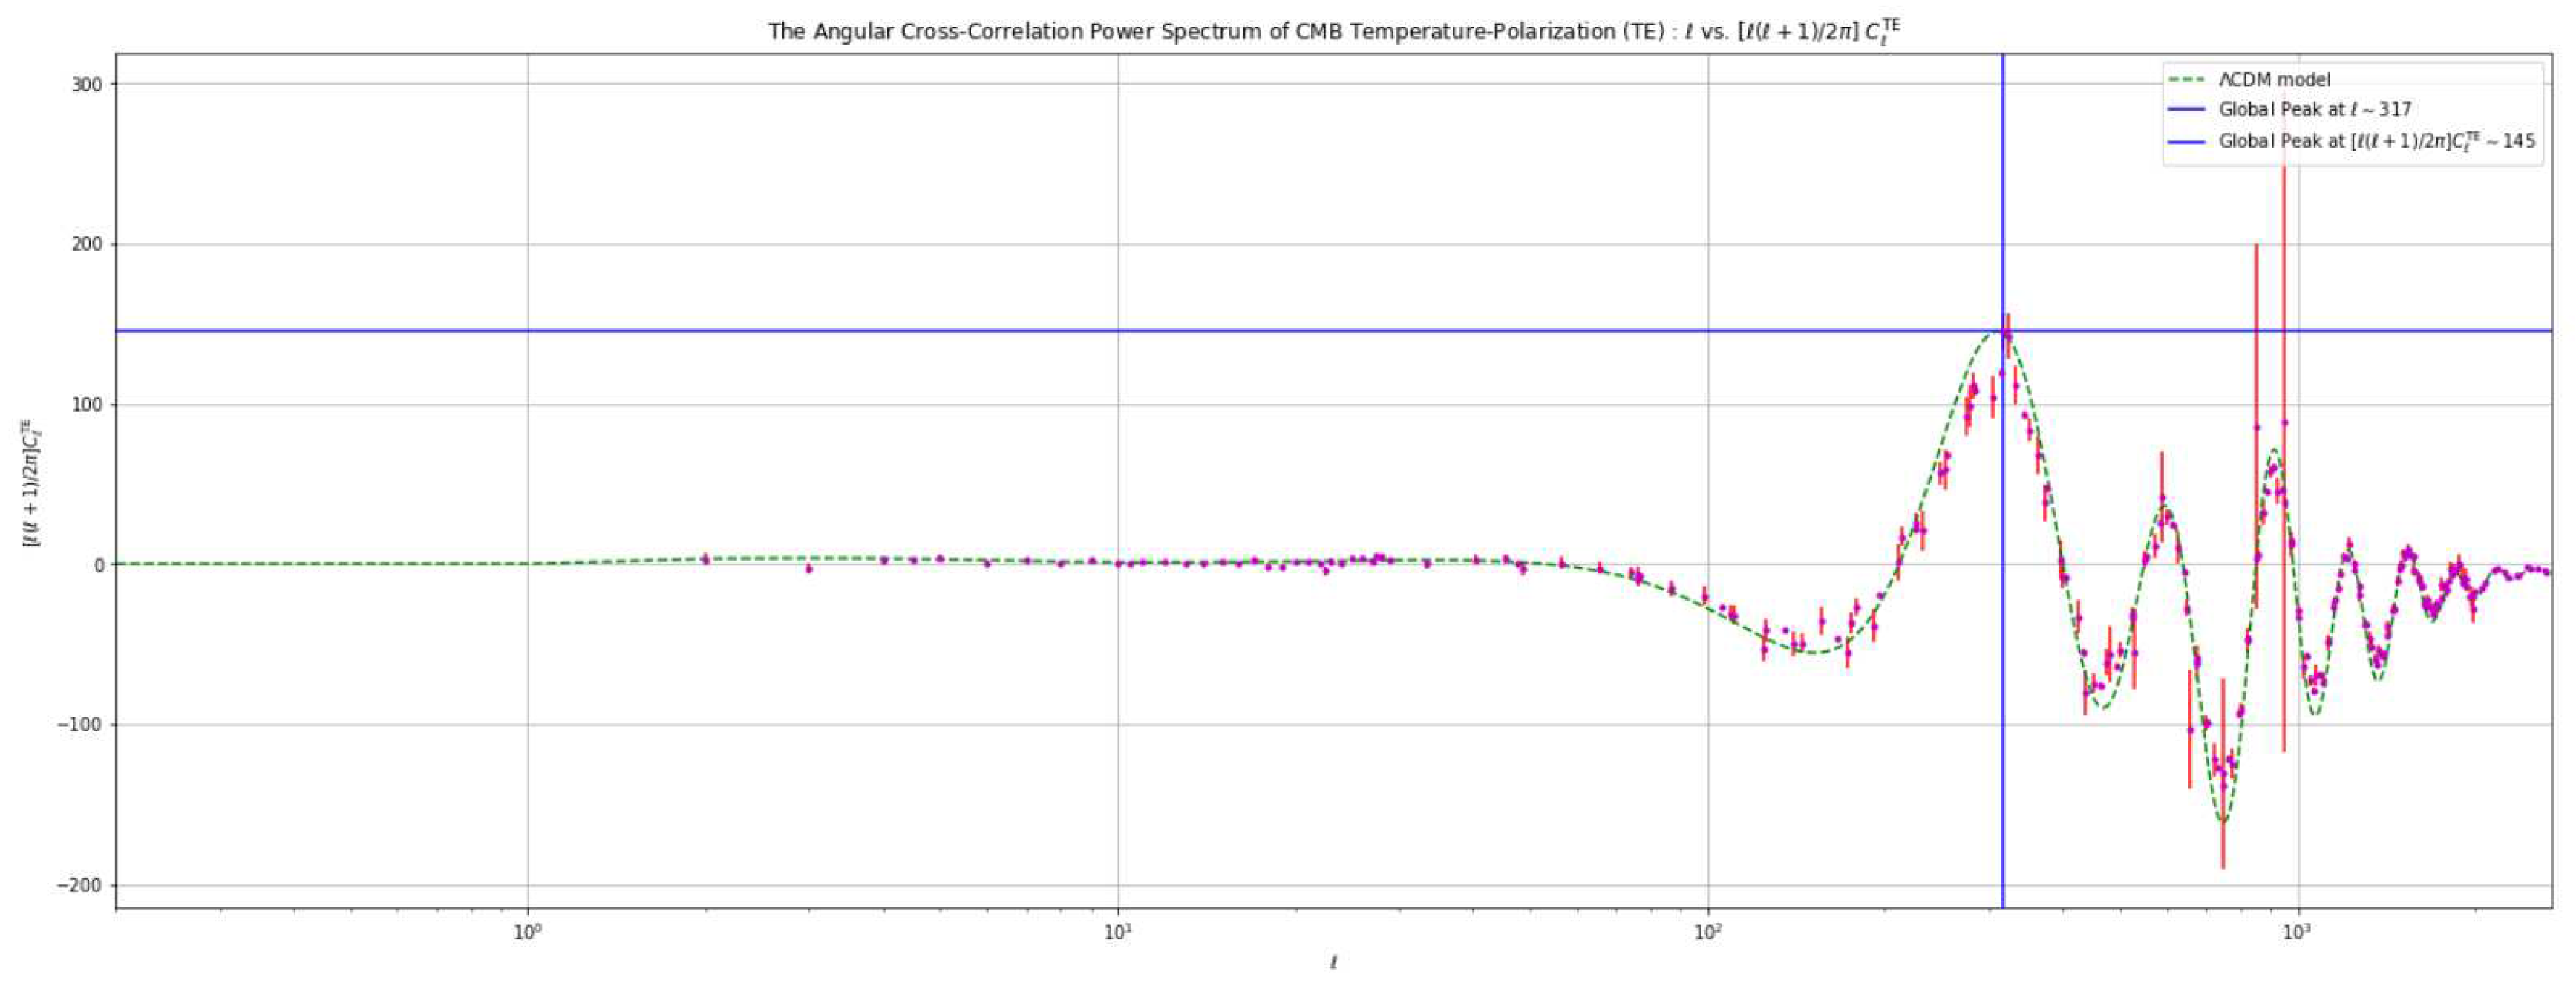
Figure 13.
TE Component Power Spectrum Plot
In our analysis of the four power spectrum plots, we have observed that the CDM model provides a remarkable description of the observed behavior of the universe. However, it is crucial to address the disagreements that have been identified. In order to achieve a better fit to the real data, we have embarked on the development of a new model17.
Prior to developing this new model, we are intrigued by the idea of conducting an analysis that involves varying the value of the Hubble constant, denoted as , within a range of 51 to 100 . By exploring different values of , we aim to ascertain its impact on the power spectrum and evaluate how well it aligns with the observed data. This analysis will enable us to assess the sensitivity of the power spectrum to variations in the Hubble constant and potentially gain insights into the true value of that best matches the real observations.
By undertaking this comprehensive analysis, which includes developing a new model and investigating the influence of on the power spectrum, we strive to refine our understanding of the universe’s behavior and achieve a more accurate representation of the observed data.
4.3. Analysis Based on Varying the Value of the Hubble Constant ()
In this section, we embark on an insightful analysis to investigate the influence of the Hubble constant, denoted as , on the power spectrum. We aim to comprehend how different values of affect the observed power spectrum, which provides essential insights into the structure and evolution of the universe.
To delve into this exploration, we will consider real data points that have been meticulously plotted. By juxtaposing these data points with varying values of , we can discern any discernible patterns, correlations, or discrepancies between the observed power spectrum and the Hubble constant.
By systematically analyzing the relationship between and the power spectrum, we hope to shed light on the intricate interplay between cosmic parameters and their impact on the observed data. This investigation is crucial for refining our new model.
TT Power Spectrum Figure 14 presents the TT power spectrum, depicting the influence of different values of the Hubble constant () on the CDM model. This analysis reveals an intriguing pattern that provides valuable insights into the impact of the Hubble constant on the CDM model.
For = 51 , the corresponding profile is represented by a dotted blue line. Notably, this profile shows a leftward shift for all observed peaks. Furthermore, for lower values of ℓ, the profile starts from a higher initial value. Additionally, all values of tend to converge around 20.
Conversely, when is set to 100 , the profile exhibits rightward shifts for all peaks. Moreover, in the lower range of smaller ℓ values, the profile descends towards the bottom and displays a distinct horizontal trend. This pattern is continued to follow from smaller values (51 ) to larger values (100 ) of .
EE Power Spectrum The power spectrum of EE (electric-like) fluctuations is depicted in Figure 15. Initially, for all the examined values of the parameter , the power spectrum follows a constant trend until 260. After that point, we start to notice distinct profiles for different values of .
Specifically, let’s focus on the blue dotted line representing = 51 . In the EE power spectrum, this value exhibits a lower starting point and the peaks are shifted towards the right, in contrast to the TT (temperature-like) power spectrum. On the other hand, for = 100 , we observe a higher initial value and the peaks are shifted towards the left.
This pattern continues for all the other values of , which fall within the range of = 51 to 100 (km s).
BB Power Spectrum The BB (B-type polarization) power spectrum is illustrated in Figure 16. Similar to the EE plot, the power spectrum remains at a constant value of zero until 120. After that point, distinctive profiles emerge for different values of .
Specifically, let’s focus on the lower value of = 51 (km s), where the profile exhibits the highest amplitude. Conversely, for = 100 (km s), the profile is on the lowest amplitude.
This pattern persists for all the other values of falling within the range of the lowest and highest amplitudes.
TE Power Spectrum The TE power spectrum shown in Figure 17 illustrates how variations in impact the TE power spectrum. For small values of ℓ, the profile remains close to the null value, which persists until around . Beyond this point, the profile takes on negative values and exhibits subsequent peaks and valleys. Notably, for = 51, km s, the profile shifts towards the right, while for a higher value of = 100, km s, the profile shifts towards the left. This pattern is observed for Hubble constant values lying between 51 and 100 km s.
4.4. Real Data Measurements via MCMC Technique
Numerous large-scale survey missions have been dedicated to exploring the properties of the Cosmos on a grand scale. In this regard, we will examine the measurements obtained from three notable survey missions: WMAP, Planck, and DES. Specifically, we will utilize the data from these missions to construct MCMC Triangle/corner plots, which are essential for investigating the interdependencies among various cosmic parameters.
Through analysis of MCMC Triangle/corner plots, we can derive valuable insights into the relationships between fundamental quantities and their influence on the broader cosmological framework. Let’s explore the missions in context, including their positions, mode of operation, and the cosmological parameters they have focused on.
-
Wilkinson Microwave Anisotropy Probe (WMAP)WMAP was a significant survey mission launched in 2001 and operated until 2010. It was positioned in the L2 orbit to minimize exposure to solar radiation. The primary objective of WMAP was to analyze temperature fluctuations in the Cosmic Microwave Background (CMB). Figure 18 showcases a corner plot displaying ten parameters (, , , , , , , , , ) measured by the WMAP probe, highlighting their correlations. The first column of the plot reveals variations in the Hubble constnat with variations in other cosmological parameters. Notably, these measurements have a value of zero. Furthermore, the value of amounts to 0.000645.
-
Planck Large Scale Survey MissionThe Planck survey mission, which commenced in 2009 and operated until 2013, was another significant endeavor in the field of cosmology. Similar to WMAP, Planck was also positioned in the L2 orbit around Earth. This satellite leveraged the Cosmic Microwave Background (CMB) to obtain measurements of great importance. The corner plot depicted in Figure 19 showcases ten parameters (, , , , , , , , , ) measured by the Planck mission. In particular, the first column of the plot allows us to assess the correlation between the Hubble constant and various cosmological parameters. This analysis provides valuable insights into the relationship between the Hubble constant and other fundamental aspects of the universe. Moreover, the value of is found to be 0.000645.
-
Dark Energy Survey (DES)The DES (Dark Energy Survey) mission was launched in 2013 and successfully operated until 2019. This survey primarily utilized measurements from Type Ia supernovae and baryon acoustic oscillations (BAO) to capture data from the late universe. The results obtained from DES are presented in Figure 20, which highlights the nine parameters (, , , , A, , , , ) that were measured made by the DES mission. In this figure, the uncertainties in the measurements are more pronounced, providing valuable insights into the precision of the data. Specifically, the first column of the plot illustrates variations in the value of the Hubble constant in relation to other cosmological parameters. This analysis offers a comprehensive understanding of how the Hubble constant interacts with various aspects of the universe. Additionally, the value of is found to be 0.000645.
5. Discussion and Conclusions
In this study, we have comprehensively explored the CDM model with varying Hubble constant. Successfully fitting the CDM model to real observational measurements allowed us to identify certain discrepancies that warrant further investigation. These disagreements hold the potential to offer insights for modifying the CDM model. Consequently, we have proposed the need for a new cosmological model to address these discrepancies and achieve a better understanding of our Universe.
The utilization of MCMC analysis has proven to be highly beneficial, providing quantitative insights into how different cosmological parameters influence each other. Notably, the Hubble tension remains a compelling topic for future research. To gain deeper insights and test new theories and cosmological models, we emphasize the necessity for more extensive survey mission data.
In conclusion, this study has enhanced our understanding of the CDM model and has set the stage for further research to address the identified disagreements and explore new cosmological avenues. The potential for advancements in our comprehension of the Universe is promising, fueled by the pursuit of more accurate cosmological models and comprehensive data analysis techniques.
Acknowledgments
This report consists of twenty-three pages, wherein I present potential solutions for the Hubble Tension. As part of my summer internship project, I conducted an analysis of real data. I am immensely grateful to the IAS, INSA, and NAS for awarding me the Fellowship, which enabled me to pursue this research. I extend my sincere appreciation to Dr. Debasis Borah for his invaluable guidance throughout my internship. I would also like to express my gratitude to Dr. Biswajit Paul, my remarkable teacher, and Dr. Uttam Kumar Bera from NIT Agatala for their unwavering support and mentorship. Lastly, I am indebted to my family and friends for their constant encouragement and support in all my endeavors, pushing me to strive for excellence.
References
- Riess, Adam G., et al. "Large Magellanic Cloud Cepheid standards provide a 1% foundation for the determination of the Hubble constant and stronger evidence for physics beyond ΛCDM." The Astrophysical Journal 876.1 (2019): 85.
- Riess, Adam G., et al. "A comprehensive measurement of the local value of the Hubble constant with 1 kms-1mpc-1 uncertainty from the Hubble space telescope and the sh0es team." The Astrophysical Journal Letters 934.1 (2022): L7.
- Migkas, K., et al. "Cosmological implications of the anisotropy of ten galaxy cluster scaling relations." Astronomy & Astrophysics 649 (2021): A151.
- Wong, Kenneth C., et al. "H0LiCOW–XIII. A 2.4 per cent measurement of H 0 from lensed quasars: 5.3 σ tension between early-and late-Universe probes." Monthly Notices of the Royal Astronomical Society 498.1 (2020): 1420-1439.
- Millon, M., et al. "TDCOSMO-I. An exploration of systematic uncertainties in the inference of H0 from time-delay cosmography." Astronomy & Astrophysics 639 (2020): A101.
- Reid, M. J., et al. "The megamaser cosmology project. IV. A direct measurement of the Hubble constant from UGC 3789." The Astrophysical Journal 767.2 (2013): 154.
- Kuo, C. Y., et al. "The megamaser cosmology project. V. An angular-diameter distance to NGC 6264 at 140 Mpc." The Astrophysical Journal 767.2 (2013): 155.
- Mooley, K. P., et al. "Superluminal motion of a relativistic jet in the neutron-star merger GW170817." Nature 561.7723 (2018): 355-359.
- DLT40 Collaboration Haislip JB 241 Kouprianov VV 241 Reichart DE 241 Tartaglia L. 242 243 Sand DJ 242 Valenti S. 243 Yang S. 243 244 245, and Las Cumbres Observatory Collaboration Arcavi Iair 246 247 Hosseinzadeh Griffin 246 247 Howell D. Andrew 246 247 McCully Curtis 246 247 Poznanski Dovi 248 Vasylyev Sergiy 246 247. "A gravitational-wave standard siren measurement of the Hubble constant." Nature 551.7678 (2017): 85-88.
- Benisty, David, and Denitsa Staicova. "Testing late-time cosmic acceleration with uncorrelated baryon acoustic oscillation dataset." Astronomy & Astrophysics 647 (2021): A38.
- Addison, G. E., et al. "Elucidating Λ CDM: impact of baryon acoustic oscillation measurements on the Hubble constant discrepancy." The Astrophysical Journal 853.2 (2018): 119.
- Poulin, V., Smith, T. L., Karwal, T., & Kamionkowski, M. (2019). Early dark energy can resolve the hubble tension. Physical Review Letters, 122(22), 221301. 22. [CrossRef]
- Niedermann, F., & Sloth, M. S. (2022). Hot new early dark energy: Towards a unified dark sector of neutrinos, dark energy and dark matter. Physics Letters B, 835, 137555. [CrossRef]
- Schöneberg, N., Abellán, G. F., Sánchez, A. P., Witte, S. J., Poulin, V., & Lesgourgues, J. (2022). The H 0 Olympics: A fair ranking of proposed models. Physics Reports, 984, 1–55. [CrossRef]
- Jedamzik, K., & Saveliev, A. (2019). Stringent limit on primordial magnetic fields from the cosmic microwave background radiation. Physical Review Letters, 123(2), 021301. 2. [CrossRef]
- Jedamzik, K., Pogosian, L. & Zhao, GB. Why reducing the cosmic sound horizon alone can not fully resolve the Hubble tension. Commun Phys 4, 123 (2021). [CrossRef]
- T. Sekiguchi and T. Takahashi, “Early recombination as a solution to the H0 tension,” Phys. Rev. D, vol. 103, no. 8, p. 083507, 2021.
- J.-P. Uzan, “The Fundamental Constants and Their Variation: Observational Status and Theoretical Motivations,” Rev. Mod. Phys., vol. 75, p. 403, 2003.
- M. Park, C. D. Kreisch, J. Dunkley, B. Hadzhiyska, and F.-Y. Cyr-Racine, “ΛCDM or self-interacting neutrinos: How CMB data can tell the two models apart,” Phys. Rev. D, vol. 100, no. 6, p. 063524, 2019.
- S. Ghosh, R. Khatri, and T. S. Roy, “Can dark neutrino interactions phase out the Hubble tension?,” Physical Review D, vol. 102, p. 123544, Dec. 2020.
- Archidiacono, M., & Gariazzo, S. (2022). Two sides of the same coin: Sterile neutrinos and dark radiation. Status and perspectives. Universe, 8(3), 175. [CrossRef]
| 1 | Recombination refers to the period when ions cooled down sufficiently to combine, forming neutral hydrogen atoms. |
| 2 | Baryon Acoustic Oscillations (BAO): These are the imprints of primordial acoustic waves that were frozen in the early universe’s density distribution. The characteristic scale of BAO is extracted via Fourier analysis. It serves as a standard ruler for measuring the history of the universe’s expansion and prohibiting dark energy. |
| 3 | Nucleosynthesis is the process by which light elements were formed in the early universe, and its predictions align with the observed abundance of certain elements, such as hydrogen and helium. |
| 4 | The diffusion of photons occurs due to the unimpeded motion of electrons in the early universe and the limited thickness of the photon-baryonic fluid |
| 5 | Re-ionization refers to the process when the initially neutral hydrogen in the universe becomes ionized by the first light sources, such as stars and quasars. |
| 6 | |
| 7 | The potential wells and hills observed are a consequence of density fluctuations. These fluctuations can be likened to a spring-mass system, where the baryon mass acts as the loaded mass and the photon pressure represents the spring. |
| 8 | adding mass to the baryon |
| 9 | Gravitational Waves: Ripples in the spacetime fabric. |
| 10 | Post-doc at the Centre for Particle Cosmology at the University of Pennsylvania.(https://tanvikarwal.wordpress.com/) |
| 11 | |
| 12 | |
| 13 | Dark Energy Survey |
| 14 | |
| 15 | |
| 16 | LAMBDA - TE and EE Power Spectrum Plot Data Sources. (n.d.). LAMBDA - TE and EE Power Spectrum Plot Data Sources. Retrieved June 7, 2023, from https://lambda.gsfc.nasa.gov/education/lambda-graphics/more/te-spectrum-source.html
|
| 17 | *THE NEW MODEL IS A TOPIC OF FURTHER RESEARCH AND HOLDS ITS IMPORTANCE BEYOND THE SCOPE OF THIS 2 MONTHS INTERNSHIP* |
Figure 1.
Interactions between different particle species
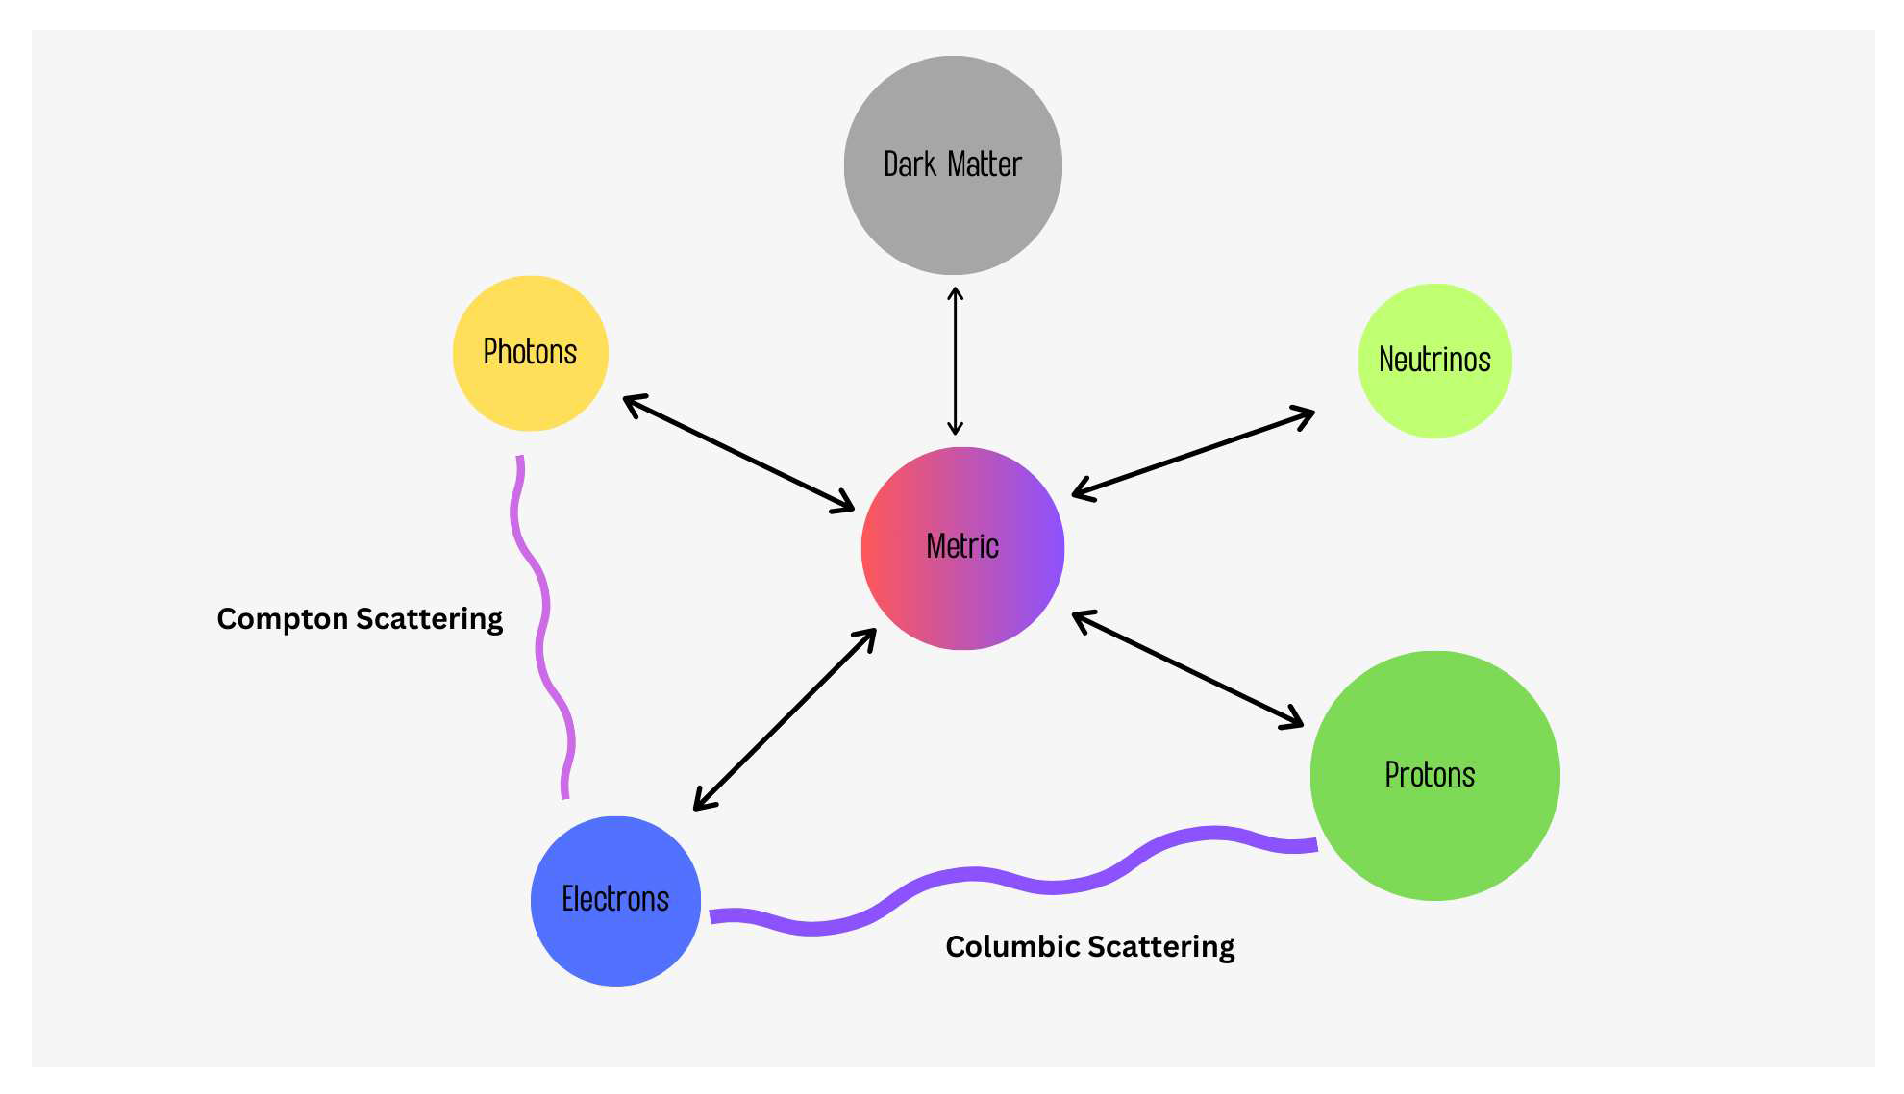
Figure 2.
Visualization of CMB
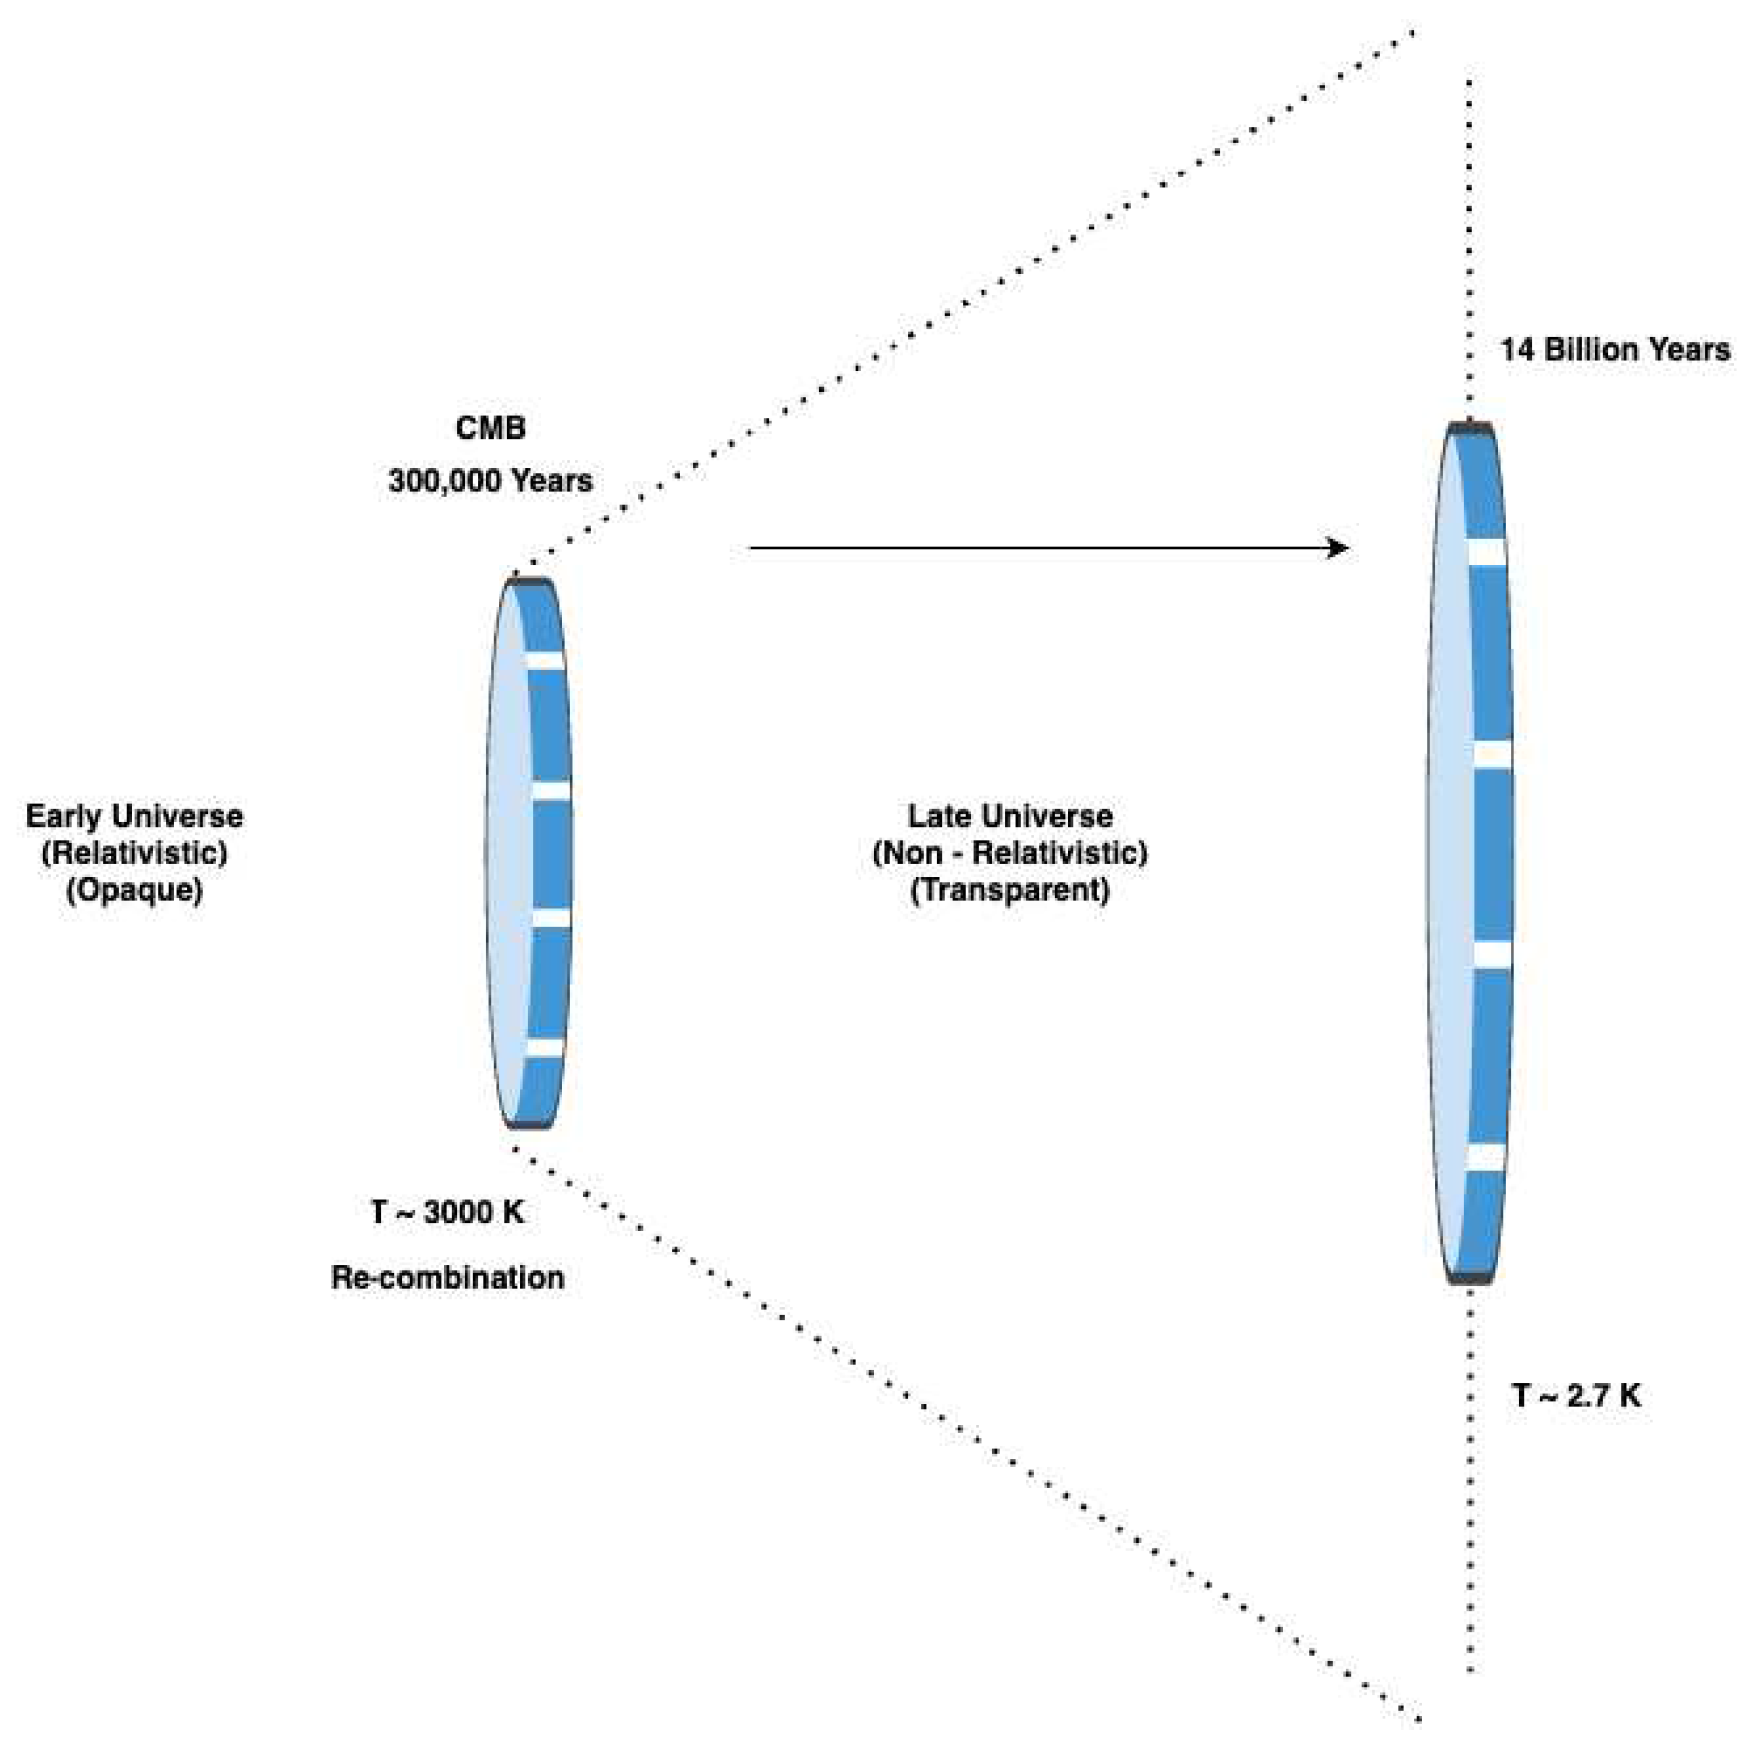
Figure 3.
E-mode and B-mode polarization
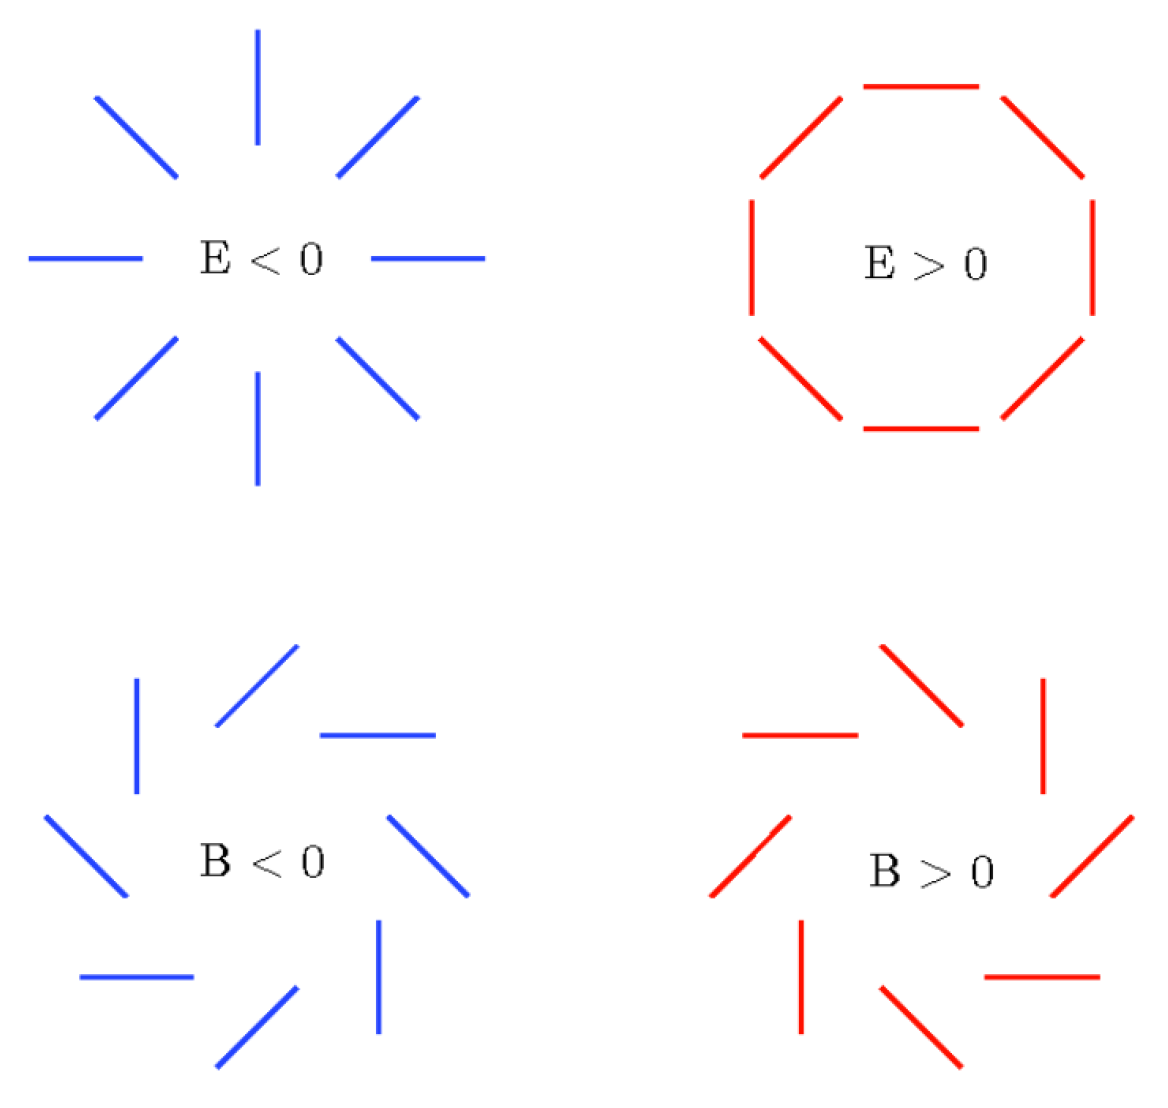
Figure 4.
The Variation in measured value of
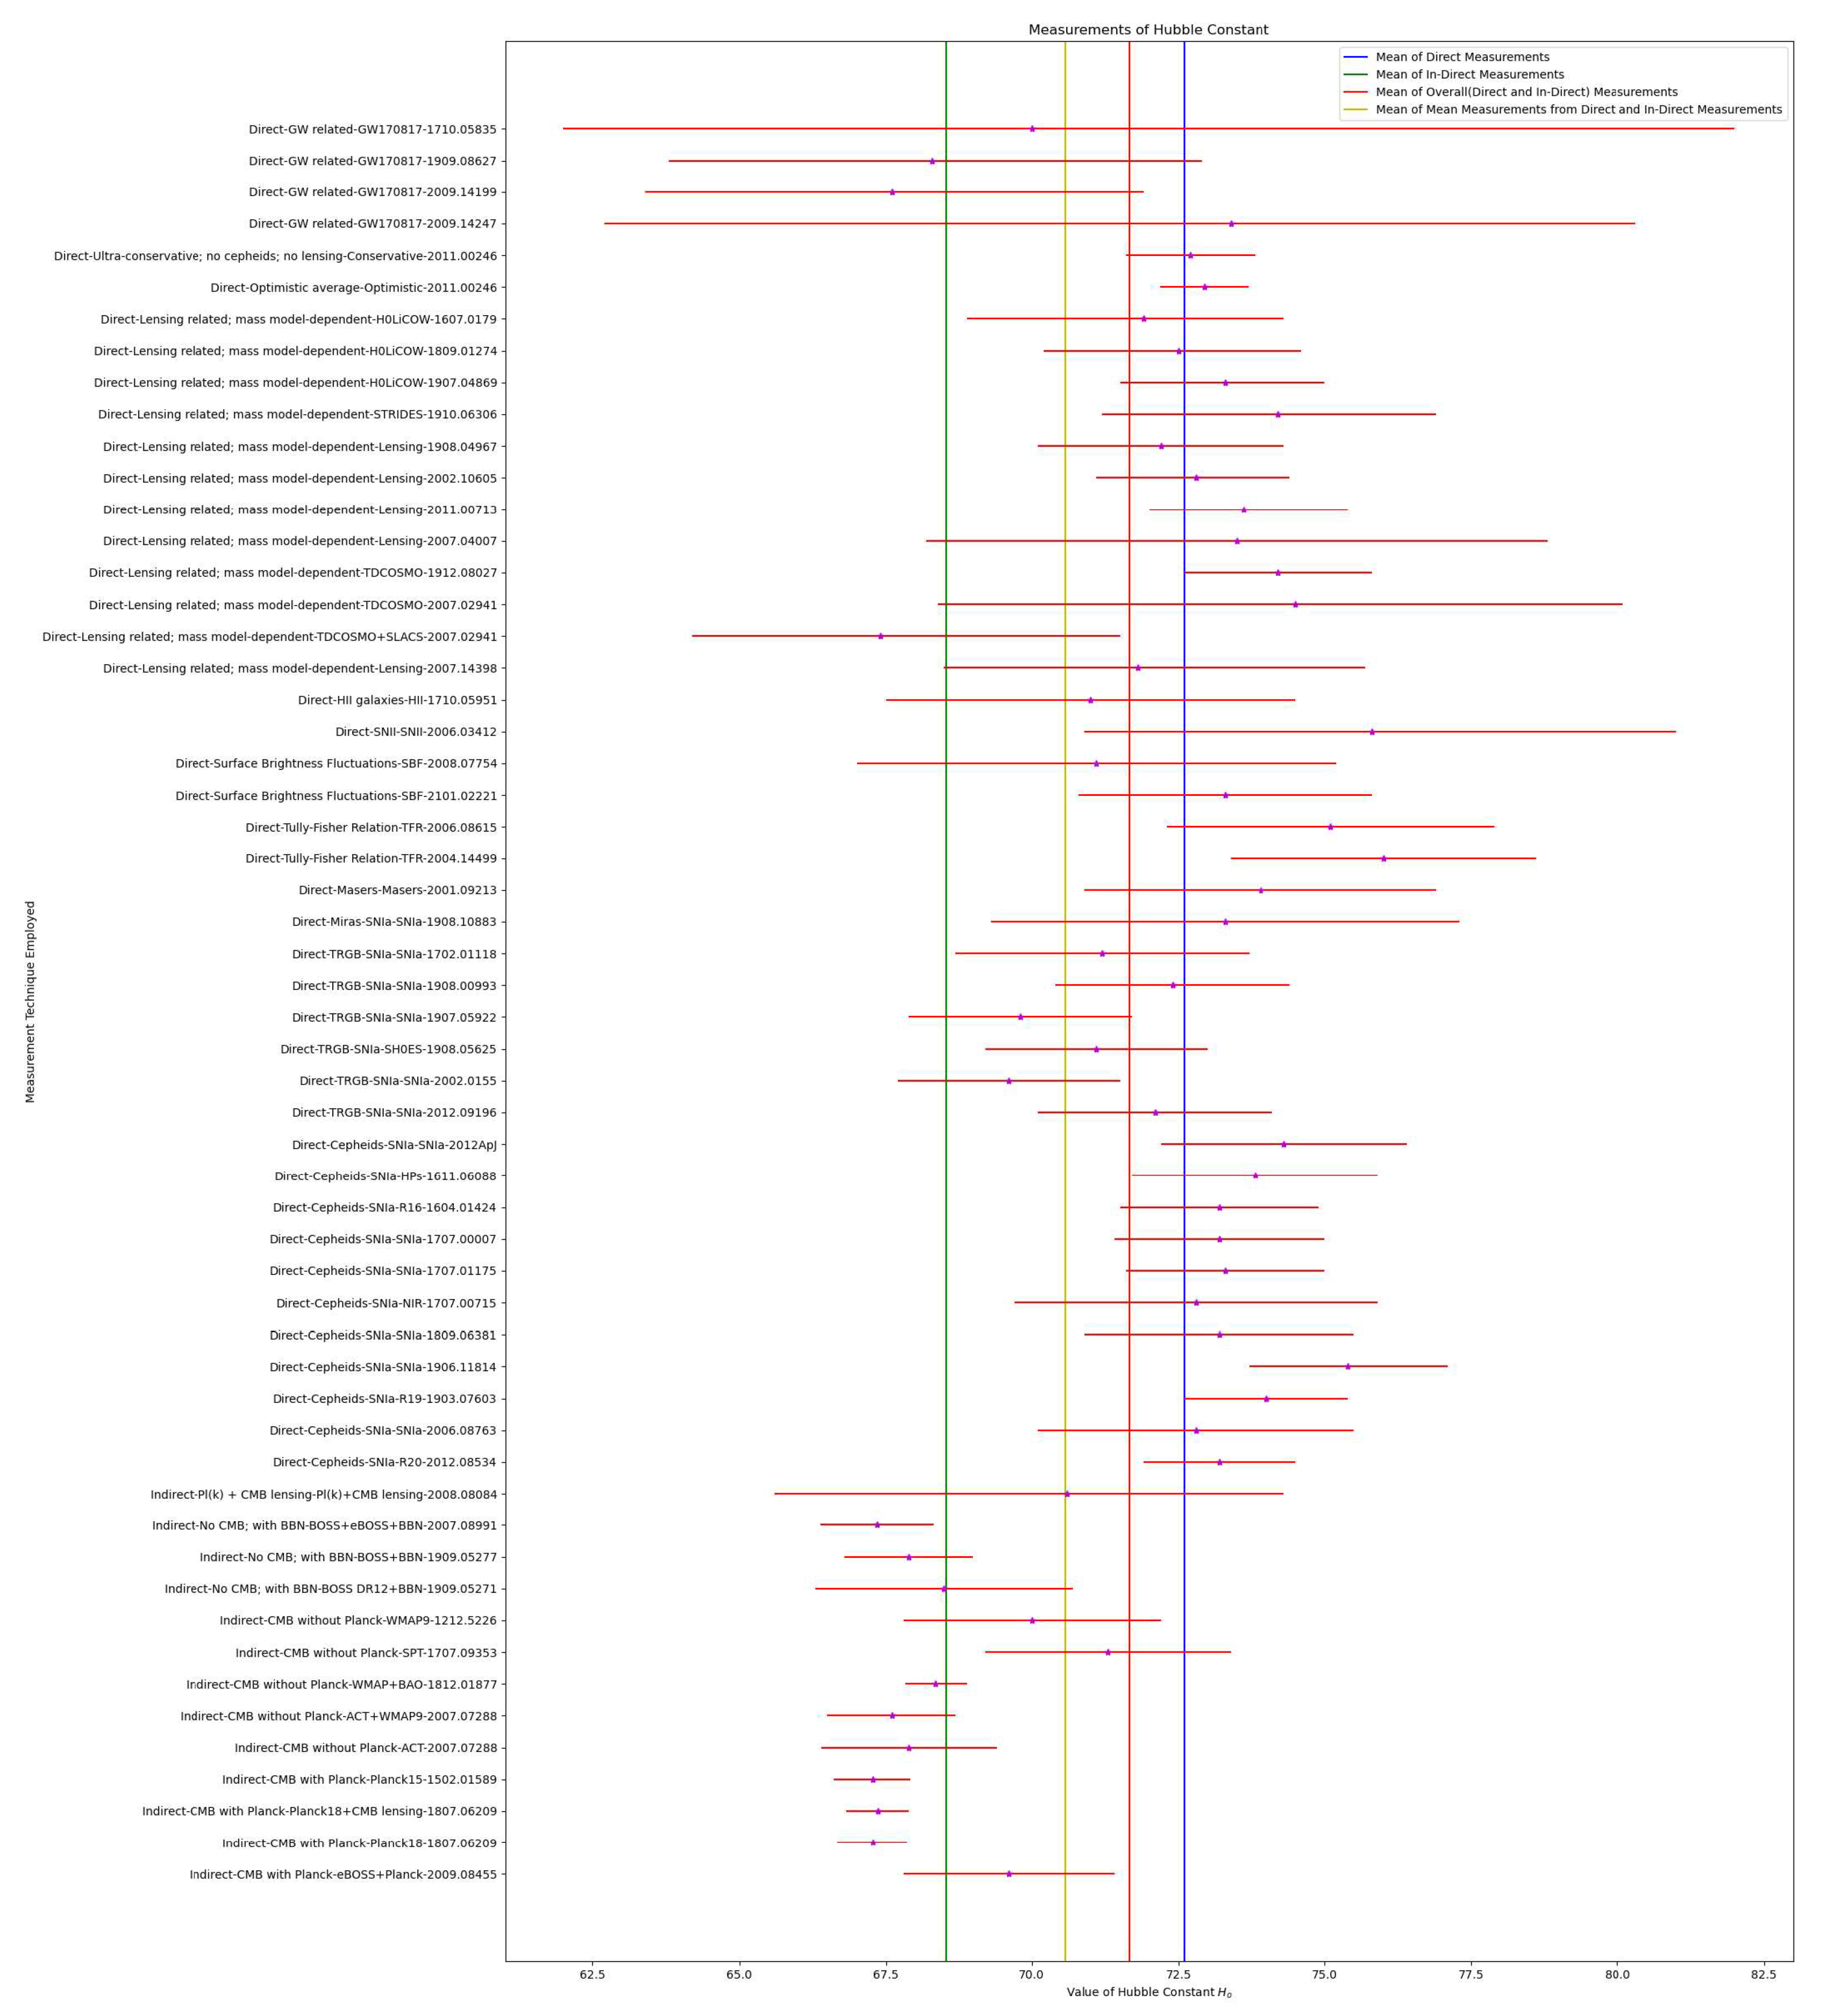
Figure 5.
Visualization for Image credits: Tristan L. Smith
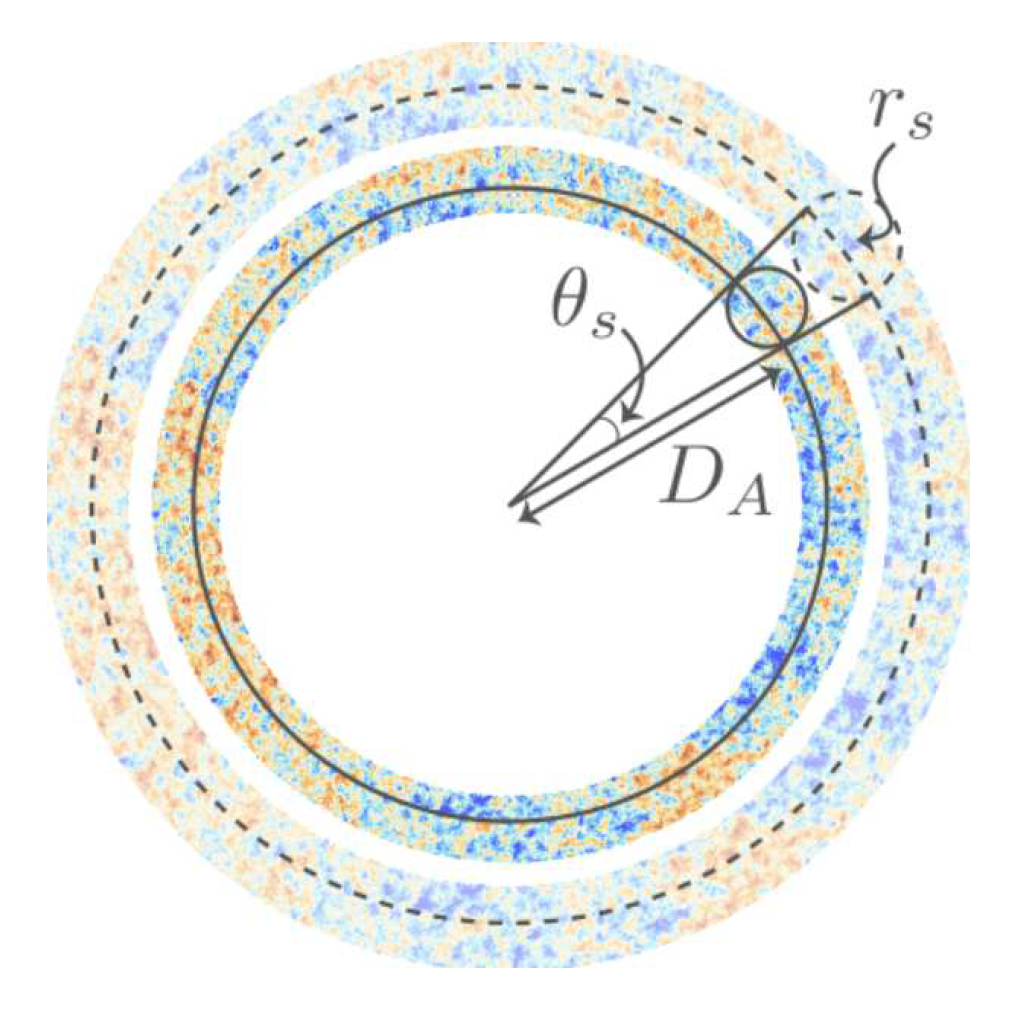
Figure 7.
Power Spectrum Components by CDM
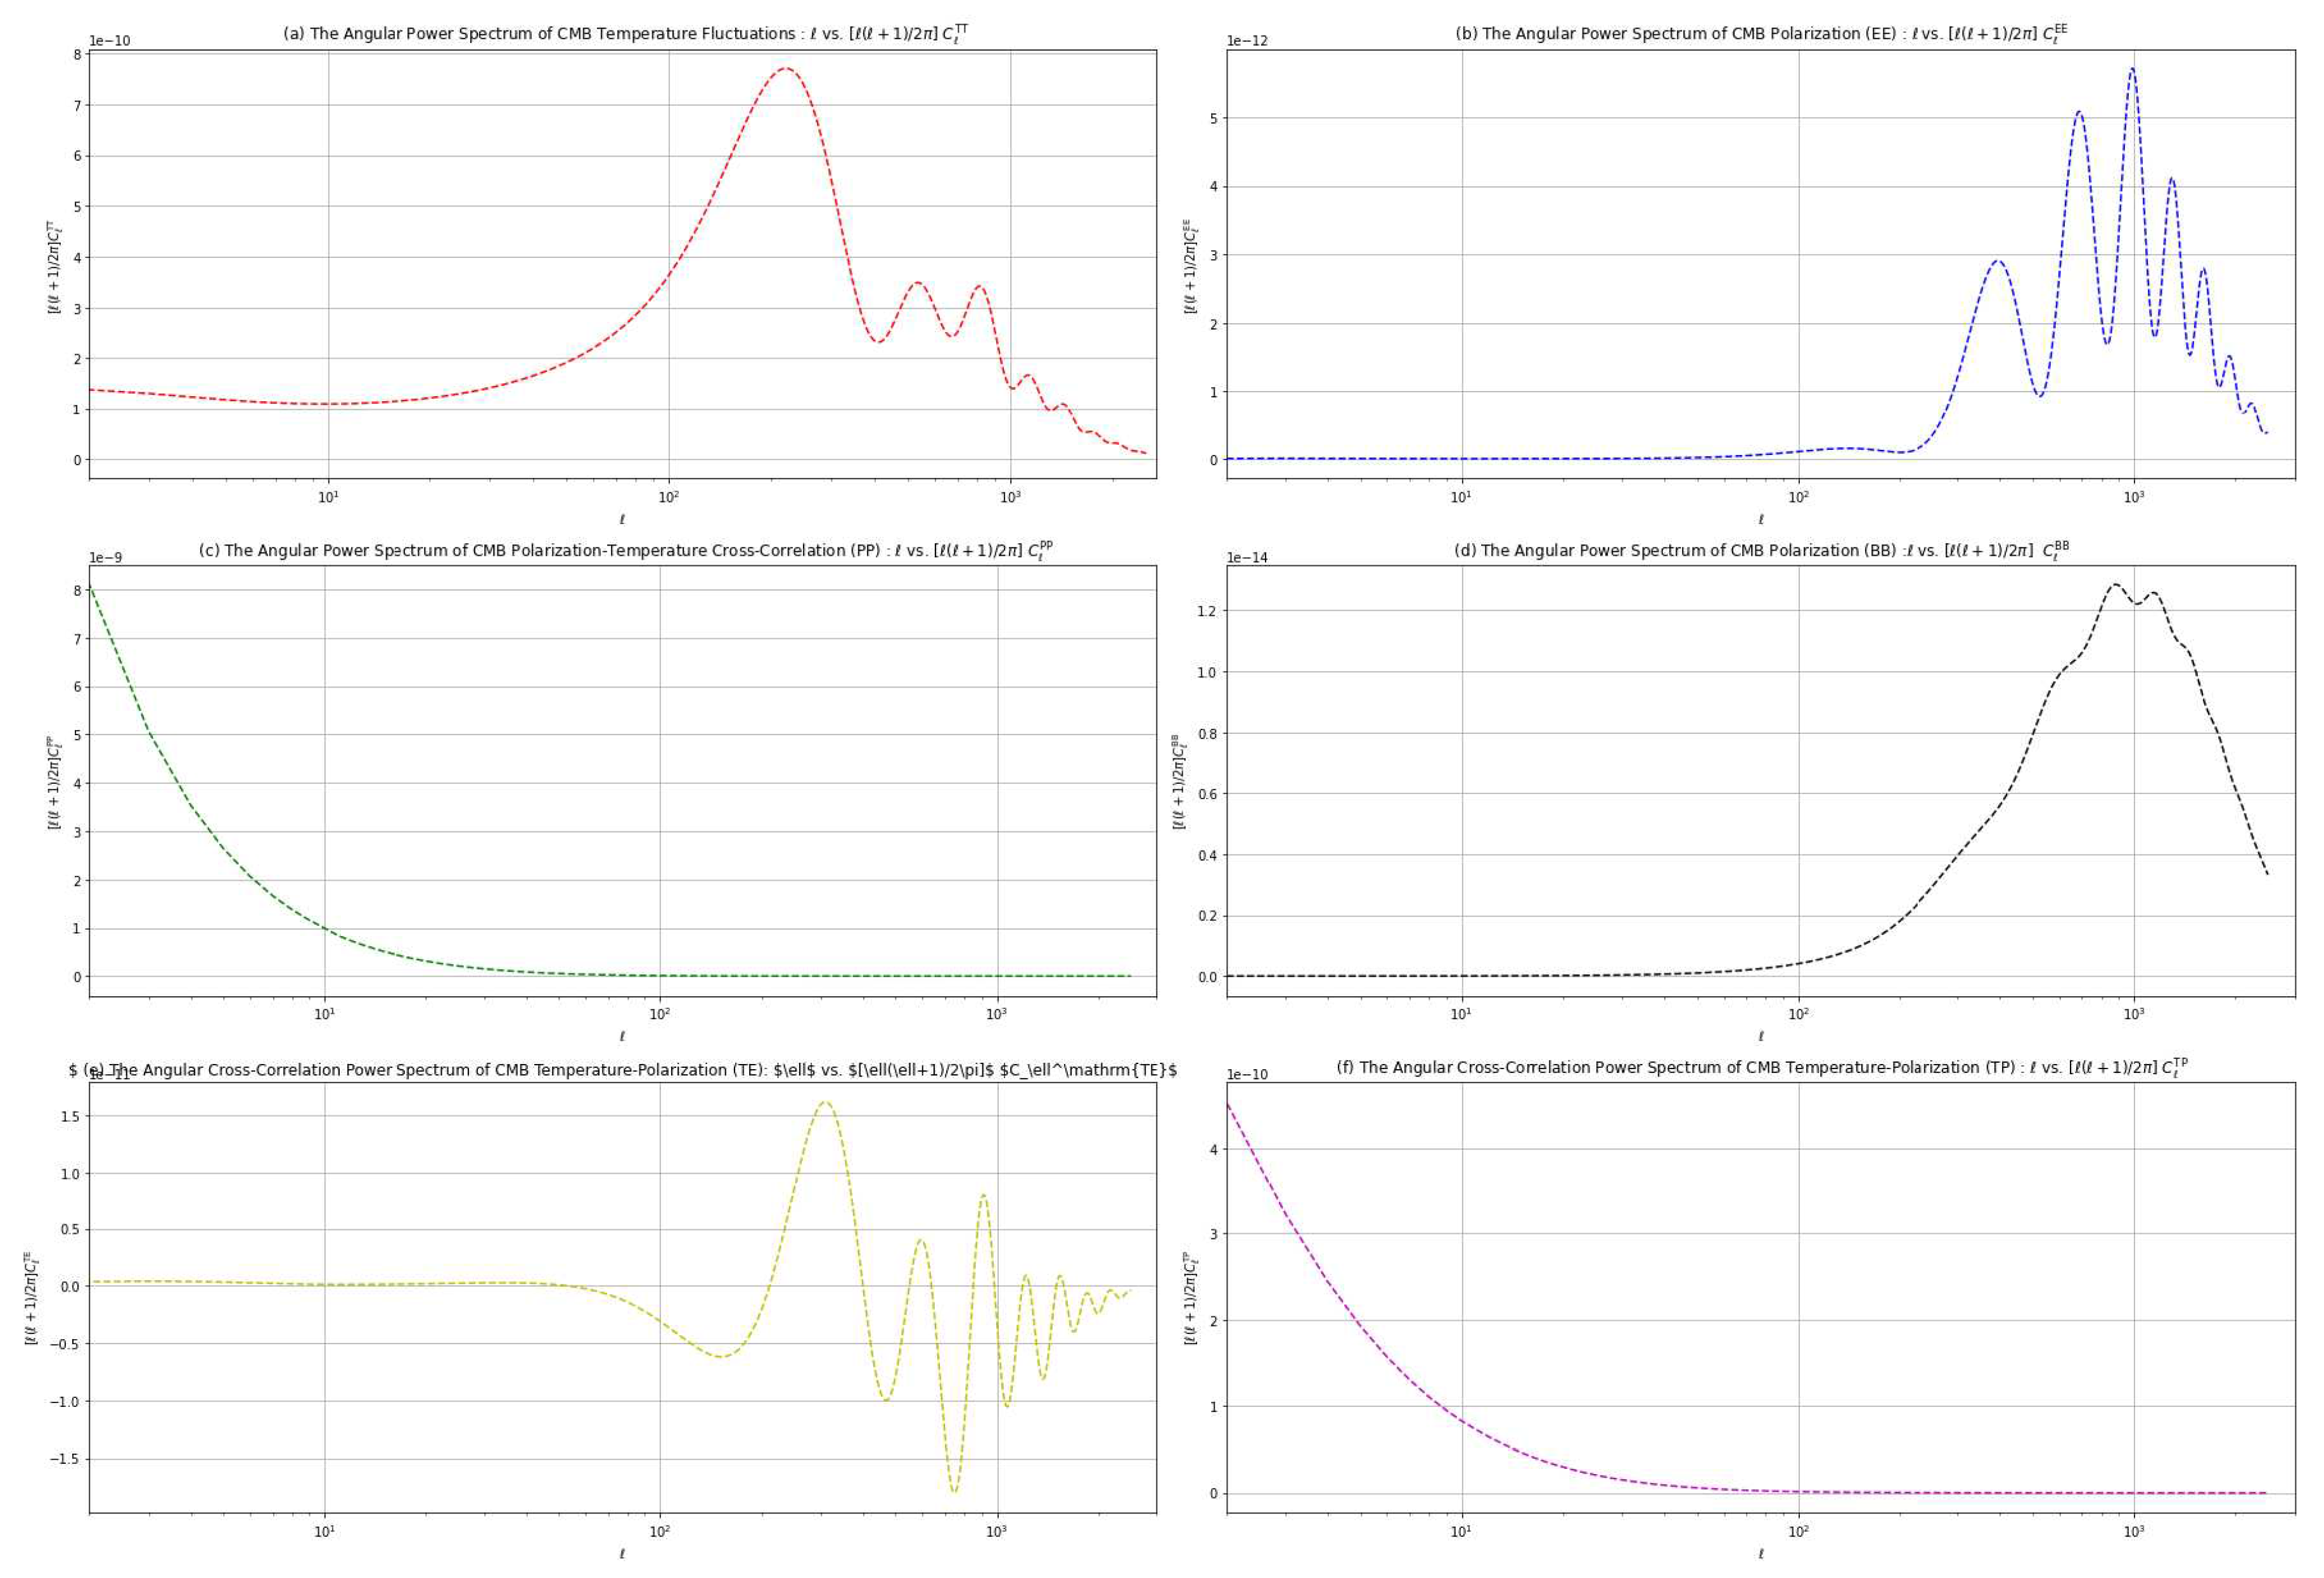
Figure 8.
Evolution of Different Power Spectrum Components with ℓ
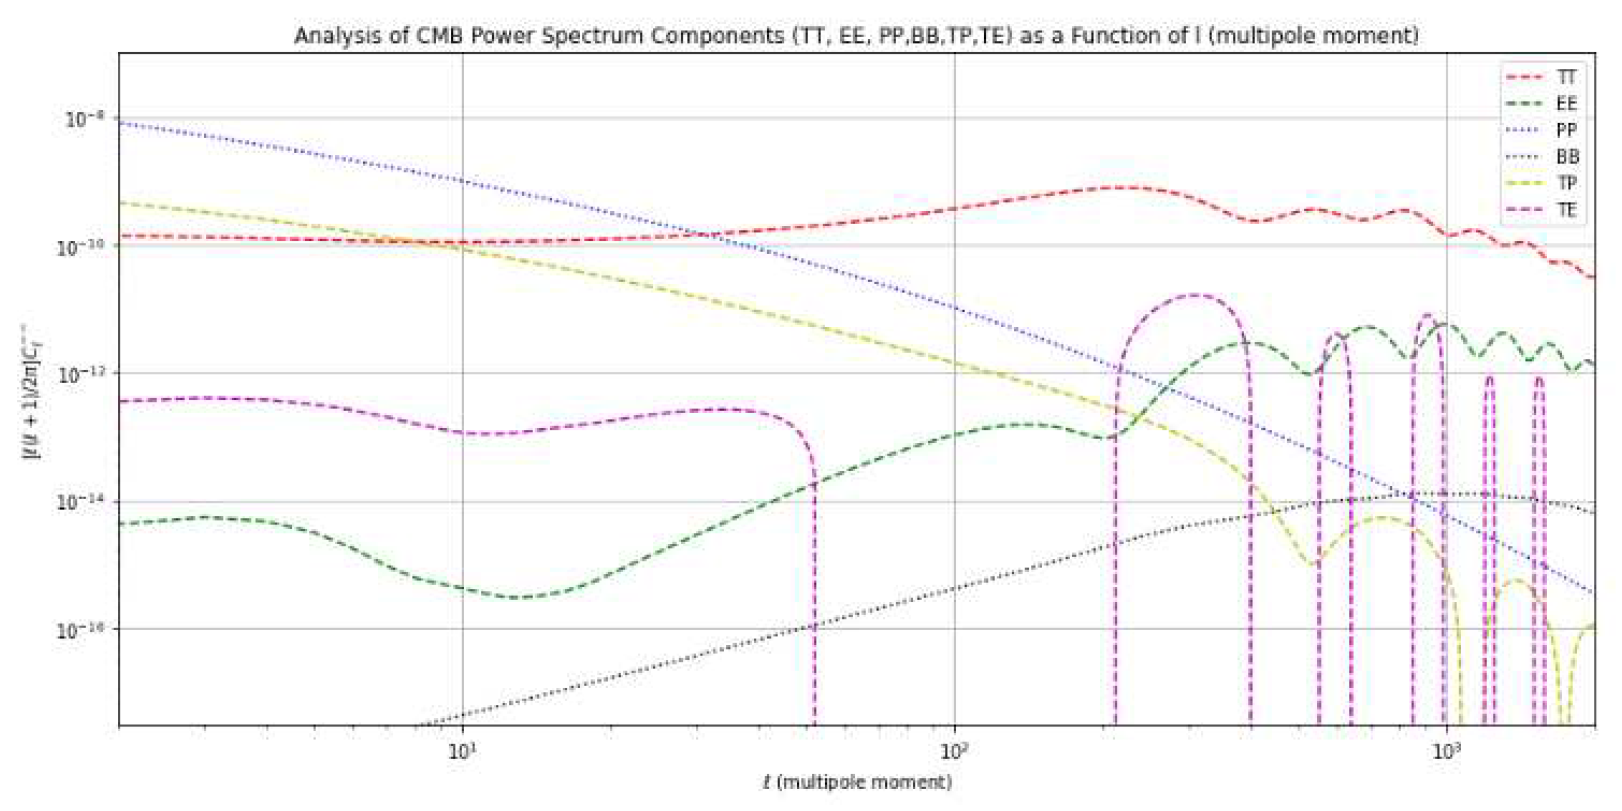
Figure 9.
Linear Matter Power Spectrum
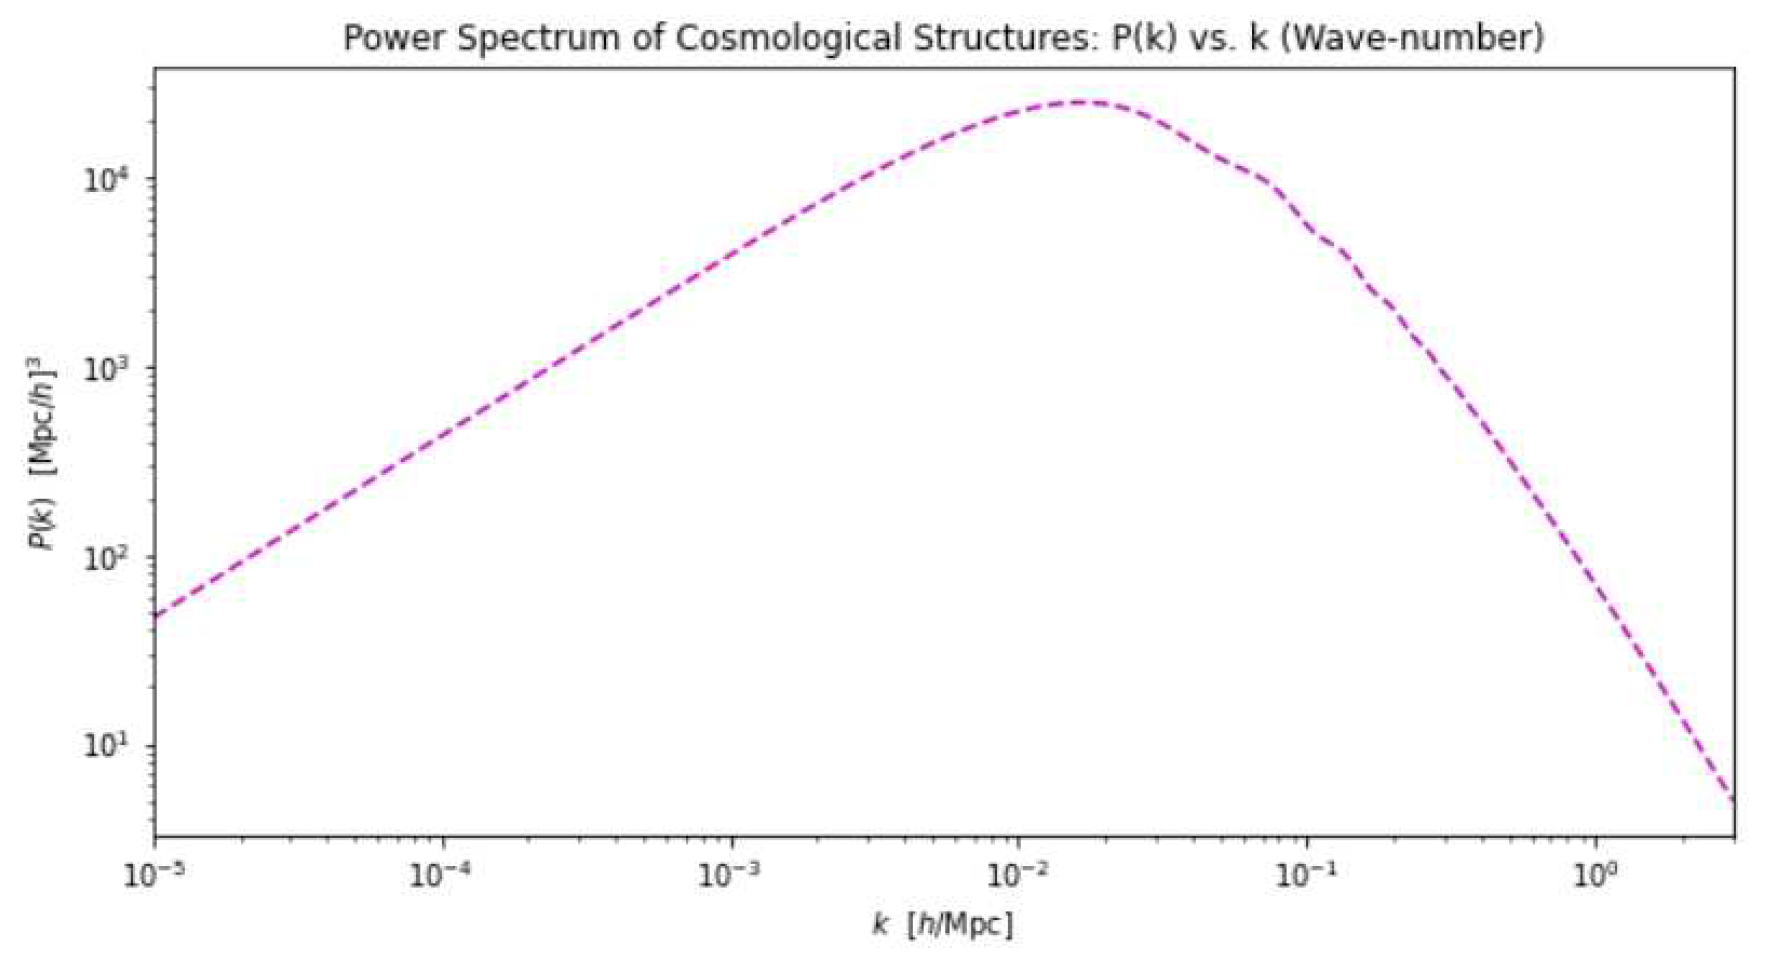
Figure 14.
TT Power Spectrum varying
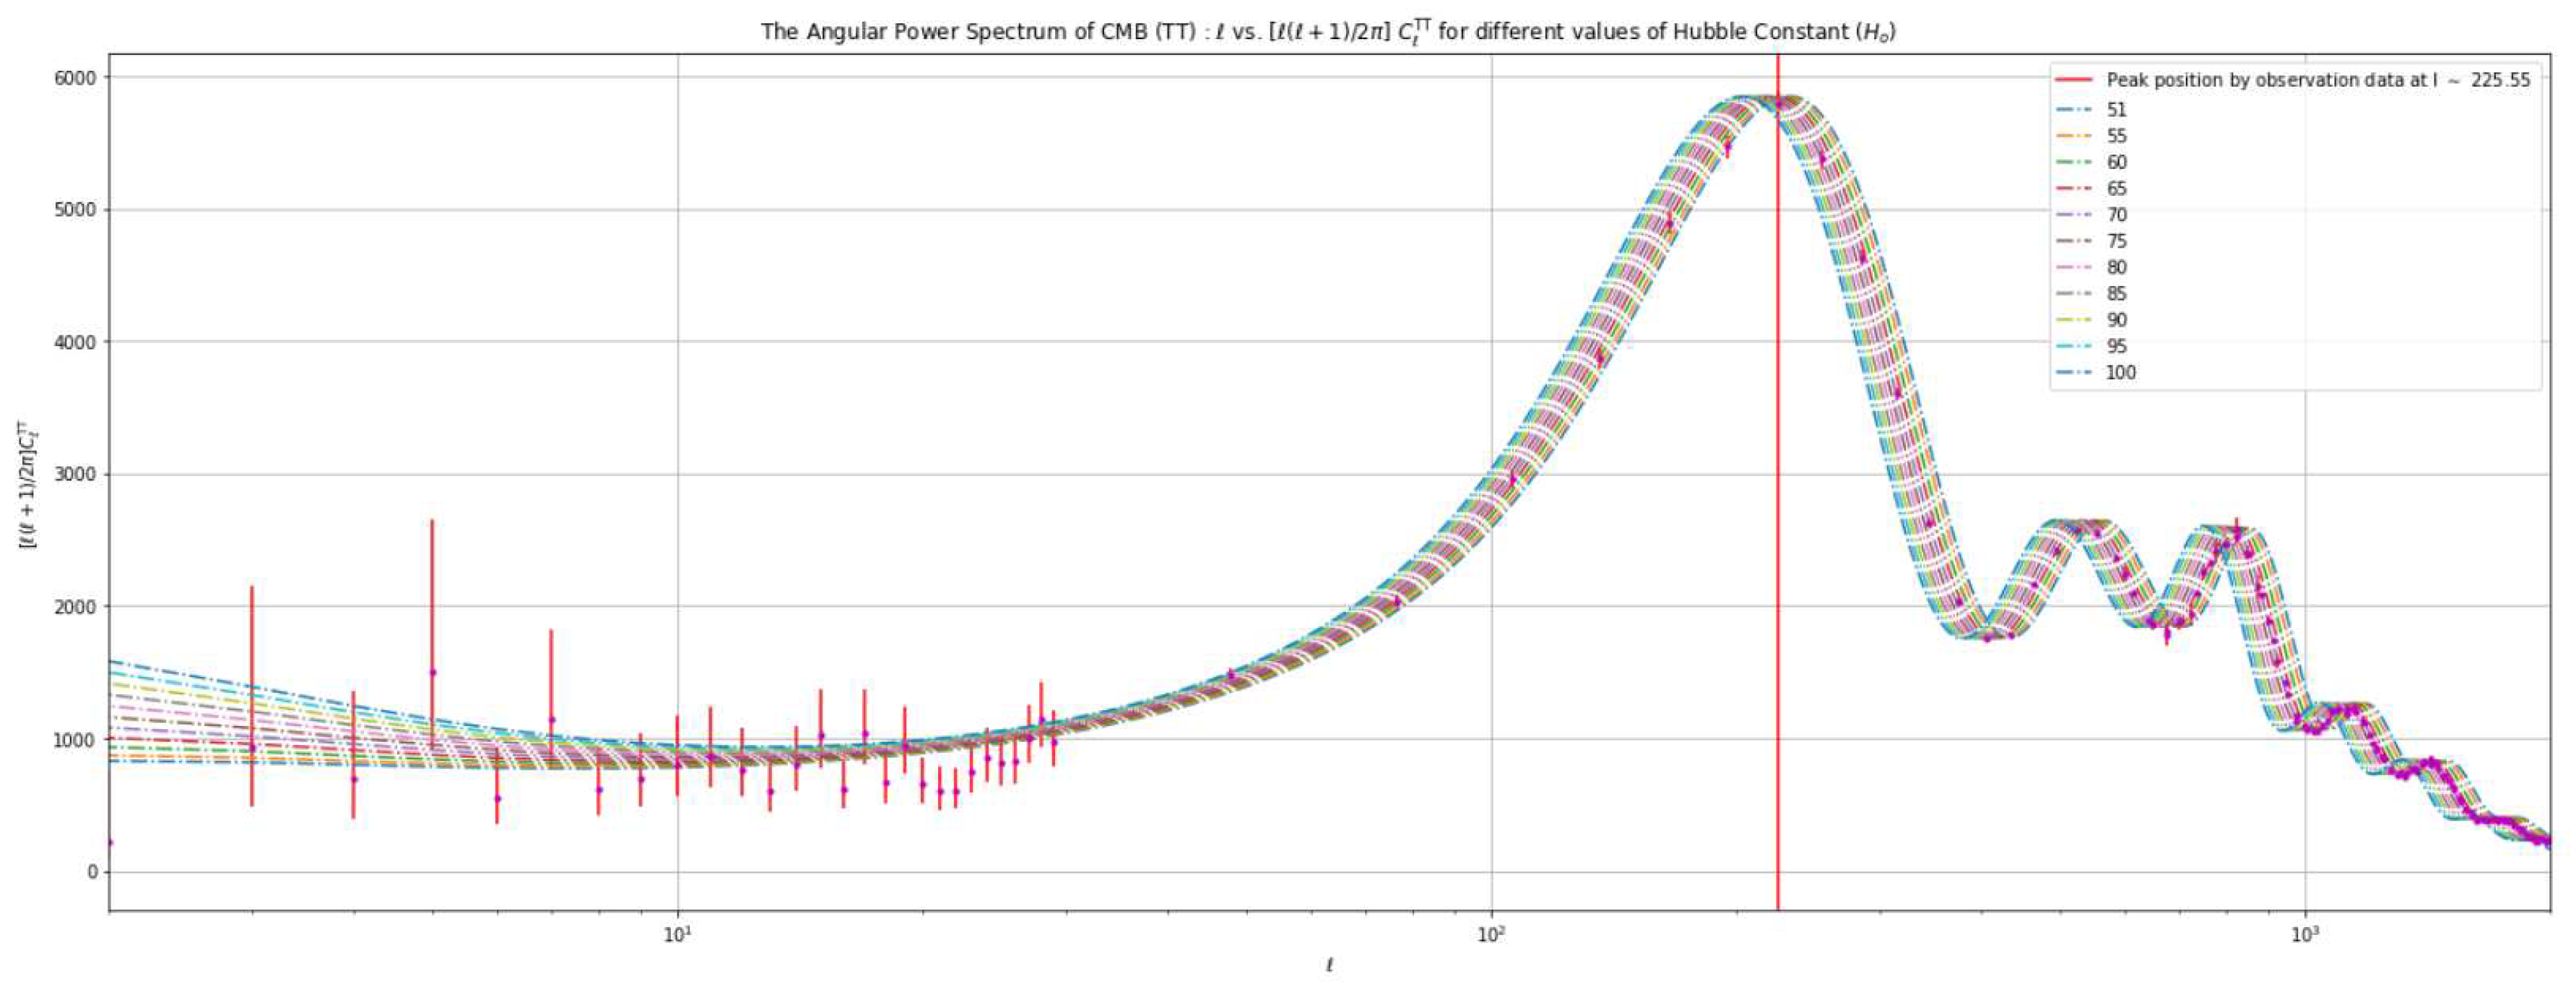
Figure 15.
EE Power Spectrum varying
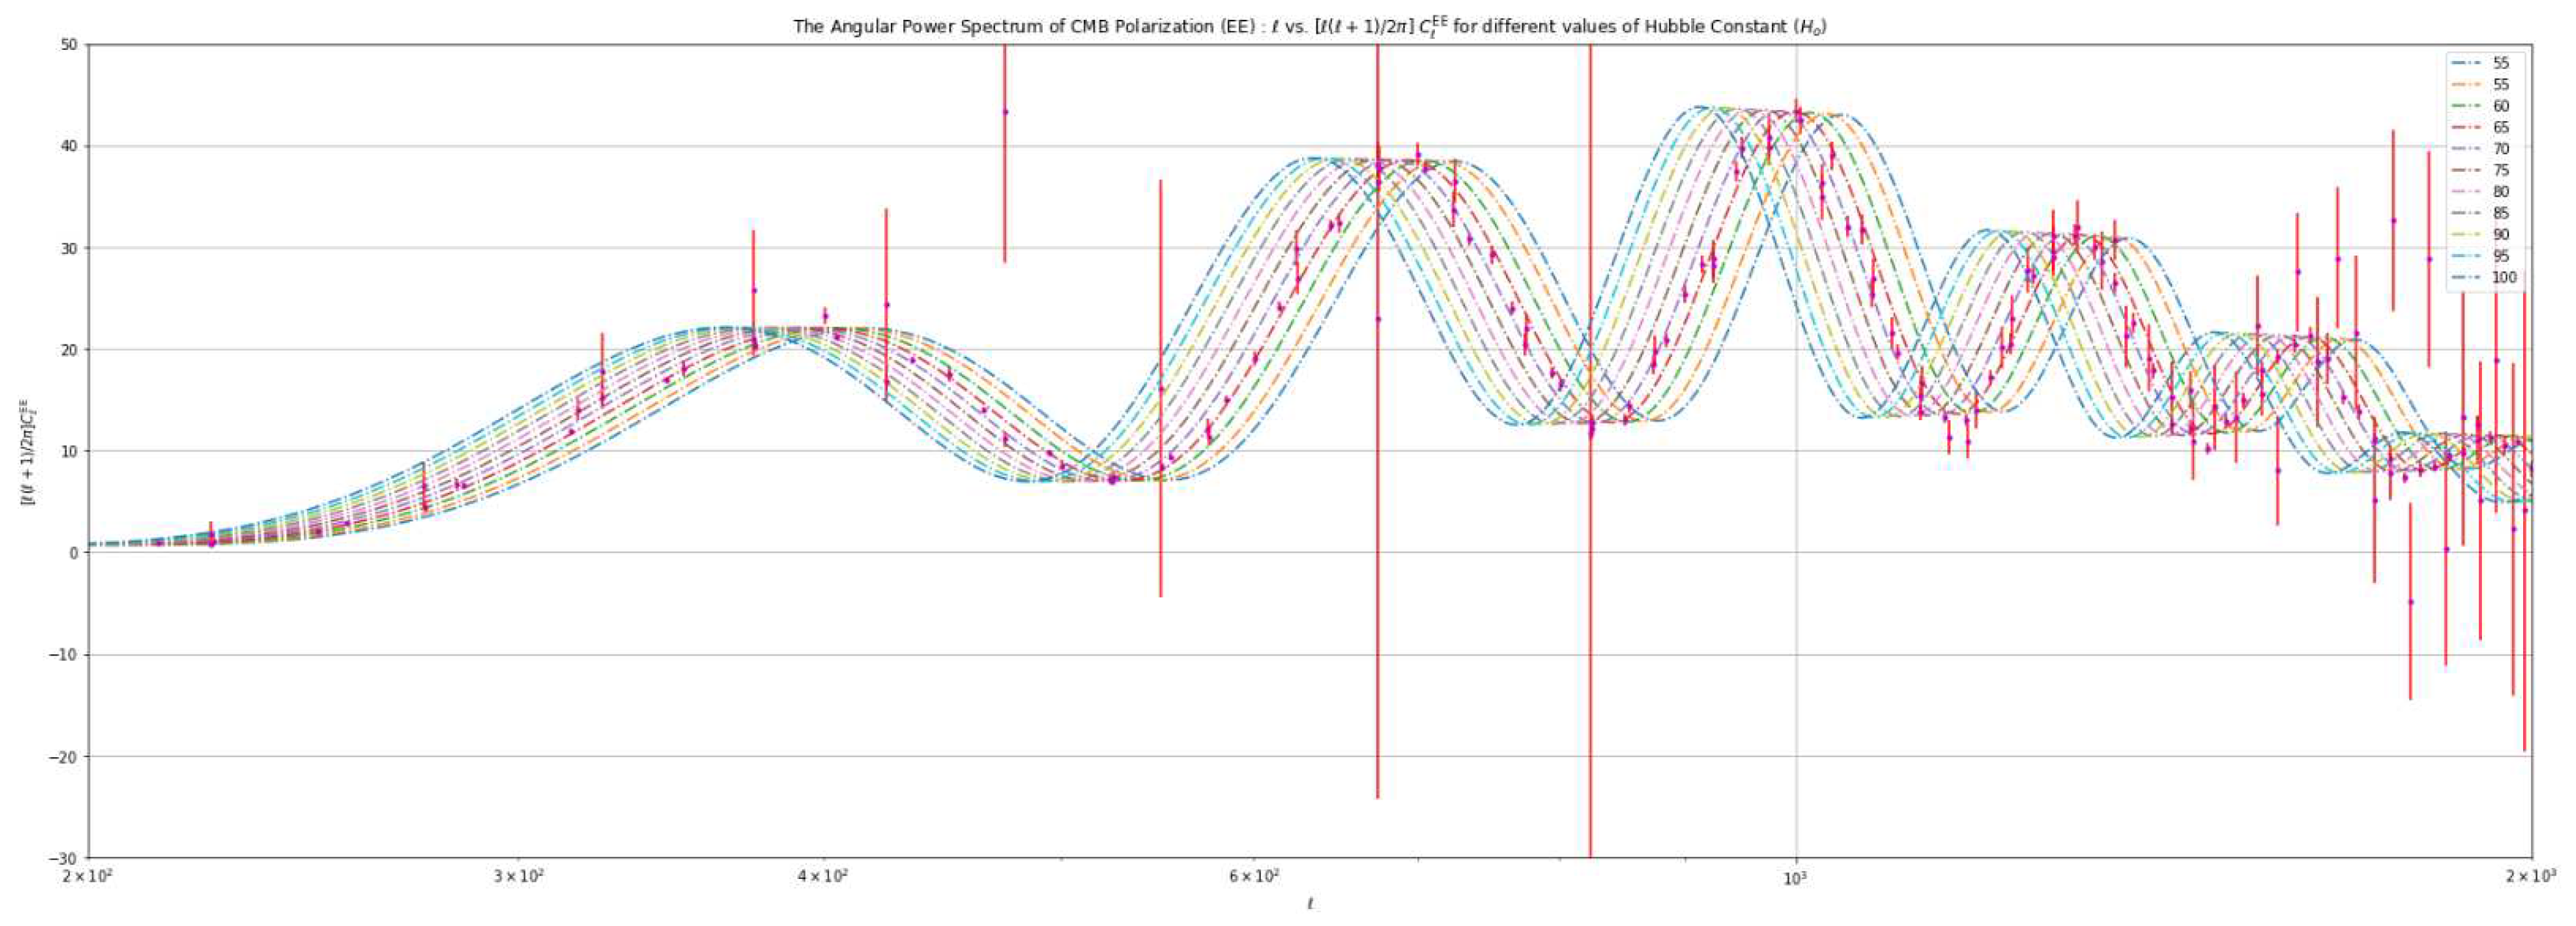
Figure 16.
BB Power Spectrum varying .
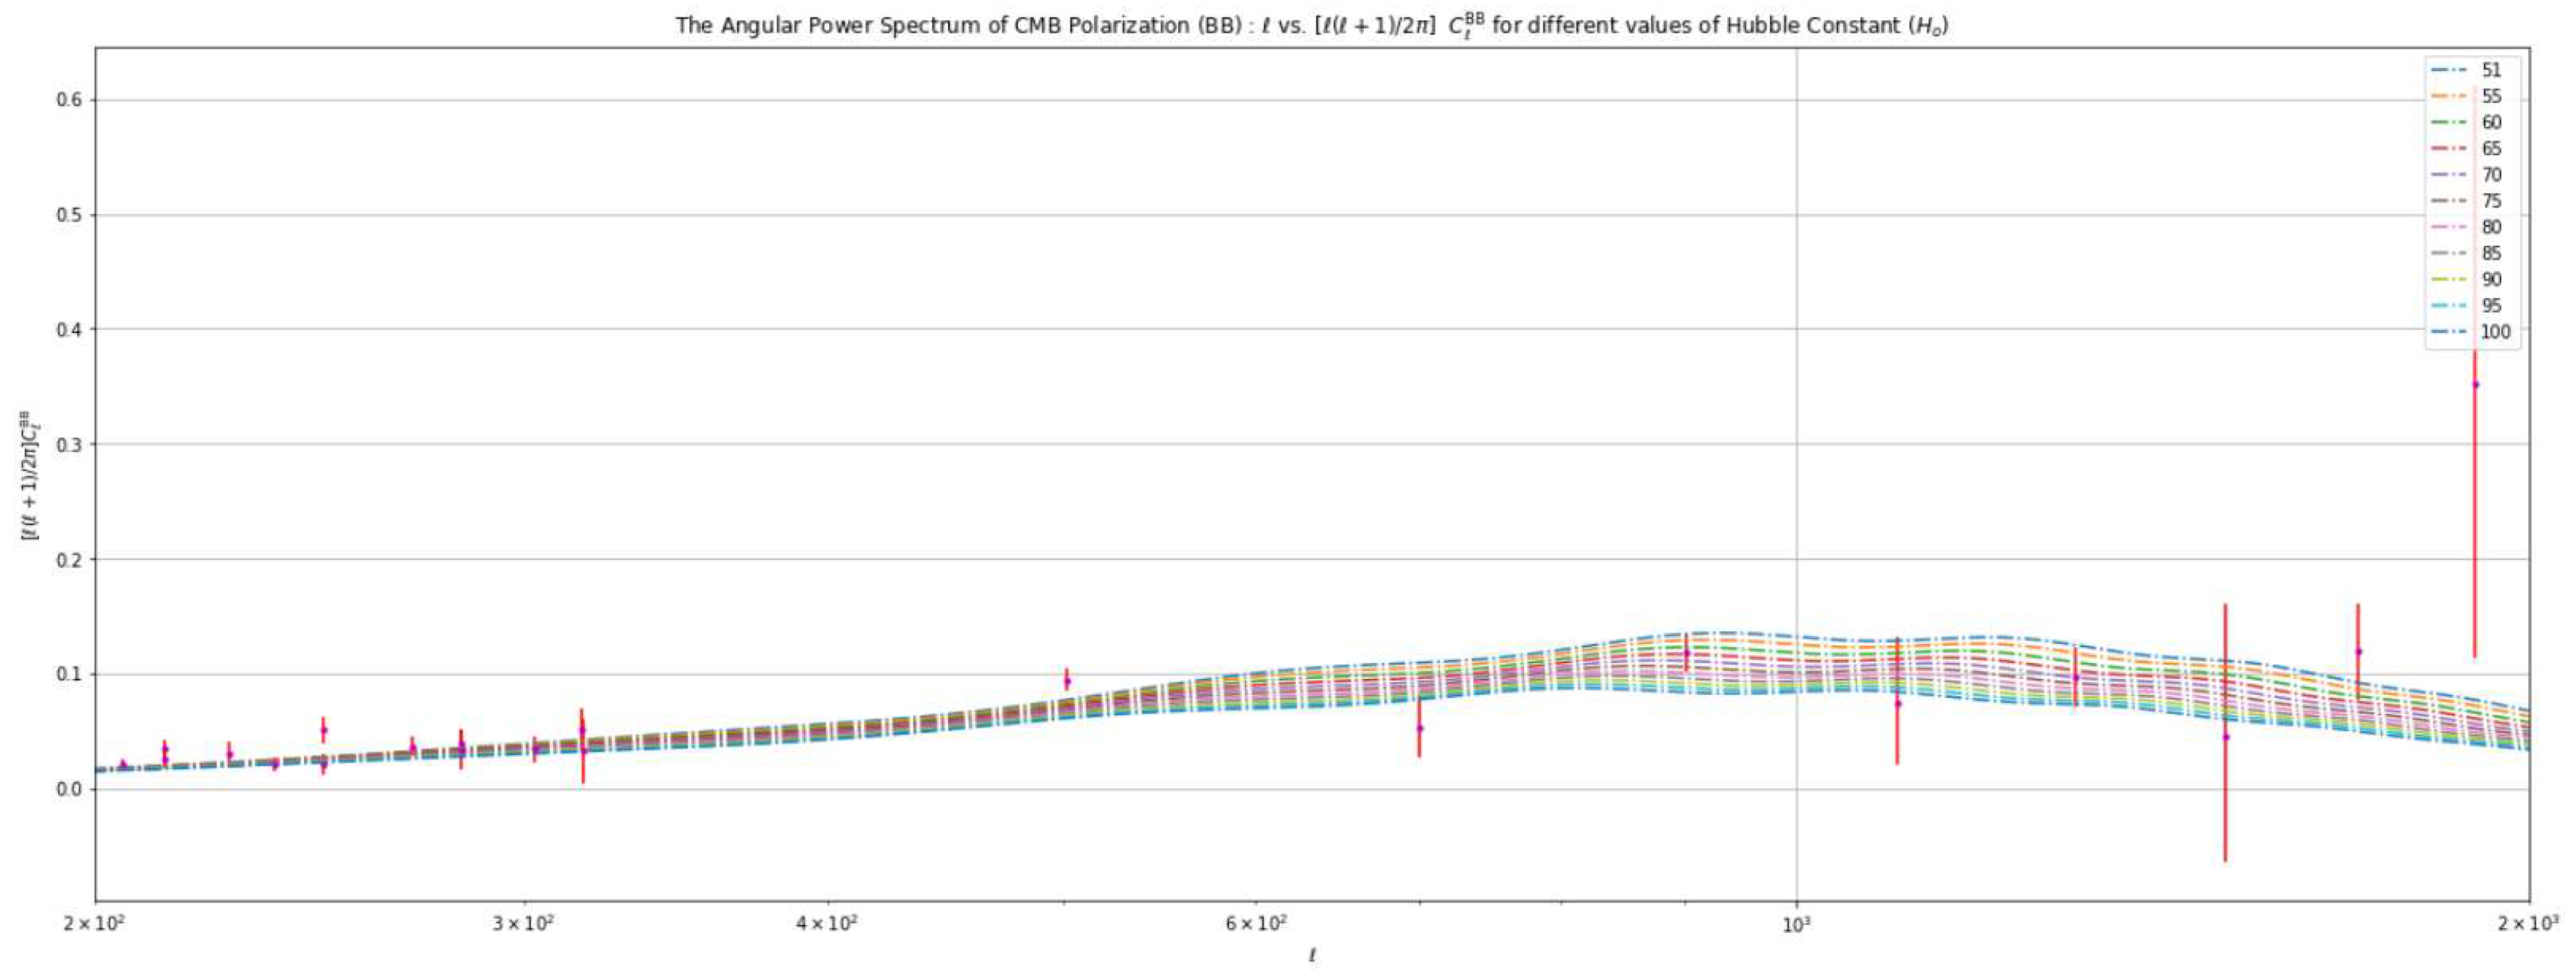
Figure 17.
TE Power Spectrum varying
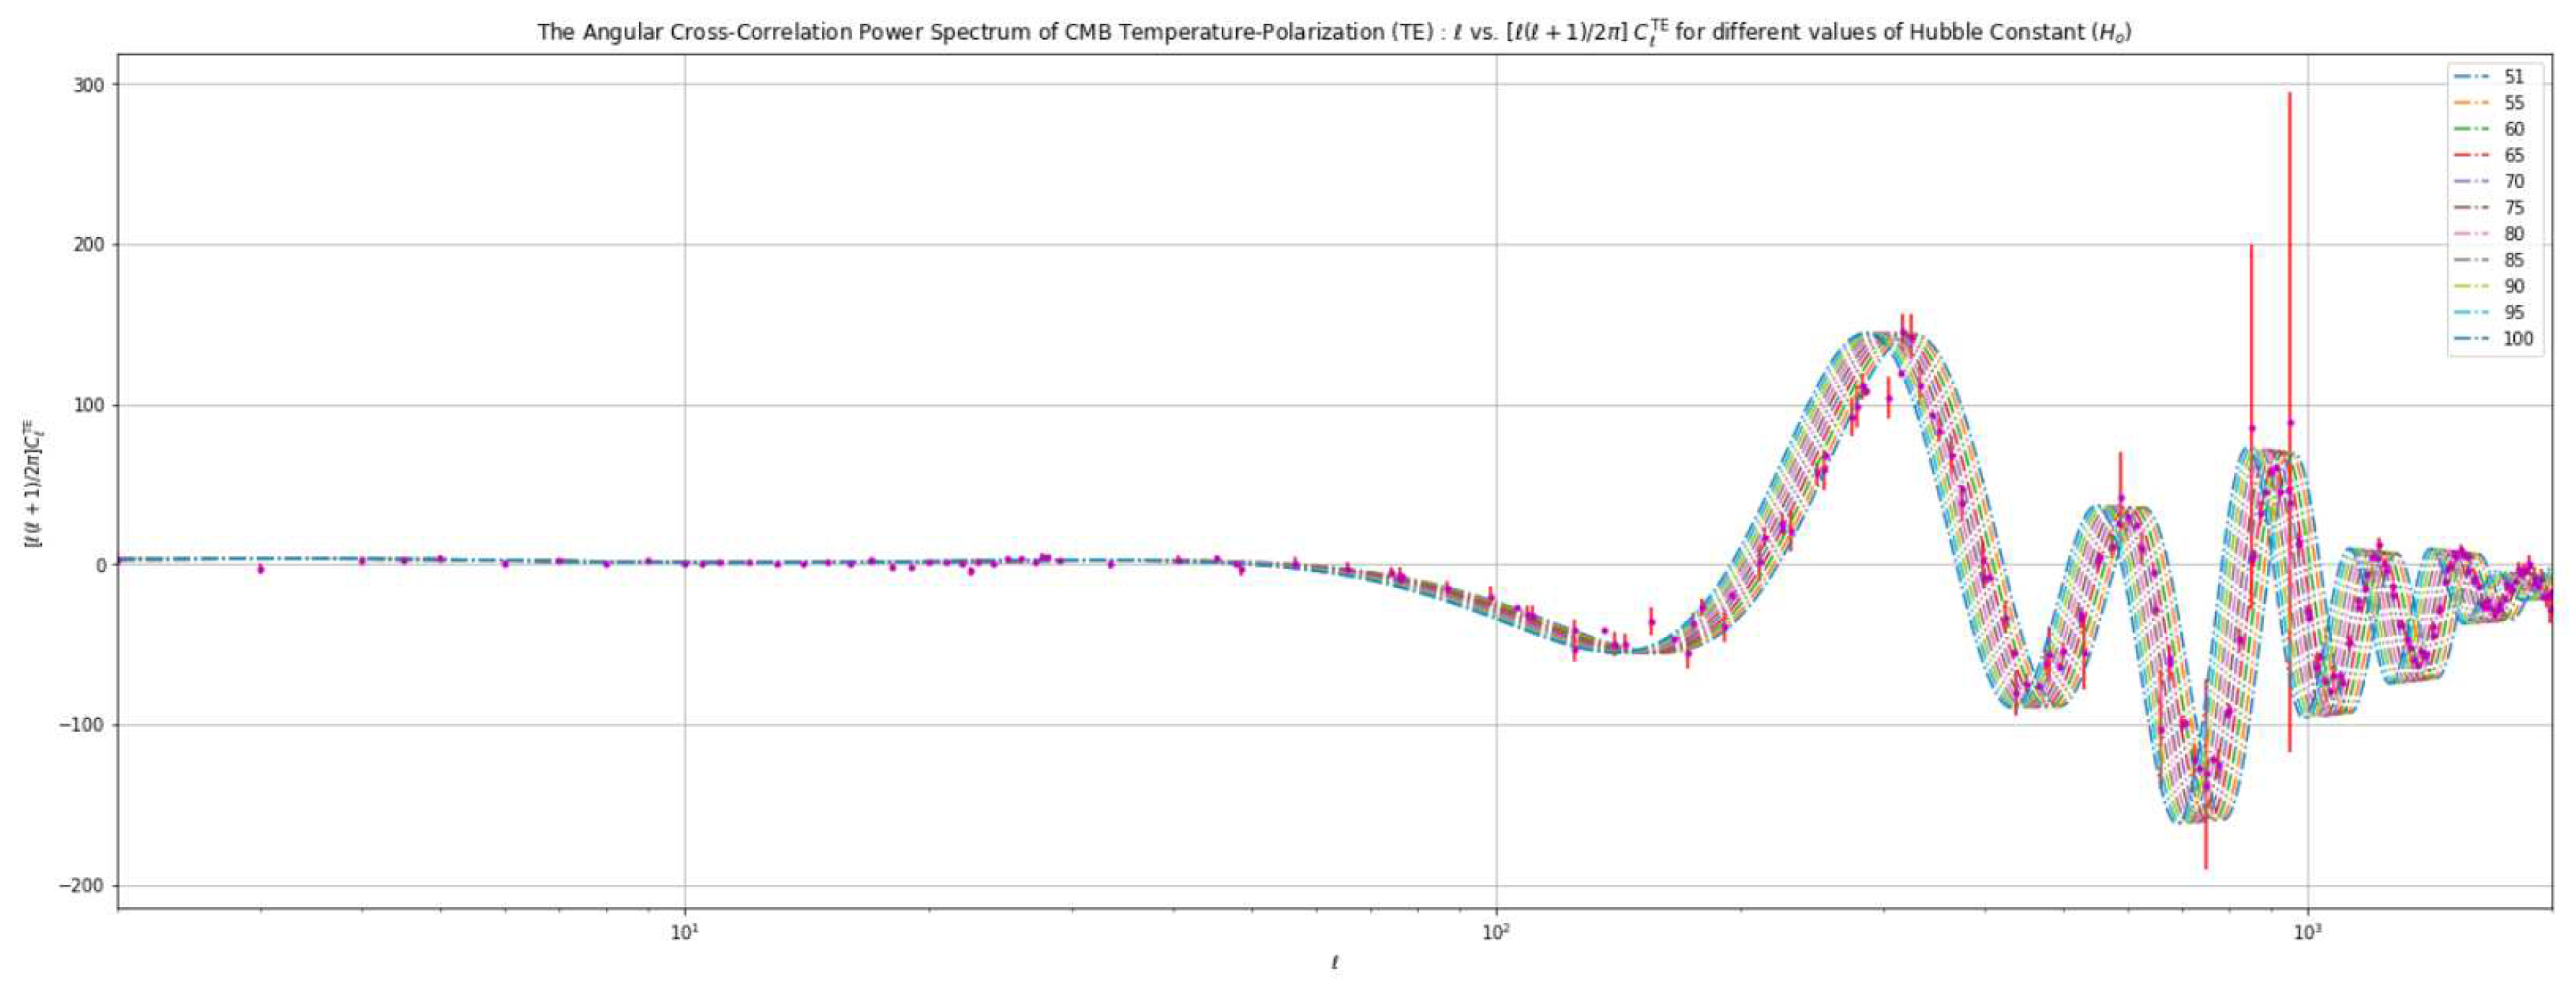
Figure 18.
WMAP Satellite Large Survey Data
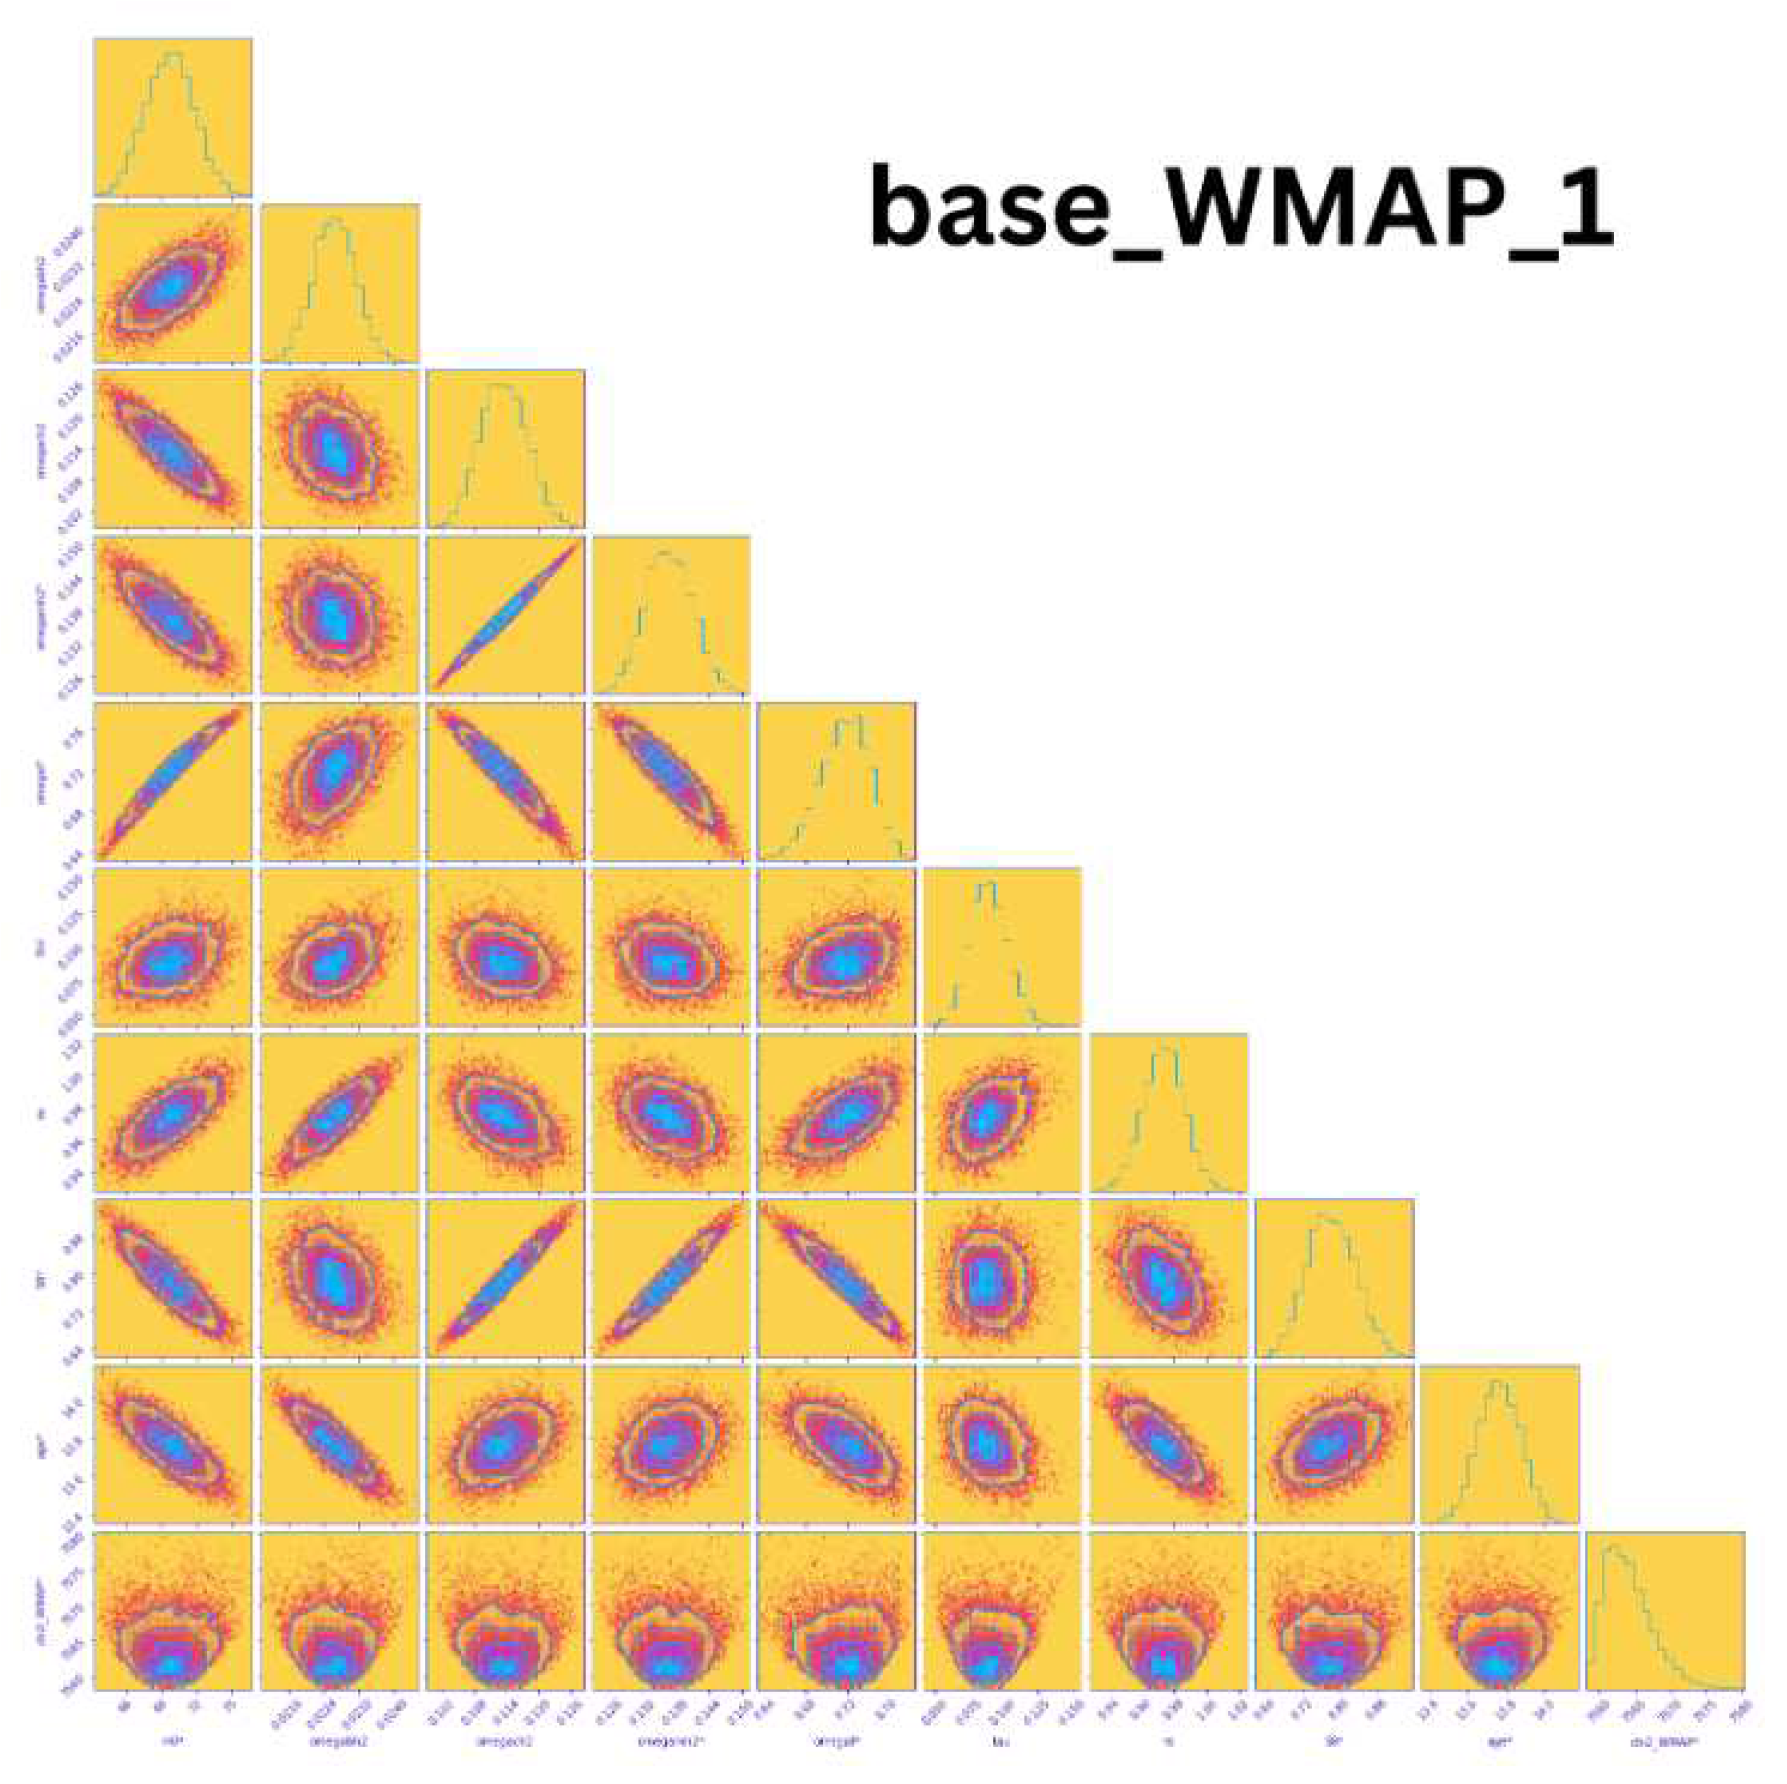
Figure 19.
Planck Satellite Large Survey Data
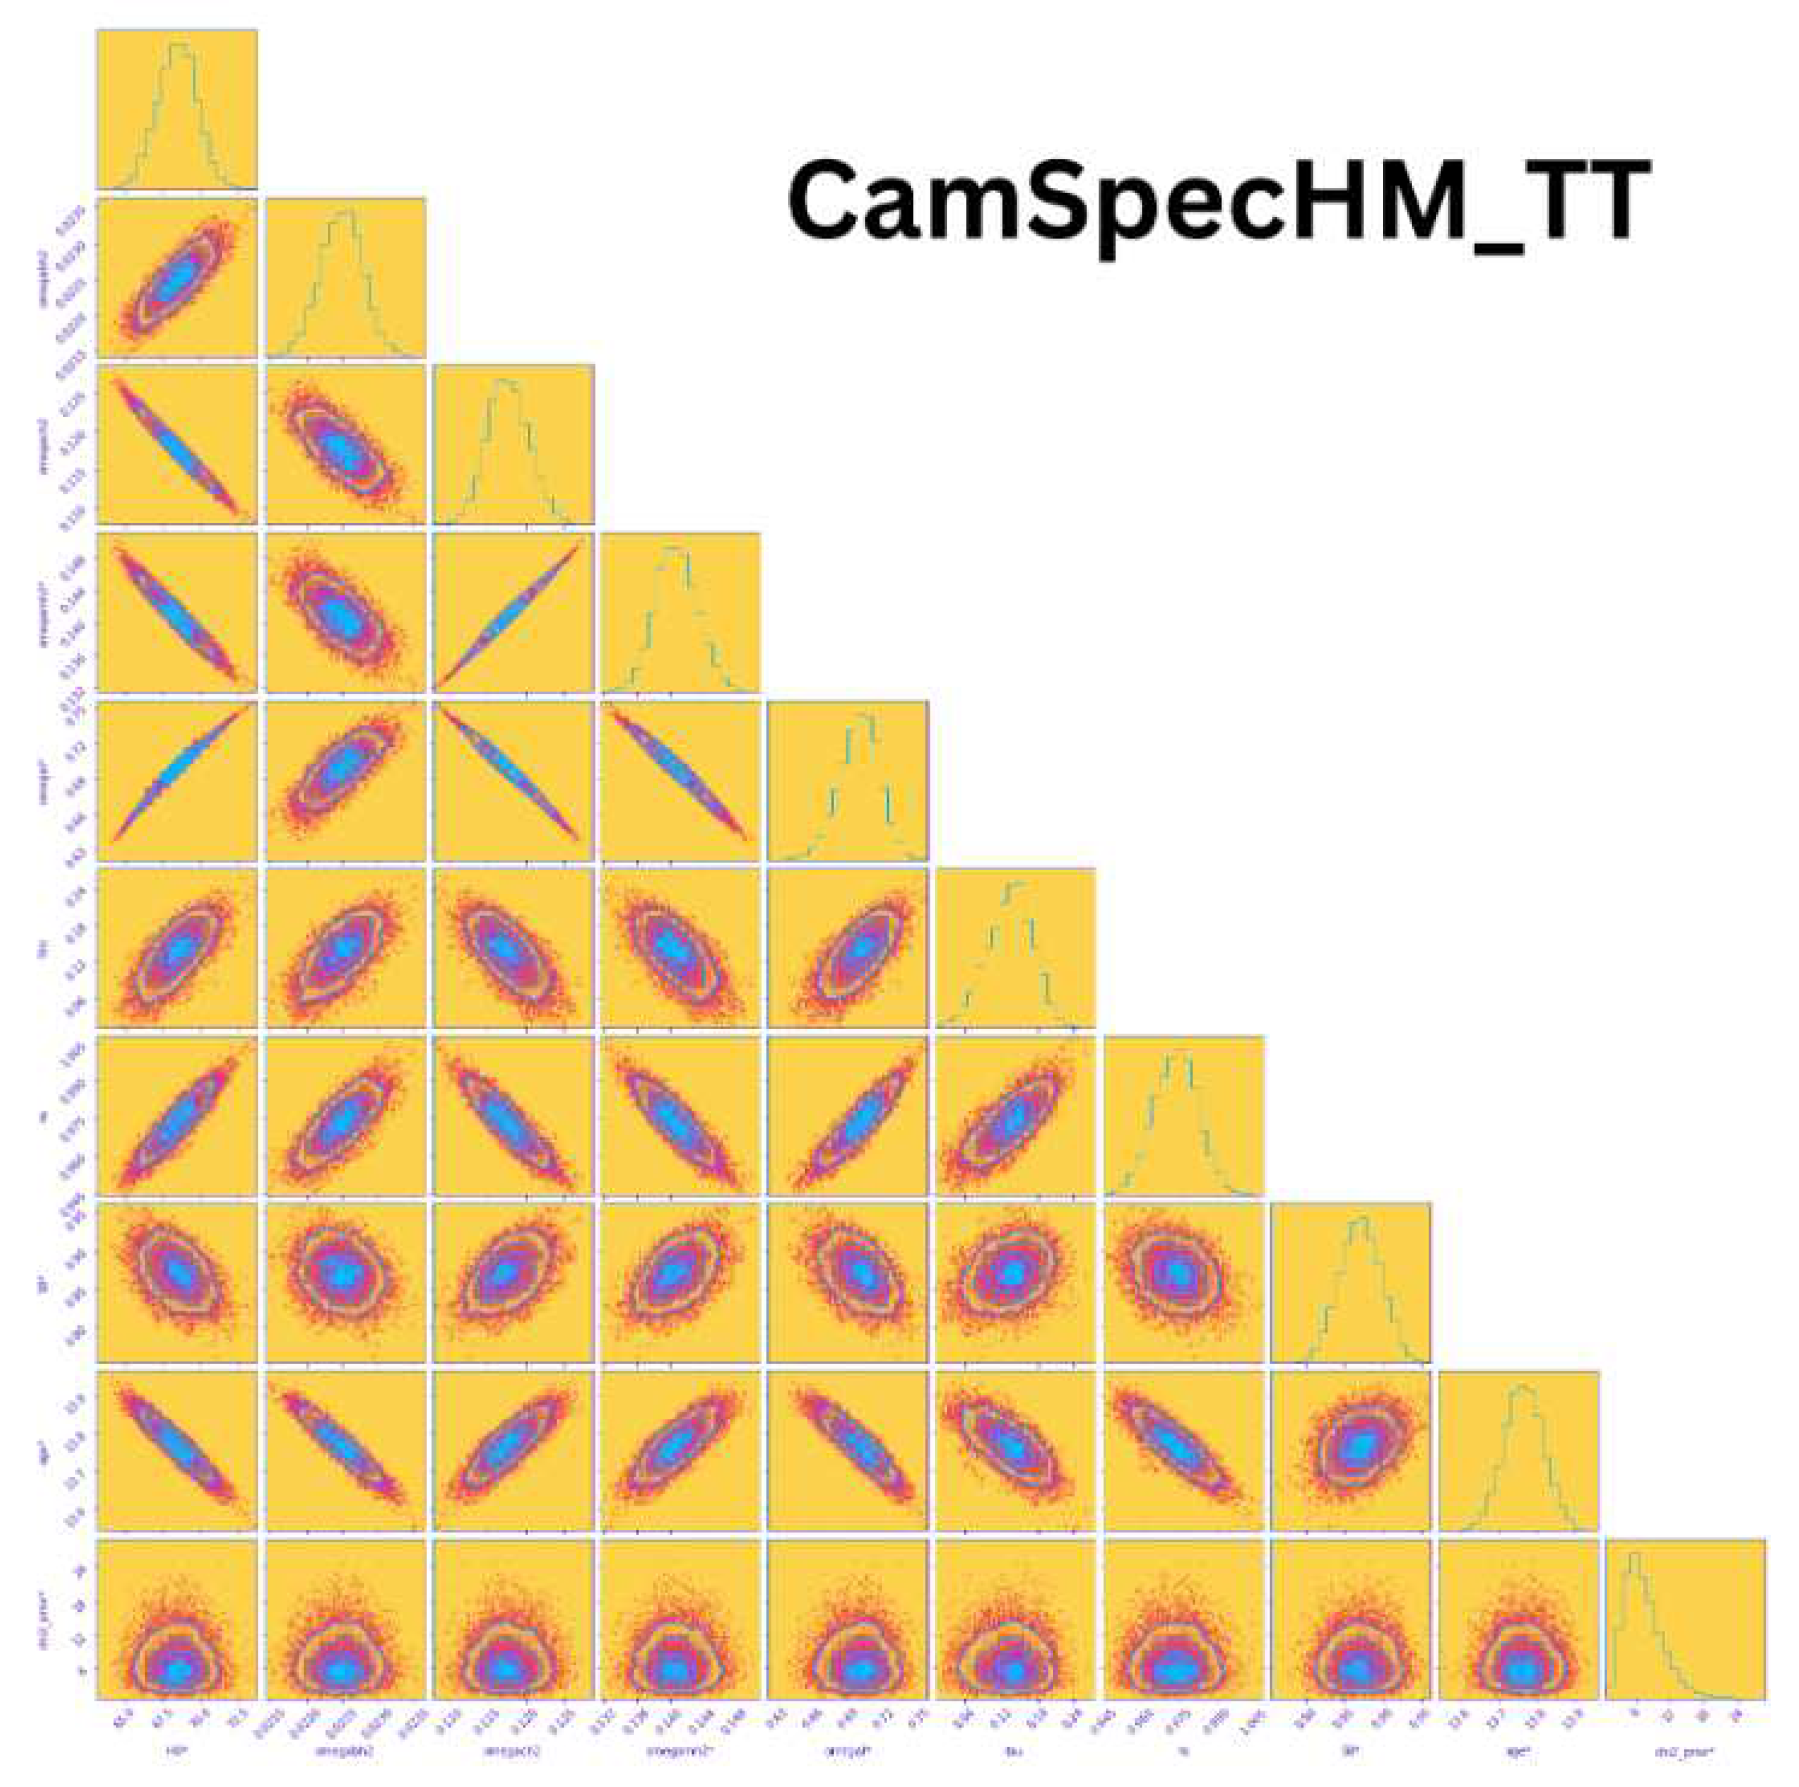
Figure 20.
Dark Energy Survey Data
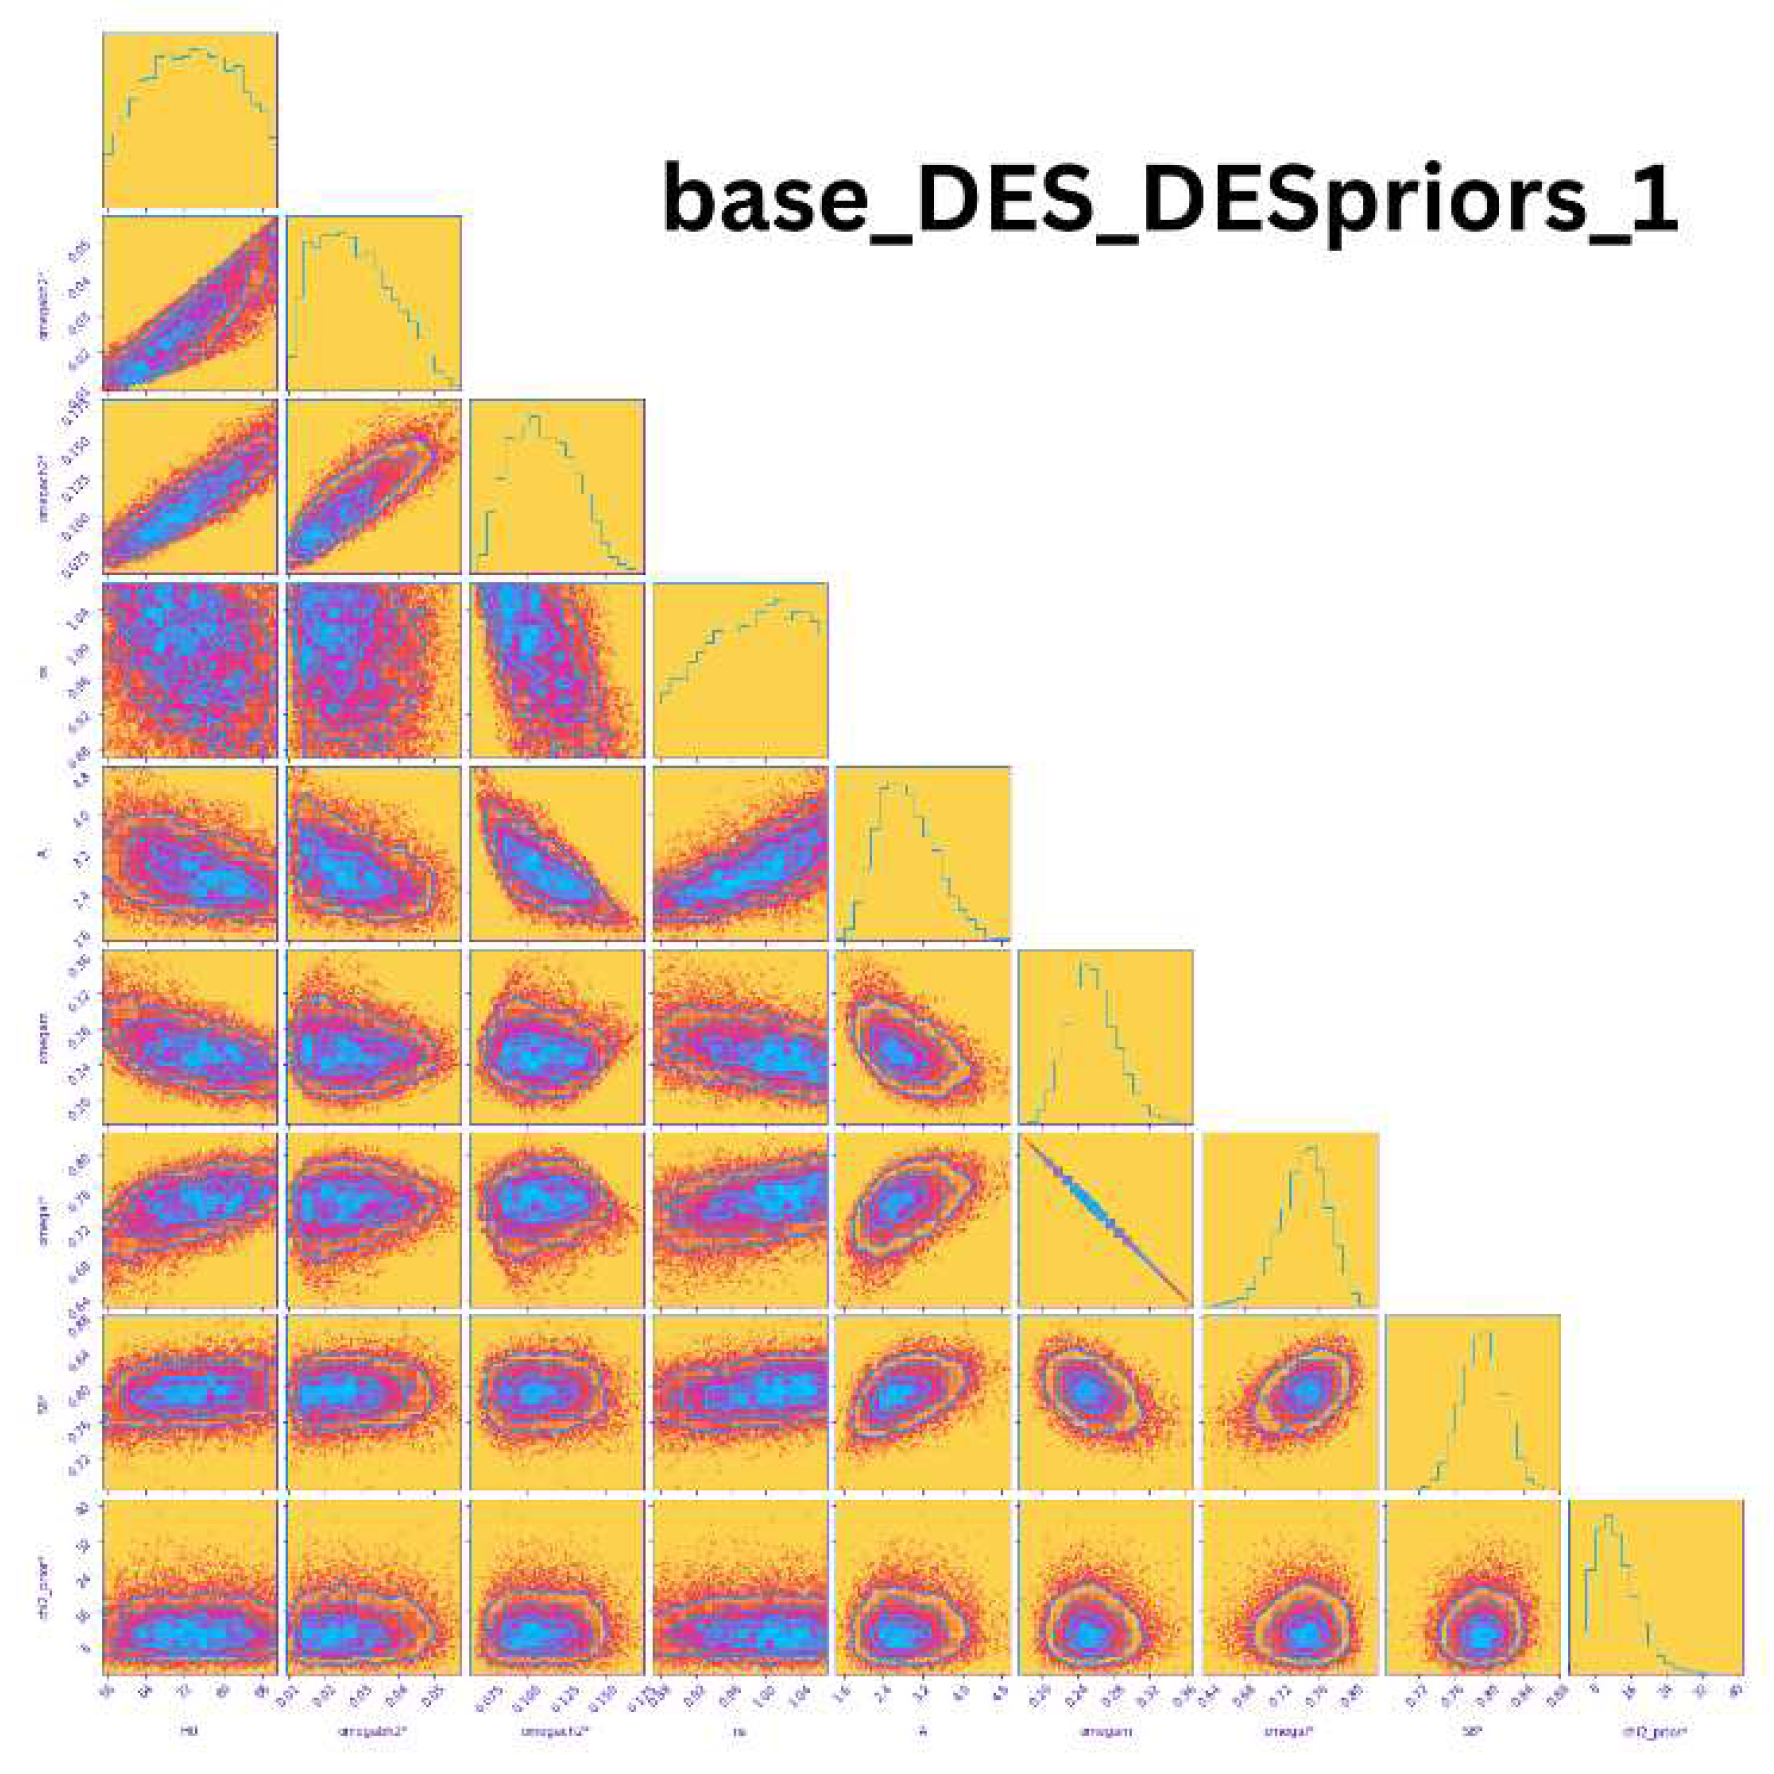
Table 2.
Measurements of Hubble Constant
| Universe | Minimum | Maximum | Mean | Mean | Mean of Mean |
| Value | Value | Value | Overall | values of Direct and | |
| Indirect Measurements | |||||
| Early | 67.27 | 71.3 | 68.54 | ||
| (Indirect) | 71.65 | 70.56 | |||
| Late | 67.4 | 76.0 | 72.59 | ||
| (Direct) |
Disclaimer/Publisher’s Note: The statements, opinions and data contained in all publications are solely those of the individual author(s) and contributor(s) and not of MDPI and/or the editor(s). MDPI and/or the editor(s) disclaim responsibility for any injury to people or property resulting from any ideas, methods, instructions or products referred to in the content. |
© 2023 by the authors. Licensee MDPI, Basel, Switzerland. This article is an open access article distributed under the terms and conditions of the Creative Commons Attribution (CC BY) license (http://creativecommons.org/licenses/by/4.0/).
Copyright: This open access article is published under a Creative Commons CC BY 4.0 license, which permit the free download, distribution, and reuse, provided that the author and preprint are cited in any reuse.


