Preprint
Article

The Inhibition of FGFR/PI3K/Akt Axis by AZD4547 Disrupts the Proangiogenic Microenvironment and Vasculogenic Mimicry Arising from the Interplay between Endothelial and Triple-Negative Breast Cancer Cells

Altmetrics

Downloads

143

Views

53

Comments

0

A peer-reviewed article of this preprint also exists.

Submitted:

17 July 2023

Posted:

18 July 2023

You are already at the latest version

Alerts
Abstract
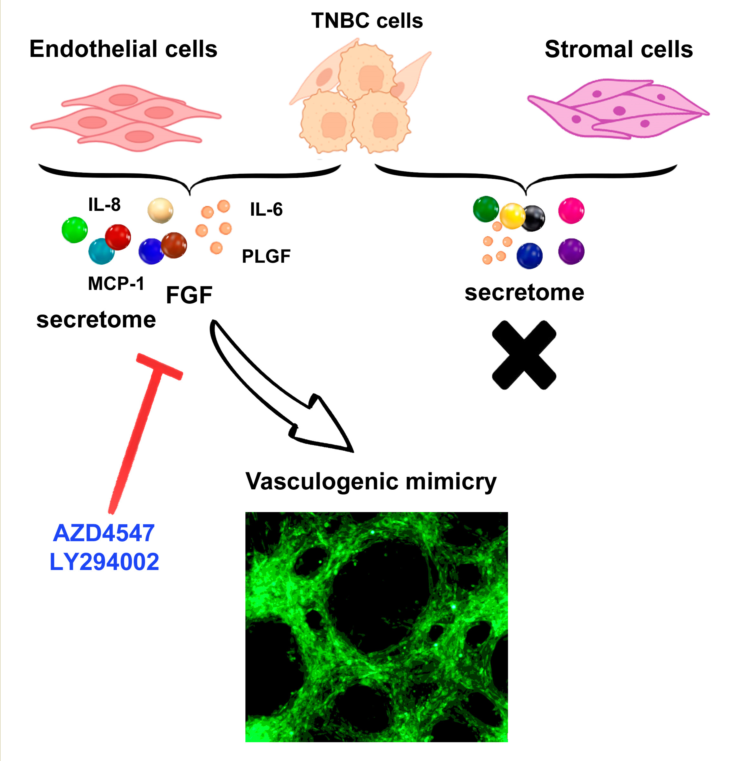
Vasculogenic mimicry (VM), a process in which aggressive cancer cells form tube-like structures, plays a crucial role in providing nutrients and escape routes. Highly plastic tumor cells, such as those with triple-negative breast cancer (TNBC) phenotype, can develop VM. However, little is known about the interplay between cellular components of the tumor microenvironment upon TNBC cells VM-capacity. In this study, we analyzed the ability of endothelial and stromal cells to induce VM when interacting with TNBC cells, and analyzed the involvement of the FGFR/PI3K/Akt pathway in this process. VM was corroborated using fluorescently‐labeled TNBC cells. Only endothelial cells triggered VM formation, suggesting a predominant role of paracrine/ juxtacrine factors from an endothelial origin in VM development. By immunocytochemistry, qPCR and secretome analyses, we determined increased expression of proangiogenic factors as well as stemness markers in VM-forming cancer cells. Similarly, endothelial cells primed by TNBC cells showed upregulation of proangiogenic molecules, including FGF, VEGFA, and several inflammatory cytokines. The endothelium-dependent TNBC-VM formation was prevented by AZD4547 or LY294002, strongly suggesting the involvement of the FGFR/PI3K/Akt axis in this process. Given that VM is associated with poor clinical prognosis, targeting FGFR/PI3K/Akt pharmacologically may hold promise for treating and preventing VM in TNBC tumors.
Keywords: 
Subject: Medicine and Pharmacology  -   Oncology and Oncogenics

1. Introduction

In cancer, tumor growth and dissemination depend on adequate access to the host blood supply through neo-vascularization, a process comprising the formation of microvascular networks capable of perfusion, that develop in response to local poor blood flow or ischemia [1]. Tumor neo-vascularization can be achieved through different mechanisms, including a) angiogenesis, an endothelial-dependent event where new vessels arise from preexistent ones; b) mosaic vessels formation, in which endothelial cells (ECs) and cancer cells intermingle to form vessels; or c) vasculogenic mimicry (VM), where cancer cells undergo phenotypical changes allowing them to secrete extracellular matrix (ECM) components to form tubular structures as blood channels [1,2,3].
Notably, cancer cells capable of forming VM exhibit high plasticity, which enables them to transdifferentiate into endothelial-like cells co-expressing endothelial, embryonic/stem and tumor markers. These cells also show aberrant expression of specific glycoproteins such as vascular endothelial cadherin (VE-cadherin) and CD133 [4,5,6].
Since lack of oxygen acts as a VM driver, VM can develop after an antiangiogenic treatment or in hypoxic regions of highly aggressive tumors, including breast cancer, with increased frequency in the triple-negative breast cancer (TNBC) phenotype [7,8]. TNBC tumor cells are known to secrete factors and exosomes that induce tumorigenic features in neighboring normal cells by changing their metabolic program to become tumor-supportive [9]. However, little is known about the participation of ECs and stromal cells (SCs) in the microenvironment changes and reprograming of cancer cells that enable them for VM formation. Moreover, even if previous studies have shown the ability of ECs to induce VM in breast cancer [10,11,12,13], there is limited information so far on the factors provided by these cells that are capable of inducing VM, and the mechanisms involved. Therefore, in this study, we aimed to explore the capacity of ECs and SCs to induce VM in two different TNBC cell lines using an in vitro co-culture model that allows to study their close interaction. In addition, knowing that the loss of equilibrium between the activators and repressors of vasculogenesis in the tumor microenvironment involves modifications of the secretome and the ECM, which can lead to the activation of both VM and angiogenesis [8], herein, we also characterized the endothelial-dependent pro-vasculogenic signature occurring in co-cultures (CCs) of ECs and cancer cells. In an oncogenic setting, both ECs and cancer cells can undergo activation not only of the angiogenic switch but also of the metabolic switch, increasing glycolysis to satisfy the high demand for energy, resulting in a complete metabolic signature transformation [13,14]. In this regard, hexokinase 2 (HK2), a rate-limiting glycolytic enzyme that turns on the metabolic switch for cancer progression and vascularization, can be activated by a variety of proangiogenic molecules, including hypoxia-inducible factor-1α (HIF1A), vascular endothelial growth factor (VEGFA) and some members of the fibroblast growth factor (FGF) family [15,16]. Among the 22 members of the FGF family, 18 interact with the tyrosine kinase receptors FGFR1, FGFR2, FGFR3, and FGFR4, regulating diverse cellular functions such as the enhancement of cellular proliferation, motility, invasiveness, metastasis, and angiogenesis [17]. FGFs are released into the tumor microenvironment when liberated from the ECM or may be secreted by cancer cells and/or other cell types, thereby enriching the tumor microenvironment secretome [18]. The FGF-FGFR axis is one of the most relevant proangiogenic signaling mediators, suggesting that it can play a key inductive role in VM formation by activating both ECs and cancer cells [19,20]. Indeed, the angiogenic pathway in TNBC cells is known to be closely related to VM [21]. Notably, the binding of FGFs to FGFRs activates major oncogenic intracellular signaling pathways, including the phosphatidylinositol 3-kinase/Akt (PI3K-AKT) pathway [22,23]. Therefore, in this study we also aimed to explore the possibility of blocking VM in TNBC cells by inhibiting FGF/FGFR signaling using AZD4547, a potent and selective inhibitor of FGFRs [24], and LY294002, a PI3K inhibitor.

2. Results

2.1. Endothelial cells, but not stromal cells, enable VM formation by TNBC cells, which undergo phenotypic and morphological changes during the formation of tubular-like structures

Previously, we and others have shown the paracrine contribution of ECs in tumor cell behavior, including TNBC VM formation [10,12,25,26]. In this study, our aim was to gain further insight into the contribution of cellular components of the tumor microenvironment in TNBC VM induction, focusing on identifying the participation of ECs and SCs in this process. To investigate this, two TNBC cell lines, MBCDF-T and HCC1806, were independently co-incubated with SCs (N30 cells) or ECs (EA.hy926) for 48 h (Figure 1). As depicted, only the co-culture of cancer cells with ECs showed VM formation. The co-culture of HCC1806 or MBCDF-T cells with ECs resulted in a complete cytoarchitectural change, displaying two noticeable focal planes in the dish: one below forming cellular packages in a monolayer, and the second one above the first one, arranged in tridimensional tubular-like structures engaged in networks (Figure 1 upper panels). In contrast, in the case of SCs-TNBC CCs, the cells were distributed in a monolayer within a single focal plane and showed mesenchymal-like features (Figure 1 lower panels). Therefore, ECs, but not SCs, supported cancer cells transdifferentiation, enabling them to form tubular networks. The morphological modifications that each cell lineage showed when co-cultured included a reduced nuclear/cytoplasmic proportion and a needle-like shape in TNBC cells, while EA.hy926 cells seemed enlarged in their cytoplasmic proportion and displayed a bigger nuclear size than TNBC cells. Some cancer cells showed a round shape, probably related to recent mitosis.
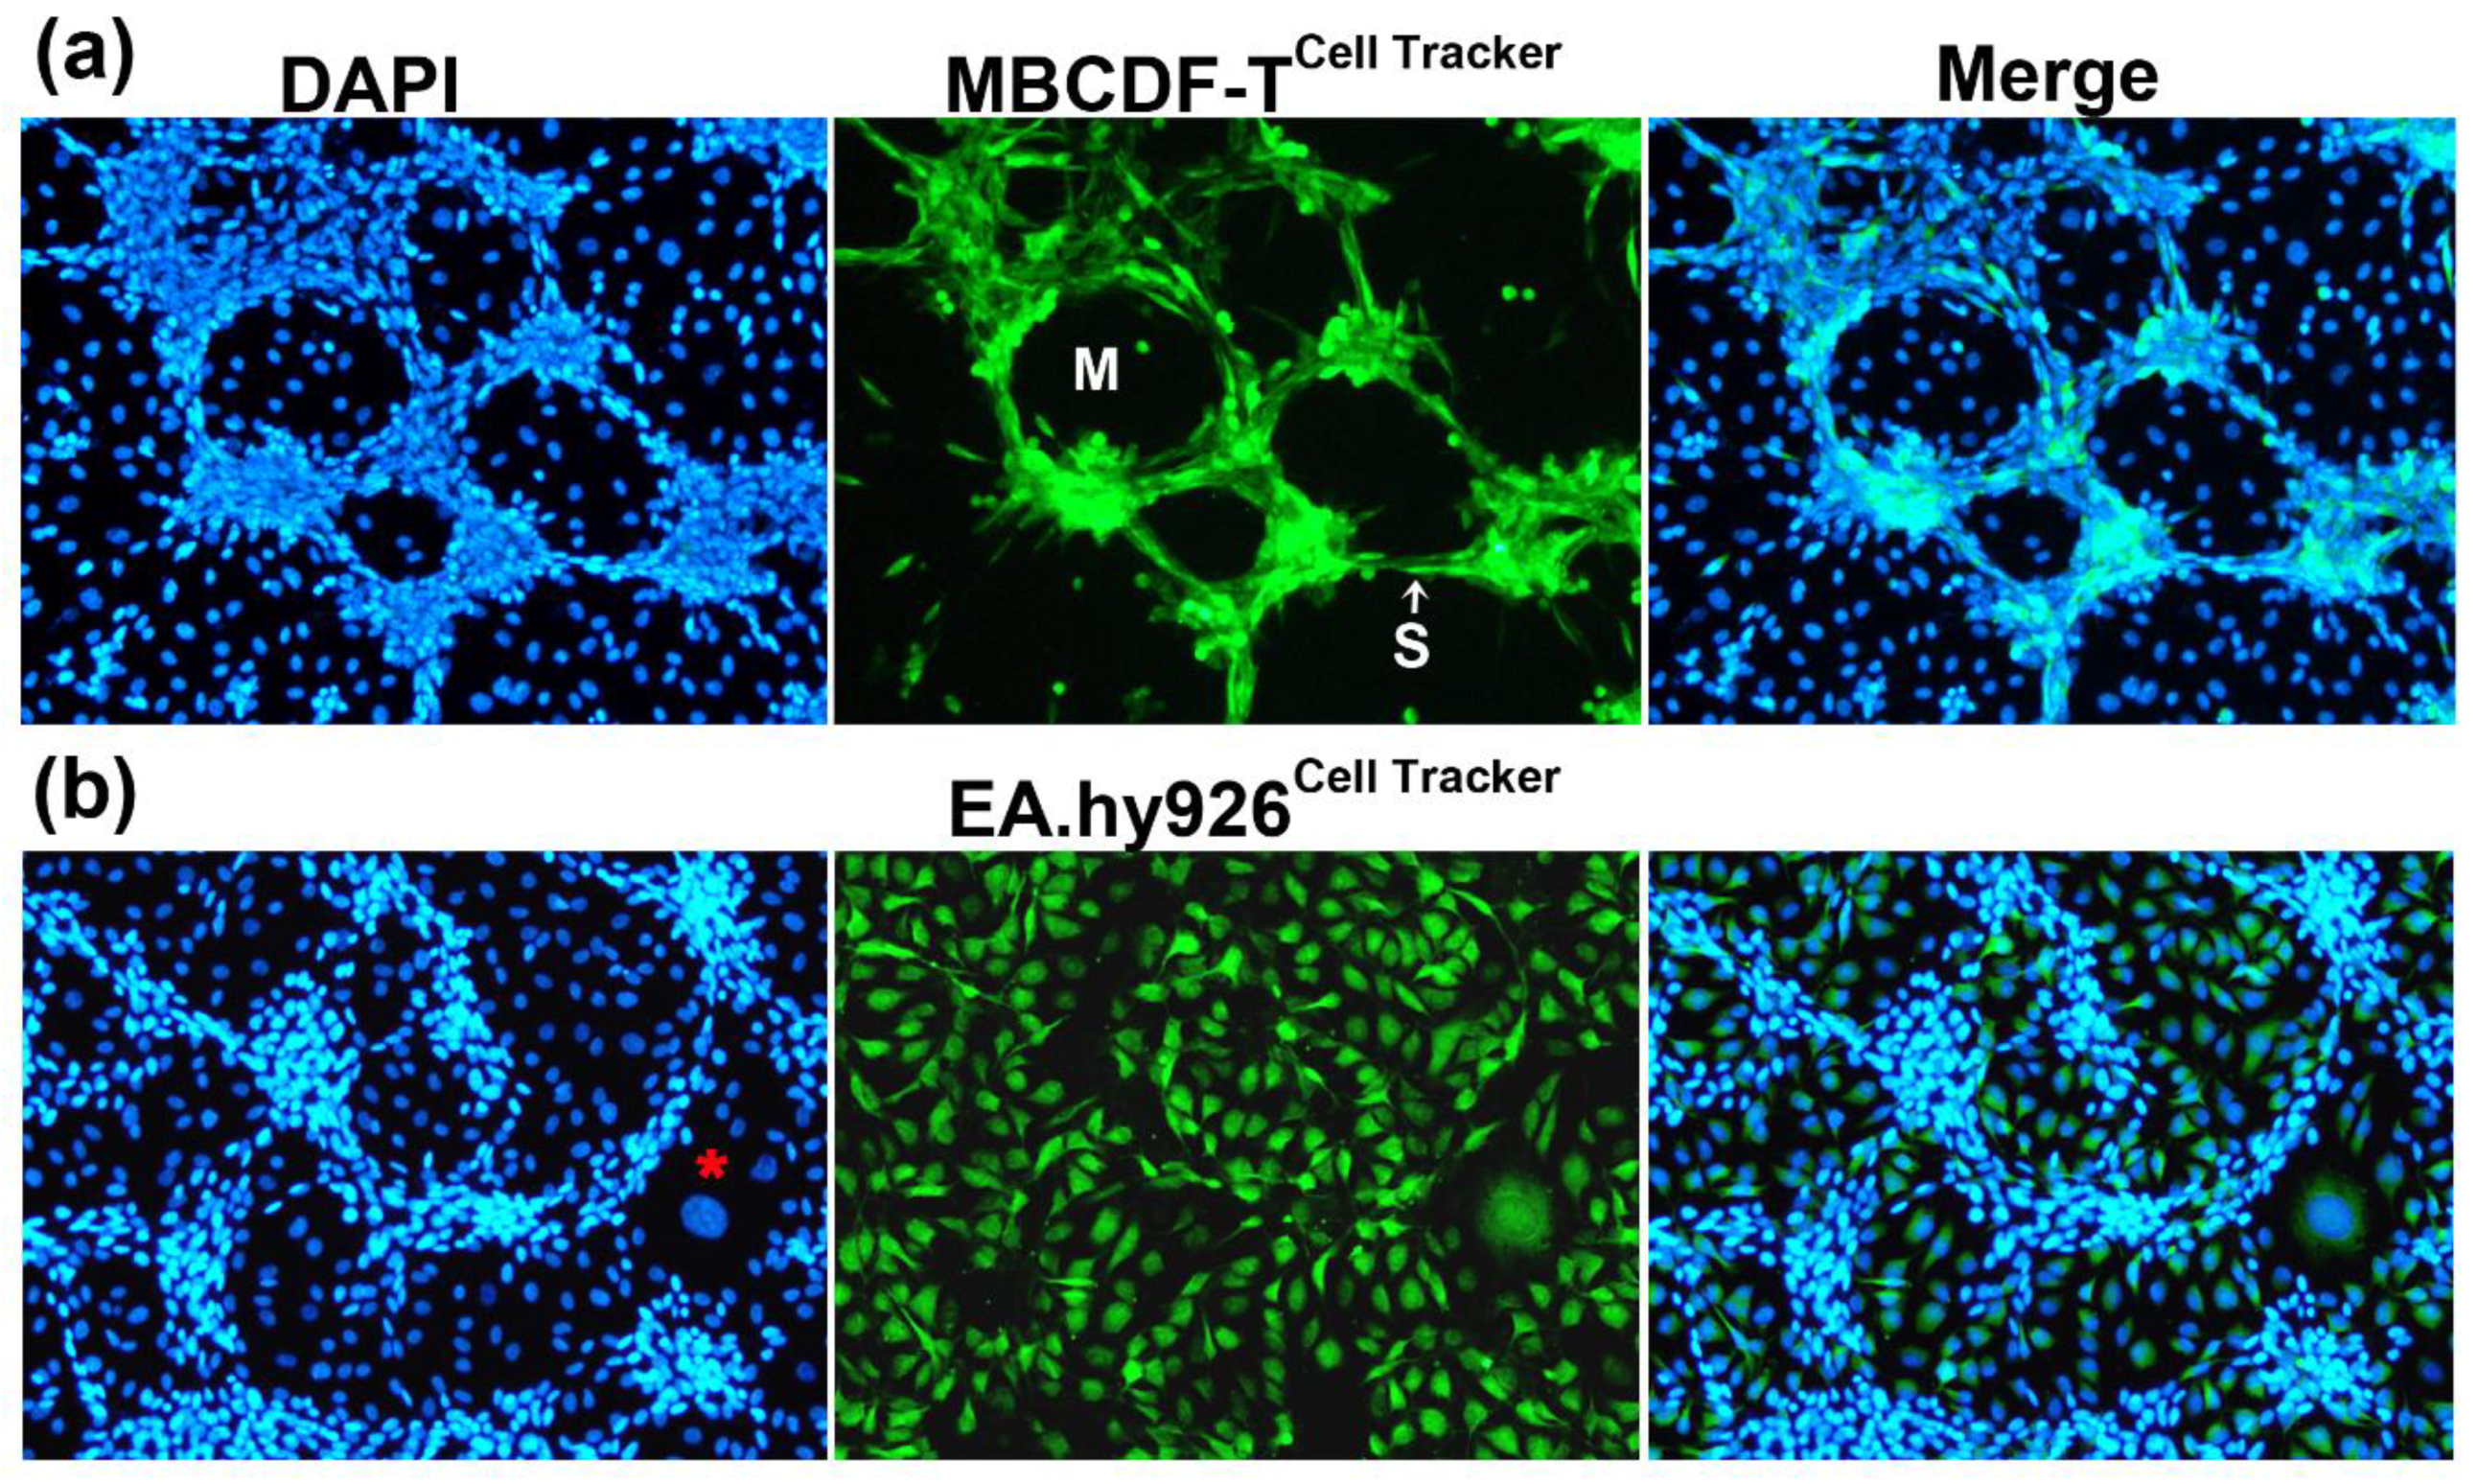
To confirm that the tubular networks in TNBC-ECs CCs were formed by cancer cells and not by ECs themselves, we labeled TNBC cells (MBCDF-T) with a fluorescent green Cell Tracker and then co-cultivated them with unlabeled EA.hy926 cells (Figure 2a). As depicted in Figure 2a, only the green-labeled cancer cells were involved in VM formation in the co-culture, ruling out endothelial angiogenesis. Moreover, when we conducted the opposite experiment, labeling ECs with the Cell Tracker instead of TNBC cells and co-cultured them, we found that ECs were clearly arranged below the tubular networks in the lower focal plane (Figure 2b). In some cases, ECs seemed to rearrange themselves into patches, leaving spaces for the tubular cancer structures. However, in other instances, their configuration suggested that they acted like scaffolds for the tridimensional TNBC assemblies, probably providing ECM and mechanical support for TNBC-VM. In the TNBC-3D networks, two different VM structures were identified, as previously reported [10], and as shown in Figure 2a: segments, defined as cords or branches formed by spindle-shaped TNBC cells, and meshes, represented as the enclosed areas surrounded by the segments, showing underlying ECs visible by DAPI-staining of their nuclei (Figure 2a).
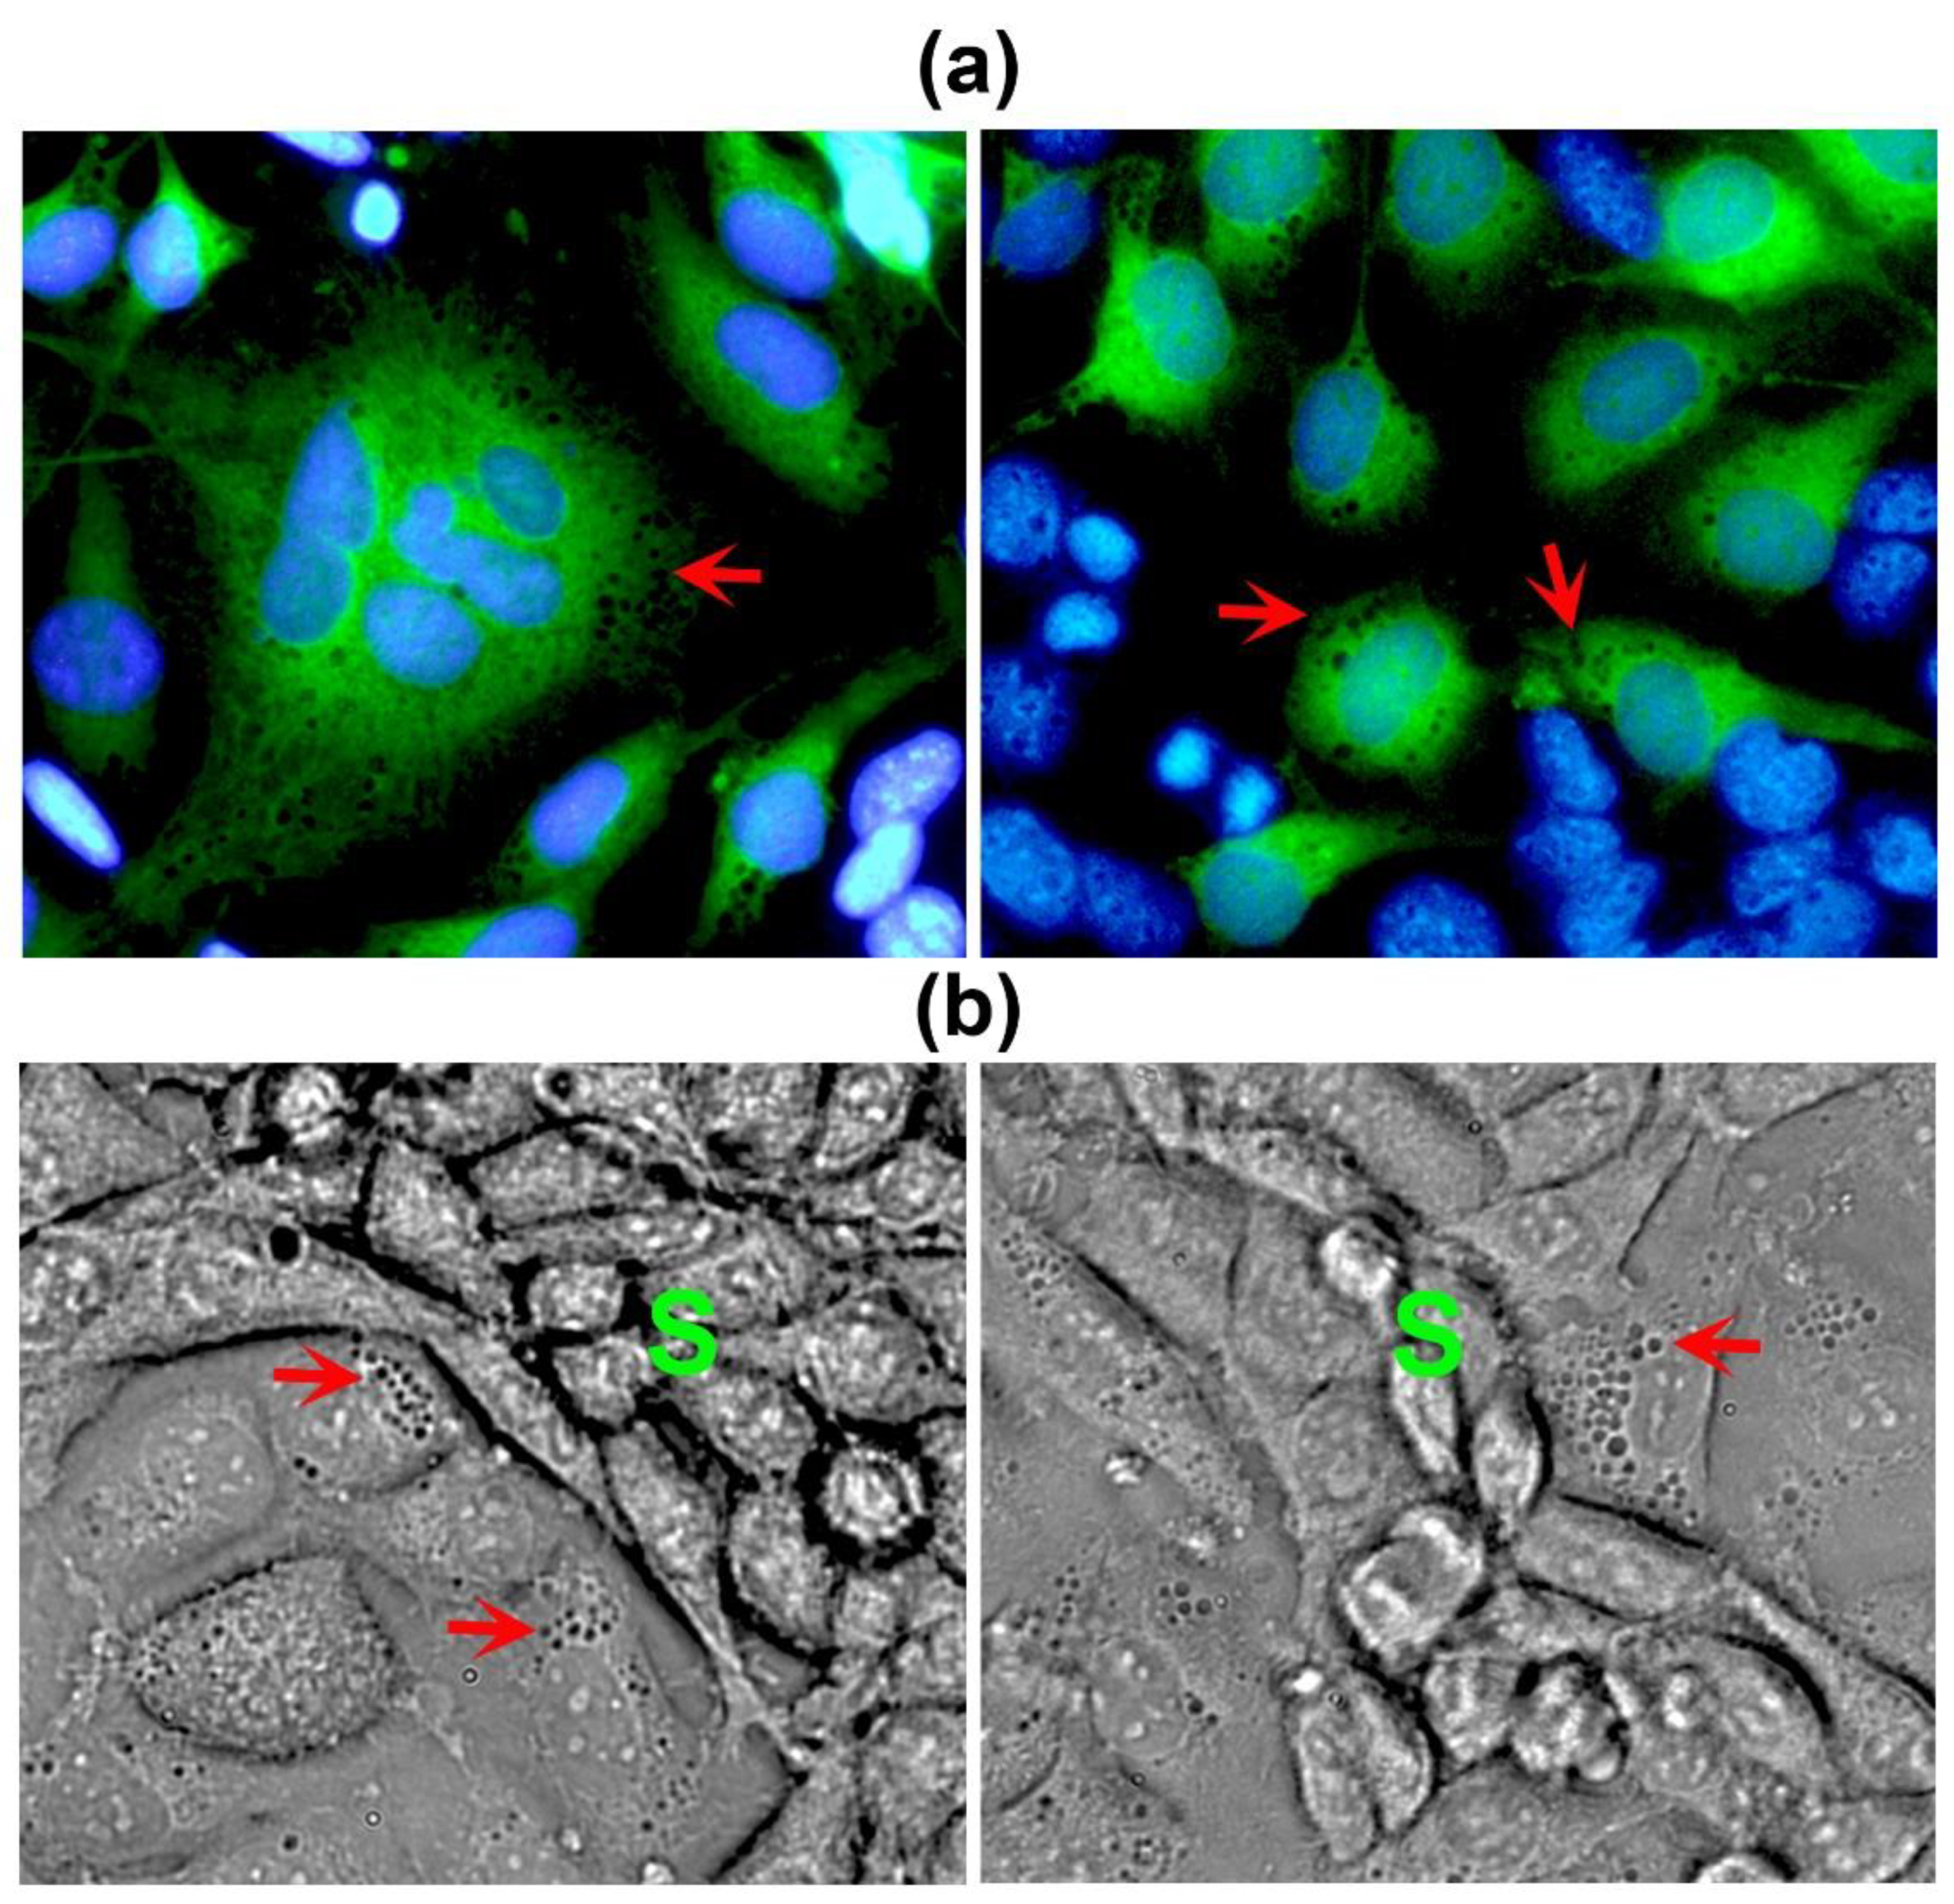
Interestingly, the ECs located in close contact with the VM-segments exhibited a highly vacuolated cytoplasm (Figure 3), suggesting their active participation in the conformation of the VM meshes, probably by providing necessary ECM components and/or pro-VM factors from endothelial origin. Thus, we named these cells donor cells. Occasionally, we could observe giant, flattened ECs characterized by a large nucleus (Figure 2, red asterisk). Sometimes, these giant cells displayed multiple nuclei with an atypical shape (Figure 3a), and could present a disrupted nuclear membrane. Thus, we believe that these multinucleated cells may participate in VM-structures formation. As judged by the green-tracker studies, donor cells appear to be modified ECs (Figure 3); however, cancer multinucleated giant cells could also be identified, starting to form as early as 2 – 4 h after co-seeding both cell types, and were also found in TNBC monocultures (data not shown).
Taken together, these results indicate that ECs, but not SCs, are able to induce TNBC-VM formation when co-cultured, without engaging themselves in the tridimensional tubular structures but providing VM drivers and ECM components to support them.

2.2. Co-cultured cells differentially express markers of VM and endothelium

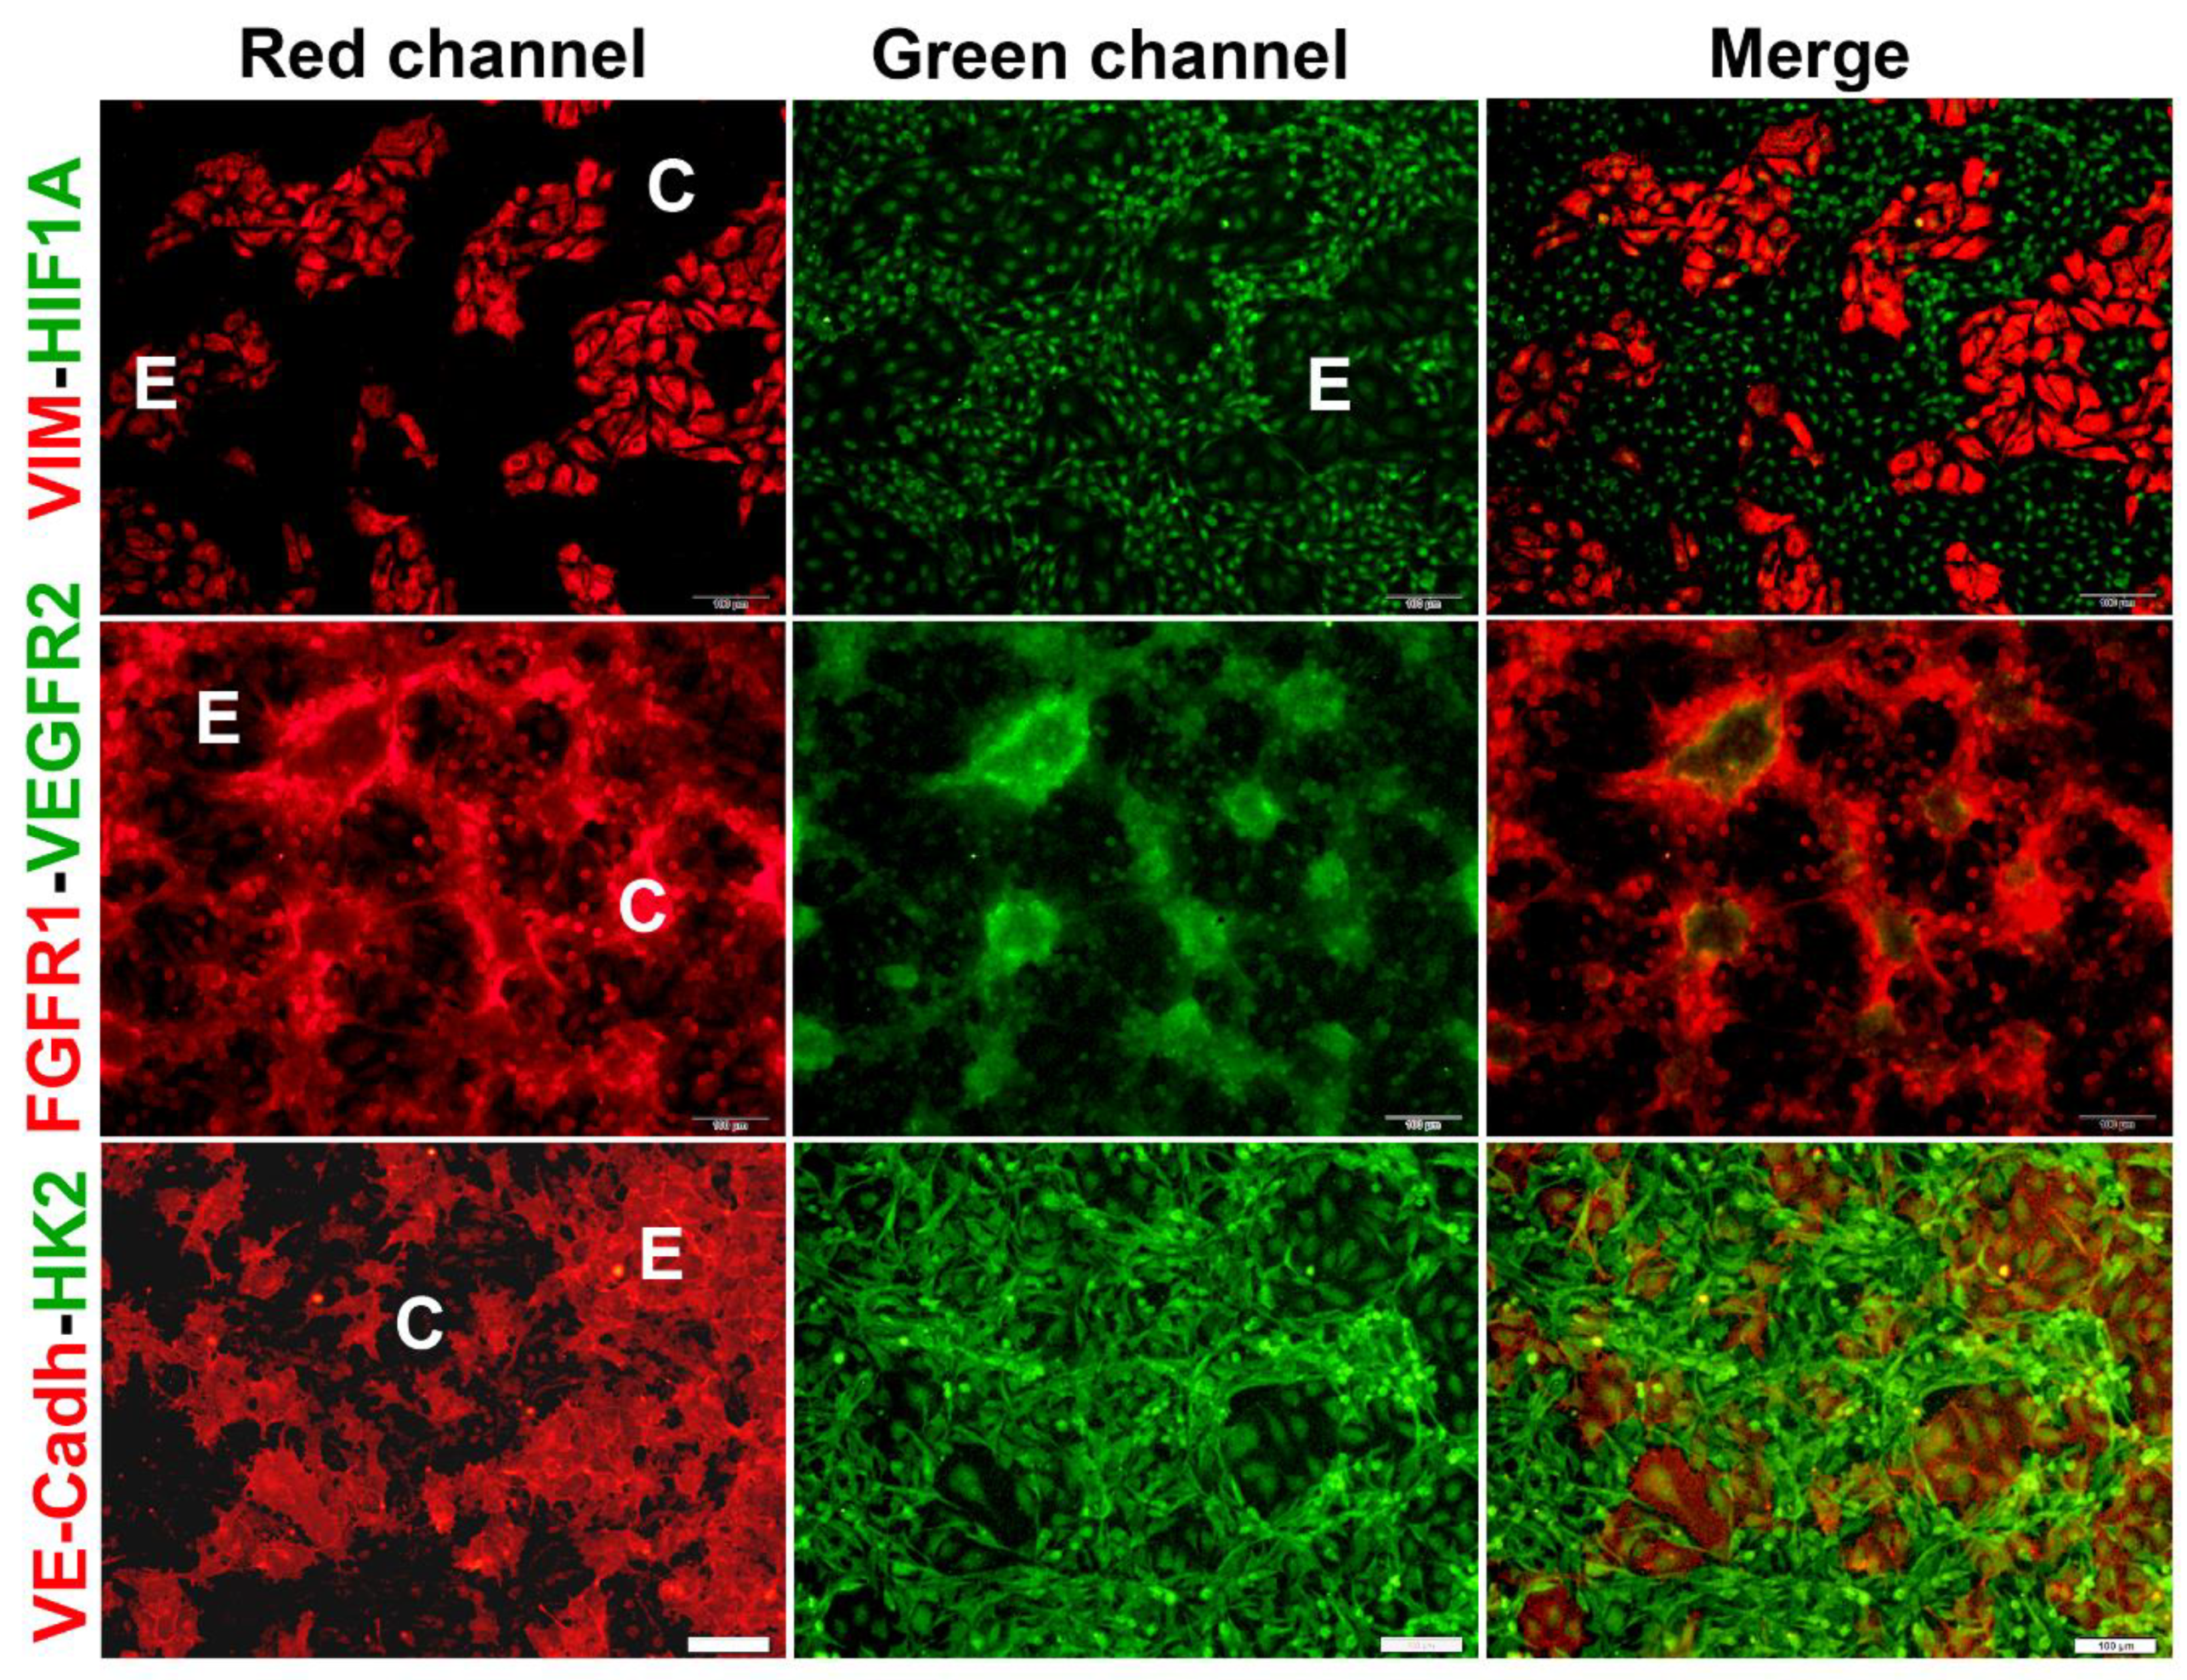
It is well-established that tumor cells undergoing VM develop several metabolic changes in response to environmental stressors such as hypoxia and other VM drivers. These changes include metabolic reprogramming involving the upregulation of HK2 and the expression of endothelial markers such as VE-cadherin [4,27,28,29]. Other markers associated with vasculogenesis/VM include HIF1A, vimentin, and the receptors FGFR1 and VEGFR2 [15,30]. Therefore, we performed immunocytochemistry studies to investigate the status of these proteins in each cell lineage conforming the CCs. As depicted in Figure 4, each cell lineage in co-culture displays a specific expression and localization pattern for the protein markers. In particular, vimentin was highly expressed in the cytoskeleton of ECs (Figure 4, upper panel, red channel), a feature associated with cell-ECM focal adhesions and endothelial sprouting [31,32]. Similarly, VE-cadherin, the major endothelial adhesion molecule, was highly expressed in ECs, localized in the membranes at the junctions between the cells, and had low diffuse expression in the cytosol (Figure 4, lower panel, red channel). This localization of vimentin and VE-cadherin was observed in ECs both in monoculture (Supplementary Figure 1) and co-culture (Figure 4). In comparison, TNBC cells showed weak vimentin cytoplasmic/nuclear expression in monoculture (Supplementary Figure 1), while it was virtually undetected in TNBC cells arranged in the VM segments of the CCs (Figure 4 upper panel). As for VE-cadherin, low cytosolic and nuclear expression was identified in monocultures of TNBC cells (Supplementary Figure 1). However, when co-culturing TNBCs with ECs, nuclear and membrane localization of VE-cadherin was observed at higher magnification in the segments and branch intersections of TNBC VM-segments (Supplementary Figure 2). Nuclear HIF1A was found in both ECs and TNBC cells monocultures and CCs, with a more robust expression pattern in VM forming cells (Figure 4 upper panel, Supplementary Figure 1, green channel). On the other hand, while in EC monocultures HK2 signal was low and found mainly in the nuclear compartment (Supplementary Figure 1), in TNBC monocultures HK2 signal was high and localized with a diffuse pattern in cell nuclei and enriched at the cytoplasmic compartment (Supplementary Figure 1). Notably, when both cell lines were co-incubated, the expression of HK2 increased mainly in the cells engaged in VM (Figure 4, lower panel, green channel).
Regarding the receptors mediating angiogenic signals, we investigated the expression and localization profiles of FGFR1 and VEGFR2. As depicted in Figure 4 (middle panel), and Supplementary Figure 1, while monocultures showed practically undetectable expression of both receptors in ECs, a relatively high nuclear and cytoplasmic abundance of VEGFR2 and FGFR1, respectively, was observed in TNBC cells. When co-cultured, both receptors were more strongly expressed in the cells engaged in the tubular-like structures, showing a lower signal in the underlying ECs (Figure 4).
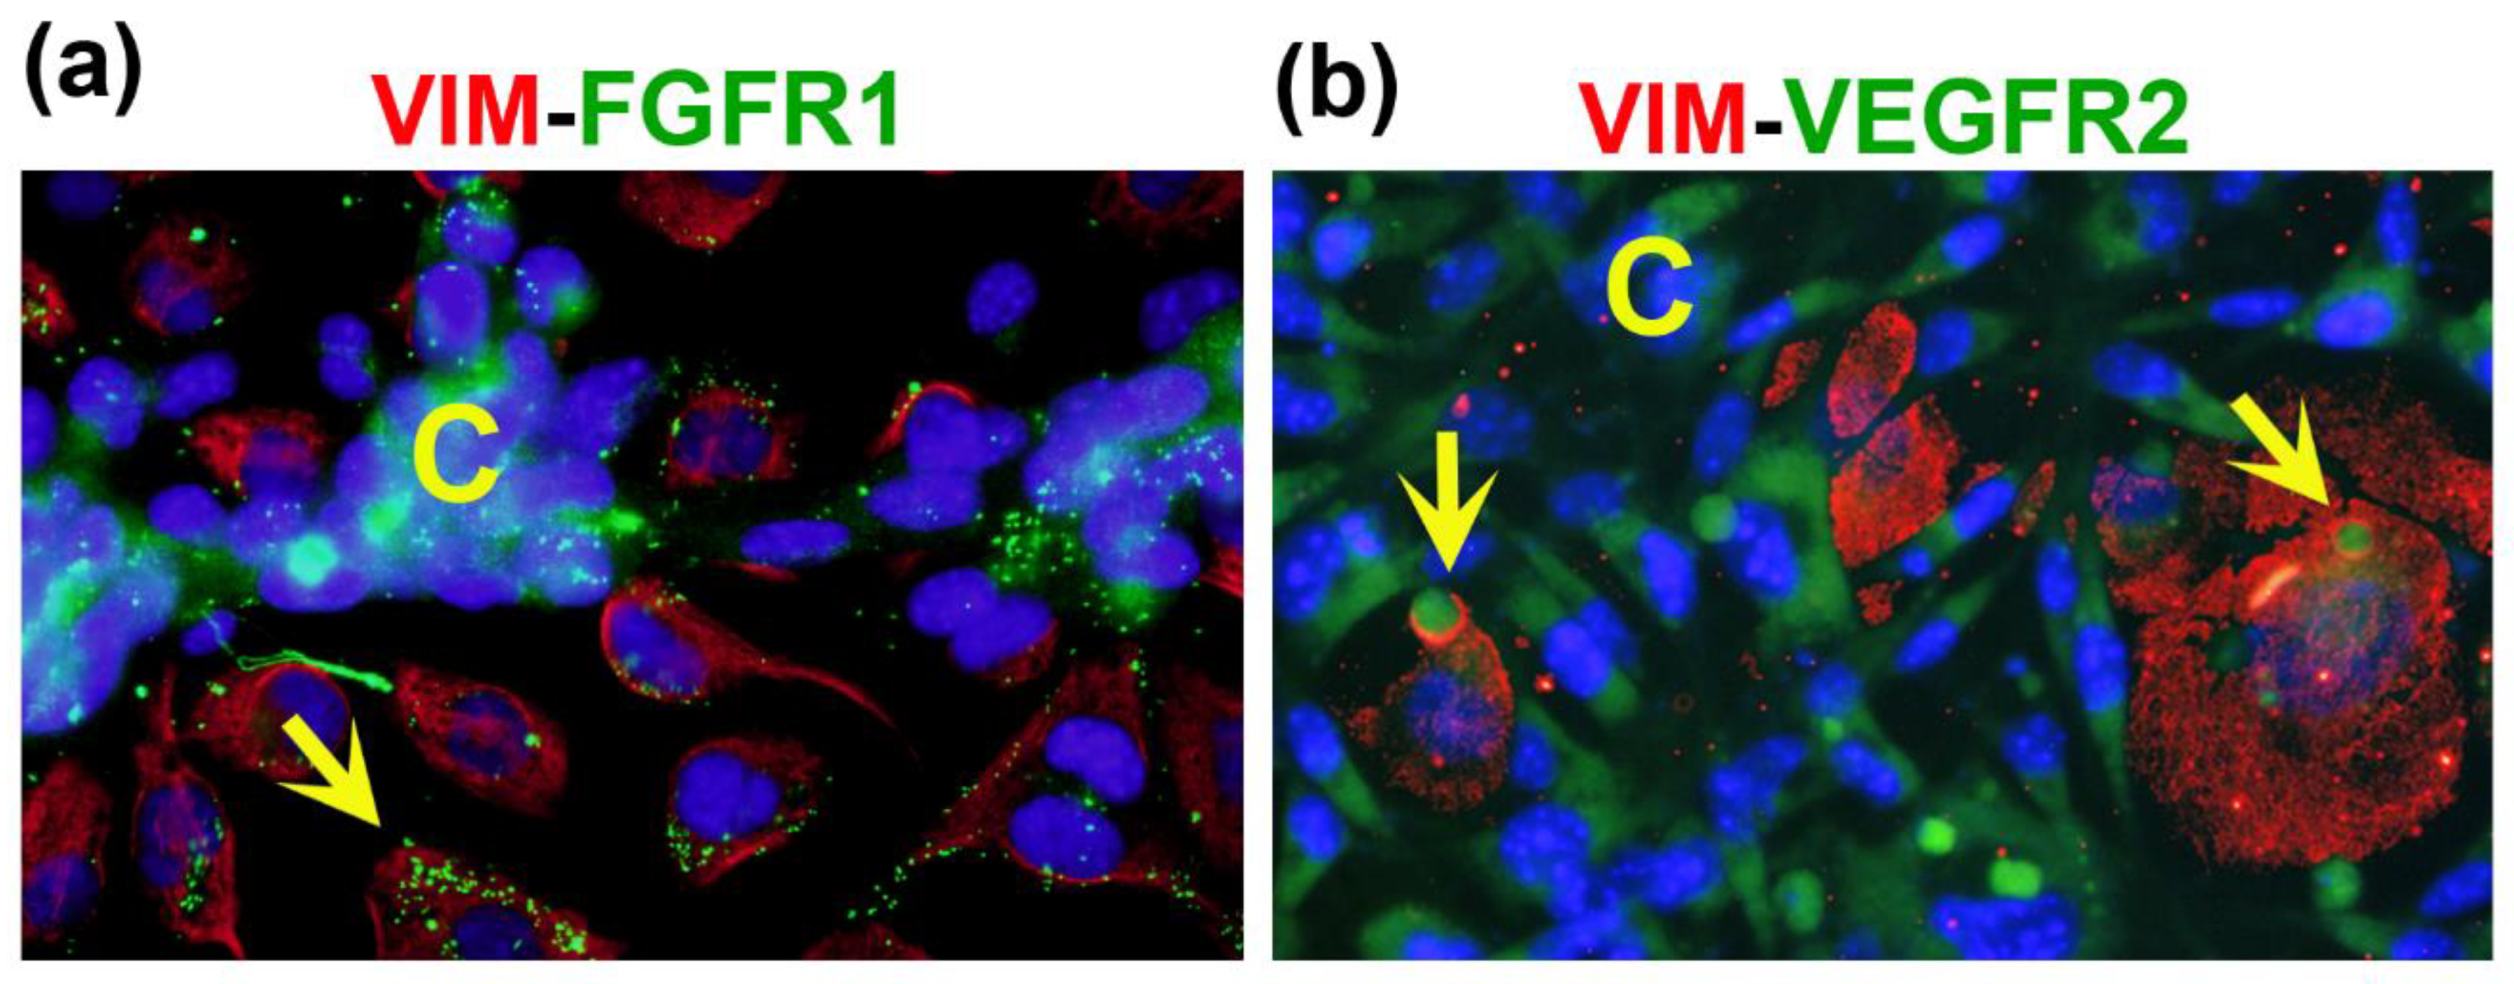
Notably, at a higher magnification, we observed the expression of FGFR1 and VEGFR2 in vesicles/vacuoles within the vimentin-positive donor ECs located near the branches of the VM networks (Figure 5a,b). In these images, vimentin was used to identify ECs (Figure 5, red channel), while both receptors can be visualized in the green channel. The increased expression of FGFR1 and VEGFR2 in cancer VM-forming cells, along with their specific localization pattern within the donor cells of CCs, suggest an important role for these receptors in intercellular communication, contributing to the formation of VM structures.

2.3. Co-cultured endothelial and TNBC cells modify the equilibrium of proangiogenic and anti-angiogenic molecules in the secretome, favoring a pro-VM microenvironment.

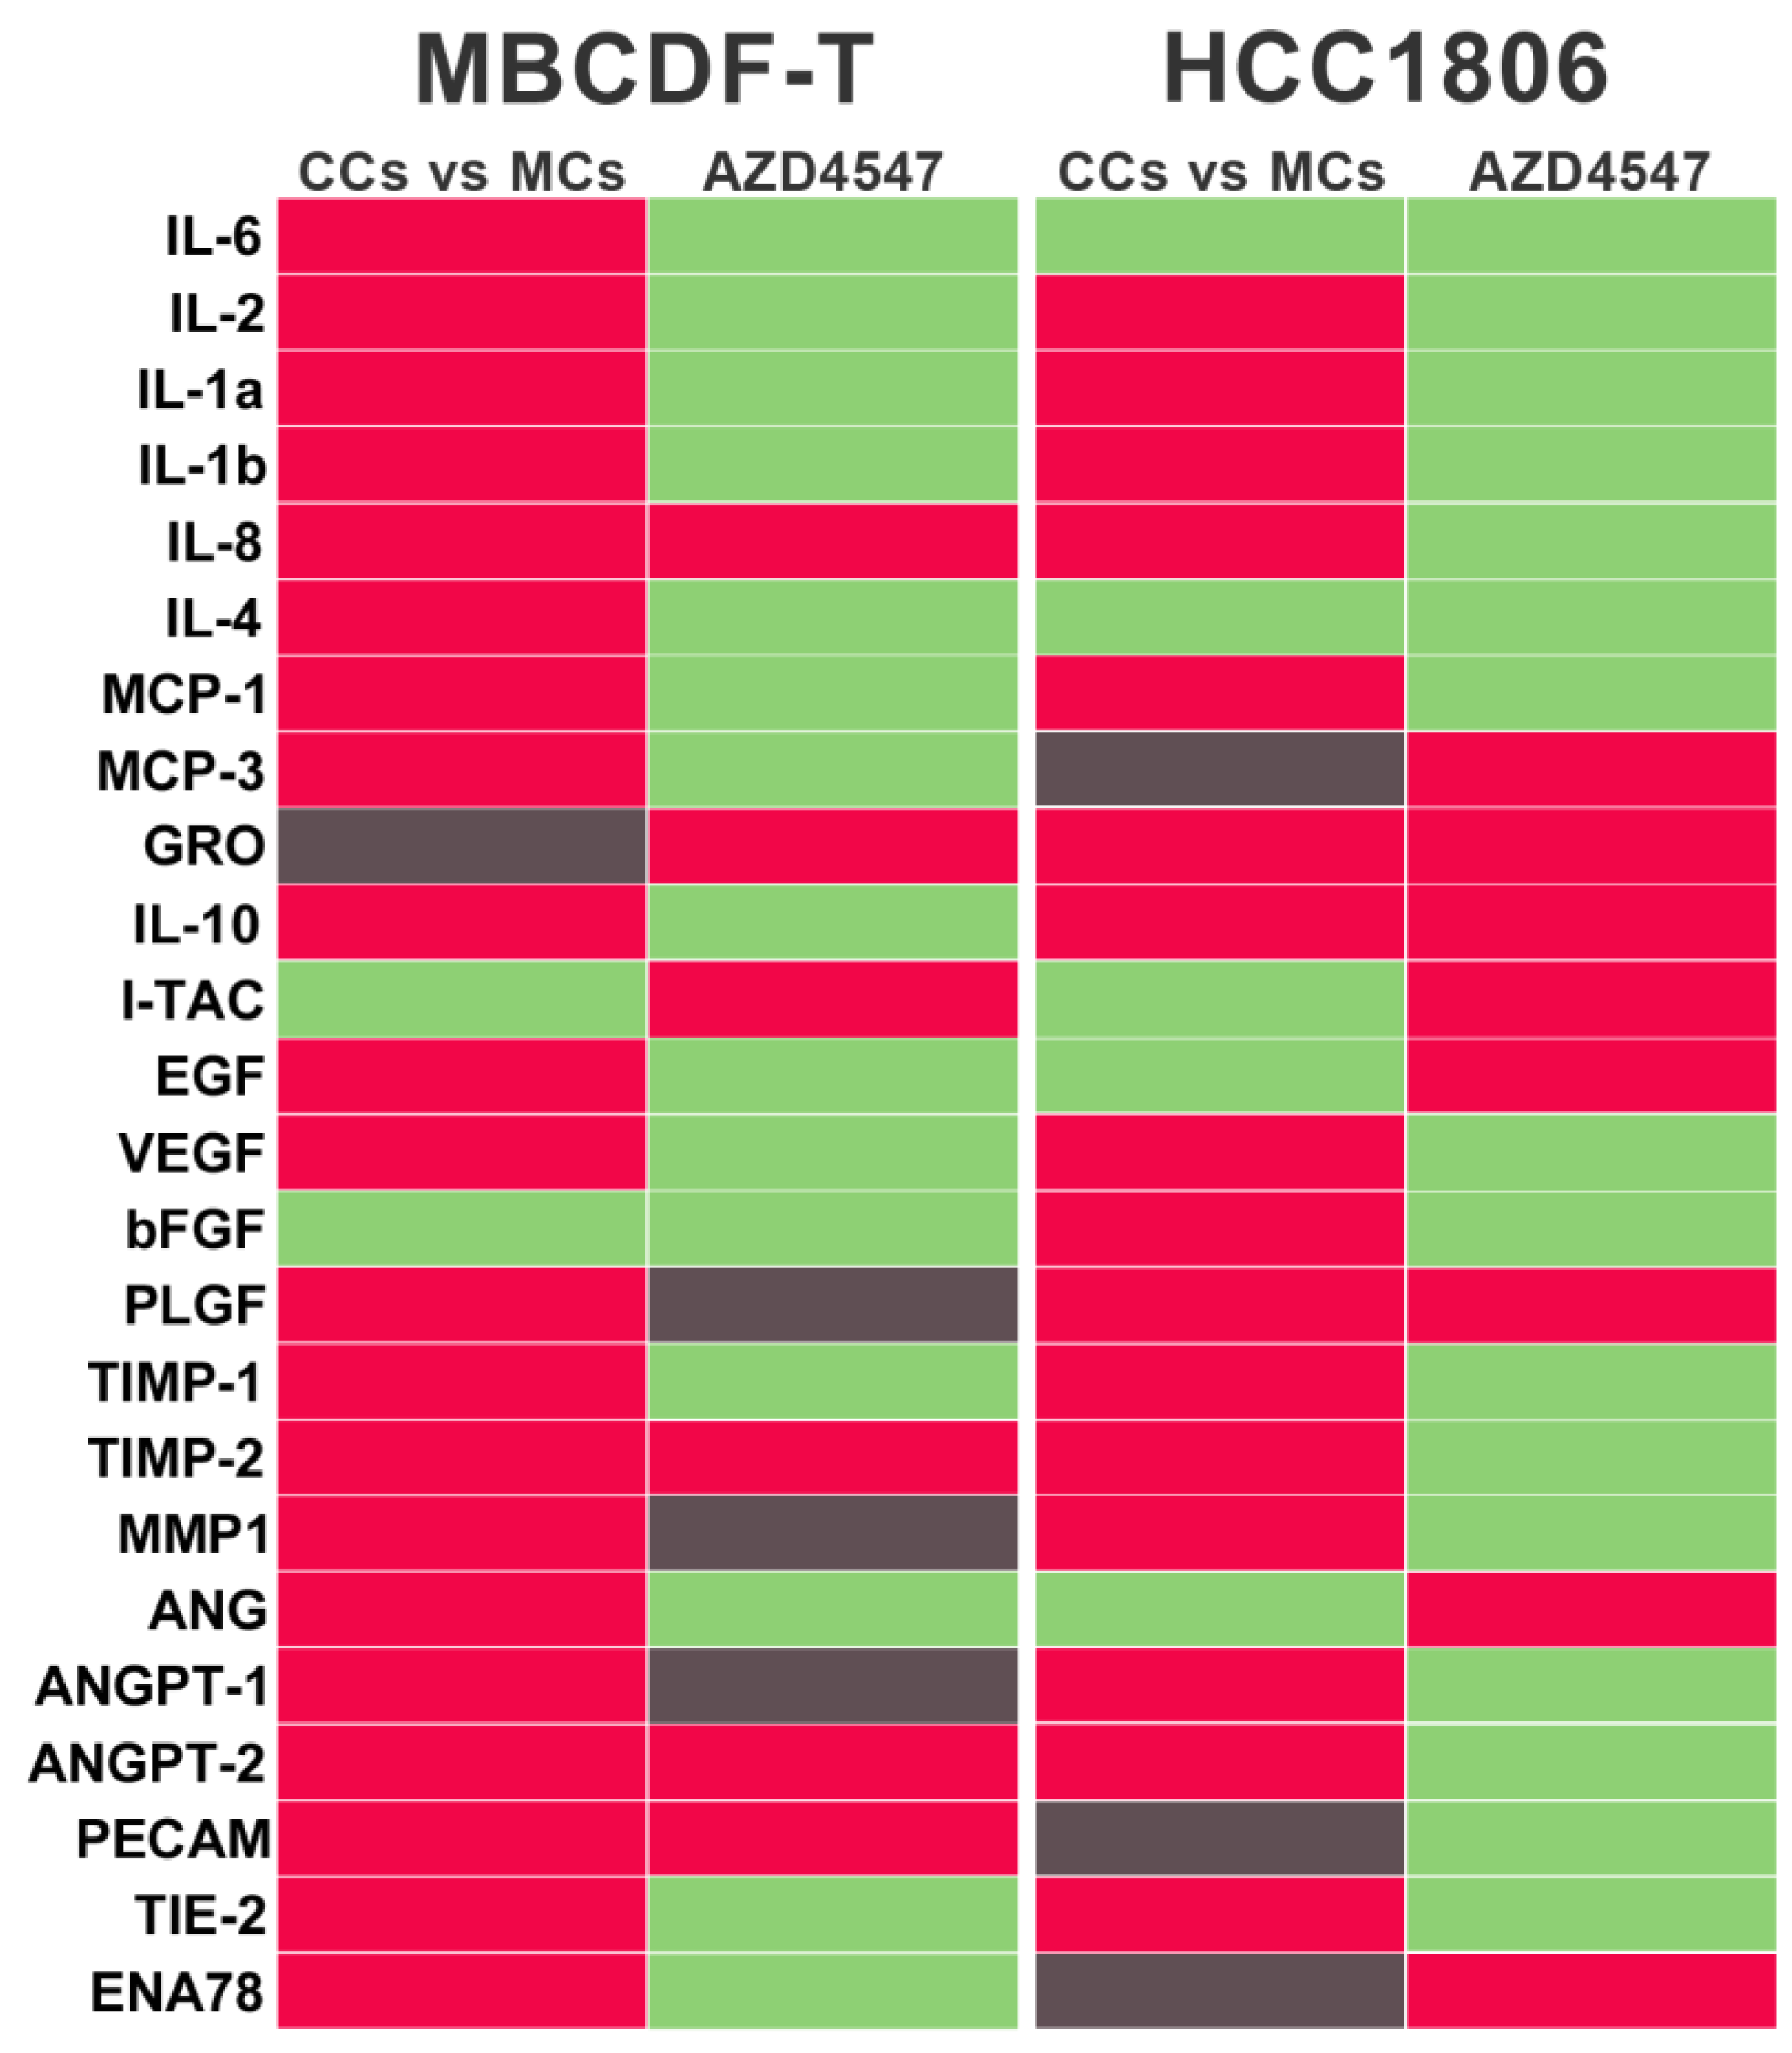
By modifying the microenvironment components of the tumor niche, cancer cells can recruit several types of cells from the host, including those with an endothelial, stromal, or immune lineage [33,34,35,36]. However, there is limited knowledge about the reciprocal communication between cellular components promoting VM. Therefore, we conducted an analysis of vasculogenesis-related factors in the secretome (conditioned media, CM) of EA.hy926 and TNBC cells mono and CCs, using a commercial angiogenesis antibody array. Surprisingly, in the CM from TNBC cells, many targets in the array were either undetected or present at very low levels, particularly in MBCDF-T cells. In contrast, the secretome from ECs was relatively more enriched in the analyzed components (Supplementary Table 1). Among the proangiogenic factors more highly detected in the CM from ECs (considering a normalized densitometric value > 0.01), were interleukin (IL)-8, IL-6, IL-4, monocyte chemoattractant protein-1 (MCP1), FGF, angiogenin (ANG), epithelial-neutrophil activating peptide (ENA78) and placental growth factor (PLGF). In comparison, among the anti-angiogenic factors, a high abundance of the tissue inhibitors of metalloproteinases (TIMP)- 1 and TIMP-2 and C-X-C motif chemokine ligand 11 (CXCL11, I-TAC) and angiopoietin-2 (ANGPT2) was found (Supplementary Table 1). The combination of these factors suggested an equilibrium between pro- and anti-angiogenic molecules, possibly favoring a deactivated angiogenic switch, explaining the lack of angiogenesis in monocultured ECs. However, when both cell lineages ECs and cancer cells were co-cultured, the abundance of several proangiogenic factors increased compared to the CM of monocultured ECs, including several cytokines, chemokines, and growth factors (Figure 6, red color and Supplementary Table 1). Notably, matrix metalloproteinase (MMP)-1 and VEGF were highly induced, together with IL-8 and MCP-1. FGF was also induced, but only in the EC-HCC1806 CCs. On the other hand, whereas the abundance of TIMPs was increased in the CM from CCs (Figure 6 red color, and Supplementary Table 1), the anti-angiogenic molecule I-TAC was considerably reduced, way below the threshold of 0.01 in both TNBC cells CCs (Figure 6, green color, and Supplementary Table 1). In a similar way as observed with comparisons against CM from ECs, when compared with the CM from monocultured TNBCs, many pro-VM factors were increased when both cell lineages were co-incubated, especially MMP1, ANGPT-1, and inflammatory cytokines, while I-TAC was downregulated in HCC1806 (Supplementary Table 1). Considering this, the results suggest a shift in the balance of proangiogenic factors and endogenous angiogenesis inhibitors, promoting activation of the VM switch when both ECs and TNBC cells were co-incubated.
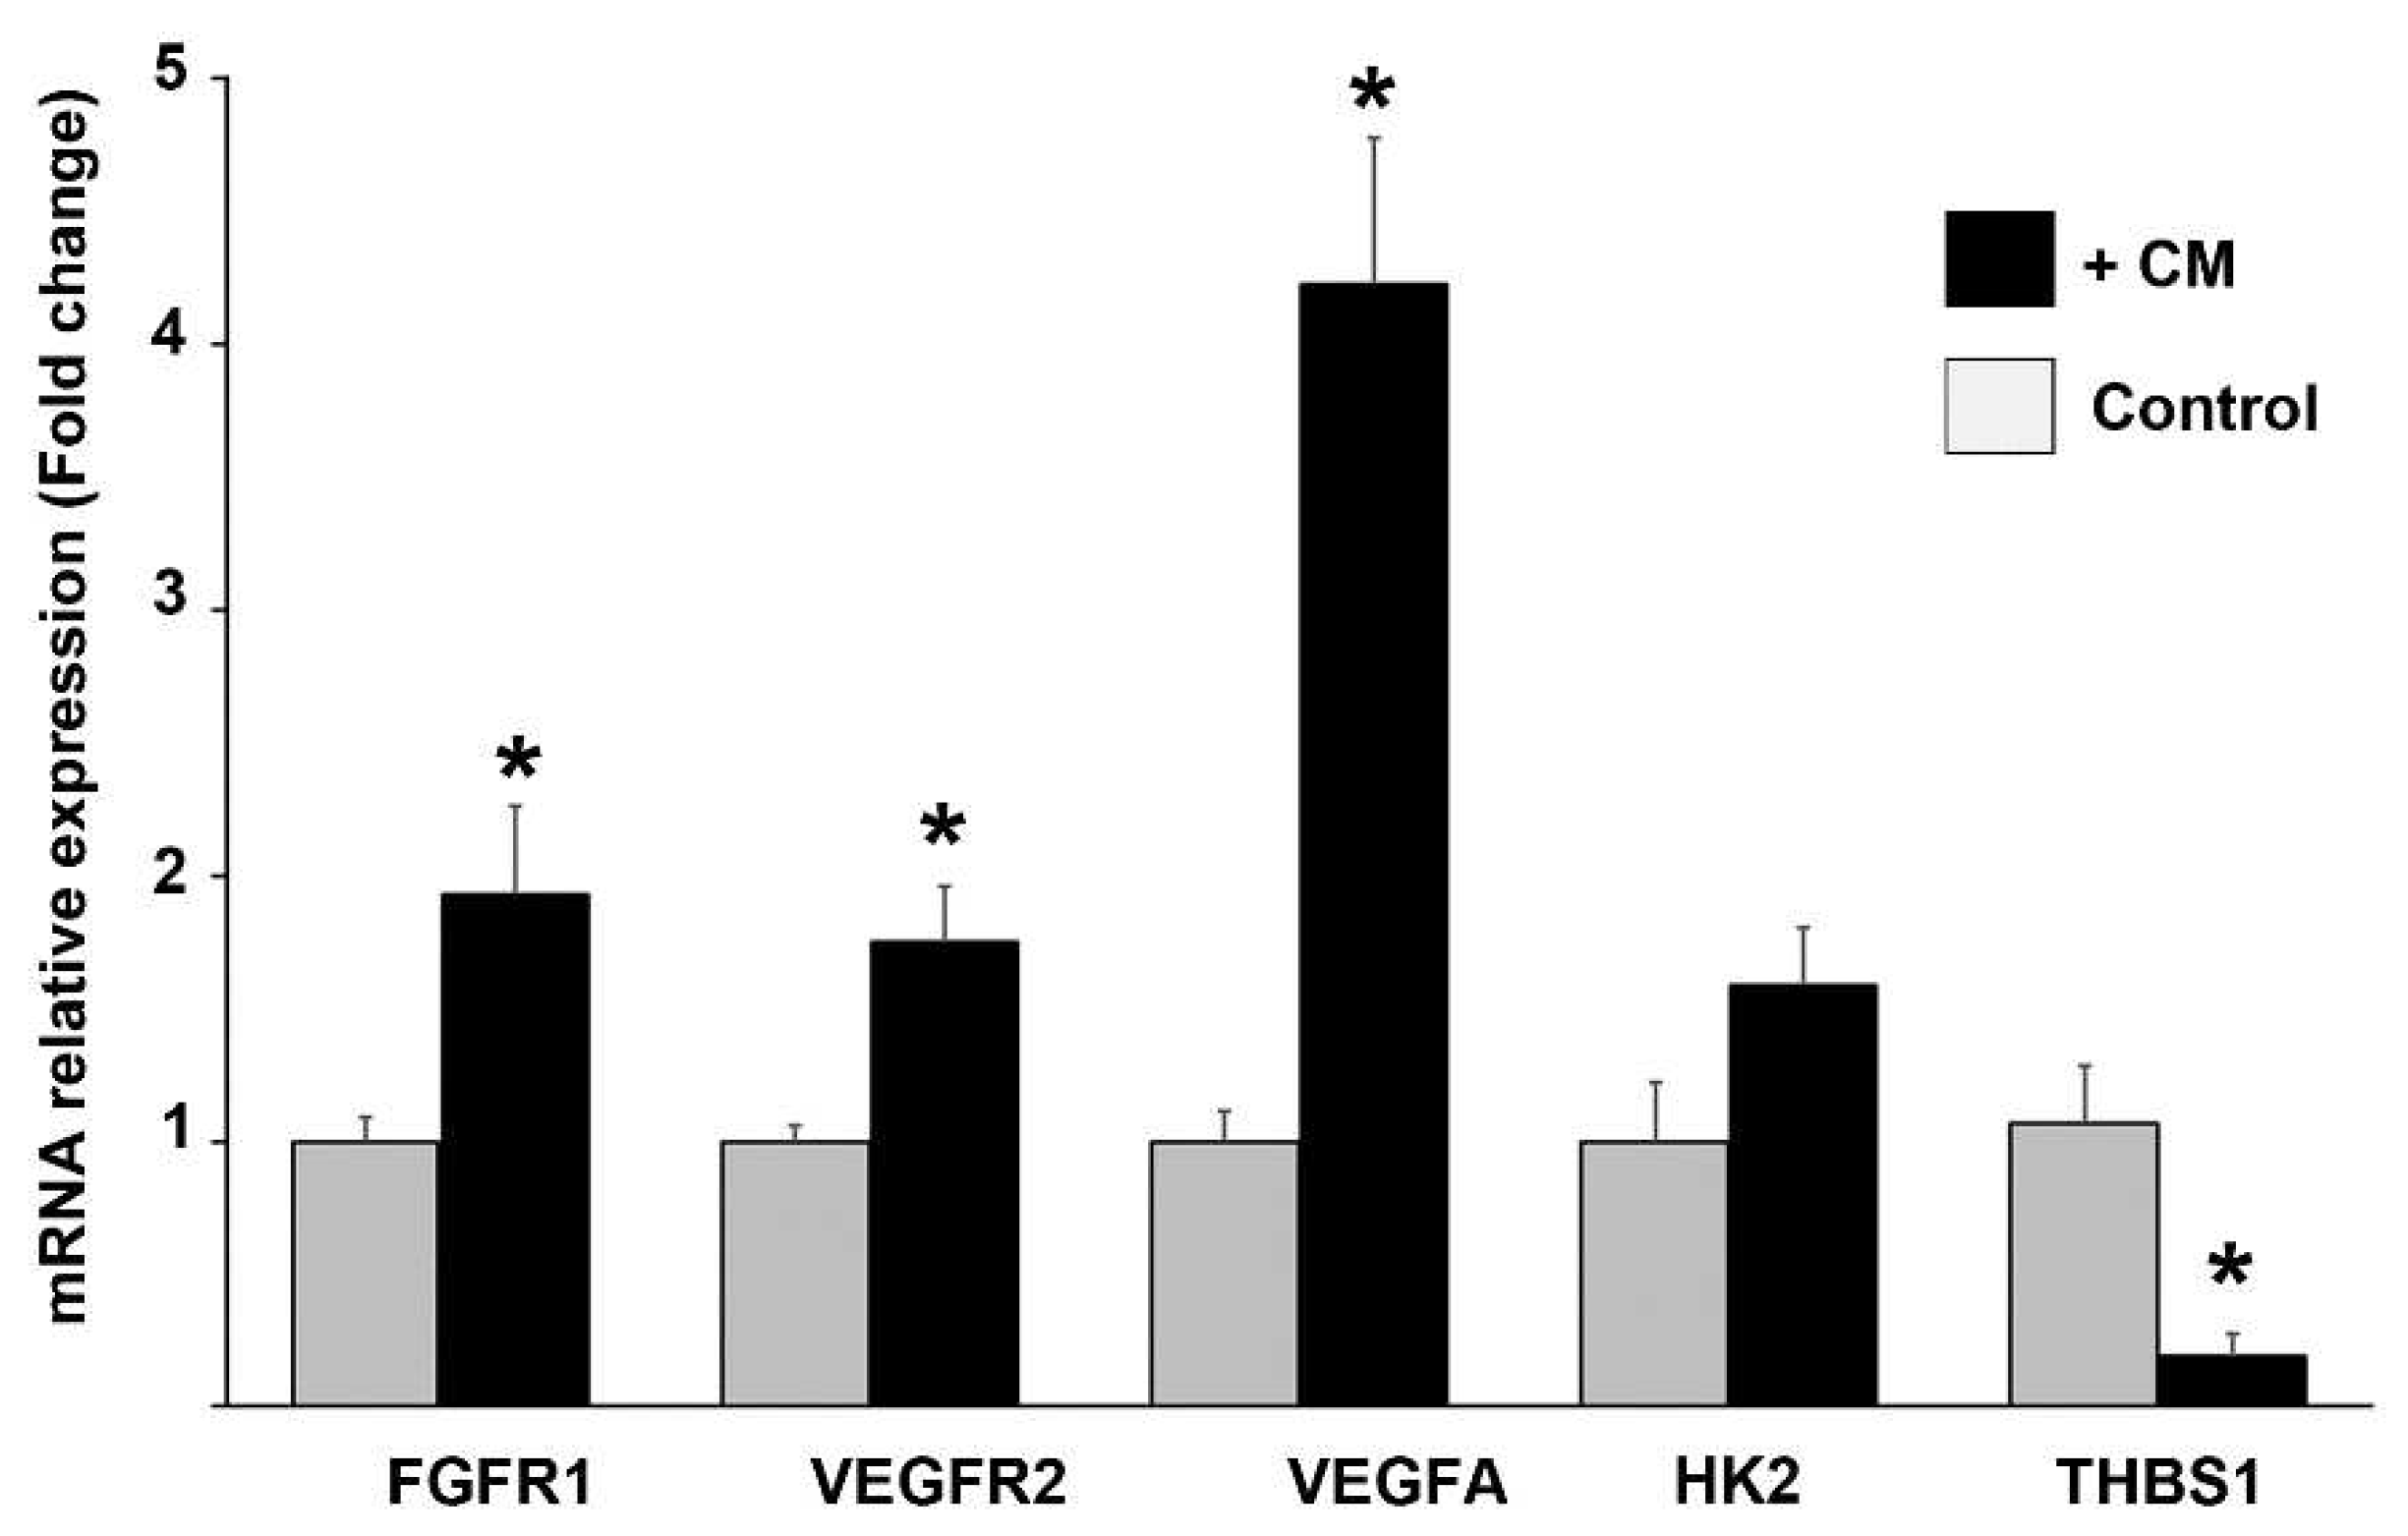
At this point, the evidence suggests that the endothelial lineage plays a crucial role in engaging TNBC cells into VM formation; however, given the pattern of VEGFR2 and FGFR protein expression in the donor cells located in close contact with the VM segments, we wondered if TNBC cells induced endothelial cells reprogramming by reciprocally interacting with them. So, to investigate this we studied the regulation of mRNA expression of selected markers in ECs exposed to the secretome from CCs. For this, we incubated EA.hy926 cells in the presence of CM from CCs, and determined the relative mRNA expression of FGFR1, HK2, VEGFR2, VEGFA and the negative regulator of angiogenesis thrombospondin-1 (THBS1). As depicted in Figure 7, and as compared with ECs incubated with control media, CM from CCs induced the gene expression of all these angioregulatory factors, except for THBS1, which was significantly downregulated, corroborating the promotion of a proangiogenic profile in ECs exposed to CM from cancer cells (Figure 7).
On the other hand, incubation of MBCDF-T cells with the CM from CCs resulted in the induction of the stemness markers OCT4, SOX2, KLF4, and MYC (Table 1). Of note, the gene expression of SOX2 and KLF4 was only detected after exposure of cells to CM. It is noteworthy mentioning that the stemness phenotype has been shown to significantly contribute to the malignant biological behavior of dormant polyploid giant cancer cells, prompting them to form VM [37]. Worth mentioning that the exposure of monocultures (ECs or TNBC cells) to the CM of CCs did not result in the formation of tridimensional tubular structures, probably due to the lack of ECM factors produced by the physical interaction between the two cell lineages. However, changes in morphology could be noticed, particularly in the polarity of the cells (data not shown).
All considered, the results suggest that by interacting with TNBC cells, ECs act as the main contributors of soluble factors into the CCs secretome to establish a vasculogenic microenvironment suitable for VM development by inducing in TNBC cells stem-cell-like characteristics. However, ECM components produced by the interplay of ECs and TNBC cells also play an important role in this process.

2.4. VM capacity of TNBC in co-cultures is regulated by FGFR1/PI3K/Akt pathway.

The FGF-FGFR axis is one of the most relevant proangiogenic signaling mediators activating both ECs and cancer cells and is closely involved in VM formation [19,20,38]. Considering the latter, together with the high FGFR1 expression observed in VM-engaged TNBC cells, and given that FGFRs activation triggers the PI3K-Akt pathway [22,23], we explored the effect of blocking this pathway upon VM formation.
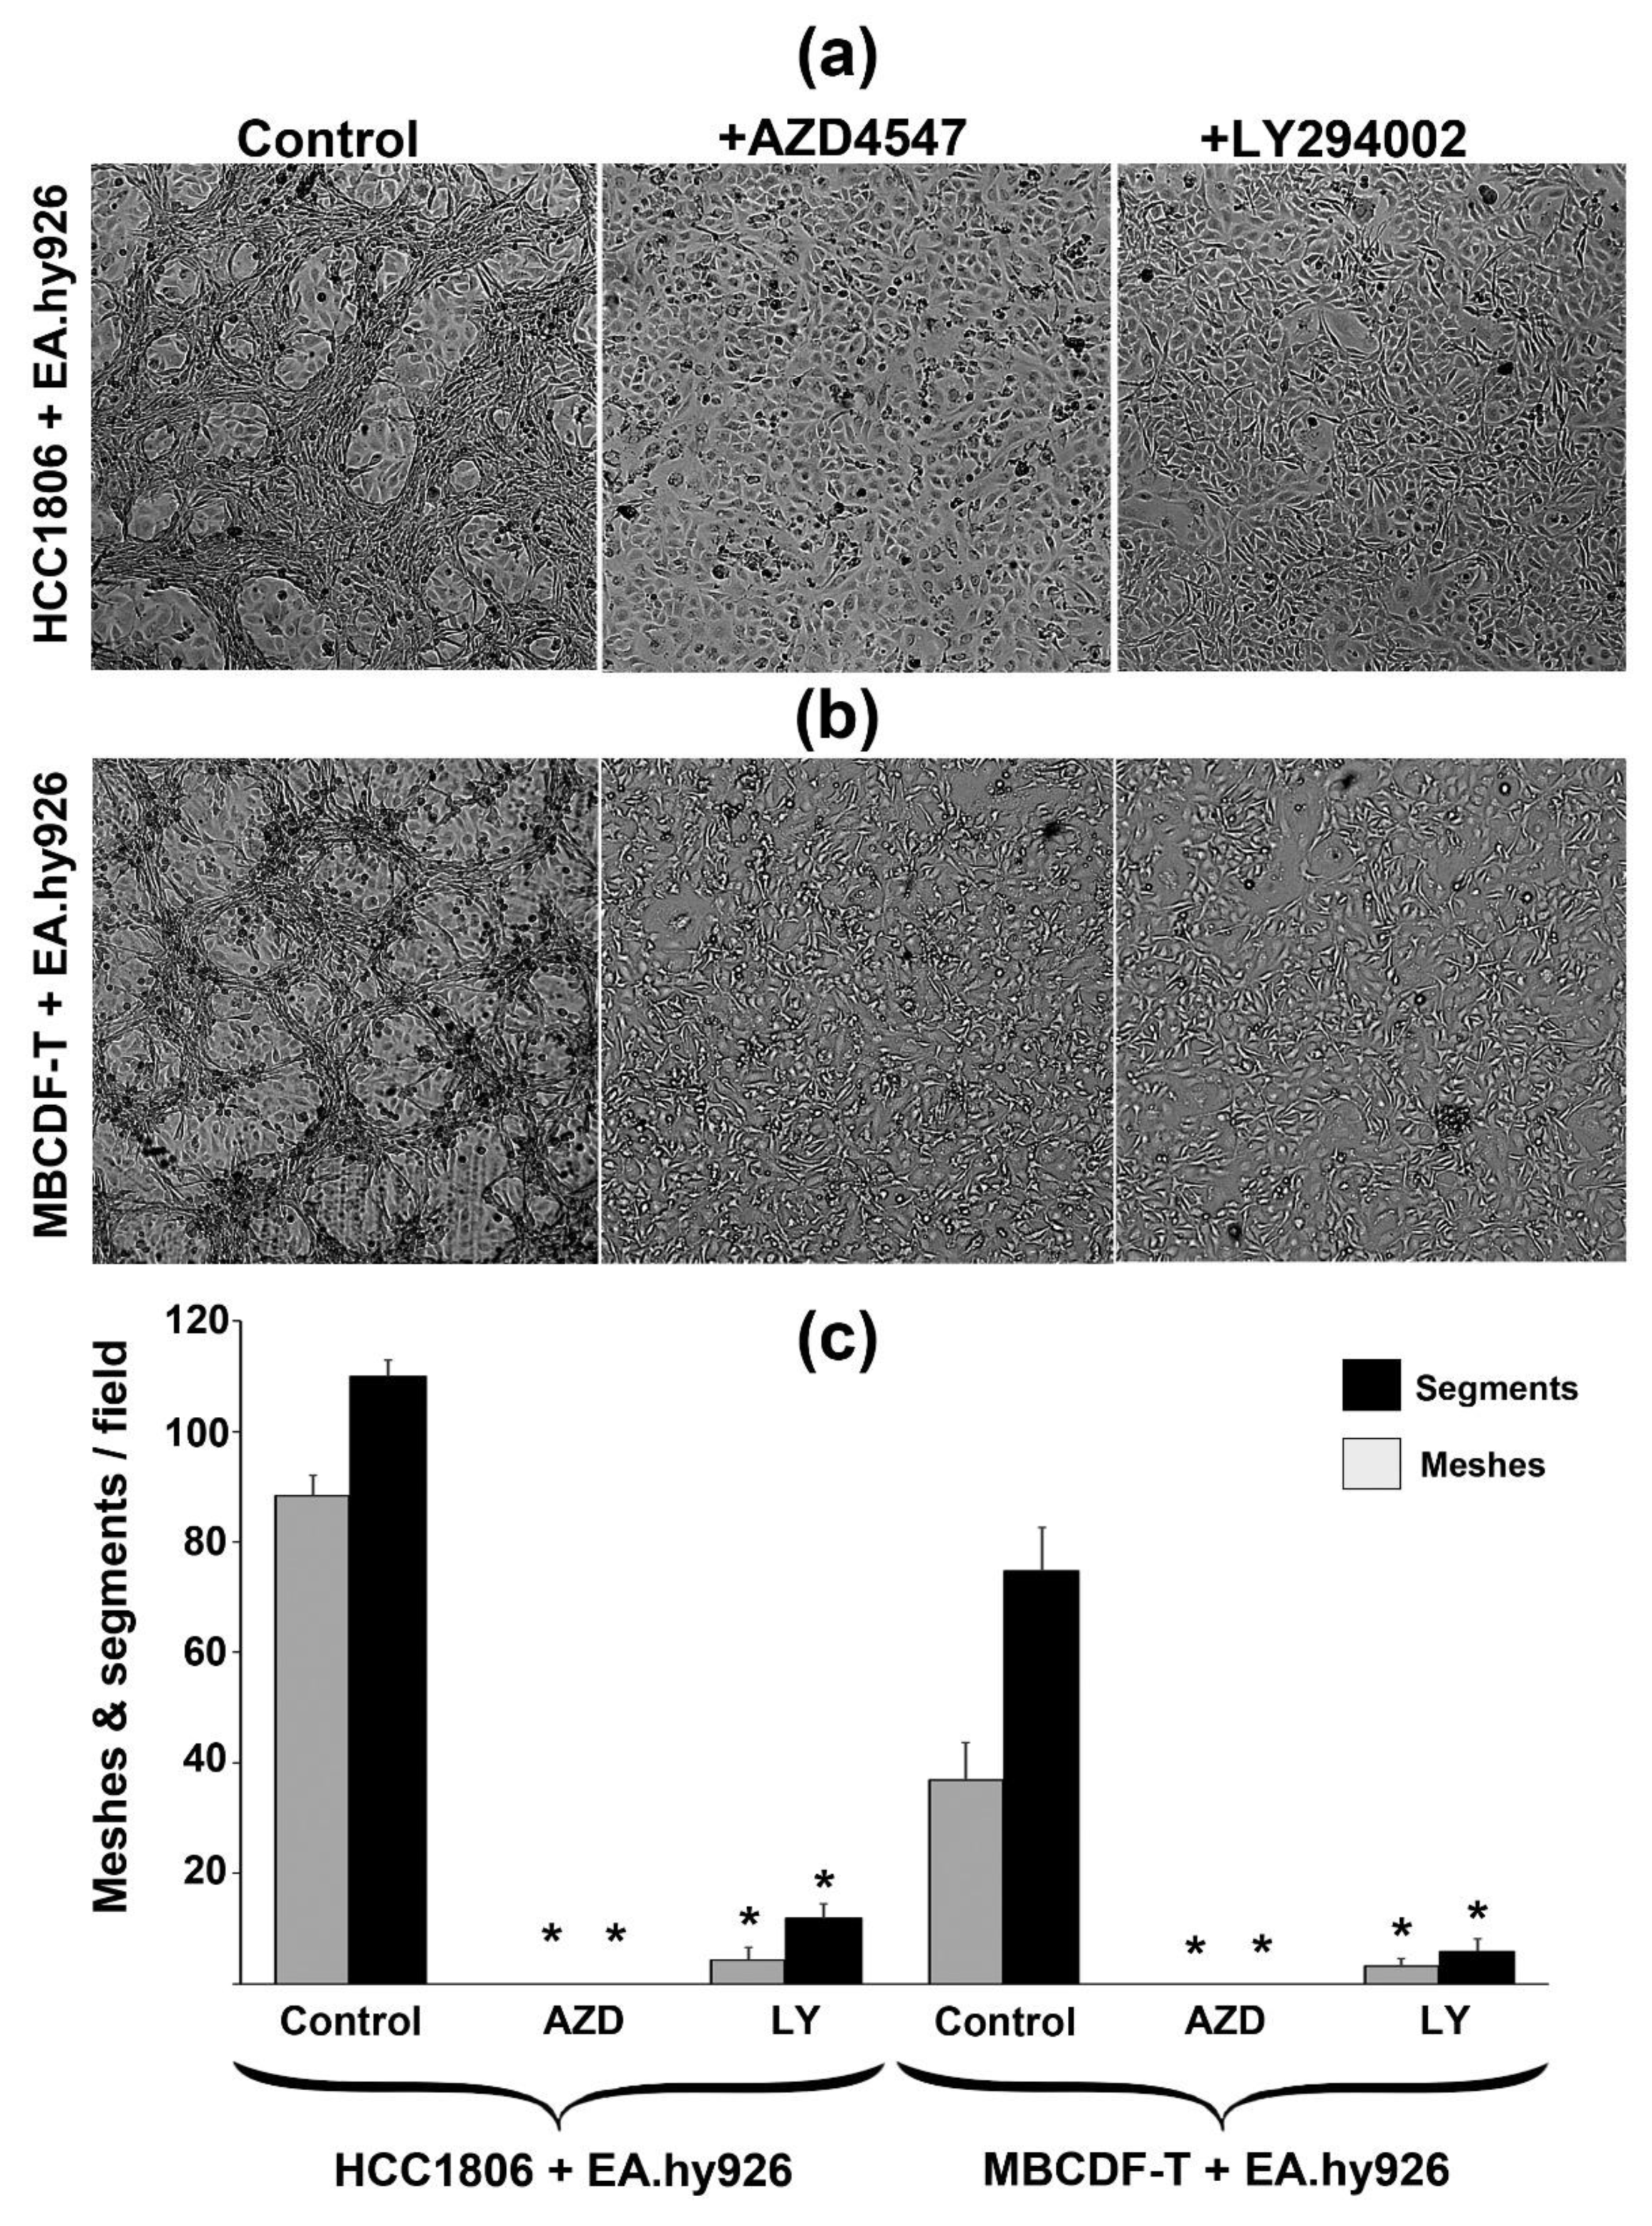
First, to confirm the involvement of FGFR signaling in the VM capacity of TNBC cells, we used AZD4547, a selective FGFR inhibitor. ECs-TNBC cells CCs were exposed to 5 µM AZD4547 for 2 days. As shown in Figure 8, inhibition of FGFRs with this compound disrupted the formation of tubular-like structures, while untreated control CCs readily formed VM. To identify downstream VM-associated signaling pathways, we blocked the PI3K-Akt axis by using the PI3K-inhibitor LY294002. As depicted in Figure 8, the presence of 6 µM LY294002 almost completely abolished the formation of tube-like structures. Morphological changes were observed in the AZD4547-treated TNBC cells, specifically, shrinking and a more spherical form, contrasting with the spindle-shaped form observed when forming tubular like-structures. In contrast, there were no apparent cellular shape changes in the co-cultured ECs (Figure 8).
Thus, both FGFR and PI3K inhibitors displayed similar VM-disrupting effects, suggesting that the activation of the FGFR/PI3K-Akt axis is responsible for triggering TNBC cells VM capacity and the ability of ECs to promote an angiogenic environment.
Further, to explore which secretome components were being affected by AZD4547 in the CCs, we compared the angiogenesis array results obtained with CCs in the presence or absence of this FGFR-inhibitor. As depicted in Figure 6 and Supplementary Table 1, several pro-VM/angiogenic factors that had been upregulated by co-culturing ECs and TNBC cells were readily downregulated by AZD4547, considering at least one TNBC cell line (Figure 6, green color, and Supplementary Table 1). Notably, this effect was observed for various cytokines, chemokines, and growth factors, including the most abundant ones: MMP-1, VEGF, IL-8 and MCP-1. Interestingly, the anti-angiogenic I-TAC, which had been downregulated in the CCs, was upregulated by AZD4547 (Figure 6, green color, and Supplementary Table 1).

3. Discussion

Vasculogenic mimicry is an alternative vascularization mechanism that aggressive tumors develop to obtain oxygen and nutrients either in response to specific tumor microenvironment-derived factors or after exposure to therapeutic treatments [1,2,3,7,8]. Although VM is clinically relevant due to its association with poor prognosis and metastasis, the available in vitro models to study this process are scarce and limited. These models are generally restricted to the interaction between cancer cells and commercially available ECMs, which contain a standardized set of extracellular matrix proteins and growth factors. Herein, we characterized a simple CC model to study VM in vitro, that considers the interplay between cancer and endothelial cellular components, mimicking the in vivo tumor microenvironment more accurately. The CCs allow to explore the physical interaction between TNBC cells and ECs, which are known to stimulate VM in breast cancer through paracrine signaling [10,25], while at the same time considers the mixture of VM-driving factors produced by their mutual communication. Numerous studies have previously reported models of tumor cells-ECs interaction; however, they were used to address angiogenesis, ECs proliferation, or cross-talk between cancer cells and ECs, but not VM formation [13,39,40,41,42]. Nonetheless, the paracrine effects of ECs on tumor cell behavior have been described [12]. While in our study the ECs in monoculture underwent polarity changes after exposure to CM from TNBC cells, in the CCs, endothelial angiogenesis was ruled out by labeling each cell lineage separately, corroborating VM formation by TNBC cells. We believe that angiogenesis was not developed in CCs due to the balance between specific factors induced by the physical interaction between ECs and cancer cells. In particular, the high abundance of the anti-angiogenic TIMPs, together with the high plasticity of TNBC cells, may have overridden endothelial angiogenesis. Supporting this, in ECs, TIMP-2 has been shown to abolish proangiogenic factors-induced proliferation [43], and to disrupt FGF-2-stimulated mitogenesis [44]. Interestingly, in our in vitro model VM was formed using two different TNBC cell lines, further corroborating that this malignant cell phenotype overrides ECs-dependent angiogenesis when closely interacting. Thus, the cancer component more likely engages ECs into providing pro-VM factors. Among the tumor microenvironment cellular components affecting tumorigenesis, both SCs and ECs are relevant. However, only ECs were able to induce VM in the CCs, even though mesenchymal SCs are known to promote tumor angiogenesis and metastasis [45]. Therefore, we concentrated on studying ECs-TNBC cells interaction for VM formation.
Regarding the plasticity of cancer cells, this feature is characteristic of stem cells that can go through VM, allowing for the transition into endothelial-like phenotype, poor differentiation and metabolic reprogramming [5,6,8,35,46]. We were able to characterize several markers of these processes in our CCs. In particular, VE-cadherin, a critical adhesion molecule expressed in ECs and cancer cells able to perform VM [4,47], was found in the TNBC-VM structures. This finding is an important fact since VE-cadherin is known to promote VM [47]. For example, HER2 overexpression enabled MCF-7 breast cancer cells to form VM only if VE-cadherin protein was also over expressed [48]. This evidence, together with our findings, suggest that VE-cadherin is a central link to VM formation regardless of the cell phenotype. Similarly, the status of HK2, an enzyme highly associated with metabolic reprogramming, was increased in the TNBC-VM segments. However, they were completely vimentin-negative, suggesting that the two TNBC cell lines tested herein were not going through epithelial-to-endothelial transition, nor epithelial-to-mesenchymal transition when forming VM. Instead, they gained stemness markers, as observed by RT-qPCR increased gene expression of MYC, OCT4, SOX2 and KLF4, otherwise known as the Yamanaka reprogramming transcription factors, and whose co-expression is sufficient to induce pluripotent stem cells [49]. Of note, several authors have pointed out that stem-like cancer cells are the ones responsible for VM formation and increased malignant behavior in distinct types of tumors [6,37,50]. Similar to our findings, the increase in stem cell markers gene expression in MCF-7 cells has been reported in a standardized protocol following indirect co-culture with ECs, although VM was not reported [42]. Altogether these evidences further support that the induction of the stem phenotype enables breast cancer cells to conform VM structures.
It is known that the activation of the angiogenic switch induces cellular metabolic and phenotypic changes [51,52]. So, we explored the composition of the secretome, as well as the gene expression profile of ECs exposed to TNBC-CM. We found that angiogenesis-associated modulators were upregulated in the CCs while some anti-angiogenic ones were downregulated. For example, I-TAC, also known as CXCL11, has been shown to exert anti-angiogenic/angiostatic properties through its binding to the CXCR3 receptor [53,54]. In our CCs, I-TAC abundance was reduced as compared to monocultures in the angiogenesis array. Interestingly, a study using the rabbit cornea micropocket model found that CXCR3 agonists were able to inhibit the angiogenic activity of IL-8 [55]. So, it is reasonable to believe that I-TAC downregulation favored IL-8 pro-vasculogenic effects in our CCs. Several molecules involved in angiogenesis are also related to VM induction [8,21]. One of them is in fact IL-8, which was among the most abundant factors in the CCs secretome, as compared to monocultures CM. Notably, IL-8 inhibition has been reported to restrain VM in TNBC MDA-MB-231 cells [56]. Other upregulated factors in the CCs CM included various cytokines, MMP1, MCP-1, ANG, and PLGF, which have also been associated with VM and angiogenic processes [1,8,57].
Supporting the protein array, genes in ECs related to the angiogenic phenotype underwent transcriptional reprogramming when exposed to TNBC CM; for example, FGFR1, VEGFR2, VEGFA, and HK2 were upregulated, while THBS1 was downregulated. Other authors have also shown transcriptional reprogramming of ECs when exposed to the secretome of tumor cells, for instance, the co-culture of glioma cells with HUVEC ECs, resulting in their activation and the formation of net-like structures, secondary to the release of self-activating factors, such as FGF [39]. In addition, we observed by immunocytochemistry that FGFR1 and VEGFR2 were expressed in cancer cells engaged in VM, and interestingly, they were also present in vesicles of donor ECs. This finding is consistent with other reports proposing extracellular vesicles and/or exosomes as microenvironment elements supporting tumor progression through favoring angiogenesis and cancer cell reprogramming [58,59,60]. Indeed, extracellular vesicles can contain as cargo a variety of angiogenic factors, such as ANG, IL-6, IL-8, and VEGF, or even mRNA, which can be incorporated by cells of the tumor microenvironment, changing their behavior [61]. For instance, VEGF-enriched exosomes released from ECs after an anti-angiogenic treatment significantly promoted VM in hepatocellular carcinoma [62]. Altogether these pieces of evidence support the cross-talk between tumor cells and donor ECs to promote tumor vasculogenesis, warranting further research.
As it is known, and as shown herein, one of the mechanisms involved in the VM capacity of TNBC cells is the gaining of stemness features. Therefore, considering that FGF-FGFR signaling is highly involved in the maintenance of stemness and metabolic reprogramming in cancer cells [63,64], we hypothesized that FGFR could be a main driver of VM in our in vitro model. Moreover, in malignant glioma cells, the pharmacological inhibition of FGFR has proved to be sufficient for VM impairment, while suppression of FGF signaling impaired the metabolism of ECs [15,65,66]. So, we explored the possibility of blocking VM in TNBC cells using an FGFR-inhibitor. First, we were able to show that FGFR1 was not only expressed in the TNBC cells engaged in VM but also in the donor ECs neighboring the branches of the cancer networks, strongly suggesting the involvement of this receptor in the intercellular communication during VM. Remarkably, the blockade of FGFR signaling in the CCs using AZD4547 completely prevented TNBC tube-like network formation. This result is in line with very recent reports showing that Receptor Interacting Protein Kinase 1 (RIPK1)-dependent necroptosis promoted VM formation in TNBC cells [67], while AZD4547 potently inhibited necroptosis by selectively targeting RIPK1 [68]. Similarly, AZD4547 has been shown to inhibit stemness features in the BT-474 breast cancer cell line, including MYC gene expression [64], providing additional rationale for using AZD4547 to avoid VM formation. In addition, in our study, AZD4547 was able to downregulate several pro-VM/angiogenic factors, as shown in the protein array, while it upregulated I-TAC accumulation. Notably, as reported previously [53,54] and as discussed earlier in this paper, I-TAC has antiangiogenic/angiostatic effects, while high levels of this chemokine have been shown to exert antitumor immunity in breast cancer [69]. Nevertheless, its impact on VM formation has not yet been studied, and deserves further research.
Finally, knowing that PI3K-Akt is involved in VM activation [10], we pharmacologically inhibited this signaling pathway with LY294002 and found that VM was suppressed, further suggesting that the FGFR/PI3K-Akt axis was a main regulator of VM in our CCs. Other works have previously shown that FGFR or PI3K/Akt inhibition can impair both angiogenesis and VM in different types of cancer, and that the pan-FGFR inhibitor PD173074 impaired VM in cultured TNBC cells [38,65,70,71,72]; however, to our knowledge, this is the first report of VM inhibition in breast cancer by AZD4547 and LY294002, warranting future clinical studies. Of note, phase 1 and phase 2 studies have shown that AZD4547 is active and relatively well tolerated in patients with solid tumors, including breast cancer [73,74].
In summary, herein we show that the bidirectional cross-talk between ECs and TNBC resulted in the formation of a proangiogenic microenvironment involving a mixture of cytokines and growth factors promoting VM via the PI3K-Akt signaling pathway, that can be readily inactivated by AZD4547 and LY294002. Thus, our results demonstrate the therapeutic potential of AZD4547 and LY294002 for VM prevention in breast cancer. The co-culture system used herein may serve as a valuable tool to further study endothelial-dependent VM formation, as well as potential therapeutic strategies to abrogate it.

4. Materials and Methods

4.1. Reagents

Trizol was acquired from Life Technologies, Carlbad, USA. LightCycler TaqMan Master was from Roche (Roche Applied Science, IN, USA). The reverse transcription (RT) system (Maxima™ Reverse Transcriptase) was from Thermo (Thermo-Scientific, St. Louis, MO, USA). The compound LY294002 in solution was from Calbiochem, La Joya, CA, USA, while AZD4547 (AstraZeneca) was acquired from Santa Cruz (Santa Cruz Biotechnology Inc., Dallas, TX, USA).

4.2. Cell cultures

We used two different TNBC cell lines; MBCDF-T which was derived from an invasive ductal breast carcinoma primary cell culture [75,76], and the other one acquired from the American Type Culture Collection (HCC1806, CRL-2335, repository of cell lines from “Programa de Investigación en Cáncer de Mama” Universidad Nacional Autónoma de México). For the co-culture models, we used the human SC endometrial cell line N30, donated by Dr. Robert Taylor (Department of Obstetrics and Gynecology, Wake Forest School of Medicine Winston Salem, NC, USA), as well as the human endothelium cell line EA.hy926 (American Type Culture Collection CRL-292). All cell lines were maintained in supplemented medium [DMEM-F12 medium, 100 units/mL penicillin, 100 μg/mL streptomycin, 5% fetal bovine serum (FBS)].

4.2.1. Mixed CCs

We used mixed CCs to assess the role of stroma and endothelium on the VM capacity of TNBC cells. Two cell lineages were simultaneously seeded: ECs/TNBC or SCs/TNBC cells (1:1 ratio, 250,000 each cell line) on glass coverslips placed into 6-well plates and incubated with 2 mL of supplemented medium under standard culture conditions. Control cultures with single cell lines were also undertaken. Bright-field images were captured in each case. After 48 h of culture, cells were fixed and processed to further study tube formation and specific VM markers expression by fluorescent immunocytochemistry as described below. The cell culture media obtained after these ECs/TNBC incubations were collected and stored at -70°C for further use in the angiogenesis array. To know which cell line was conforming the VM structures in the EC/TNBC cells CCs, each cell lineage was independently labeled with a fluorescent green Cell Tracker following the manufacturer’s instructions (CellTracker™ Green CMFDA, Invitrogen, Thermo Fisher Scientific, Waltham, USA) and co-seeded with the other unlabeled cell lineage. After 2 days, cells were washed and fixed in 80% ethanol for 10 min. After air drying, a drop of UltraCruz™ mounting medium containing 4′,6-diamidino-2-phenylindole (DAPI, Santa Cruz Biotechnology, Santa Cruz, CA, USA) was added to coverslips, which were placed onto glass slides and photographed with a conventional fluorescence microscope (DP72 camera, Olympus Optical Co., Ltd., Tokyo, Japan).

4.2.2. Incubation of ECs with CM from CCs and gene expression studies

To get insight into the gene expression changes induced by the secretome of binomial CCs on regulators of angiogenesis, we exposed confluent EA.hy926 cells to the CM obtained from mixed CCs (EC + TNBC cells) for 24 h. Total RNA was extracted from ECs using Trizol reagent. Then, two micrograms of RNA were reverse transcribed using the Maxima Reverse Transcriptase system, following the manufacturer’s instructions. The resultant cDNAs were used in qPCR analysis. Amplifications were carried out in the LightCycler® 480 from Roche (Roche Diagnostics, Mannheim, Germany), according to the following protocol: activation of TaqDNA polymerase and DNA denaturation at 95 °C for 10 min, followed by 45 amplification cycles comprising 10 s at 95 °C, 30 s at 60 °C, and 1 s at 72 ◦C. The primers sequences (upper / lower) and corresponding universal probe number (Roche, Germany) in parenthesis are the following: For THBS1: caatgccacagttcctgatg / tggagaccagccatcgtc, (56); FGFR1: agactccggcctctatgctt / aggaggggagagcatctga, (66); HK2: tcccctgccaccagacta / tggacttgaatcccttggtc, (54); VEGFR2: gctcaagacaggaagaccaa / ggtgccacacgctctag, (27); VEGFA: ctacctccaccatgccaagt / ccacttcgtgatgattctgc, (29). As an internal control, we used the gene expression of the housekeeping gene glyceraldehyde-3-phosphate dehydrogenase GAPDH: agccacatcgctgagacac / gcccaatacgaccaaatcc, (60).

4.3. Immunocytochemistry

Mixed CCs of ECs with TNBC cells were allowed to interact for 48 h. Then, the cells were fixed in ice-cold 80% ethanol for 10 min and permeabilized with Perm/Wash buffer [1X Phosphate-buffered saline (PBS) pH 7.4, 3% FBS, 0.05% Tween 20) for 15 minutes. Perm/wash buffer was also used for antibodies dilutions. Washing steps were performed with wash buffer (1X PBS pH: 7.4, 1% FBS, 0.05% Tween 20). Coverslips were incubated overnight at 4°C, pairing one anti-rabbit and one anti-mouse primary antibody as indicated in corresponding figure legends. The following antibodies were used: rabbit anti-HIF1A (1:300, Abcam, Cambridge, MA, USA), mouse anti-Vimentin (1 μg/mL, Abcam), rabbit anti-VEGFR-2 (1:200, Cell Signaling Technology, Danvers, MA), mouse anti-FGFR1 (1:60, Santa Cruz Biotechnology) or rabbit anti-FGFR1 (1:200, Cell Signaling), mouse anti-HK2 (1:100, Santa Cruz Biotechnology), and mouse anti-VE-Cadherin (1 μg/mL, BioLegend, San Diego, CA). Slides were washed and further incubated with goat anti-mouse-Cyanine3 (Cy3) antibody (1:1000, Life Technologies Inc., Carlsbad, CA, USA) and goat anti-rabbit-Fluorescein isothiocyanate (FITC, 1:500, Jackson ImmunoResearch Laboratories, West Grove, PA) for 2 h at room temperature. After washing, one drop of mounting medium for nuclei visualization was applied to the coverslips, which were then placed onto slides. Cells were photographed with a conventional fluorescence microscope.

4.4. Angiogenesis Antibody Array

In order to identify the presence of activators and inhibitors of the vasculogenic process in the CM, we used a human angiogenesis antibody array in membranes format (ab193655, Abcam). This assay displays antibodies spotted on the membranes for 43 different targets. All steps were carried out as recommended by the manufacturer. Briefly: after blocking, the membranes were incubated overnight at 4°C in the presence of 1 mL undiluted CM from either monocultured ECs, HCC1806, MBCDF-T or co-cultured ECs + HCC1806, ECs + MBCDF-T, ECs + HCC1806 + AZD4547 5 μM, or ECs + MBCDF-T 5 μM. After washing, incubations with a biotinylated-secondary antibody cocktail followed by the HRP-conjugated streptavidin mixture (2 h each at room temperature) were performed. Chemiluminescence signals were analyzed in a ChemiDoc XRS+ System (BioRad). Semi-quantitative comparisons between samples were performed with the image acquisition and analysis software Image Lab (BioRad) using the positive controls included in each membrane. Antigen-spots without signal were disregarded. A semi-supervised hierarchical analysis of the targets was carried out in GraphPad Prisma 7 software.

4.5. Evaluation of AZD4547 and LY294002 Effects on VM morphometric parameters

To quantitatively evaluate the effect of AZD4547 and LY294002 on the VM-capacity of TNBC cells, cells were co-cultured with EA.hy926 in the presence or absence of 5 μM AZD4547 or 6 μM LY294002 for 48 h. Bright-field images were acquired in VM-hot spots by conventional microscopy. Two different observers counted the segments and meshes per visual field in hot spots of at least three 4x images. As segments, we considered cords or branches formed by TNBC cells, delimited by two junctions, while meshes were spotted as closed areas surrounded by segments.

4.5. Statistical Analysis

In RNA expression studies, Mann-Whitney Rank Sum Test was used when normality test failed, otherwise, Student’s t-test was used for each gene studied. Data were expressed as the mean ± standard error of the mean (SEM). Statistical significance was considered at p < 0.05.

5. Conclusions

Co-culturing ECs with TNBC cells induced in vitro VM formation through molecular reprogramming and phenotypic cellular transformation by activating the FGFR/PI3K/Akt axis. VM formation was triggered by the proangiogenic signature produced by ECs when they interacted physically with TNBC cells in co-culture. These findings contribute to our understanding of the vasculogenic processes associated with tumorigenesis and hold the potential for enhancing cancer treatment strategies by targeting endothelial-dependent VM induction.

Supplementary Materials

The following supporting information can be downloaded at the website of this paper posted on Preprints.org. Figure S1: Monocultured TNBC cells and endothelial cells differentially express markers of VM and endothelium; Figure S2: Immunolocalization of VE-Cadherin in CCs of TNBC cells and endothelial cells; Table S1: The interaction between endothelial and TNBC cells induces a pro-angiogenic secretome, which is suppressed by AZD4547.

Author Contributions

Validation, methodology, investigation, formal analysis, visualization, writing-review and editing, writing-original draft preparation, G.M.-G.; validation, methodology, investigation, formal analysis and visualization, E.A.M.-P.; methodology, investigation, formal analysis and visualization, writing-review and editing, J.G.-Q.; methodology, formal analysis and visualization, writing-review and editing, E.A.; formal analysis and visualization, writing-review and editing, R.G-B.; methodology, formal analysis and visualization, writing-review and editing, M.J.I-S and J.E-L.; writing-review and editing, F.L.; conceptualization, validation, methodology, investigation, formal analysis, visualization, writing-original draft preparation, supervision, project administration and funding acquisition, L.D. All authors have read and agreed to the published version of the manuscript.

Funding

This study was funded by Consejo Nacional de Ciencia y Tecnología (CONACYT, México), grant number A1-S-10749 to L.D. The funders had no role in the study design, analysis and interpretation of the data, writing of the manuscript or the decision to submit the article for publication.

Institutional Review Board Statement

Not applicable.

Informed Consent Statement

Not applicable

Data Availability Statement

The authors confirm that the data supporting the findings of this study are available within the article [and/or] its Supplementary Materials.

Acknowledgments

Gabriela Morales-Guadarrama is a student from Programa de Doctorado en Ciencias Biomédicas, Universidad Nacional Autónoma de México (UNAM) and received fellowship 662170 from CONACyT, México, for which we are very grateful. This study was part of GM-G thesis work to obtain her Ph.D. degree in Biomedical Sciences. We are also thankful for the support from Fundación amigos del INCMNSZ, A.C. (Grant number 348 to GM-G). The authors would like to thank Salvador Ramírez Jiménez, who is responsible of the repository of cell lines from “Programa de Investigación en Cáncer de Mama” Universidad Nacional Autónoma de México, for providing the HCC1806 cell line.

Conflicts of Interest

The authors declare no conflict of interest.

References

  1. Carmeliet, P.; Jain, R.K. Molecular mechanisms and clinical applications of angiogenesis. Nature 2011, 473, 298–307. [Google Scholar] [CrossRef] [PubMed]
  2. Chang, Y.S.; di Tomaso, E.; McDonald, D.M.; Jones, R.; Jain, R.K.; Munn, L.L. Mosaic blood vessels in tumors: frequency of cancer cells in contact with flowing blood. Proc Natl Acad Sci U S A 2000, 97, 14608–14613. [Google Scholar] [CrossRef] [PubMed]
  3. Folberg, R.; Maniotis, A.J. Vasculogenic mimicry. APMIS 2004, 112, 508–525. [Google Scholar] [CrossRef] [PubMed]
  4. Hendrix, M.J.; Seftor, E.A.; Meltzer, P.S.; Gardner, L.M.; Hess, A.R.; Kirschmann, D.A.; Schatteman, G.C.; Seftor, R.E. Expression and functional significance of VE-cadherin in aggressive human melanoma cells: role in vasculogenic mimicry. Proc Natl Acad Sci U S A 2001, 98, 8018–8023. [Google Scholar] [CrossRef] [PubMed]
  5. Liu, T.J.; Sun, B.C.; Zhao, X.L.; Zhao, X.M.; Sun, T.; Gu, Q.; Yao, Z.; Dong, X.Y.; Zhao, N.; Liu, N. CD133+ cells with cancer stem cell characteristics associates with vasculogenic mimicry in triple-negative breast cancer. Oncogene 2013, 32, 544–553. [Google Scholar] [CrossRef] [PubMed]
  6. Sun, H.; Yao, N.; Cheng, S.; Li, L.; Liu, S.; Yang, Z.; Shang, G.; Zhang, D.; Yao, Z. Cancer stem-like cells directly participate in vasculogenic mimicry channels in triple-negative breast cancer. Cancer Biol Med 2019, 16, 299–311. [Google Scholar] [CrossRef]
  7. Sun, H.; Zhang, D.; Yao, Z.; Lin, X.; Liu, J.; Gu, Q.; Dong, X.; Liu, F.; Wang, Y.; Yao, N.; et al. Anti-angiogenic treatment promotes triple-negative breast cancer invasion via vasculogenic mimicry. Cancer Biol Ther 2017, 18, 205–213. [Google Scholar] [CrossRef]
  8. Morales-Guadarrama, G.; Garcia-Becerra, R.; Mendez-Perez, E.A.; Garcia-Quiroz, J.; Avila, E.; Diaz, L. Vasculogenic Mimicry in Breast Cancer: Clinical Relevance and Drivers. Cells 2021, 10. [Google Scholar] [CrossRef]
  9. Ziegler, Y.S.; Moresco, J.J.; Yates, J.R., 3rd; Nardulli, A.M. Integration of Breast Cancer Secretomes with Clinical Data Elucidates Potential Serum Markers for Disease Detection, Diagnosis, and Prognosis. PLoS One 2016, 11, e0158296. [Google Scholar] [CrossRef]
  10. Morales-Guadarrama, G.; Mendez-Perez, E.A.; Garcia-Quiroz, J.; Avila, E.; Garcia-Becerra, R.; Zentella-Dehesa, A.; Larrea, F.; Diaz, L. Endothelium-Dependent Induction of Vasculogenic Mimicry in Human Triple-Negative Breast Cancer Cells Is Inhibited by Calcitriol and Curcumin. Int J Mol Sci 2022, 23. [Google Scholar] [CrossRef]
  11. Rezaei, M.; Martins Cavaco, A.C.; Stehling, M.; Nottebaum, A.; Brockhaus, K.; Caliandro, M.F.; Schelhaas, S.; Schmalbein, F.; Vestweber, D.; Eble, J.A. Extracellular Vesicle Transfer from Endothelial Cells Drives VE-Cadherin Expression in Breast Cancer Cells, Thereby Causing Heterotypic Cell Contacts. Cancers (Basel) 2020, 12. [Google Scholar] [CrossRef] [PubMed]
  12. Rak, J.; Filmus, J.; Kerbel, R.S. Reciprocal paracrine interactions between tumour cells and endothelial cells: the ‘angiogenesis progression’ hypothesis. Eur J Cancer 1996, 32A, 2438–2450. [Google Scholar] [CrossRef] [PubMed]
  13. Buchanan, C.F.; Szot, C.S.; Wilson, T.D.; Akman, S.; Metheny-Barlow, L.J.; Robertson, J.L.; Freeman, J.W.; Rylander, M.N. Cross-talk between endothelial and breast cancer cells regulates reciprocal expression of angiogenic factors in vitro. J Cell Biochem 2012, 113, 1142–1151. [Google Scholar] [CrossRef] [PubMed]
  14. Verdegem, D.; Moens, S.; Stapor, P.; Carmeliet, P. Endothelial cell metabolism: parallels and divergences with cancer cell metabolism. Cancer Metab 2014, 2, 19. [Google Scholar] [CrossRef] [PubMed]
  15. Yu, P.; Wilhelm, K.; Dubrac, A.; Tung, J.K.; Alves, T.C.; Fang, J.S.; Xie, Y.; Zhu, J.; Chen, Z.; De Smet, F.; et al. FGF-dependent metabolic control of vascular development. Nature 2017, 545, 224–228. [Google Scholar] [CrossRef]
  16. Cao, L.; Wang, M.; Dong, Y.; Xu, B.; Chen, J.; Ding, Y.; Qiu, S.; Li, L.; Karamfilova Zaharieva, E.; Zhou, X.; et al. Circular RNA circRNF20 promotes breast cancer tumorigenesis and Warburg effect through miR-487a/HIF-1alpha/HK2. Cell Death Dis 2020, 11, 145. [Google Scholar] [CrossRef]
  17. Turner, N.; Grose, R. Fibroblast growth factor signalling: from development to cancer. Nat Rev Cancer 2010, 10, 116–129. [Google Scholar] [CrossRef] [PubMed]
  18. Lugano, R.; Ramachandran, M.; Dimberg, A. Tumor angiogenesis: causes, consequences, challenges and opportunities. Cell Mol Life Sci 2020, 77, 1745–1770. [Google Scholar] [CrossRef] [PubMed]
  19. da Cunha, B.R.; Domingos, C.; Stefanini, A.C.B.; Henrique, T.; Polachini, G.M.; Castelo-Branco, P.; Tajara, E.H. Cellular Interactions in the Tumor Microenvironment: The Role of Secretome. J Cancer 2019, 10, 4574–4587. [Google Scholar] [CrossRef] [PubMed]
  20. Herrera-Vargas, A.K.; Garcia-Rodriguez, E.; Olea-Flores, M.; Mendoza-Catalan, M.A.; Flores-Alfaro, E.; Navarro-Tito, N. Proangiogenic activity and vasculogenic mimicry in the tumor microenvironment by leptin in cancer. Cytokine Growth Factor Rev 2021, 62, 23–41. [Google Scholar] [CrossRef]
  21. Maiti, A.; Qi, Q.; Peng, X.; Yan, L.; Takabe, K.; Hait, N.C. Class I histone deacetylase inhibitor suppresses vasculogenic mimicry by enhancing the expression of tumor suppressor and anti-angiogenesis genes in aggressive human TNBC cells. Int J Oncol 2019, 55, 116–130. [Google Scholar] [CrossRef] [PubMed]
  22. Liu, G.; Chen, T.; Ding, Z.; Wang, Y.; Wei, Y.; Wei, X. Inhibition of FGF-FGFR and VEGF-VEGFR signalling in cancer treatment. Cell Prolif 2021, 54, e13009. [Google Scholar] [CrossRef] [PubMed]
  23. Lamothe, B.; Yamada, M.; Schaeper, U.; Birchmeier, W.; Lax, I.; Schlessinger, J. The docking protein Gab1 is an essential component of an indirect mechanism for fibroblast growth factor stimulation of the phosphatidylinositol 3-kinase/Akt antiapoptotic pathway. Mol Cell Biol 2004, 24, 5657–5666. [Google Scholar] [CrossRef] [PubMed]
  24. Gavine, P.R.; Mooney, L.; Kilgour, E.; Thomas, A.P.; Al-Kadhimi, K.; Beck, S.; Rooney, C.; Coleman, T.; Baker, D.; Mellor, M.J.; et al. AZD4547: an orally bioavailable, potent, and selective inhibitor of the fibroblast growth factor receptor tyrosine kinase family. Cancer Res 2012, 72, 2045–2056. [Google Scholar] [CrossRef]
  25. Park, Y.; Kim, J. Regulation of IL-6 signaling by miR-125a and let-7e in endothelial cells controls vasculogenic mimicry formation of breast cancer cells. BMB Rep 2019, 52, 214–219. [Google Scholar] [CrossRef] [PubMed]
  26. Furlan, A.; Vercamer, C.; Heliot, L.; Wernert, N.; Desbiens, X.; Pourtier, A. Ets-1 drives breast cancer cell angiogenic potential and interactions between breast cancer and endothelial cells. Int J Oncol 2019, 54, 29–40. [Google Scholar] [CrossRef] [PubMed]
  27. Draoui, N.; de Zeeuw, P.; Carmeliet, P. Angiogenesis revisited from a metabolic perspective: role and therapeutic implications of endothelial cell metabolism. Open Biol 2017, 7. [Google Scholar] [CrossRef]
  28. Colwell, N.; Larion, M.; Giles, A.J.; Seldomridge, A.N.; Sizdahkhani, S.; Gilbert, M.R.; Park, D.M. Hypoxia in the glioblastoma microenvironment: shaping the phenotype of cancer stem-like cells. Neuro Oncol 2017, 19, 887–896. [Google Scholar] [CrossRef]
  29. Jiang, X.; Deng, X.; Wang, J.; Mo, Y.; Shi, L.; Wei, F.; Zhang, S.; Gong, Z.; He, Y.; Xiong, F.; et al. BPIFB1 inhibits vasculogenic mimicry via downregulation of GLUT1-mediated H3K27 acetylation in nasopharyngeal carcinoma. Oncogene 2022, 41, 233–245. [Google Scholar] [CrossRef]
  30. Jiang, X.; Wang, J.; Deng, X.; Xiong, F.; Zhang, S.; Gong, Z.; Li, X.; Cao, K.; Deng, H.; He, Y.; et al. The role of microenvironment in tumor angiogenesis. J Exp Clin Cancer Res 2020, 39, 204. [Google Scholar] [CrossRef]
  31. Tsuruta, D.; Jones, J.C. The vimentin cytoskeleton regulates focal contact size and adhesion of endothelial cells subjected to shear stress. J Cell Sci 2003, 116, 4977–4984. [Google Scholar] [CrossRef] [PubMed]
  32. Dave, J.M.; Bayless, K.J. Vimentin as an integral regulator of cell adhesion and endothelial sprouting. Microcirculation 2014, 21, 333–344. [Google Scholar] [CrossRef] [PubMed]
  33. Vartanian, A.; Karshieva, S.; Dombrovsky, V.; Belyavsky, A. Melanoma educates mesenchymal stromal cells towards vasculogenic mimicry. Oncol Lett 2016, 11, 4264–4268. [Google Scholar] [CrossRef] [PubMed]
  34. Peters, B.A.; Diaz, L.A.; Polyak, K.; Meszler, L.; Romans, K.; Guinan, E.C.; Antin, J.H.; Myerson, D.; Hamilton, S.R.; Vogelstein, B.; et al. Contribution of bone marrow-derived endothelial cells to human tumor vasculature. Nat Med 2005, 11, 261–262. [Google Scholar] [CrossRef] [PubMed]
  35. Sun, B.; Zhang, D.; Zhao, N.; Zhao, X. Epithelial-to-endothelial transition and cancer stem cells: two cornerstones of vasculogenic mimicry in malignant tumors. Oncotarget 2017, 8, 30502–30510. [Google Scholar] [CrossRef] [PubMed]
  36. Albini, A.; Bruno, A.; Noonan, D.M.; Mortara, L. Contribution to Tumor Angiogenesis From Innate Immune Cells Within the Tumor Microenvironment: Implications for Immunotherapy. Front Immunol 2018, 9, 527. [Google Scholar] [CrossRef] [PubMed]
  37. Cheng, T.; Zhang, S.; Xia, T.; Zhang, Y.; Ji, Y.; Pan, S.; Xie, H.; Ren, Q.; You, Y.; You, B. EBV promotes vascular mimicry of dormant cancer cells by potentiating stemness and EMT. Exp Cell Res 2022, 421, 113403. [Google Scholar] [CrossRef] [PubMed]
  38. Plantamura, I.; Casalini, P.; Dugnani, E.; Sasso, M.; D’Ippolito, E.; Tortoreto, M.; Cacciatore, M.; Guarnotta, C.; Ghirelli, C.; Barajon, I.; et al. PDGFRbeta and FGFR2 mediate endothelial cell differentiation capability of triple negative breast carcinoma cells. Mol Oncol 2014, 8, 968–981. [Google Scholar] [CrossRef]
  39. Khodarev, N.N.; Yu, J.; Labay, E.; Darga, T.; Brown, C.K.; Mauceri, H.J.; Yassari, R.; Gupta, N.; Weichselbaum, R.R. Tumour-endothelium interactions in co-culture: coordinated changes of gene expression profiles and phenotypic properties of endothelial cells. J Cell Sci 2003, 116, 1013–1022. [Google Scholar] [CrossRef]
  40. Dong-Le Bourhis, X.; Berthois, Y.; Millot, G.; Degeorges, A.; Sylvi, M.; Martin, P.M.; Calvo, F. Effect of stromal and epithelial cells derived from normal and tumorous breast tissue on the proliferation of human breast cancer cell lines in co-culture. Int J Cancer 1997, 71, 42–48. [Google Scholar] [CrossRef]
  41. Acevedo-Acevedo, S.; Millar, D.C.; Simmons, A.D.; Favreau, P.; Cobra, P.F.; Skala, M.; Palecek, S.P. Metabolomics revealed the influence of breast cancer on lymphatic endothelial cell metabolism, metabolic crosstalk, and lymphangiogenic signaling in co-culture. Sci Rep 2020, 10, 21244. [Google Scholar] [CrossRef] [PubMed]
  42. Guo, Y.; Miller, B.; Heim, M.; Gutierrez-Garcia, A.; Jaskula-Sztul, R.; Ren, B.; Sewell-Loftin, M.K. Protocol for indirect and direct co-culture between human cancer cells and endothelial cells. STAR Protoc 2023, 4, 102177. [Google Scholar] [CrossRef] [PubMed]
  43. Seo, D.W.; Li, H.; Guedez, L.; Wingfield, P.T.; Diaz, T.; Salloum, R.; Wei, B.Y.; Stetler-Stevenson, W.G. TIMP-2 mediated inhibition of angiogenesis: an MMP-independent mechanism. Cell 2003, 114, 171–180. [Google Scholar] [CrossRef] [PubMed]
  44. Seo, D.W.; Kim, S.H.; Eom, S.H.; Yoon, H.J.; Cho, Y.R.; Kim, P.H.; Kim, Y.K.; Han, J.W.; Diaz, T.; Wei, B.Y.; et al. TIMP-2 disrupts FGF-2-induced downstream signaling pathways. Microvasc Res 2008, 76, 145–151. [Google Scholar] [CrossRef] [PubMed]
  45. Mao, Y.; Keller, E.T.; Garfield, D.H.; Shen, K.; Wang, J. Stromal cells in tumor microenvironment and breast cancer. Cancer Metastasis Rev 2013, 32, 303–315. [Google Scholar] [CrossRef] [PubMed]
  46. Izawa, Y.; Kashii-Magaribuchi, K.; Yoshida, K.; Nosaka, M.; Tsuji, N.; Yamamoto, A.; Kuroyanagi, K.; Tono, K.; Tanihata, M.; Imanishi, M.; et al. Stem-like Human Breast Cancer Cells Initiate Vasculogenic Mimicry on Matrigel. Acta Histochem Cytochem 2018, 51, 173–183. [Google Scholar] [CrossRef]
  47. Delgado-Bellido, D.; Fernandez-Cortes, M.; Rodriguez, M.I.; Serrano-Saenz, S.; Carracedo, A.; Garcia-Diaz, A.; Oliver, F.J. VE-cadherin promotes vasculogenic mimicry by modulating kaiso-dependent gene expression. Cell Death Differ 2019, 26, 348–361. [Google Scholar] [CrossRef]
  48. Liu, T.; Sun, B.; Zhao, X.; Gu, Q.; Dong, X.; Yao, Z.; Zhao, N.; Chi, J.; Liu, N.; Sun, R.; et al. HER2/neu expression correlates with vasculogenic mimicry in invasive breast carcinoma. J Cell Mol Med 2013, 17, 116–122. [Google Scholar] [CrossRef]
  49. Takahashi, K.; Yamanaka, S. Induction of pluripotent stem cells from mouse embryonic and adult fibroblast cultures by defined factors. Cell 2006, 126, 663–676. [Google Scholar] [CrossRef]
  50. Scully, S.; Francescone, R.; Faibish, M.; Bentley, B.; Taylor, S.L.; Oh, D.; Schapiro, R.; Moral, L.; Yan, W.; Shao, R. Transdifferentiation of glioblastoma stem-like cells into mural cells drives vasculogenic mimicry in glioblastomas. J Neurosci 2012, 32, 12950–12960. [Google Scholar] [CrossRef]
  51. Talasila, K.M.; Rosland, G.V.; Hagland, H.R.; Eskilsson, E.; Flones, I.H.; Fritah, S.; Azuaje, F.; Atai, N.; Harter, P.N.; Mittelbronn, M.; et al. The angiogenic switch leads to a metabolic shift in human glioblastoma. Neuro Oncol 2017, 19, 383–393. [Google Scholar] [CrossRef] [PubMed]
  52. Du, W.; Ren, L.; Hamblin, M.H.; Fan, Y. Endothelial Cell Glucose Metabolism and Angiogenesis. Biomedicines 2021, 9. [Google Scholar] [CrossRef] [PubMed]
  53. Vandercappellen, J.; Van Damme, J.; Struyf, S. The role of CXC chemokines and their receptors in cancer. Cancer Lett 2008, 267, 226–244. [Google Scholar] [CrossRef] [PubMed]
  54. Hueso, L.; Ortega, R.; Selles, F.; Wu-Xiong, N.Y.; Ortega, J.; Civera, M.; Ascaso, J.F.; Sanz, M.J.; Real, J.T.; Piqueras, L. Upregulation of angiostatic chemokines IP-10/CXCL10 and I-TAC/CXCL11 in human obesity and their implication for adipose tissue angiogenesis. Int J Obes (Lond) 2018, 42, 1406–1417. [Google Scholar] [CrossRef] [PubMed]
  55. Proost, P.; Schutyser, E.; Menten, P.; Struyf, S.; Wuyts, A.; Opdenakker, G.; Detheux, M.; Parmentier, M.; Durinx, C.; Lambeir, A.M.; et al. Amino-terminal truncation of CXCR3 agonists impairs receptor signaling and lymphocyte chemotaxis, while preserving antiangiogenic properties. Blood 2001, 98, 3554–3561. [Google Scholar] [CrossRef] [PubMed]
  56. Aikins, A.R.; Kim, M.; Raymundo, B.; Kim, C.W. Downregulation of transgelin blocks interleukin-8 utilization and suppresses vasculogenic mimicry in breast cancer cells. Exp Biol Med (Maywood) 2017, 242, 573–583. [Google Scholar] [CrossRef] [PubMed]
  57. Ma, J.; Wang, Q.; Fei, T.; Han, J.D.; Chen, Y.G. MCP-1 mediates TGF-beta-induced angiogenesis by stimulating vascular smooth muscle cell migration. Blood 2007, 109, 987–994. [Google Scholar] [CrossRef]
  58. Lang, H.L.; Hu, G.W.; Zhang, B.; Kuang, W.; Chen, Y.; Wu, L.; Xu, G.H. Glioma cells enhance angiogenesis and inhibit endothelial cell apoptosis through the release of exosomes that contain long non-coding RNA CCAT2. Oncol Rep 2017, 38, 785–798. [Google Scholar] [CrossRef]
  59. Chistiakov, D.A.; Chekhonin, V.P. Extracellular vesicles shed by glioma cells: pathogenic role and clinical value. Tumour Biol 2014, 35, 8425–8438. [Google Scholar] [CrossRef]
  60. Giusti, I.; Delle Monache, S.; Di Francesco, M.; Sanita, P.; D’Ascenzo, S.; Gravina, G.L.; Festuccia, C.; Dolo, V. From glioblastoma to endothelial cells through extracellular vesicles: messages for angiogenesis. Tumour Biol 2016, 37, 12743–12753. [Google Scholar] [CrossRef]
  61. Skog, J.; Wurdinger, T.; van Rijn, S.; Meijer, D.H.; Gainche, L.; Sena-Esteves, M.; Curry, W.T., Jr.; Carter, B.S.; Krichevsky, A.M.; Breakefield, X.O. Glioblastoma microvesicles transport RNA and proteins that promote tumour growth and provide diagnostic biomarkers. Nat Cell Biol 2008, 10, 1470–1476. [Google Scholar] [CrossRef] [PubMed]
  62. Zeng, Y.; Yao, X.; Liu, X.; He, X.; Li, L.; Liu, X.; Yan, Z.; Wu, J.; Fu, B.M. Anti-angiogenesis triggers exosomes release from endothelial cells to promote tumor vasculogenesis. J Extracell Vesicles 2019, 8, 1629865. [Google Scholar] [CrossRef] [PubMed]
  63. Quan, M.Y.; Guo, Q.; Liu, J.; Yang, R.; Bai, J.; Wang, W.; Cai, Y.; Han, R.; Lv, Y.Q.; Ding, L.; et al. An FGFR/AKT/SOX2 Signaling Axis Controls Pancreatic Cancer Stemness. Front Cell Dev Biol 2020, 8, 287. [Google Scholar] [CrossRef] [PubMed]
  64. Morales-Guadarrama, G.; Mendez-Perez, E.A.; Garcia-Quiroz, J.; Avila, E.; Larrea, F.; Diaz, L. AZD4547 and calcitriol synergistically inhibited BT-474 cell proliferation while modified stemness and tumorsphere formation. J Steroid Biochem Mol Biol 2022, 223, 106132. [Google Scholar] [CrossRef] [PubMed]
  65. Smith, S.J.; Ward, J.H.; Tan, C.; Grundy, R.G.; Rahman, R. Endothelial-like malignant glioma cells in dynamic three dimensional culture identifies a role for VEGF and FGFR in a tumor-derived angiogenic response. Oncotarget 2015, 6, 22191–22205. [Google Scholar] [CrossRef] [PubMed]
  66. Drago, J.Z.; Formisano, L.; Juric, D.; Niemierko, A.; Servetto, A.; Wander, S.A.; Spring, L.M.; Vidula, N.; Younger, J.; Peppercorn, J.; et al. FGFR1 Amplification Mediates Endocrine Resistance but Retains TORC Sensitivity in Metastatic Hormone Receptor-Positive (HR(+)) Breast Cancer. Clin Cancer Res 2019, 25, 6443–6451. [Google Scholar] [CrossRef]
  67. Li, F.; Sun, H.; Yu, Y.; Che, N.; Han, J.; Cheng, R.; Zhao, N.; Guo, Y.; Huang, C.; Zhang, D. RIPK1-dependent necroptosis promotes vasculogenic mimicry formation via eIF4E in triple-negative breast cancer. Cell Death Dis 2023, 14, 335. [Google Scholar] [CrossRef] [PubMed]
  68. Wang, Z.W.; Zou, F.M.; Wang, A.L.; Yang, J.; Jin, R.; Wang, B.L.; Shen, L.J.; Qi, S.; Liu, J.; Liu, J.; et al. Repurposing of the FGFR inhibitor AZD4547 as a potent inhibitor of necroptosis by selectively targeting RIPK1. Acta Pharmacol Sin 2023, 44, 801–810. [Google Scholar] [CrossRef]
  69. Zhang, X.; Wu, J.; Hu, C.; Zheng, X.; Guo, Z.; Li, L. CXCL11 negatively regulated by MED19 favours antitumour immune infiltration in breast cancer. Cytokine 2023, 162, 156106. [Google Scholar] [CrossRef]
  70. Chiablaem, K.; Lirdprapamongkol, K.; Keeratichamroen, S.; Surarit, R.; Svasti, J. Curcumin suppresses vasculogenic mimicry capacity of hepatocellular carcinoma cells through STAT3 and PI3K/AKT inhibition. Anticancer Res 2014, 34, 1857–1864. [Google Scholar]
  71. Kim, H.S.; Won, Y.J.; Shim, J.H.; Kim, H.J.; Kim, B.S.; Hong, H.N. Role of EphA2-PI3K signaling in vasculogenic mimicry induced by cancer-associated fibroblasts in gastric cancer cells. Oncol Lett 2019, 18, 3031–3038. [Google Scholar] [CrossRef] [PubMed]
  72. Zhu, Y.; Liu, X.; Zhao, P.; Zhao, H.; Gao, W.; Wang, L. Celastrol Suppresses Glioma Vasculogenic Mimicry Formation and Angiogenesis by Blocking the PI3K/Akt/mTOR Signaling Pathway. Front Pharmacol 2020, 11, 25. [Google Scholar] [CrossRef] [PubMed]
  73. Coombes, R.C.; Badman, P.D.; Lozano-Kuehne, J.P.; Liu, X.; Macpherson, I.R.; Zubairi, I.; Baird, R.D.; Rosenfeld, N.; Garcia-Corbacho, J.; Cresti, N.; et al. Results of the phase IIa RADICAL trial of the FGFR inhibitor AZD4547 in endocrine resistant breast cancer. Nat Commun 2022, 13, 3246. [Google Scholar] [CrossRef] [PubMed]
  74. Saka, H.; Kitagawa, C.; Kogure, Y.; Takahashi, Y.; Fujikawa, K.; Sagawa, T.; Iwasa, S.; Takahashi, N.; Fukao, T.; Tchinou, C.; et al. Safety, tolerability and pharmacokinetics of the fibroblast growth factor receptor inhibitor AZD4547 in Japanese patients with advanced solid tumours: a Phase I study. Invest New Drugs 2017, 35, 451–462. [Google Scholar] [CrossRef] [PubMed]
  75. Esparza-Lopez, J.; Ramos-Elias, P.A.; Castro-Sanchez, A.; Rocha-Zavaleta, L.; Escobar-Arriaga, E.; Zentella-Dehesa, A.; Leon-Rodriguez, E.; Medina-Franco, H.; Ibarra-Sanchez Mde, J. Primary breast cancer cell culture yields intra-tumor heterogeneous subpopulations expressing exclusive patterns of receptor tyrosine kinases. BMC Cancer 2016, 16, 740. [Google Scholar] [CrossRef] [PubMed]
  76. Garcia-Quiroz, J.; Garcia-Becerra, R.; Santos-Cuevas, C.; Ramirez-Nava, G.J.; Morales-Guadarrama, G.; Cardenas-Ochoa, N.; Segovia-Mendoza, M.; Prado-Garcia, H.; Ordaz-Rosado, D.; Avila, E.; et al. Synergistic Antitumorigenic Activity of Calcitriol with Curcumin or Resveratrol is Mediated by Angiogenesis Inhibition in Triple Negative Breast Cancer Xenografts. Cancers (Basel) 2019, 11. [Google Scholar] [CrossRef] [PubMed]
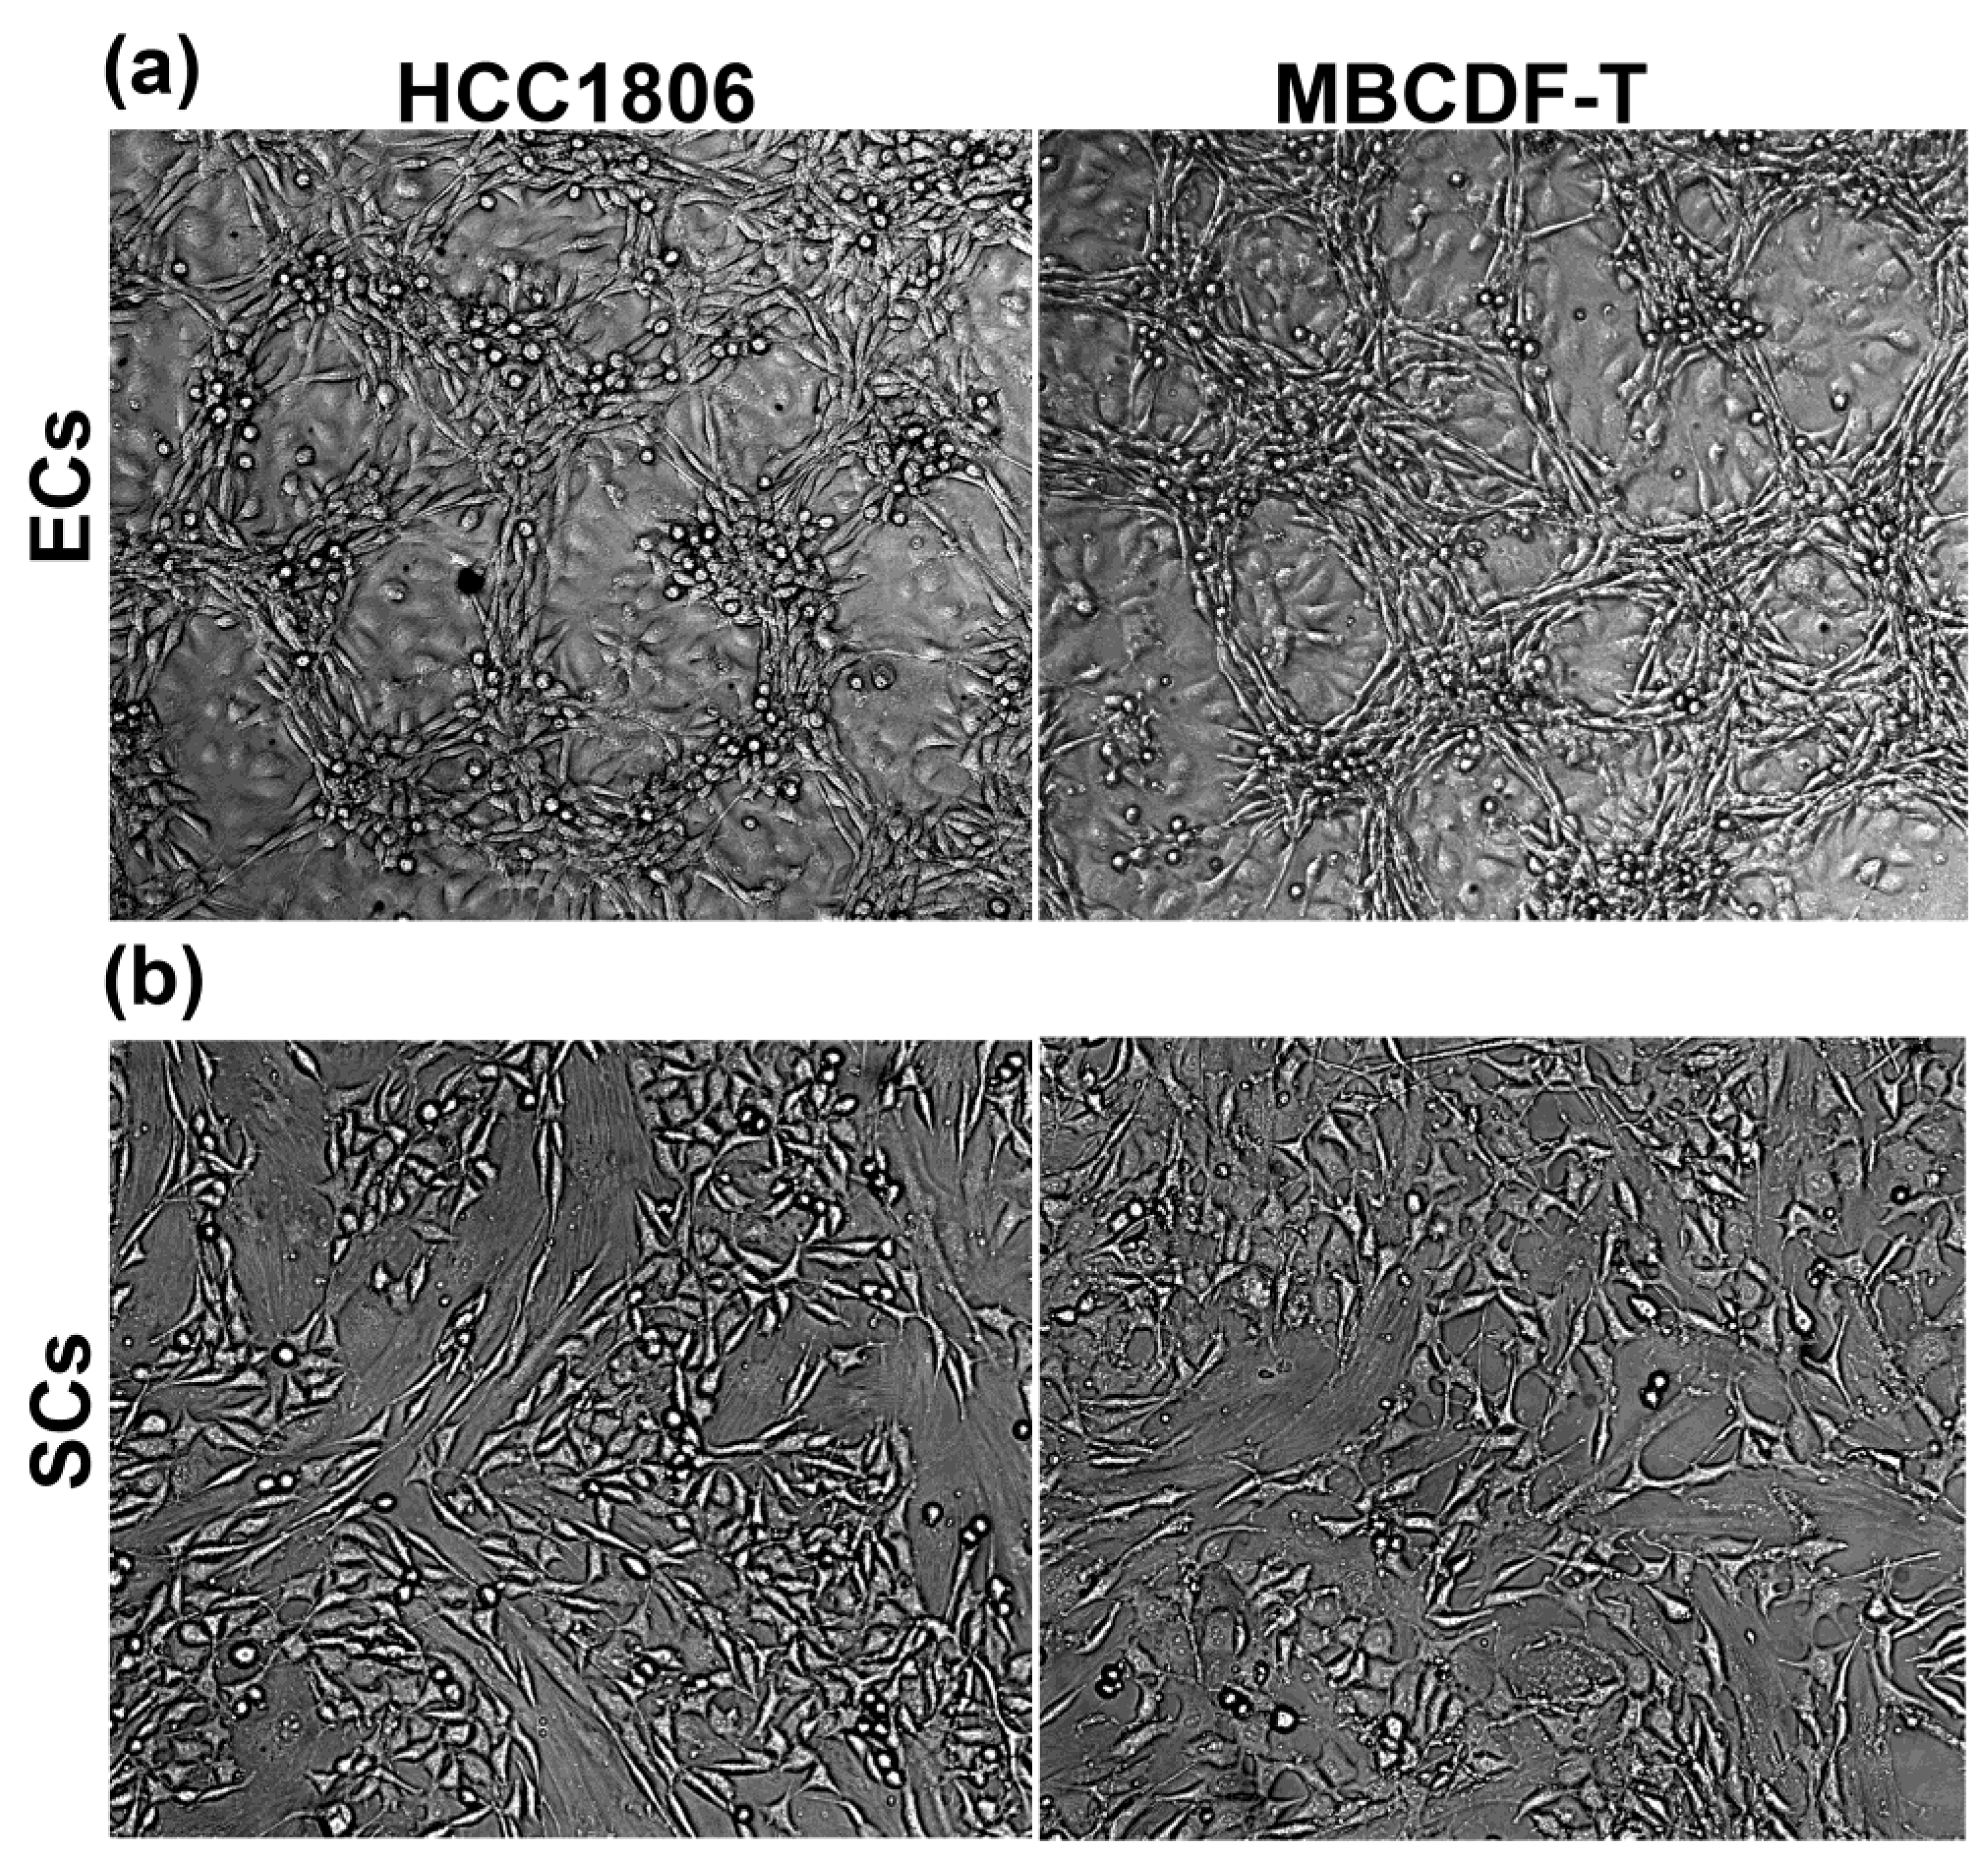
Figure 1. Endothelial cells, but not stromal cells, enabled VM formation by TNBC cells. EA.hy926 endothelial cells (ECs), but not N30 stromal cells (SCs), promoted the formation of vasculogenic mimicry by two different TNBC cell lines (HCC1806 or MBCDF-T). Two tumor microenvironment cell lineages, ECs (a) or SCs (b), were co-seeded with TNBC cells for 48 h, and the formation of tubular-like three-dimensional structures was observed only with ECs and TNBC co-cultures (a). Live cells were photographed, and representative bright field images are shown. Pictures are magnifications from 10x images.
Preprints 79750 g001
Figure 2. TNBC cells form the tubular structures in endothelial-breast cancer co-cultures. ECs and TNBC cells co-cultures resulted in VM formation, rather than endothelial angiogenesis. (a) MBCDF-T cells were labeled with a green cell tracker and then co-cultured with unlabeled ECs (EA.hy926) for 48 h. As depicted, exclusively TNBC cells were involved in the tubular-like network, displaying a spindle-like shape, and conforming segments (S) and meshes (M). (b) EA.hy926 cells were labeled with the green cell tracker before co-culturing them with unlabeled MBCDF-T cells. The nuclei were counterstained with DAPI (blue channel). Giant, flattened ECs characterized by a large nucleus may be found in the co-cultures (red asterisk). Representative images were obtained by epifluorescence microscopy. Magnifications from 10x pictures are shown.
Preprints 79750 g002
Figure 3. Endothelial donor cells show a highly vacuolated cytoplasm in the areas in close contact with the VM segments. (a) EA.hy926 cells were labeled with a green cell tracker before co-culturing them with unlabeled MBCDF-T cells for 48 h. Nuclei were counterstained with DAPI (blue channel). Non-green cells represent cancer cells. (b) Live HCC1806 cells co-cultured with EA.hy926 cells during 48 h were photographed. Red arrows show vacuoles in the endothelial cells neighboring the VM segments (S). Cancer cells appear smaller and elongated, with low cytoplasm/nucleus ratio, while endothelial cells look bigger and flattened, with large nuclei and greater cytoplasm/nucleus ratio. Magnifications from 40x bright field images are shown.
Preprints 79750 g003
Figure 4. Co-cultured TNBC cells and endothelial cells differentially express markers of VM and endothelium. HCC1806 cells and EA.hy926 cells were co-cultured for 48 h. Then, co-cultures were fixed and further processed for immunocytochemistry. Each slide was incubated with two primary antibodies, one made in mice and one in rabbits. Incubations were undertaken overnight at 4°C. Mice-made primary antibodies were detected using a secondary goat anti-mouse-Cy3 antibody (red channel, left panels). Rabbit antibodies were detected with a goat anti-rabbit-FITC (green channel, middle panels). The right panels show merged pictures. As a guide, C depicts the location of cancer cells in the segments of VM structures, while E depicts endothelial cells position. Cell images were captured using a conventional fluorescence microscope. Representative 10x images are shown. Vimentin (VIM); hypoxia-inducible factor-1α (HIF1); VE-Cadherin (VE-Cadh); Hexokinase 2 (HK2), Vascular endothelial growth factor receptor 2 (VEGFR2); Fibroblast growth factor receptor 1 (FGFR1).
Preprints 79750 g004
Figure 5. FGFR1 and VEGFR2 are localized in vesicles and vacuoles of donor cells in co-cultures of TNBC and endothelial cells. MBCDF-T and EA.hy926 cells were co-cultured for 48 h, followed by fixation and immunocytochemistry processing. (a) The primary antibodies mouse-anti-vimentin (VIM) and rabbit-anti-FGFR1 were co-incubated overnight at 4°C. (b) Mouse-anti-VIM along with rabbit-anti-VEGFR2 were co-incubated overnight. The secondary antibodies used were goat anti-mouse-Cy3 (red) and goat anti-rabbit-FITC (green). DAPI-containing mounting media was used for nuclei staining (blue). In (a) the yellow arrow indicates the presence of small but plenty of FGFR1-containing vacuoles (green) in an endothelial donor cell, identified by VIM expression (red). C shows cancer cells in the nearest VM segment. The photo is a magnification from a 40x image. In (b), C depicts VEGFR2-positive cancer cells (green) in VM-segments that surround endothelial VIM-expressing cells (red), which contain vesicles with VEGFR2 in green color (yellow arrows). Magnification from 20x photography.
Preprints 79750 g005
Figure 6. The interaction between endothelial and TNBC cells induces a proangiogenic secretome, which is suppressed by AZD4547. Results from the angiogenesis antibody array analysis showing the graphical color representation of the shift in the abundance of each factor in the secretome from co-cultures (CCs) after comparing against the secretome from endothelial monocultures (MCs). This effect is shown in the left column of the two TNBC cell lines, MBCDF-T and HCC1806, respectively (CCs vs MCs). The change in the abundance of the angioregulatory factors in the secretome from CCs treated with the FGFR inhibitor AZD4547, compared against the CM of untreated CCs is shown in the right column of each cell line (AZD4547). The red color indicates a rise in the abundance of each factor, whereas the green color indicates downregulation. The gray color depicts no change. As depicted, co-culturing endothelial cells with either TNBC cell line resulted in a general upregulation of proangiogenic factors as compared with the secretome from monocultured endothelial cells, while AZD4547 suppressed this effect.
Preprints 79750 g006
Figure 7. Relative mRNA expression levels of proangiogenic molecules in endothelial cells exposed to conditioned media from co-cultures. The relative gene expression of FGFR1, VEGFR2, VEGFA, HK2 and THBS1 was analyzed by RT-qPCR in EA.hy926 cells incubated for 24 h with the conditioned media (+ CM) from TNBC-ECs co-cultures, or culture media from monocultured ECs (control). Bars in grey represent the mean normalized values ± SEM of the relative expression of targets assessed in EC monocultures, which was set to one. Black bars represent mean values ± SEM of normalized expression of targets assessed in EC exposed to CM from co-cultures. GAPDH was used as a housekeeping gene for relative expression normalization. Data were obtained from three independent experiments, * P < 0.05 vs control.
Preprints 79750 g007
Figure 8. The FGFR1/PI3K/Akt pathway is involved in TNBC cells VM capacity. The interaction of EA.hy926 cells with two different TNBC cell lines (a) HCC1806 or (b) MBCDF-T resulted in VM formation (Control). Incubation of these co-cultures in the presence of 5 µM AZD4547 or 6 µM LY294002 for 2 days prevented the formation of tubular-like structures. (c) Evaluation of the effect of each compound on VM morphometric parameters. The mean number of segments ± SEM is shown in black bars, while the mean number of meshes ± SEM is in grey bars. In (a) and (b), representative amplifications from 4x bright field images are shown. Two observers counted the segments and meshes per visual field in hot spots of at least three 4x magnification images. * P <0.05 vs. control.
Preprints 79750 g008
Table 1. Relative gene expression of OSKM genes.
Gene Control +CM
OCT4 3.24E-08 ± 3.2E-08 8.28E-05 ± 3.8E-05 *
SOX2 0.00 6.89E-04 ± 6.7E-04 *
KLF4 0.00 2.48E-06 ± 3.9E-06 *
MYC 1.14E-03 ± 5.4E-04 5.27E-03 ± 1.7E-03
The gene expression is depicted as relative to that of GAPDH. CM = Conditioned media from CCs. N = 3 different experiments with triplicate replicates each. Asterisk denotes P<0.05 vs. control.
Disclaimer/Publisher’s Note: The statements, opinions and data contained in all publications are solely those of the individual author(s) and contributor(s) and not of MDPI and/or the editor(s). MDPI and/or the editor(s) disclaim responsibility for any injury to people or property resulting from any ideas, methods, instructions or products referred to in the content.
Copyright: This open access article is published under a Creative Commons CC BY 4.0 license, which permit the free download, distribution, and reuse, provided that the author and preprint are cited in any reuse.
Prerpints.org logo

Preprints.org is a free preprint server supported by MDPI in Basel, Switzerland.

Subscribe

© 2024 MDPI (Basel, Switzerland) unless otherwise stated