
Submitted:
17 July 2023
Posted:
18 July 2023
You are already at the latest version
Abstract
Using the fluorescent method in the modification of Krasnoyarsk State University, we study development (as chlorophyll content, ∑CHL) and photosynthetic activity of phytoplankton in seven large flat reservoir of the Volga River cascade (Russia) in August 2915–2017. In period of maximal warming of water, average ∑CHL varied in limits of 19.4–33.7 μg L–1 in the Upper Volga, 8.5–27.8 μg L–1 in the Middle Volga, and 5.2–11.3 μg L–1 in the Lower Volga. Photosynthetic activity coefficient (PhAC) varied mostly in limits of 0.12–0.59 with average of 0.22–0.38 and only in 2017 decreased to minimal <0.10 and average <0.20. The average PhAC values shows the normal physiological state of the phytoplankton of the Upper Volga during all periods of observation, occasional decrease of PhAC in the Middle Volga, and low photosynthetic activity in the Lower Volga. A decrease in the average ∑Chl and PhAC in 2017 was under cyclonic windy weather with a large amount of precipitation, low solar radiation, and large volume of flow. Trend towards a decrease in ∑CHL, like decrease in PhAC from the Upper Volga to the Lower Volga is explained by increasing in the flow rate and volume of runoff downstream the Volga River.
Keywords:
phytoplankton
; chlorophyll
; algae phylum
; coefficient of photosynthetic activity (PhAC)
; Volga River reservoirs
1. Introduction
The study of the autotrophic community of aquatic ecosystems is a crucial part of hydroecological research. Planktonic algae produce the main stock of autochthonous organic matter in large lakes and reservoirs. An energy base for organisms of higher trophic levels is creating and the water column is enriching with oxygen by photosynthesis [1,2,3]. A special place among the indicators of the abundance and functioning of phytoplankton is given to photosynthetic pigments which have been used extensively nowadays in production hydrobiology. The primary pigment of green plants – сhlorophyll a (CHL) – provides important information about the development and state of algocoenoses and the state of water environment [1,4]. The unique optical properties of chlorophyll – the ability to absorb and emit light radiation in a narrow wavelength range [5] – are the basis for methods to define it.
Phytoplankton forms the foundation of the trophic pyramid in reservoirs of the Volga River – the largest river in Europe [6,7]. Research of the pigments in the Volga River was started in the middle of the XX century [8] and they have been supplemented with new data nowadays [9,10,11] which are summarized in [12]. Most of these studies were carried out with standard spectrophotometric method [13]. Recently, we have begun to use fluorescent diagnostics of phytoplankton and preliminary data of the fluorescence CHL determination showed good agreement with the results of spectrophotometry [14].
Measurement of CHL fluorescence directly in natural water makes it possible to quickly analyze a large series of samples and evaluate a number of phytoplankton characteristics without affecting its integrity. The coefficient of photosynthetic activity (PhAC) is a direct indicator of the algocenoses state [15]. PhAC characterizes the effective quantum yield of photochemical energy conversion [16,17]. These mechanisms are associated with the functioning of photosystem II (PS II) reflecting the absorption efficiency of solar energy by algae during photosynthesis [18]. The quantum yield of photosynthesis (i.e., PhAC) serves as a measure of photosynthetic activity under electron-saturated reaction centers [19,20]. PhAC varies depending on a wide range of factors, reflecting the physiological state of photosynthetic organisms [21]. Application of PhAC to the assessment of productivity and state of natural algae communities seems to be a promising aspect of hydrobiological research [22,23]. The first data on PhAC of the Volga phytoplankton were obtained by us for the reservoirs of the Upper Volga previously [24,25].
The main purpose of this work is to study the total content of chlorophyll a with the proportion of the main algae taxa, and assess the photosynthetic activity of phytoplankton with the relationship between PhAC and chlorophyll in the water of the Volga River reservoirs.
2. Materials and Methods
2.1. Site Description
The Volga River, at 3690 km, is the longest river in Europe [26,27]. The river network of the Volga looks like a branching tree in the north that evolves into a single trunk rooting as a delta in the Caspian Sea in the south. The Volga catchment area is located on the Russian Plain, covering various latitudinal and climatic zones from the southern taiga to semi-desert. The most of the Volga River from the town of Tver’ to Volgograd that is over 2500 km long, is affected by an uninterrupted cascade of eight large shallow reservoirs, considerably slowing the flow velocity of the river. The reservoirs differ in terms of morphometry, optical regime, chemistry, lateral inflow, water exchange, and trophic status. A schematic map of the reservoirs is shown in Figure 1 and their basic characteristics are given in Table 1.
With a change of conditions in the drainage basin, the total amount of ions – conductivity – increases and the color of the water decreases from the Upper Volga to the Lower Volga. Water transparency increases with the depth in lower reservoirs. The content of nitrogen and phosphorus compounds in the entire cascade is high enough to not limit the development of algae [27]. In accordance with the geographical zonality, three sections are distinguished in the cascade that are Upper Volga (56°51′N, 35°55′ E – 57°29′ N, 38°17′ E), Middle Volga (58°03′ N, 38°50′ E – 53°31′ N, 49°25′ E), and Lower Volga (53°28′ N, 49°42′ E – 46°23′ N, 48°02′ E).
2.2. Sampling
Our data includes the route surveys carried out at seven run-of-river Volga reservoirs in the mid summer. In 2015–2017, samples were taken at 50–60 stations of the Upper and Middle Volga, also at 6 stations of the Saratov reservoir in 2016, and at 19 stations of the Lower Volga in 2017. Surveying each reservoir took 2–3 days. We used integral samples obtained by mixing equal volumes of water taken from each meter of the water column from surface to bottom with a 1 m Elgmork bathometer.
2.3. Chlorophyll
Fluorescence of chlorophyll was measured on board of the research vessel in natural water on a stationary fluorimeter PFL-3004 (Krasnoyarsk University) [28,29]. Modification of the method is based on the specifics of light-harvesting pigment-protein complexes of the diatoms, green algae, and cyanoprokaryots (blue-green algae) that makes it possible to determine the total amount of ∑CHL by its content in these main taxa of freshwater phytoplankton. The fluorescence intensity was measured in the red region of the spectrum (~ 680 nm) when excited by light with wavelengths of 410 ± 10, 490 ± 10, and 540 ± 10 nm. The measurement was repeated after the addition of ETC inhibitor simazine (at a concentration of 10-5 M) to the cuvette, thereby increasing the fluorescence yield to a maximum level. To introduce a correction for the presence of colored organic matter, at the same wavelengths, fluorescence of water filtered through a membrane filter with a pore diameter of ~0.5 μm, i.e., was measured devoid of algae. Total chlorophyll a amount (ΣCHL) was calculated as the sum of its concentration in diatoms, cyanoprokaryotes, and green algae (respectively, Bacillariophyta, CHLBac; Cyanoprokaryota, CHLCyan; Chlorophyta, CHLChl). Equations for calculating CHLBac, CHLCyan, and CHLChl are given in [30].
2.4. Photosynthetic Activity of Algae
The photosynthetic activity of algae was determined using the coefficient of photosynthetic activity (PhAC), which is assessed using the variable fluorescence index. The fluorescence yield of natural water was measured in the red region of the spectrum (680 nm) upon excitation with white light in the range of 400–620 nm at an intensity of 150 W m–2 before and after adding the ETC inhibitor simazine to the sample cuvette. PhAC was calculated using the formula (1) from [31].
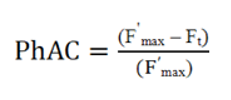
F'max, maximum fluorescence of light-adapted algae after the addition of an inhibitor;
Ft, steady–state fluorescence upon adaptation to a given light intensity.
PhAC values <0.10 correspond to the presence of cells with a non-functional photosynthetic apparatus [32]. Values of 0.10–0.30 characterize the low photosynthetic activity of phytoplankton and/or its growth under stress conditions; values of 0.30–0.50 correspond to the normal photosynthetic activity of phytoplankton in natural water bodies; values >0.50 indicate a high photosynthetic activity of algae under favorable hydrological and weather conditions. PhAC ~0.70 show the approach of fluorescence to its biological maximum, which is actually not observed in situ [33,34,35].
2.5. Statistics
Standard software packages for a personal computer Statistic10 (StstSoft Inc., USA) were used for statistical data processing, i.e., for calculating averages, their errors, correlation, regression, and dispersion analysis. The data are given as mean value with standard error (X ± SE). To determine the relationships between chlorophyll content and PhAC we used Pearson correlation coefficient significant at P < 0.05.
3. Results
The data obtained in August are confined to the period of maximum warming of the water column. The average water temperature in the reservoirs was 18.0–20.9 ºС in 2015, and 21.9–24.7 ºС in 2016. The start of the growing season in 2017 was cold and rainy [36], however, the summer heating reached normal temperature of 21.0–23.0 ºС. Water transparency increased from north to south, varied within the limits typical for reservoirs, and averaged 0.8–1.1, 1.0–1.3, and 1.8–2.2 m in the Upper, Middle, and Lower Volga.
Usually in the middle summer the summer maximum of phytoplankton is formed. The content of ∑CHL during the years of research was characterized by a wide range of values (Table 2). In the Ivankovo reservoir, it varied from the minimum 3–8 to the maximum 49–56 μg L–1, in the Uglich reservoir from 10–17 to 30–46 μg L–1, in the Gorky reservoir from 8 to 44 μg L–1 in 2015 and 2016 and from 1 up to 13 μg L–1 in 2017. In the Cheboksary reservoir, the highest concentrations (16–52 μg L–1) were obtained in 2015, lower (3–38 μg L–1) in 2016 and 2017. In the Kuibyshev reservoir, as in the Gorky reservoir, higher values (from 2–8 to 39–50 μg L–1) were obtained in 2015 and 2016, and lower values (1–15 μg L–1) in 2017. In the Lower Volga, ∑CHL concentrations were lower and varied in a narrow range from 2–5 to 10–20 μg L–1. The minimum and maximum concentrations in each survey differed by a factor of 10–20 in the Ivankovo and Kuibyshev reservoirs and by a factor of 2–10 in all the others.
Average ∑CHL concentrations in reservoirs varied from 11.3 ± 1.4 to 27.8 ± 1.5 in 2015, from 19.6 ± 2.7 to 33.7 ± 11.1 in 2016, and from 9.1 ± 2.5 to 30.5 ± 3.9 in 2017 (Figure 2).
Average ∑CHL tends to decrease downstream from the reservoirs of the Upper Volga to the reservoirs of the Lower Volga. This is most clearly shown by the data averaged over the years of observation (Figure 3A) and confirmed by the results of ANOVA (Table 3). However, this decrease was significant in 2016 and 2017 (R2 = 0.83 and 0.59) but was disturbed in 2015 due to the high concentration of ∑CHL in the Cheboksary reservoir (Figure 2).
The content of chlorophyll for each of the three algae phylum also varied widely. The minimum amount of CHLCyan was <1–5 μg L–1, and the maximum values in 2015 and 2016 reached 49 μg L–1 in the Ivankovo reservoir, 28 μg L–1 in the Uglich, 36 μg L–1 in the Gorky, and 47 μg L–1 in the Kuibyshev reservoir. In 2017, CHLCyan in these reservoirs was lower, and the maximum values did not exceed 12–29 μg L–1. In the Cheboksary, Saratov, and Volgograd reservoirs, the maximum values were less than 10–26 μg L–1 in all years. Average concentrations of CHLCyan in 2015 and 2016 varied from 13.5 ± 3.6 to 19.9 ± 1.6 in the Upper and Middle Volga. It decreased to 4.6 ± 1.7 – 9.5 ± 1.3 in the Lower Volga, as well as in 2017 in the Upper and Middle Volga (Figure 2). The contribution of CHLCyan to the total ∑CHL ranged from 60 to 90% on average, and only in 2017 in the Upper Volga it decreased to 30–40%. The highest percentage of CHLCyan over 80% was recorded in Gorky (2016) and in Saratov reservoirs. The change in CHLCyan in the cascade of reservoirs is not clear (Figure 3B, Table 3) and only a downward trend can be seen in its amount in the lower reservoirs.
The maximum of CHLBac in individual reservoirs was mainly from 11.7 to 31.8 μg L–1 and was less (0.8–6.4 μg L–1) in the Gorky reservoir (2016, 2017) as well as in the Lower Volga. Average concentrations of CHLBac in limits of 7.6–18.3 μg L–1 were obtained in Ivankovo reservoir in 2016 and 2017, in Uglich reservoir in all years, and in Cheboksary reservoir in 2016. In all other cases, the average concentrations of CHLBac were below 5 μg L–1 (Figure 2). The share of it in ΣCHL basically was 14–35%. It decreased to 9% in Gorky reservoir in 2016 and increased to 40–60% in Ivankovo and Uglich reservoirs in 2017, in Cheboksary reservoir in 2015. Like ∑CHL average CHLBac is significantly declining downstream from the reservoirs of the Upper Volga to the reservoirs of the Lower Volga (Figure 3C, Table 3). For CHLBac, as for ∑CHL, there is a decrease in the lower reservoirs compared to the upper ones that is confirmed by the results of dispersion analysis. At the same time, no significant decrease in CHLCyan was detected (Table 3).
Maximal CHlChl did not exceed 1–4 μg L–1, with average being 1.1–1.5 μg L–1 in Ivankovo reservoir and usually <1 μg L–1 in all other (Table 2, Figure 2). The contribution of CHLChl into ΣCHL varied very little both within the cascade as well as during the observation periods, with average being 0.5–6.8%. We do not consider the spatial and temporal dynamics of CHlChl because of its low content.
Photosynthetic activity coefficient (PhAC) changed to a lesser extent than ∑CHL. The maximum and minimum values of PhAC in each reservoir differed by 1.5–3 times, and only in the Cheboksary and Kuibyshev reservoirs in 2017 the difference between them increased up to 5–6 times. In reservoirs of the Upper Volga, in different years PhAC varied from the minimum 0.17 to the maximum of 0.38–0.59 in Ivankovo and 0.40–0.57 in the Uglich reservoir, and in both the average values were similar in all years. In the reservoirs of the Middle Volga, the PhAC range was wider, from a minimum <0.10 to a maximum of 0.43 in Gorky, 0.52 in Cheboksary, and 0.39 in Kuibyshev reservoirs. In 2017, there was a significant decrease in the average PhAC in the Gorky and Cheboksary reservoirs. In the Lower Volga, both the marginal (0.10–0.38) and average (0.17 ± 0.02 – 0.28 ± 0.03) PhAC values are lower than in other reservoirs. For the Saratov reservoir, a decrease in PhAC was noted in 2017 (Table 4, Figure 4).
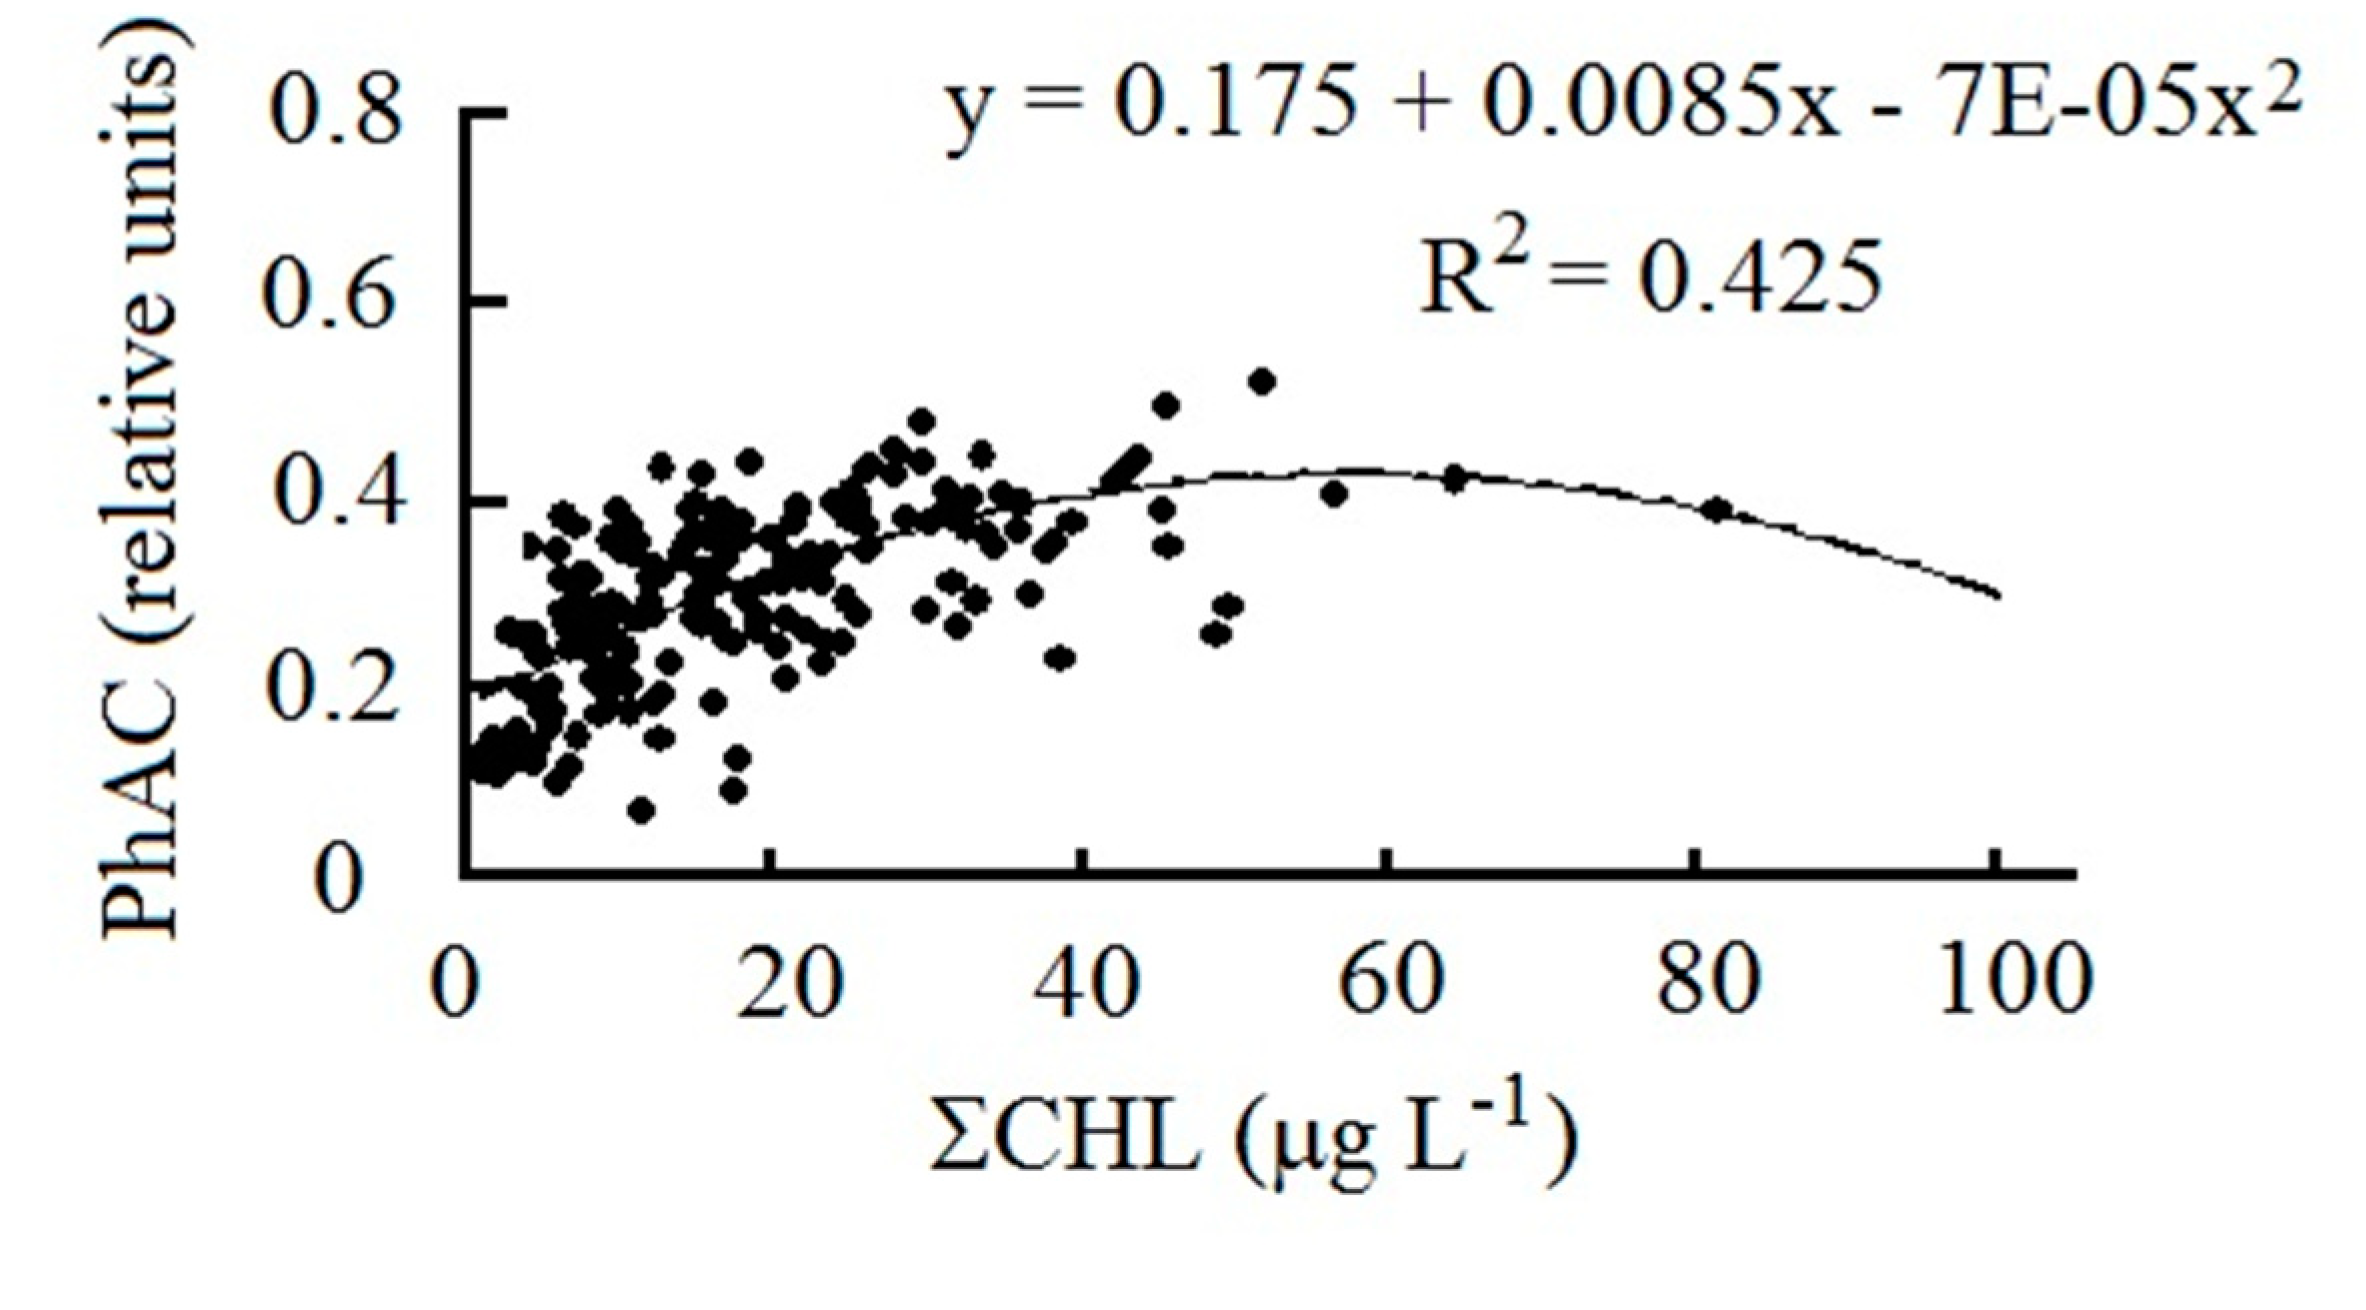
PhAC is closely related to ∑CHL content (Figure 5). This relationship is described by a polynomial function and demonstrates slowdown in the growth of PhAC and its decrease at high pigment concentrations that are above 40 μg L–1. Therefore, it is not surprising that there is a decreasing in PhAC from the upper reservoirs to the lower ones (Figure 4). In each year, this decrease is less significant than the decrease in ∑CHL (R2 = 0.30–0.37). However, according to the data averaged over three years, it can be traced very clearly and is confirmed by the results of ANOVA (Figure 3D, Table 3).
The relationship of PhAC with ∑CHL, which is an indicator of the trophic state of water bodies, makes it possible to assess the photosynthetic activity of phytoplankton in waters of different trophy. Average PhAC values increase threefold at the transition from low productive oligotrophic waters to highly productive hypertrophic ones (Table 5). The state of phytoplankton was characterized by low photosynthetic activity in oligotrophic waters and by normal activity in all others.
4. Discussion
The study of the summer phytoplankton is of considerable interest, because negative trends caused by eutrophication or climate changes become apparent in water ecosystem of the reservoir during this season. The data obtained in August are confined to the maximum warming of the water column and correspond to the summer maximum of phytoplankton, which is indicative for assessing the state of water bodies. Concentrations of chlorophyll (ΣCHL) in each reservoir were typical for this particular period of phytoplankton seasonal succession [9].
Each reservoir of the Volga River is a unique water body with specific conditions that control the development of biota. Reservoirs are characterized by a complex hydrodynamic regime, which is formed under the influence of factors including morphometry, flow velocity, intensive mixing, a developed network of tributaries, and the presence of heterogeneous water masses [27]. These features determine the uneven large-scale distribution of phytoplankton and, as a result, the significant difference between the maximum and minimum chlorophyll concentrations in each reservoir. An increased amount of chlorophyll is usually observed in shallow water areas, in the mouth sections of tributaries, in dam extensions [9]. Photosynthetic activity coefficient (PhAC) was changing less than ∑CHL and it looks like a more stable parameter as well as photosynthesis measured by the oxygen flask method [7]. The same PhAC range was obtained for phytoplankton of Lake Shira [37] and reservoirs of the Upper Volga including Rybinsk reservoir, which also had a low PhAC variation [24,25]. Like photosynthesis, PhAC is closely correlated with chlorophyll and shows changes in waters of different trophiс state.
Fluorescent analysis makes it possible to estimate the chlorophyll content of the three algal phylums typical for freshwater phytoplankton. With differences in the specific content of chlorophyll in the large taxonomic groups of algae [38], these data do not quantify the biomass of the phylums, but are of interest for a comparative analysis of their development. The amount and ratio of CHLCyan and CHLBac corresponds to the composition of summer phytoplankton, which is characterized by the dominance of cyanoprokaryotes or cyanoprokaryotes and diatoms [39].
The average PhAC values correspond to the normal physiological state of the phytoplankton of the Upper Volga during all periods of observation. On the Middle Volga, the situation is different. Phytoplankton of the Gorky reservoir is characterized by normal photosynthetic activity in 2015, Cheboksary reservoir in 2015 and 2016. In other cases, PhAC reflects the low photosynthetic activity of algae. In the Kuibyshev and two reservoirs of the Lower Volga, photosynthetic activity is decreasing that is probably due to an increase in the volume of water runoff.
In the interannual dynamics of chlorophyll and photosynthetic activity, 2017 stands out when a decrease in the average content of ∑Chl and CHLCyan in all water bodies and a decrease in average PhAC in the Middle and Lower Volga, was noted. A cyclonic windy weather prevailed for most of the season in 2017 with a large amount of precipitation, low solar radiation, and large volume of flow [36]. Weather conditions in the Volga region and especially in the Upper Volga were unfavorable for the development of phytoplankton and, in particular, cyanoprokaryotes, which usually make up the majority of phytoplankton in summer [39]. As for CHLBac, it decreased in the Middle and Lower Volga, but became higher in comparison with previous years in the Upper Volga since diatoms are well adapted to existence in conditions of an actively mixed water column [40]. With a general decrease in PhAC in the Middle and Lower Volga in 2017, values <0.10 were obtained in each reservoir, which may indicate the presence of cells with a damaged photosynthetic apparatus [32].
During the period of our studies, as before [9], there is a tendency for chlorophyll and PhAC to decrease from the Upper Volga to the Lower Volga. A similar distribution has been traced for the phytoplankton biomass [39]. This is explained by increasing in the flow rate and volume of runoff downstream the Volga River, and these factors limit the development of phytoplankton. Ecosystems of the lower reservoirs that close the cascade are considered the least stable due to high dependence on the changing flow of the Volga River [41].
5. Conclusion
Study of productivity and development of phytoplankton in the Volga River cascade in summer period showed a wide range of chlorophyll concentration with uneven large-scale distribution and significant difference between the maximum and minimum ∑CHL in reservoirs with complex hydrodynamic regime. Average ∑CHL varied in limits of 19.4–33.7 μg L–1 in the Upper Volga, 8.5–27.8 μg L–1 in the Middle Volga, and 5.2–11.3 μg L–1 in the Lower Volga. Chlorophyll content of basic algal phylums corresponds to the composition of summer phytoplankton with the dominance of cyanoprokaryotes or cyanoprokaryotes and diatoms. CHLCyan accounted for 31–68% of the ∑CHL in the Upper Volga and 60–90% in the Middle and Lower Volga. The share of CHLBac was 29–62% and 9–40%, the share of CHLChl was 5–7% and 1–4% respectively.
Photosynthetic activity coefficient (PhAC) was changing less than ∑CHL and varied mostly in limits of 0.12–0.59 with average of 0.22–0.38 and only in 2017 decreased to minimal <0.10 and average <0.20. The average PhAC values show the normal physiological state of phytoplankton in the Upper Volga during all periods of observation, occasional decrease of PhAC in the Middle Volga, and low photosynthetic activity in the Lower Volga. PhAC is closely correlated with ∑CHL and changes in waters of different trophiс state. In the interannual dynamics, a decrease in the average ∑Chl and CHLCyan in all water bodies and decrease in PhAC in the Middle and Lower Volga was noted in 2017 under cyclonic windy weather with a large amount of precipitation, low solar radiation, and large volume of flow. Currently, there is a previously identified trend towards a decrease in ∑CHL, like decrease in PhAC from the Upper Volga to the Lower Volga that is explained by increasing in the flow rate and volume of runoff downstream the Volga River.
Author Contributions
M.N.M.: conceptualization; leading and coordinating the drafting of the manuscript; supervision of research; data analysis; data curation and visualization; manuscript writing, reviewing, and editing. S.I.V.: field sampling; data analysis; manuscript writing; statistical data analyses; drafting of the manuscript with a focus on interpretation of the results; figure plotting.
Funding
This research was funded by Papanin Institute for Biology of Inland Waters Russian Academy of Sciences (IBIW, Borok) through the state task “Diversity, structure and functioning of algae and plant communities in continental waters” (121051100099-5).
Institutional Review Board Statement
Not applicable.
Informed Consent Statement
Not applicable.
Data Availability Statement
The data presented in this study can be available upon request to corresponding author.
Acknowledgments
We thank Olga Makarova and Vera Solovyeva for sampling support, and also crew of the Academician Topchiev science ship for logistical support and ship operation.
Conflicts of Interest
The authors declare no conflict of interest. The funders had no role in the design of the study; in the collection, analyses, or interpretation of data; in the writing of the manuscript; or in the decision to publish the results.
References
- Vinberg, G.G. Primary Production of the Basins, 1st ed.; Academic Press, Minsk, USSR, 1960.
- Likens, J.E. Primary production of inland aquatic ecosystems. In Primary Productivity of the Biosphere. Leith, H.; Whittaker, R.H. Editors; Springer–Verlag, Berlin, Heidelberg, New York, USA. 1975; pp. 185–202.
- Behrenfeld, M.J.; Randerson, J.T.; McClain, C.R.; Feldman, G.C.; Los, S.O.; Tucker, C.J.; Falkowsli, P.G.; Field, C.B.; Frouin, R.; Esaias, W.E.; Kolber, D.D.; Pollack, N.H. Biospheric primary production during an ENSO transition. Science 2001, 291, 2594–2597. [Google Scholar] [CrossRef] [PubMed]
- OECD. Eutrophication of Waters. Monitoring, Assessment and Control. Paris, France, 1982.
- Chemistry and Biochemistry of Plant Pigments, 1st ed.; Goodwin, T.W., Ed., Academic Press, London, New York, UK, 1965.
- Romanenko, V.I. Microbiological Processes of Production and Destruction of Organic Matter in Inland Waters,1st ed.; Nauka Press, Leningrad, Russia, 1985.
- Mineeva, N.M. Phytoplankton Primary Production in the Volga River Reservoirs, 1st ed.; Print House, Yaroslavl, Russia, 2009.
- Pyrina, I.L. Primary production of phytoplankton in Ivankovo, Rybinsk, and Kuibyshev reservoirs in dependence on some factors. In Production and Cycle of Organic Matter in Inland Waters. Nauka Press, Moscow–Leningrad, Russia. 1966, pp. 249–270.
- Mineeva, N.M. Plant Pigments in the Waters of the Volga River Reservoirs, 1st ed.; Nauka Press, Moscow, Russia. 2004.
- Mineeva, N.M.; Makarova, O.S. Chlorophyll content as an indicator of the modern (2015–2016) trophic state of Volga River Reservoirs. Inland Water Biology. 2018, 11, 386–389. [Google Scholar] [CrossRef]
- Mineeva, N.M.; Semadeni, I.V.; Makarova, O.S. Chlorophyll content and the modern trophic state of the Volga River reservoirs (2017–2018). Inland Water Biology. 2020, 13, 327–330. [Google Scholar] [CrossRef]
- Mineeva, N.M. Chlorophyll and its role in freshwater ecosystem on the example of the Volga River reservoirs. In Chlorophylls, Ameen, S.; Akhtar, M.S.; Shin, H., eds. IntechOpen, London, UK, 2022. Available from:. Available online: https://www.intechopen.com/books/11324.
- SCOR-UNESCO Working Group 17. Determination of photosynthetic pigments. In: Determination of Photosynthetic Pigments in Sea Water. In Monographs on Oceanographic Methodology. UNESСO, Montreux, France. 1966, pp. 9–18.
- Mineeva, N.M. Composition and content of photosynthetic pigments in plankton of the Volga River reservoirs (2015–2016). Transactions of Papanin Institute for Biology of Inland Waters RAS, Russia. 2018; 81(84), 85–96. [Google Scholar] [CrossRef]
- Belous, O.; Klemeshova, K.; Panchenko, O. Comparative analysis of photosynthetic indicators in freesia hybrids on the Black Sea coast of Krasnodar region. Horticultural Science 2017, 44, 99–104. [Google Scholar] [CrossRef]
- Hartig, P.; Wolfstein, K.; Lippemeier, S.; Colijn, F. Photosynthetic activity of natural microphytobenthos populations measured by fluorescence (PAM) and 14C-tracer methods: a comparison. Marine Ecology Progress Series 1998, 166, 53–62. [Google Scholar] [CrossRef]
- Maxwell, K.; Johnson, G.N. Chlorophyll fluorescence – a practical guide. Journal of Experimental Botany 2000, 345, 659–668. [Google Scholar] [CrossRef]
- Loll, B.; Kern, J.; Saenger, W.; Zouni, A.; Biesiadka, J. Towards complete cofactor arrangement in the 3.0 Å resolution structure of photosystem II. Nature 2005, 438, 1040–1044. [Google Scholar] [CrossRef] [PubMed]
- Zavaruev, V.V.; Aponasenko, A.D.; Lopatin, V.N.; Kachin, S.V. Research of correlation dependencies of the phytoplankton physiological state with a fluorescent response based on the use of it maximum and stationary parameters. Journal of Mining Institute, Russia. 2001, 149, 71–74. [Google Scholar]
- Braslavsky, S.E. Glossary of terms used in photochemistry. Pure and Applied Chemistry 2007, 79, 293–465. [Google Scholar] [CrossRef]
- Matorin, D.N. , Rubin, A.B. Fluorescence of Chlorophyll in Higher Plants and Algae, 2012. [Google Scholar]
- Geider, R.J.; Greene, R.M.; Kolber, Z.; Maclntyre, H.L.; Falkowski, P.G. Fluorescence assessment of the maximum quantum efficiency of photosynthesis in the western North Atlantic. Deep Sea Research Part I: Oceanographic Research Papers 1993, 40, 1205–1224. [Google Scholar] [CrossRef]
- Gorbunov, M.Y.; Falkowski, P.G. Using chlorophyll fluorescence to determine the fate of photons absorbed by phytoplankton in the world’s oceans. Annual Review of Marine Science 2022, 14, 213–238. [Google Scholar] [CrossRef] [PubMed]
- Semadeni, I.V. Assessment of phytoplankton photosynthetic activity in the Upper Volga reservoirs via fluorescence diagnosis. Issues of Modern Algology 2021, 27, 18–25. [Google Scholar] [CrossRef]
- Semadeni, I.V. Chlorophyll content and photosynthetic activity of phytoplankton in the Rybinsk Reservoir in years with different hydroclimatic conditions. Ph.D. Dissertation, Institute for Biology of Inland Waters RAS, Borok, Russia, 30 May, 2023. [Google Scholar]
- The River Volga and Its Life, 1st ed.; Butorin, N.V.; Mordukhai-Boltovskoy, P.D., Editors; Dr. W. Junk B.V. Publ., The Hague-Boston–London, UK, 1979.
- Rivers of Europe, 2nd edition. Tockner, K.; Zarfl, Ch.; Robinson, Ch., Editors; Elsevier, Amsterdam, Netherlands. 2021.
- Gol’d, V.M.; Gaevsky, N.A.; Grigoriev, Y.S.; Gekhman, A.V.; Popelʹnitsky, V.A. Theoretical Bases and Methods of Study Chlorophyll Fluorescence. Krasnoyarsk State University Press, Krasnoyarsk, Russia, 1984.
- Golʹd, V.M.; Gaevsky, N.A.; Shatrov, I.Yu.; Popelʹnitsky, V.A.; Rybtsov, S.A. Experience of using fluorescence for differential evaluation of chlorophyll contents in planktonic algae. Hydrobiol. J. 1986, 22, 80–85. [Google Scholar]
- Gaevsky, N.A.; Kolmakov, V.I.; Anishchenko, O.V.; Gorbaneva, T.B. Using DCMU-fluorescence method for the identification of dominant phytoplankton groups. J. Applied Phycol. 2005, 17, 483–494. [Google Scholar] [CrossRef]
- Genty, B.; Briantais, J.M.; Baker, N.R. The relationship between the quantum yield of photosynthetic electron transport and quenching of chlorophyll fluorescence. Biochimica et Biophysica Acta 1989, 990, 87–92. [Google Scholar] [CrossRef]
- Reeves, S.; McMinn, A.; Martin, A. The effect of prolonged darkness on the growth, recovery and survival of Antarctic sea ice diatoms. Polar. Biol. 2011, 34, 1019–1032. [Google Scholar] [CrossRef]
- Franklin, D.J.; Choi, C.J.; Hughes, C.; Malin, G.; Berges, J.A. Effect of dead phytoplankton cells on the apparent efficiency of photosystem II. Marine Ecology Progress Series 2009, 382, 35–40. [Google Scholar] [CrossRef]
- Ilyash, L.V.; Kurochkina, V.A.; Belevich, T.A.; Pogosyan, S.I. Fluorescence of individual cells of the algae Conticribra weissflogii under hyperosmotic stress. Issues of Modern Algology 2012, 2, URL:. Available online: http://algology.ru/131.
- Todorenko, D.A. Characteristics of light reactions of photosynthesis when exposed to toxic substances. Ph.D. Dissertation, Lomonosov Moscow State University, Moscow, Russia, 30 March, 2016. [Google Scholar]
- Report on Climate Features on the Territory of the Russian Federation in 2017. Roshydromet, Moscow, Russia, 2018.
- Gaevsky, N.A.; Zotina, T.A.; Gorbaneva, T.B. Vertical structure and photosynthetic activity of Lake Shira. Aquatic Ecology 2002, 36, 165–178. [Google Scholar] [CrossRef]
- Mineeva, N.M.; Shchure, L.A. Chlorophyll content in phytoplankton biomass. Review. Algology 2012, 22, 423–435. [Google Scholar]
- Korneva, L.G. Phytoplankton of Volga River Basin Reservoirs. Dom Pechati, Kostroma, Russia. 2015.
- Moreno-Ostos, E.; Cruz-Pizarro, L.; Basanta, A.; George, D.G. The spatial distribution of different phytoplankton functional groups in a Mediterranean reservoir. Aquat. Ecol. 2008, 42, 115–128. [Google Scholar] [CrossRef]
- Pautova, V.N.; Nomokonova, V.I. Phytoplankton Production of the Kuibyshev Reservoir, 1st ed.; Institute of Ecology of the Volga Basin RAS, Tolyatti, Russia, 1994.
Figure 1.
Schematic map of the Volga River reservoirs according to [12]. 1 – boundary of reservoirs.
Figure 1.
Schematic map of the Volga River reservoirs according to [12]. 1 – boundary of reservoirs.
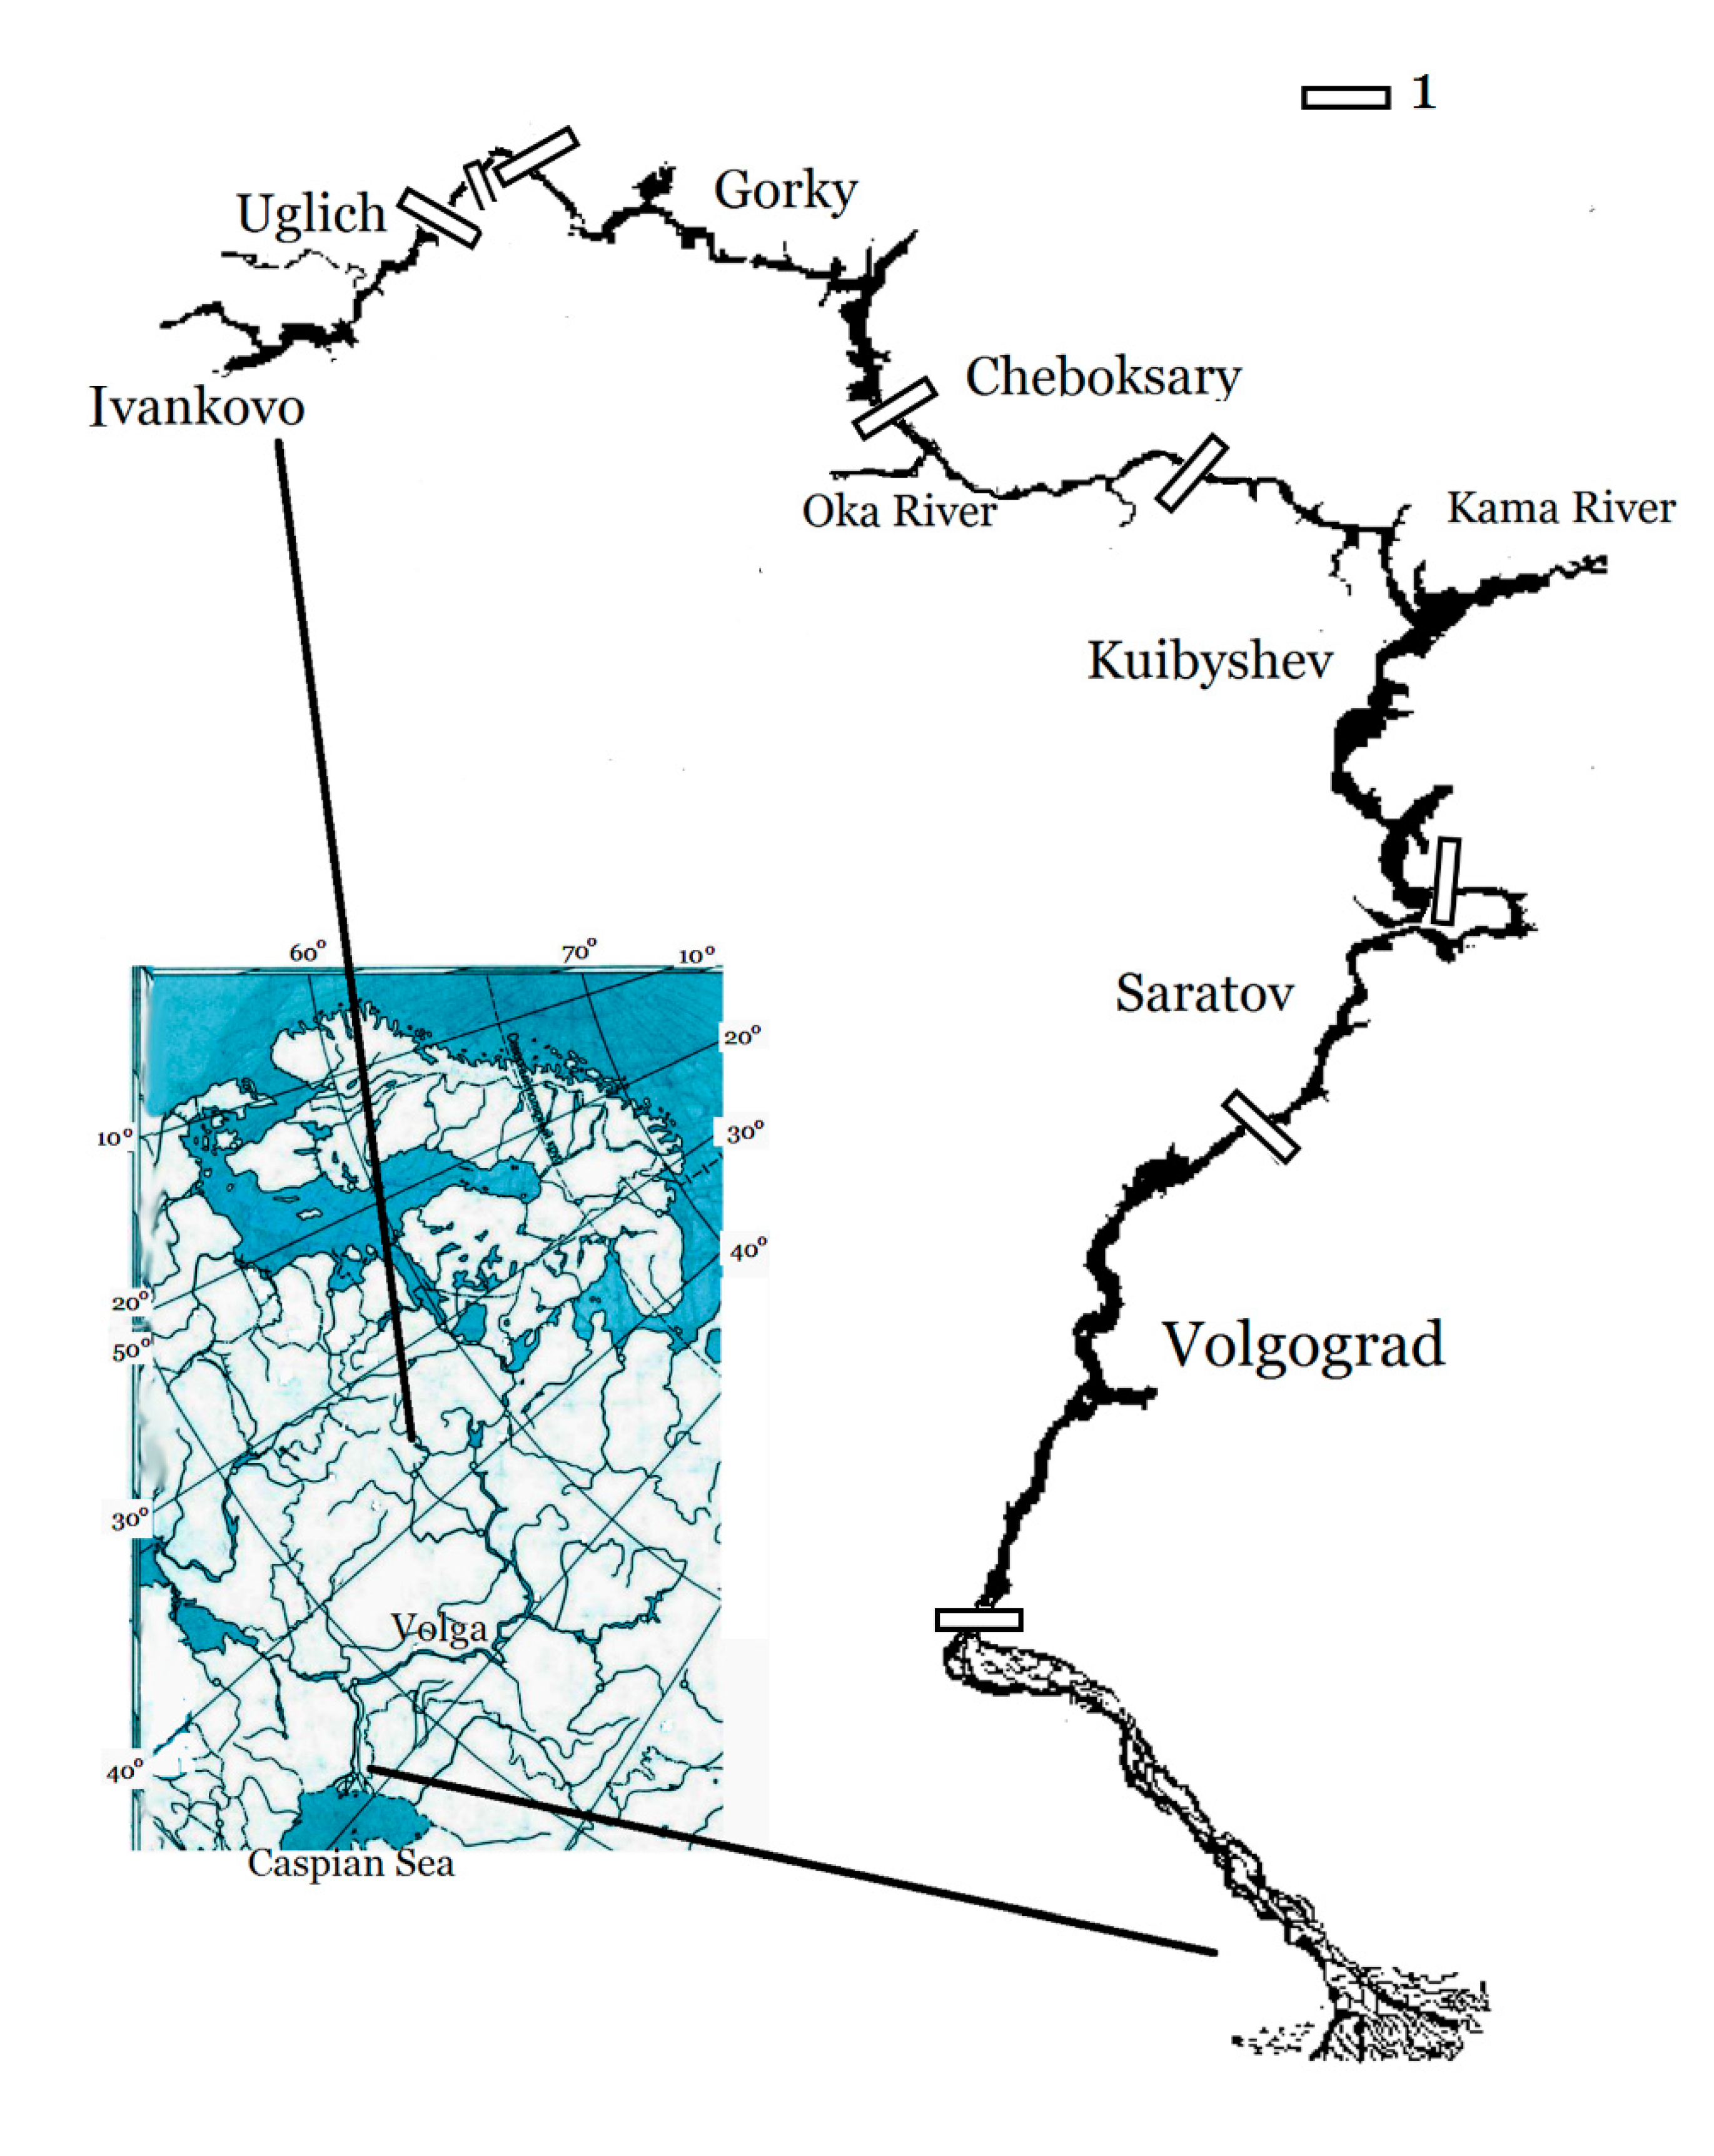
Figure 2.
Average chlorophyll content in basic phytoplankton taxa (CHLCyan , CHLBac, CHLChlor) and in total (∑CHL) equal to their sum in the Volga River reservoirs in years of study (2015–2017, A–C, respectively). Error bar and trend dotted line are given for ∑CHL; R2 – coefficient of determination. Reservoirs: Iv – Ivankovo, Ugl – Uglich, Gor – Gorky, Cheb – Cheboksary, Kuib – Kuibyshev, Sar – Saratov, Volg – Volgograd.
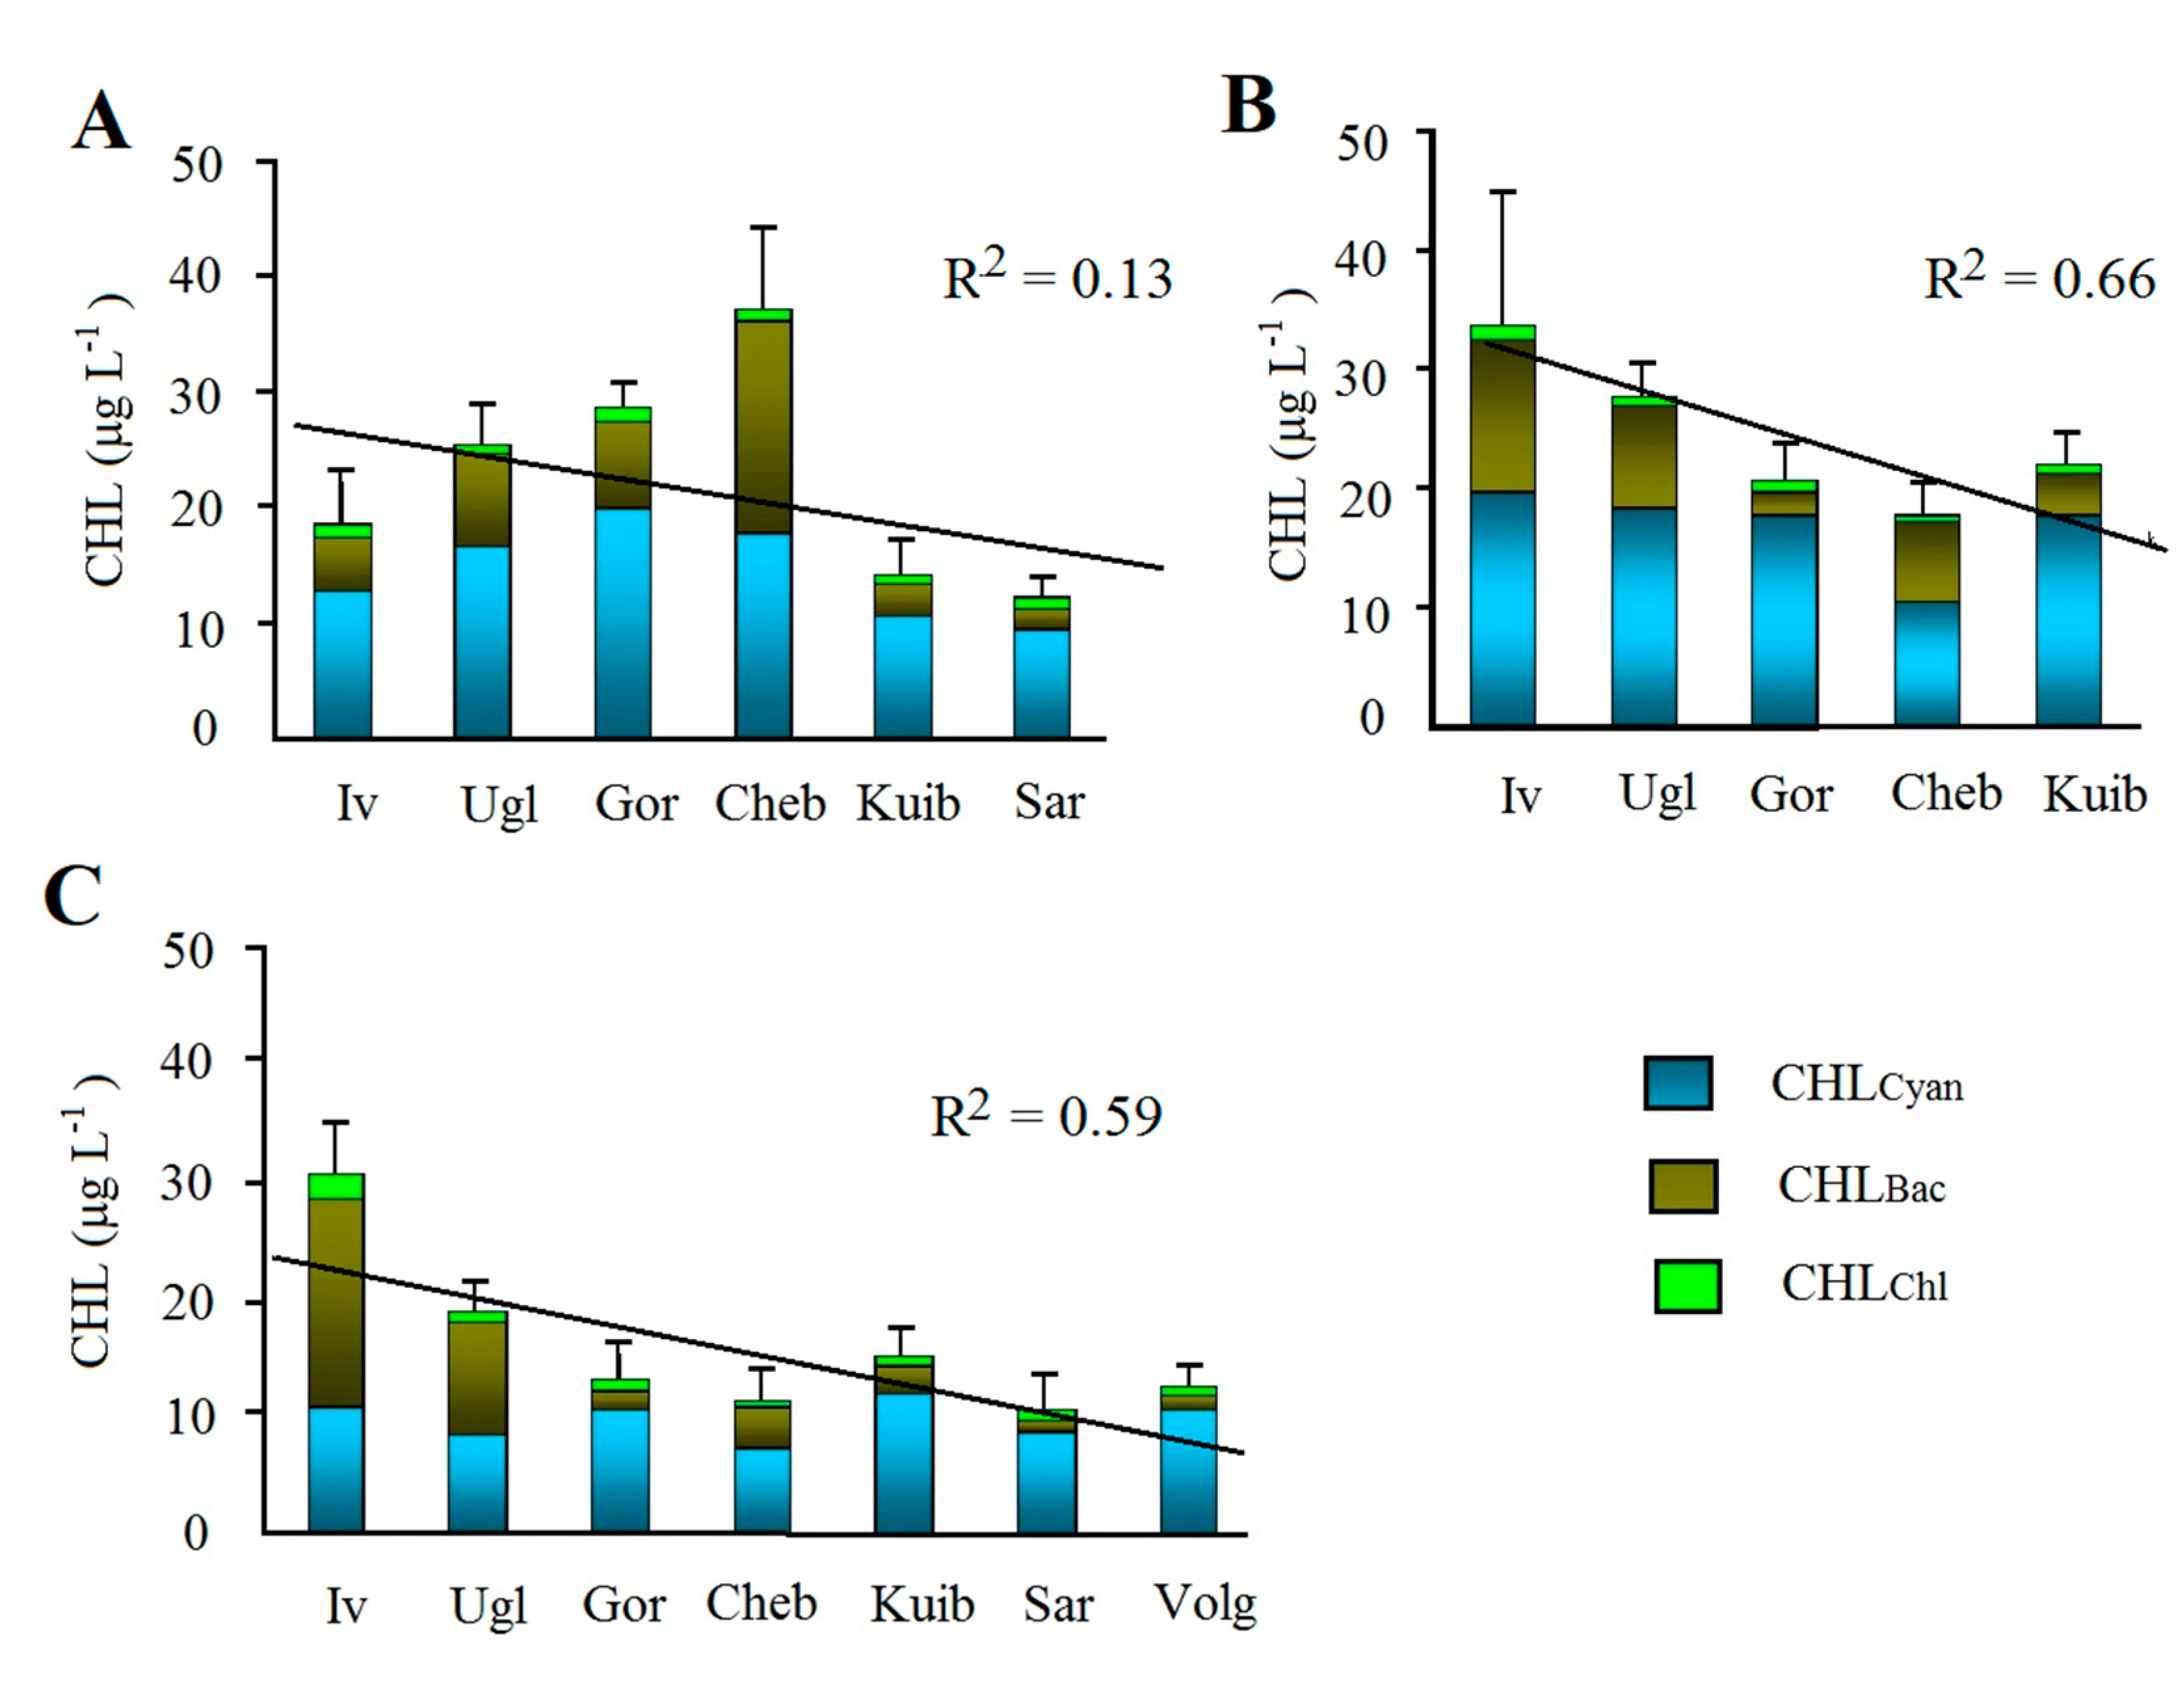
Figure 3.
Box plots of chlorophyll concentrations in total (∑CHL, A), CHLCyan (B), CHLBac (C), and PhAC (D) in the Upper, Middle, and Lower Volga (UpV, MV, LV, respectively). Data are averaged over three years of study.
Figure 3.
Box plots of chlorophyll concentrations in total (∑CHL, A), CHLCyan (B), CHLBac (C), and PhAC (D) in the Upper, Middle, and Lower Volga (UpV, MV, LV, respectively). Data are averaged over three years of study.
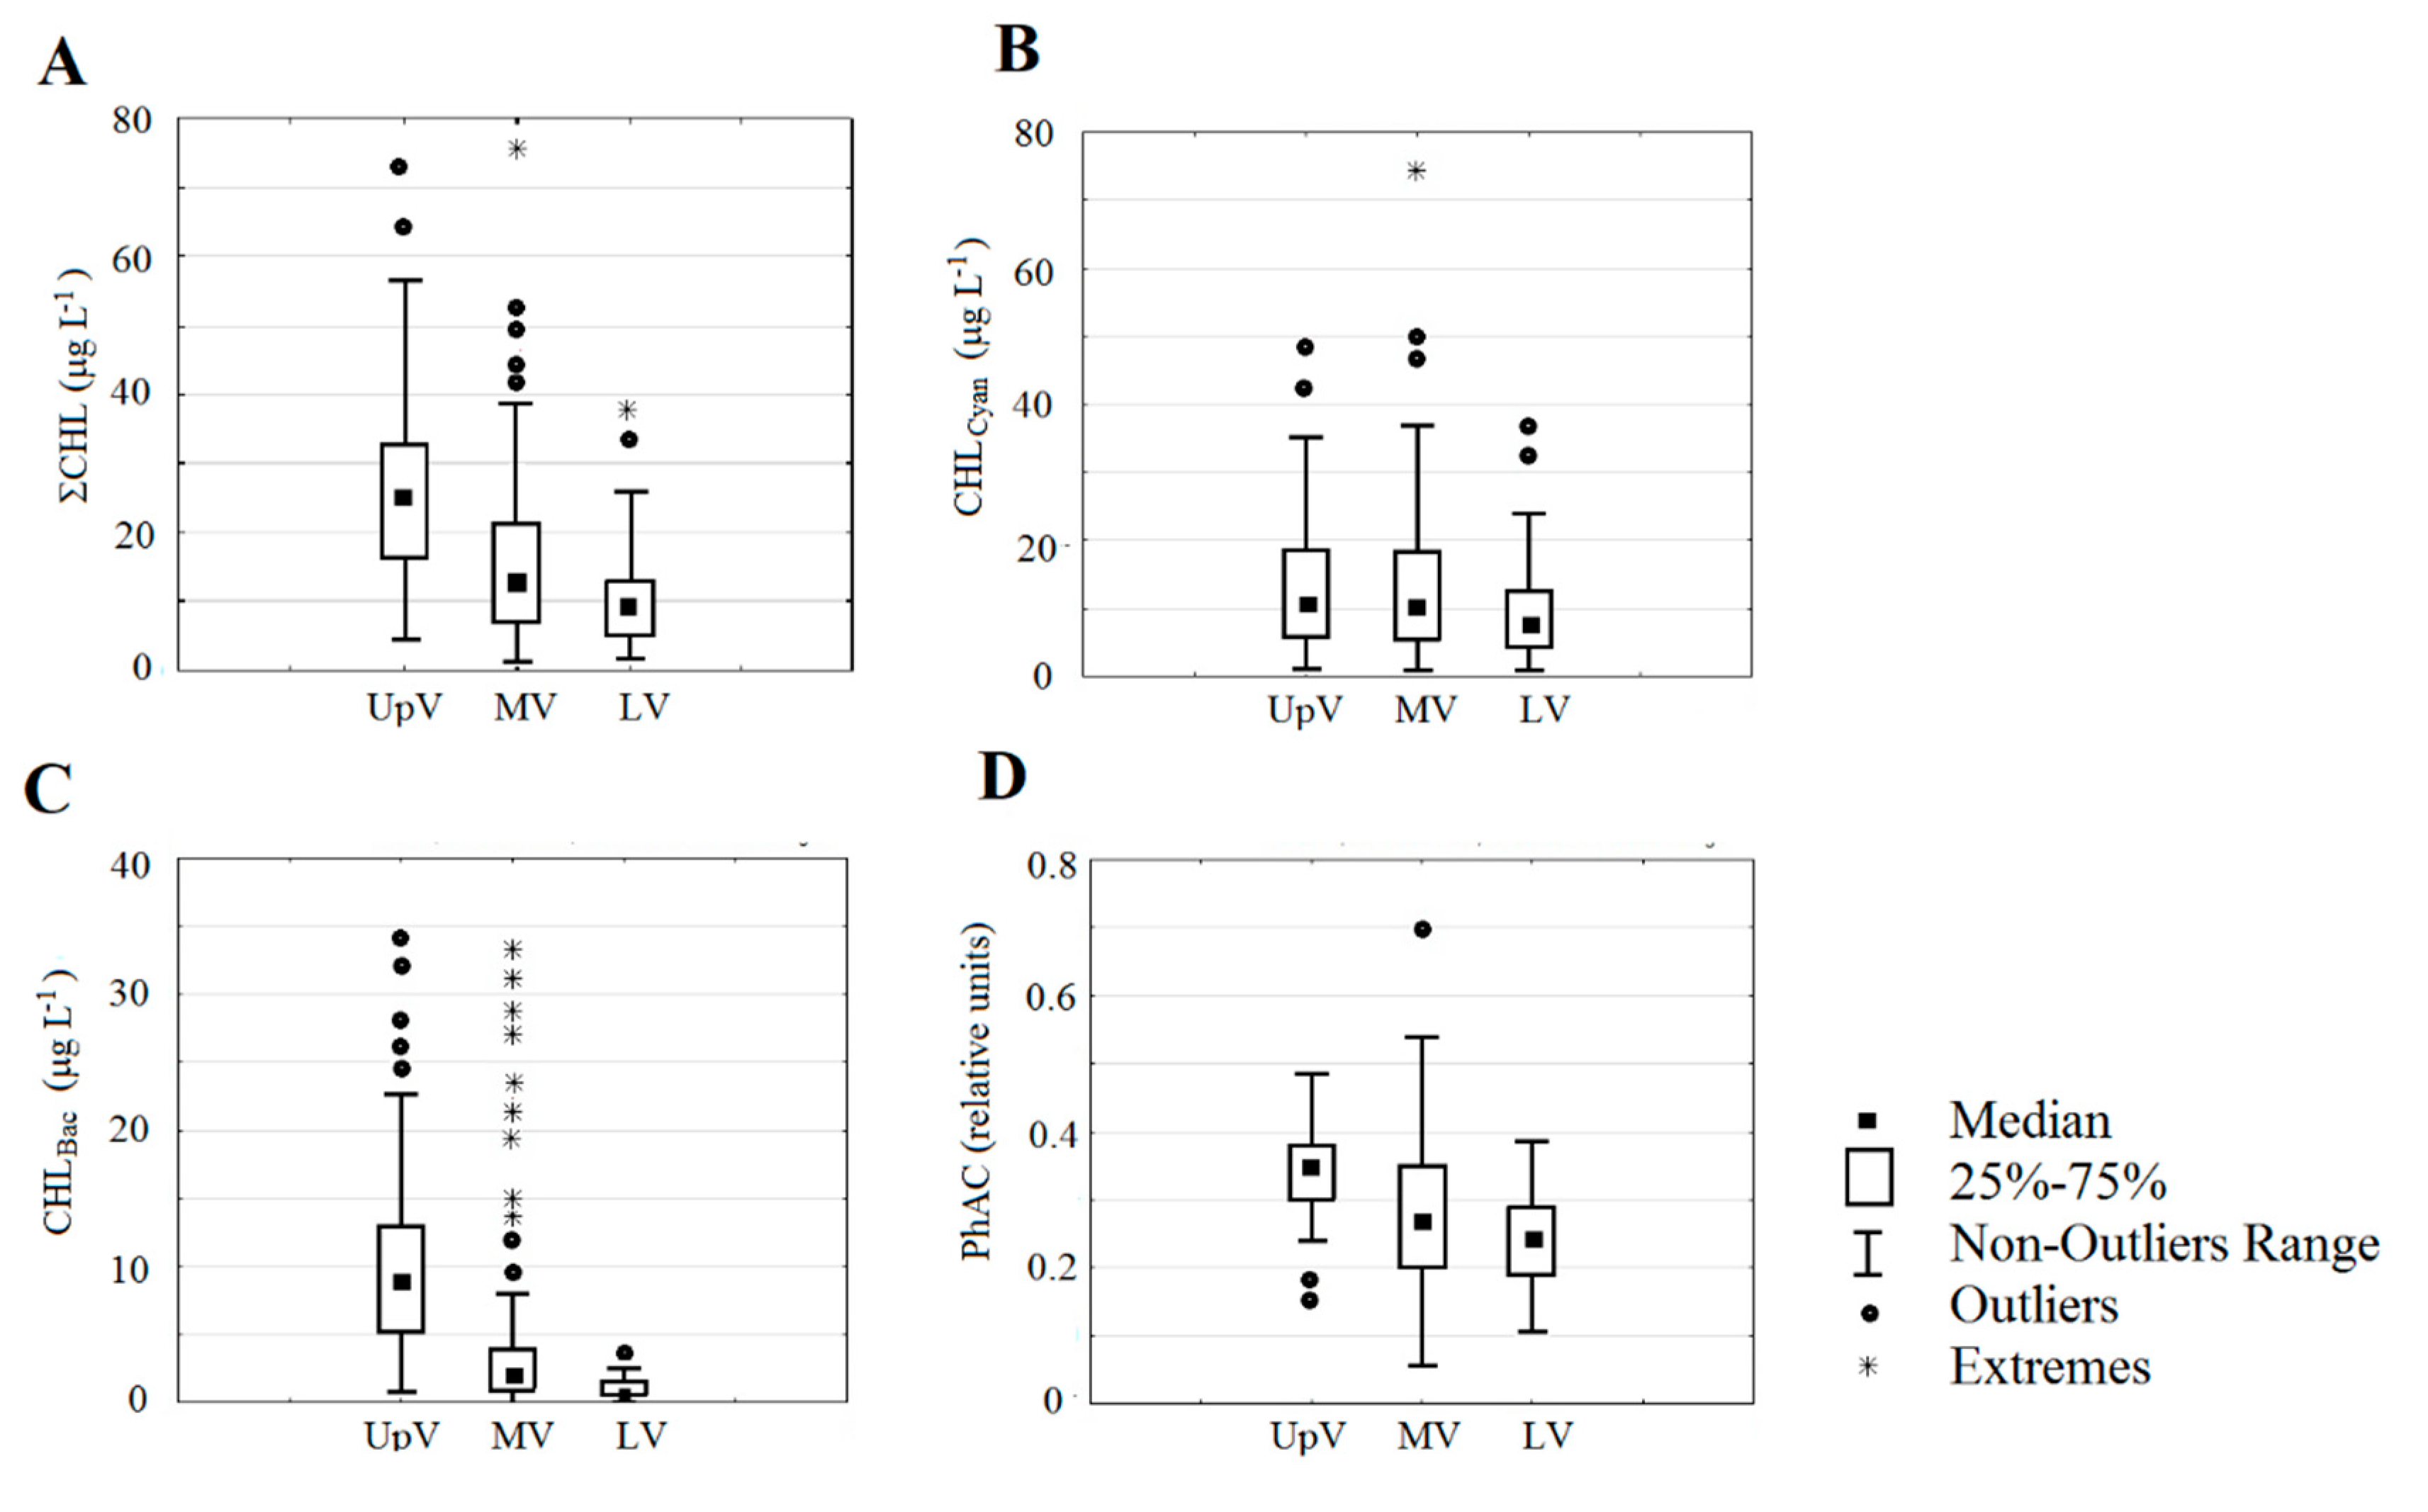
Figure 4.
Coefficient of photosynthetic activity (PhAC) of phytoplankton in the Volga River reservoirs in years of study (2015–2017, A–C, respectively). Mean values with standard error; dotted line – trend line; R2 – coefficient of determination. Reservoirs: Iv – Ivankovo, Ugl – Uglich, Gor – Gorky, Cheb – Cheboksary, Kuib – Kuibyshev, Sar – Saratov, Volg – Volgograd.
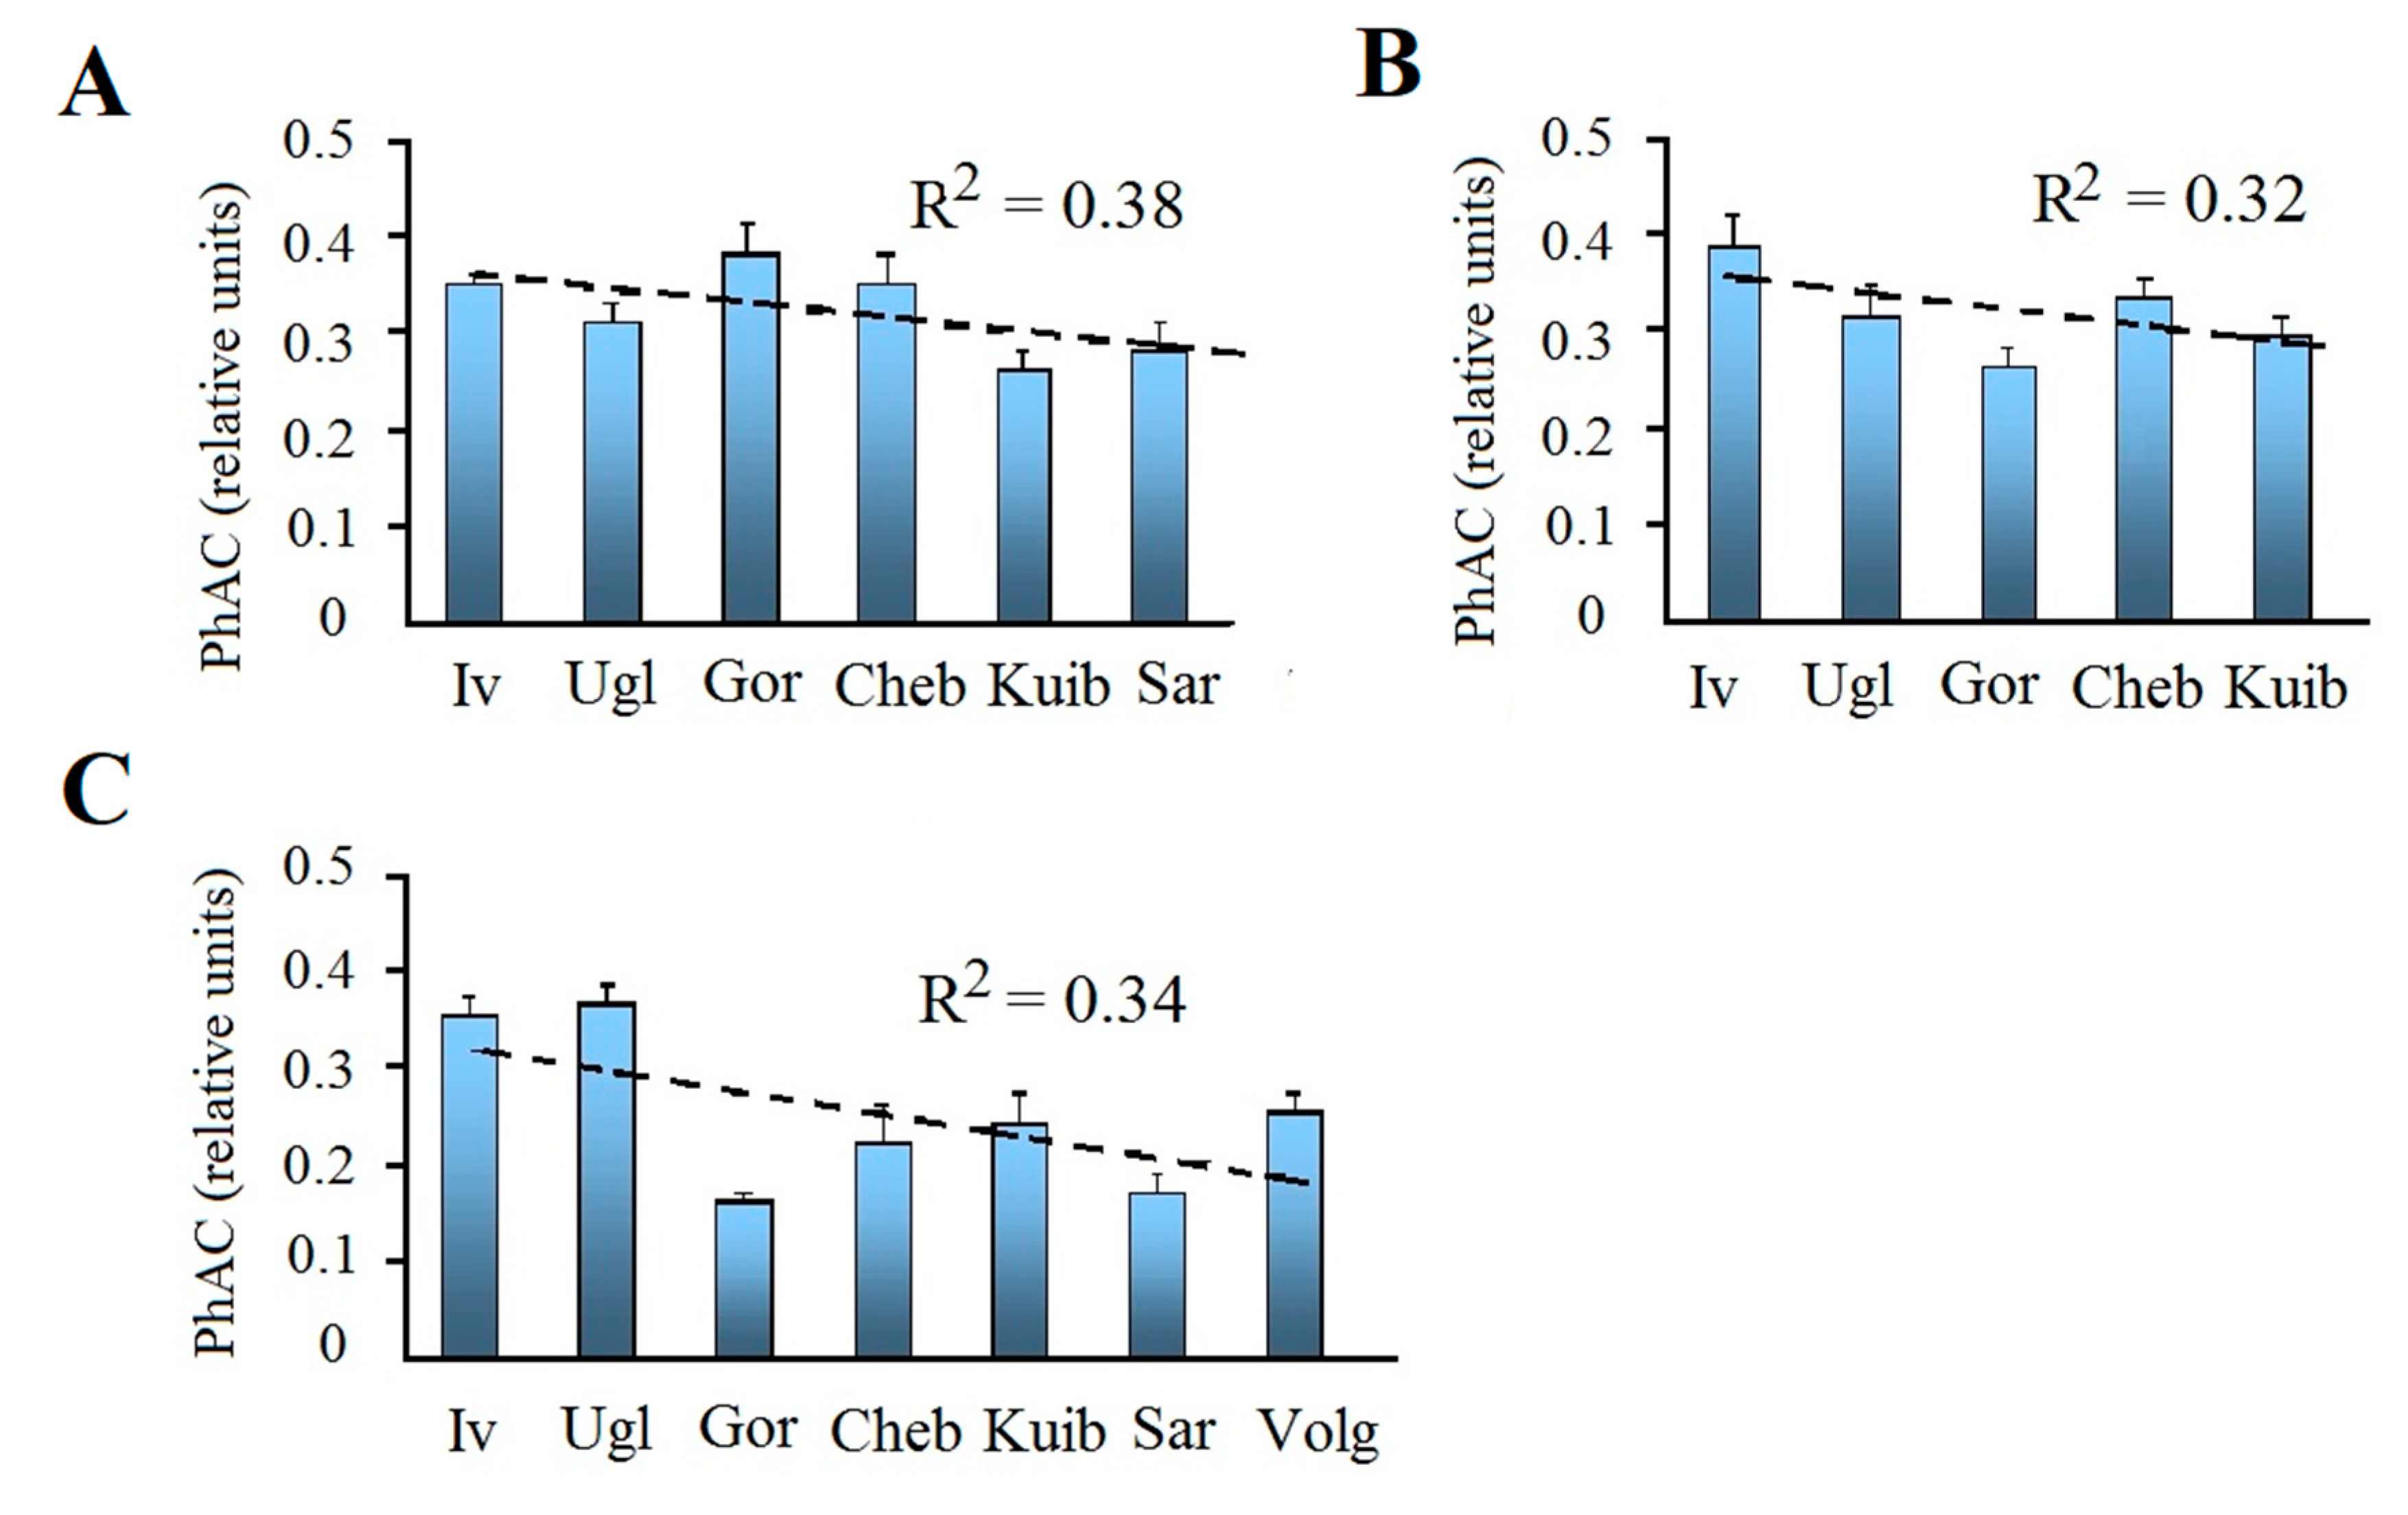
Figure 5.
Dependence of PhAC on chlorophyll content in the Volga River reservoirs.

| Parameters | Upper Volga | Middle Volga | Lower Volga | ||||
|---|---|---|---|---|---|---|---|
| Ivankovo | Uglich | Gorky | Cheboksary | Kuibyshev | Saratov | Volgograd | |
| Total water input, km3 per year | 10.07 | 11.46 | 49.53 | 118.89 | 244.3 | 248.3 | 259.2 |
| Surface area, km2 | 327 | 249 | 1591 | 1080 | 6150 | 1831 | 3117 |
| Length, km | 120 | 143 | 430 | 321 | 484 | 348 | 546 |
| Mean depth, m | 3.4 | 5.0 | 6.1 | 4.2 | 8.9 | 7.3 | 10.1 |
| Total storage, km3 | 1.12 | 1.25 | 8.82 | 4.60 | 57.30 | 12.87 | 31.45 |
| Water exchange, year-1 | 10.6 | 10.1 | 6.1 | 20.9 | 4.2 | 19.1 | 8.0 |
| Transparency, m | 0.8 | 0.8 | 1.2 | 1.2 | 1.5 | 2.2 | 2.0 |
| Water color, Cr-Co degree | 53 | 51 | 53 | 42 | 38 | 36 | 34 |
| Conductivity, μSim cm-1 | 240 | 250 | 206 | 355 | 315 | 345 | 424 |
| Total nitrogen, mg L-1 | 1.34 | 1.27 | 1.09 | 1.14 | 1.08 | 0.99 | 0.98 |
| Total phosphorus, μg L-1 | 90 | 93 | 68 | 124 | 145 | 127 | 134 |
Table 2.
Chlorophyll content in basic phytoplankton taxa (CHLCyan , CHLBac, CHLChlor) and in total (∑CHL) in the Volga River reservoirs in years of study (above the line limits, below the line mean values with standard error).
Table 2.
Chlorophyll content in basic phytoplankton taxa (CHLCyan , CHLBac, CHLChlor) and in total (∑CHL) in the Volga River reservoirs in years of study (above the line limits, below the line mean values with standard error).
| Reservoir | Year, | CHLCyan | CHLBac | CHLChlor | ∑CHL | |||
|---|---|---|---|---|---|---|---|---|
| μg L-1 | % | μg L-1 | % | μg L-1 | % | μg L-1 | ||
| Ivankovo | 2015 | 3.0–42.0 | 26–86 | 0.8–11.7 | 8–58 | 0.3–3.9 | 2–18 | 4.3–49.0 |
| 13.5 ± 3.6 | 64 ± 6 | 4.7 ± 1.0 | 29 ± 5 | 1.1 ± 0.3 | 7 ± 1 | 19.4 ± 4.0 | ||
| 2016 | 4.8–49.1 | 37–87 | 1.7–12.6 | 12–61 | 0.5–3.0 | 1–11 | 8.4–56.2 | |
| 19.7 ± 5.4 | 62 ± 4 | 6.7 ± 1.8 | 32 ± 4.2 | 1.2 ± 0.3 | 5 ± 1 | 33.7 ± 11.1 | ||
| 2017 | 1.3–29.1 | 11–58 | 1.2–31.8 | 36–85 | 0.2–3.7 | 3–18 | 3.2–45.7 | |
| 6.8 ± 2.1 | 31 ± 4 | 14.8 ± 3.2 | 62 ± 4 | 1.5 ± 0.3 | 7 ± 1 | 23.1 ± 4.9 | ||
| Uglich | 2015 | 2.2–28.5 | 20–84 | 3.2–14.2 | 12–74 | 0.3–1.7 | 2–7 | 17.1–35.2 |
| 16.6 ± 3.0 | 62 ± 6 | 8.0 ± 1.2 | 35 ± 6 | 0.8 ± 0.1 | 3 ± 1 | 25.3 ± 3.6 | ||
| 2016 | 10.9–27.1 | 40–85 | 3.9–26.1 | 14–57 | 0.3–1.6 | 1–5 | 16.7–45.9 | |
| 18.2 ± 1.5 | 68 ± 4 | 8.6 ± 2.2 | 29 ± 4.0 | 0.8 ± 0.2 | 3 ± 1 | 27.6 ± 2.8 | ||
| 2017 | 2.3–16.3 | 23–52 | 7.1–13.9 | 44–73 | 0.4–1.4 | 2–7 | 10.4–31.3 | |
| 7.9 ± 1.5 | 40 ± 3 | 10.2 ± 0.9 | 55 ± 3 | 0.9 ± 0.1 | 5 ± 1 | 19.0 ± 2.0 | ||
| Gorky | 2015 | 7.2–27.8 | 46–91 | 2.6–14.0 | 9–53 | 0.0–2.1 | 0.1–6 | 15.6–36.1 |
| 19.9 ± 1.6 | 71 ± 4 | 7.6 ± 1.0 | 28 ± 4 | 0.3 ± 0.2 | 1 ± 0.4 | 27.8 ± 1.5 | ||
| 2016 | 6.4–36.6 | 76–98 | 0.3–6.4 | 2.2–22 | 0.0–1.1 | 0.1–2 | 8.5–44.1 | |
| 17.7 ± 2.3 | 90 ± 2 | 1.8 ± 0.5 | 9 ± 2 | 0.1 ± 0.1 | 1 ± 0.3 | 19.6 ± 2.7 | ||
| 2017 | 0.7–12.2 | 55–98 | 0.2–1.6 | 1–35 | 0.0–0.5 | 1–9 | 1.2–13.1 | |
| 6.1 ± 1.0 | 79 ± 3 | 1.1 ± 0.1 | 18 ± 3 | 0.2 ± 0.0 | 3 ± 1 | 7.4 ± 1.0 | ||
| Cheboksary | 2015 | 0.5–26.1 | 2–89 | 1.6–33.0 | 10–97 | 0.0–0.4 | 0.1–1 | 16.2–52.1 |
| 17.8 ± 2.6 | 60 ± 10 | 18.3 ± 6.8 | 40 ± 10 | 0.2 ± 0.0 | 0.5 ± 0.1 | 36.3 ± 6.9 | ||
| 2016 | 3.8–18.7 | 14–97 | 0.5–31.4 | 3–82 | 0.0–1.3 | 0.1–7 | 5.2–38.1 | |
| 11.0 ± 1.9 | 66 ± 6 | 3.6 ± 1.2 | 30 ± 6 | 0.6 ± 0.1 | 4 ± 1 | 15.1 ± 2.2 | ||
| 2017 | 0.4–17.4 | 1–98 | 0.4–27.5 | 2–86 | 0.0–3.9 | 1–12 | 3.5–31.8 | |
| 5.0 ± 1.9 | 61 ± 11 | 4.7 ± 3.4 | 32 ± 9 | 0.8 ± 0.5 | 7 ± 2 | 10.5 ± 3.6 | ||
| Kuibyshev | 2015 | 1.6–22.8 | 59–93 | 0.6–13.6 | 7–35 | 0.0–2.5 | 0.1–6 | 2.2–38.9 |
| 10.6 ± 2.0 | 78 ± 3 | 2.7 ± 0.9 | 21 ± 3 | 0.3 ± 0.2 | 1 ± 0.5 | 13.6 ± 2.8 | ||
| 2016 | 6.7–47.2 | 44–95 | 0.6–11.9 | 5–46 | 0.1–3.0 | 0.2–12 | 7.9–49.9 | |
| 17.6 ± 2.0 | 79 ± 2.9 | 3.5 ± 0.6 | 17 ± 2 | 0.8 ± 0.2 | 4 ± 1 | 21.9 ± 2.0 | ||
| 2017 | 0.7–13.3 | 37–98 | 0.1–6.5 | 1–62 | 0.1–0.8 | 1–15 | 1.3–15.0 | |
| 6.2 ± 1.0 | 72 ± 5 | 1.9 ± 0.6 | 22 ± 5 | 0.4 ± 0.1 | 6 ± 1 | 8.5 ± 1.1 | ||
| Saratov | 2015 | 4.0–18.4 | 74–88 | 1.0–2.6 | 10–26 | 0.0–0.3 | 0.5–2 | 5.1–20.8 |
| 9.5 ± 1.3 | 82 ± 1 | 1.7 ± 0.2 | 17 ± 1 | 0.1 ± 0.0 | 1 ± 0.1 | 11.3 ± 1.4 | ||
| 2017 | 1.5–10.1 | 78–96 | 0.3–0.8 | 2–25 | 0.1–0.2 | 1–6 | 2.0–10.7 | |
| 4.6 ± 1.7 | 83 ± 5 | 0.5 ± 0.1 | 14 ± 4 | 0.1 ± 0.0 | 3 ± 1 | 5.2 ± 1.5 | ||
| Volgograd | 2017 | 0.6–14.2 | 28–93 | 0.1–2.2 | 2–63 | 0.2–0.4 | 1–9 | 2.1–15.8 |
| 6.6 ± 1.2 | 78 ± 6 | 1.1 ± 0.2 | 18 ± 6 | 0.3 ± 0.1 | 4 ± 1 | 8.0 ± 1.1 | ||
Table 3.
Results of comparison of the average chlorophyll and PhAC in the Upper, Middle, and Lower Volga using oneway ANOVA.
Table 3.
Results of comparison of the average chlorophyll and PhAC in the Upper, Middle, and Lower Volga using oneway ANOVA.
| Parameter | Source of variation | SS | df | MS | F | P | Fcr |
|---|---|---|---|---|---|---|---|
| ∑CHL | Between groups | 7962 | 2 | 3981 | 27.1 | 0.00 | 3.03 |
| Within groups | 38526 | 262 | 147 | ||||
| CHLCyan | Between groups | 454 | 2 | 227 | 2.28 | 0.10 | 3.03 |
| Within groups | 26134 | 262 | 99 | ||||
| CHLBac | Between groups | 3408 | 2 | 1704 | 43.5 | 0.00 | 3.02 |
| Within groups | 10262 | 262 | 39.2 | ||||
| PhAC | Between groups | 0.251 | 2 | 0.125 | 15.1 | 0.00 | 3.04 |
| Within groups | 1.588 | 191 | 0.008 |
SS, sum of squared deviations; df , number of degrees of freedom; MS, mean square; F, F-test; Fcr, F critical; P, significance level.
Table 4.
Coefficient of photosynthetic activity (PhAC) of phytoplankton in the Volga River reservoirs in 2015-2017.
Table 4.
Coefficient of photosynthetic activity (PhAC) of phytoplankton in the Volga River reservoirs in 2015-2017.
| Reservoir | 2015 | 2016 | 2017 | |||
|---|---|---|---|---|---|---|
| Min–max | X ± SE | Min–max | X ± SE | Min–max | X ± SE | |
| Ivankovo | 0.17–0.38 | 0.35 ± 0.01 | 0.37–0.59 | 0.38 ± 0.03 | 0.27–0.43 | 0.35 ± 0.02 |
| Uglich | 0.27–0.4 | 0.31 ± 0.02 | 0.18–0.57 | 0.31 ± 0.03 | 0.27–0.44 | 0.36 ± 0.02 |
| Gorky | 0.24–0.70 | 0.38 ± 0.03 | 0.14–0.44 | 0.26 ± 0.02 | 0.09–0.26 | 0.16 ± 0.01 |
| Cheboksary | 0.18-0.52 | 0.35 ± 0.03 | 0.18–0.44 | 0.33 ± 0.02 | 0.08–0.4 | 0.22 ± 0.04 |
| Kuibyshev | 0.12–0.39 | 0.26 ± 0.02 | 0.2–0.39 | 0.29 ± 0.02 | 0.06–0.36 | 0.24 ± 0.03 |
| Saratov | 0.19–0.38 | 0.28 ± 0.03 | – | – | 0.10–0.25 | 0.17 ± 0.02 |
| Volgograd | – | – | – | – | 0.12–0.38 | 0.25 ± 0.02 |
Table 5.
Change in PhAC in waters of different trophic state estimated by ∑CHL.
| Trophic state | ∑CHL, μg L–1 | PhAC, relative units |
|---|---|---|
| Oligotrophic | <3 | 0.12 ± 0.01 |
| Mesotrophic | 3–10 | 0.20 ± 0.01 |
| Moderate eutrophic | 10–15 | 0.27 ± 0.01 |
| Eutrophic | 15–30 | 0.32 ± 0.01 |
| Hypertrophic | >30 | 0.38 ± 0.01 |
Disclaimer/Publisher’s Note: The statements, opinions and data contained in all publications are solely those of the individual author(s) and contributor(s) and not of MDPI and/or the editor(s). MDPI and/or the editor(s) disclaim responsibility for any injury to people or property resulting from any ideas, methods, instructions or products referred to in the content. |
© 2023 by the authors. Licensee MDPI, Basel, Switzerland. This article is an open access article distributed under the terms and conditions of the Creative Commons Attribution (CC BY) license (http://creativecommons.org/licenses/by/4.0/).
Copyright: This open access article is published under a Creative Commons CC BY 4.0 license, which permit the free download, distribution, and reuse, provided that the author and preprint are cited in any reuse.


