
Submitted:
16 July 2023
Posted:
18 July 2023
You are already at the latest version
Abstract
In the laboratory practice, several standards for testing the bending stiffness of corrugated board are used. There are often cases of tests where the results depend on the way the sample is placed on the supports. The problem arises when the board is five-ply (with two corrugated layers with different corrugation heights) or when the board has asymmetrically selected papers on the flat layers. In this article, we focus our attention on the problem related to boundary conditions, with particular attention to the local effects of the support of the sample. Since the cardboard layers, both flat and corrugated, have a small thickness, a slight deformation of the papers can always be observed at the point of contact between the sample and the support, which affects the readings of the measured stiffness. The paper presents theoretical and numerical analyzes showing how much the method of supporting the sample affects the measured bending stiffness of various samples. Numerical observations were also compared with the results of analyzes presented by other scientists as well as with experimental results.
Keywords:
corrugated board
; bending stiffness
; multilayer unsymmetrical panels
; boundary conditions
; finite element analysis
Introduction
Cardboard is a material commonly used around the world. The volume of production of cardboard products and the dynamics of the development make this sector in the first place of the entire paper industry. Cardboard is widely used mainly in the following industries: packaging, transportation, catering, construction and renovation, food, advertising, but also in everyday life.
Cardboard packaging is very common because it is a product that is cheap and suitable for mass production. Corrugated cardboard is made of paper, making it an environmentally friendly product, 100 percent recyclable, thus displacing plastic. Scientific research has proven that corrugated fibres can be reused more than 25 times without significant loss of quality (Putz and Schabel 2018), although heavy metal contamination of the cardboard is a problem (Mertoglu-Elmas 2017). It is also a very lightweight material, hence the packaging made of this material practically does not affect the final weight of the shipment. Ultimately, corrugated board is very strong, protects objects from shock and mechanical damage, and absorbs impacts (Wang et al. 2021). Corrugated board composites are also perfect as elements of sound absorbers (Chanlert et al. 2022).
This product has few disadvantages. Corrugated board is a material that is very sensitive to environmental conditions, especially moisture. It is also a material without special coatings or admixtures, paper will not be resistant to moisture and without proper storage and warehousing conditions. The effect of temperature and relative humidity on the compressive strength of corrugated boxes is studied in (Liu et al. 2010). The sensitivity of paperboard to environmental conditions is forcing manufacturers to seek new solutions such as innovative low-diffusion corrugated cardboard coated with a polymer-wax coating. An Innovative Cardboard ARchitecture Object, ICARO, modular, highly sustainable, has just been developed in Sicily and is in the testing phase (Sapienza et al. 2022).
Corrugated board is made by alternating layers of paper (liners and corrugated layers). The layers can have different thicknesses and the waves can have different geometries, i.e. different heights and lengths. The most popular wave types are: E, B, C, with E being the lowest and C being the highest. Typically, 2-ply (cardboard), 3-ply and 5-ply corrugated cardboard are used. 7-layer and 9-layer boards are less frequently exploited. The 2-ply comes in rolls and is used to wrap items for protection during transportation. On the other hand, 3- and 5-layer corrugated boards are used for making packaging. 7- and 9-ply cardboards are intended for special tasks e.g. for bulk packaging. They are also used in the metallurgical and automotive industries.
The most important aspect of packaging is the appropriate protection of the goods during storage or transport. In order to assess the ability of the packaging to protect the goods, it is necessary to perform appropriate strength tests and determine the appropriate characteristics of the cardboard. The box compression test (BCT) is a test of the compression resistance of the finished, formed box. (Marin et al. 2021). This method allows to determine the maximum pressure that the finished box can withstand and the number of layers in which boxes with contents can be stored. The Edgewise Crush Test (ECT) determines the strength of corrugated board under edge pressure (Bai et al. 2019; Schrampfer et al. 1987), where the sample is compressed until strength is lost. The 4-point bending test expresses the resistance of multilayer paperboard to bending under the influence of forces acting perpendicular to its surface (Jamsari et al. 2019). The bending stiffness is defined per unit width of the element. This test precisely indicates even small cardboard deformations that are impossible to determine by other methods. The stiffness indicates the crucial importance of board thickness and its influence on BCT.
Due to its great practical importance, the issue of determining the bending stiffness of cardboard (and not only) is constantly the subject of scientific publications. The determination of bending properties of cardboard in three-point bending tests using samples of various span lengths was presented in (Yoshihara et al. 2022). The bending stiffness and moment capacity per unit width were determined, and the effects of the testing method and span length were investigated. Of course, in the case of 3-point bending, shape deformations of the cardboard caused by shear forces should be taken into account. This issue may require an advanced approach (Garbowski and Gajewski 2021; Buannic et al. 2003). The problem of global or local loss of stability has also been discussed many times in the literature, mainly in the context of edge compression (Norstrand 2004; Garbowski et al. 2020; Popil 2012), and of course it does not apply only to cardboard. (Åslund et al. 2014). However, the influence of the local deformation of the cardboard at the supports on the determination of its bending stiffness is omitted, although the significance of this phenomenon was presented in publications concerning, for example, sandwich panels (Błaszczuk and Pozorski 2012; Pozorska and Pozorski 2018). The flexural stiffness is also dependent on the moisture content, and this problem can be related to the stiffness of the pulp fibers (Lorbach et al. 2014).
Although traditional experimental methods are the basic and necessary tool for evaluating the properties of cardboard, they are often supported or supplemented by numerical analysis, which facilitates understanding the complexity of the observed phenomena and makes it possible to perform many simulations in a short time. In (Urbanik and Frank 2006), FEM and data obtained from multiple literature sources were used to derive a more general box compression formula. FEM was also applied to observe of buckling phenomena of corrugated cardboard boxes (Urbanik and Saliklis 2003). In (Sohrabpour and Hellström 2011), numerical models were used to predict cardboard properties and corrugated box properties. Extension discussion on the topic of numerical strength estimation of corrugated board packages can be found in (Park et al. 2020).
In this paper, we present a discussion on the 4-point bending test and the influence of local cardboard deformations on the obtained value of bending stiffness. This problem, overlooked in the literature on the subject so far, turns out to be extremely important. The more so that the correct assessment of the properties of the cardboard is of great importance for the prediction of the functional properties of cardboard packaging.
Methods and Materials
The Four-Point Bending Test of Asymmetric Corrugated Board
The 4-point bend test is the most popular test used to determine the bending stiffness of various materials, including corrugated board.. It consists in bending a sample placed on two bottom supports, by moving two upper supports, which have a spacing greater than the lower supports. The test scheme is shown in Figure 1. Such arrangement of supports allows for pure bending, which means that in the part of the sample between the bottom supports there is a constant bending moment without the simultaneous action of other cross-sectional forces. Bending stiffness (BS) per unit width can be calculated as [PN-EN ISO 5628:1990]:
where is the bending force, is the distance between the outer support and its nearer inner support, is the distance between the inner supports, is the deflection of the sample center and is the test sample width.
In the middle part of the cardboard sample, the sample is subjected to bending with a constant moment , i.e. the upper part of the cross-section is stretched while the bottom part is compressed. Testing corrugated board with an asymmetric cross-section, measurements should be taken for two positions of the sample, see Figure 2. In the first position of the sample (see Figure 2a), the higher flute part of the sample is compressed and the lower flute side is stretched. For this configuration, lower bending stiffness values are usually obtained compared to the results obtained from bending the same sample but arranged in the opposite way (see Figure 2b). For this reason, it can be assumed that the side of the cross-section with the higher wave (B in this example) is “weaker” and the part with the lower wave (E in this example) is “stronger”.
To distinguish between the two positions of the sample during the test, the name of cardboard was described with two letters denoting the type of flute, so that the letter corresponding to the stretched flute was written first, and the letter related to the compressed flute - second. In practice, one can find many asymmetric corrugated boards, these will be all double-walled (i.e. 5-layer) cardboards with two different flutes, starting from the most common EB, through BC to less popular EC and many others.
In the case of above mentioned double-walled corrugated boards, the notation EB, EC and BC means the compression of the section with the “weaker” higher flute, and the notation BE, CE and CB means the compression of the part with the “stronger” lower flute (see Figure 2). An asymmetric cross-section can also be obtained for five-layer cardboard with two the same waves and for three-layer cardboard but only if different papers for the external flat layers are used, see Figure 3. In such cases, the position of the sample with the weaker liner in compression will be indicated by letters corresponding to the wave types (EE, B and C) and the position with the stronger liner in compression will be written with the subscript “rev” (EErev, Brev i Crev).
Corrugated Board – Geometry and Materials
Corrugated board is a material consisting of flat layers (liners) and corrugated layers (flutings) connected with each other by an adhesive joint in the production process. The geometry of the cardboard is mainly determined by the corrugated layers, which have a sinusoidal shape. Therefore, they can be described by two values: the wavelength and the height of the wave. In Figure 4, a simplified geometry scheme of double-walled corrugated board is shown, where is the wavelength of the -th flute and is the height of the -th flute. In Table 1, the geometrical parameters of the waves used in the analyzes are presented.
In Figure 4, a simplified geometric scheme of a double-walled cardboard is shown, which does not take into account the thickness of the layers. Since the bending stiffness, apart from the fluting geometry, also significantly depends on the thickness of the corrugated board layers, the actual location of the central axis of each layer was used in the numerical model. Unfortunately, this approach results in some gaps between the layers represented by the central axes in the model. In Figure 5, a cross-section of the five-layer corrugated board with paper layer thicknesses is presented.
Taking into account the thickness of the layers allowed to determine the actual axial distance between the liners:
where is the distance between the central axes of the liners. Based on the above equations and Figure 5, the total height of the five-layer cardboard can be represented as:
and the total height of the three-layer cardboard as:
Corrugated board is an orthotropic material, however, considering bending stiffness only in the machine direction, the paper layers can be modeled as an isotropic material. Therefore, just Young’s modulus, Poisson’s ratio and layer thickness are used in 2D modeling. In Table 2, thickness and material parameters for each paperboard layer of various cardboard analyzed here are presented.
Boundary Conditions in the Four-Point Bending Test – Numerical Study
The main purpose of the work is the numerical analysis of the influence of the arrangement of the sample on the supports on the determined bending stiffness for many types of asymmetric corrugated board. The 4-point bending test of the corrugated board was simulated in commercial finite element method (FEM) software. According to the scheme shown in Fig. 1, the cardboard sample was placed on the bottom supports and loaded with the upper supports. The distance between the upper support and the nearest bottom support was 50 mm, and the distance between the bottom supports was 100 mm. The total length of the sample was 250 mm and the width of the sample was equal to 50 mm.
Because in this study the bending stiffness was considered only in the machine direction, the simplified 2D modeling was used i.e. cross-section of the corrugated board (each paperboard layer) were modeled using two node Timoshenko beam elements. The beam elements were assigned a rectangular cross-section with a width of equal to 50 mm and a height of in accordance with the values given in Table 2. It was necessary to shift the individual cardboard layers by appropriate distances resulting from the assigned layer thicknesses. Such a treatment was necessary to achieve the appropriate moment of inertia of the cardboard. In Figure 6, the numerical model of the cardboard without and with the visualization of the assigned layer thickness is shown.
Consistent behavior of the flat and corrugated layers was obtained by using a “tie” technique, which ensures the structure integrity (continuity of displacement) between the crests of the waves and the flat layers (see Figure 7). The cardboard layers were modeled using the classic linear elastic isotropy model. The material of the cardboard layers was modeled as isotropic and linearly elastic. In Table 2, the respective material parameters are presented.
As it was written before, the 4-point bending test was modeled according to the scheme shown in Figure 1. Vertical displacements were blocked on the lower supports, and vertical displacements were allowed in the places of the upper supports. To ensure the correct bending behavior of the cardboard, the horizontal displacement of the liners was blocked in the middle of the sample length.
Simulations of the 4-point bending test were performed for four types of five-layer cardboard (EB, EC, BC and EE flutes) and two types of three-layer cardboard (B and C flutes). The samples were loaded in two configurations: the “stronger” part of the cross-section upwards and downwards. In order to assess the influence of the location of the sample on the supports, the shift of the wave crest relative to the support was changed. In double-walled corrugated boards, both the bottom flute relative to the bottom support and the upper flute relative to the upper support were shifted independently. The shift value ranged from 0% to 90% in increments of 10%. In this way, a full spectrum of bending stiffness was obtained depending on the location of the wave crest relative to the support. In a single-walled cardboard there is only one flute, so it was shifted first relative to the bottom and then relative to the upper support.
The setup of the 4-point bending test is obviously symmetrical with respect to the vertical axis, however, the cardboard sample in this test is no longer symmetrical. This is due to the fact that the location of the crest of the wave in relation to the left support will be in general different than in relation to the right support. Therefore the wave shift was determined in relation to the bottom and upper supports on the left side of the model. The shift of the wave was recorded as a percentage and determined by a percentage shift of the wave’s crest relative to the support. For example, a wave shift of 0% means that the wave crest is at the support, and a 25% shift means that the wave crest is shifted 25% of the wavelength to the right. In Figure 8, several variants of shifts for five-layer cardboard are shown.
Based on all the described variants, each selected test variant can be marked with the symbol X-Y-zz for three-layer cardboard and XX-yy-zz for five-layer cardboard. For single-walled corrugated board, X means the flute type as described at the beginning of the METHODS AND MATERIALS section (B, Brev, C or Crev). Symbol Y indicates the support on which the shift occurs. In this case, two options are possible: B – bottom support and U – upper support. The number zz denotes the value of the flute crest shift relative to the Y support. For double-walled cardboard, XX denotes the flute type (EB, EBrev, EC, ECrev, BC, BCrev, EE or EErev). The numbers yy and zz mean the shift values of the bottom and upper waves relative to the bottom and upper supports, respectively. The numbers yy and zz for five-layer cardboard and zz for three-layer cardboard can be 00, 10, 20, 30, 40, 50, 60, 70, 80 or 90. Using a symbolic notation system, the variants shown in Figure 8 can be represented as (a) EB-00-00 and (b) EB-30-60.
In all analyses, the two-node planar linear beam elements (B21 elements) were used [abaqus]. All models were generated in FEM commercial software. From the analyses performed, the reactions in all supports and the vertical displacement of the sample center were obtained, which are necessary to calculate the bending stiffness in accordance with Eq. (1). An approximate global finite element length of 0.2 mm was assumed. Various types of cardboard were analyzed, therefore the number of elements for each model was different. For example, in the case of EB-00-00, the numerical model consists of 6,569 nodes, 6,564 elements and 19,707 degrees of freedom.
Results and Discussion
As already emphasized in the previous section, the commercial Simulia ABAQUS FEA computing package was used for all analyses. Figure 9 shows both left supports (lower and upper) in two sample arrangements: (a) BC with lower and upper flutings shifted by 50%; (b) CB with the same shift of both wavy layers. In both Figure 9a,b, the displacements shown are scaled to emphasize the local deformations at both supports. The colors in the figures indicate the stress concentration, here the reduced Huber-Mises-Hencky stresses are shown. It is clear from these graphs that the influence of the boundary conditions of the corrugated board samples in the 4-point bending test on the global behavior of the sample is evident.
The purpose of this work, however, was not to indicate that the influence of supports on bending stiffness is evident, but rather to try to quantify it. The same principles of loading and flutes shifting as described in the previous section were maintained in all numerical analyses. In all calculated examples, the applied displacement on the upper support was only 0.2 mm to avoid the need to use non-linear geometrical analysis.
Since it seemed obvious that the location of the wave tops of the corrugated layers relative to the supports would have the greatest impact on the bending stiffness, this issue was given the most attention. Because the modeling of the shifts of the corrugated layers was already described in detail in the previous section, only the problem of averaging the results on supports will be explained here.
In all analyzed cases, the lower supports are stationary and that the crest of the lower wave can fall exactly on the support or at a certain distance from it. However, the position of the wave relative to the support can only be determined relative to one of the supports - in this case the left one. It means that the position of the wave on the second support - the right one, is rather accidental. The same also applies to the both upper supports, where the position of the upper fluting was controlled only on the left support - so on the right support the crest of the wave appeared in a random location relative to the support (i.e. the position of the wave crest resulted from the wavelength and the distance between the supports) Therefore, in order to correctly and fairly indicate the influence of the position of the fluting relative to the supports on the bending stiffness of the cardboard samples, the reactions at both lower supports were averaged. These averaged reactions are then used to calculate the bending stiffness from Eq. 1. The same could of course also be done on the upper supports, but due to the balance of forces in the model, both results would be identical. Thus, the procedure for quantifying the influence of the position of the fluting vertices relative to the supports in the 4-point bending test is as follows: (i) in each numerical analysis, three matrices are generated: (reactions in the lower left support), (reactions in the lower right support) and (vertical displacements in the center of the sample span), where the index i controls the position of the wave relative to the lower left support and the index j controls the position of the fluting relative to the upper left support; (ii) average reaction is computed from and ; (iii) bending stiffness is computed using Eq. (1); (iv) a statistical analysis of differences in bending stiffness is performed for each fluting position relative to the bottom left support.
Table 3 presents all computed bending stiffnesses for all samples in both arrangements. Figure 10, Figure 11, Figure 12, Figure 13, Figure 14 and Figure 15 present the statistical distributions of the differences between the calculated bending stiffness in two different positions of the sample on the supports for six cardboards: (a) B vs Brev (see Figure 10); (b) BE vs EB (see Figure 11); (c) C vs Crev (see Figure 12); (d) CB vs BC (see Figure 13); (e) CE vs EC (see Figure 14) and (f) EE vs EErev (see Figure 15). Blue boxes on each figure indicate 25th to 75th percentiles of the data, while the central red line indicates the median. The whiskers extend to the most extreme data points not considered outliers, and the outliers are plotted individually using the ‘+’ marker symbol.
Figure 10 shows very clearly that the bending stiffness (BS) measured in the 4-point bending test varies depending on how the sample is placed in the machine, i.e. stronger side up or weaker side up. The mean values of BS differences depending on the position of the fluting relative to the bottom support range from 0.65 to 1.40 percent. The minimum difference in this case was 0.58% while the maximum 1.61%. The average difference in bending stiffness of all cases was 1.00%.
In the case of BE and EB boards, this difference is much more pronounced (see Figure 11) than in the previous case (see Figure 10), where the only source of asymmetry was the difference in stiffness of the outer liners. In the case of BE and EB board, the asymmetry results from the difference in the geometry of the corrugated layers on both sides of the sample. The minimum difference was 2.36%, the maximum was 7.87%, and the average difference of all cases was 4.251.59%.
Figure 12 shows the discrepancy between bending stiffness (BS) of two different corrugated board (i.e. different in the sense of placing the sample in the slot of the 4-point bending test with the stronger side up or down). In the case of C and Crev board, the average difference in bending stiffness of all cases was 3.760.65%. Minimum BS difference in this case was 2.89% while the maximum value was 4.69%.
Figure 13 shows that the higher the flutes of the corrugated layer are used in the corrugated board, the greater the differences in bending stiffness. In fact, in one case (for the fluting shift relative to the lower left support by 60%), the minimum BS difference was 0%, but the maximum difference in another case was as much as 13.13%. There is also a clear and characteristic wavy trend of the BS difference depending on the position of the fluting relative to the bottom left support. In the case of CB and BC board, the average difference in bending stiffness of all cases was nearly 6.093.06%.
The case of CE and EC board (shown in Figure 14) is special because in this case the difference between the lower flute and the higher flute is the largest, which also results in the largest discrepancy between the bending stiffnesses of CE and EC board. In this case, the minimum BS difference was about 10.06% and the maximum 17.51%. The average discrepancy of all possible configurations of the positions of both flutings in relation to the bottom and top supports was slightly more than 14.022.71%.
The difference in bending stiffness in the case of EE and EErev board is the least clear (see Figure 15), as it ranges from 0.32% to 0.44%. Such small percentage differences in bending stiffness result from small wavelength of fluting E. The paper of the liners stretched between the densely arranged tops of the waves does not undergo such large local deformations as in the case of higher waves, which of course has a positive effect on the stability of the measurable stiffness in the 4-point bending test.
All the above observations lead to the unequivocal conclusion that the stiffness of the corrugated board in the 4-point bending test depends on how the sample is placed in the machine. This is very clear especially when the cardboard is asymmetrical due to the use of two different waves in 5-layer cardboard or liners with different stiffness in the case of 3-layer cardboard. BS is higher when the stronger side of the corrugated board is compressed, lower when the weaker side of the corrugated board is compressed. These observations are in line with those found in the literature. For example, in [Czechowski et al. 2022] these differences were experimentally demonstrated for many different cases of cardboard. Although the authors did not indicate the reasons for these differences during the conducted research, the experimental data from the 4-point bending test are unambiguously consistent with those indicated in this work. In another paper [Garbowski & Knitter 2022], the authors explain the difference between the bending stiffness of asymmetric samples of various cardboards with imperfection that activates the buckling of compressed flat layers of corrugated boards during bending. The authors found some correlation between the proposed models and the available experimental data, however, the predictions of the model in several cases were not very precise. Perhaps if the effects of imperfections and boundary conditions were combined, the predictive models would be more accurate.
Conclusions
- There is a very clear difference between the bending stiffness of the unsymmetrical corrugated board samples which differ only in the way they are arranged, i.e. those in which weaker or stronger layers are compressed during the 4-point bending test.
- The difference in bending stiffness is greater in the case of cardboards with more pronounced asymmetry, i.e., when two very different waves of corrugated layers are used.
- The BS difference results, among others, from the position of the wave crests of the corrugated layers relative to the supports, the further the crest is from the support, the more pronounced the local bending effects of the flat layers, which obviously leads to greater differences in bending stiffness.
- In this type of 4-point bending test, there is no way to avoid the formation of local disturbances that affect the estimated bending stiffness, unless a different support design is used. Therefore, it is important to understand the origin of BS differences when examining corrugated board, especially when it is characterized by very high asymmetry.
References
- Abaqus Unified FEA Software. Available online: https://www.3ds.com/products-services/simulia/products/abaqus (accessed on 15 July 2023).
- Åslund, P. E.; Hägglund, R.; Carlsson, L. A.; Isaksson, P. I. Modeling of global and local buckling of corrugated board panels loaded in edge-to-edge compression. Journal of Sandwich Structures & Materials 2014, 16, 272–292. [Google Scholar] [CrossRef]
- Bai, J.; Wang, J.; Pan, L.; Lu, L.; Lu, G. Quasi-static axial crushing of single wall corrugated paperboard. Compos. Struct. 2019, 226, 111237. [Google Scholar] [CrossRef]
- Błaszczuk, J.; Pozorski, Z. The analysis of the influence of core compression effect on the determination of the shear modulus of sandwich panel core. Scientific Research of the Institute of Mathematics and Computer 2012, 11, 5–13. [Google Scholar] [CrossRef]
- Buannic, N.; Cartraud, P.; Quesnel, T. Homogenization of corrugated core sandwich panels. Comp. Struct. 2003, 59, 299–312. [Google Scholar] [CrossRef]
- Chanlert, P.; Jintara, A.; Manoma, W. Comparison of the sound absorption properties of acoustic absorbers made from used copy paper and corrugated board. BioResources 2022, 17, 55612–55621. [Google Scholar] [CrossRef]
- Czechowski, L.; Kmita-Fudalej, G.; Szewczyk, W.; Gralewski, J.; Bieńkowska, M. Numerical and experimental study of five-layer non-symmetrical paperboard panel stiffness. Materials 2021, 14, 7453. [Google Scholar] [CrossRef]
- EN ISO 5628:1990. Paper and board — Determination of bending stiffness by static methods — General principles.
- Garbowski, T.; Gajewski, T.; Grabski, J. K. The role of buckling in the estimation of compressive strength of corrugated cardboard boxes. Materials 2020, 13, 4578. [Google Scholar] [CrossRef]
- Garbowski, T.; Gajewski, T. Determination of Transverse Shear Stiffness of Sandwich Panels with a Corrugated Core by Numerical Homogenization. Materials 2021, 14, 1976. [Google Scholar] [CrossRef]
- Garbowski, T.; Knitter-Piątkowska, A. Analytical determination of the bending stiffness of a five-layer corrugated cardboard with imperfections. Materials 2022, 15, 663. [Google Scholar] [CrossRef]
- Jamsari, M. A.; Kueh, C.; Gray-Stuart, E. M.; Dahm, K.; Bronlund, J. E. Experimental and numerical performance of corrugated fibreboard at different orientations under four-point bending test. Packag. Technol. Sci. 2019, 32, 555–565. [Google Scholar] [CrossRef]
- Liu, M., Yang, C., and Wang, H. J. (2010). “Effects of the temperature and relative humidity on the compression strength of corrugated cardboard boxes,” in: Proceedings of the 17th IAPRI World Conference, pp. 136-139.
- Lorbach, C.; Fischer, W. J.; Gregorova, A.; Hirn, U.; Bauer, W. Pulp fiber bending stiffness in wet and dry state measured from moment of inertia and modulus of elasticity. BioResources 2014, 9, 5511–5528. [Google Scholar] [CrossRef]
- Marin, G.; Srinivasa, P.; Nygårds, M.; Östlund, S. Experimental and finite element simulated box compression tests on paperboard packages at different moisture levels. Packag. Technol. Sci. 2021, 34. [Google Scholar] [CrossRef]
- Mertoglu-Elmas, G. The effect of colorants on the content of heavy metals in recycled corrugated board papers. BioResources 2017, 12, 2690–2698. [Google Scholar] [CrossRef]
- Norstrand, T. On buckling loads for edge-loaded orthotropic plates including transverse shear. Comp. Struct. 2004, 65, 1–6. [Google Scholar] [CrossRef]
- Park, J.; Chang, S.; Jung, H. M. Numerical prediction of equivalent mechanical properties of corrugated paperboard by 3D finite element analysis. Appl. Sci. 2020, 10, 7973. [Google Scholar] [CrossRef]
- Pozorska, J., and Pozorski Z. (2018), “The comparison of numerical models of a sandwich panel in the context of the core deformations at the supports, in: AIP Conference Proceedings, AIP Publishing, 1922, 050007, pp. 050007-1–050007-7. [CrossRef]
- Popil, R. E. Overview of recent studies at IPST on corrugated board edge compression strength: testing methods and effects of interflute buckling. BioResorces 2012, 7, 2553–2581. [Google Scholar] [CrossRef]
- Putz, H.-J.; Schabel, S. The Myth of Limited Fibre Life Cycles. Wochenblatt für Papierfabrikation 2018, 6, 350–356. [Google Scholar]
- Sapienza, V.; Rodonò, G.; Monteleone, A.; Calvagna, S. ICARO - Innovative Cardboard ARchitecture Object: Sustainable Building Technology for Multipurpose Micro-Architecture. Sustainability 2022, 14, 16099. [Google Scholar] [CrossRef]
- Schrampfer, K. E.; Whitsitt, W. J.; Baum, G. A. Combined Board Edge Crush (ECT) Technology; Institute of Paper Chemistry: Appleton, WI, USA, 1987. [Google Scholar]
- Sohrabpour, V., and Hellström, D. (2011). “Models and software for corrugated board and box design“, in: Proceedings of the 18th International Conference on Engineering Design, ICED 11, Copenhagen, Denmark, 15–18 August.
- Urbanik, T. J.; Saliklis, E. P. Finite element corroboration of buckling phenomena observed in corrugated boxes. Wood Fiber Sci. 2003, 35, 322–333. [Google Scholar]
- Urbanik, T. J.; Frank, B. Box compression analysis of world-wide data spanning 46 years. Wood Fiber Sci. 2006, 38, 399–416. [Google Scholar]
- Wang, C.-C.; Chen, C.-H.; Jiang, B.C. Shock Absorption Characteristics and Optimal Design of Corrugated Fiberboard Using Drop Testing. Appl. Sci. 2021, 11, 5815. [Google Scholar] [CrossRef]
- Yoshihara, H.; Yoshinobu, M.; Maruta, M. Bending stiffness and moment capacity of cardboard obtained from three-point and elastic bending tests. Nordic Pulp & Paper Research Journal 2023, 38, 73–85. [Google Scholar] [CrossRef]
Figure 1.
Static scheme of the 4-point bending test.
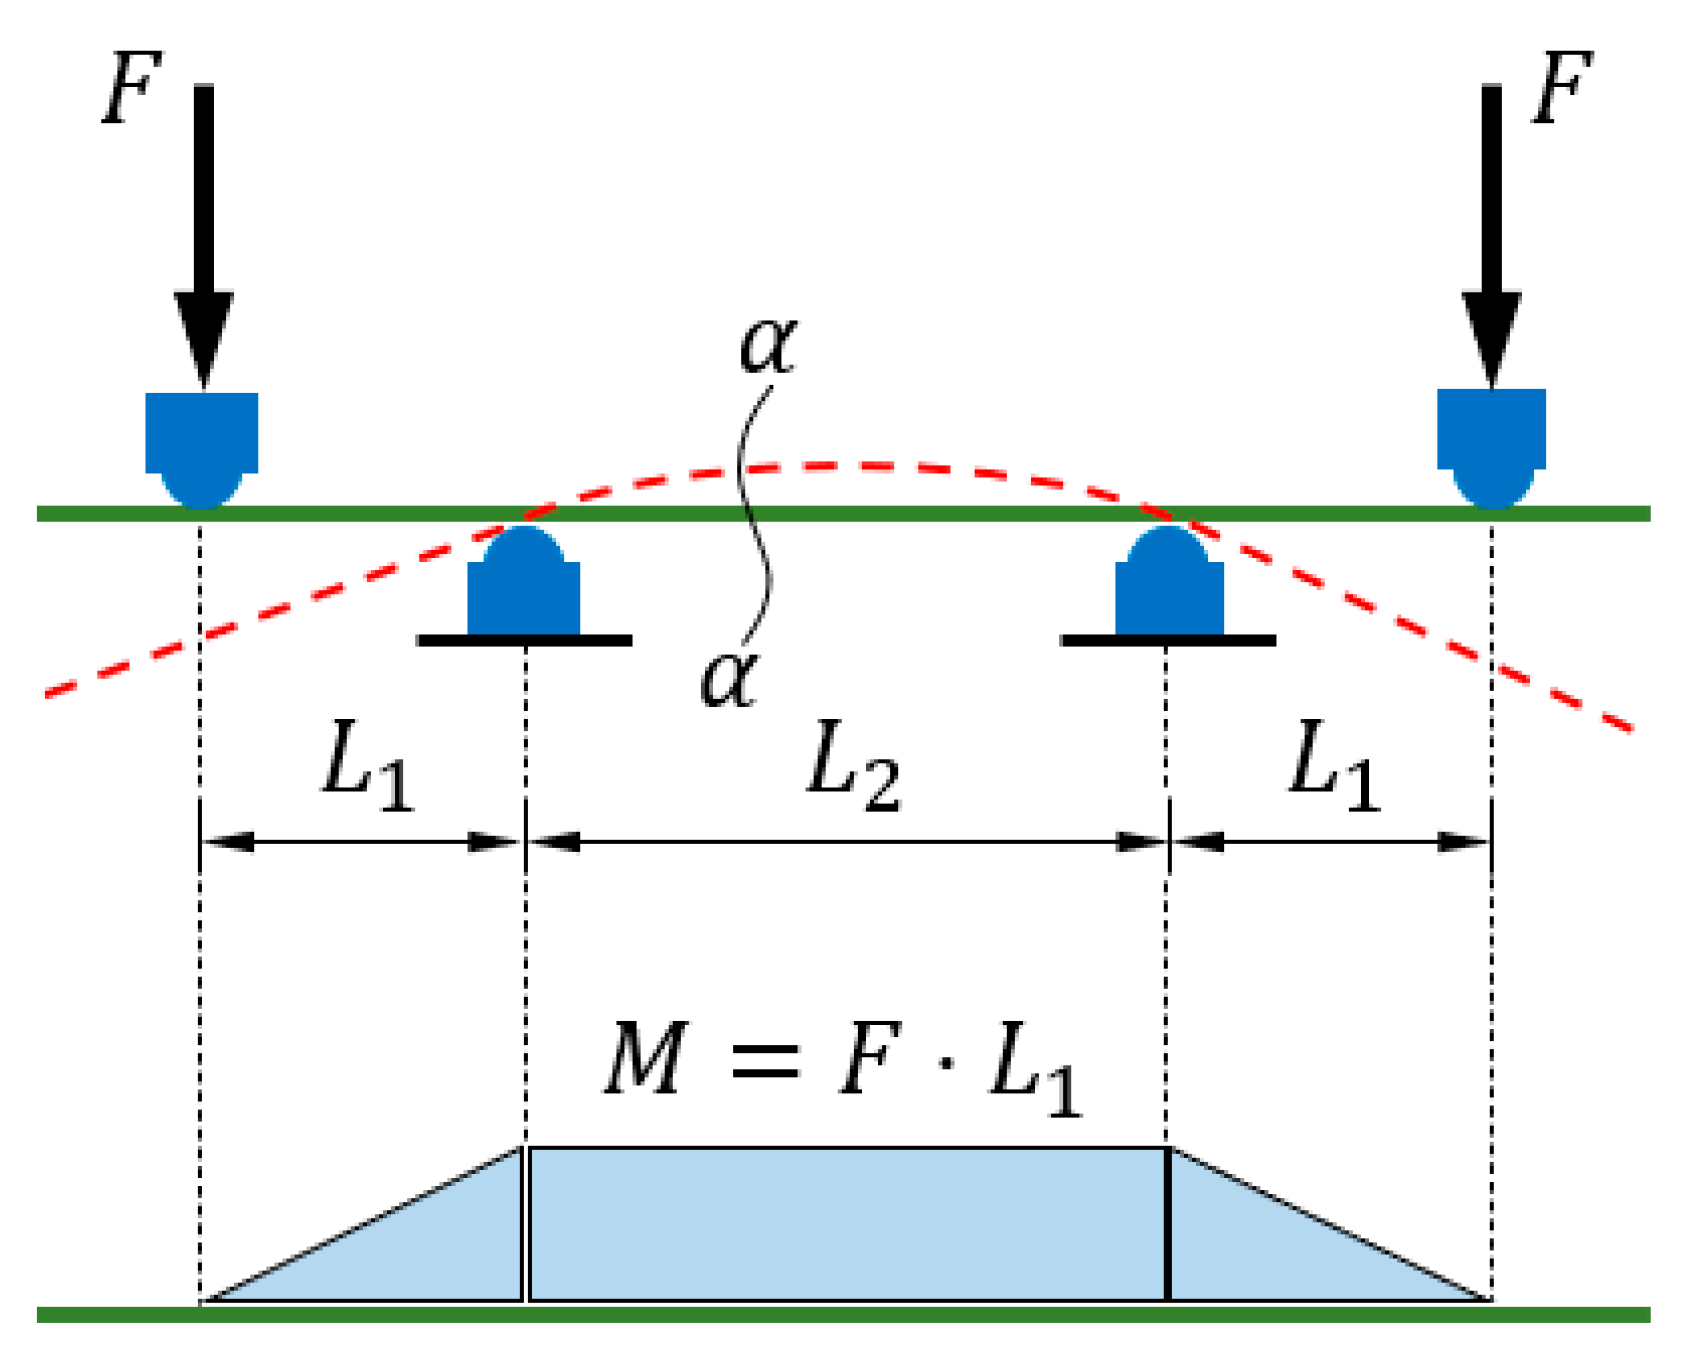
Figure 2.
Two possible positions of the cardboard sample in the 4-point bending test: (a) B flute downwards (EB flute) and (b) E flute downwards (BE flute).
Figure 2.
Two possible positions of the cardboard sample in the 4-point bending test: (a) B flute downwards (EB flute) and (b) E flute downwards (BE flute).
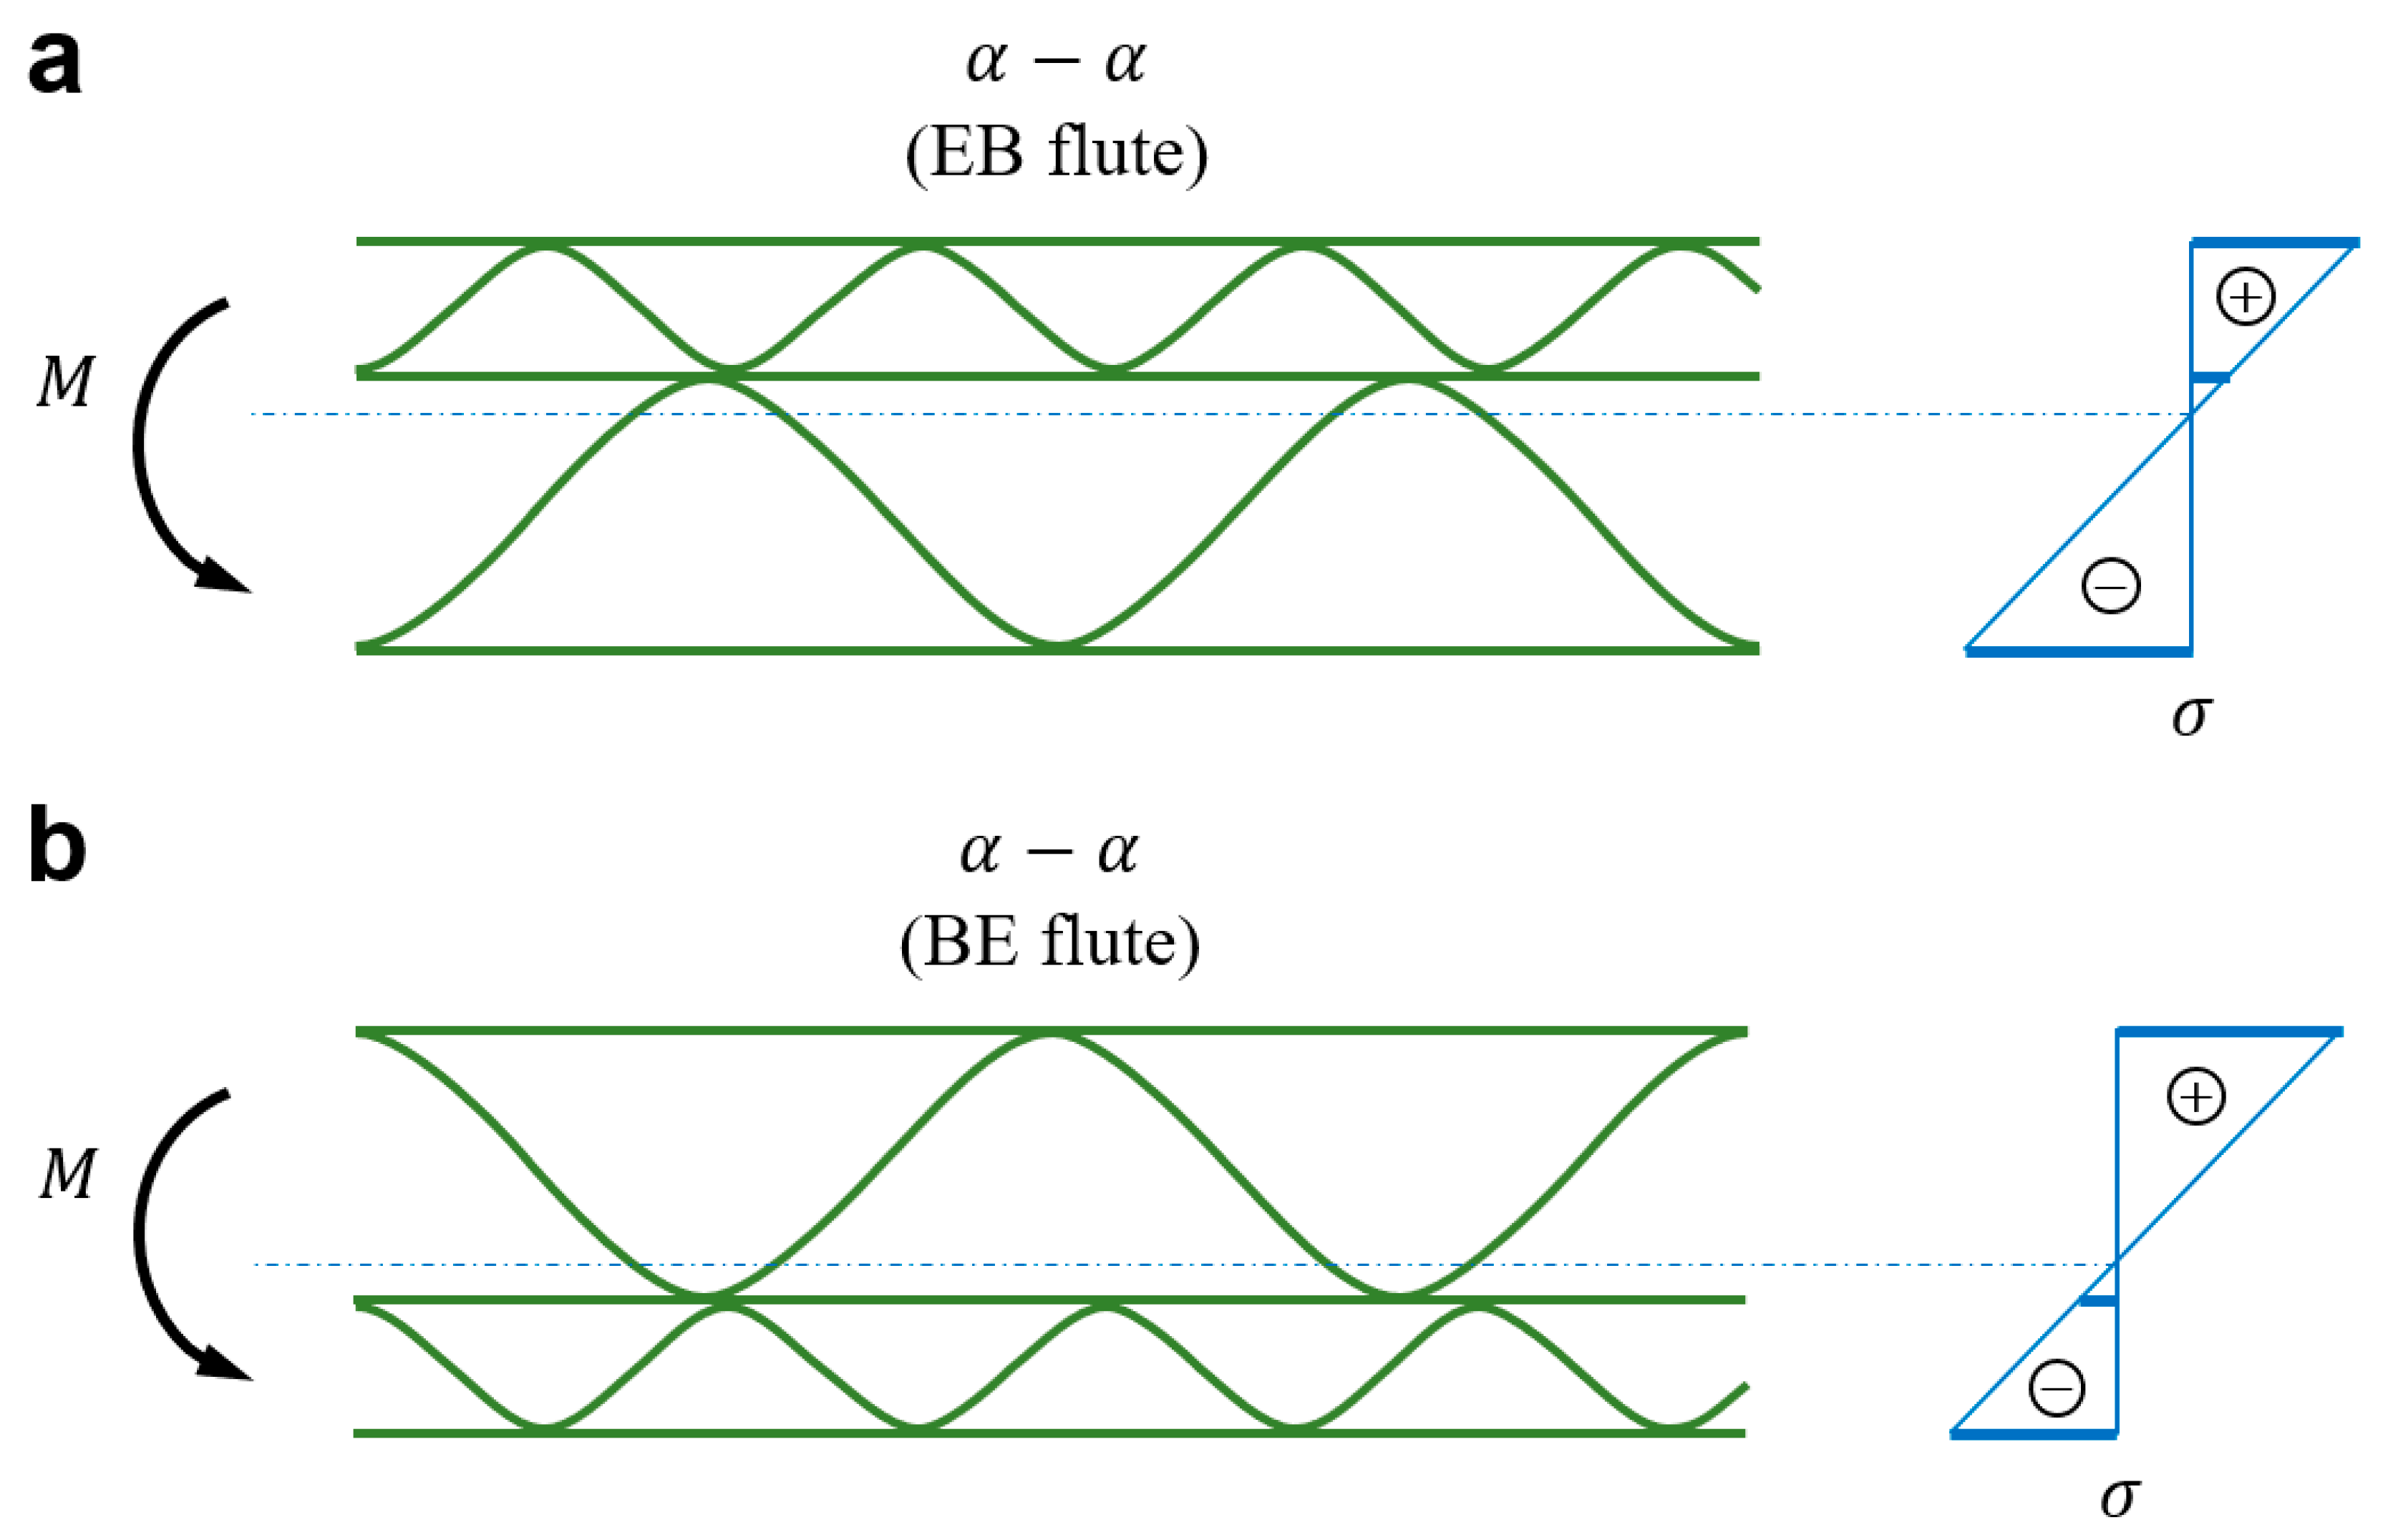
Figure 3.
Possible positions of single-walled cardboard and double-walled cardboard with two the same waves: (a) B flute – tension of stronger liner, (b) EE flute – tension of stronger liner, (c) Brev flute – compression of stronger liner and (d) EErev flute – compression of stronger liner.
Figure 3.
Possible positions of single-walled cardboard and double-walled cardboard with two the same waves: (a) B flute – tension of stronger liner, (b) EE flute – tension of stronger liner, (c) Brev flute – compression of stronger liner and (d) EErev flute – compression of stronger liner.
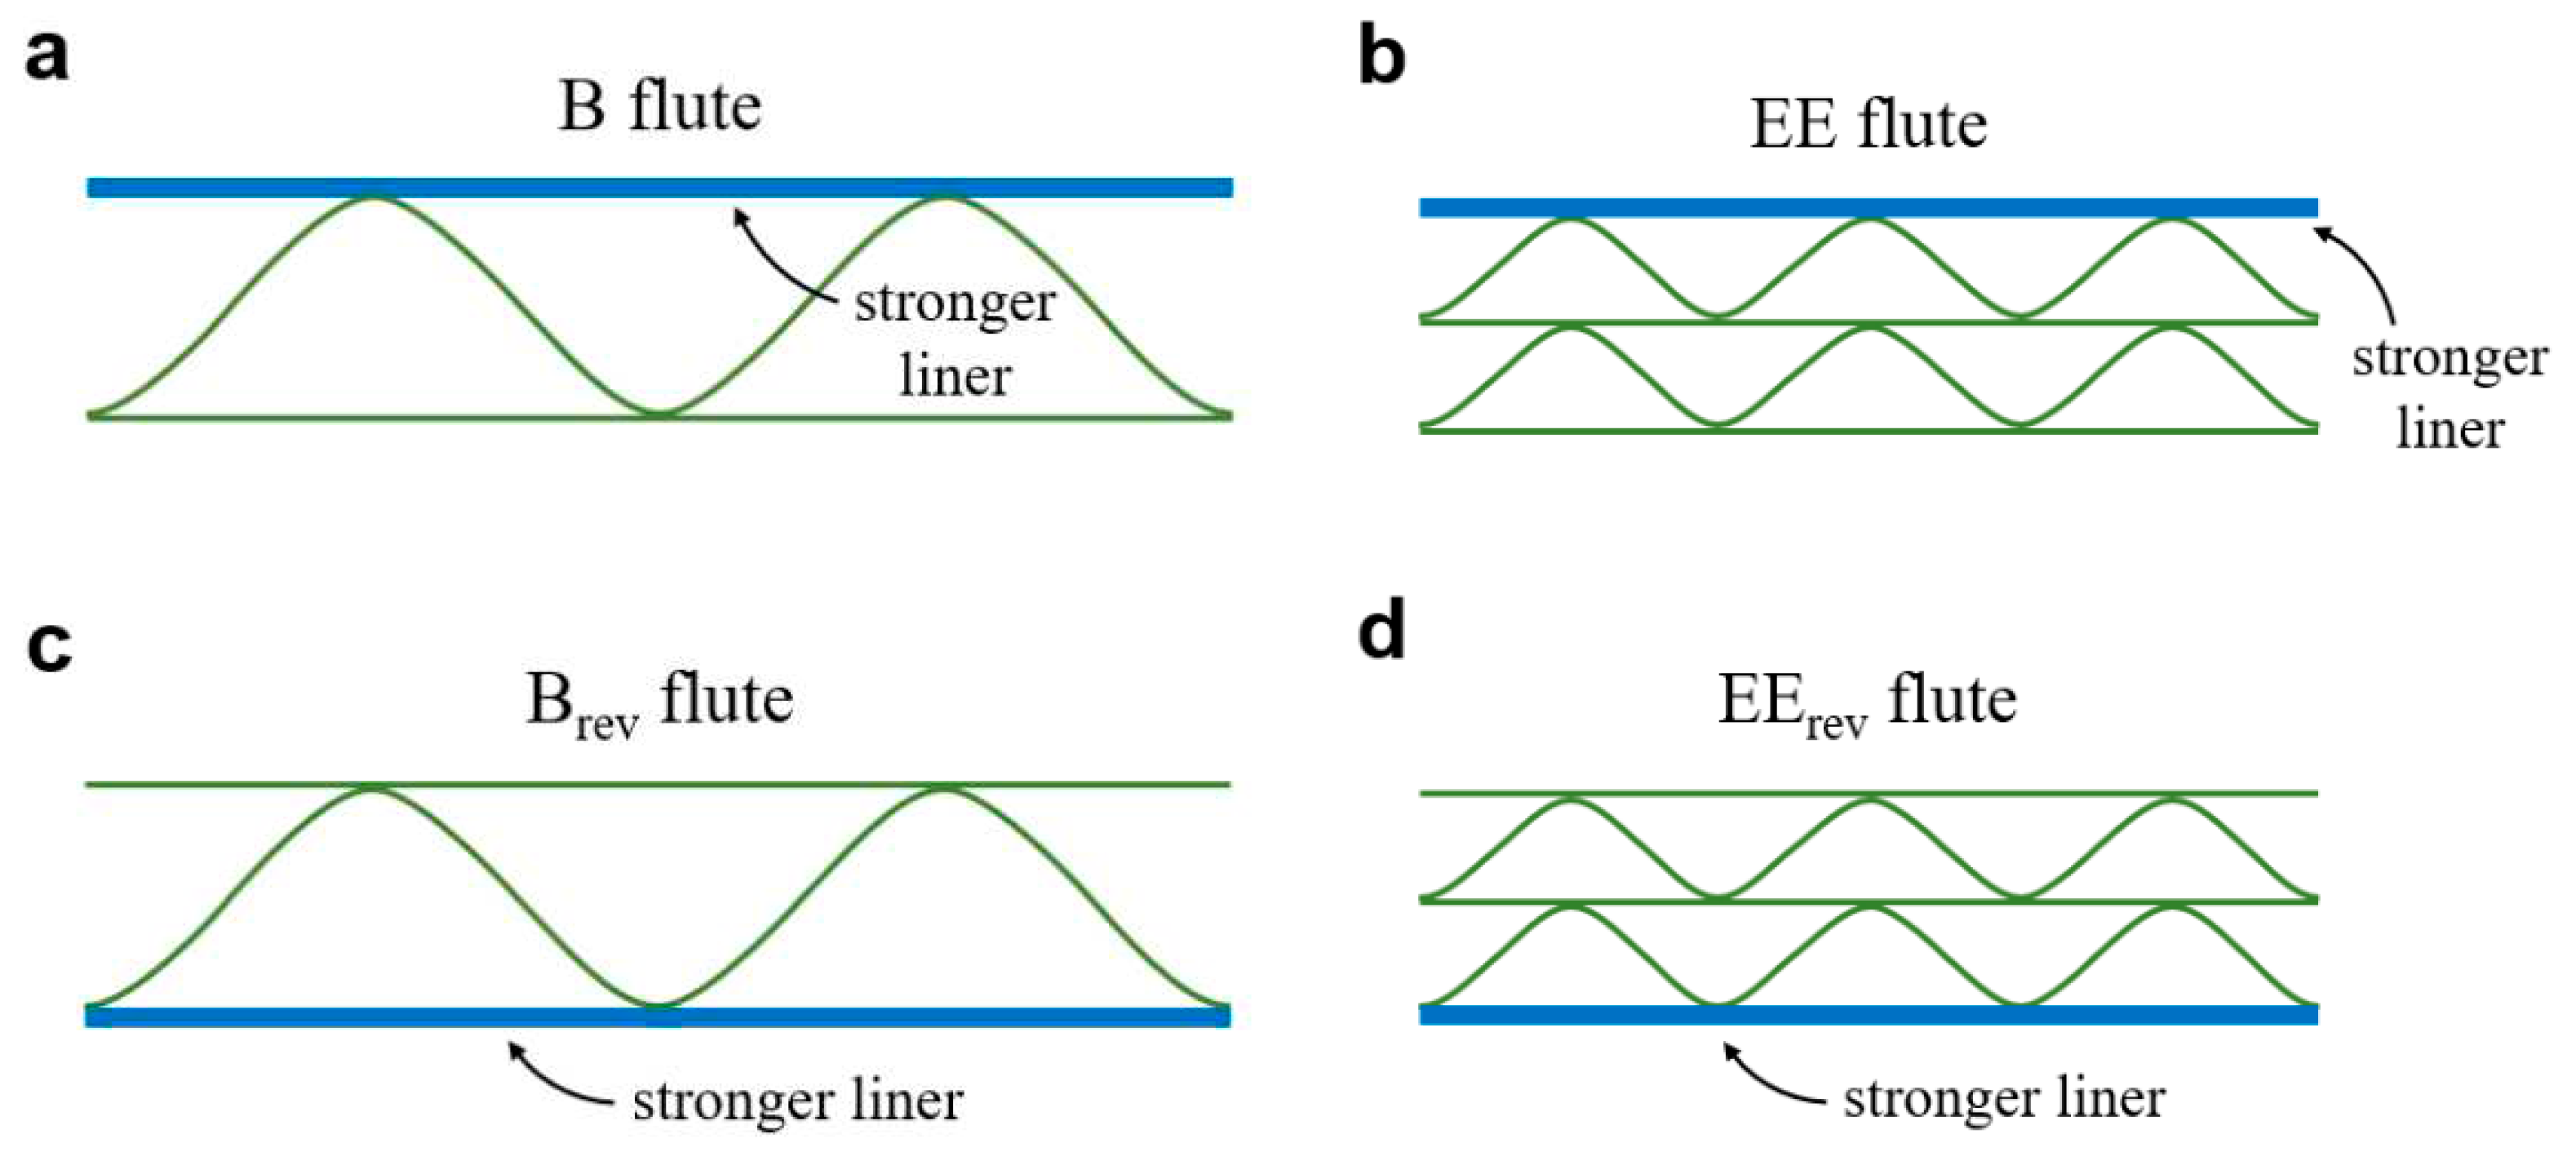
Figure 4.
Geometry of the double-walled corrugated cardboard flutes.
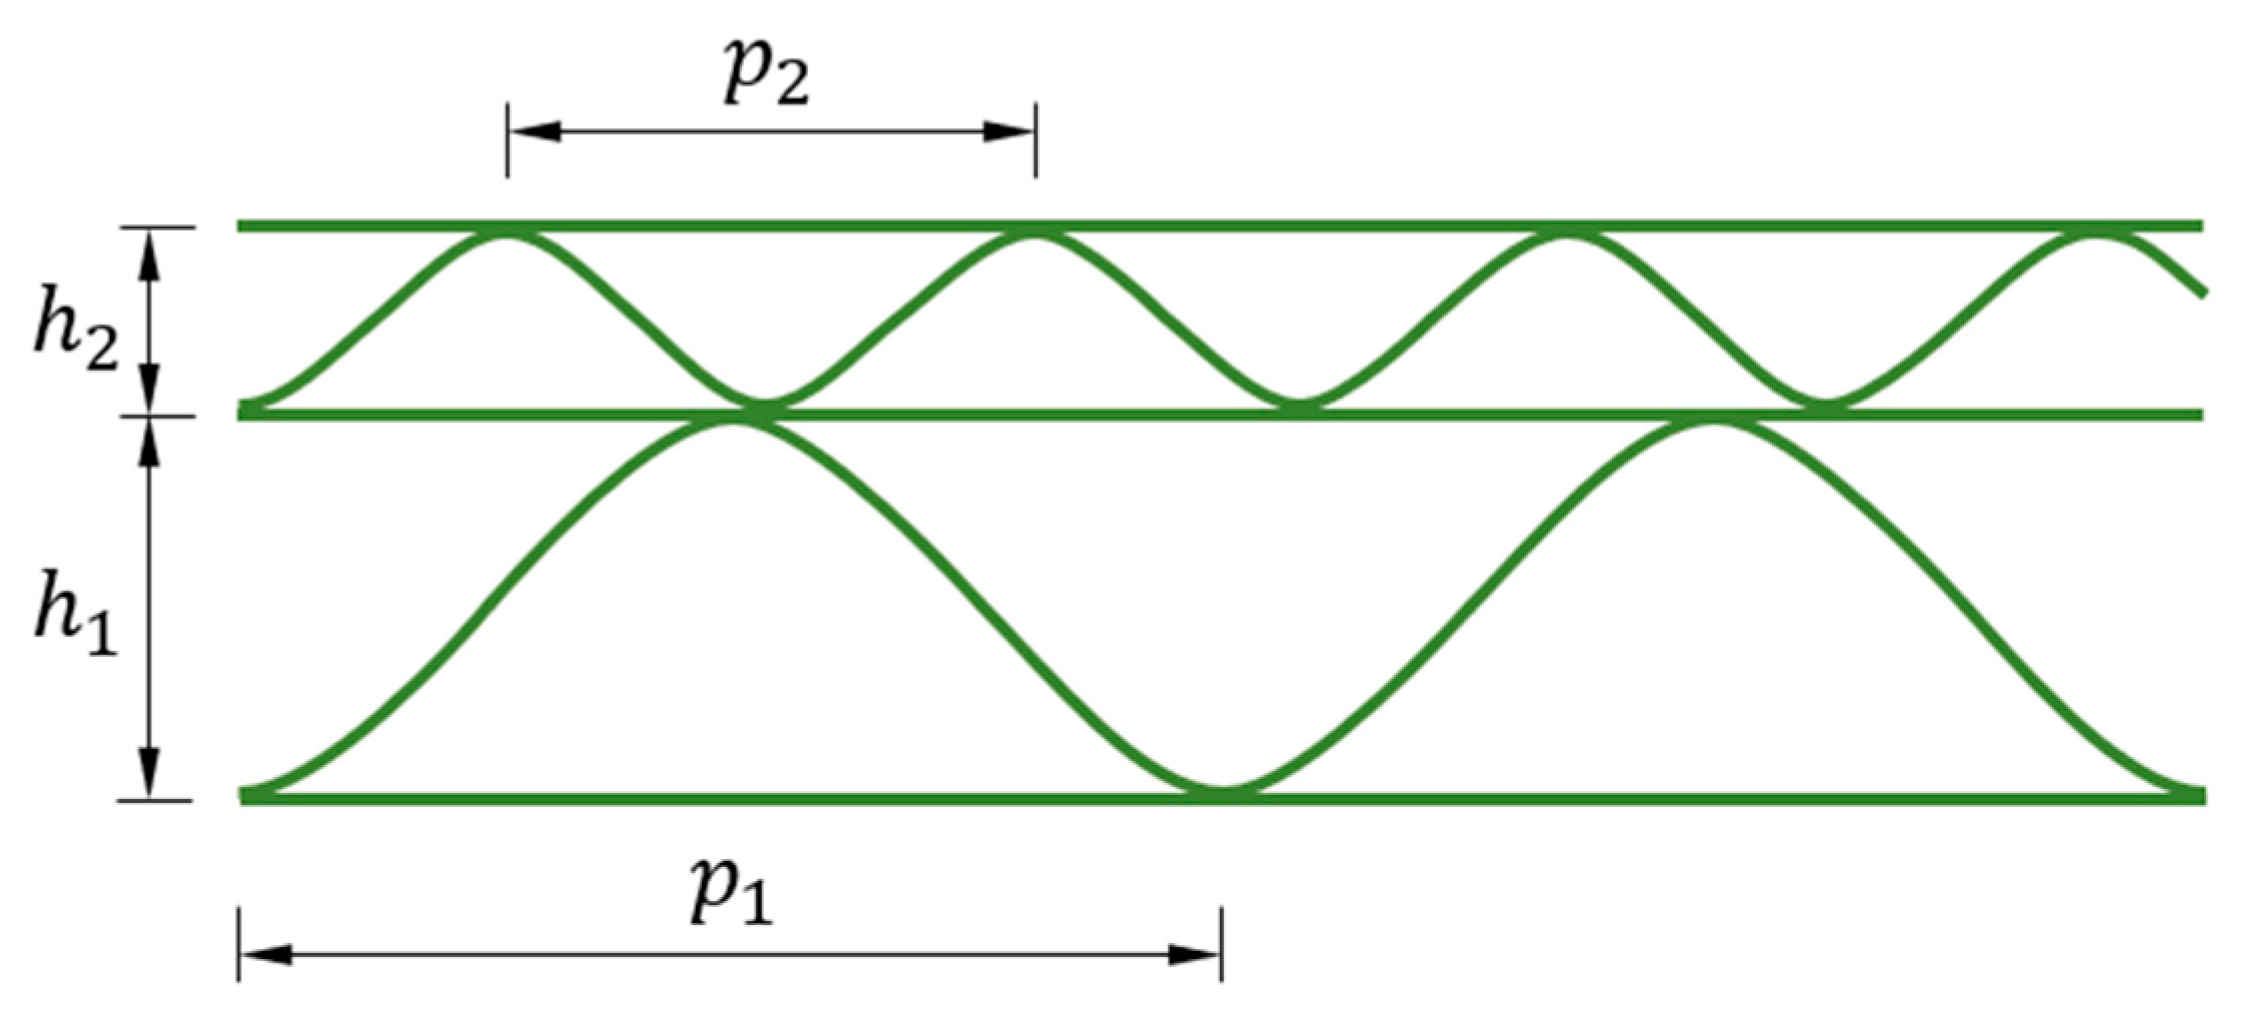
Figure 5.
The geometry of the numerical model.
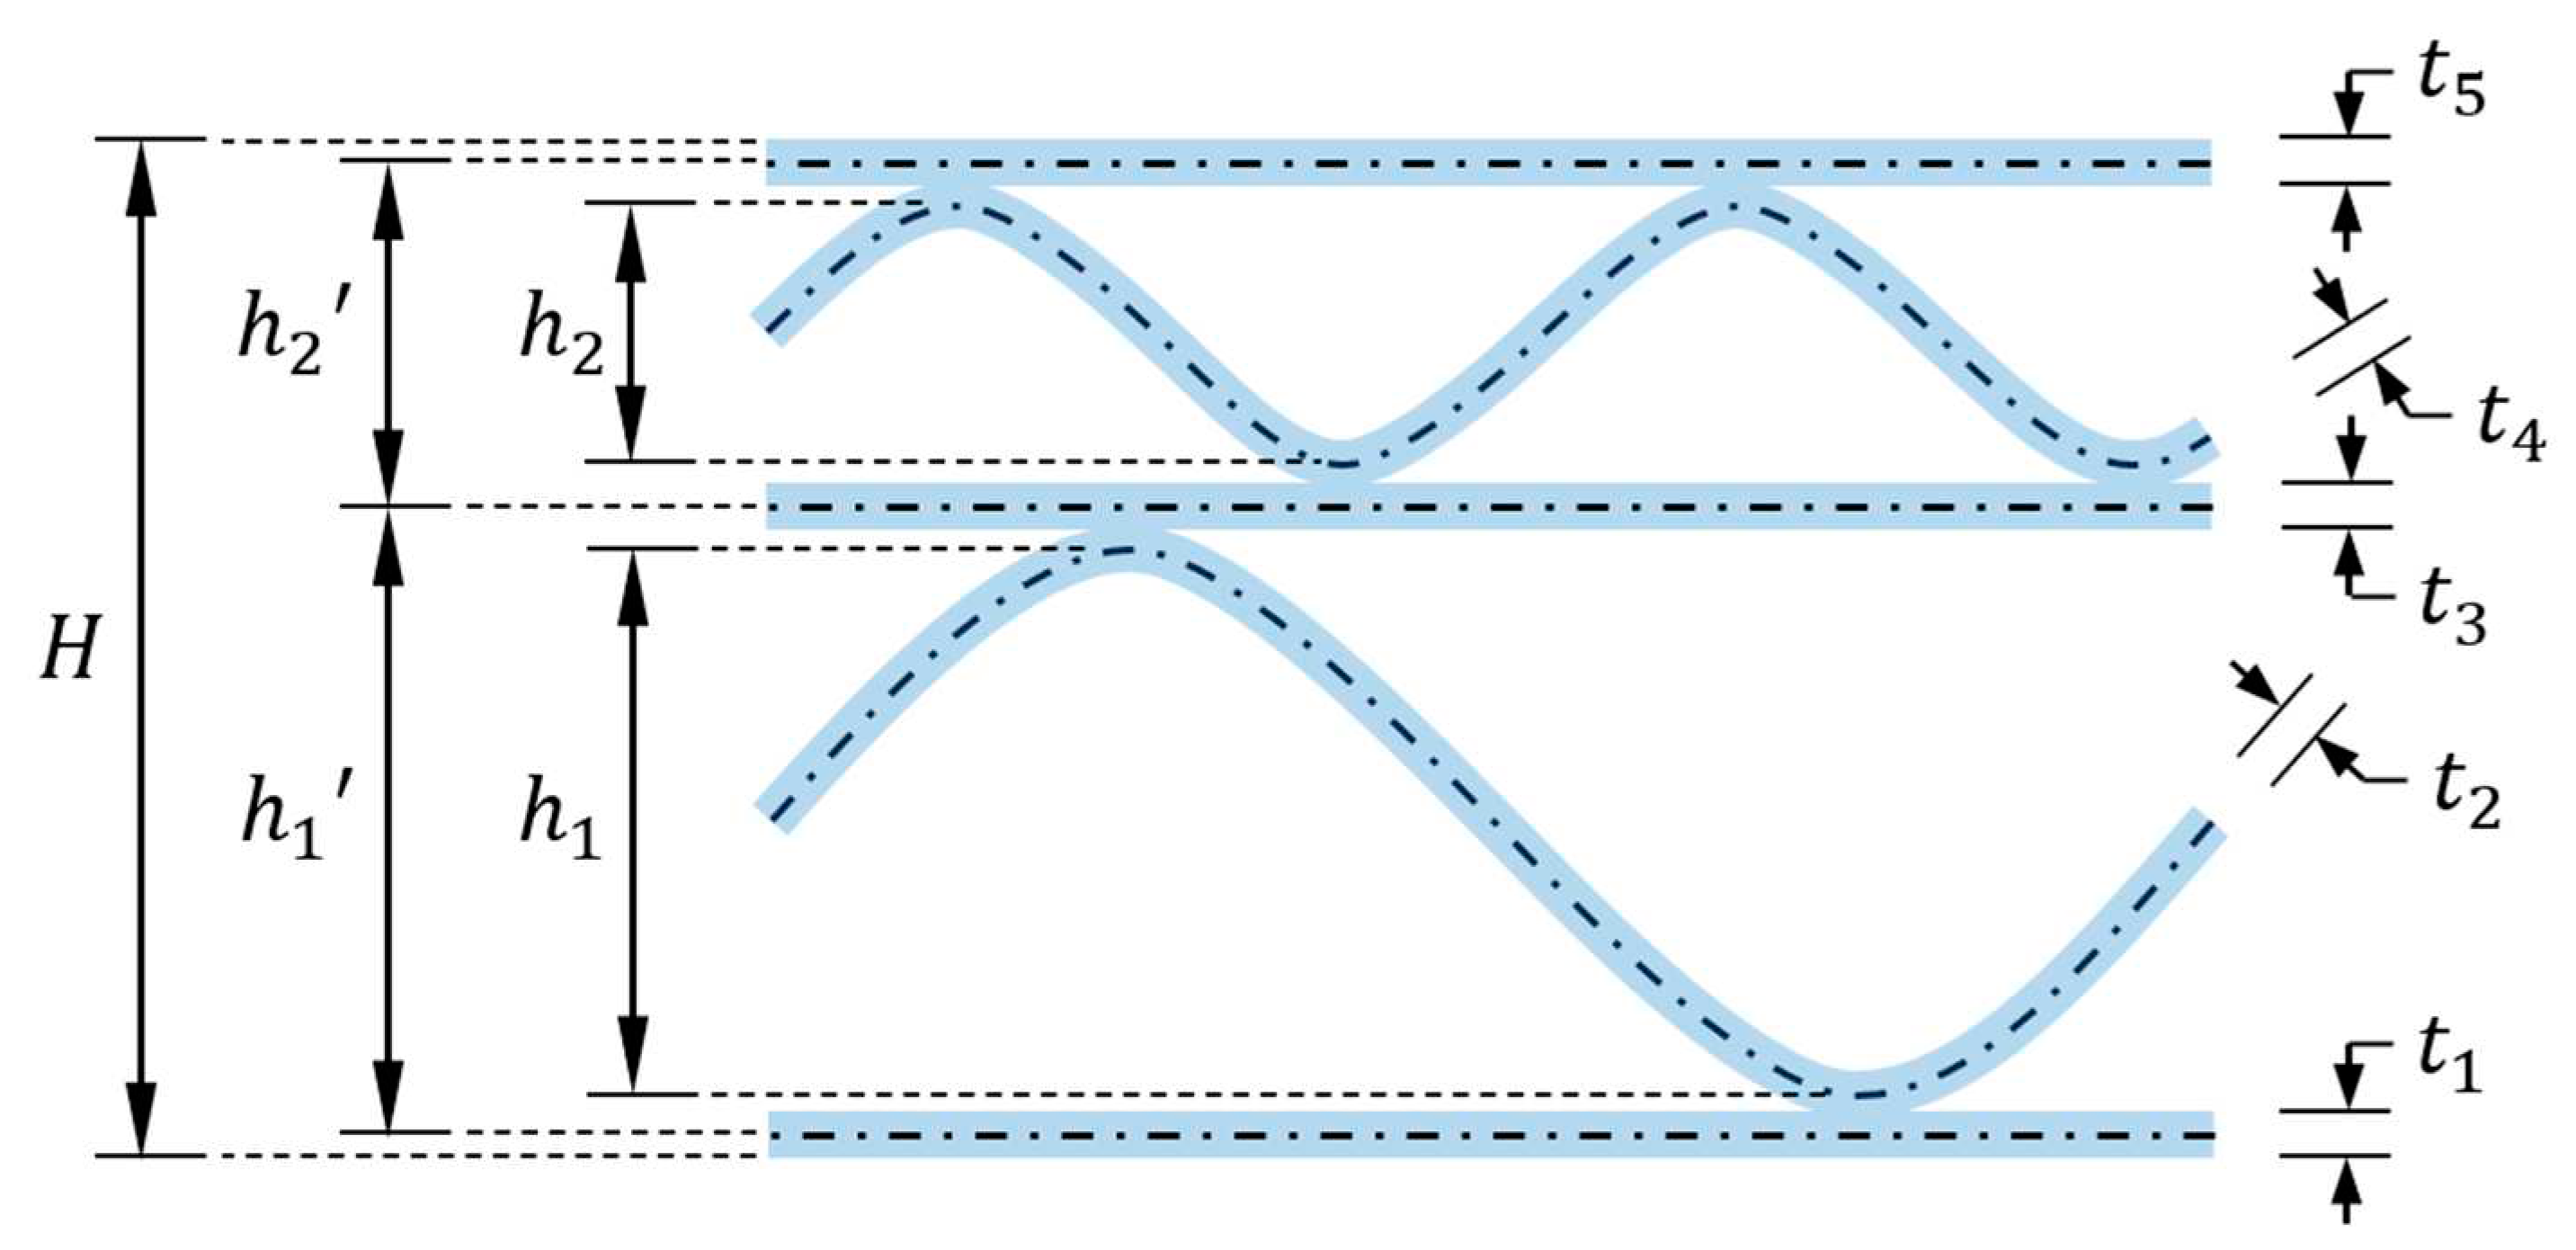
Figure 6.
Numerical cardboard model: (a) without thickness visualization and (b) with thickness visualization.
Figure 6.
Numerical cardboard model: (a) without thickness visualization and (b) with thickness visualization.
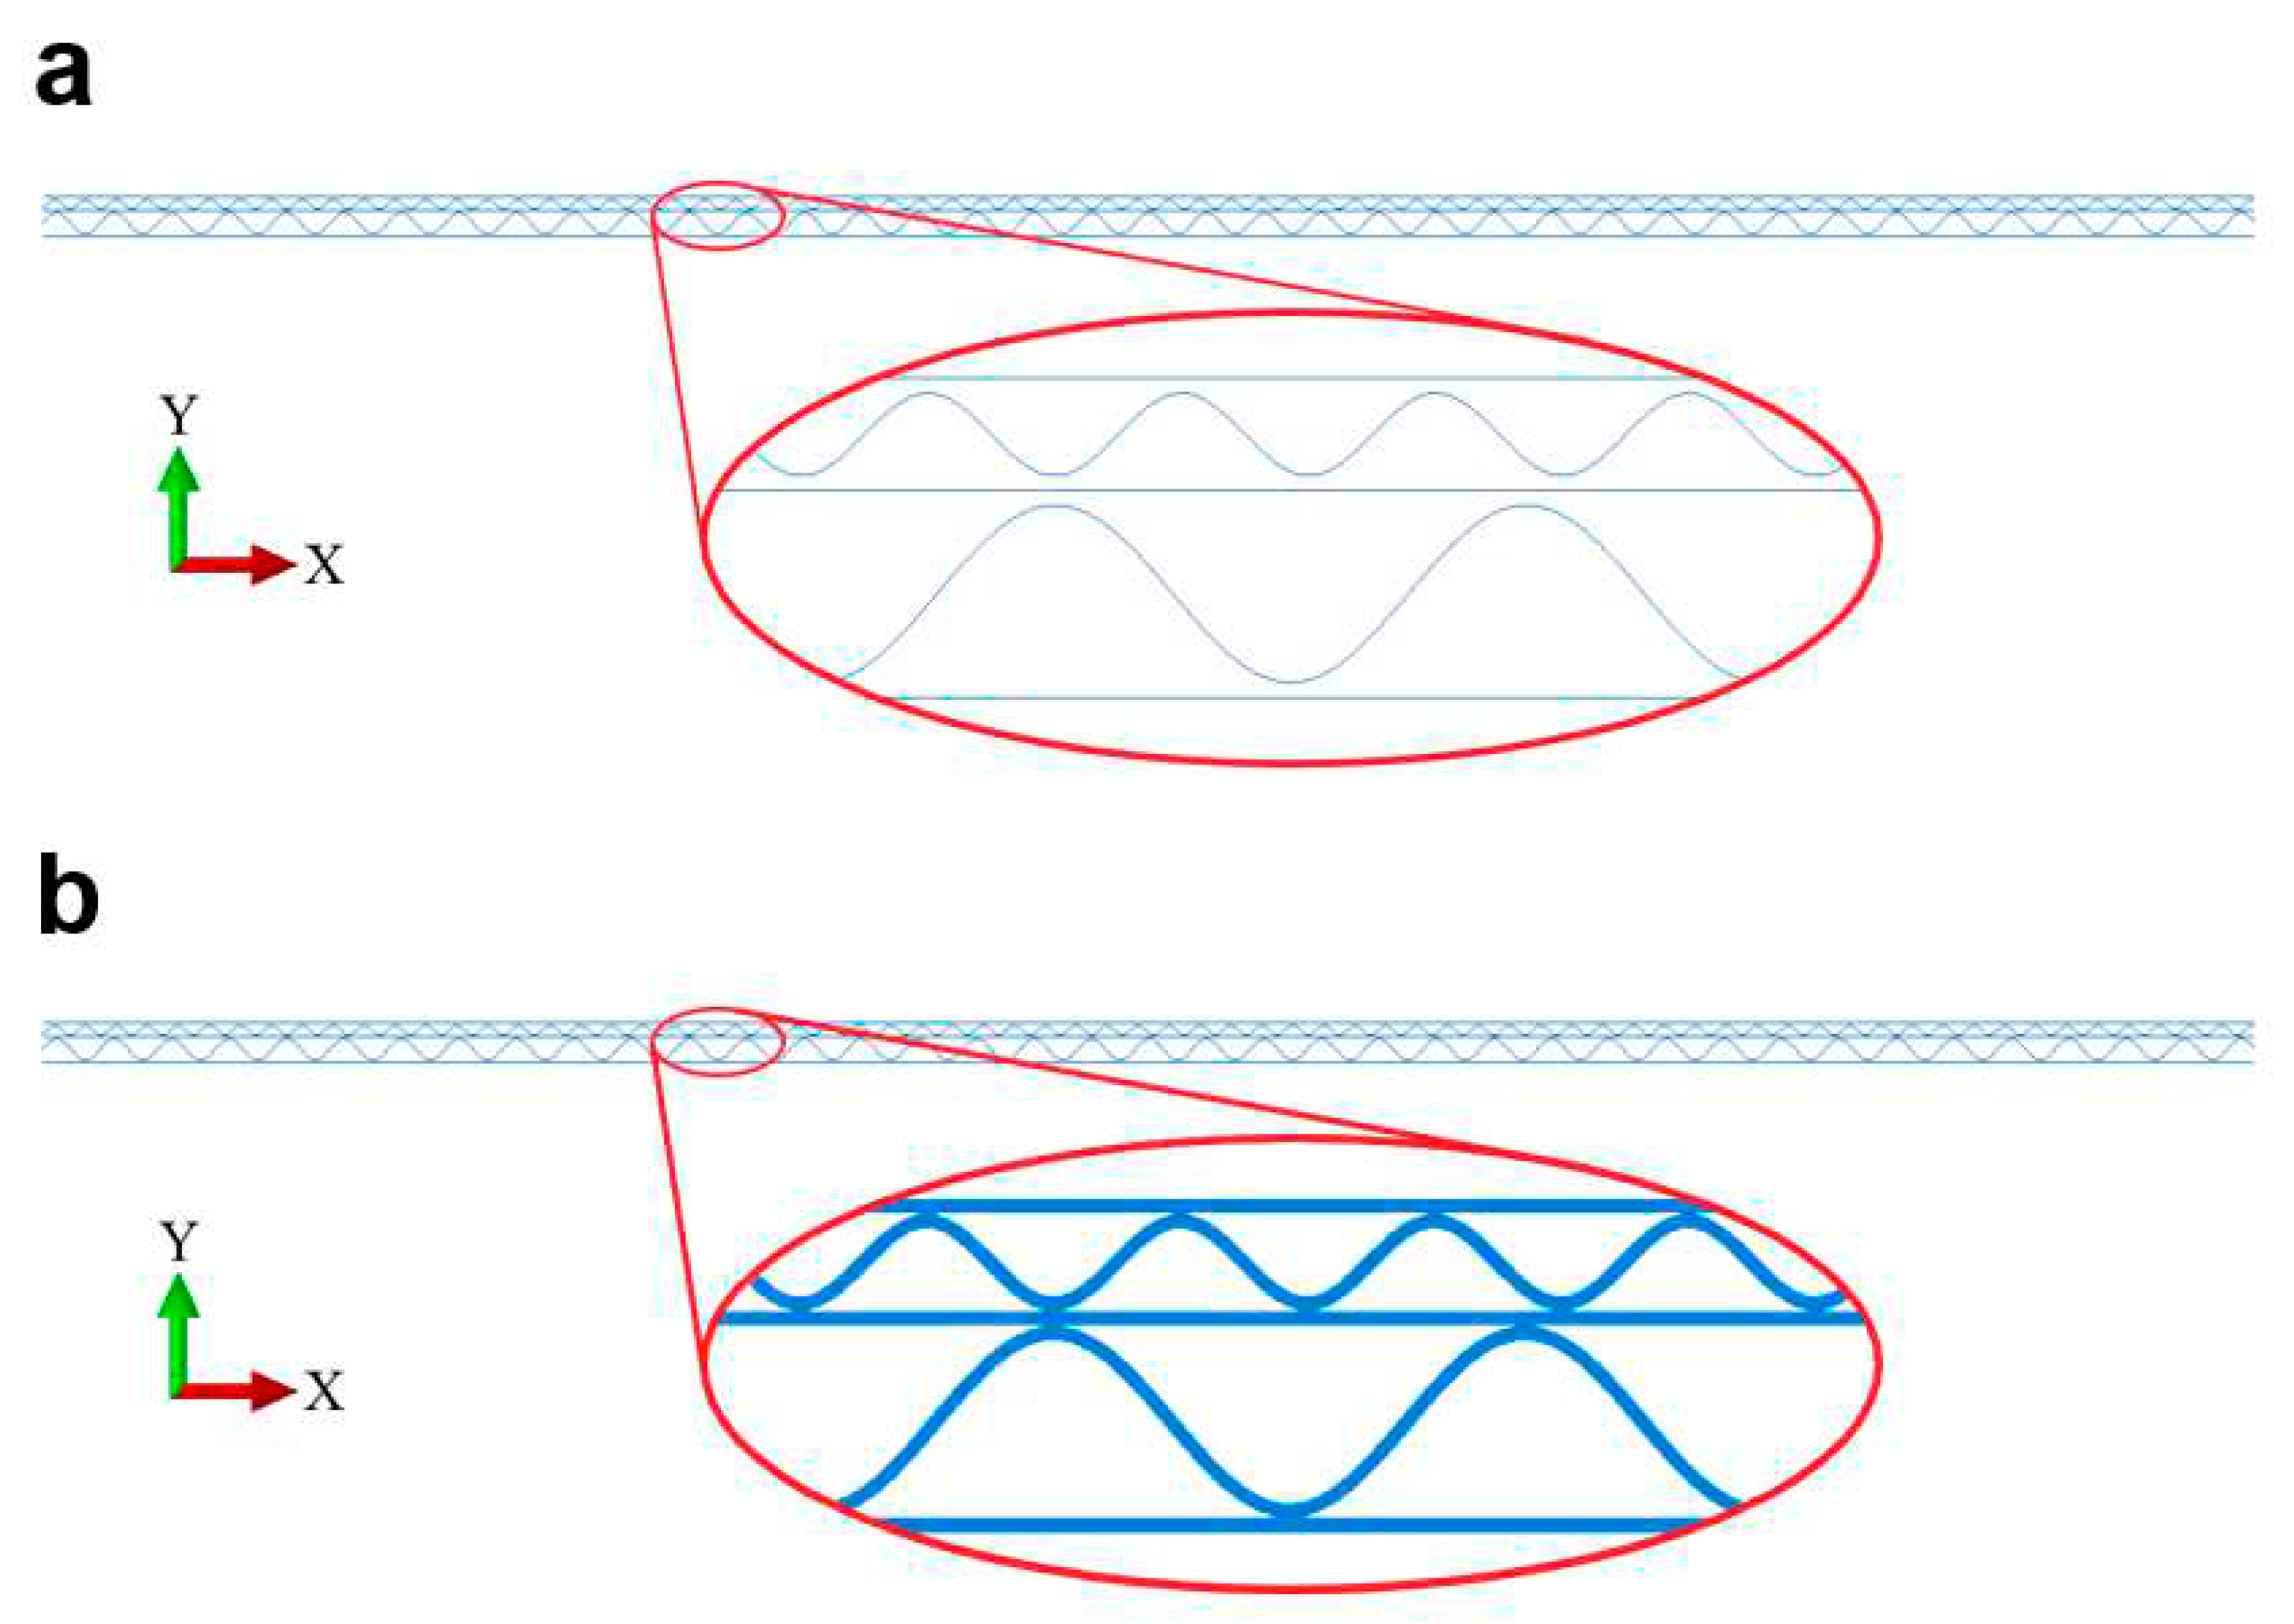
Figure 7.
Visualization of the structure integrity between: (a) the bottom liner and the crests of the bottom flute, (b) the middle liner and the crests of the upper flute, (c) the middle liner and the crests of the bottom flute and (d) the upper liner and the crests of the upper flute.
Figure 7.
Visualization of the structure integrity between: (a) the bottom liner and the crests of the bottom flute, (b) the middle liner and the crests of the upper flute, (c) the middle liner and the crests of the bottom flute and (d) the upper liner and the crests of the upper flute.
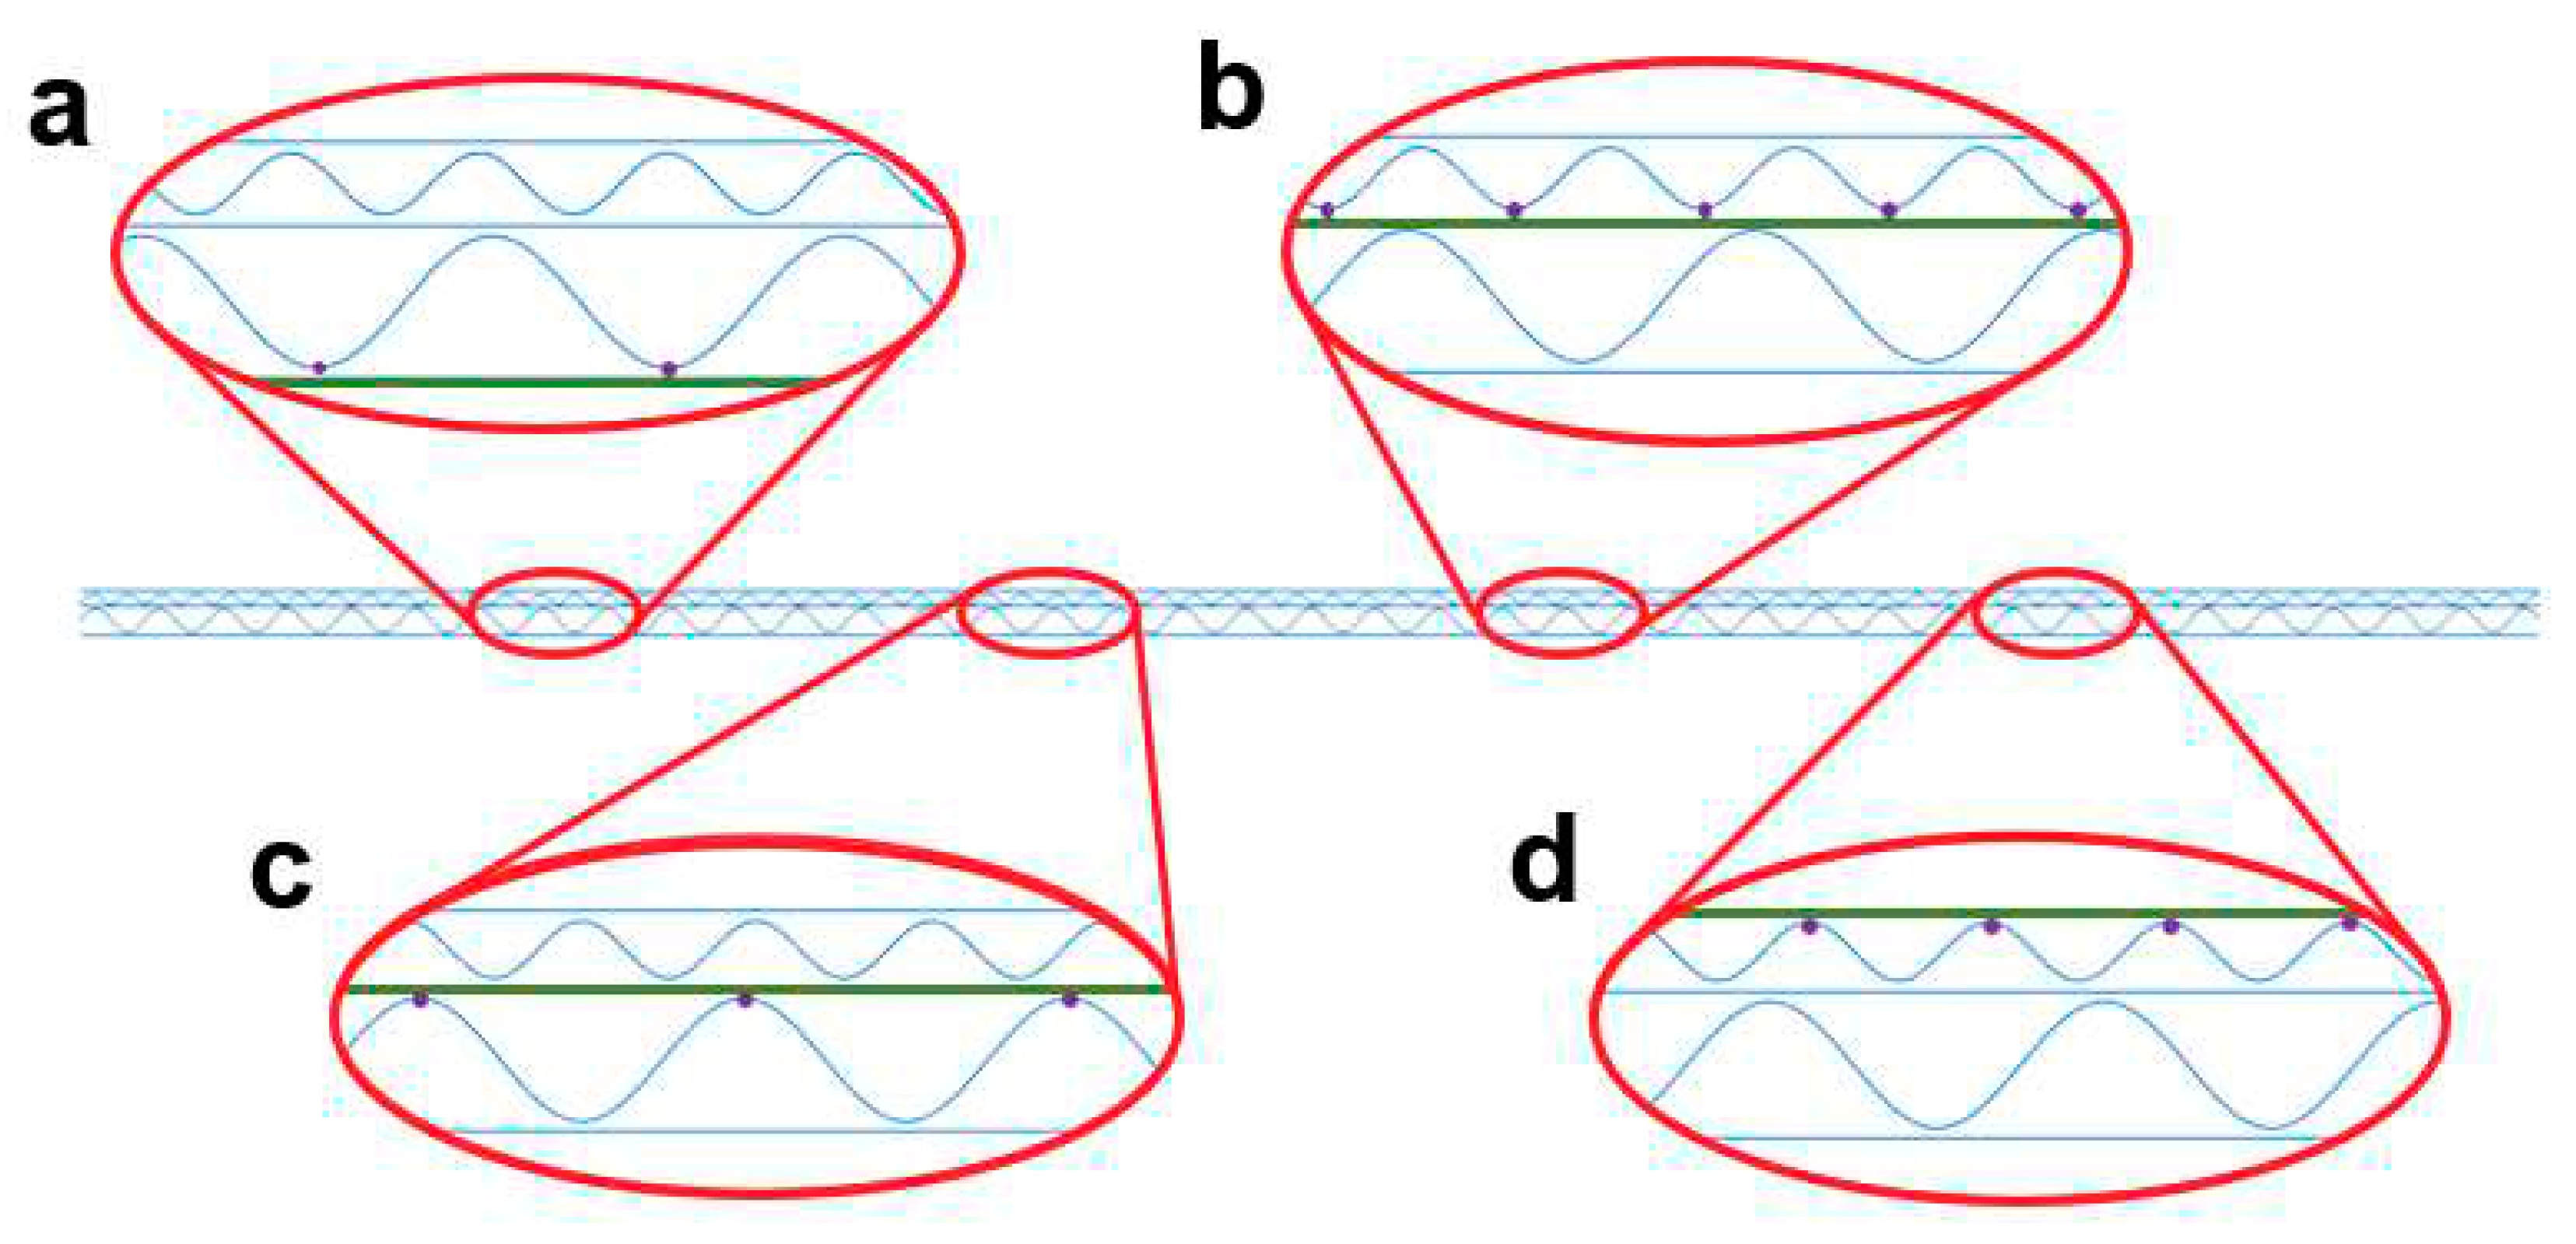
Figure 8.
The shifts of the wave crests relative to the supports for the model: (a) EB-00-00 and (b) EB-30-60.
Figure 8.
The shifts of the wave crests relative to the supports for the model: (a) EB-00-00 and (b) EB-30-60.
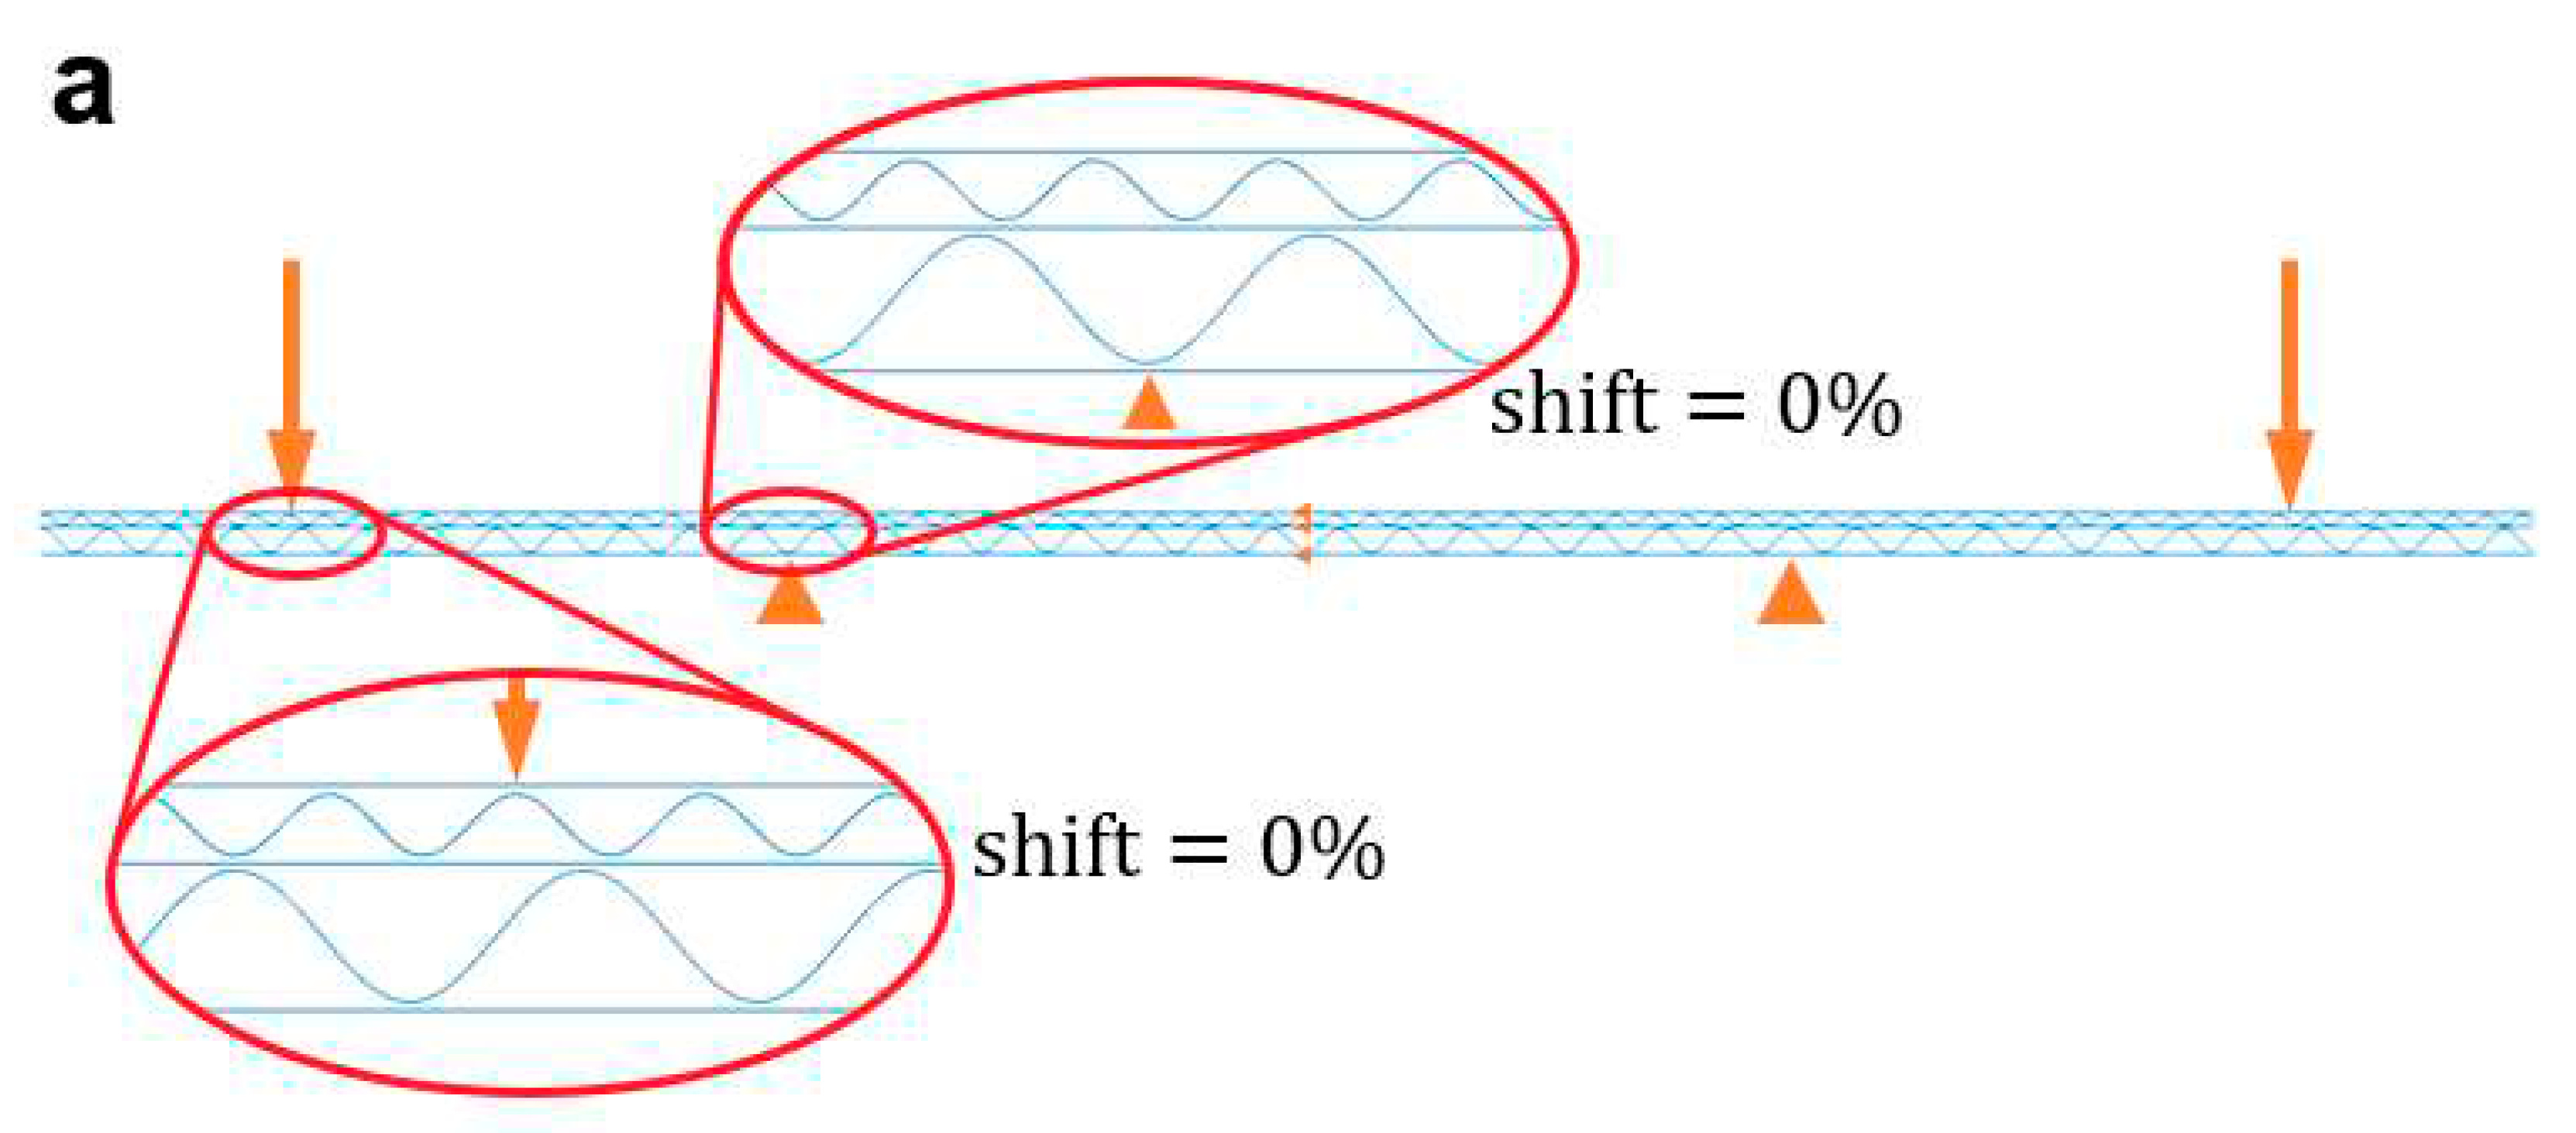
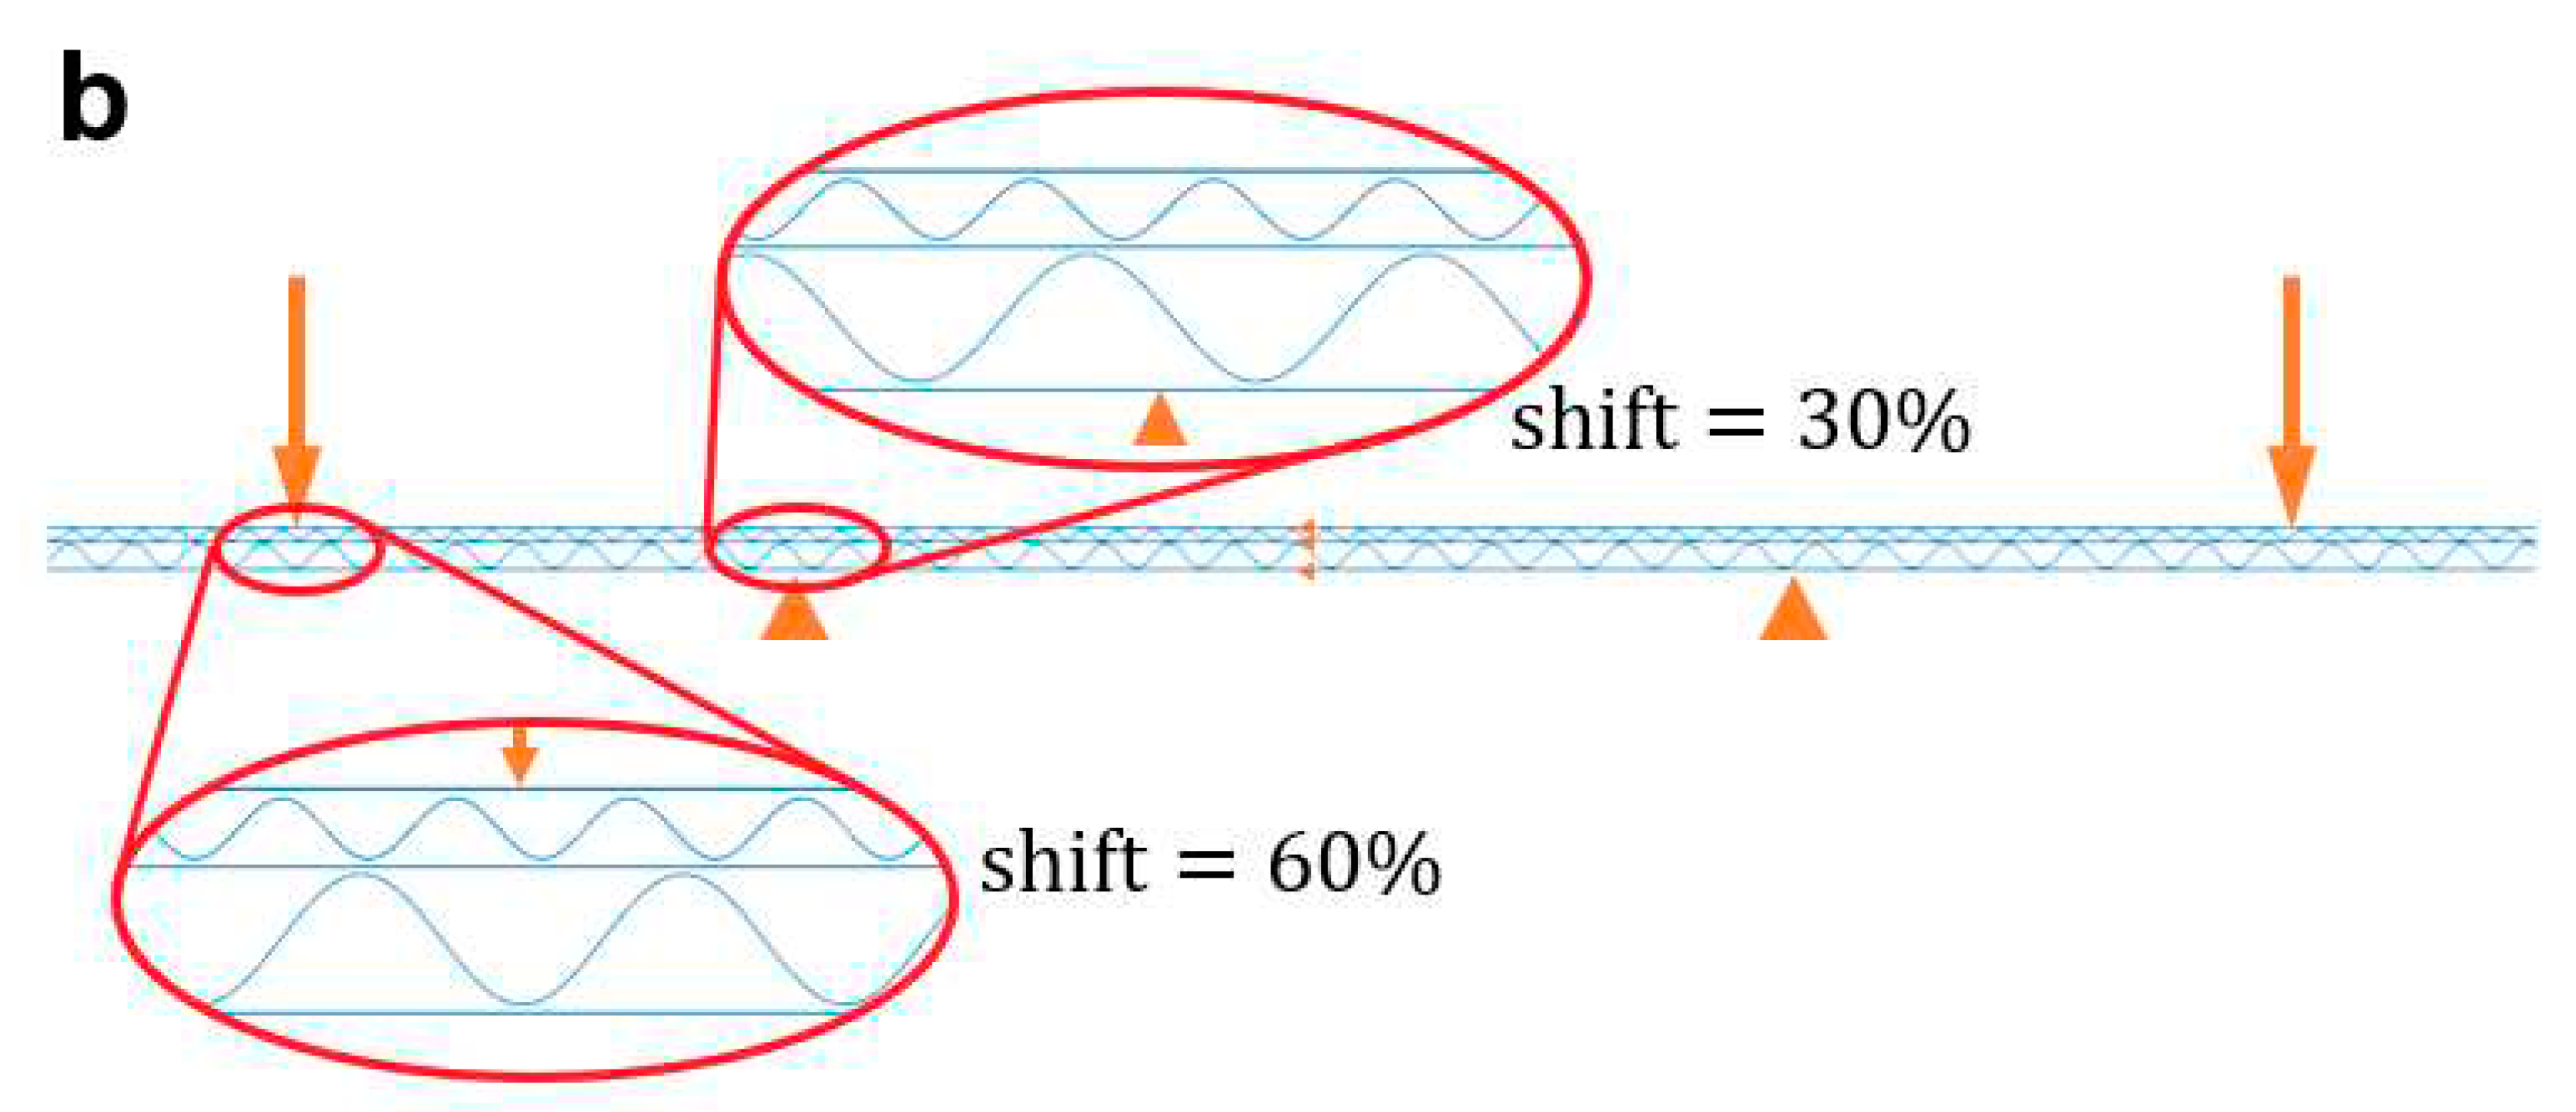
Figure 9.
Scaled displacements and the Huber-Mises-Hencky equivalent stress map on left supports for the two samples: (a) BC-50-50 and (b) CB-50-50.
Figure 9.
Scaled displacements and the Huber-Mises-Hencky equivalent stress map on left supports for the two samples: (a) BC-50-50 and (b) CB-50-50.
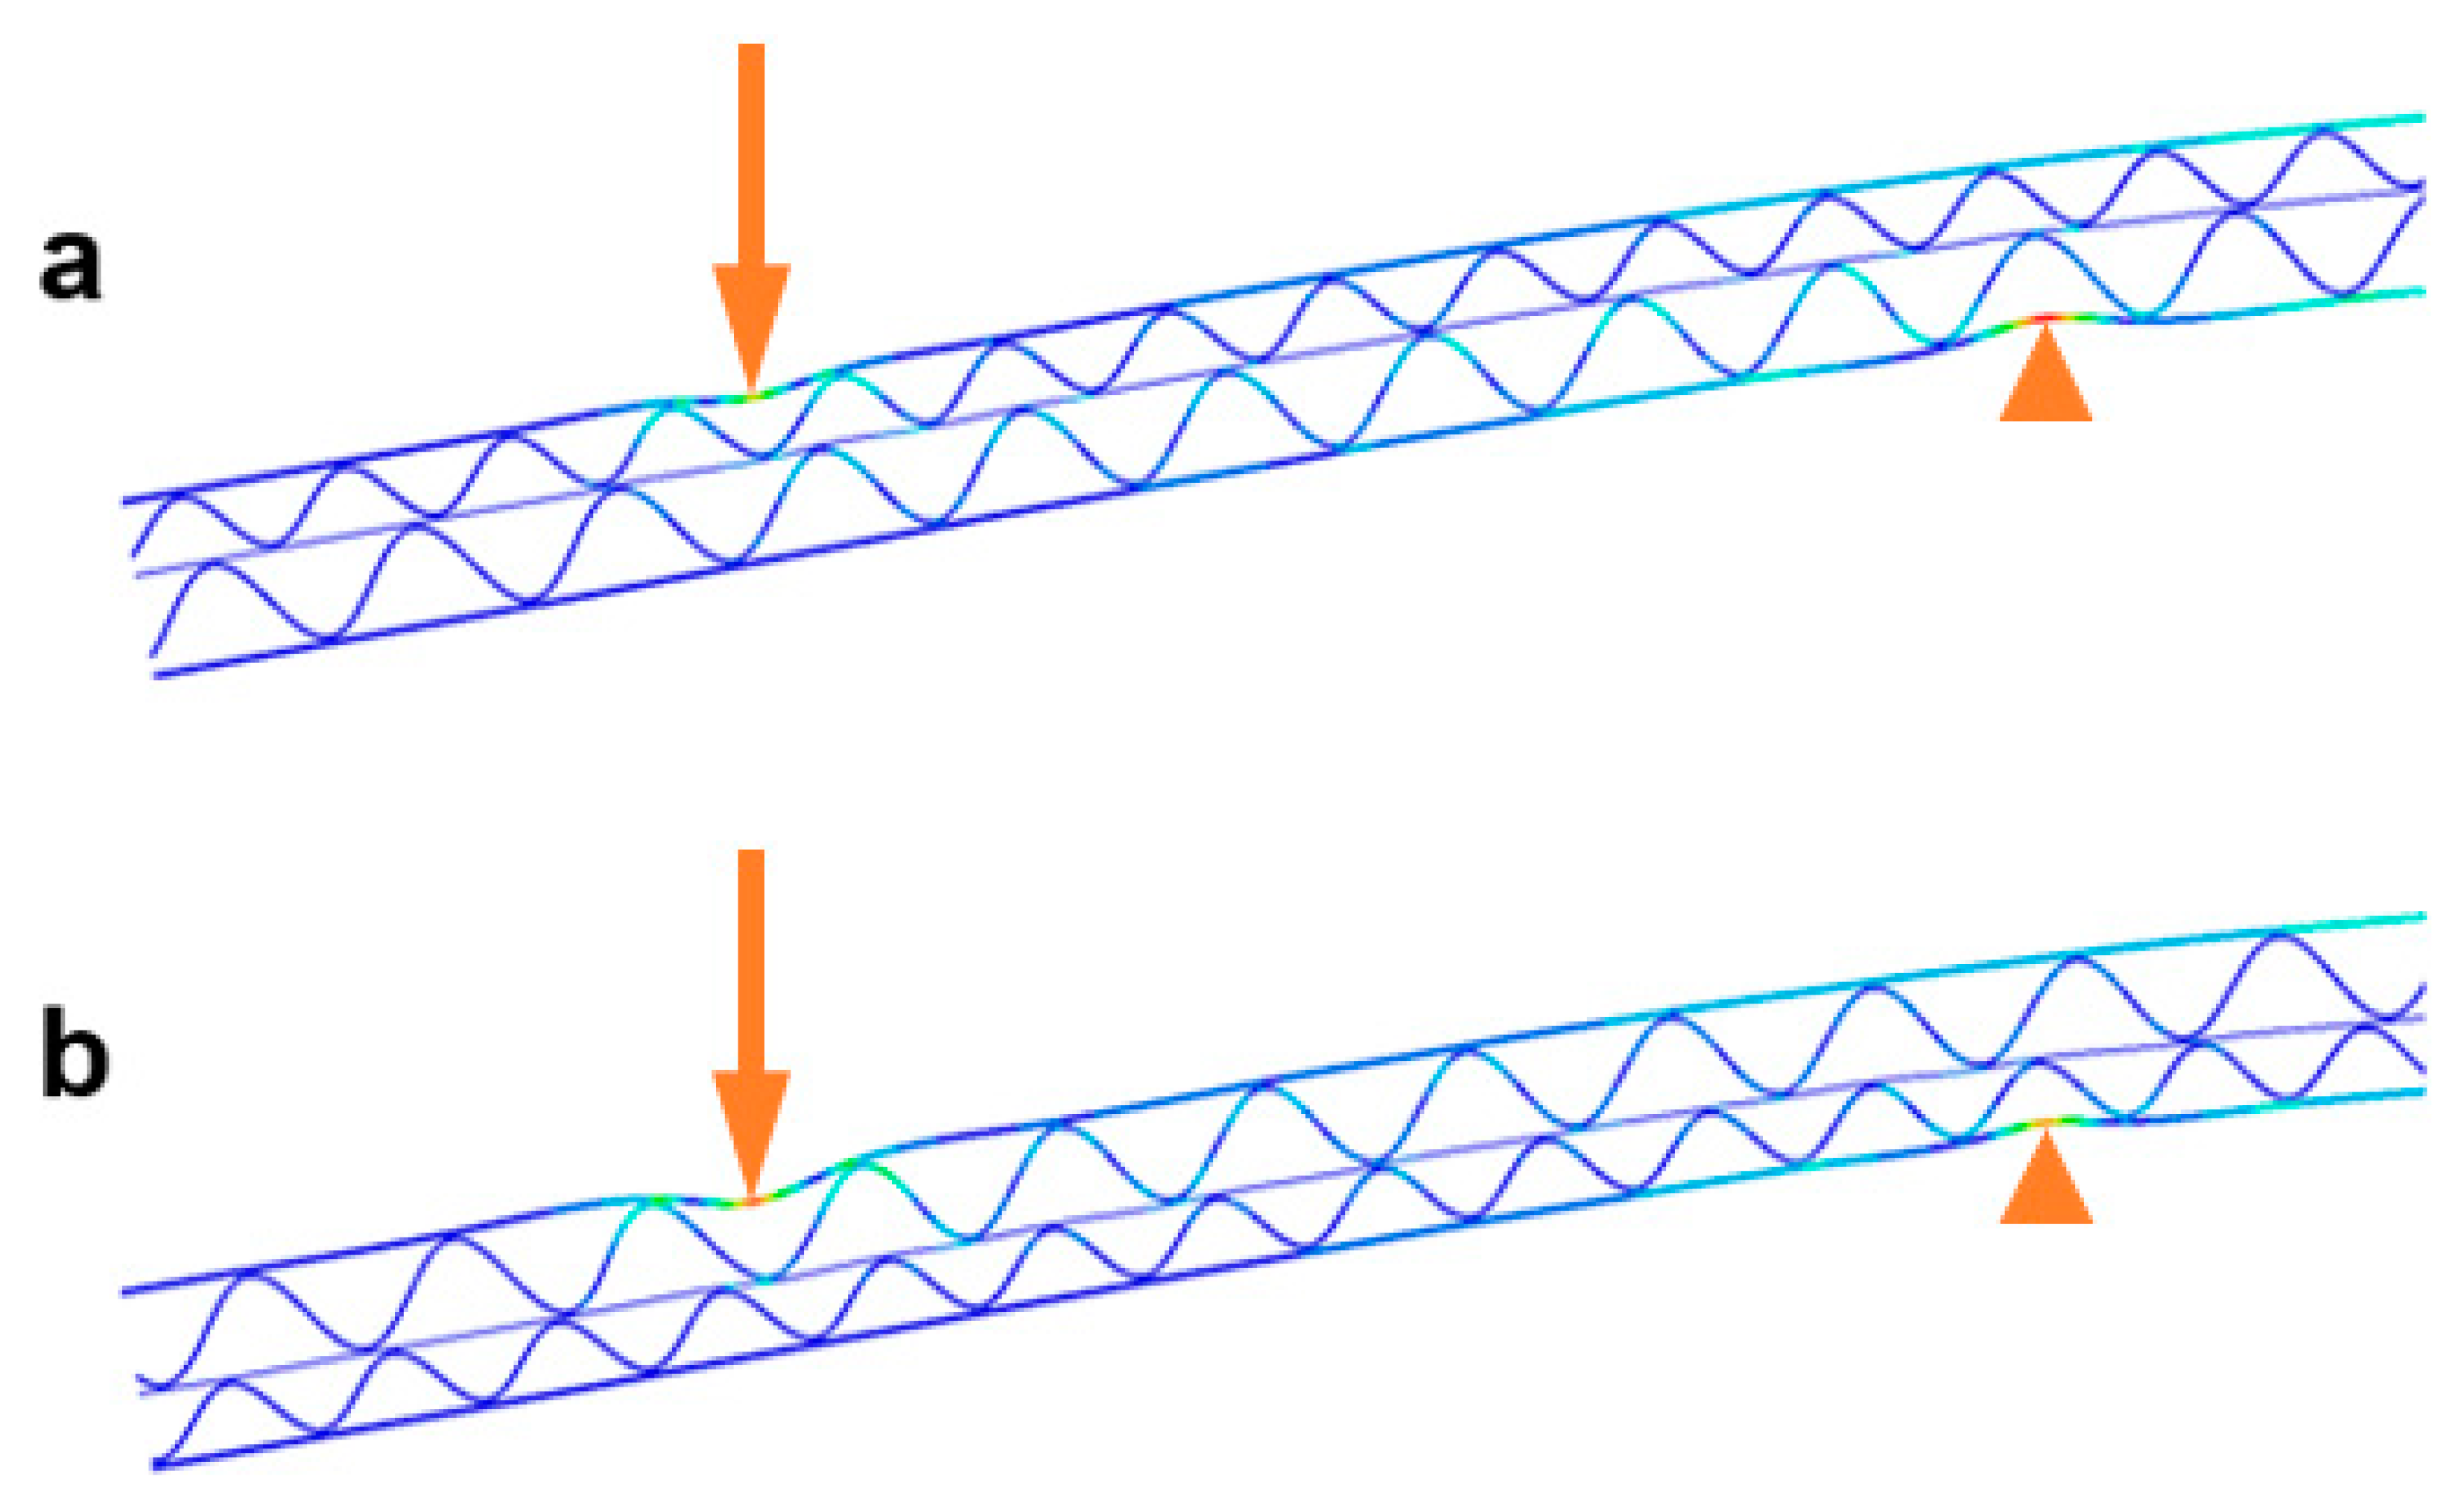
Figure 10.
Percentage difference in bending stiffness for cardboard example B and Brev.
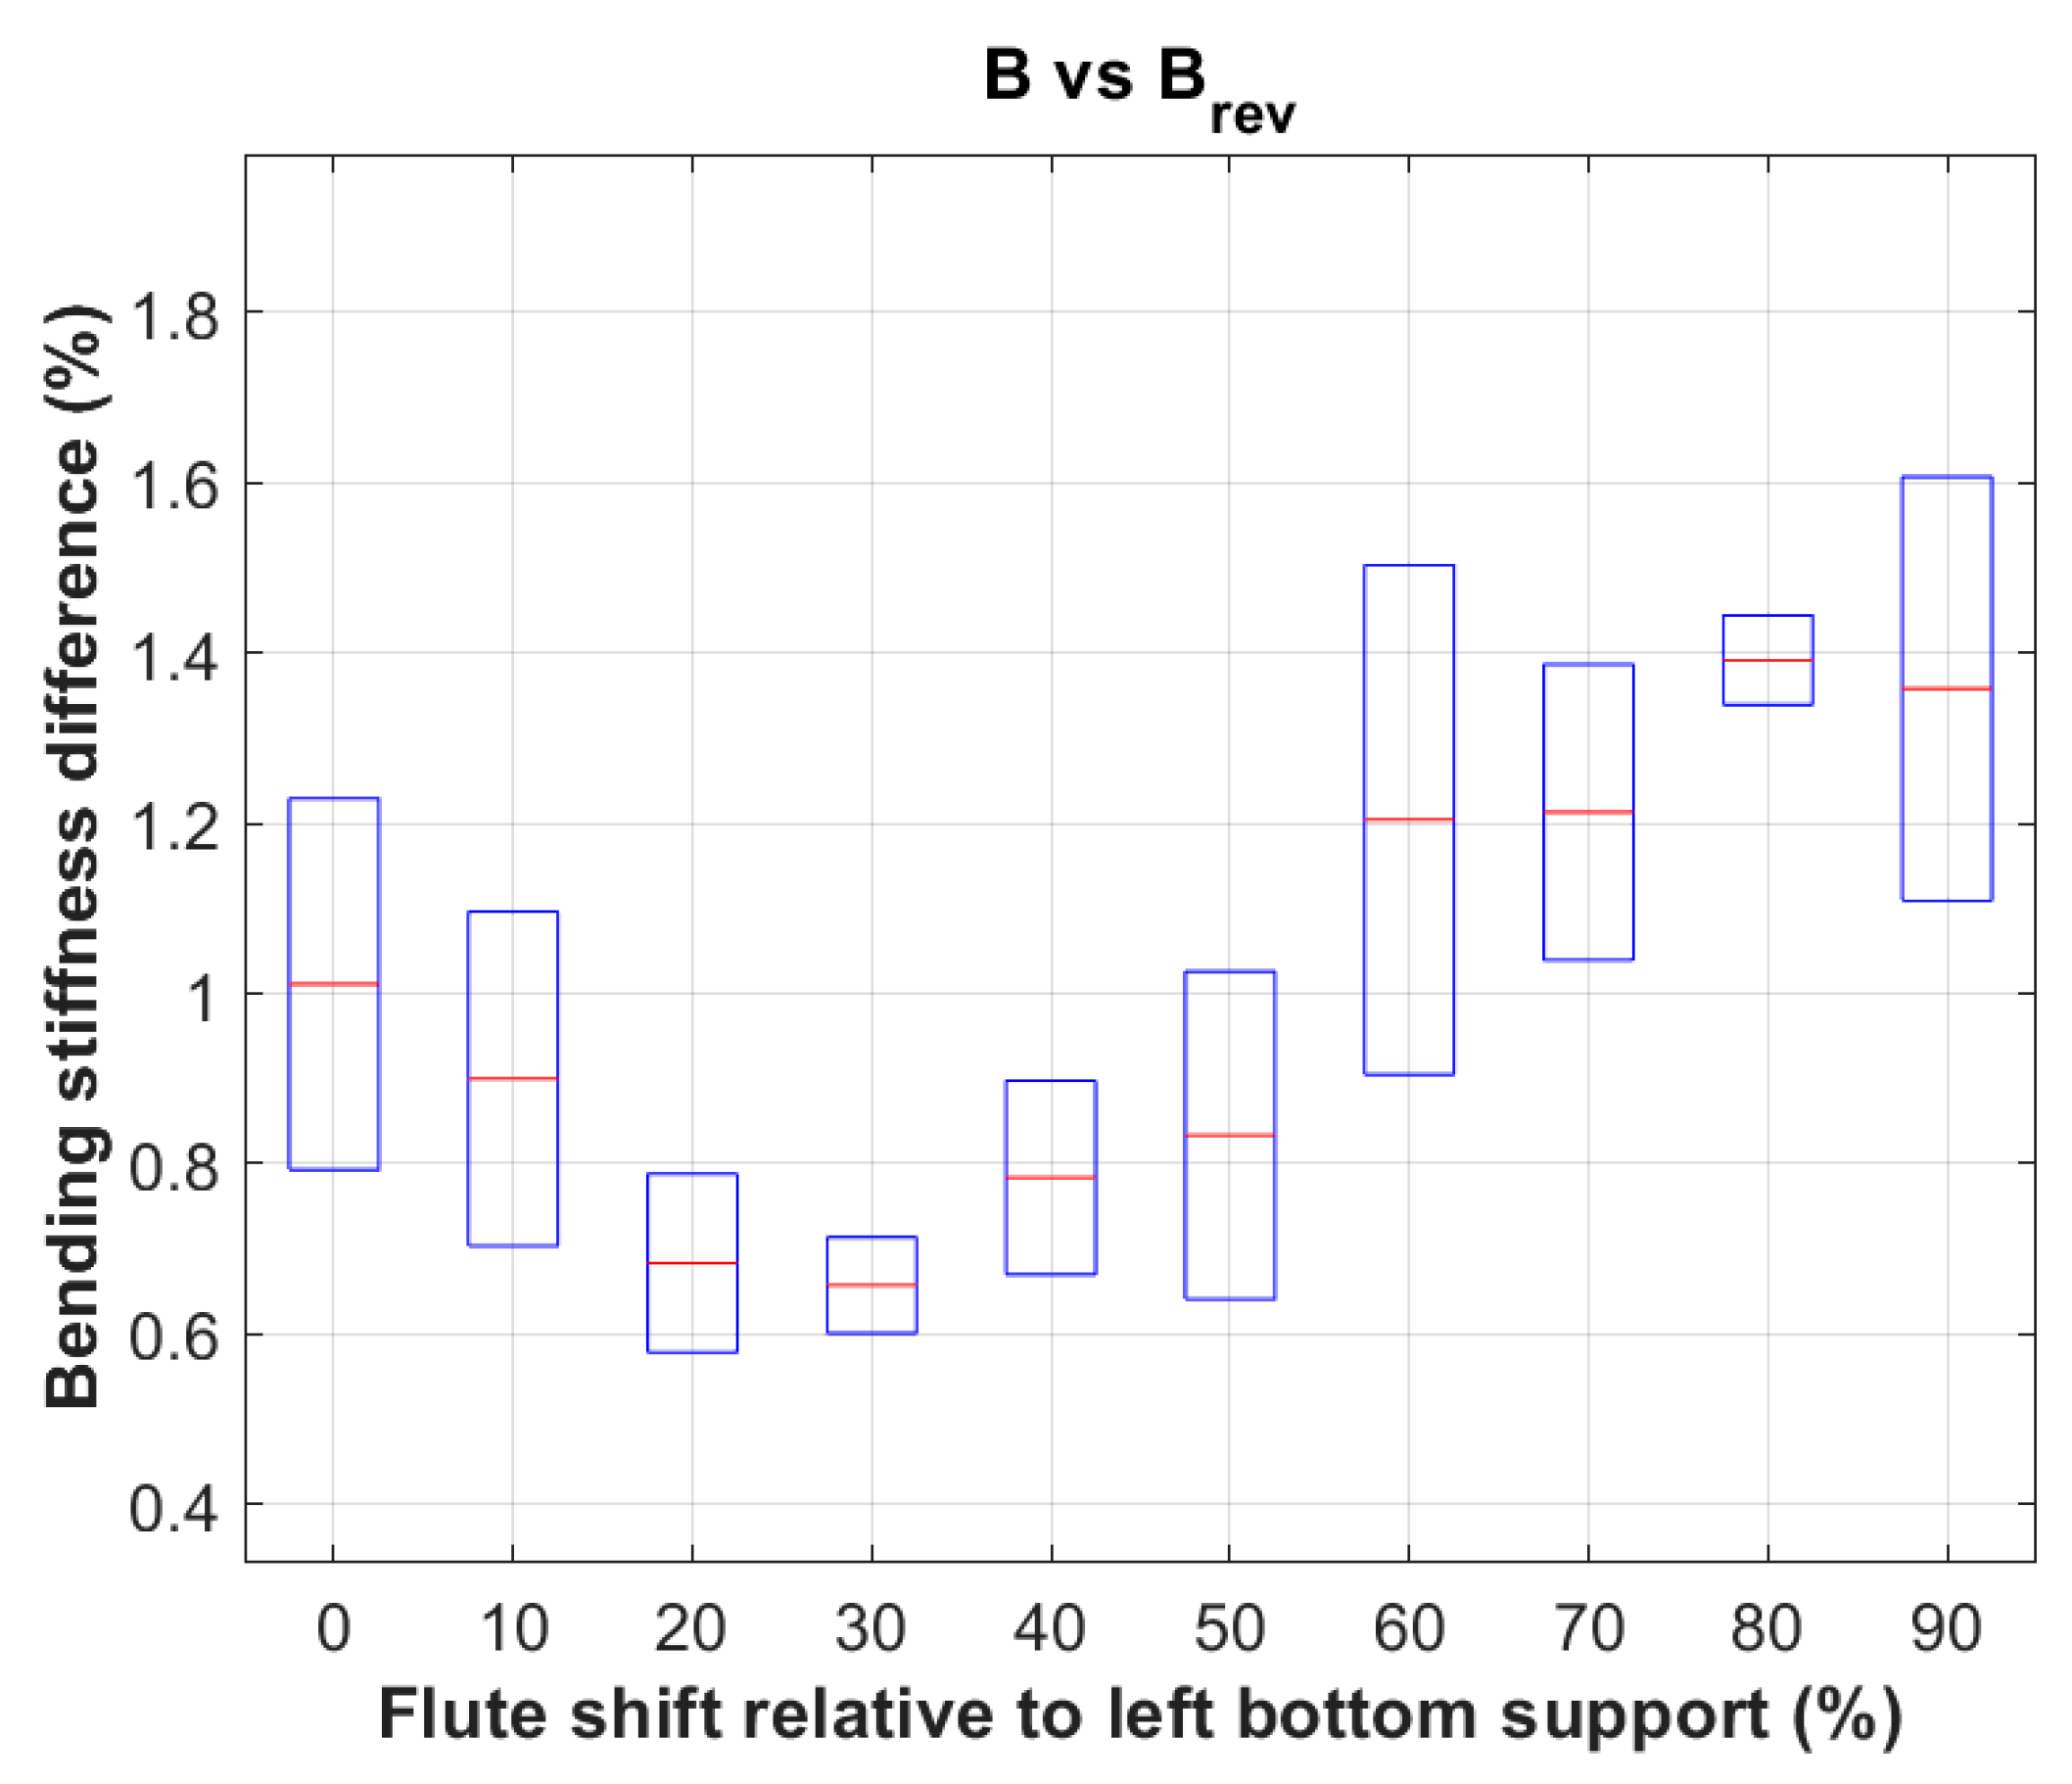
Figure 11.
Percentage difference in bending stiffness for cardboard example BE and EB.
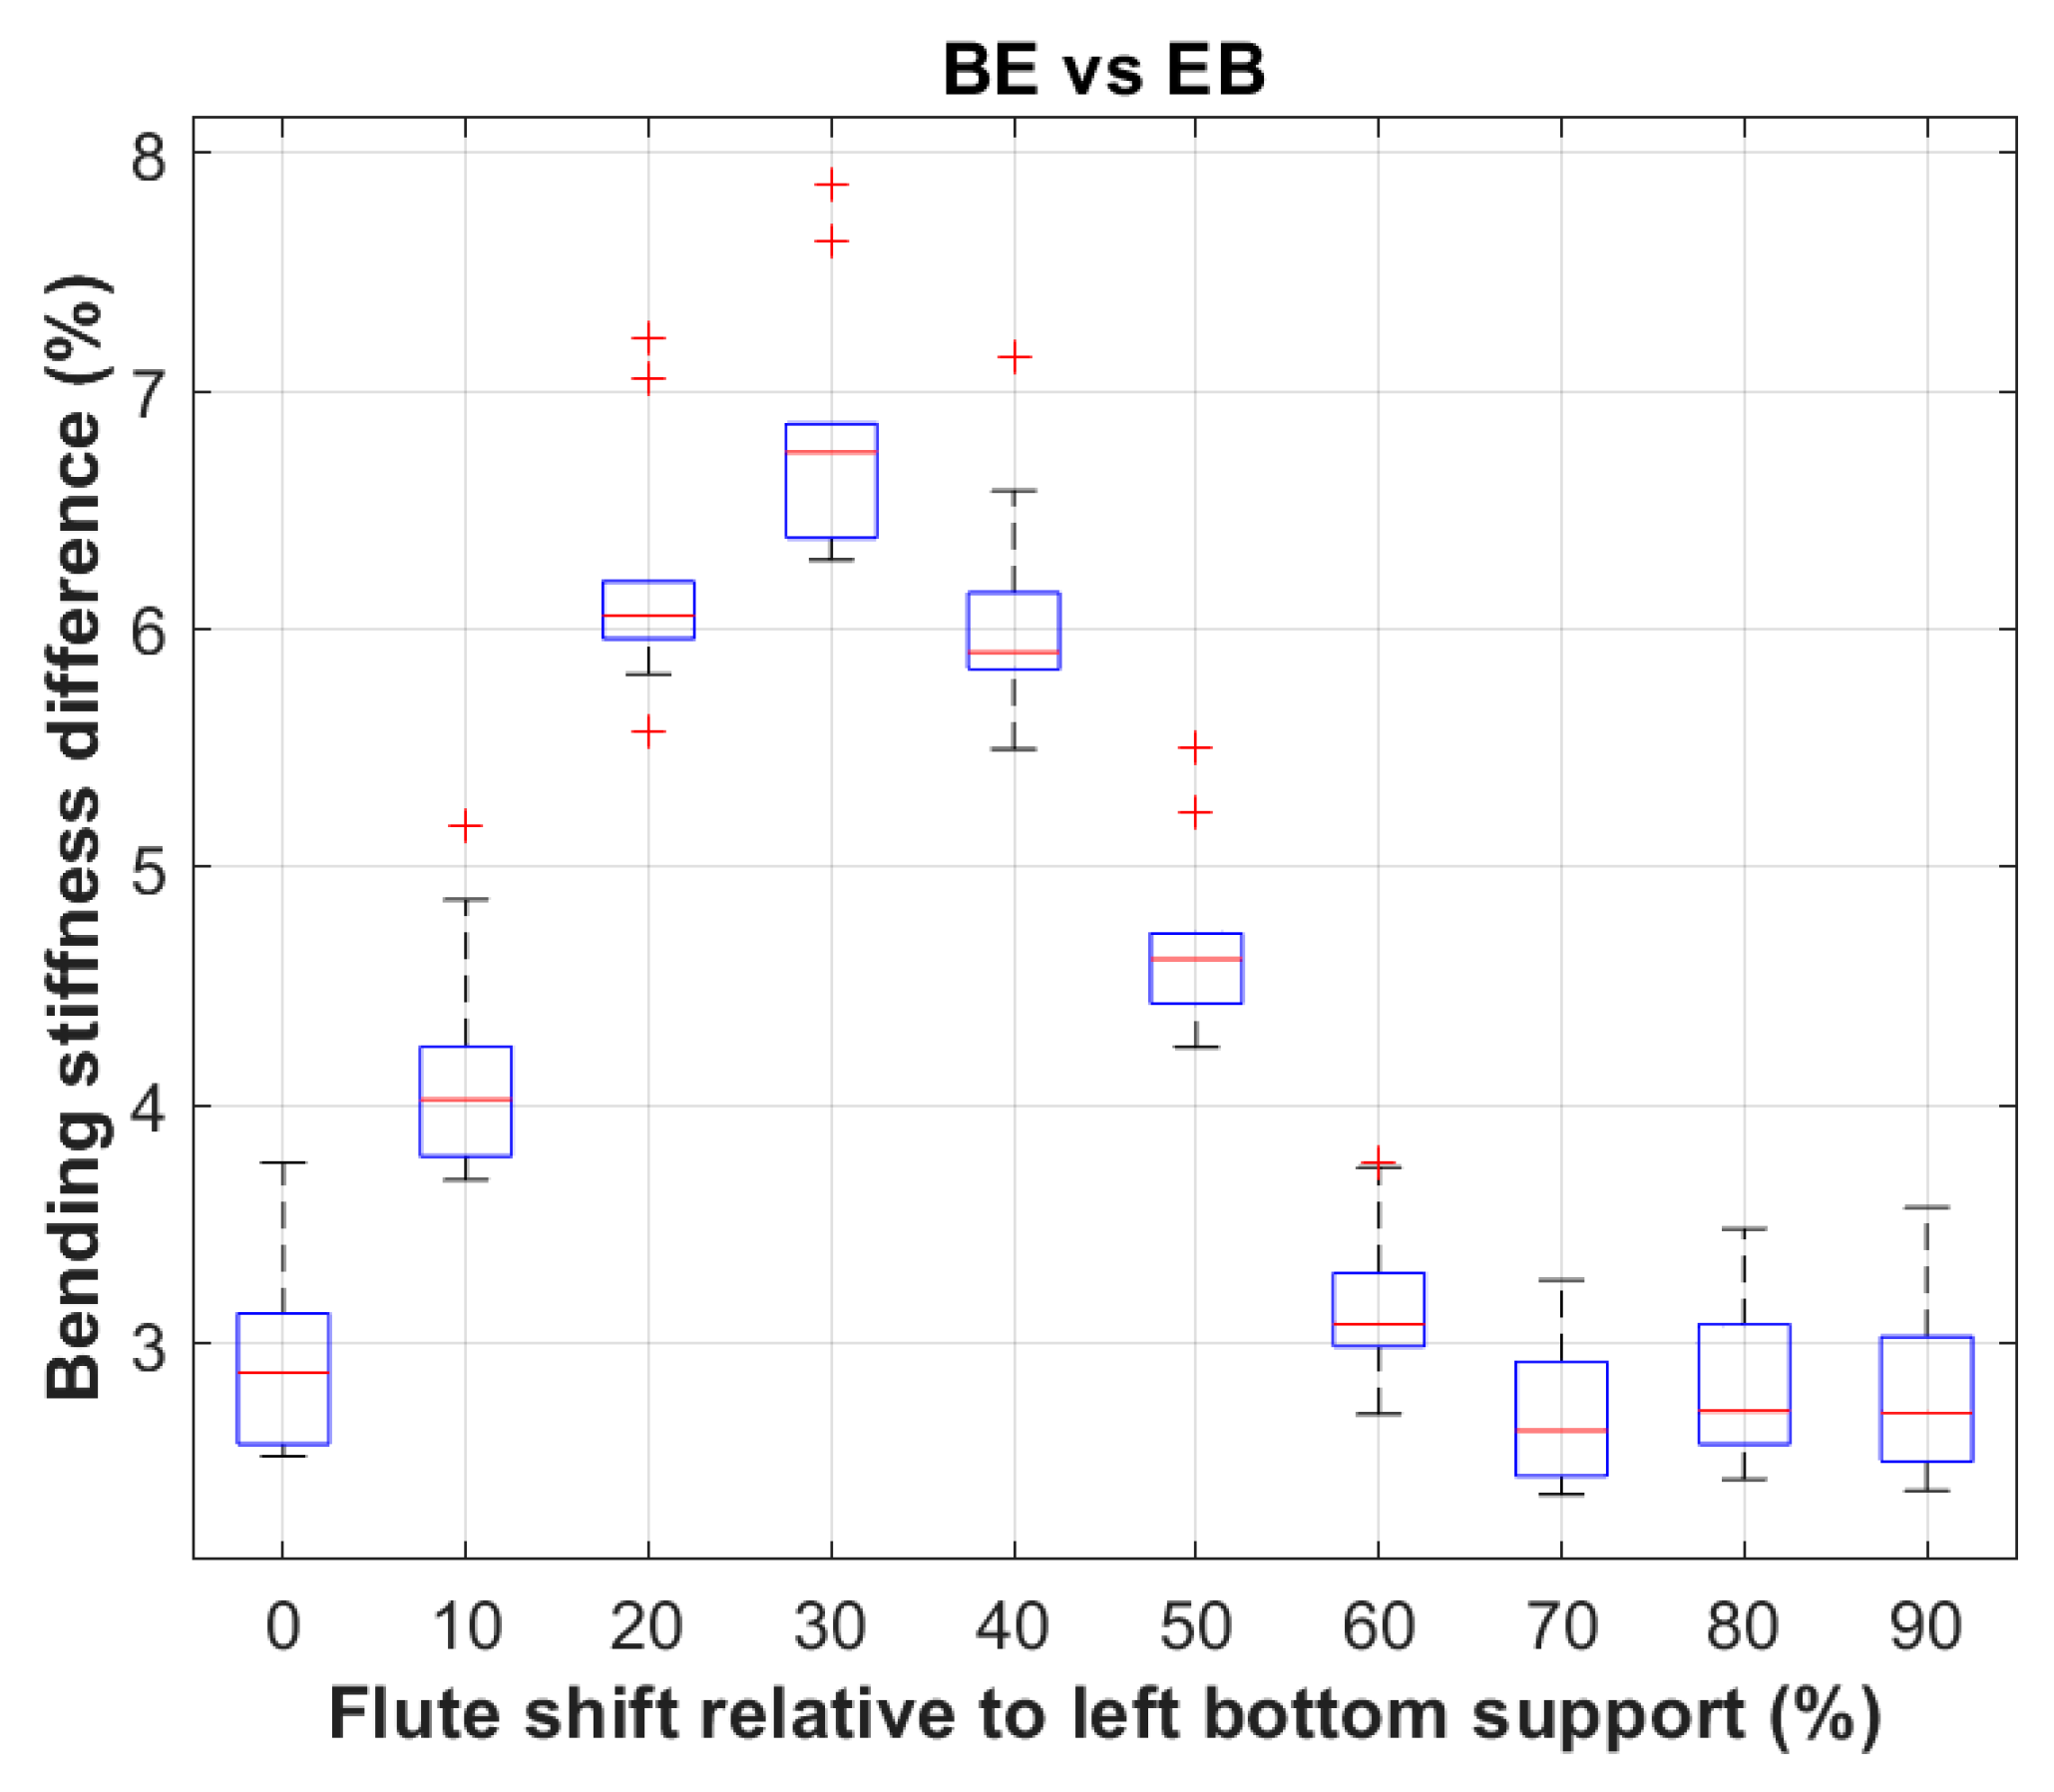
Figure 12.
Percentage difference in bending stiffness for cardboard example C and Crev.
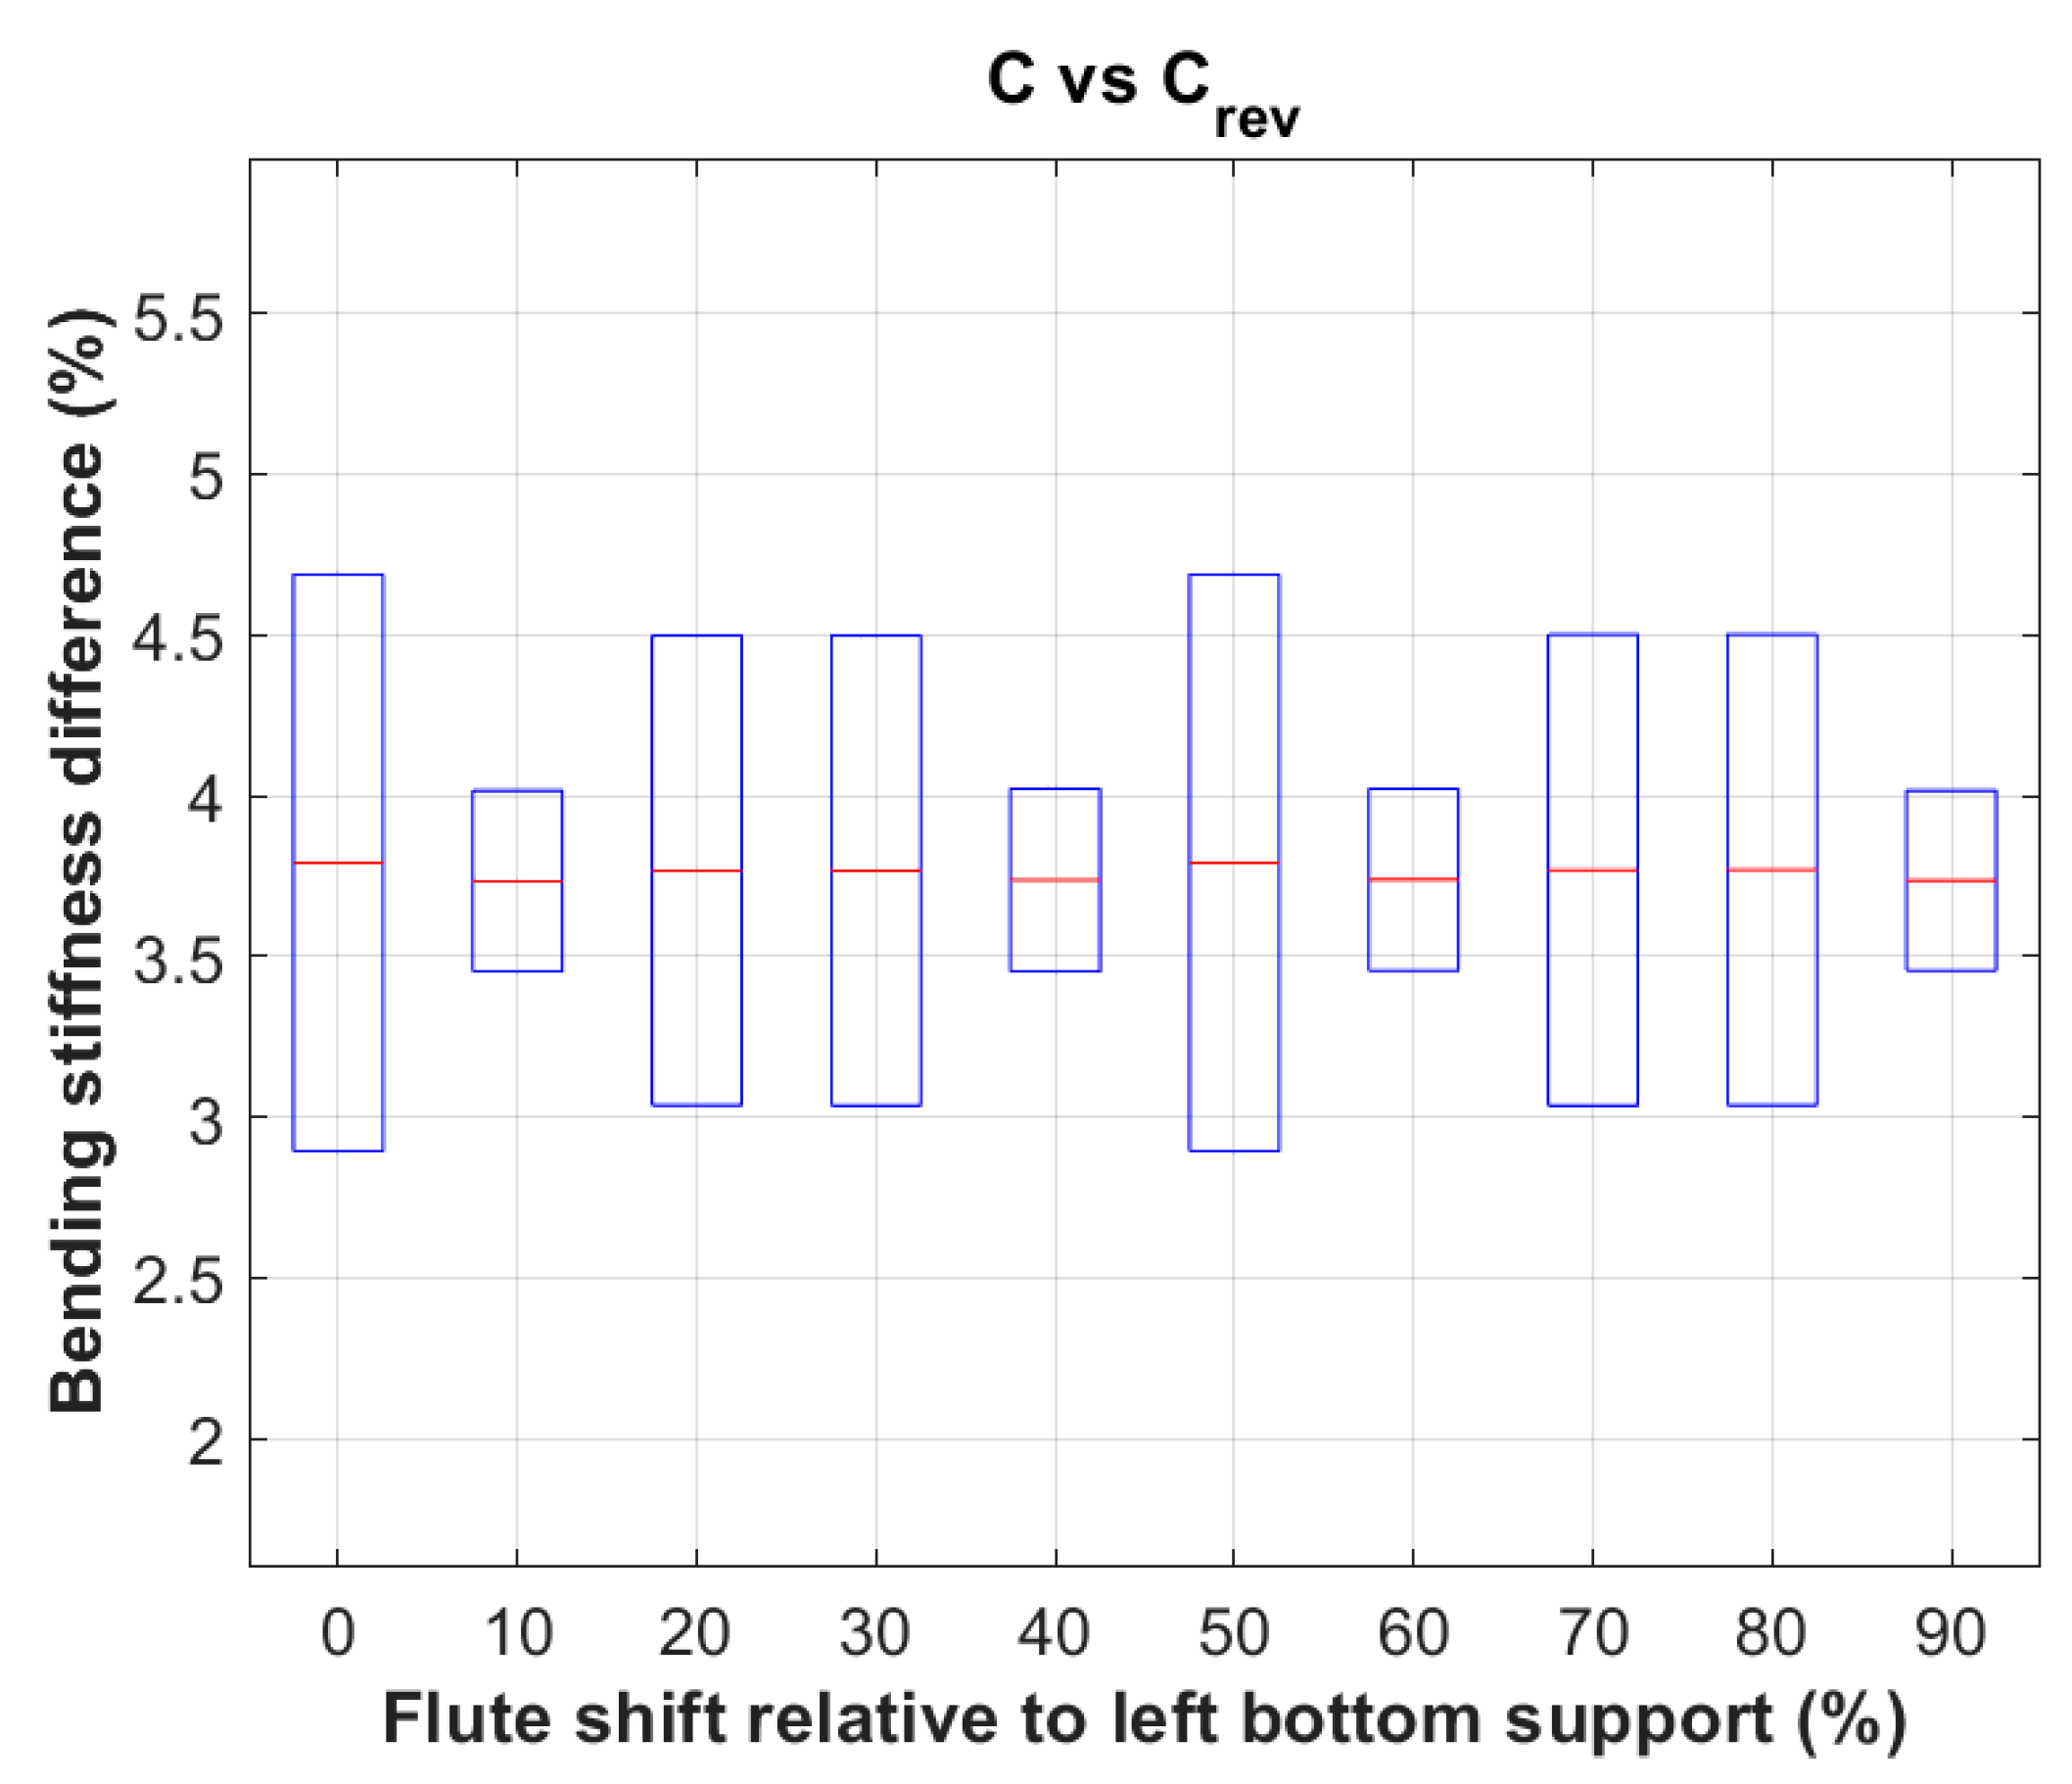
Figure 13.
Percentage difference in bending stiffness for cardboard example CB and BC.
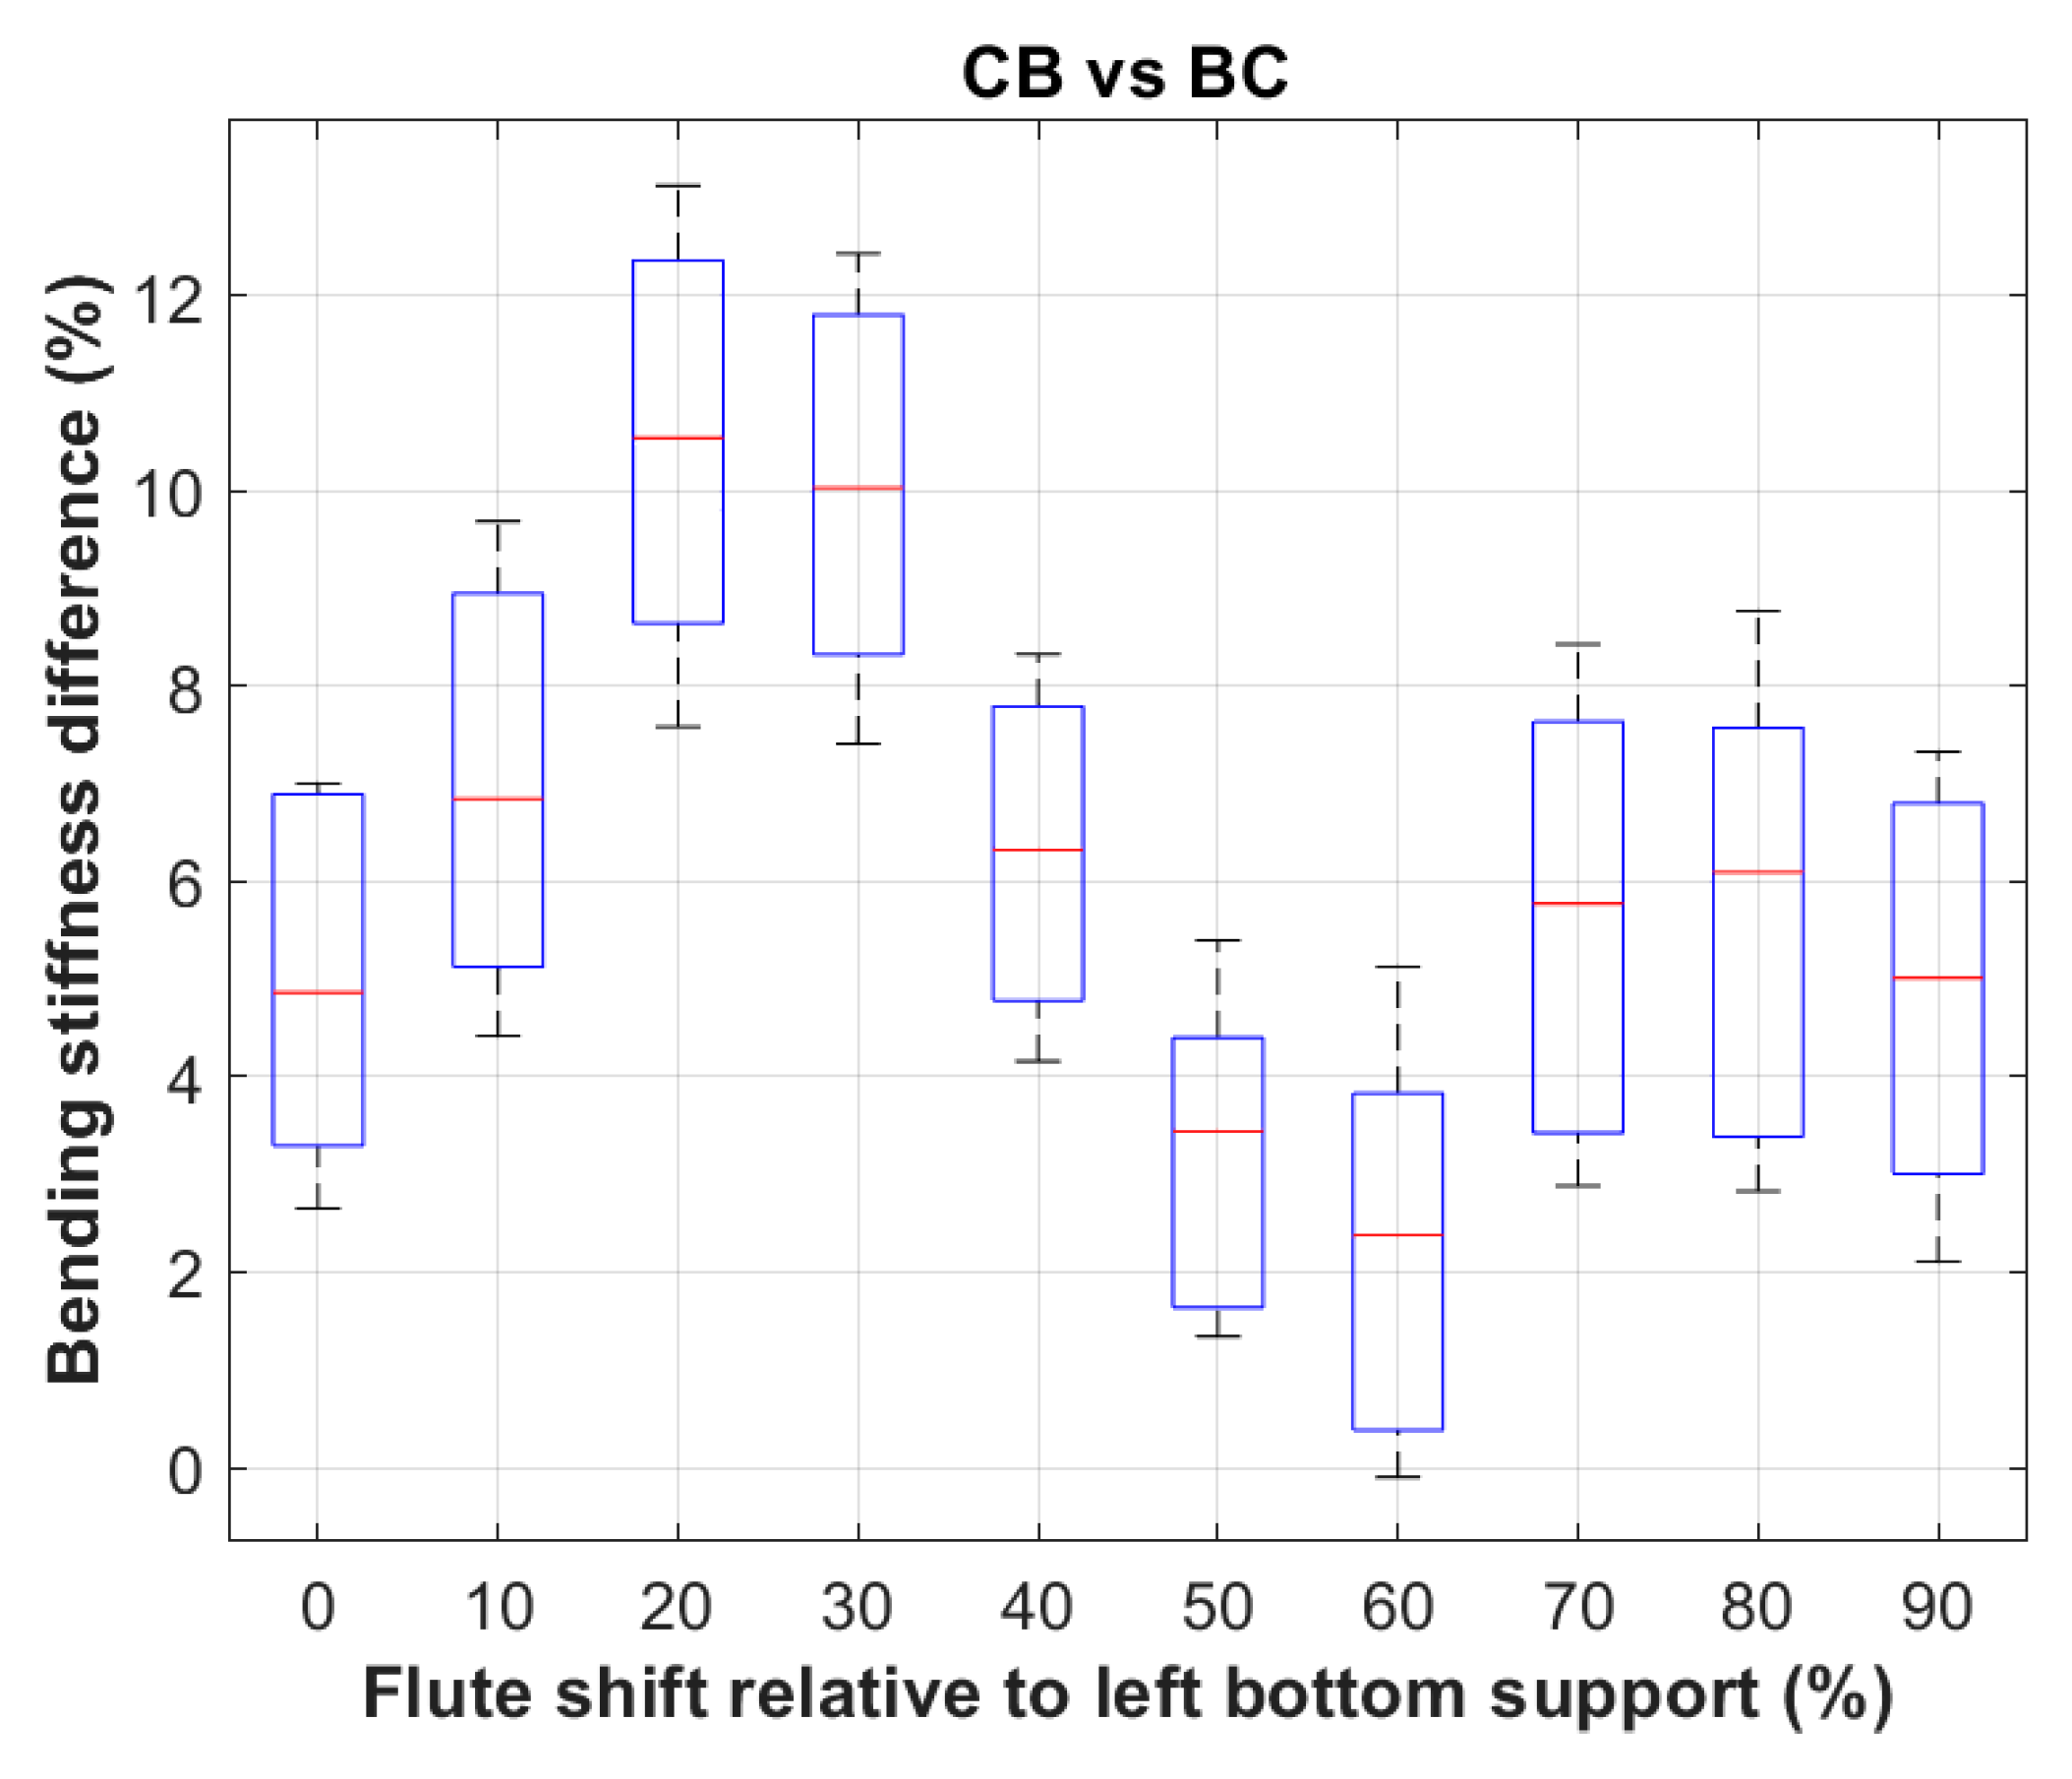
Figure 14.
Percentage difference in bending stiffness for cardboard example CE and EC.
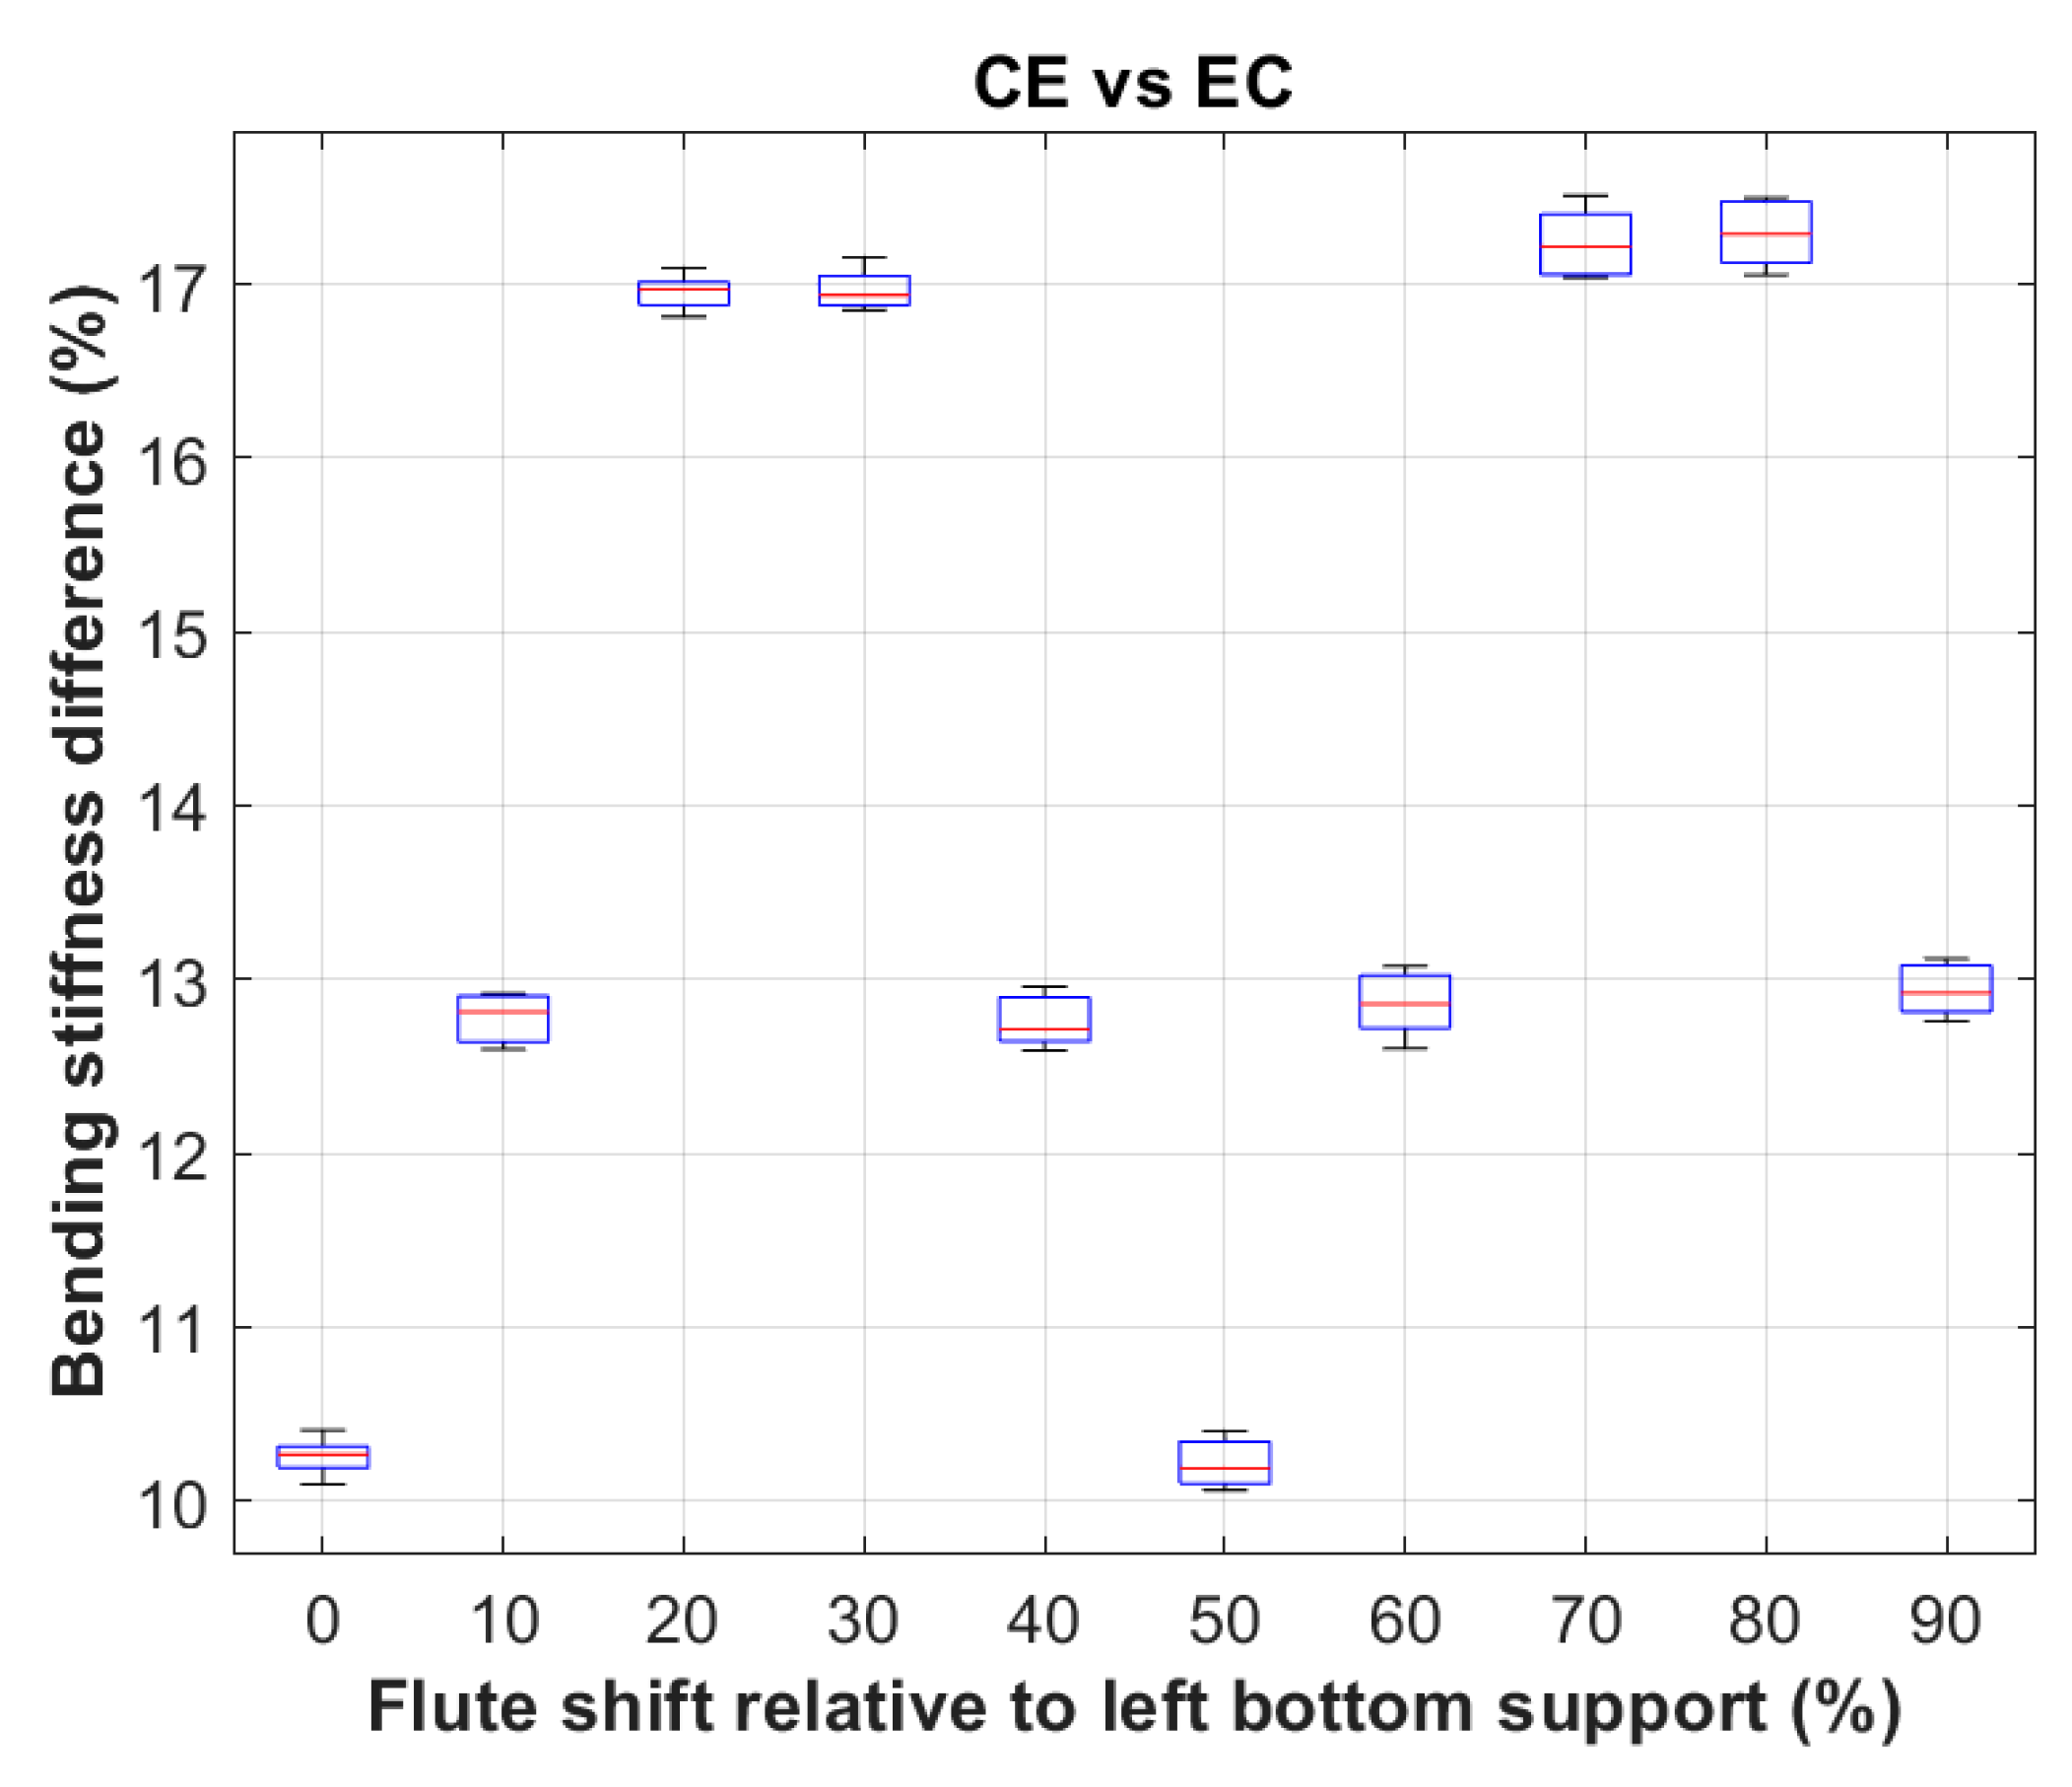
Figure 15.
Percentage difference in bending stiffness for cardboard example EE and EErev.
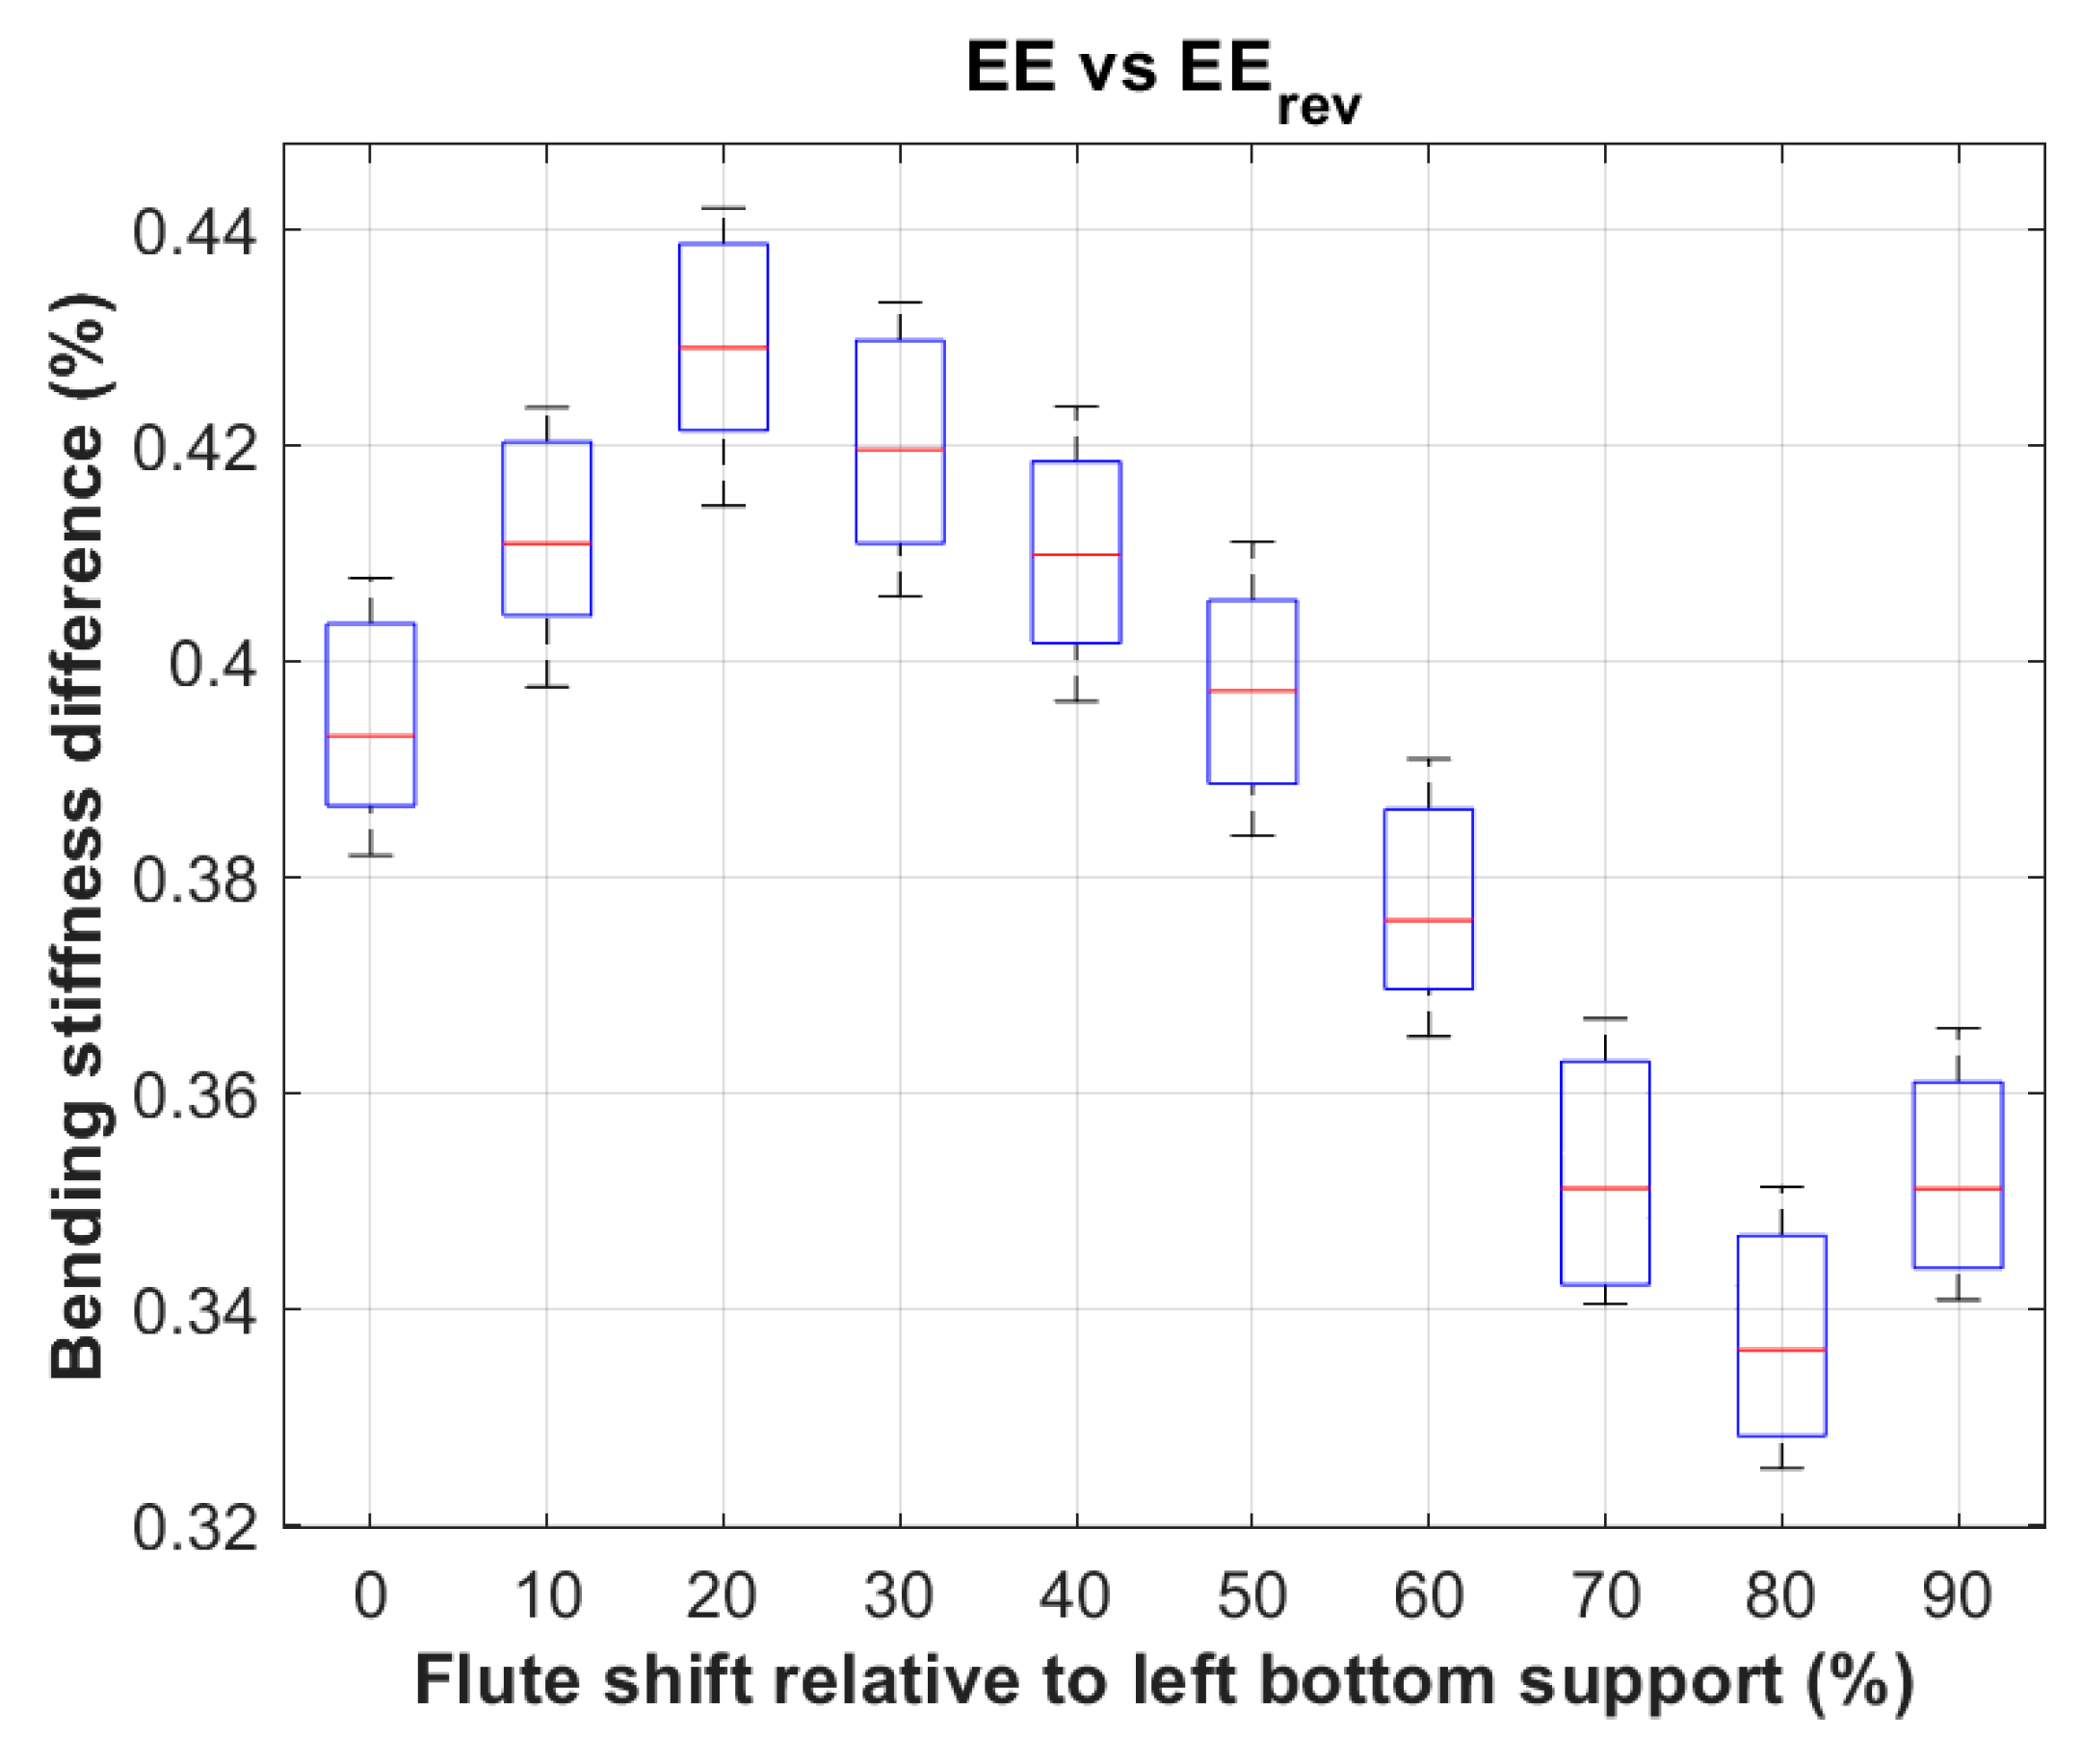

Table 1.
Geometry Data of Corrugated Cardboard Flutes.
| Flute | Wavelength (mm) | Height (mm) | Take-Up Factor (–) |
|---|---|---|---|
| B | 6.5 | 2.46 | 1.32 |
| C | 8.0 | 3.61 | 1.27 |
| E | 3.5 | 1.15 | 1.43 |
Table 2.
Corrugated Board Data.
| Corrugated Cardboard | Layer | Thickness (mm) | Young’s Modulus (MPa) | Poisson’s Ratio (–) |
|---|---|---|---|---|
| B and C | 1 | 0.195 | 5427 | 0.483 |
| 2 | 0.185 | 5538 | 0.484 | |
| 3 | 0.259 | 5684 | 0.484 | |
| EE | 1 | 0.188 | 5113 | 0.442 |
| 2 | 0.156 | 5479 | 0.468 | |
| 3 | 0.130 | 5358 | 0.414 | |
| 4 | 0.156 | 5479 | 0.468 | |
| 5 | 0.259 | 5684 | 0.484 | |
| EB and EC | 1 | 0.180 | 4906 | 0.427 |
| 2 | 0.142 | 5327 | 0.464 | |
| 3 | 0.130 | 5358 | 0.414 | |
| 4 | 0.156 | 5479 | 0.468 | |
| 5 | 0.188 | 5113 | 0.442 | |
| BC | 1 | 0.255 | 6016 | 0.456 |
| 2 | 0.197 | 5652 | 0.500 | |
| 3 | 0.126 | 5548 | 0.432 | |
| 4 | 0.202 | 5680 | 0.497 | |
| 5 | 0.260 | 5458 | 0.450 |
Table 3.
Bending Stiffnesses of all cardboards in both arrangements.
| Corrugated Board | Bending Stiffness [Nmm] | |||
|---|---|---|---|---|
| Mean value | Standard deviation | Minimum | Maximum | |
| B | 5158 | 16.8 | 5133 | 5187 |
| Brev | 5210 | 32.3 | 5167 | 5260 |
| BC | 40,672 | 1004.5 | 38,904 | 42,492 |
| CB | 38,174 | 876.9 | 36,657 | 39,923 |
| BE | 8868 | 152.8 | 8701 | 9192 |
| EB | 8490 | 18.3 | 8448 | 8527 |
| C | 10,395 | 33.9 | 10,347 | 10,441 |
| Crev | 10,802 | 108.7 | 10,656 | 10,955 |
| CE | 16,364 | 516.0 | 15,634 | 17,004 |
| EC | 14,056 | 22.1 | 14,010 | 14,100 |
| EE | 5225 | 2.3 | 5220 | 5229 |
| EErev | 5245 | 3.7 | 5237 | 5252 |
Disclaimer/Publisher’s Note: The statements, opinions and data contained in all publications are solely those of the individual author(s) and contributor(s) and not of MDPI and/or the editor(s). MDPI and/or the editor(s) disclaim responsibility for any injury to people or property resulting from any ideas, methods, instructions or products referred to in the content. |
© 2023 by the authors. Licensee MDPI, Basel, Switzerland. This article is an open access article distributed under the terms and conditions of the Creative Commons Attribution (CC BY) license (http://creativecommons.org/licenses/by/4.0/).
Copyright: This open access article is published under a Creative Commons CC BY 4.0 license, which permit the free download, distribution, and reuse, provided that the author and preprint are cited in any reuse.


