Submitted:
14 July 2023
Posted:
17 July 2023
You are already at the latest version
Abstract
The Pingbei area is the main accumulation area of oil and gas in the Xihu Sag. The phase characteristics of oil and gas in this area are complex, and the understanding of their genesis is still unclear. In this paper, based upon discussions of crude oil and natural gas geochemical data, integrated with local geological features, we discuss the sources, migration, and phase state characteristics of oil and gas in the Pingbei area of the Xihu Sag. The study results showed that the crude oil and natural gas in the Pingbei area are coal-derived and the oil and gas produced by the humic organic matter during the maturity stage. The oil and gas source correlation showed that crude oil and natural gas have good affinity with the Eocene Pinghu Formation (PF) coal-bearing source rocks. Crude oil has the characteristics of near-source accumulation and short-distance migration while natural gas is supplied from a dual source: the coal-derived hydrocarbon rocks of PH in the deep part of the study area, supplemented by the coal-derived hydrocarbon rocks of PH on the bottom of the slope, and adjacent hydrocarbon-bearing sub sag. The distribution characteristics and geochemical migration indices of hydrocarbon showed that the oil generated from the hydrocarbon source rocks of PH in the deep Pingbei area mainly migrates vertically along the fault connecting the reservoir and the source rocks to the trap, where it accumulates, while the natural gas exhibits deep and large faults that mainly migrate vertically, supplemented by its lateral migration along the composite transport system composed of faults and sandstone layers in the slope zone. The mechanisms of produced, exhausted, and geochromatographic effects (PGE), as well as evaporative fractionation (EF) and phase-controlled migration fractionation (PMF), result in the obvious discrepancy of hydrocarbon’s properties on the vertical profiles.
Keywords:
sources of oil and gas
; phases of oil and gas
; hydrocarbon geochemistry
; enrichment mechanisms
; Xihu Sag
0. Introduction
The Pingbei area is located in the north-central part of the Pinghu slope zone in Xihu Sag. After nearly three decades of oil and gas exploration, a number of oil and gas fields have been discovered, including Kongqueting (KQT), Wuyunting (WYT), Baoyunting (BYT), and Tuanjieting (TJT), indicating that the area is rich in hydrocarbon resources [1]. The discovered hydrocarbon reservoirs in Pingbei area are widely distributed, with a variety of types and large differences in the hydrocarbon abundance and properties between the reservoirs [2]. Previous studies on the geochemical characteristics of hydrocarbon in the Pingbei area have been carried out, though they have mainly focused on the characterization of the unilateral geochemical characteristics such as oil and gas origin type and maturity. There are few systematic discussions on the migration and accumulation processes revealed by oil and gas geochemical characteristics [1,3,4,5,6,7]. Through the qualitative and quantitative analysis on the hydrocarbon composition, the isotopes of the oil and gas, combined with the actual geological conditions, this study revealed the indicative significance of oil and gas accumulation on the basis of expounding the source, phase characteristics, and enrichment mechanisms of hydrocarbon, and it provides a basis for further study on oil and gas accumulation in the Pingbei area of Xihu Sag. At the same time, it theoretically guides on further expansion of exploration results in this area.
1. Geological background
Xihu Sag is the largest area an contains the richest oil and gas resources in the East China Sea Shelf Basin, which located in the northeast of,the basin (Figure 1). Xihu Sag can be divided into the western slope belt (WSB), western sub sag (WSS), central inverted belt (CIB), east sub Sag (ESB), and eastern fault belt (EFB), from west to east (Figure 1). From bottom to top, the strata developed as follows: Paleocene (E1), Eocene Bajiao ting (E2b), Baoshi (E2bs) and Pinghu (E2p) Formations, Oligocene Huagang Formation (E3h), Miocene Longjing Formation (N11l), and so on [8]. The Pingbei area is located in the middle of WSB, with an area of nearly 2000 km2, showing the characteristics of a high northeast and low southwest areas. From north to south, the KQT, Laiheting (LHT), WYT, BYT, and TJT tectonic zones [2] developed successively (Figure 1).
Several hydrocarbon source formations have been drilled and encountered in Xihu Sag, and from top to bottom, they include the Longjing Formation, Huagang Formation (HF), Pinghu Formation (PF), and Baoshi Formation. Among these, the source rocks of the Baoshi Formation are rarely drilled because of their depth, and so they are largely a seismic prediction. However, previous studies [9,10] have confirmed that the coal-bearing source rocks of PH are the main source rocks of Xihu Sag, and they were formed in a delta-limited marine sedimentary environment. The lithology is dominated by mudstone and sandstone interspersed with multiple sets of coal beds in which the coal beds are mainly distributed in WSB and the mudstone is mainly located in CIB [11,12]. At the same time, the HF is a secondary source rock which was formed in the lacustrine-delta sedimentary environment. Its lithology is also dominated by sand and mud interbedded with a small amount of thin coal seams in which the seams are mainly distributed in WSS and CIB and the mudstone is mainly distributed in the south of the WSS and CIB [12].
PH and HF are both primary source rock formations, as well as the main reservoirs. The characteristics of interbedded sand and mudstone between the two formations in the vertical direction make it possible to obtain good source–reservoir–cap assemblages in this area. In addition, as shown in Figure 1, the deep and large fault system that has developed in the Pingbei area can not only act as an oil and gas migratory channel but as an effective oil and gas accumulation space, together with the strata, under certain conditions.
The Pingbei area as a whole is rich in hydrocarbons. The oil and gas accumulations are mainly distributed in areas with developed faults. The oil and gas reservoirs are mainly located in PH of the Eocene, and the HF also has oil and gas reservoirs. The whole area presents the spread characteristics of “upper oil and lower gas” (Figure 2). There are multiple phase types of oil and gas, including normal crude oil, light oil, condensate oil, and natural gas, with condensate oil and gas dominating, indicating that the area has good prospects for light oil and gas resource exploration.
2. Sampling and methodology
2.1. Sampling locations and data collection
Thirteen natural gas samples and twelve crude oil samples were collected from oil and gas fields (KQT, WYT and TJT) in the Pingbei area. The total organic carbon (TOC) content, Rock-Eval pyrolysis, and vitrinite reflectance (% Ro) of the coal-derived source rocks from PH, as well as the crude oil physical properties (such as density, wax content, and asphaltenes), gas chromatography, mass spectrometry, and isotope data were collected from the Shanghai branch of the China National Offshore Oil Corporation (CNOOC).
2.2. Experimental methods
The molecular compositions of the gas samples were determined using an Agilent 6890N gas chromatograph equipped with a flame ionization detector and a thermal conductivity detector. The individual hydrocarbon gas components (C1-C4) were separated using a capillary column (PLOT Al2O3 50 m × 0.53 mm). The non-hydrocarbon gases were separated using two capillary columns (PLOT Molsieve 5 Å 30 m × 0.53 mm and PLOT Q 30 m × 0.53 mm). The GC oven temperature was initially set at 60 °C for 4 min, and then it was ramped to 190 °C in 10 °C/min increments. The oxygen-free correction and the corresponding correction for nitrogen were made for all the gas compositions.
The carbon isotope values were measured on a Trace GC ULTRA-MAT 253 IRMS. The gas chromatograph was equipped with a Poraplot Q capillary column (30 m × 0.25 mm × 0.25 μm), and helium was used as the carrier gas(99.999%). The gas components were separated on the gas chromatograph in a stream of helium, converted into CO2 in a combustion interface, and then injected into the mass spectrometer. The initial temperature of the injection was 35 °C, where it was kept for 6 minutes, and then it was increased to 80 °C at a heating rate of 15 °C/min, and then increased again to 200 °C at a heating rate of 5 °C/min, where it was kept for 5 min. The measurement precision was ± 0.1‰ for δ13C.
The crude oil light hydrocarbon composition analysis was completed on a Shimadzu GC-2010 gas chromatograph. The chromatographic conditions were as follows: the chromatographic column was an HP-5MS(30 m × 0.25 mm × 0.25 μm), the injection temperature was 300 °C, the carrier gas was high-purity helium(99.999%), the flow rate in the column was 1.0 mL/min, and the initial gas chromatograph temperature was 100 °C , where it was kept constant for 1 min, and then it was increased to 300 °C at a heating rate of 4 °C /min for 15~20min. Lastly, the detector was a hydrogen flame ionization detector (FID), and its temperature was 300 °C.
3. Results
3.1. Chemical compositions of the oil and gas
The density of the crude oil was between 0.75 and 0.90 g/cm3, which is the density of light-medium crude. The wax content had a wide distribution range, ranging from 0.07% to 26.81%, and it was mainly medium-high wax crude oil. The content of asphaltene was 0.17%~14.19%. In general, the physical properties of the crude oil in the north oil and gas fields of the Pingbei area were higher than those in the south (Figure 3). Moreover, as seen in Figure 3, that the density and wax content of most of the oil and gas fields that were in respectively vertical directions were characterized by shallow formations that were higher than the deep formations.
The light hydrocarbon parameters of the crude oil in the Pingbei area also showed similar vertical differences (Figure 4). Crude oil generally contains a relatively high number of cycloalkanes, its toluene/n-heptane distribution ranges from 1.10 to 6.25, with an average value of 3.77, and its n-heptane/methylcyclohexane distribution ranges from 0.23 to 0.43, with an average value of 0.28. In our study, as crude oil’s depth decreased, some WYT and KQT fields showed increases in toluene/n-heptane and decreases in n-heptane/methylcyclohexane, indicating that the shallow crude oil was relatively heavier and richer in aromatics. This phenomenon had good consistency with the density of the crude oil in this oil and gas field.
The molecular compositions of the natural gas in the Pingbei area were dominated by hydrocarbon gas. The content of hydrocarbon gas was 92.14%~99.49%, with an average value of 96.42%. The content of non-hydrocarbon gas was less, distributed between 0.45% and 7.87%, with an average value of 3.49%. The gas dryness coefficient (Dg = C1/C1-5) determines the wet and dry nature of the gas and has a positive correlation with maturity, with a Dg value of ≥95% representing dry gas and a Dg value of <95% representing wet gas[13]. The distribution of Dg was between 0.65 and 0.94, with an average value of 0.86 (Table 1), indicating that the natural gas was wet gas (Dg <0.95).
The carbon isotope ratios (δ13C) of the natural gas in the Pingbei area are generally heavier, among which δ13C1 ranges from -42.5~-33.5‰, with an average value of -36.3‰, and δ13C2 ranges from -30.9~-22.7‰, with an average value of -27.1‰ (Table 2). The overall performance for the normal carbon isotope series is as follows: δ13C1 <δ13C2 <δ13C3. Previous studies have shown that carbon isotope values and their series of characteristics can effectively identify the genesis of natural gas [14], and the isotopic characteristics of the natural gas suggested an organic origin. At the same time, it could be seen that δ13C of the natural gas in the shallow formations of most of the reservoirs in the Pingbei area (except for the T1 well in TJT) were heavier than those in the deep formations. Among them, the difference for δ13C1 in well W3 of the Wuyunting oil and gas field was the largest, which reached -7.1‰.
It could be seen that the deep and shallow formations’ crude oil and natural gas in the Pingbei area of Xihu Sag had great differences in their physical properties and chemical compositions.

Table 2.
Stable carbon isotope ratios of natural gas (δ13C/‰, PDB).
| Well | Depth/m | Formation | δ13C1 | δ13C2 | δ13C3 | δ13iC4 | δ13nC4 | δ13CO2 | Rog/% |
| K2* | 4160 | E2p | -37.1 | -22.7 | -20.8 | -19.8 | -21.7 | / | 0.9 |
| K3* | 4116 | E2p | -37.8 | -27.2 | -25.4 | -26.1 | -24.6 | / | 0.8 |
| K4 | 4190 | E2p | -35.4 | -25.7 | -24.4 | -25.4 | -24.8 | / | 0.9 |
| 4557 | E2p | -37.6 | -27.5 | -26.1 | -27.4 | -25.9 | / | 0.8 | |
| K6* | 4238 | E3h | -33.5 | -26.3 | -24.0 | -23.7 | -23.0 | -5.2 | 1.0 |
| 4818 | E2p | -33.6 | -28.4 | -27.1 | -22.7 | -22.7 | -5.6 | 1.0 | |
| K7 | 4121 | E2p | -34.6 | -25.3 | -24.5 | -26.8 | -25.4 | -10.6 | 1.0 |
| W3 | 4371 | E2p | -33.9 | -25.3 | -24.2 | -25.8 | -24.8 | -5.9 | 1.0 |
| 4600 | E2p | -41.0 | -28.6 | -26.1 | / | / | -4.8 | 0.7 | |
| W4* | 3532 | E2p | -35.2 | -26.7 | -24.5 | -25.1 | -23.7 | -6.6 | 1.0 |
| 3537 | E2p | -35.4 | -26.9 | -24.7 | -25.3 | -24.2 | -7.1 | 0.9 | |
| 3614 | E2p | -35.6 | -26.7 | -24.6 | -25.4 | -23.8 | -8.8 | 0.9 | |
| 3641 | E2p | -36.2 | -26.0 | -23.7 | -24.8 | -23.0 | -9.4 | 0.9 | |
| 3740 | E2p | -36.6 | -28.5 | -25.9 | -27.0 | -24.7 | -9.8 | 0.9 | |
| 3744 | E2p | -37.1 | -26.3 | -23.7 | -24.8 | -23.0 | -7.3 | 0.9 | |
| 3760 | E2p | -36.4 | -25.9 | -23.3 | -24.3 | -22.6 | -9.4 | 0.9 | |
| 3780 | E2p | -37.1 | / | / | / | / | / | 0.9 | |
| 4050 | E2p | -39.9 | -29.5 | -27.3 | -28.7 | -26.2 | -10.6 | 0.8 | |
| 4056 | E2p | -39.9 | -29.5 | -27.4 | -28.9 | -26.1 | -10.6 | 0.8 | |
| B1 | 3774 | E2p | -34.3 | -27.4 | -27.4 | / | -27.1 | -18.9 | 1.0 |
| 3955 | E2p | -35.0 | -30.9 | -27.8 | / | -26.3 | -19.8 | 1.0 | |
| B2 | 3455 | E2p | -33.7 | -26.7 | -22.1 | / | -30.1 | -15.6 | 1.0 |
| 3773 | E2p | -34.7 | -27.1 | -25.7 | / | -24.9 | -17.3 | 1.0 | |
| T1* | 2848 | E3h | -42.5 | -27.4 | -25.8 | -26.9 | -25.3 | -6.7 | 0.7 |
| 3233 | E2p | -37.2 | -27.4 | -26.2 | -27.5 | -25.3 | -7.0 | 0.9 | |
| 3314 | E2p | -35.5 | -27.3 | -26.2 | -27.3 | -25.2 | -7.7 | 0.9 | |
| T2 | 3510 | E2p | -36.0 | -27.4 | -26.3 | -27.6 | -25.7 | / | 0.9 |
| 3780 | E2p | -36.2 | -27.5 | -26.2 | -27.4 | -25.4 | / | 0.9 |
3.2. Genesis of oil and gas
Hu Tilin et al. [15] compared the geochemistry characteristics of source rock adsorbed hydrocarbons and natural gas light hydrocarbons and found that the C7 series of compounds could be used as a good index for identifying the genetic types of oil and gas. As shown in Figure 5, we could see that the content of methyl cyclohexane (MCyC6) in the Pingbei crude oil samples was absolutely dominant, with values of between 55% and 69%. The contents of dimethyl cyclopentane (DMCyC5) and n-heptane (nC7) were relatively low, with values ranging from 15%~26% and 16~25%, respectively. The results showed that the source rocks’ deposition environments were swamp facies and shallow lake facies, and their type was humic organic matter (III). Previous studies have shown [1] that the crude oil in the Pingbei area of Xihu Sag had high ratios of pristane to phytane (Pr/Ph of 3.6~8.2), and the C29 steranes in the C27, C28, and C29 regular steranes were relatively dominant, as were the distribution characteristics of diterpenoids, oleanane, and retene, which represented the source of the high terrestrial plants. The characteristics of the above biomarkers were consistent with the source rocks’ deposition environments and type revealed by the light hydrocarbons, indicating that crude oil was formed in a highly oxidized lacustrine and swamp sedimentary environment, it was formed by humic organic matter.
The carbon isotope of methane (δ13C1) and the carbon isotope of ethane (δ13C2) are often used as indicators to identify the genetic type of natural gas. For example, δ13C1 <-55‰ indicates biogenic gas, its opposite indicates pyrolysis gas (where -55‰ <δ13C1 <-48‰ indicates biogenic-thermal catalytic transition zone gas), and δ13C2 <-29‰ indicates oil-type gas, and all others indicate coal-type gas [16,17]. As shown in Figure 6, the natural gas samples in the study area were mainly located in the coal-type gas area, and few fell into the oil-type gas area, show that the natural gas was mainly generated by humic organic matter.
3.3. Maturity of oil and gas
Mango [18] found that the ratios of the absolute concentrations of four isoheptane compounds in petroleum (2-methylhexane, denoted 2-MH; 2,3-dimethylpentane, denoted 2,3-DMP; 3-methylhexane, denoted 3-MH; and 2,4-dimethylpentane, denoted 2,4-DMP) showed striking invariance, and they could be expressed in terms of the light hydrocarbon parameter as K1 = (2-MH + 2,3-DMP)/(3-MH + 2,4-DMP).
Mango [19] also found that the ratio of 2,4-dimethylpentane (2,4-DMP) to 2,3-dimethylpentane (2,3-DMP) only had a good correlation with temperature, and it had nothing to do with the type of kerogen and the accumulation time. On this basis, the calculation formula for the maximum temperature (T) for hydrocarbon formation was proposed as follows: T = 140 + 15 ln(2,4-DMP/2,3-DMP). We further deduced that the corresponding vitrinite reflectance (RoK) could be calculated as follows: RoK = 0.0123T - 0.6764. The results of the sample calculations for the study area are shown in Table 3, and it can be seen that the distribution of the K1 values (K1 = (2-MH + 2,3-DMP)/(3-MH + 2,4-DMP)) for the different crude oil samples from the Pingbei region were relatively stable, ranging from 1.13 to 1.23, with an average value of 1.18, which was largely in line with the steady-state catalysis theory of light hydrocarbons. This average value was higher than the K1 value that Mango thought should be a stable constant (1). The reason may be related to the strong oxidizing sedimentary environment during the deposition of the organic matter, and this was confirmed by Wang Xiang et al. [20] in their study on the geochemical characteristics of the light hydrocarbon of the crude oil in Tarim Basin and Turpan-Hami Basin. Table 3 shows that the vitrinite reflectance (RoK) of the crude oil was between 0.8% and 1.0%, with an average value of 0.9% (which belongs to mature crude oil).
Radke [21] found that the methylphenanthrene index (MPI 1 = 1.5(2-MP + 3-MP)/(P + 1-MP + 9-MP)) had a good correlation with the vitrinite reflectance of the source rocks and crude oil, and they proposed corresponding calculation formulas as follows: RoP = 0.4 + 0.6 MPI 1(RoP : 0.55~1.40) and RoP = 2.6 - 0.6 MPI 1 (RoP : 1.45~2.20). The crude oil methylphenanthrene index (MPI 1) for the Pingbei area is distributed between 0.66 and 1.26, and the average value is 0.99. With reference to the above-mentioned maturity of crude oil obtained from the light hydrocarbons, the previous formula was used to calculate the vitrinite reflectance (Ro), which ranged from 0.8% to 1.2%, with an average value of 1.0%, indicating that the crude oil in the study area was mainly in the mature stage, which was largely consistent with the maturity of the crude oil reflected by the light hydrocarbon. This confirmed that the crude oil would have been formed by humic organic matter in the mature stage.
Table 3.
Crude oil maturity in the Pingbei area.
| Well | Depth/m | Formation | K1 | T/℃ | RoK/% | MPI1 | RoP/% |
|---|---|---|---|---|---|---|---|
| K2* | 4160 | E2p | 1.20 | 123.14 | 0.8 | 0.84 | 0.9 |
| K3* | 4116 | E2p | 1.18 | 130.24 | 0.9 | 1.02 | 1.0 |
| 4195 | E2p | 1.17 | 130.91 | 0.9 | 1.01 | 1.0 | |
| K4* | 4190 | E2p | 1.18 | 130.69 | 0.9 | 0.97 | 1.0 |
| 4557 | E2p | 1.23 | 126.22 | 0.9 | 0.71 | 0.8 | |
| K5 | 4321 | E2p | 1.18 | 130.97 | 0.9 | 1.04 | 1.0 |
| W3 | 4371 | E2p | 1.19 | 131.08 | 0.9 | 1.15 | 1.1 |
| 4600 | E2p | 1.17 | 132.39 | 1.0 | 1.00 | 1.0 | |
| W4* | 3475 | E2p | 1.20 | 130.62 | 0.9 | 0.98 | 1.0 |
| 3532 | E2p | 1.19 | 131.22 | 0.9 | 1.09 | 1.1 | |
| 3537 | E2p | 1.18 | 130.13 | 0.9 | 1.09 | 1.1 | |
| 3546 | E2p | 1.17 | 130.66 | 0.9 | 1.03 | 1.0 | |
| 3614 | E2p | 1.19 | 129.18 | 0.9 | 1.10 | 1.1 | |
| 3641 | E2p | 1.19 | 129.72 | 0.9 | 0.97 | 1.0 | |
| 3744 | E2p | 1.20 | 129.97 | 0.9 | 1.03 | 1.0 | |
| 3760 | E2p | 1.18 | 131.22 | 0.9 | 1.09 | 1.1 | |
| 3780 | E2p | 1.01 | 135.03 | 1.0 | 1.25 | 1.1 | |
| B1 | 3955 | E2p | 1.13 | 133.57 | 1.0 | 1.02 | 1.0 |
| T1* | 2848 | E3h | 1.19 | 130.81 | 0.9 | 0.74 | 0.8 |
| 3233 | E2p | 1.19 | 130.34 | 0.9 | 0.82 | 0.9 | |
| T2* | 3314 | E2p | 1.19 | 128.16 | 0.9 | 0.66 | 0.8 |
| 3510 | E2p | 1.18 | 130.81 | 0.9 | 1.26 | 1.2 | |
| 3780 | E2p | 1.18 | 130.63 | 0.9 | 1.00 | 1.0 |
* experimental data, and the rest of the wells’ data were collected from the CNOOC’s Shanghai Branch.
In view of the research on the maturity of the natural gas in Xihu Sag, predecessor studies [22,23] have analyzed that calculation methods such as light hydrocarbon parameters (δ13C2-δ13C1, δ13C3-δ13C1, etc.) are not suitable for Xihu Sag. On this basis, in reviewing various studies that compared calculation methods, we found that Liu Wenhui et al. [24] proposed a two-stage fractionation model and calculation method for δ13C1 and Ro based on studying the isotope characteristics of coal-type gas and the source rock evolution degree in coal-bearing basins in China, and these were more suitable for Xihu Sag. The results are shown in Table 2, where it can be seen that the maturity of the natural gas (Rog) in the study area was distributed between 0.7% and 1.0%, with an average value of 0.9%, which indicated a mature natural gas.
4. Discussion
4.1. Origin of oil and gas
4.1.1. Geochemical characteristics of source rocks
As mentioned above, the Huagang Formation and PH are currently the most important hydrocarbon-generating strata in Xihu Sag. The analysis of the Rock-Eval parameters and TOC showed that the hydrocarbon generation potential of PH source rocks in Xihu Sag is generally higher than that of HF source rocks. The source rocks of PH were fair-to-good was mainly based TOC, and the main type was II–Ⅲ. HF was dominated by poor–fair source rocks, which were still largely type Ⅱ–Ⅲ. Meanwhile, we found that the organic matter types of the coal and carbonaceous mudstone in the two sets of source rocks were better—primarily type II1–II2—while the mudstone was mainly type III, which was relatively poor (Figure 7) [13,23]. In summary, it was shown that the coal-measure source rocks in Xihu Sag were mainly gas-generating, supplemented by oil-generating, and the oil generation potential of coal and carbonaceous mudstone is higher than that of dark mudstone.
As shown in Figure 8A, this study counted the vitrinite reflectance (Ro) data of the source rocks in the Pingbei area of Xihu Sag. It could be seen that the Pingbei area entered the hydrocarbon generation threshold at approximately 2800 m, and a large amount of hydrocarbon generation and expulsion began at approximately 4000 m. At the same time, it could be seen that the source rocks of the Huagang Formation in the Pingbei area of Xihu Sag were generally in the immature to low-mature stage, and the source rocks of PH were located inside the oil generation window as a whole and were in the low-mature to medium-mature stage. The basin simulation results showed that most of the source rocks at the bottom of PH in Xihu Sag were in the over-mature stage (Figure 8B) [25]. Hence, combined with the measured vitrinite reflectance (Ro), it could be inferred that the source rock at the bottom of PH in the Pingbei area would be at a high mature stage as a whole. In summary, the coal-measure source rocks in the Pingbei area of Xihu Sag could provide sufficient material support for hydrocarbon accumulation in the study area.
4.1.2. Oil and gas source correlations
Erdman et al. [26] proposed that the C4-C10 series of light hydrocarbon compounds could be used as fingerprint parameters for oil–source correlations. In this study, the C6-C7 series of light hydrocarbon compounds were selected to analyze the oil sources in the Pingbei area. As shown in Figure 9, it could be seen that the crude oils from the different oil and gas fields were well correlated, indicating that the crude oil could have the same source.
The carbon isotopes of the crude oil (δ13Coil) and its components in the Pingbei area were generally heavy. The δ13Coil was distributed between -27.3‰ and -24.8‰ while the δ13C of each component was between -29.7‰ and -24.1‰ (Table 4). Since the carbon isotope compositions of crude oil components have good maternal organic matter inheritance effects, they are often used as indicators of oil–source correlations [27,28]. As shown in Figure 10, the crude oil samples were mainly located in the source rock distribution area of PH. Combining the maturity characteristics of the crude oil reflected by the light hydrocarbons and aromatic hydrocarbon compounds, as well as by the distribution and the geochemistry of the coal measure source rocks in Xihu Sag, it was confirmed that the crude oil could have derived from the local PH coal-measure source rock, and it had a higher affinity with PH coal and carbonaceous mudstone.
Previous studies have shown that the natural gas maturity (Rog) of the Pingbei area is distributed between 0.7% and 1.0%. As mentioned above, the source rocks of PH in situ were in the mature to high-mature stage, and their products were mainly natural gas (supplemented by crude oil). The western subconcave hydrocarbon source rocks in WSS were in the high-to-overmature stage (Figure 8), and their products were mainly natural gas. Therefore, it was believed that the natural gas in the study area should mainly have come from PH coal measure source rocks of the in situ area and the adjacent area. Overall, the hydrocarbons in the region could be divided into mature stage hydrocarbons and high-to-overmature stage gas, according to their stage of thermal evolution.
4.2. Analysis of oil and gas migration and accumulation
Thompson [29] injected excessive dry gas into normal crude oil under high-temperature and high-pressure. When the gas–liquid equilibrium was reached and the gas phase was stripped, the light components of the oil were dissolved and taken away, and the aromatics, wax, and asphaltene were relatively enriched in residual oil. They cyclically collected gas phase products at different equilibrium stages and analyzed their geochemical characteristics, and they proposed that “evaporative fractionation” (EF) can be used as a formation mechanism of condensate. They further proposed that this mechanism leads to a decrease in oil and gas density and wax content, with the direction of transport of the highly mature gas. Fu Ning [10] and Tang Youjun [30] believed that EF generally existed in Xihu Sag, except for wells K4, K6, B1, and B3 in the Pingbei area, which were characterized by low shallow physical properties and high gas maturity, and other areas with low shallow physical properties, such as TJT and B2, also showed low gas maturity (Figure 11). This contradicted the characteristics of the reservoir formed by EF. In their studies on the formation and transport of hydrocarbons, the authors of [31,32,33] found that the effects of hydrocarbons produced-exhausted and geochromatographic (PGF) can lead to a decrease in the physical properties of hydrocarbons and the maturity of natural gas as the depth becomes shallower. The reason for the differential distribution of hydrocarbons in TJT and B2 was likely due to the effects of different maturity hydrocarbons and geochromatographics during the transport of hydrocarbons from the same source to the shallow parts, which was characterized by decreases in the density and wax content of the oil, the maturity, and Dg as the depth decreased.
There was also a category of relatively shallow reservoirs with high physical properties in the area related to the reason for the increase in waxy hydrocarbon content in the crude oil. Huang Difan et al. [34] concluded that on the one hand, it was related to the maternal organic matter of the oil source rocks, i.e., the crude oil produced by the higher terrestrial plants generally contained higher wax content, as well as bacteria and algae, which can also be produced a certain content of waxy hydrocarbons; on the other hand, during oil testing, the decrease in temperature around the wellbore and the circulation of the mud during the drilling process would have caused the loss in light components in the oil layer, resulting in the high wax content in the crude oil. In addition, gas invasion and evaporation can also cause the enrichment of waxy hydrocarbons in residual oil. Larter et al. [35] used phase-controlled migration and fractionation (PMF) simulation experiments to prove that the low-density single-phase condensate oil saturated with dissolved gas in the deep layer migrates to the shallow and reaches two-phase equilibrium with the decreases in temperature and pressure. Part of the medium-high molecular weight liquid hydrocarbons are precipitated, which leads to an increase in the density and wax content of shallow crude oil. As mentioned above, the maturity of crude oil was moderately low (Ro: 0.8% to 1.2%), and it had all derived from the local PH coal-measure source rocks. Since the parent organic matter of this set of source rocks was dominated by terrestrial higher plants, it would naturally form high-wax crude oil. However, the source rock was obviously not the cause of the distribution characteristics of the special crude oil in the deep and shallow layers in the oil and gas fields such as WYT. The main controlling factors that could have led to the complex distribution of the crude oil properties in this area may be the migration and fractionation during the formation of the reservoirs and the modification after it had formed.
Predecessor have conducted a large number of studies on the history of hydrocarbon generation and expulsion from source rocks in Xihu Sag [36,37,38] and the history of hydrocarbon charging [37,38,39]. They have confirmed that there were at least two periods of hydrocarbon charging in the Pingbei area of Xihu Sag. The early stage was dominated by oil (approximately 16 Ma to 10 Ma), and the late stage was dominated by gas-dominated mixed hydrocarbons (approximately 5 Ma to date). This stage was the main accumulation period of the study area. In Figure 11, we can see that the difference in the distribution of the physical properties of the deep and shallow oil in WYT was likely due to the fact that as the early gas-bearing reservoir was transported to the shallow part, medium- and high-saturated hydrocarbons precipitated out as the pressure dropped, and under the effect of PMF, this would have led to increases in the density and wax content.
The composition of natural gas contains rich geochemical information. The differences in the chemical properties between isobutane and n-butane often lead to the tendency toward "isobutylation" in the migration process of natural gas. Therefore, other researchers have often used iC4/nC4 as a natural gas migration index [40,41]. In addition, since methane (CH4) has stronger permeation and diffusion abilities compared with ethane (C2H6) and propane (C3H8), the value of C1/C2+3 gradually increases along the migration direction, and so other researchers have also commonly used C1/C2+3 to consider the migration process of natural gas [40,41]. The change in the natural gas migration index in the Pingbei area is shown in Figure 12. It can be seen that from deep to shallow, the values of the iC4/nC4 and C1/C2+3 gradually increase, revealing the characteristics of the gas migration primarily in the vertical direction in the Pingbei area. In addition, wells K4–K6 at KQT, W3–W4 at WYT, and B1–B3 at BYT showed lateral transport features.
As previously mentioned, the δ13C1 and Dg of the hydrocarbon reservoirs in the Pingbei area (except TJT) are generally heavier in the shallow areas than in the deep areas along the dip of slope (Figure 13). Because these reservoirs belong to late-stage accumulations, the thermal evolution of the source rocks within the slope has not reached the high maturity stage and cannot provide natural gas with high maturity (heavier δ13C1 and higher Dg). The late-stage gas in the area would have been transported from gas formed from highly mature hydrocarbon source rocks in the deep sub-concave to the east along the reservoir of the fracture and slope, thus creating the characteristic of a shallow slope with a heavier δ13C1 and a higher Dg than the deeper inner part. The authors of [41] believed that the δ13C of natural gas undergoes a certain degree of fractionation during the migration process, resulting in the gradual lightening of the δ13C along the migration direction. The TJT hydrocarbons were judged to be vertically transported according to the transport parameters. As the depth decreased, they showed the characteristics of a lighter δ13C1 and a lower Dg, and the carbon isotope changes were consistent with the characteristics of the transport fractionation. At the same time, the Ro, δ13C1, and Dg of the natural gas along the transport direction became smaller due to the effects of hydrocarbon source rock thermal evolution and hydrocarbon exhaustion. This indicated that the differences in the TJT hydrocarbons were mainly controlled by the production-exhaustion effects. The characteristic where hydrocarbons are transported laterally on slopes and vertically at depth is also supported by the actual geological conditions, and researches [2,42] have shown that in the early depositional stage of PH, the fault activity was strong, the fault-controlling strata developed obviously, and the sand body connectivity was generally poor. Therefore, deep natural gas primarily migrates vertically along faults, creating the characteristics of the “deep, scattered and small” oil and gas reservoirs that are found in the Pingbei area today. From the late PH to HF, the fault activity became weaker, and the faults no longer obviously controlled the development of the strata. At the same time, with the decrease in sea level and the advancing of the rivers toward the sea, the sand bodies were widely developed and had good lateral connectivity, which could be used as a good channel for the lateral migration of gas. In addition, due to the large burial depth and the adjacent hydrocarbon generation sub-sag in the lower part of the study area, the source rocks had generally entered a high-maturity stage, and the hydrocarbon supply conditions were more favorable. Hence, through the above analysis of the natural gas composition and isotopic distribution characteristics in the Pingbei area of Xihu Sag, it was shown that the natural gas in the study area mainly migrated vertically and was supplemented by lateral migration.
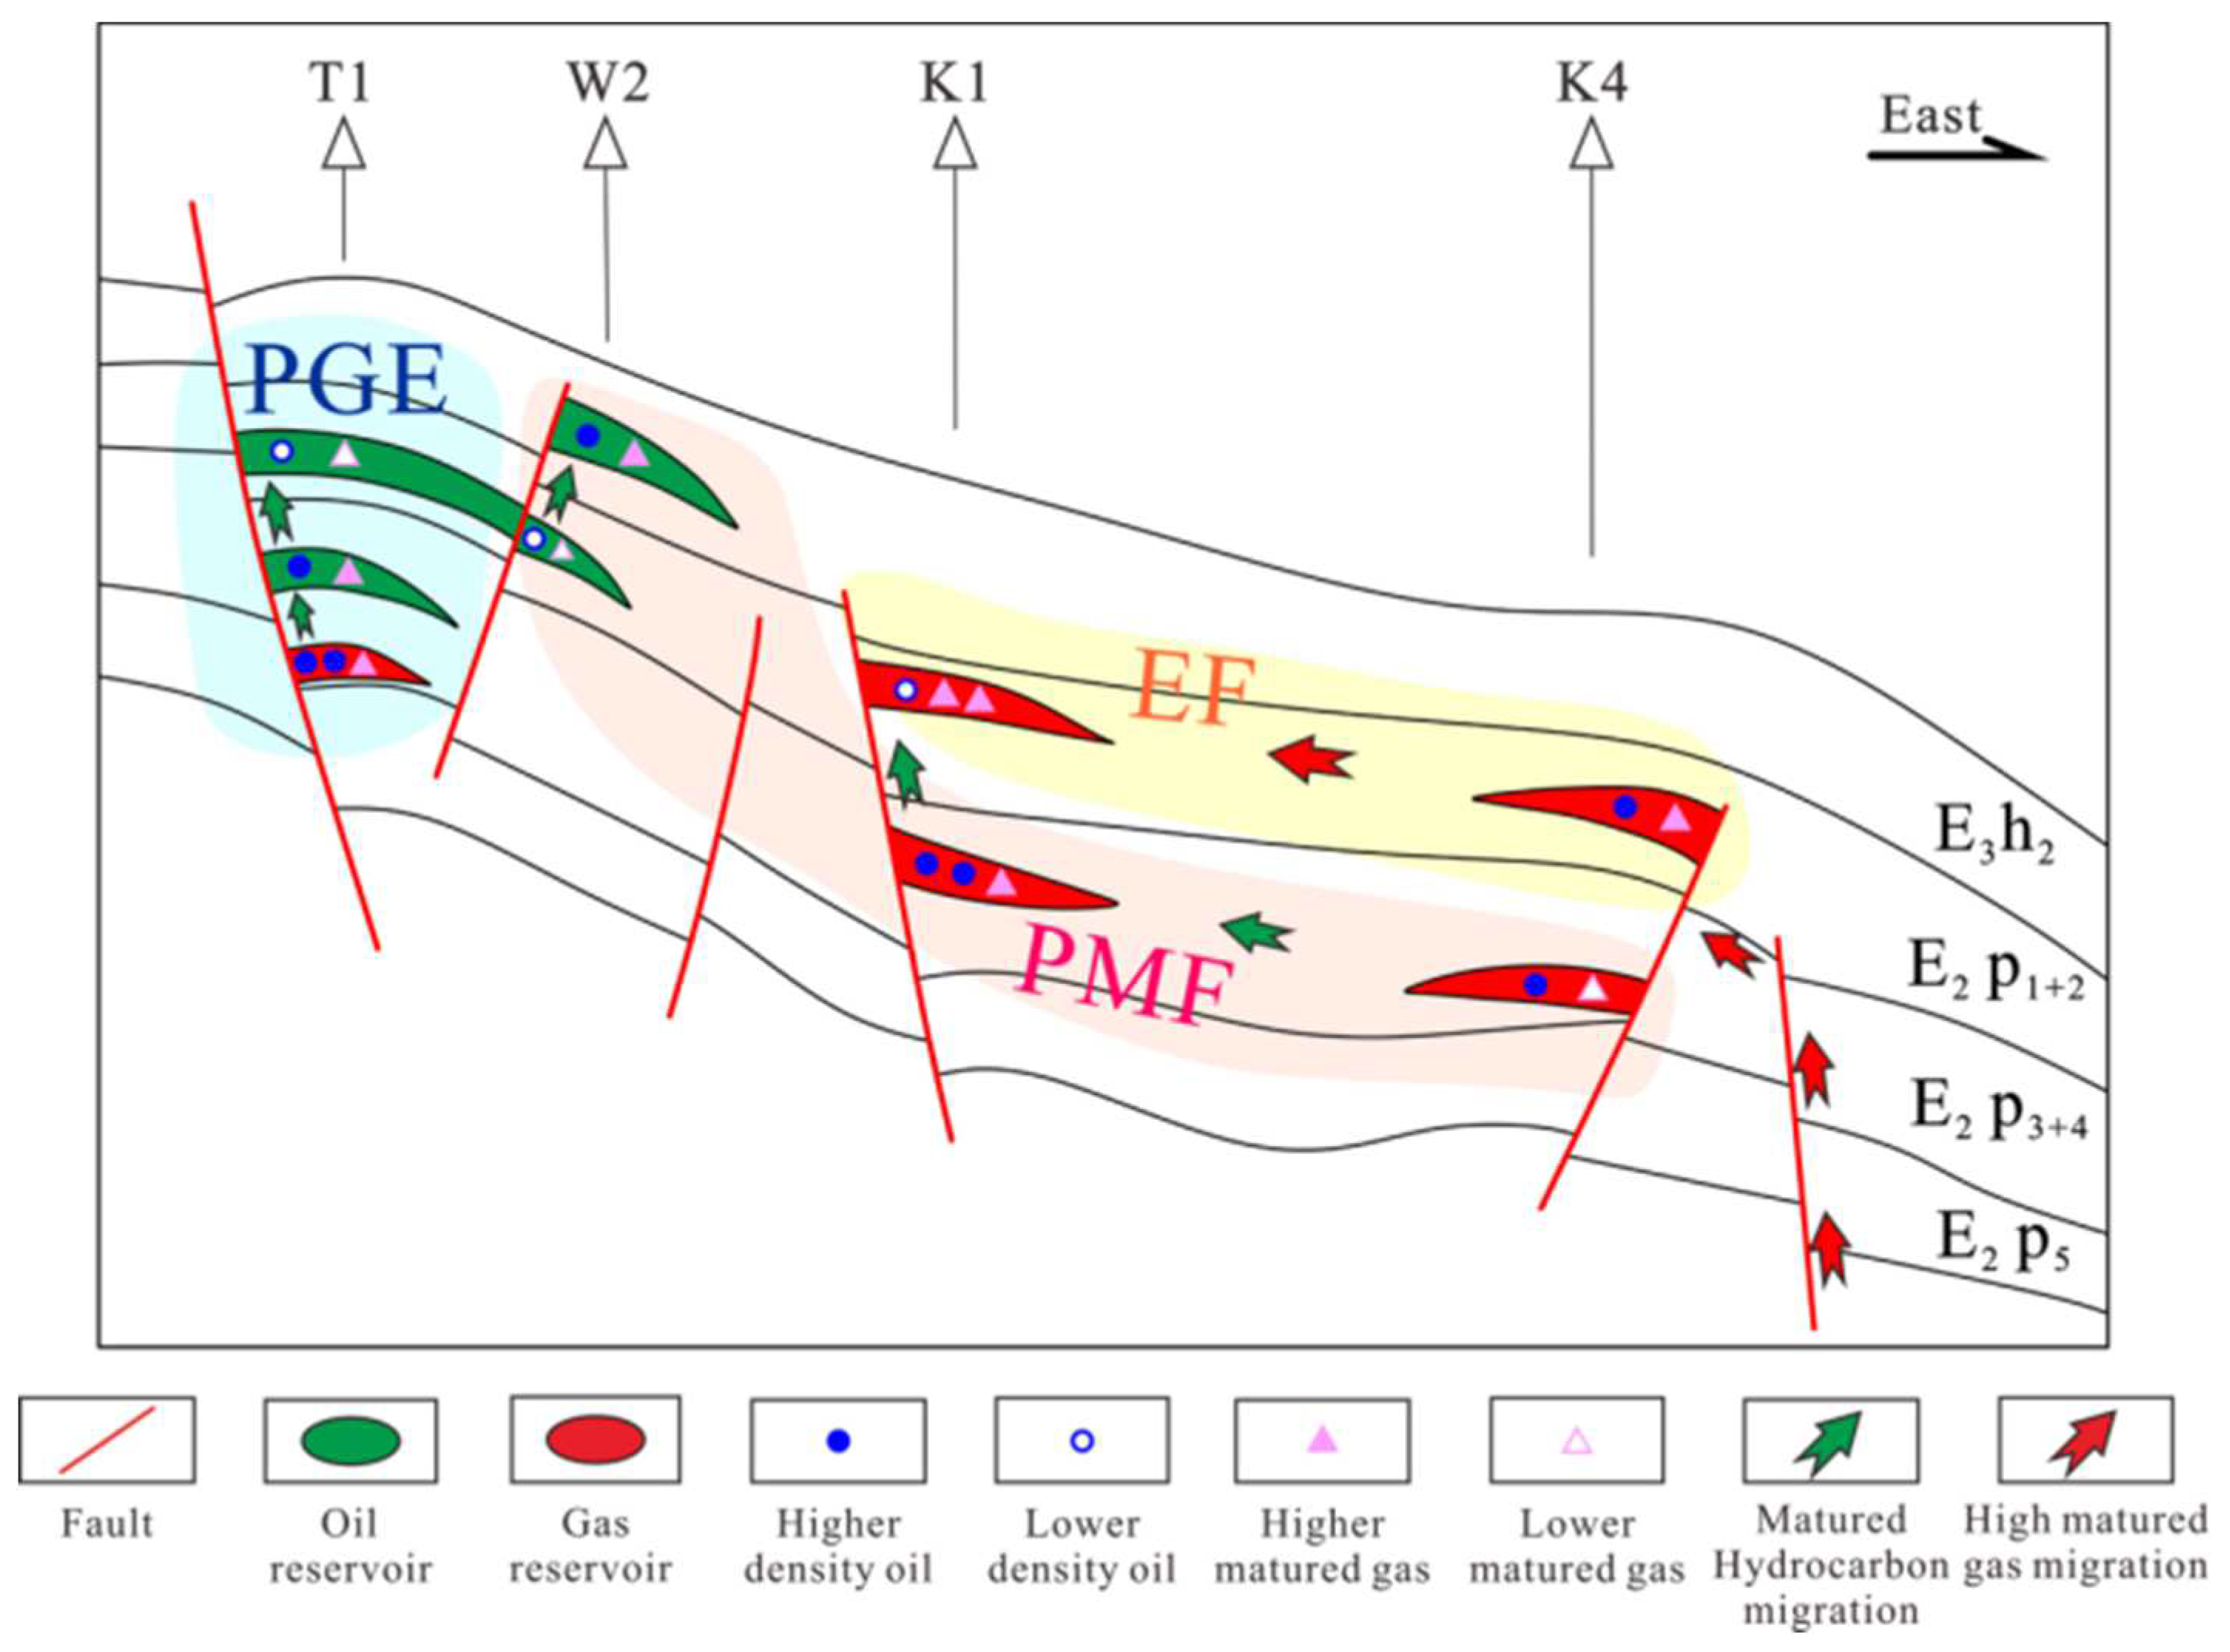
In summary, there are three mechanisms controlling the genesis of the complex hydrocarbon phase states in the Pingbei area of Xihu Sag. (1) The PGE leads to the shallow hydrocarbon characteristics of density, wax content, δ13C1, and maturity that are less than deep. These hydrocarbons are mainly distributed in the southeast and characterized by vertical transport, as represented by T1 and B2. (2) The EF has formed the shallow hydrocarbon characteristics of density and wax content that are less than deep and the gas characteristics of maturity that are higher than deep. These hydrocarbons are mainly distributed in the west and characterized by the lateral charging of high mature gas deep in the adjacent area, as represented by K4. (3) The PMF leads to the shallow hydrocarbon characteristics of density, wax content, and gas maturity that are higher than deep. These hydrocarbons are mainly distributed in the middle to north, the hydrocarbon transport is dominated vertically and supplemented laterally, as represented by K1 and W2. Meanwhile, many hydrocarbon reservoirs are influenced by multiple mechanisms together, such as how B1–B3 are influenced by PMF in the longitudinal variation and EF in the lateral direction and the deep part of W4 is influenced by PMF and its shallow part is influenced by EF. Primary hydrocarbon reservoirs are formed under the action of PGE and modified hydrocarbon reservoirs are formed under the action of EF and PMF. PGE formed the primary hydrocarbon reservoir and EF and PMF formed the modified hydrocarbon reservoir.
Figure 14.
Control mechanism of the hydrocarbon differential accumulation in the Pingbei area. PGE, production-exhaustion and geochromatographic effects; EF, evaporative fractionation; PMF, phase-controlled migration fractionation.
Figure 14.
Control mechanism of the hydrocarbon differential accumulation in the Pingbei area. PGE, production-exhaustion and geochromatographic effects; EF, evaporative fractionation; PMF, phase-controlled migration fractionation.
5. Conclusions
The density and wax of the shallow crude oil in the Pingbei area are generally greater than those of the deep crude oil, and the overall characteristics of the oil are rich in light aromatics and naphthenes. Natural gas is mainly wet gas, and the stable carbon isotope (δ13C) value is generally heavier, with most of it showing the characteristics of the shallow part as heavier than the deep part. The crude oil C7 series compounded, and the natural gas stable carbon isotope (δ13C) indicated that the oil and gas in the Pingbei area were coal-derived oil and gas formed by humic organic matter. The oil maturity and gas maturity were roughly the same, with the Ro distributed between 0.8% and 1.2%, which was formed after the humic organic matter entered the mature stage.
The distribution characteristics of the C6–C7 series of the light hydrocarbon compounds revealed that the crude oil in the Pingbei area had the same source, and through the correlation of the carbon isotope of the components of the crude oil family with the carbon isotope of the source rock extract, it was found that the crude oil in the Pingbei area mainly came from the local coal-measure source rocks of PH. The gas source correlation results showed that the natural gas in the study area would mainly have come from PH coal-measure source rocks deep in the Pingbei area.
The analysis of hydrocarbons migration and accumulation in the Pingbei area showed that the crude oil generated from the source rocks of the deep PH in the Pingbei area mainly migrated vertically along the source fault. The natural gas presented the characteristics of a dual-source hydrocarbon supply. The natural gas generated from the source rock of PH in the deep part of the study area migrated vertically along the deep fault, supplemented by the natural gas generated from the source rock of PH in the lower part of the slope and adjacent to the hydrocarbon-generating sub-sag that migrated laterally along the fault–sandstone composite pathway system to the up-dip direction of the slope.
During the process of hydrocarbon transport and accumulation, the combined effects of PGE, EF, and PMF formed the present complex hydrocarbon reservoir distribution pattern, resulting in the differences in the hydrocarbon density, wax content, carbon isotope and maturity.
Author Contributions
The contributions to this manuscript are divided as follows. Writing—original draft preparation, W.L.; Writing—editing, K.L. and J.C.; Methodology, J.C; Experiments, R.F. and T.Z.; Supervision, C.C. and X.C.; Investigation, Y.W.; Data curation, X.Z. and L.H. All authors have read and agreed to the published version of the manuscript.
Funding
This research was funded by the National Science and Technology Major Project of China, grant number 2016ZX05027-001-004; the Education Science and Technology Foundation of Gansu Province, grant number 2022QB-146 and the Tianshui Normal University Foundation, grant number CXJ2020-27.
Institutional Review Board Statement
Not applicable.
Informed Consent Statement
Not applicable.
Data Availability Statement
The data that support the findings of this study are available from the corresponding author upon reasonable request.
Acknowledgments
The authors are grateful to Shanghai Branch of CNOOC (China) for supplying the samples and providing original geological and geochemical data. The study is funded by the National Science and Technology Major Project of China (Grant No: 2016ZX05027-001-004); Education Science and Technology Foundation of Gansu Province (Grant No: 2022QB-146); Tianshui Normal University Foundation (Grant No: CXJ2020-27).. We thank anonymous reviewers for their instructive comments and suggestions on the manuscript.
Conflicts of Interest
The authors declare no conflict of interest.
References
- Yin, S.; Ye, J.; Lei, C.; Shan, C.; Tian, Y.; Liu, F. Geochemical characteristics of Pinghu crude oils in Pingbei area of Xihu Sag. Xin. Petrol. Geol. 2014, 35, 542–546. [Google Scholar]
- Zhou, X.; Gao, S.; Gao, W.; Li, N. Formation and distribution of marine-continental transitional lithologic reservoirs in Pingbei slope belt, Xihu sag, East China Sea Shelf Basin. China Petrol. Exp. 2019, 24, 153–164. [Google Scholar]
- Su, A.; Chen, H.; Wang, C.; Li, P.; Zhang, H.; Xiong, W.; Lei, M. Genesis and maturity identification of oil and gas in the Xihu Sag, East China Sea Basin. Petrol. Exp. Dev. 2013, 40, 521–527. [Google Scholar] [CrossRef]
- Zhang, K.; Tang, Y.; Hu, S.; Wang, H.; Gao, M. Detection of diamantane hydrocarbons in the oil of Pinghu slope belt and its geochemical significance. J. Oil Gas Tech. 2014, 36, 30–34. [Google Scholar]
- Xu, T.; Hou, D.; Cao, B. Study of precursors for condensates and light oils in Xihu Sag of East China Sea Basin. Geochim. 2015, 44, 289–300. [Google Scholar]
- Cao, Q.; Song, Z.; Zhou, X.; Liang, S.; Wang, L. Geochemical characteristics and source of crude oil in Xihu sag, East China Sea Shelf Basin. Petrol. Geol. Exp. 2019, 41, 251–259. [Google Scholar]
- Su, A.; Chen, H.; Wang, C.; Li, P.; Ma, L.; Liu, H. Source of natural gas in Xihu Sag of the East China Sea Basin. Geol. Sci. Tech Inform. 2014, 33, 157–169. [Google Scholar]
- Liu, J.; Cao, B.; Xu, Z.; Qin, L.; Xu, F.; Tang, J. Sedimentary facies and the characteristics of tight sandstone reservoirs of Huagang Formation in Xihu Sag, East China Sea Basin. J. CUT. 2012, 39, 130–136. [Google Scholar]
- Jia, J.; Xu, X.; Sun, B. Oil/gas geochemical character in the Xihu Trough of the East China Sea. Offsho. Oil. 2000, 2, 1–7. [Google Scholar]
- Fu, N.; Li, Y.; Chen, G.; Chen, M.; Gao, W.; Zhang, H. Pooling mechanisms of “evaporating fractionation” of oil and gas in Xihu Sag, East China Sea. Petrol. Exp. Dev. 2003, 30, 39–42. [Google Scholar]
- Zhang, G.; Miao, S.; Chen, Y.; Zhao, Z.; Li, Y.; Zhang, H.; Yang, H.; Yang, S. Distribution of gas enrichment regions controlled by source rocks and geothermal heat in China Offshore Basin. Nat. Gas Industry. 2013, 33, 1–17. [Google Scholar]
- Wang, Y.; Chen, J.; Pang, X. Hydrocarbon generation and expulsion of tertiary coaly source rocks and hydrocarbon accumulation in the Xihu Sag of the East China Sea Shelf Basin, China. J. Asian earth sci. 2022, 22, 155–170. [Google Scholar] [CrossRef]
- Dai, J.; Gong, D.; Ni, Y. Stable carbon isotopes of coal-derived gases sourced from the Mesozoic coal measures in China[J]. Org. Geochem. 2014, 74, 123–142. [Google Scholar] [CrossRef]
- Liu, K.; Chen, J.; Zhu, X. The geochemical characteristics, genetic types and sources analysis of natural gas in Pingbei area, Xihu Sag. China Offshore Oil. Gas. 2019, 31, 42–52. [Google Scholar]
- Hu, T.; Ge, B.; Zhang, Y.; Liu, B. The development and application fingerprint parameters for hydrocarbons absorbed by source rocks and light hydrocarbons in natural gas. Petrol. Geol. Exp. 1990, 12, 375–394. [Google Scholar] [CrossRef]
- Dai, J. Identification and distinction of various alkane gases. Sci. China B. 1992, 2, 185–193. [Google Scholar]
- Xu, Y.; Shen, P.; Liu, W.; Wang, W. A new genetic type of natural gas: biogenic-thermal catalyzed gas. Sci. China B. 1992, 20, 975–980. [Google Scholar]
- Mango, F. An invariance in the isoheptanes of petroleum. Science, 1987, 237, 514–517. [Google Scholar] [CrossRef]
- Mango, F. The light hydrocarbons in petroleum: a critical review. Org. Geochem. 1997, 26, 417–440. [Google Scholar] [CrossRef]
- Wang, X.; Zhang, M.; Huang, G. Compositions and geochemical characteristics of light hydrocarbons in typical marine oils and typical coal-formed oils. Nat. Gas Geosci. 2008, 19, 18–22. [Google Scholar]
- Radke, M. Application of aromatic compounds as maturity indicators in source rocks and crude oils. Mar. Petrol. Geol. 1988, 5, 224–236. [Google Scholar] [CrossRef]
- Su, A.; Chen, H.; Wang, C.; Li, P.; Zhang, H.; Xiong, W.; Lei, M. Genesis and maturity identification of oil and gas in the Xihu Sag, East China Sea Basin. Petrol. Exp. Dev. 2013, 40, 521–527. [Google Scholar] [CrossRef]
- He, L.; Chen, J.; Liu, K.; Zhu, X.; Zhang, C.; Li, W.; Luo, G.; Wang, Y.; Zhao, X.; Wu, J. Geochemical characteristics and sources of natural gas in the northern Xihu Sag. Nat. Gas Industry, 2019, 39, 53–62. [Google Scholar]
- Liu, W.; Xu, Y. A two-stage model of carbon isotopic fractionation in coal-gas. Geochim. 1999, 28, 359–366. [Google Scholar]
- Z.G. Tong, Z.; He, Q.; He, S.; Yang, S.; Xiong, B.; Hao, J. Geothermal field and its effect on source rock in the Xihu Sag, the East China Sea Basin. Petrol. Geol. Exp. 2009, 31, 466–471. [CrossRef]
- Erdman, J.; Morris, D. Geochemical correlation of petroleum. AAPG Bull. 1974, 58, 2326–2337. [Google Scholar] [CrossRef]
- Stahl, W.J. Source rock-crude oil correlation by isotopic type-curves. Geochim. Cosmochim. Ac. 1978, 42, 1573–1577. [Google Scholar] [CrossRef]
- Shen, P.; Xu, Y. Study on carbon and hydrogen isotopes composition of crude oils. Ac. Sedim. Sin. 1998, 16, 124–127. [Google Scholar]
- Thompson, K. Fractionated aromatic petroleums and the generation of gas-condensates. Organic Geochemistry 1987, 573–590. [Google Scholar] [CrossRef]
- Tang, Y.; Zhang, K.; Hu, S.; Wang, H.; Wen, Y. Study on carbon and hydrogen isotopes composition of crude oils. J. Oil Gas Tech. 2014, 36, 28–33. [Google Scholar]
- Huang, D.; Li, C.; Zhang, D. Geochemistry of petroleum migration during the formation of Karamay Oilfield. Sci. China, Seb.B. 1989, 02, 199–206. [Google Scholar]
- Huang, D.; Zhao, M.; Zhang, S. Genetic analysis of waxy hydrocarbons in lower paleozoic source oil of manjiaer oil and gas system in Tarim Basin. Acta Sedim. Sin., 1997, 02, 6–13. [Google Scholar]
- Huang, H.; Zhang, S.; Su, A. Geochemistry in the process of petroleum migration and accumulation. Petrol. Geo. & Exp., 2001, 23, 278–284. [Google Scholar]
- Huang, D.; Zhao, M.; Zhang, S. Genetic analysis of the origin of the Lower Paleozoic waxy hydrocarbon from the Manjiar oil-gas system, Tarim Basin. Ac. Sedim. Sin. 1997, 15, 6–13. [Google Scholar]
- Larter, S.; Mills, N. phase-controlled transport fractionations in migrating. In: England W A, eds. Petroleum Migration. Geol. Soc. Spec. Publ. 1991, 59, 137–147. [Google Scholar] [CrossRef]
- Ye, J.; Chen, H.; Chen, J.; Gu, H. Fluid history analysis in the Xihu Sag, East China Sea. Nat. Gas Industry. 2006, 26, 40–43. [Google Scholar]
- Chen, L.; Xiang, Y. Play evolution analysis of Xihu Sag. Offsho. Oil. 2009, 29, 1–6. [Google Scholar]
- Lu, J.; Ye, J.; Huang, S.; Wu, J. Characteristics and hydrocarbon generation-expulsion histories of source rocks of Pingbei area in Xihu Sag. Offsho. Oil. 2009, 29, 38–43. [Google Scholar]
- Xiong, B.; Zhang, X.; Zhang, J.; Wang, C.; Yang, H. The key factor controlling hydrocarbon accumulation in Xihu Sag. Offsho. Oil. 2008, 23, 14–24. [Google Scholar]
- Su, A.; Chen, H.; Lei, C.; Chen, X.; Wang, P.; Wu, T.; Chen, J.; Chen, H. Application of PVTx simulation of fluid inclusions to estimate petroleum charge stages and restore pressure: using Pinghu structural belt in Xihu Sag as an example. Geol. Sci. Tech. Inf. 2014, 33, 137–142. [Google Scholar]
- Su, A.; Chen, H.; Chen, X.; Ma, Y.H.; Yang, W.; Liu, H.; Li, P. Coupling relationship between diagenetic evolution and oil and gas accumulation of tight sandstone reservoir in Pinghu structural belt in Xihu Sag, Eastern Sea Basin. J. CSU Sci. 2015, 46, 1016–1026. [Google Scholar]
- Zhang, H.; Zhang, W. Petroleum Geology. Beijing, Petrol. Industry Pre. 1990, 1, 152–167. [Google Scholar]
- Dai, J.; Pei, X.; Qi, H. Natural Gas Geology in China. Beijing, Petrol. Industry Pre. 1992, 1, 225–284. [Google Scholar]
- Zhou, X.; Gao, W.; Zhang, J.; Zhang, N.; Tian, C. Fractures in the Pingbei area and their control on hydrocarbon accumulation in the Xihu Sag of the East China Sea. Sh. Lan. Re. 2014, 35, 54–57. [Google Scholar]
Figure 1.
Sketch diagram showing stratigraphic and geographical positions of the structural units and oil and gas fields in the Pingbei area of Xihu Sag (modified from [2]).
Figure 1.
Sketch diagram showing stratigraphic and geographical positions of the structural units and oil and gas fields in the Pingbei area of Xihu Sag (modified from [2]).
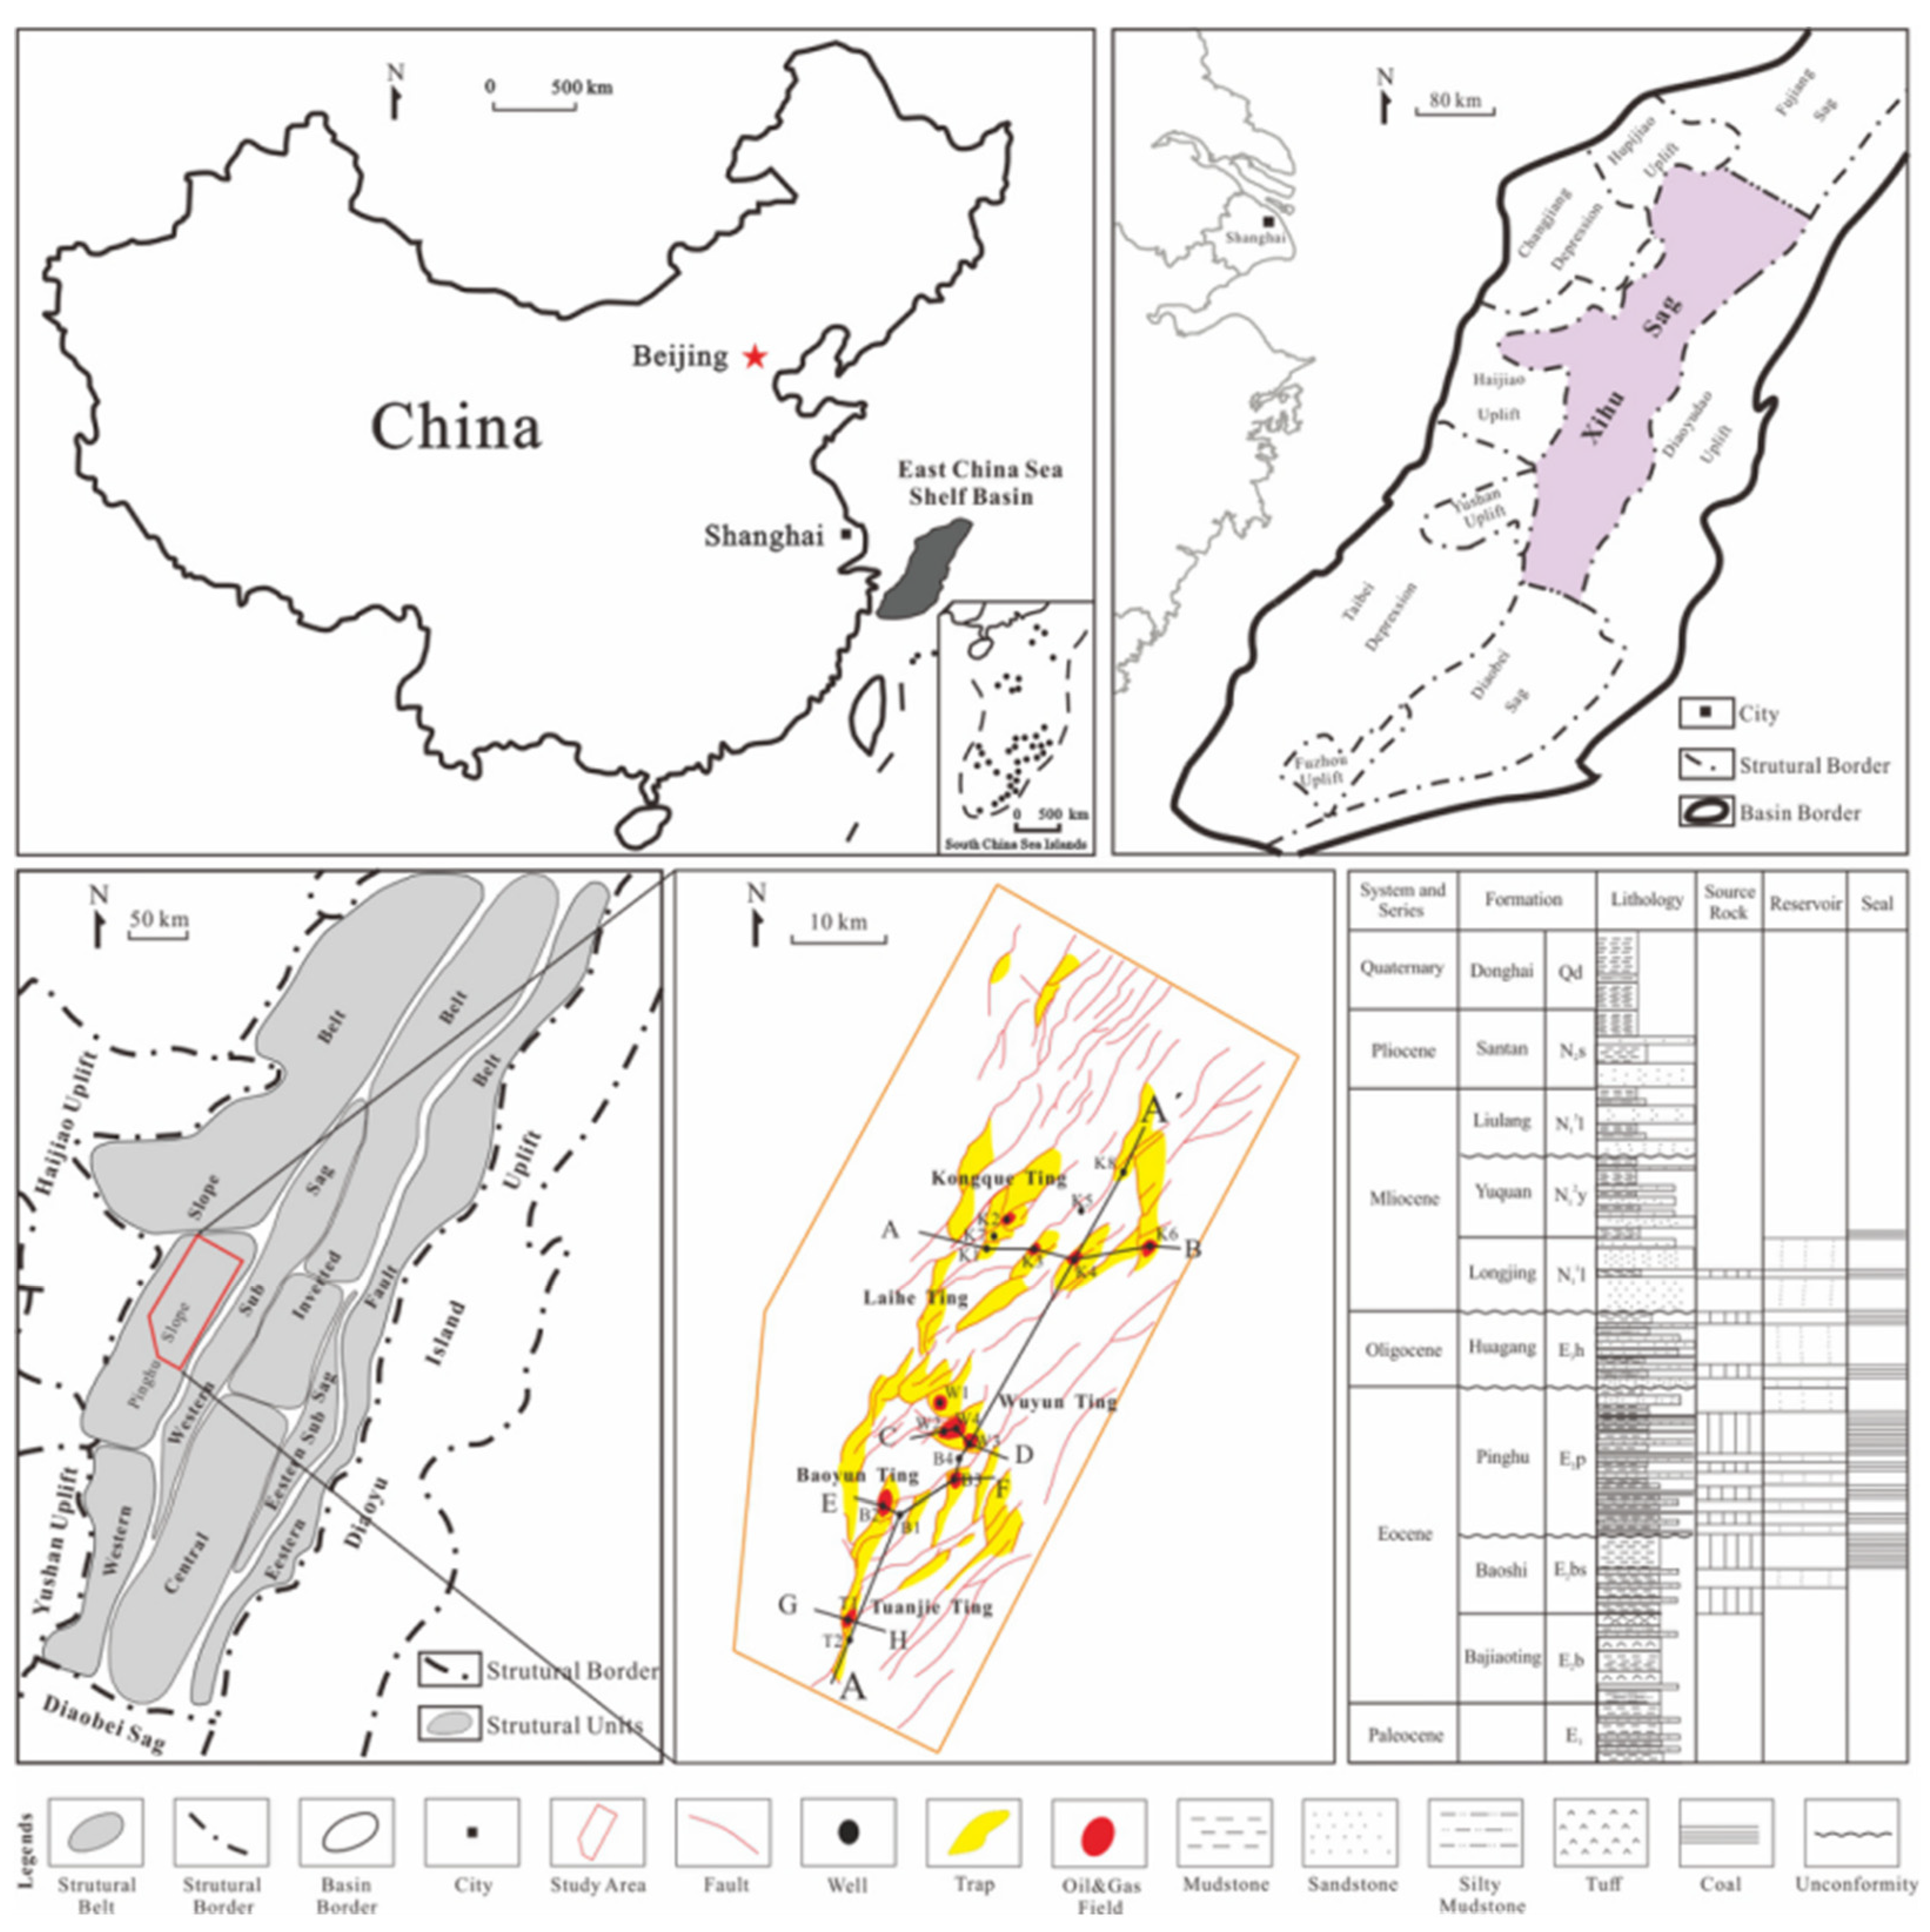
Figure 2.
Oil and gas distribution in the Pingbei area of Xihu Sag. The location’s profile can be observed in Figure 1.
Figure 2.
Oil and gas distribution in the Pingbei area of Xihu Sag. The location’s profile can be observed in Figure 1.
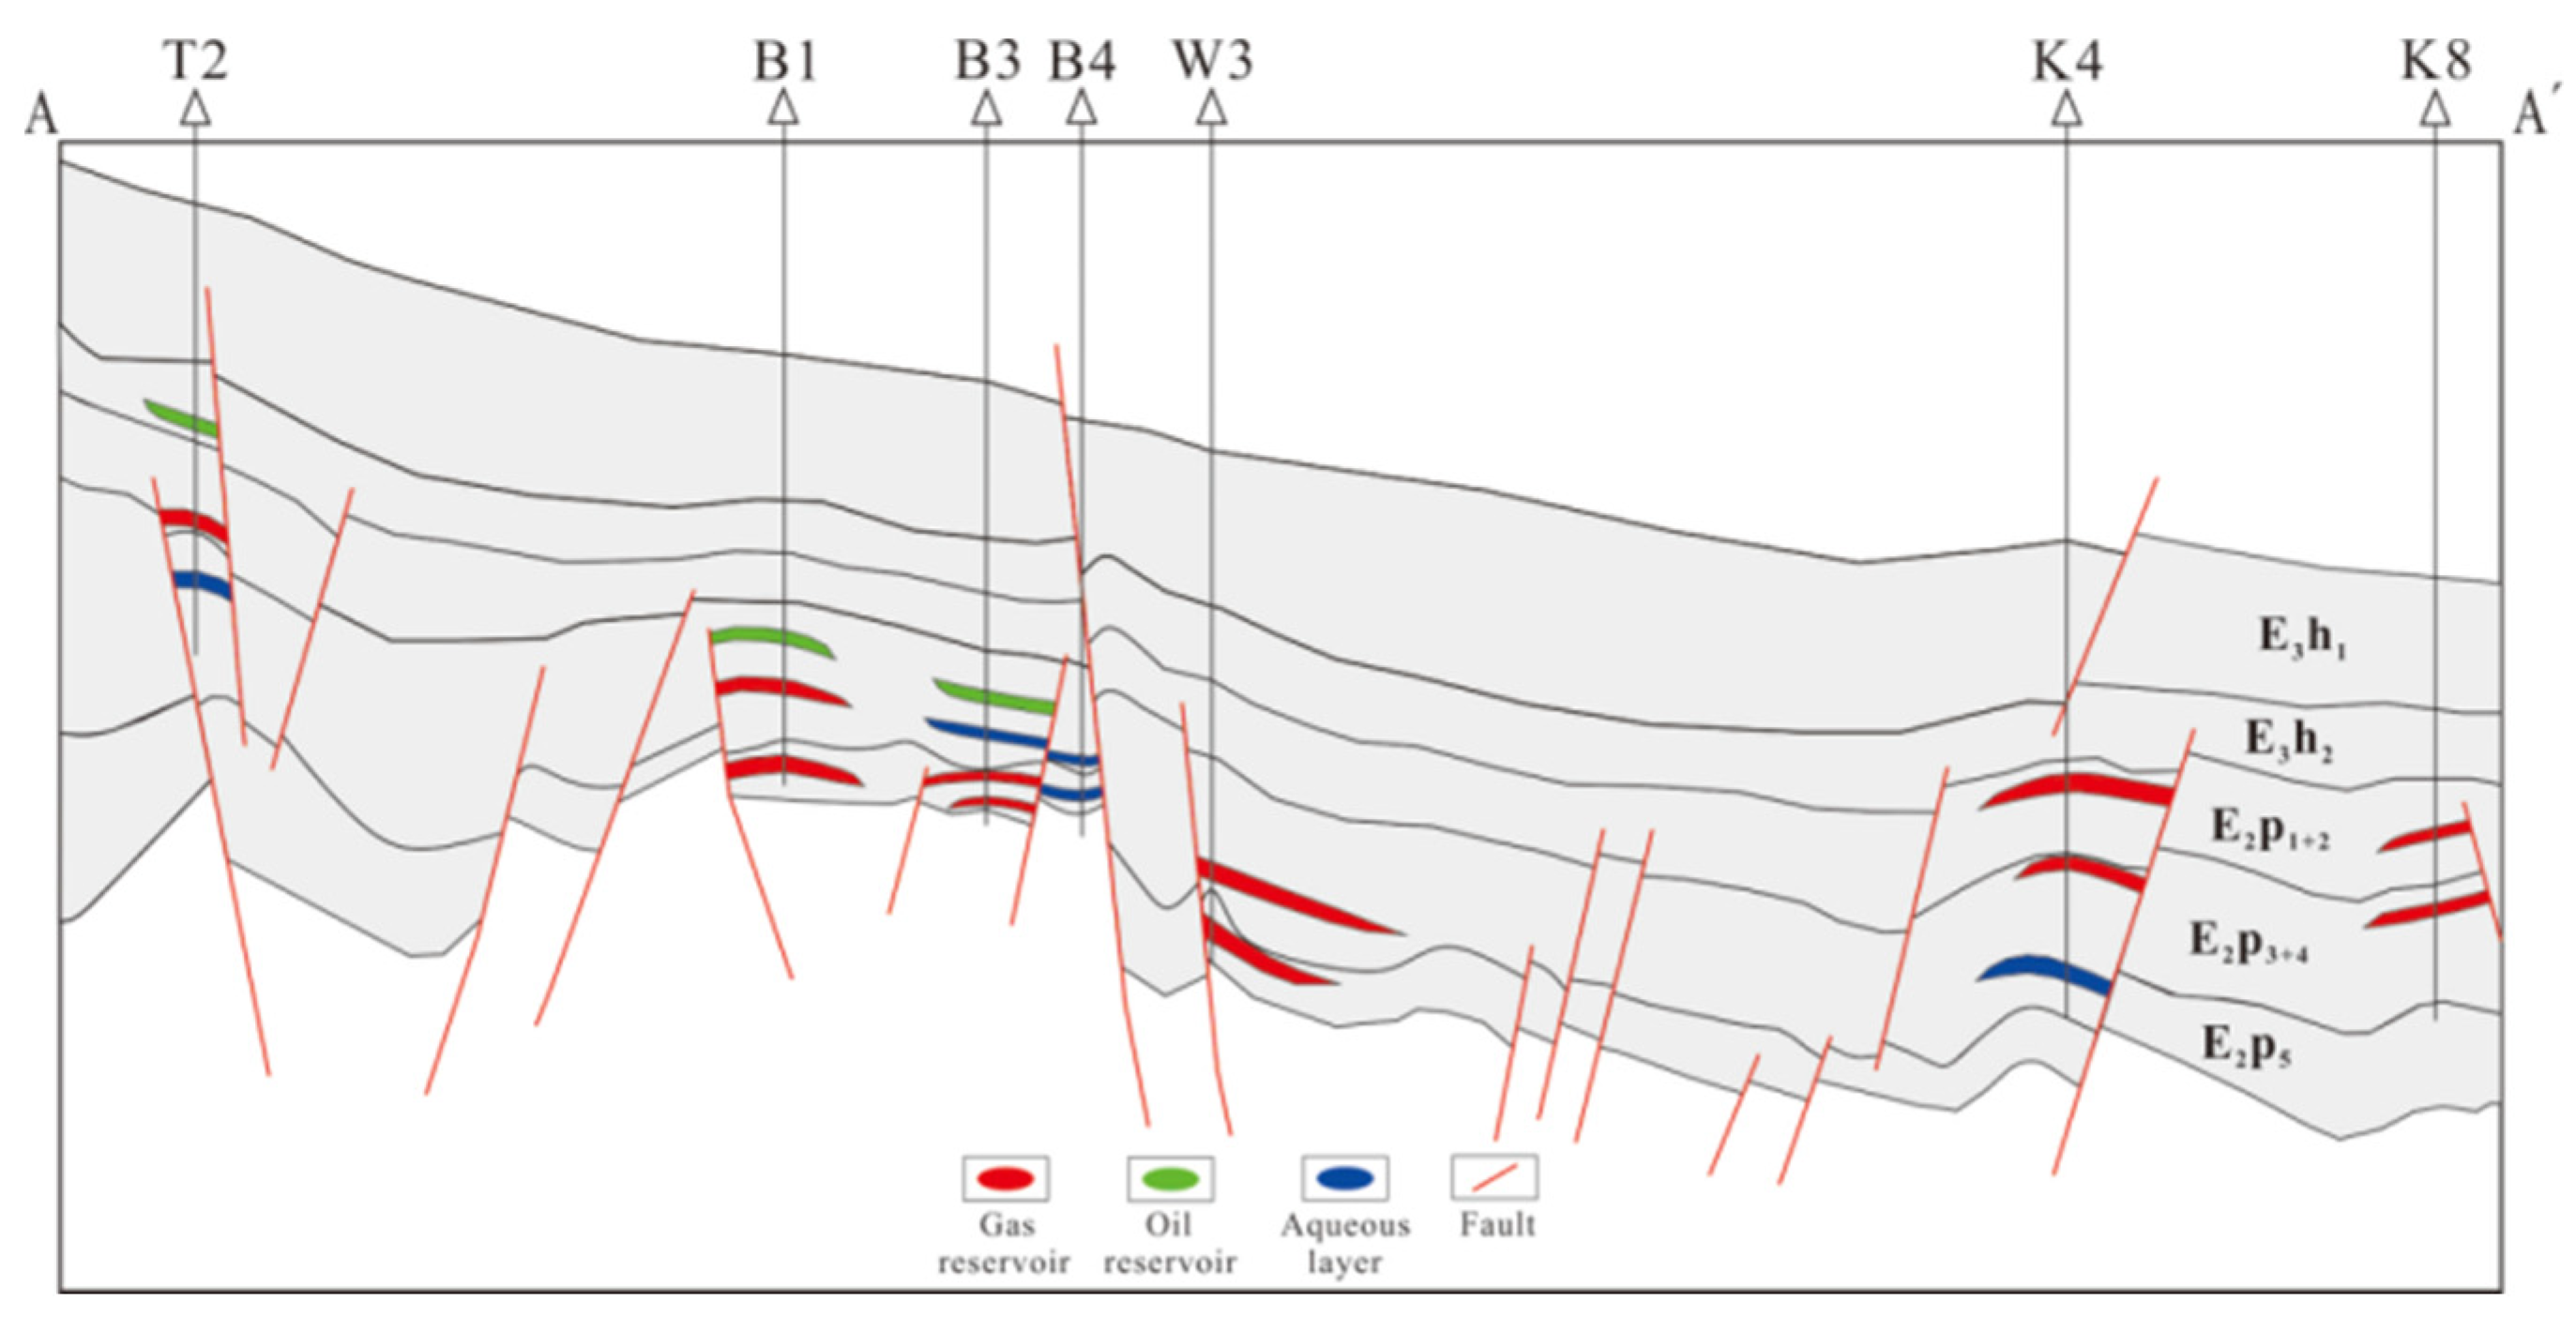
Figure 3.
Physical characteristics of crude oil.
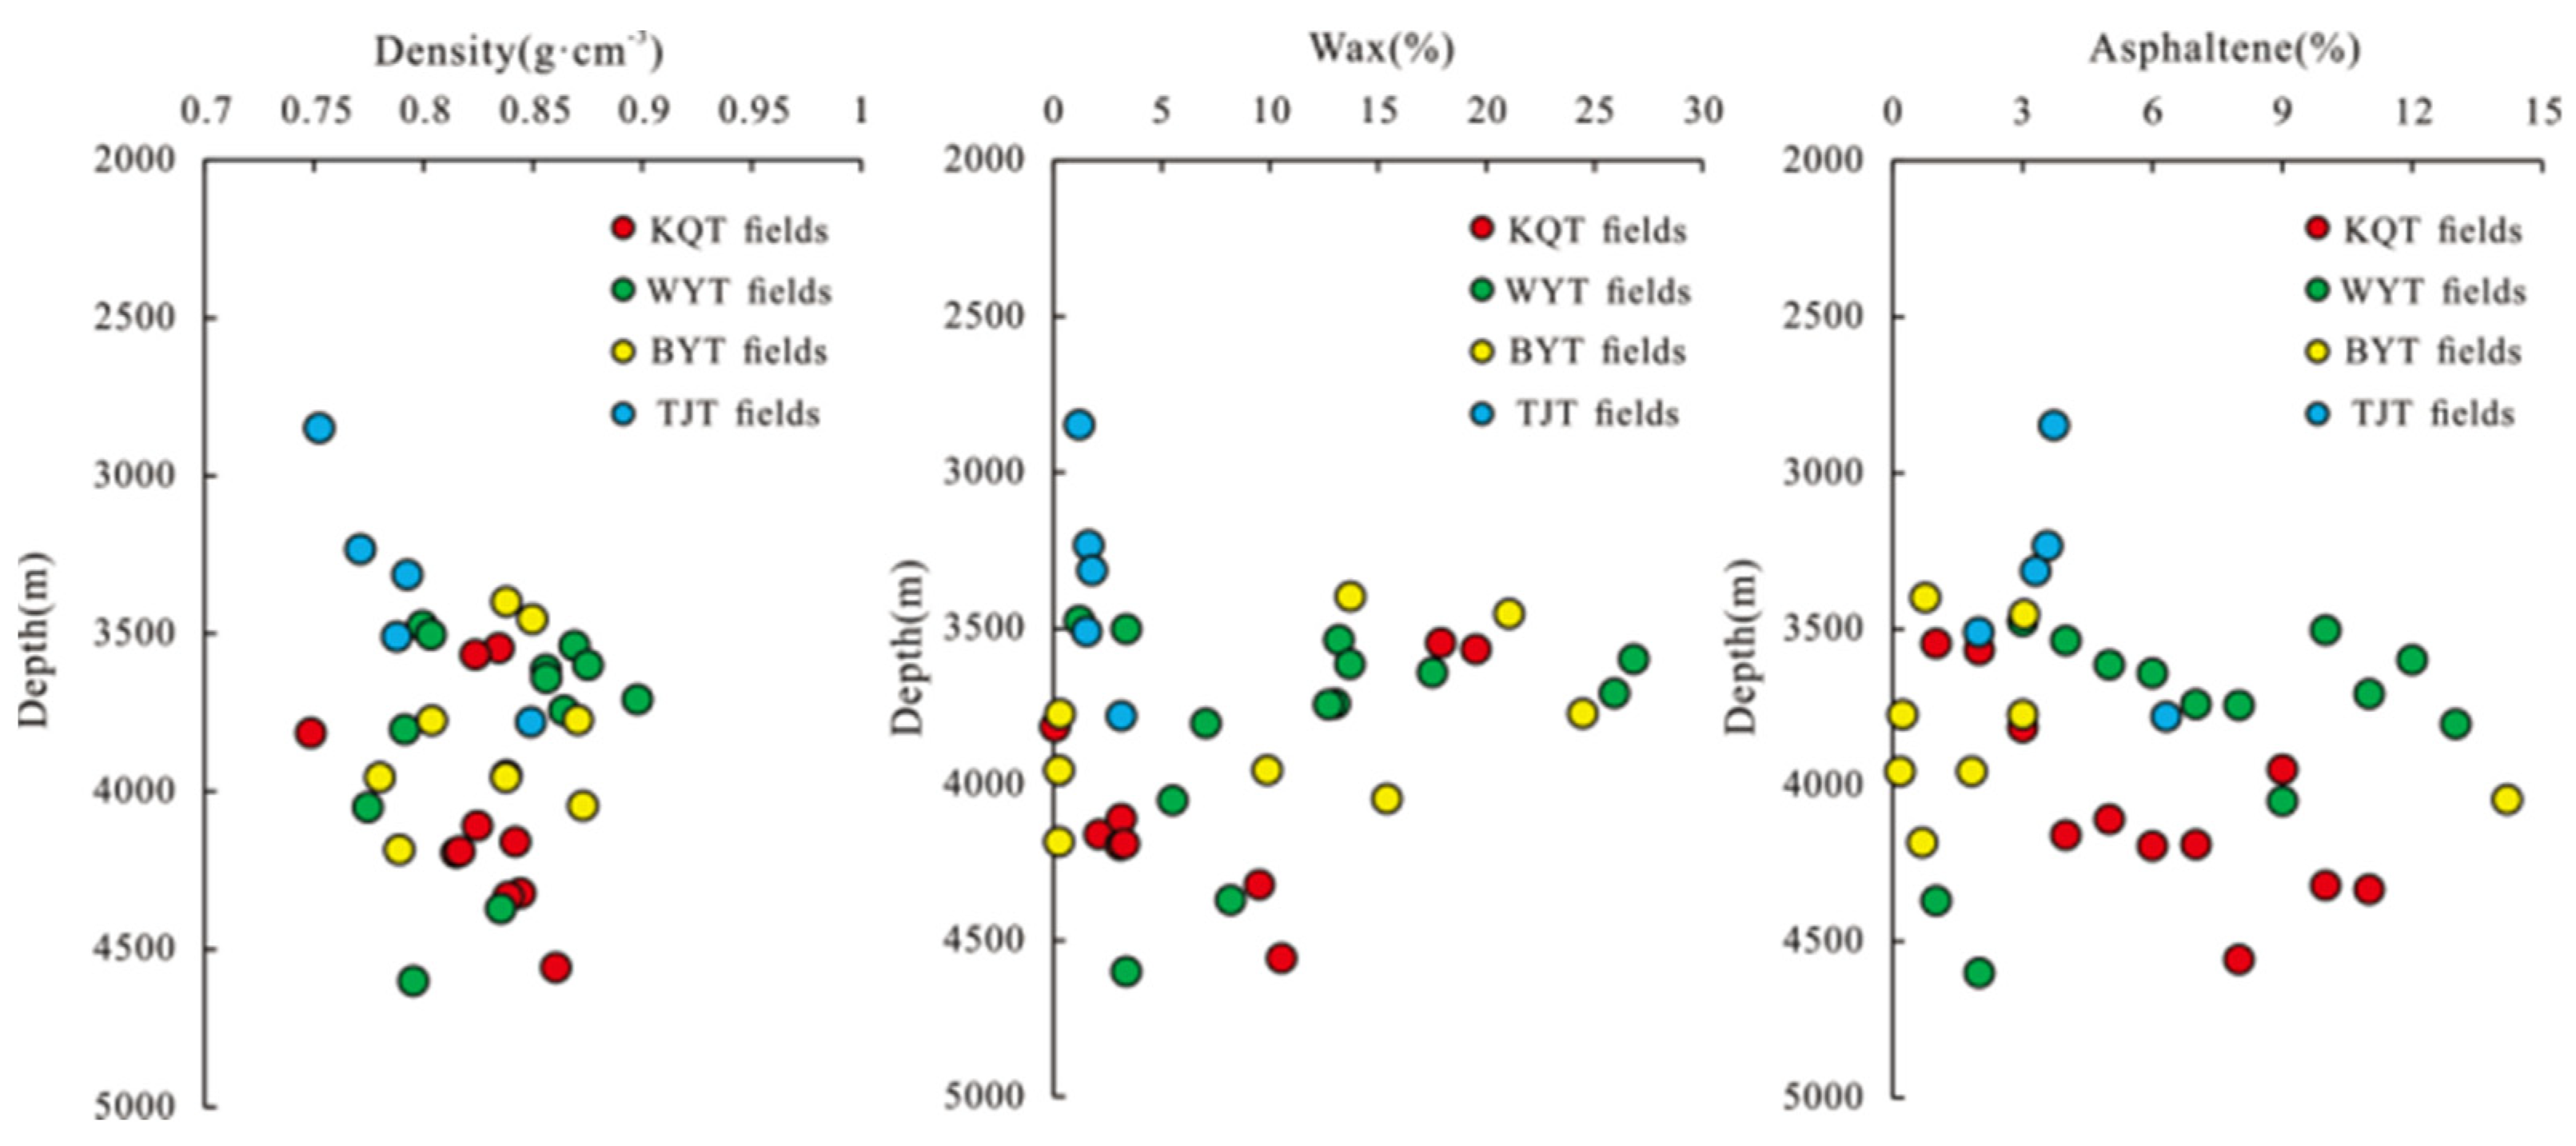
Figure 4.
Light hydrocarbon characteristics of crude oil.
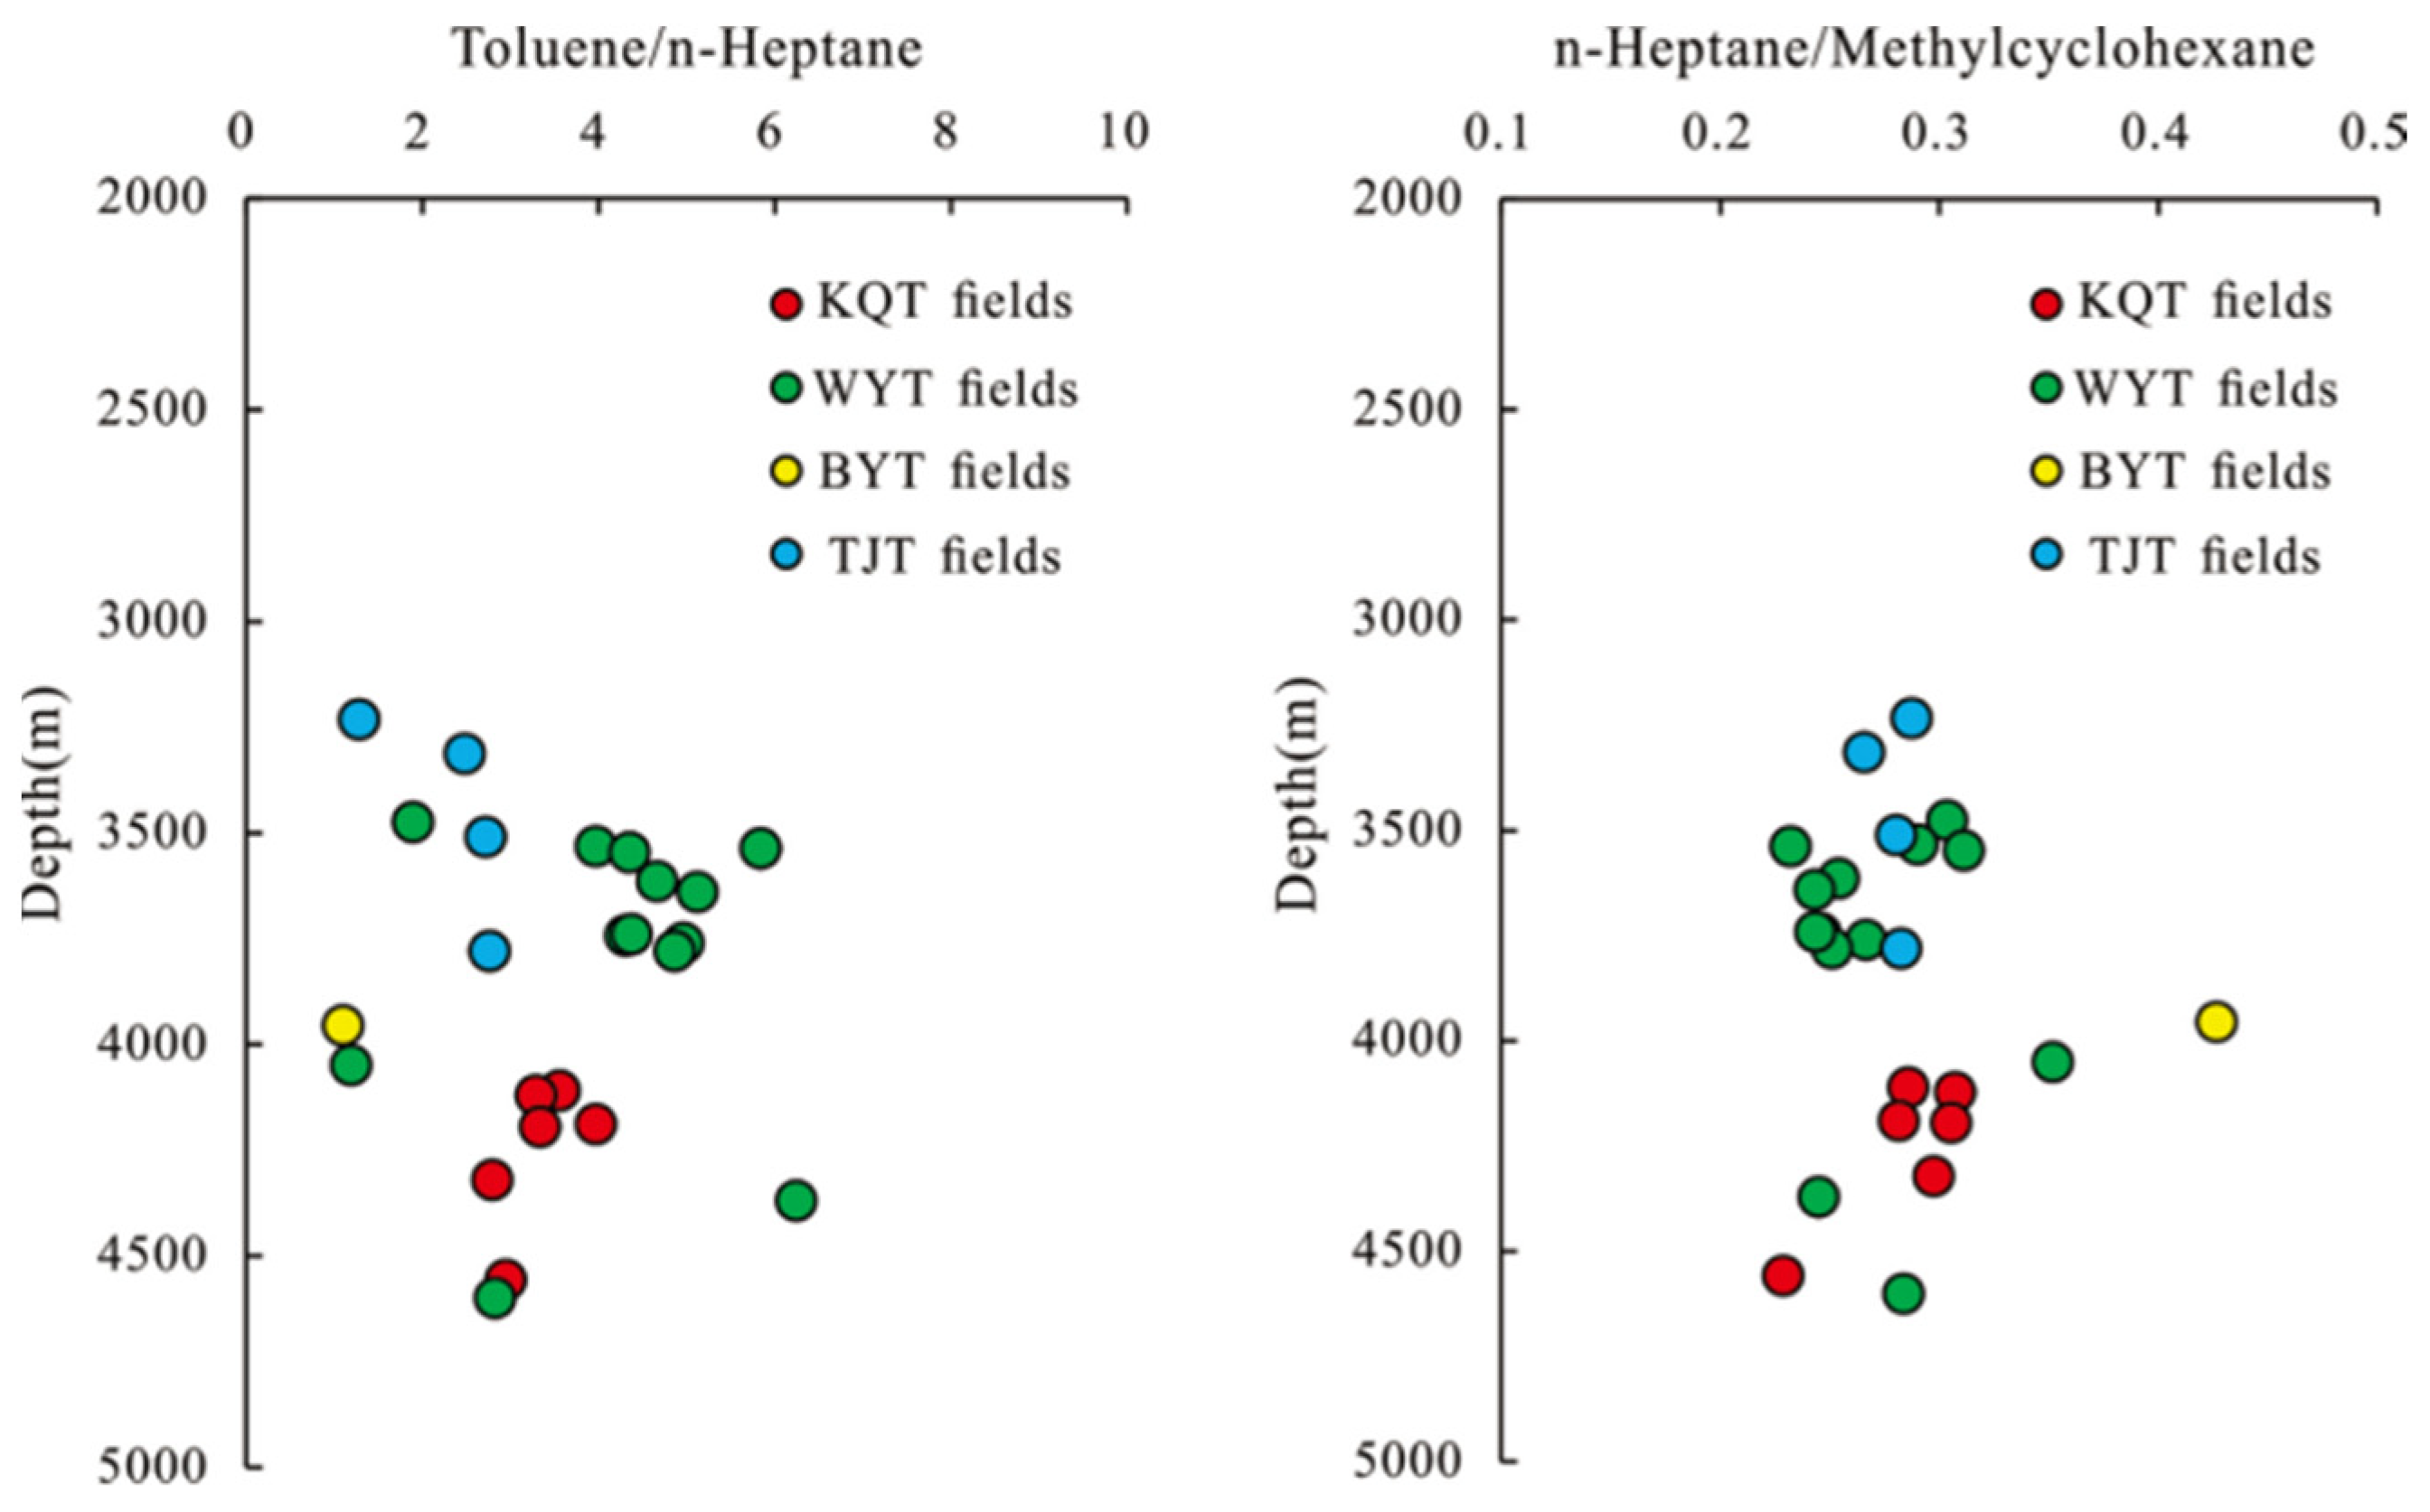
Figure 5.
Relative composition of the crude oil C7 light hydrocarbon compounds.
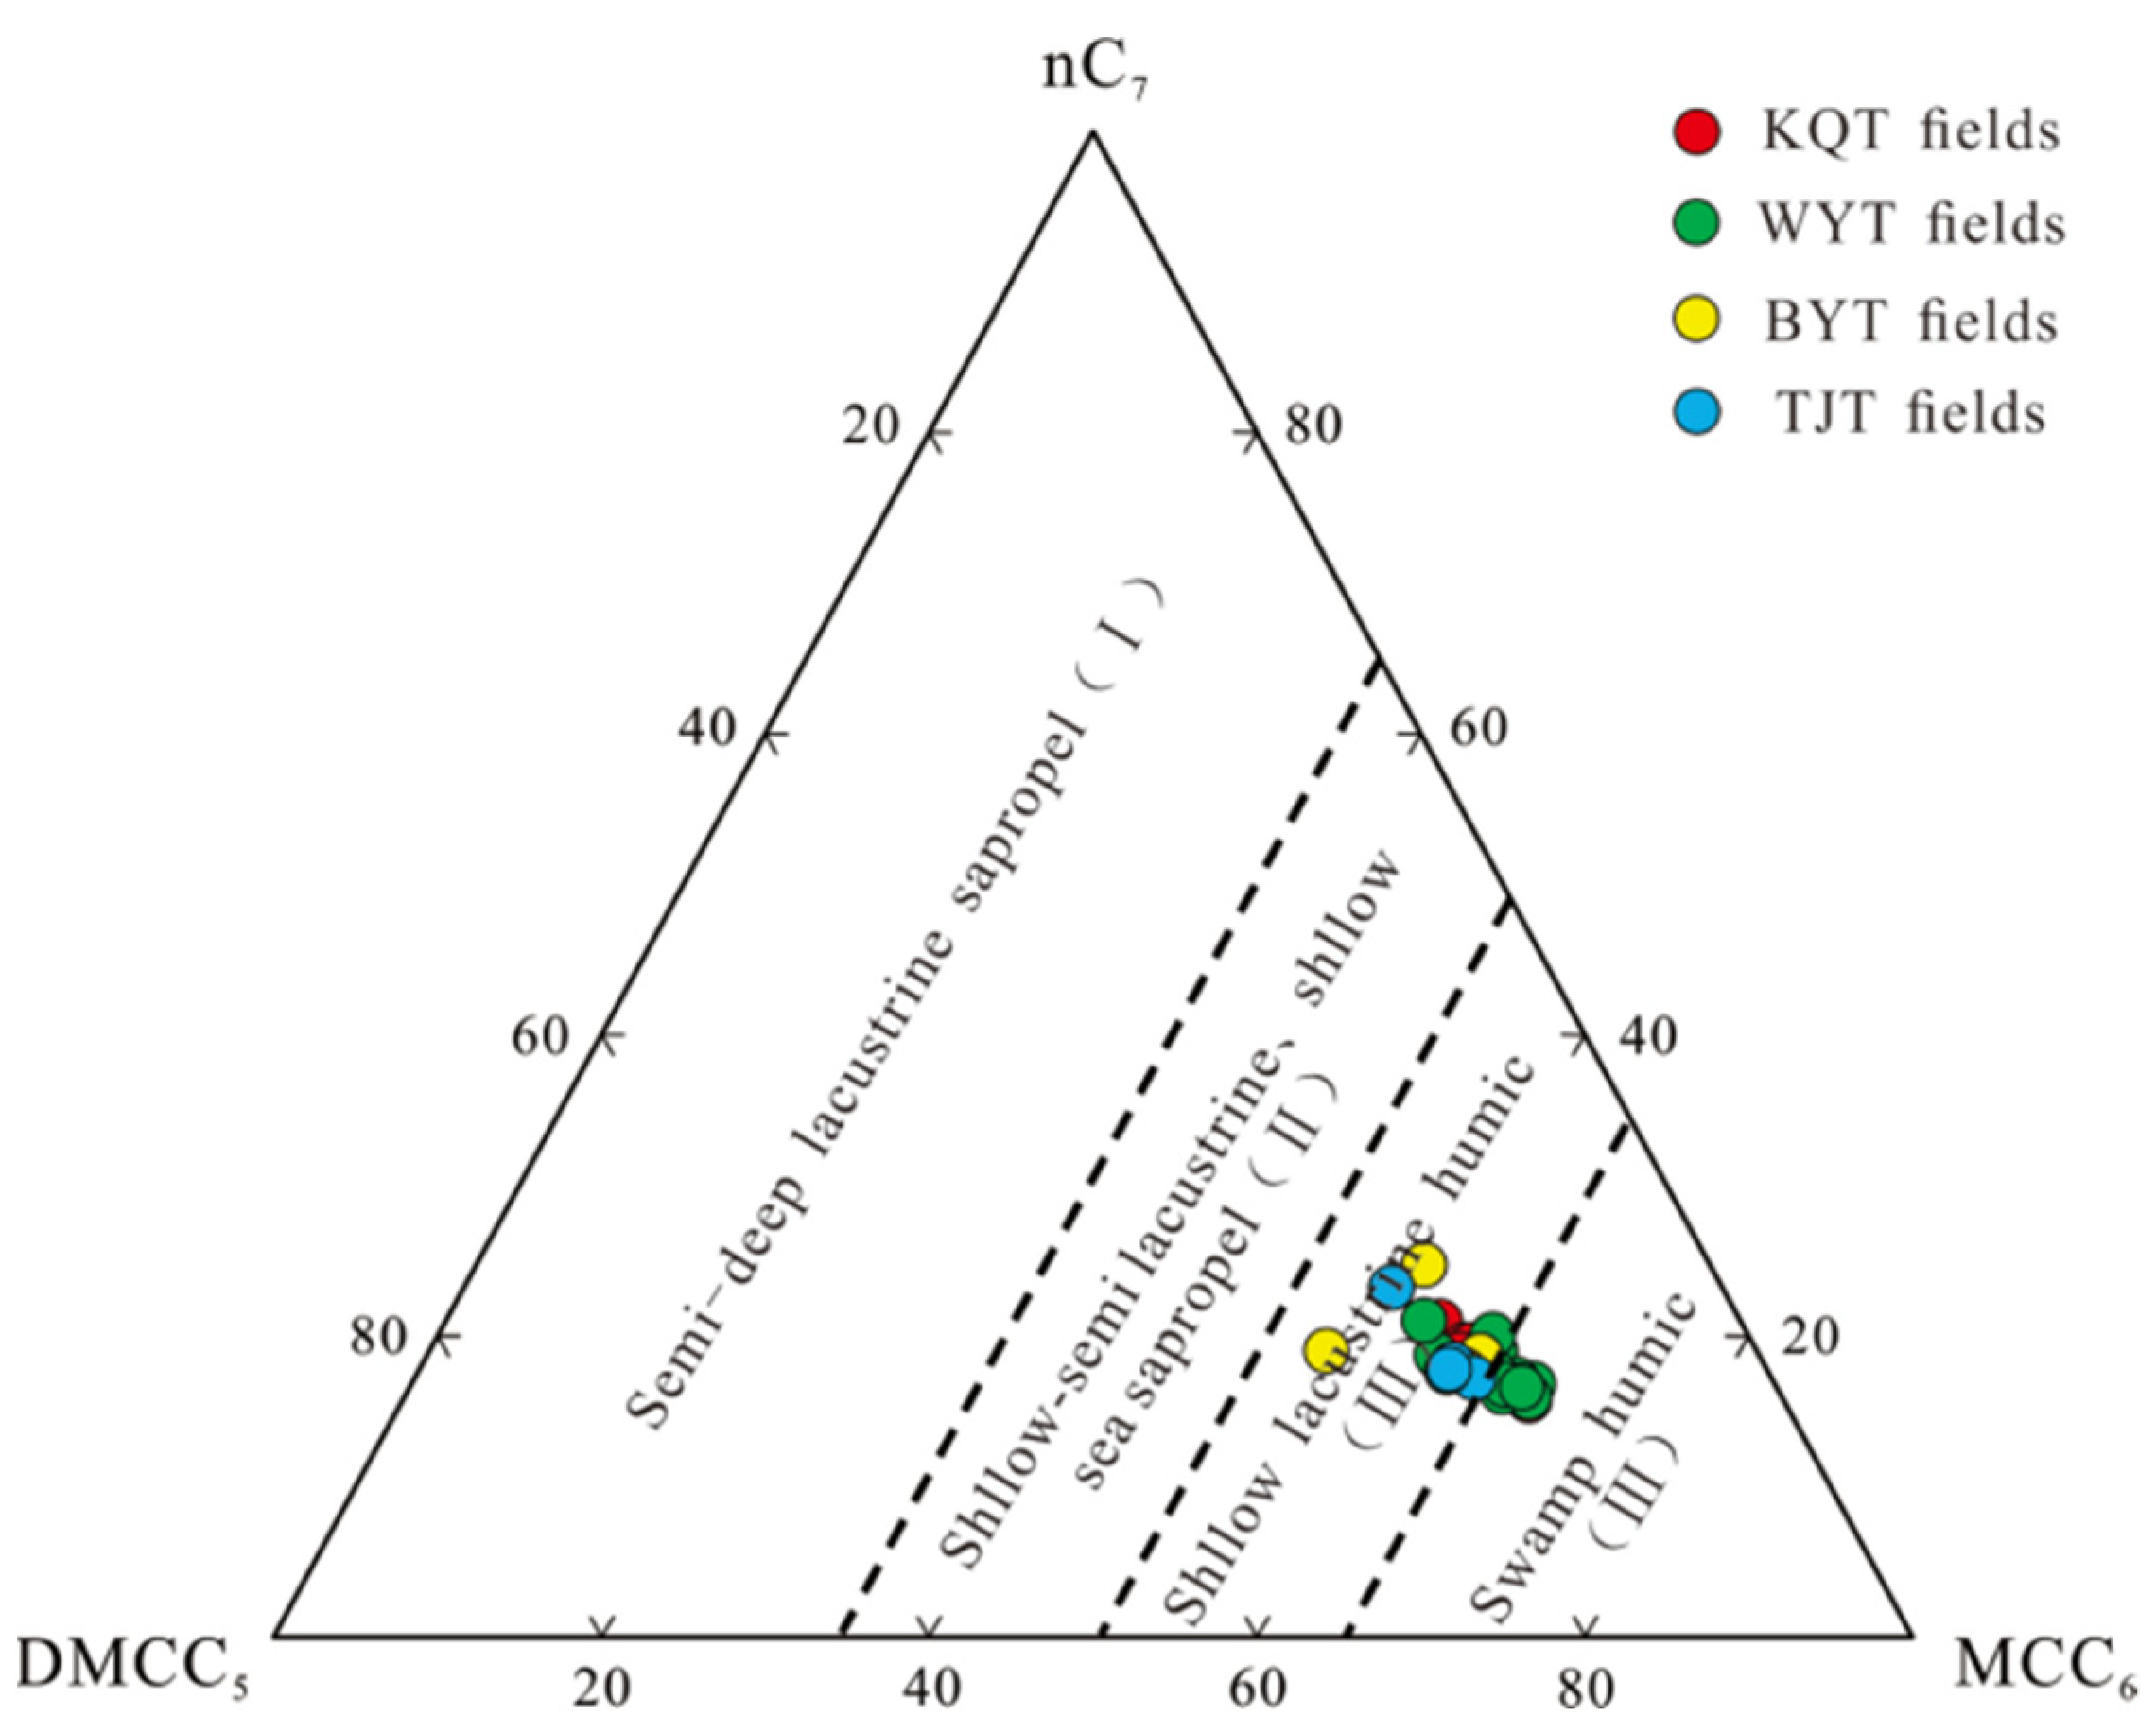
Figure 6.
Classification of natural gas genesis.
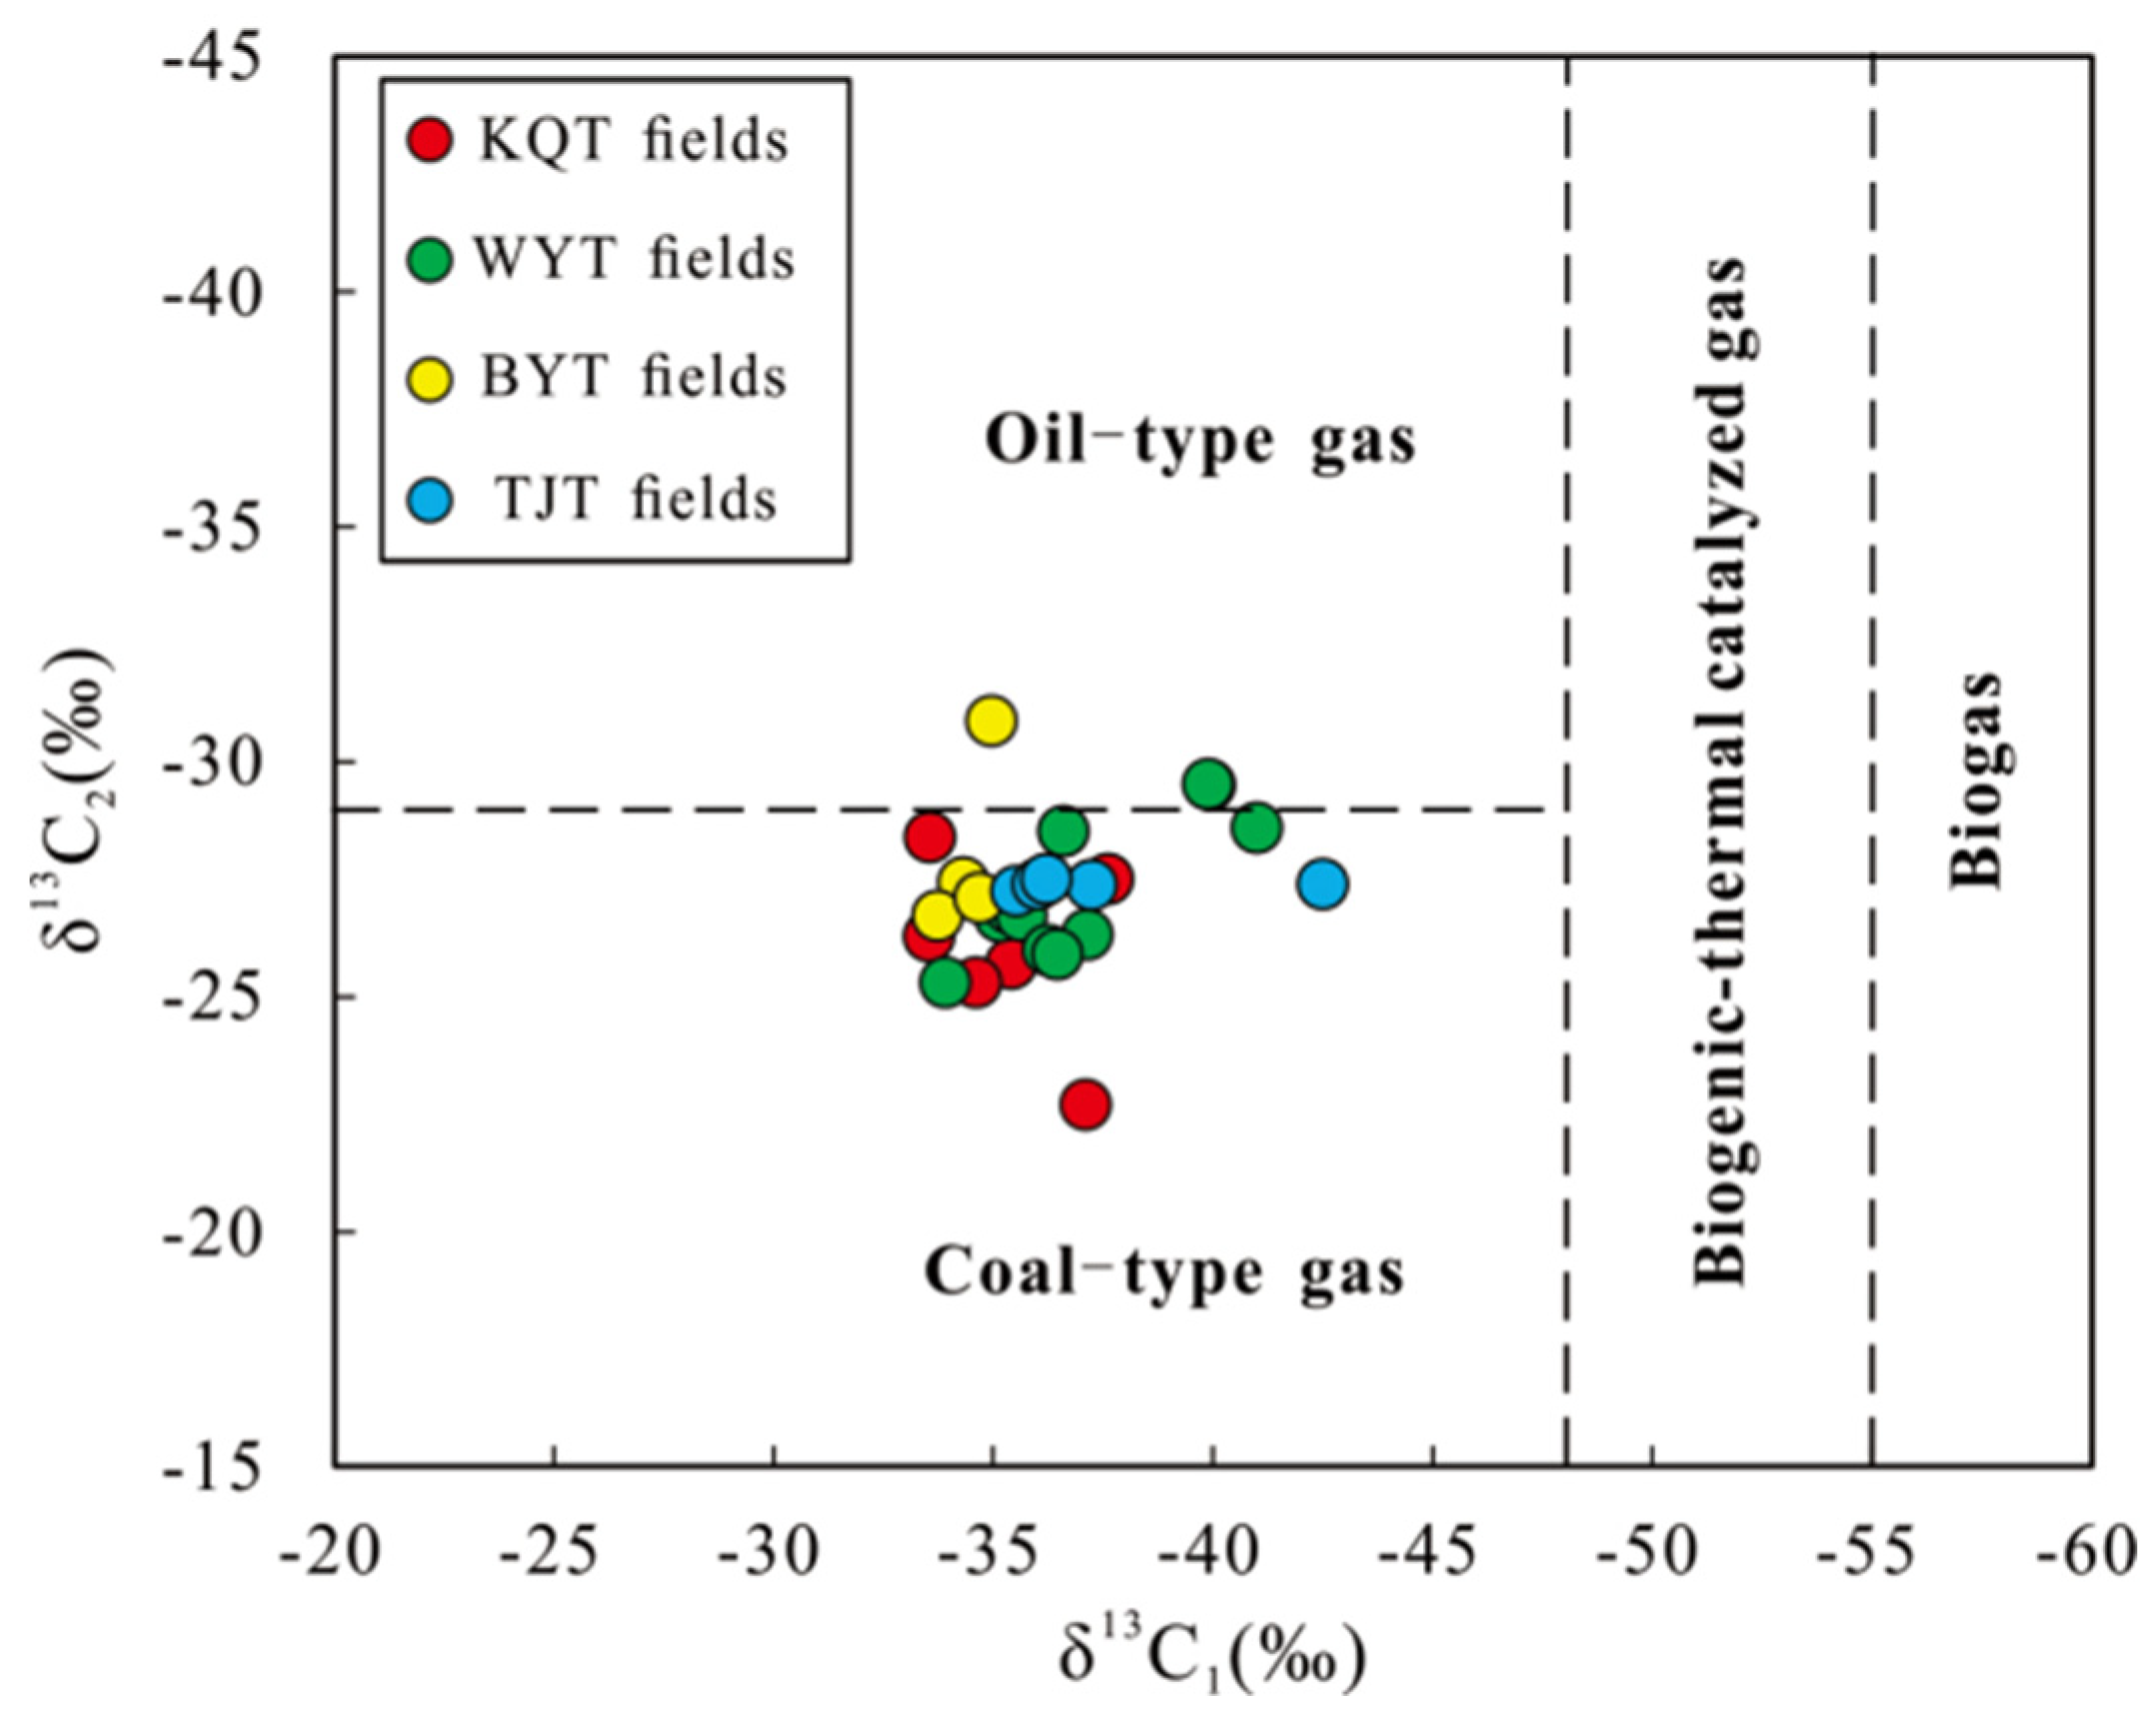
Figure 7.
Cross diagram of the TOC versus Rock-Eval S1+S2 (A) and the Rock-Eval Tmax versus HI (B).
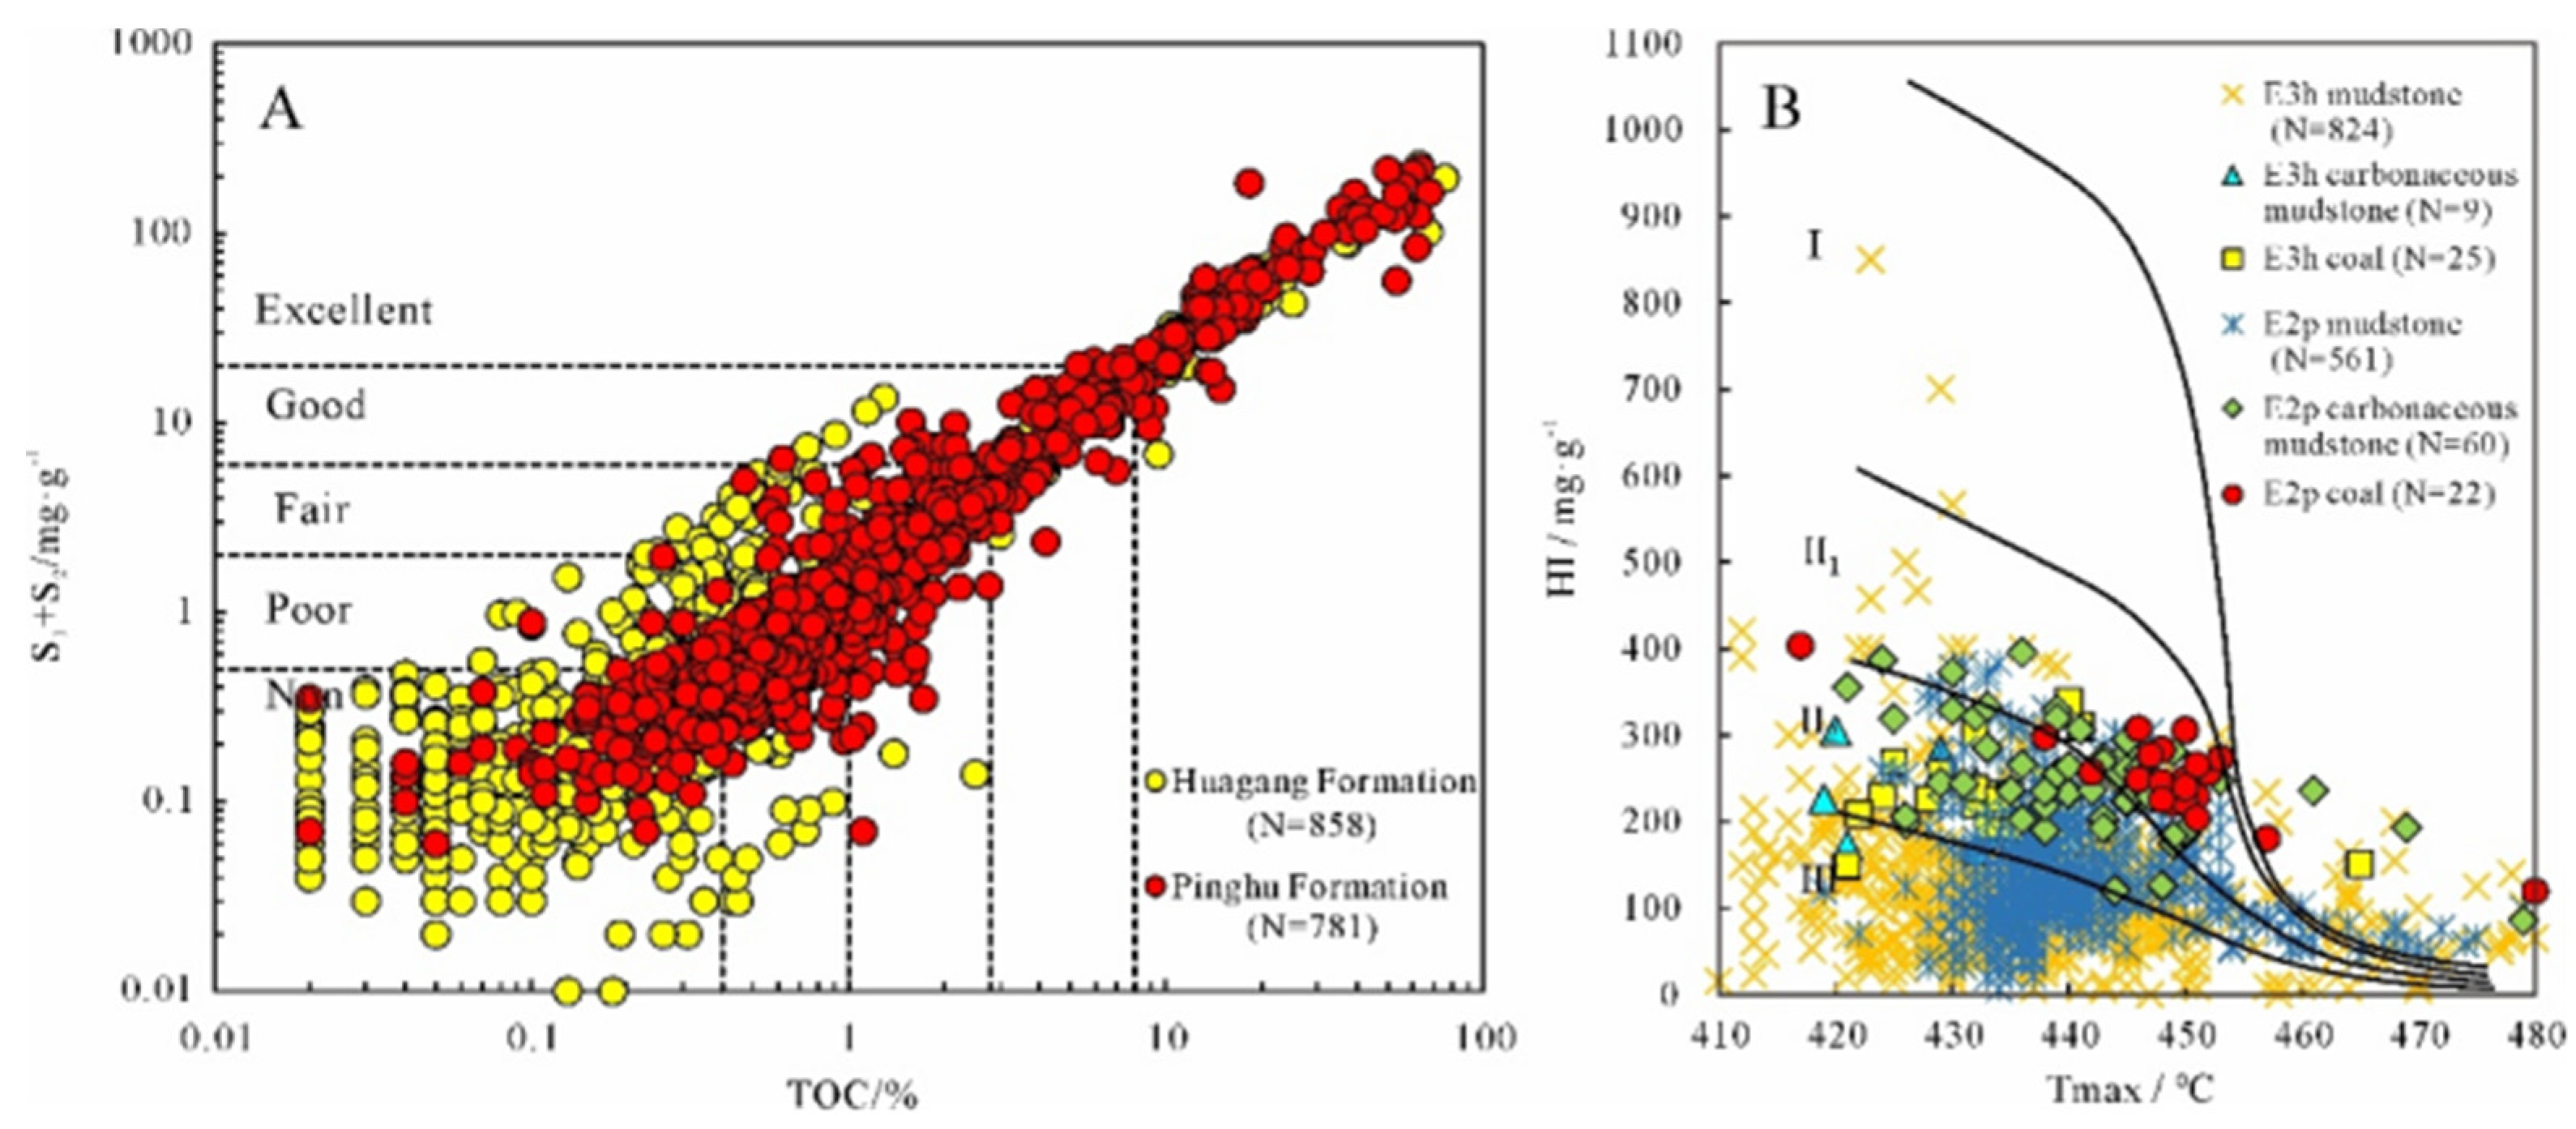
Figure 8.
Depth plots for the source rock maturity in the Pingbei area (A) and distribution of the maturity of the source rocks at the bottom of PH in Xihu Sag (B).
Figure 8.
Depth plots for the source rock maturity in the Pingbei area (A) and distribution of the maturity of the source rocks at the bottom of PH in Xihu Sag (B).
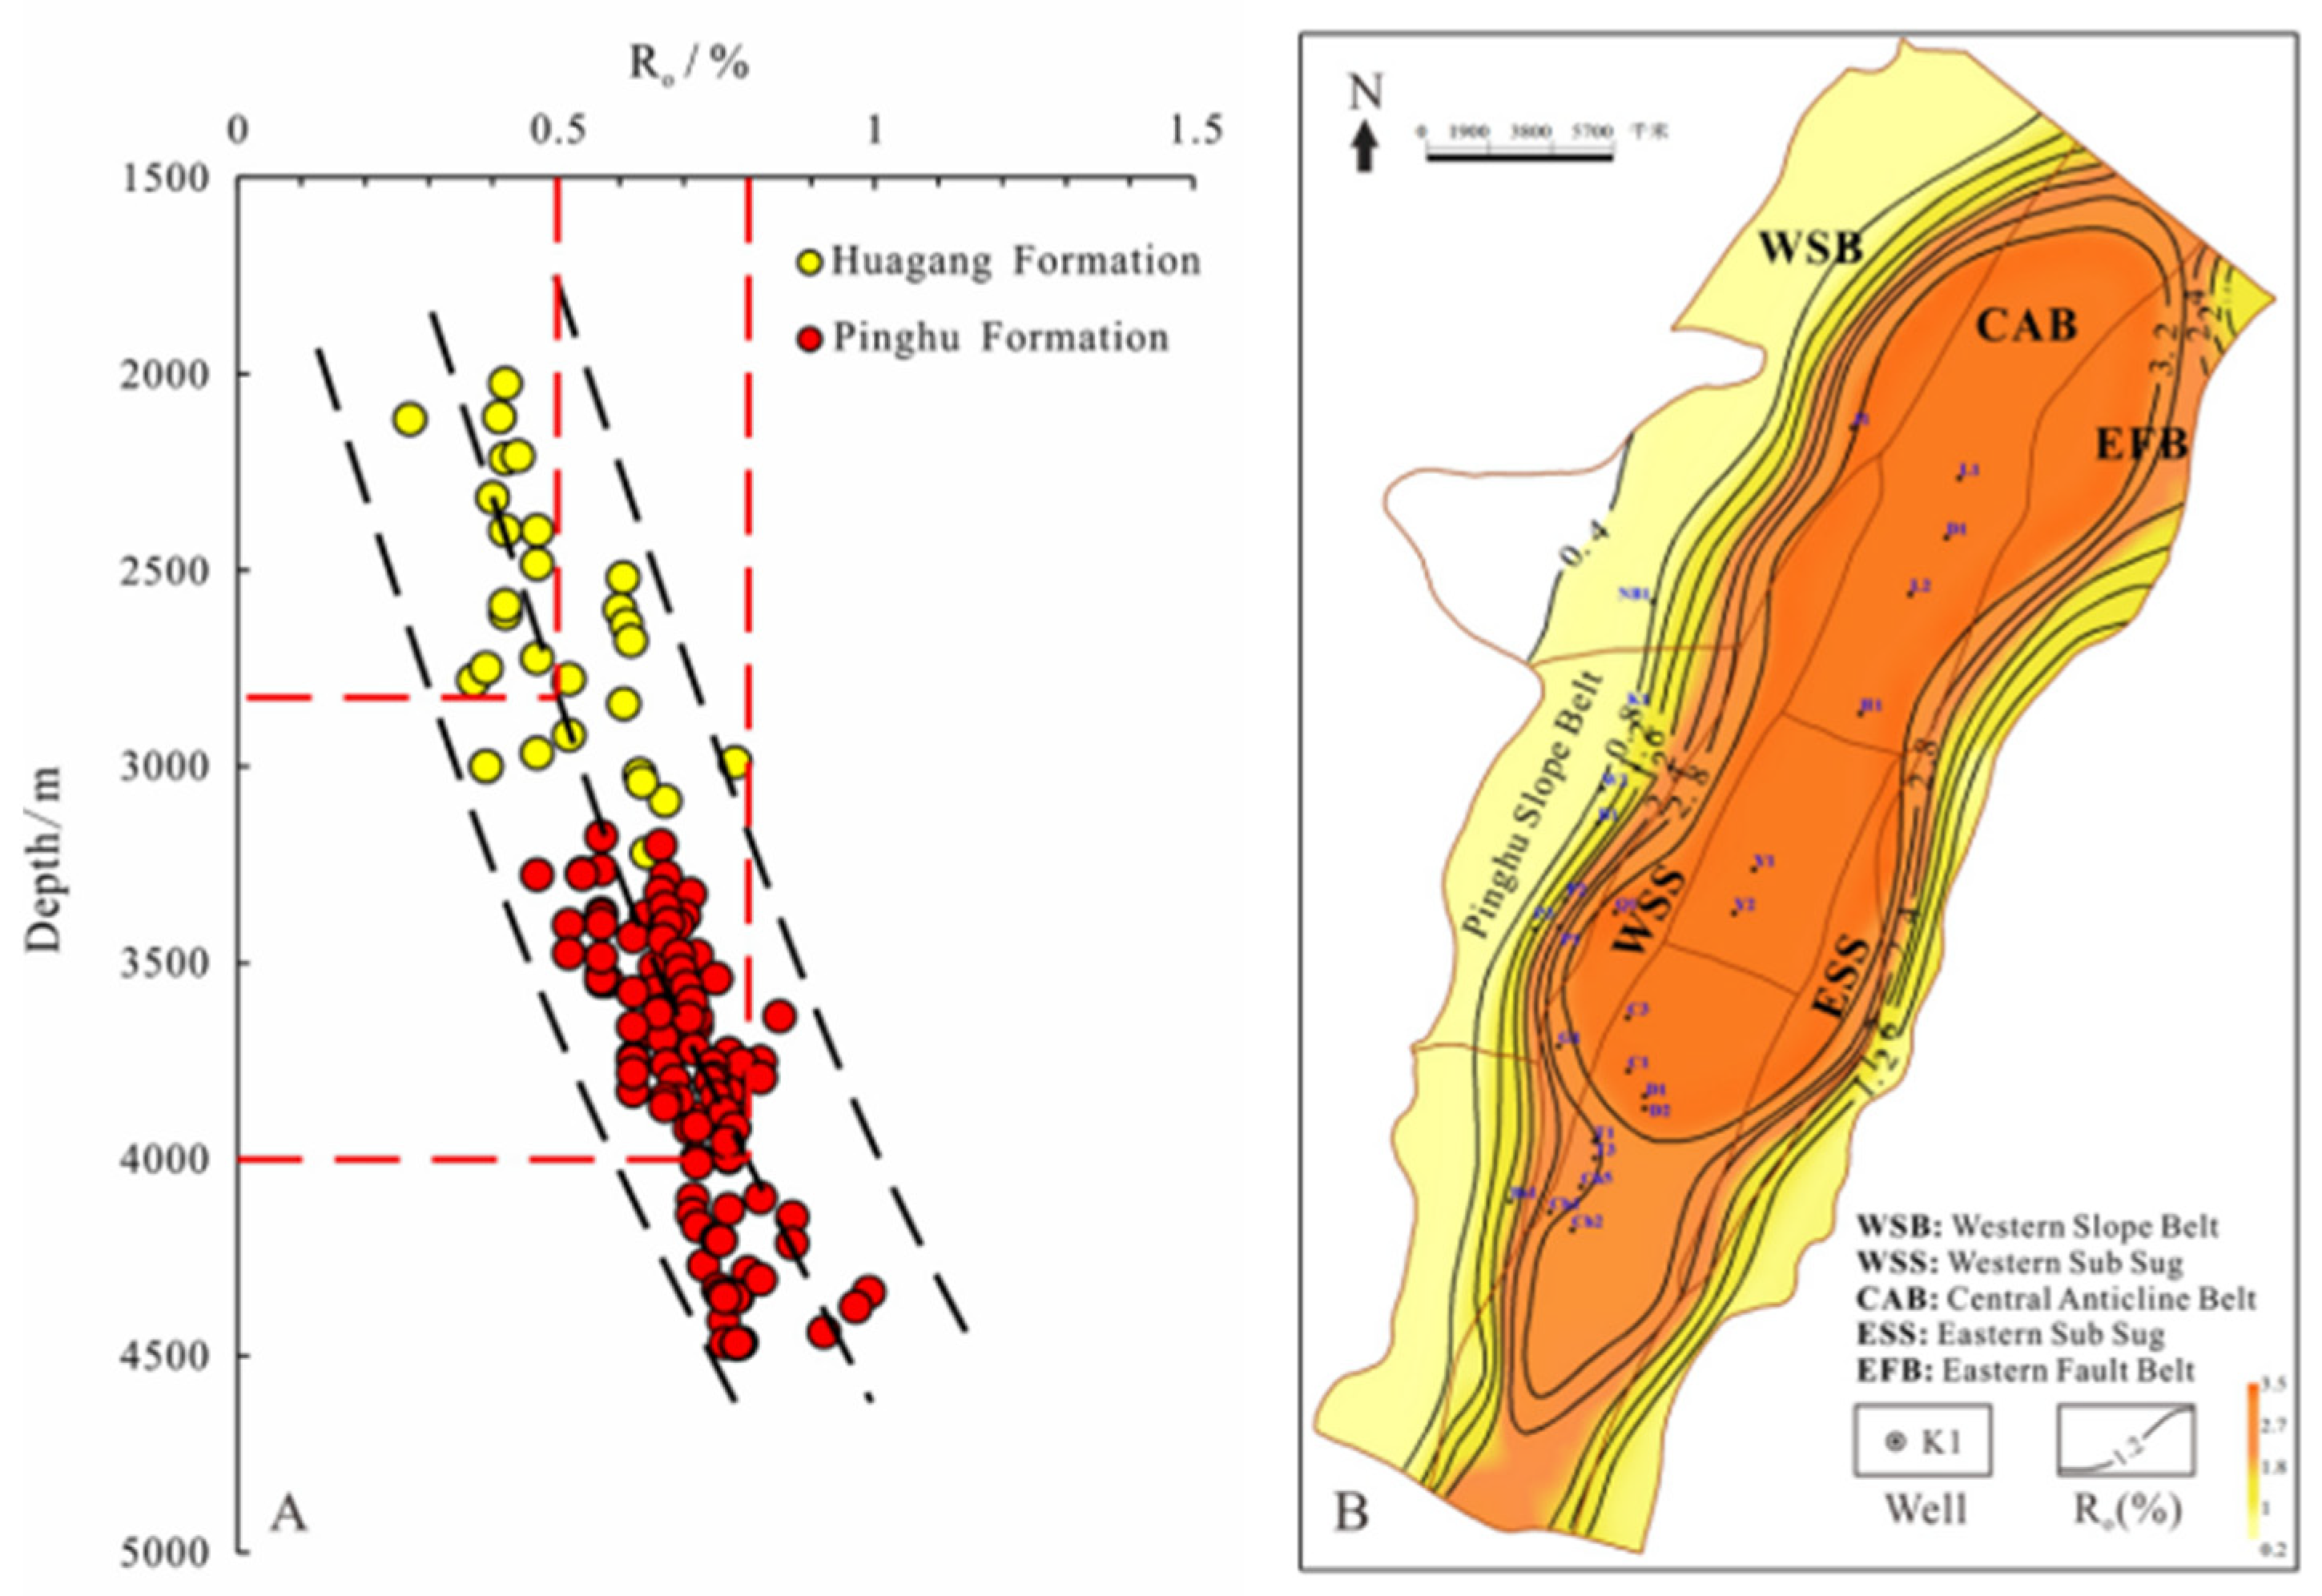
Figure 9.
Fingerprint parameter distribution characteristics of the oil’s light hydrocarbon compounds. a, 2-MC5/3-MC5; b, nC6/(MCyC5 + 2,2-DMC5); c, 2-MC6/2,3-DMC5; d, 3-MC6/(1,1-DMCyC5 + 1,c3-DMCyC5); e, 1,t3-DMCyC5/1t2-DMCyC5; f, nC7/(1,1,3-TMCyC5 + MCyC6).
Figure 9.
Fingerprint parameter distribution characteristics of the oil’s light hydrocarbon compounds. a, 2-MC5/3-MC5; b, nC6/(MCyC5 + 2,2-DMC5); c, 2-MC6/2,3-DMC5; d, 3-MC6/(1,1-DMCyC5 + 1,c3-DMCyC5); e, 1,t3-DMCyC5/1t2-DMCyC5; f, nC7/(1,1,3-TMCyC5 + MCyC6).
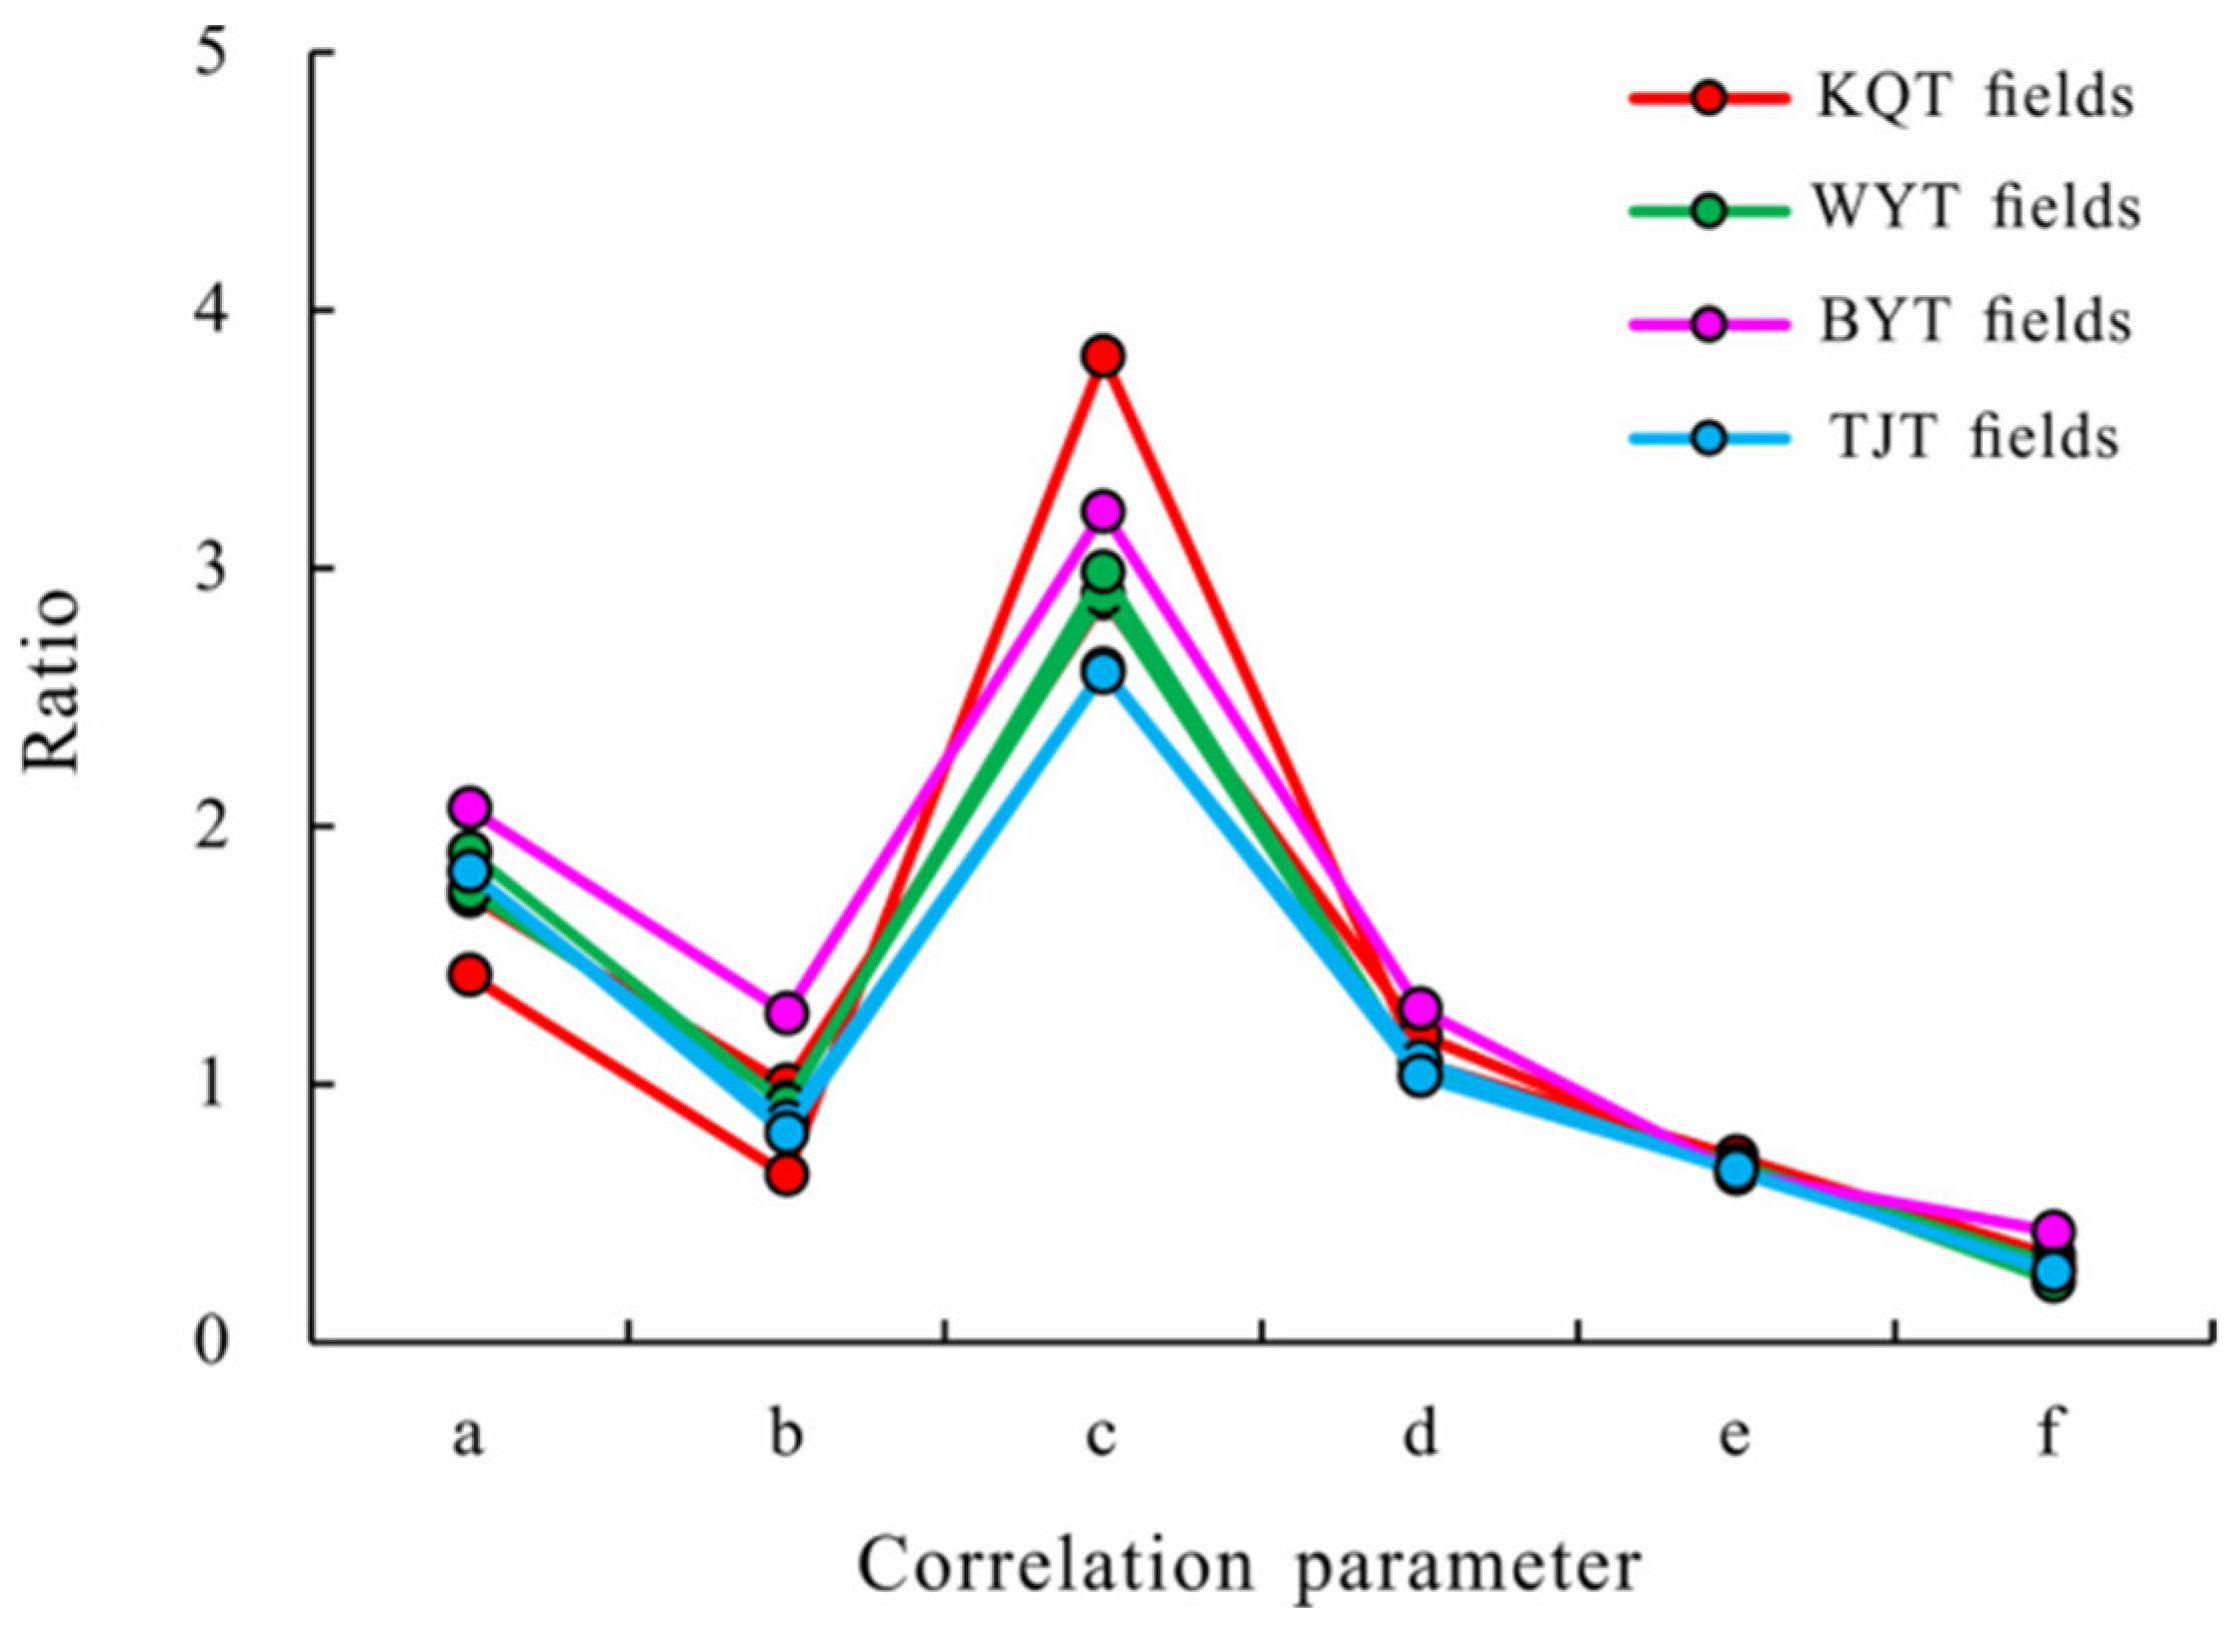
Figure 10.
Identification of the crude oil source.
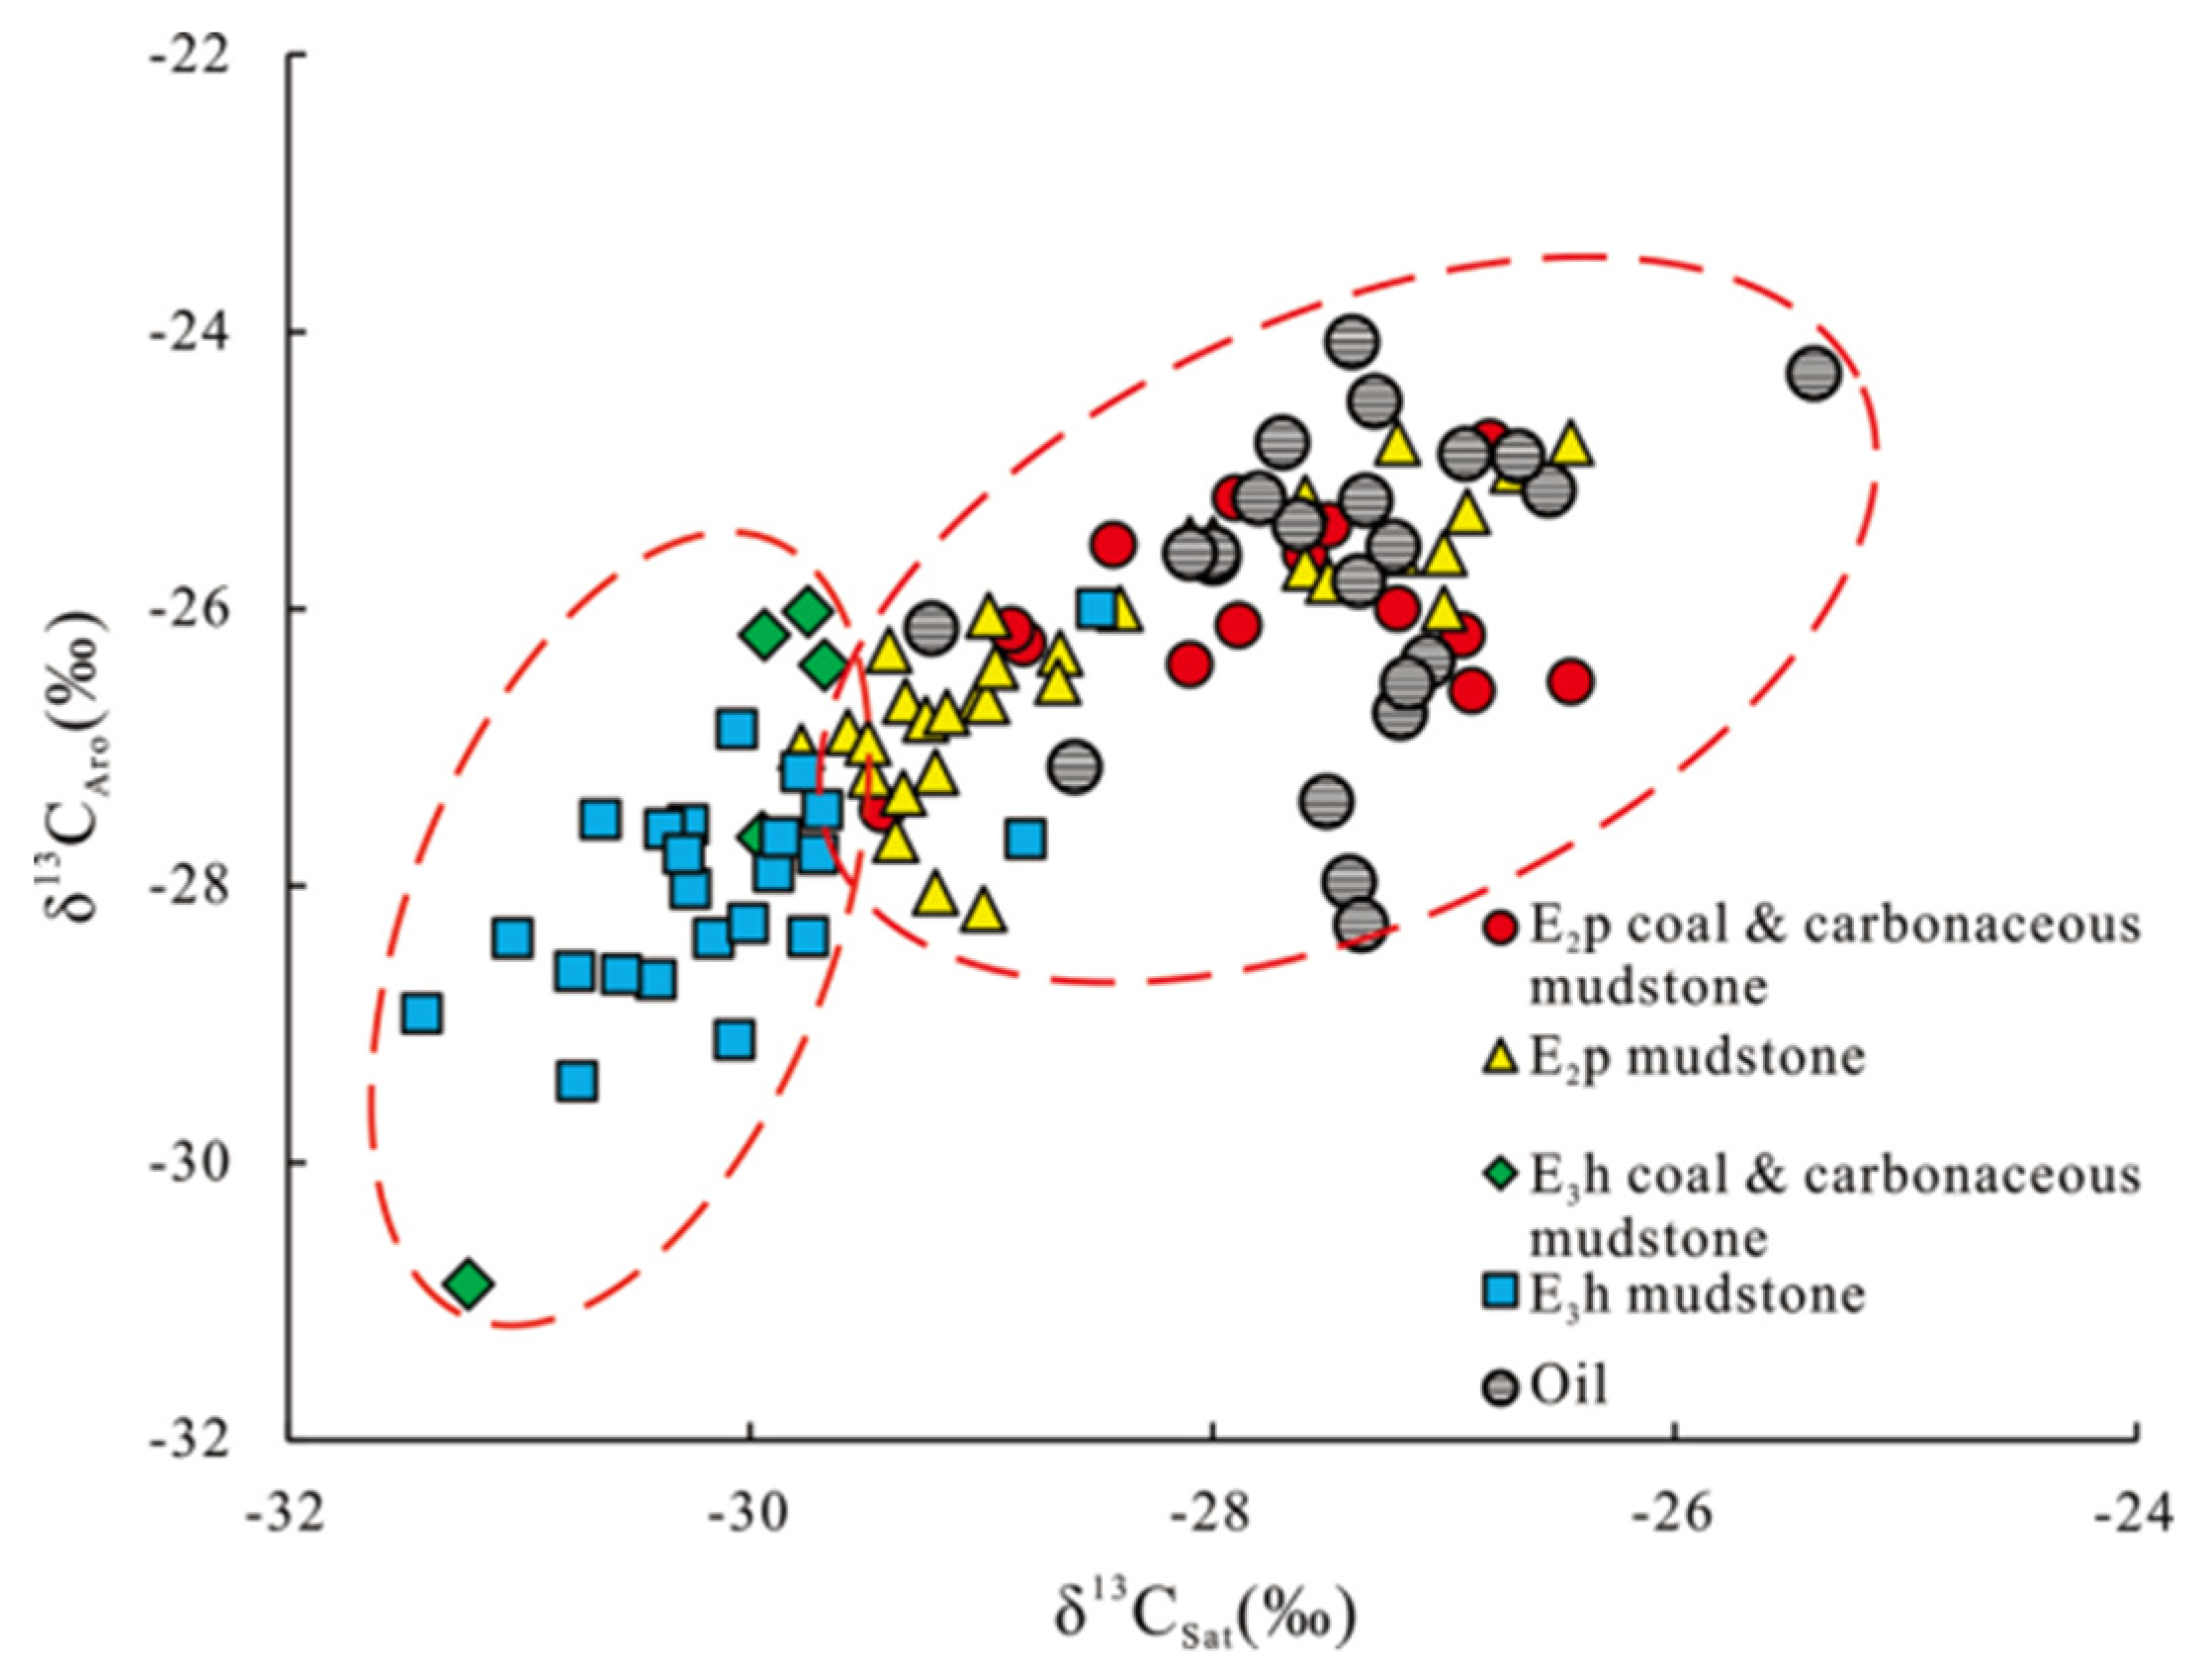
Figure 11.
Physical property distribution characteristics of the crude oil. The profile location can be observed in Figure 1.
Figure 11.
Physical property distribution characteristics of the crude oil. The profile location can be observed in Figure 1.
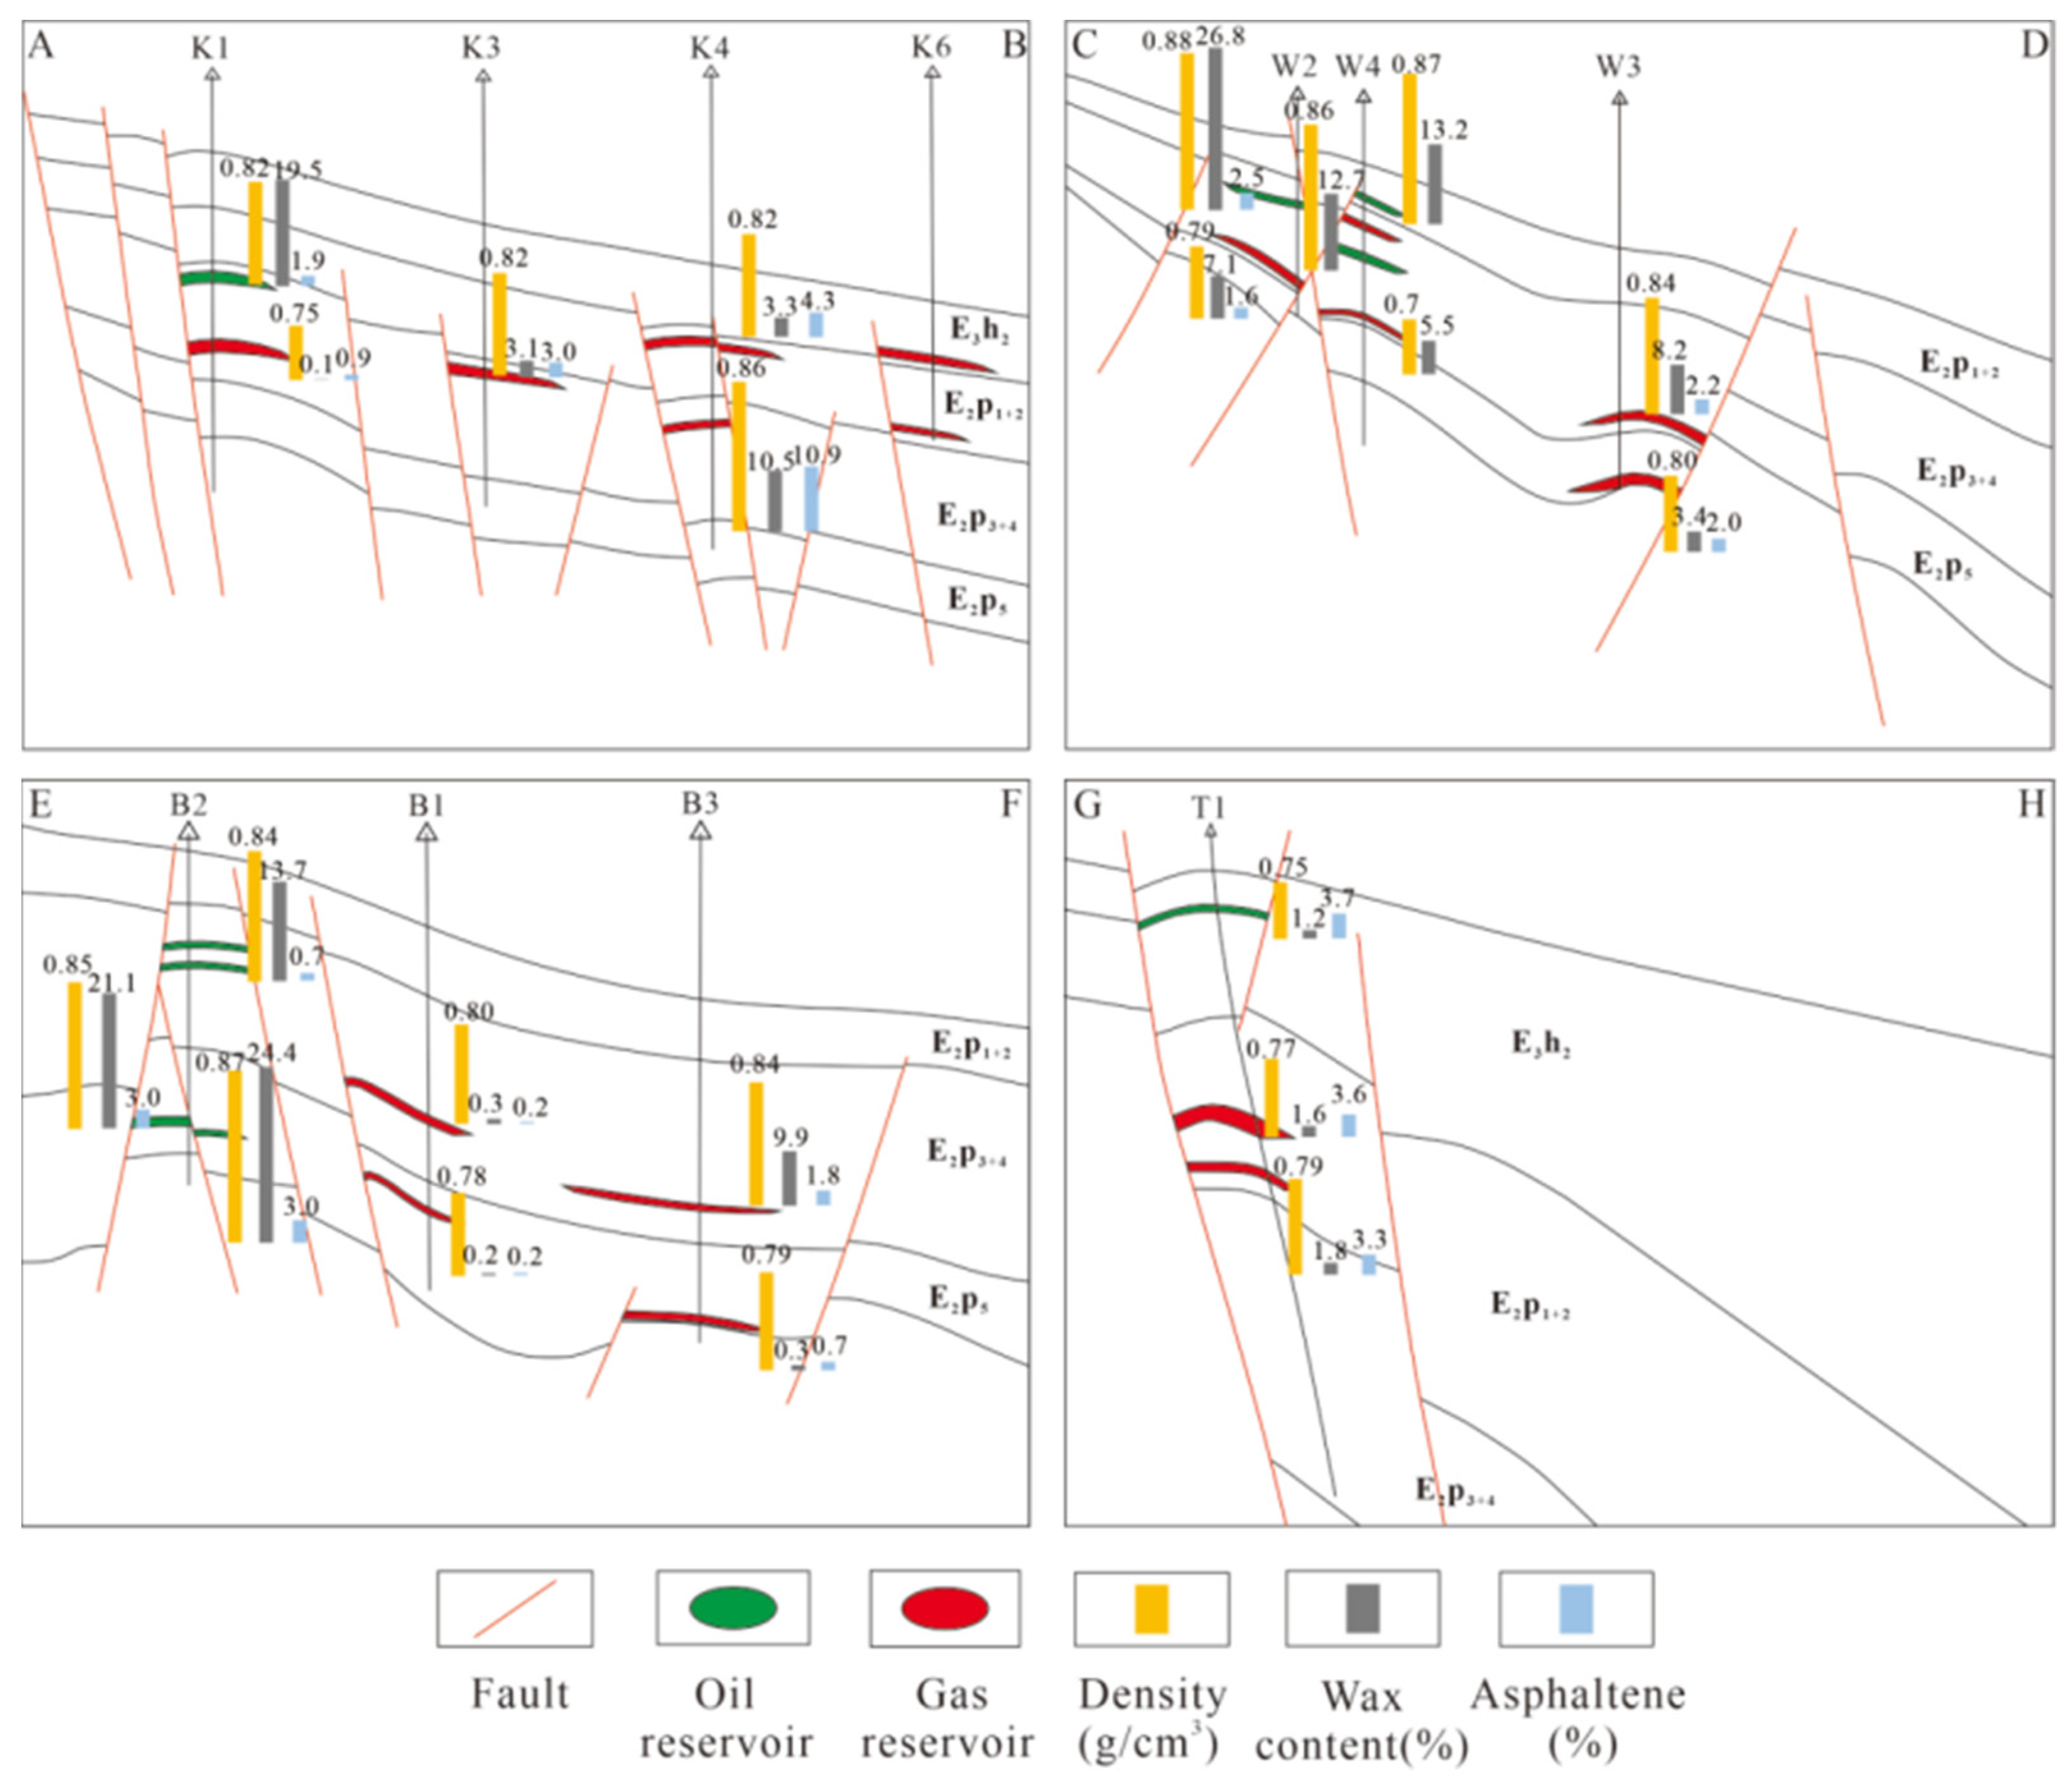
Figure 12.
Depth plots for the natural gas migration index.
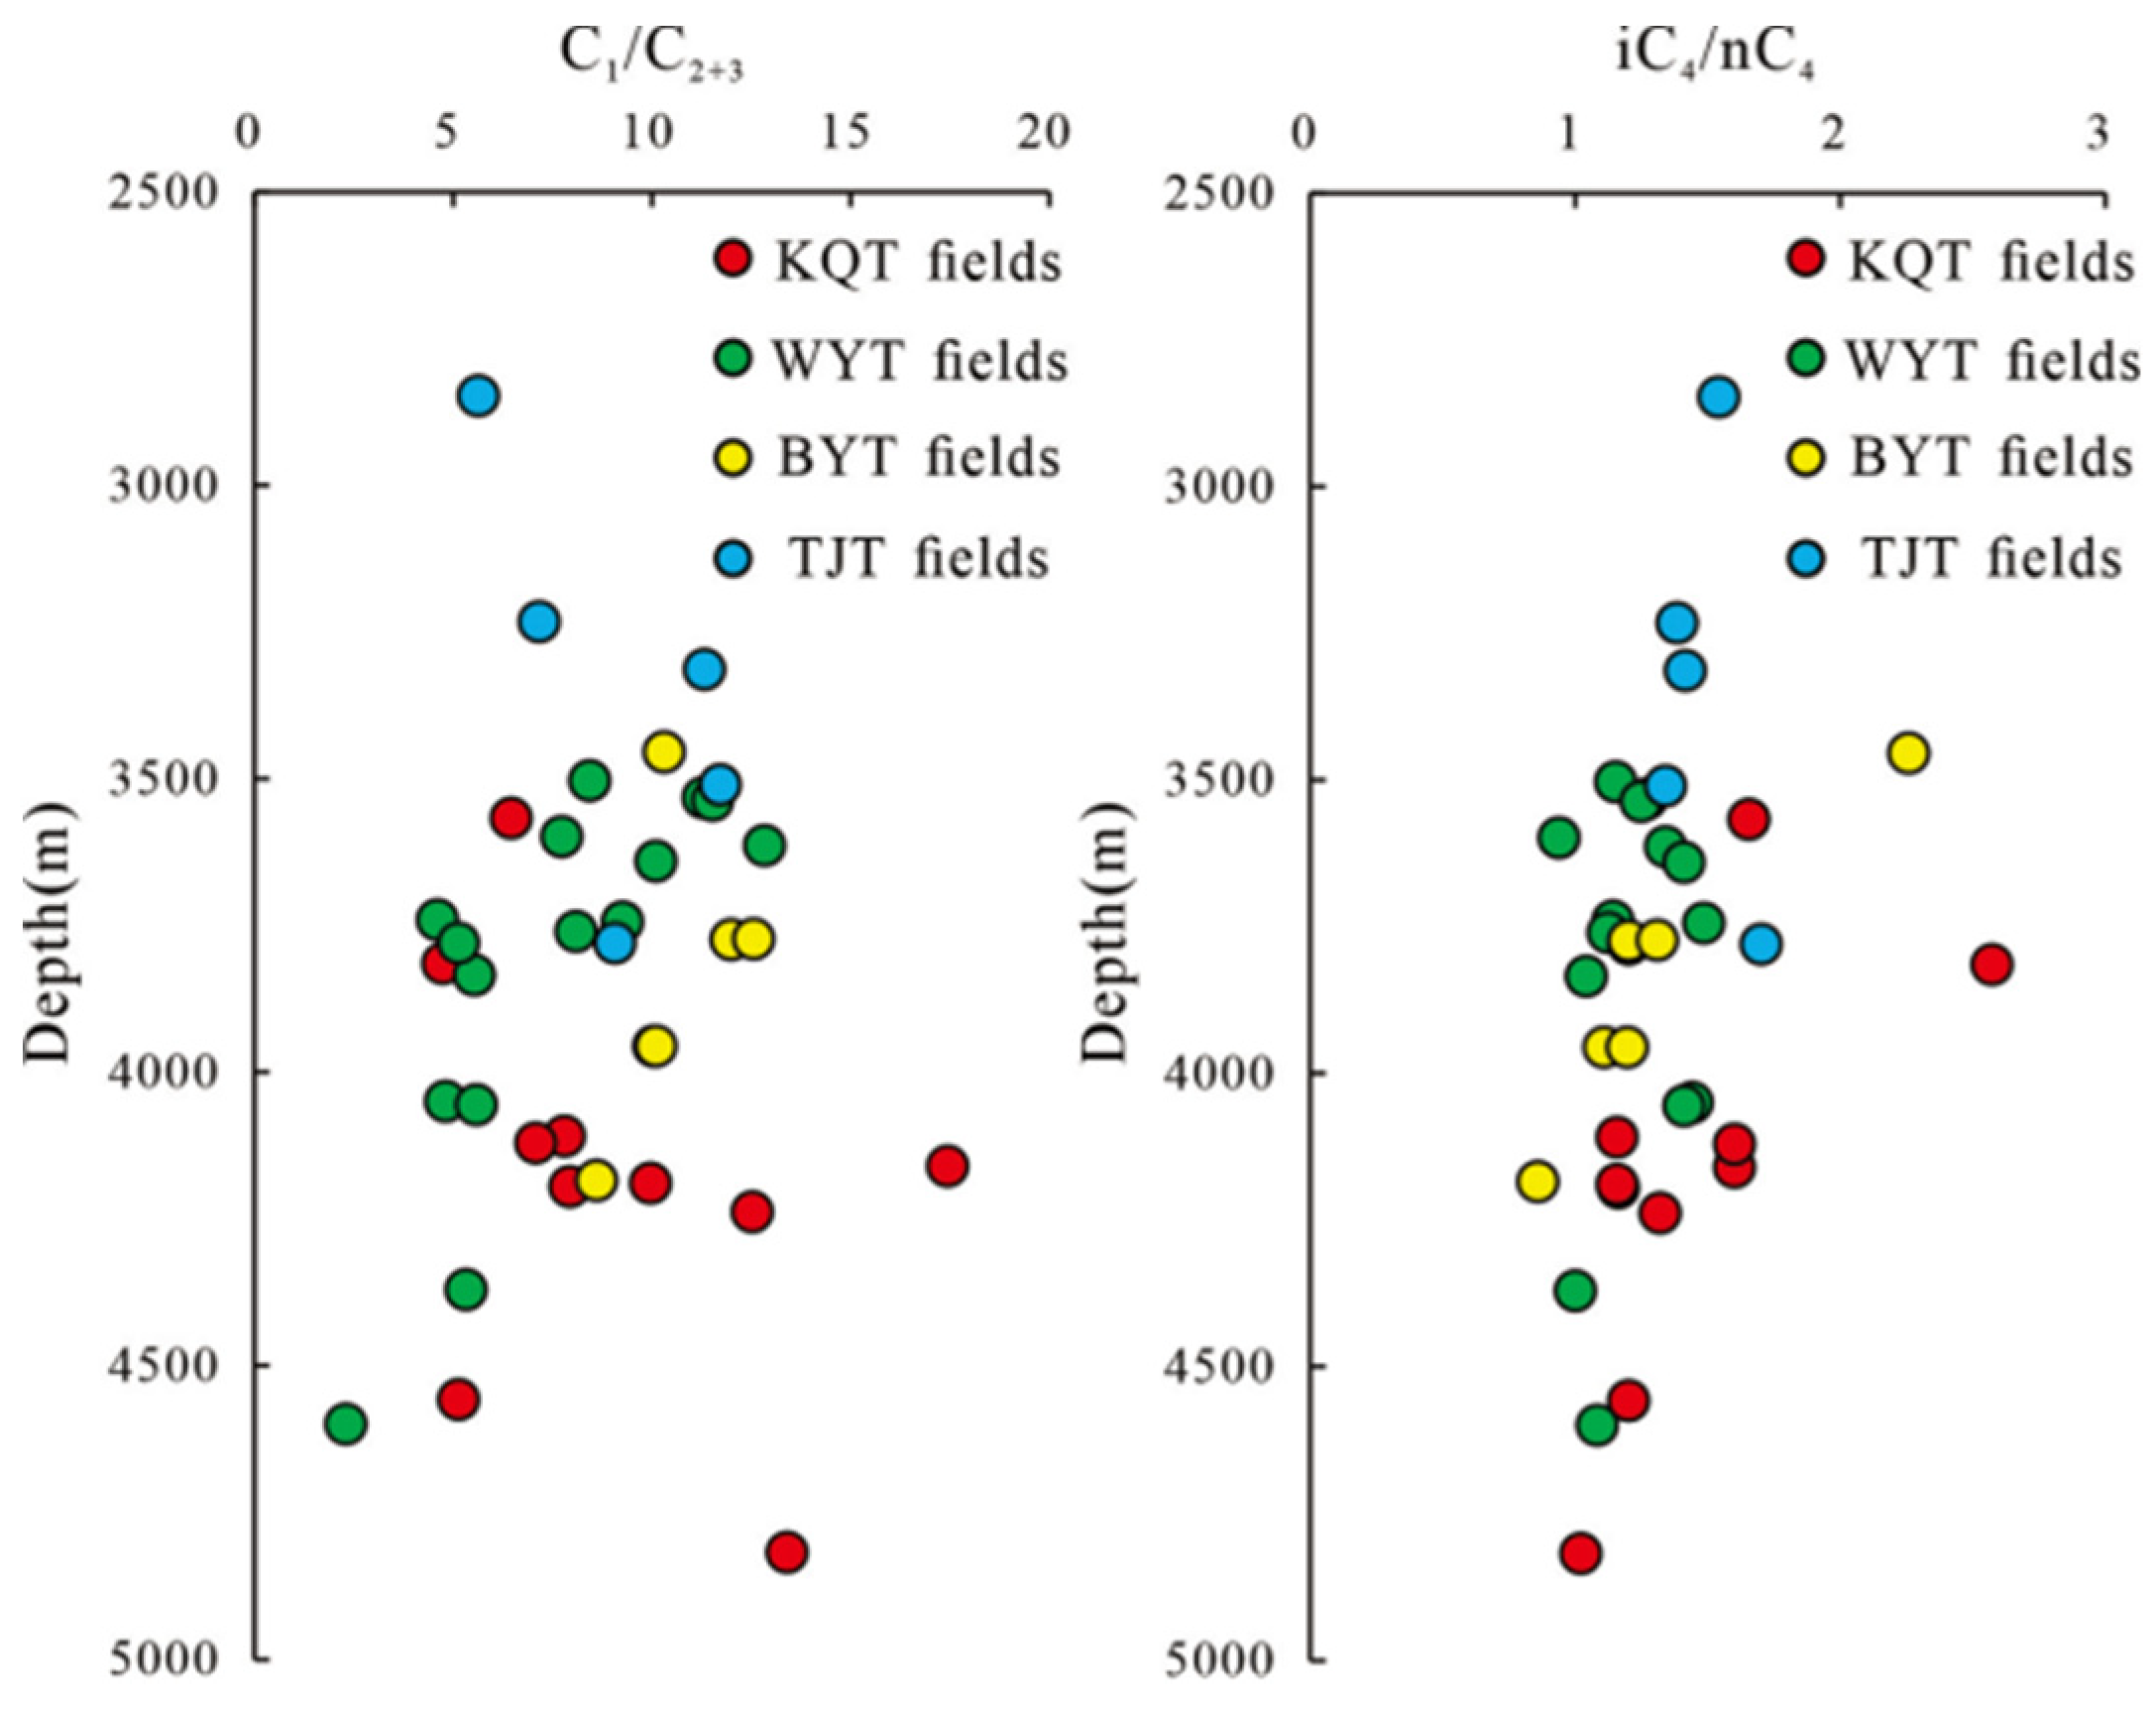
Figure 13.
Natural gas δ13C and Dg distribution profiles in the Pingbei area. The profile location can be observed in Figure 1.
Figure 13.
Natural gas δ13C and Dg distribution profiles in the Pingbei area. The profile location can be observed in Figure 1.
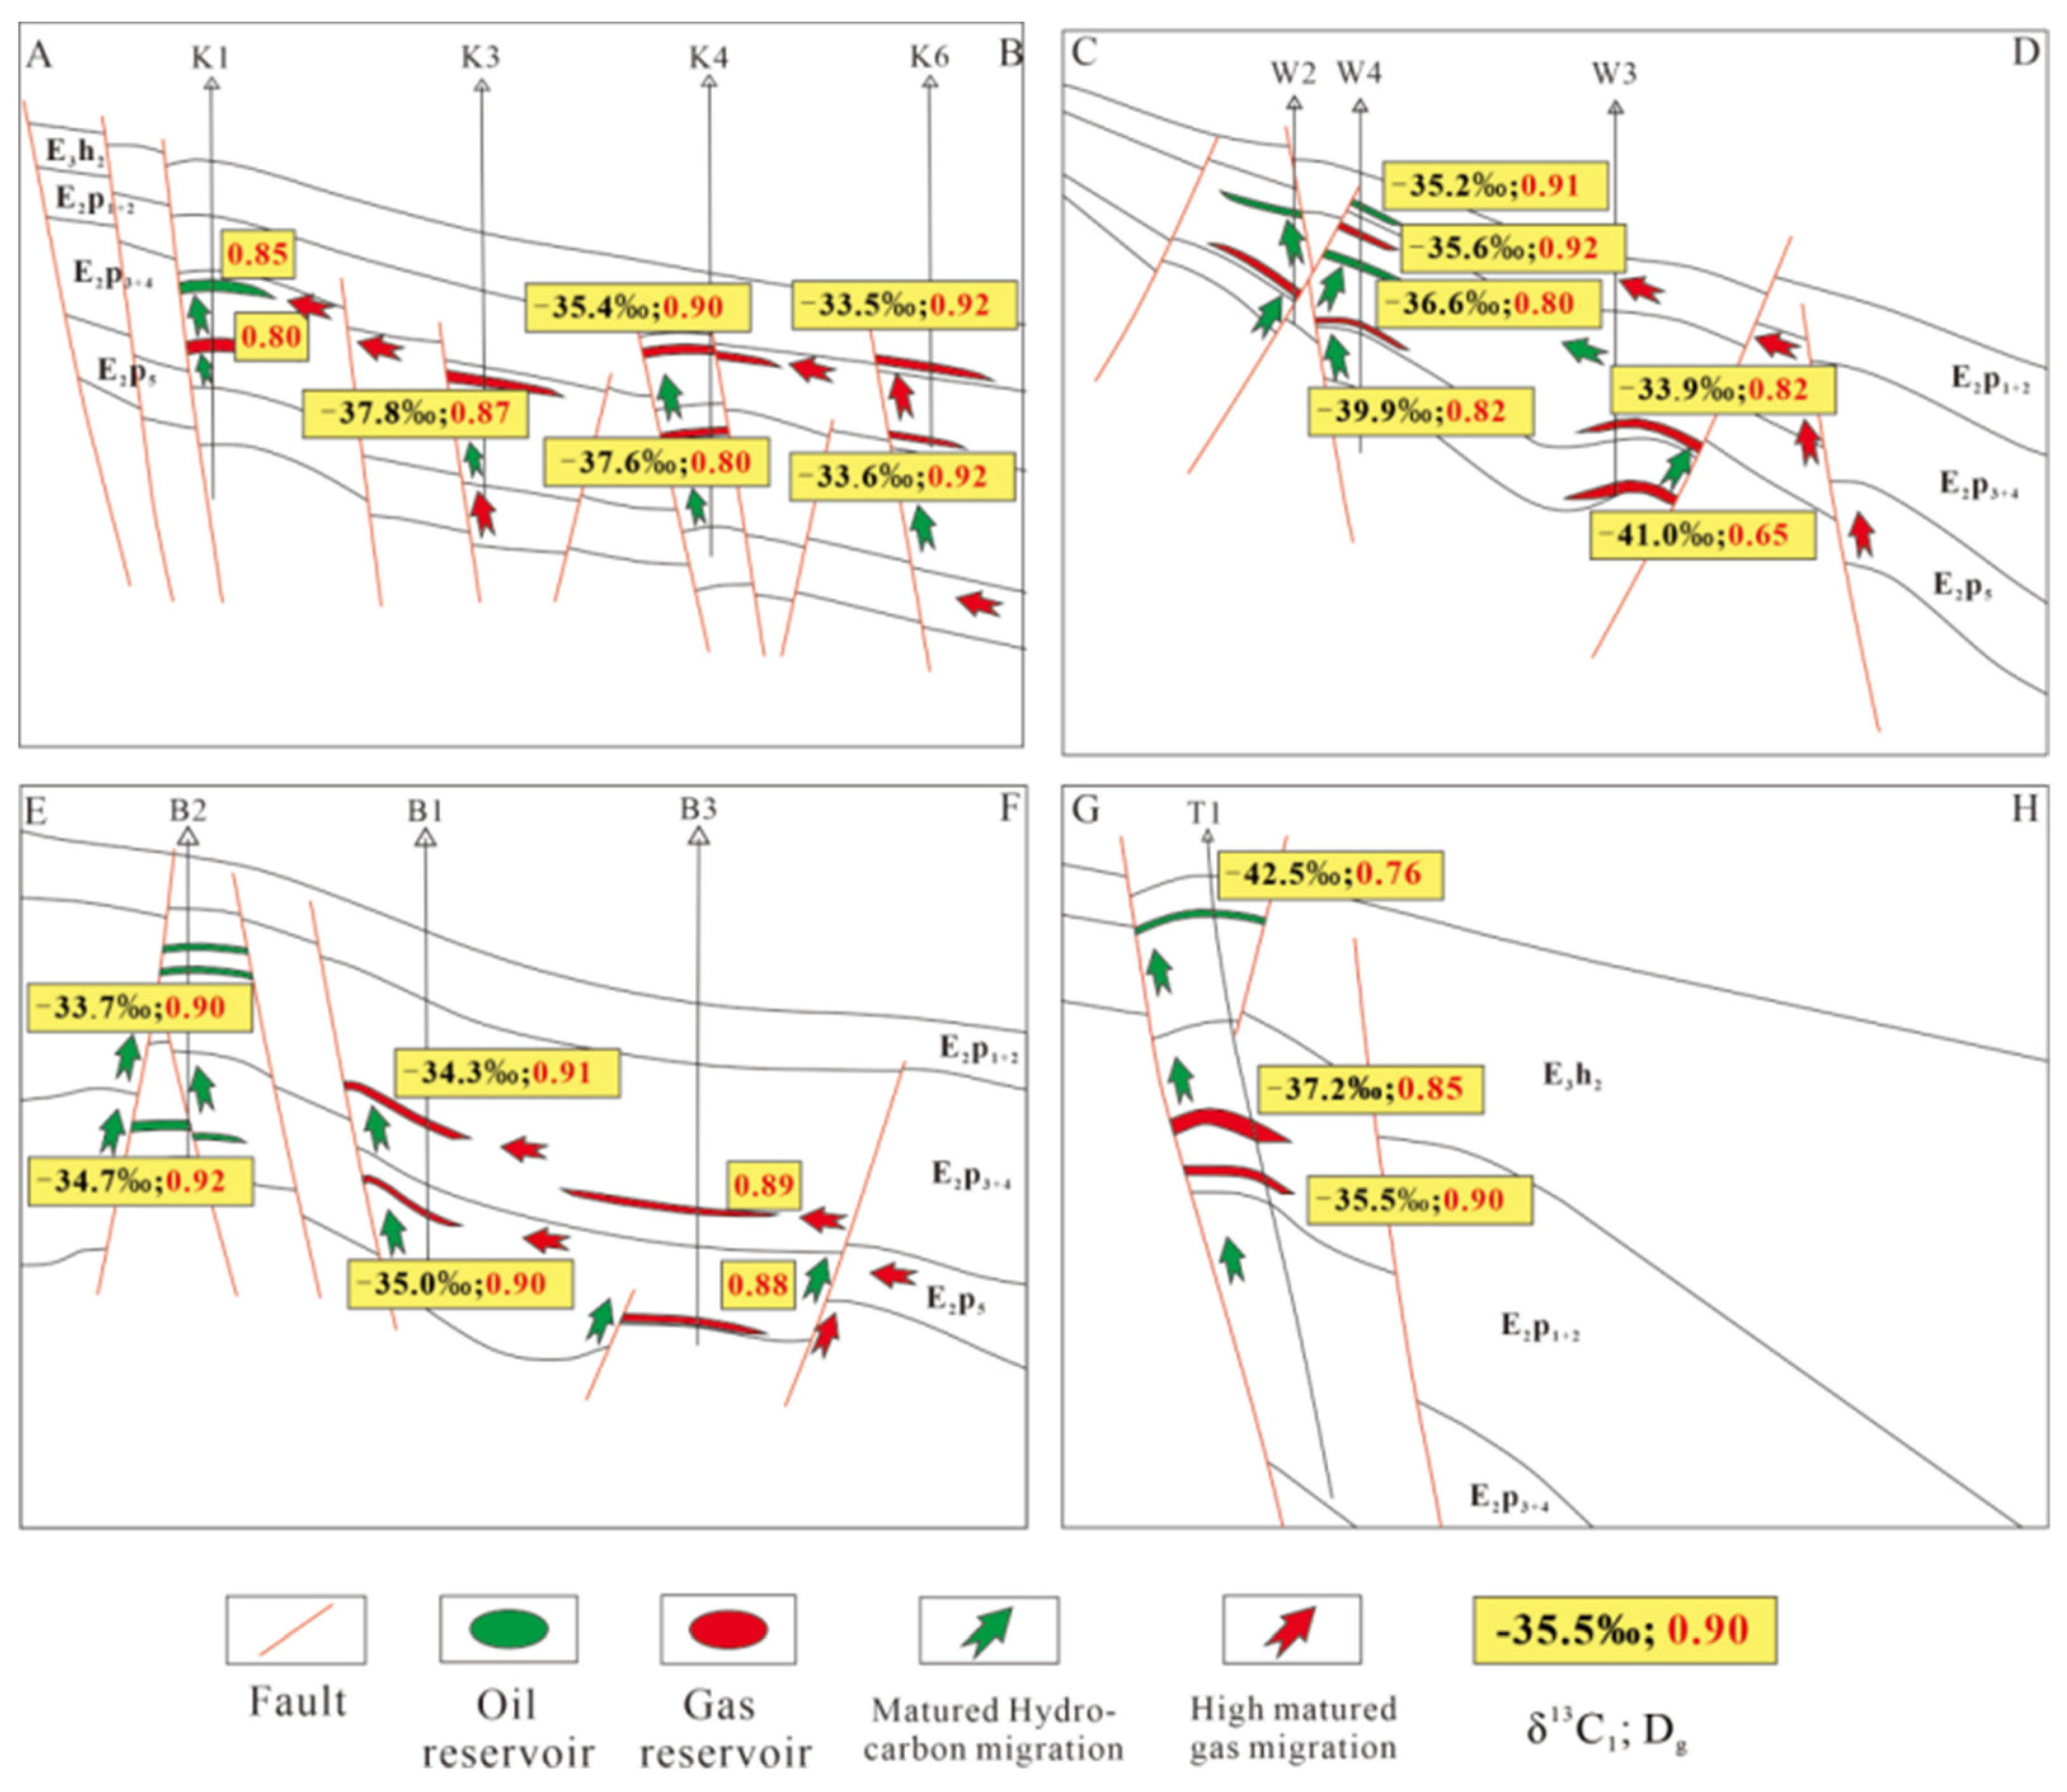
Table 1.
Natural gas composition data.
| Well | Depth/m | Formation | C1/% | C2/% | C3/% | iC4/% | nC4/% | iC5/% | nC5/% | N2/% | CO2/% | Dg |
|---|---|---|---|---|---|---|---|---|---|---|---|---|
| K1 | 3567 | E2p | 79.03 | 8.68 | 3.54 | 0.96 | 0.58 | 0.23 | 0.07 | 4.19 | 2.72 | 0.85 |
| 3815 | E2p | 75.96 | 10.33 | 5.70 | 1.80 | 0.70 | 0.25 | 0.12 | 1.70 | 3.40 | 0.80 | |
| K2* | 4160 | E2p | 89.10 | 4.48 | 0.63 | 0.16 | 0.10 | 0.05 | 0.03 | 0.36 | 5.00 | 0.94 |
| K3* | 4116 | E2p | 81.02 | 7.35 | 3.03 | 0.74 | 0.64 | 0.22 | 0.16 | 0.45 | 6.19 | 0.87 |
| 4195 | E2p | 81.42 | 7.29 | 2.97 | 0.72 | 0.62 | 0.22 | 0.16 | 0.18 | 6.19 | 0.87 | |
| K4 | 4190 | E2p | 85.51 | 6.28 | 2.30 | 0.59 | 0.51 | 0.18 | 0.13 | 0.20 | 4.11 | 0.90 |
| 4557 | E2p | 73.20 | 8.43 | 5.83 | 1.68 | 1.40 | 0.49 | 0.31 | 0.57 | 7.79 | 0.80 | |
| K6* | 4238 | E3h | 89.82 | 5.51 | 1.66 | 0.44 | 0.33 | 0.14 | 0.09 | 0.00 | 1.99 | 0.92 |
| 4818 | E2p | 91.61 | 5.33 | 1.50 | 0.36 | 0.36 | 0.18 | 0.14 | 0.45 | 0.01 | 0.92 | |
| K7 | 4121 | E2p | 79.43 | 8.38 | 2.84 | 1.04 | 0.65 | 0.28 | 0.20 | 0.59 | 6.29 | 0.86 |
| W1* | 3503 | E2p | 86.70 | 7.19 | 3.08 | 0.61 | 0.53 | 0.13 | 0.06 | 0.41 | 1.29 | 0.88 |
| W2* | 3599 | E2p | 84.89 | 7.80 | 3.17 | 0.74 | 0.79 | 0.38 | 0.22 | 0.22 | 1.79 | 0.87 |
| 3834 | E2p | 80.82 | 9.84 | 4.79 | 1.01 | 0.97 | 0.32 | 0.21 | 0.34 | 1.70 | 0.83 | |
| W3 | 4371 | E2p | 77.24 | 10.11 | 4.37 | 1.00 | 1.00 | 0.37 | 0.25 | 1.28 | 4.38 | 0.82 |
| 4600 | E2p | 59.47 | 14.97 | 10.95 | 2.81 | 2.60 | 0.82 | 0.52 | 7.87 | 0.00 | 0.65 | |
| W4* | 3532 | E2p | 87.88 | 5.76 | 2.02 | 0.37 | 0.29 | 0.07 | 0.04 | 0.61 | 2.94 | 0.91 |
| 3537 | E2p | 88.22 | 5.76 | 1.89 | 0.33 | 0.26 | 0.07 | 0.04 | 0.00 | 3.43 | 0.91 | |
| 3614 | E2p | 89.56 | 5.18 | 1.80 | 0.37 | 0.28 | 0.08 | 0.04 | 0.81 | 1.84 | 0.92 | |
| 3641 | E2p | 87.73 | 6.28 | 2.41 | 0.53 | 0.38 | 0.12 | 0.06 | 0.57 | 1.92 | 0.90 | |
| 3740 | E2p | 76.73 | 10.98 | 5.71 | 1.21 | 1.06 | 0.30 | 0.18 | 0.20 | 3.60 | 0.80 | |
| 3744 | E2p | 83.44 | 6.70 | 2.30 | 0.40 | 0.27 | 0.06 | 0.03 | 4.16 | 2.64 | 0.90 | |
| 3760 | E2p | 84.18 | 7.53 | 2.88 | 0.59 | 0.53 | 0.16 | 0.10 | 0.90 | 3.12 | 0.88 | |
| 3780 | E2p | 77.37 | 10.35 | 4.72 | 0.94 | 0.79 | 0.01 | 0.13 | 1.66 | 4.02 | 0.82 | |
| 4050 | E2p | 76.30 | 9.74 | 6.14 | 1.83 | 1.27 | 0.44 | 0.24 | 0.48 | 3.53 | 0.80 | |
| 4056 | E2p | 79.05 | 8.97 | 5.17 | 1.58 | 1.12 | 0.50 | 0.28 | 0.00 | 3.29 | 0.82 | |
| B1 | 3774 | E2p | 88.16 | 4.84 | 2.51 | 0.60 | 0.50 | 0.16 | 0.11 | 0.60 | 2.52 | 0.91 |
| 3955 | E2p | 86.47 | 5.58 | 3.02 | 0.62 | 0.56 | 0.13 | 0.10 | 1.56 | 1.96 | 0.90 | |
| B2 | 3455 | E2p | 89.21 | 5.98 | 2.67 | 0.88 | 0.39 | 0.22 | 0.08 | 0.49 | 0.08 | 0.90 |
| 3773 | E2p | 88.59 | 5.43 | 1.62 | 0.34 | 0.26 | 0.11 | 0.04 | 2.00 | 1.61 | 0.92 | |
| B3* | 3955 | E2p | 86.82 | 5.42 | 3.18 | 0.80 | 0.67 | 0.17 | 0.09 | 0.44 | 2.41 | 0.89 |
| 4184 | E2p | 86.92 | 6.94 | 3.16 | 0.60 | 0.70 | 0.00 | 0.00 | 0.67 | 1.01 | 0.88 | |
| T1* | 2848 | E3h | 73.08 | 7.06 | 5.89 | 4.36 | 2.83 | 1.77 | 0.89 | 1.89 | 1.55 | 0.76 |
| 3233 | E2p | 81.80 | 6.97 | 4.46 | 1.44 | 1.04 | 0.36 | 0.19 | 1.31 | 2.26 | 0.85 | |
| 3314 | E2p | 87.58 | 5.22 | 2.51 | 0.75 | 0.53 | 0.21 | 0.10 | 0.85 | 2.03 | 0.90 | |
| T2 | 3510 | E2p | 87.51 | 5.07 | 2.40 | 0.63 | 0.47 | 0.17 | 0.10 | 0.54 | 2.94 | 0.91 |
| 3780 | E2p | 87.06 | 5.57 | 4.02 | 1.31 | 0.77 | 0.32 | 0.16 | 0.45 | 0.00 | 0.88 |
* the experimental data, and the rest of the well data are quoted from reference [14], the same below.
Table 4.
Carbon isotope characteristics of the crude oil and its group components.
| Well | Depth/m | Formation | δ13C/‰, PDB | ||||
|---|---|---|---|---|---|---|---|
| Oil | Sat | Aro | Nso | Asp | |||
| K2 | 4160 | E2p | -24.8 | -25.4 | -24.3 | / | / |
| K5 | 4321 | E2p | -26.9 | -27.2 | -25.6 | -26.7 | -27.3 |
| W3 | 4371 | E2p | -25.9 | -27.3 | -24.5 | / | / |
| 4600 | E2p | -26.2 | -27.7 | -24.8 | / | / | |
| W4 | 3475 | E2p | -27.3 | -27.5 | -27.4 | -28.9 | -28.3 |
| 3532 | E2p | -27.3 | -27.4 | -28.0 | -29.7 | -28.1 | |
| 3537 | E2p | -27.2 | -28.0 | -25.6 | -26.4 | -27.5 | |
| 3546 | E2p | -27.0 | -27.1 | -26.4 | -27.7 | -27.5 | |
| 3614 | E2p | -26.6 | -27.6 | -25.4 | -26.1 | -27.0 | |
| 3641 | E2p | -26.8 | -27.3 | -25.2 | -26.0 | -26.9 | |
| 3744 | E2p | -26.9 | -27.4 | -25.8 | -26.2 | -27.3 | |
| 3760 | E2p | -27.2 | -27.2 | -26.8 | -29.0 | -28.0 | |
| 3780 | E2p | -26.9 | -27.2 | -26.5 | -27.9 | -28.1 | |
| B1 | 3955 | E2p | / | -27.8 | -25.2 | -26.5 | -26.2 |
| 3774 | E2p | / | -27.4 | -24.1 | -26.8 | -27.0 | |
| B2 | 3398 | E2p | / | -28.6 | -27.1 | / | / |
| 3453 | E2p | / | -27.4 | -28.3 | -27.1 | / | |
| 3773 | E2p | / | -29.2 | -26.1 | / | / | |
| T1 | 2848 | E3h | -26.3 | -26.6 | -25.1 | / | / |
| 3233 | E2p | -26.2 | -26.9 | -24.9 | / | / | |
| 3314 | E2p | -26.1 | -26.7 | -24.9 | / | / | |
| T2 | 3510 | E2p | -26.4 | -28.0 | -25.6 | / | / |
| 3780 | E2p | -26.9 | -28.1 | -25.6 | / | / | |
Disclaimer/Publisher’s Note: The statements, opinions and data contained in all publications are solely those of the individual author(s) and contributor(s) and not of MDPI and/or the editor(s). MDPI and/or the editor(s) disclaim responsibility for any injury to people or property resulting from any ideas, methods, instructions or products referred to in the content. |
© 2023 by the authors. Licensee MDPI, Basel, Switzerland. This article is an open access article distributed under the terms and conditions of the Creative Commons Attribution (CC BY) license (http://creativecommons.org/licenses/by/4.0/).
Copyright: This open access article is published under a Creative Commons CC BY 4.0 license, which permit the free download, distribution, and reuse, provided that the author and preprint are cited in any reuse.


