Submitted:
13 July 2023
Posted:
14 July 2023
You are already at the latest version
Abstract
Keywords:
1. Introduction
2. Background
3. Methods
3.1. Attractor Selection Model (ASM)
3.2. Dynamical Response Threshold Model (DRTM)
3.3. Simulation Setup
3.4. Performance Measures
4. Results
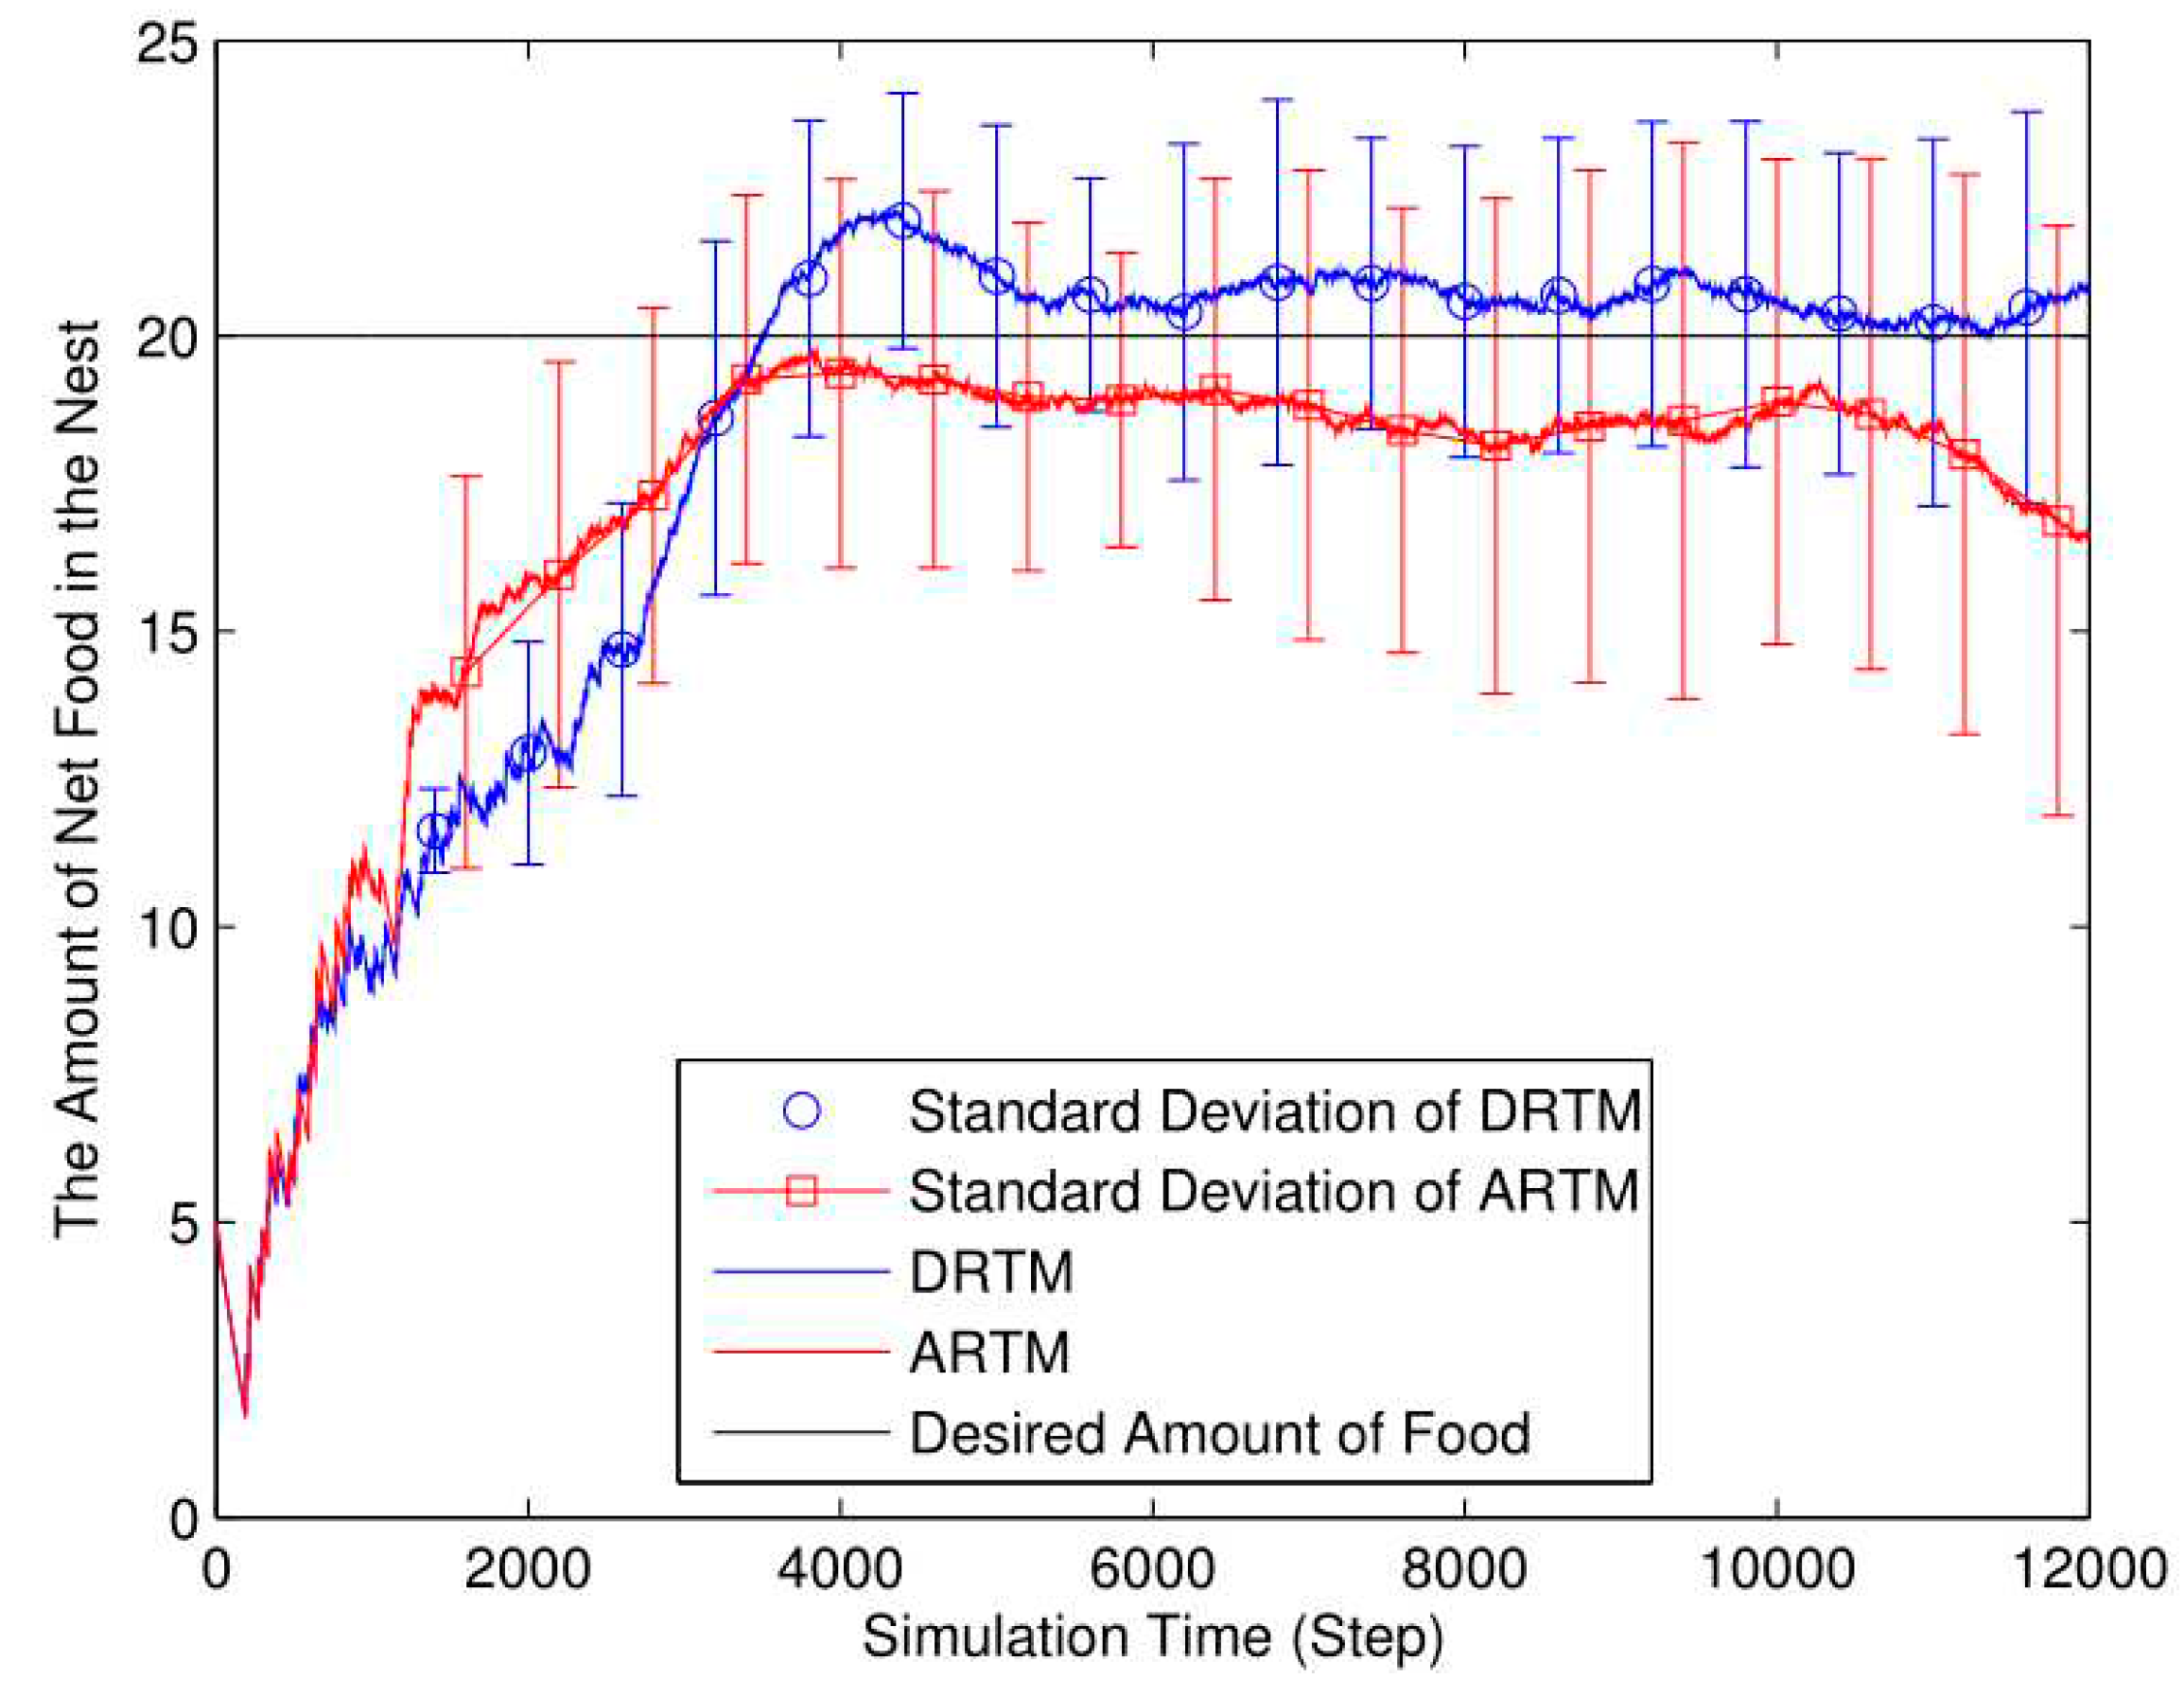
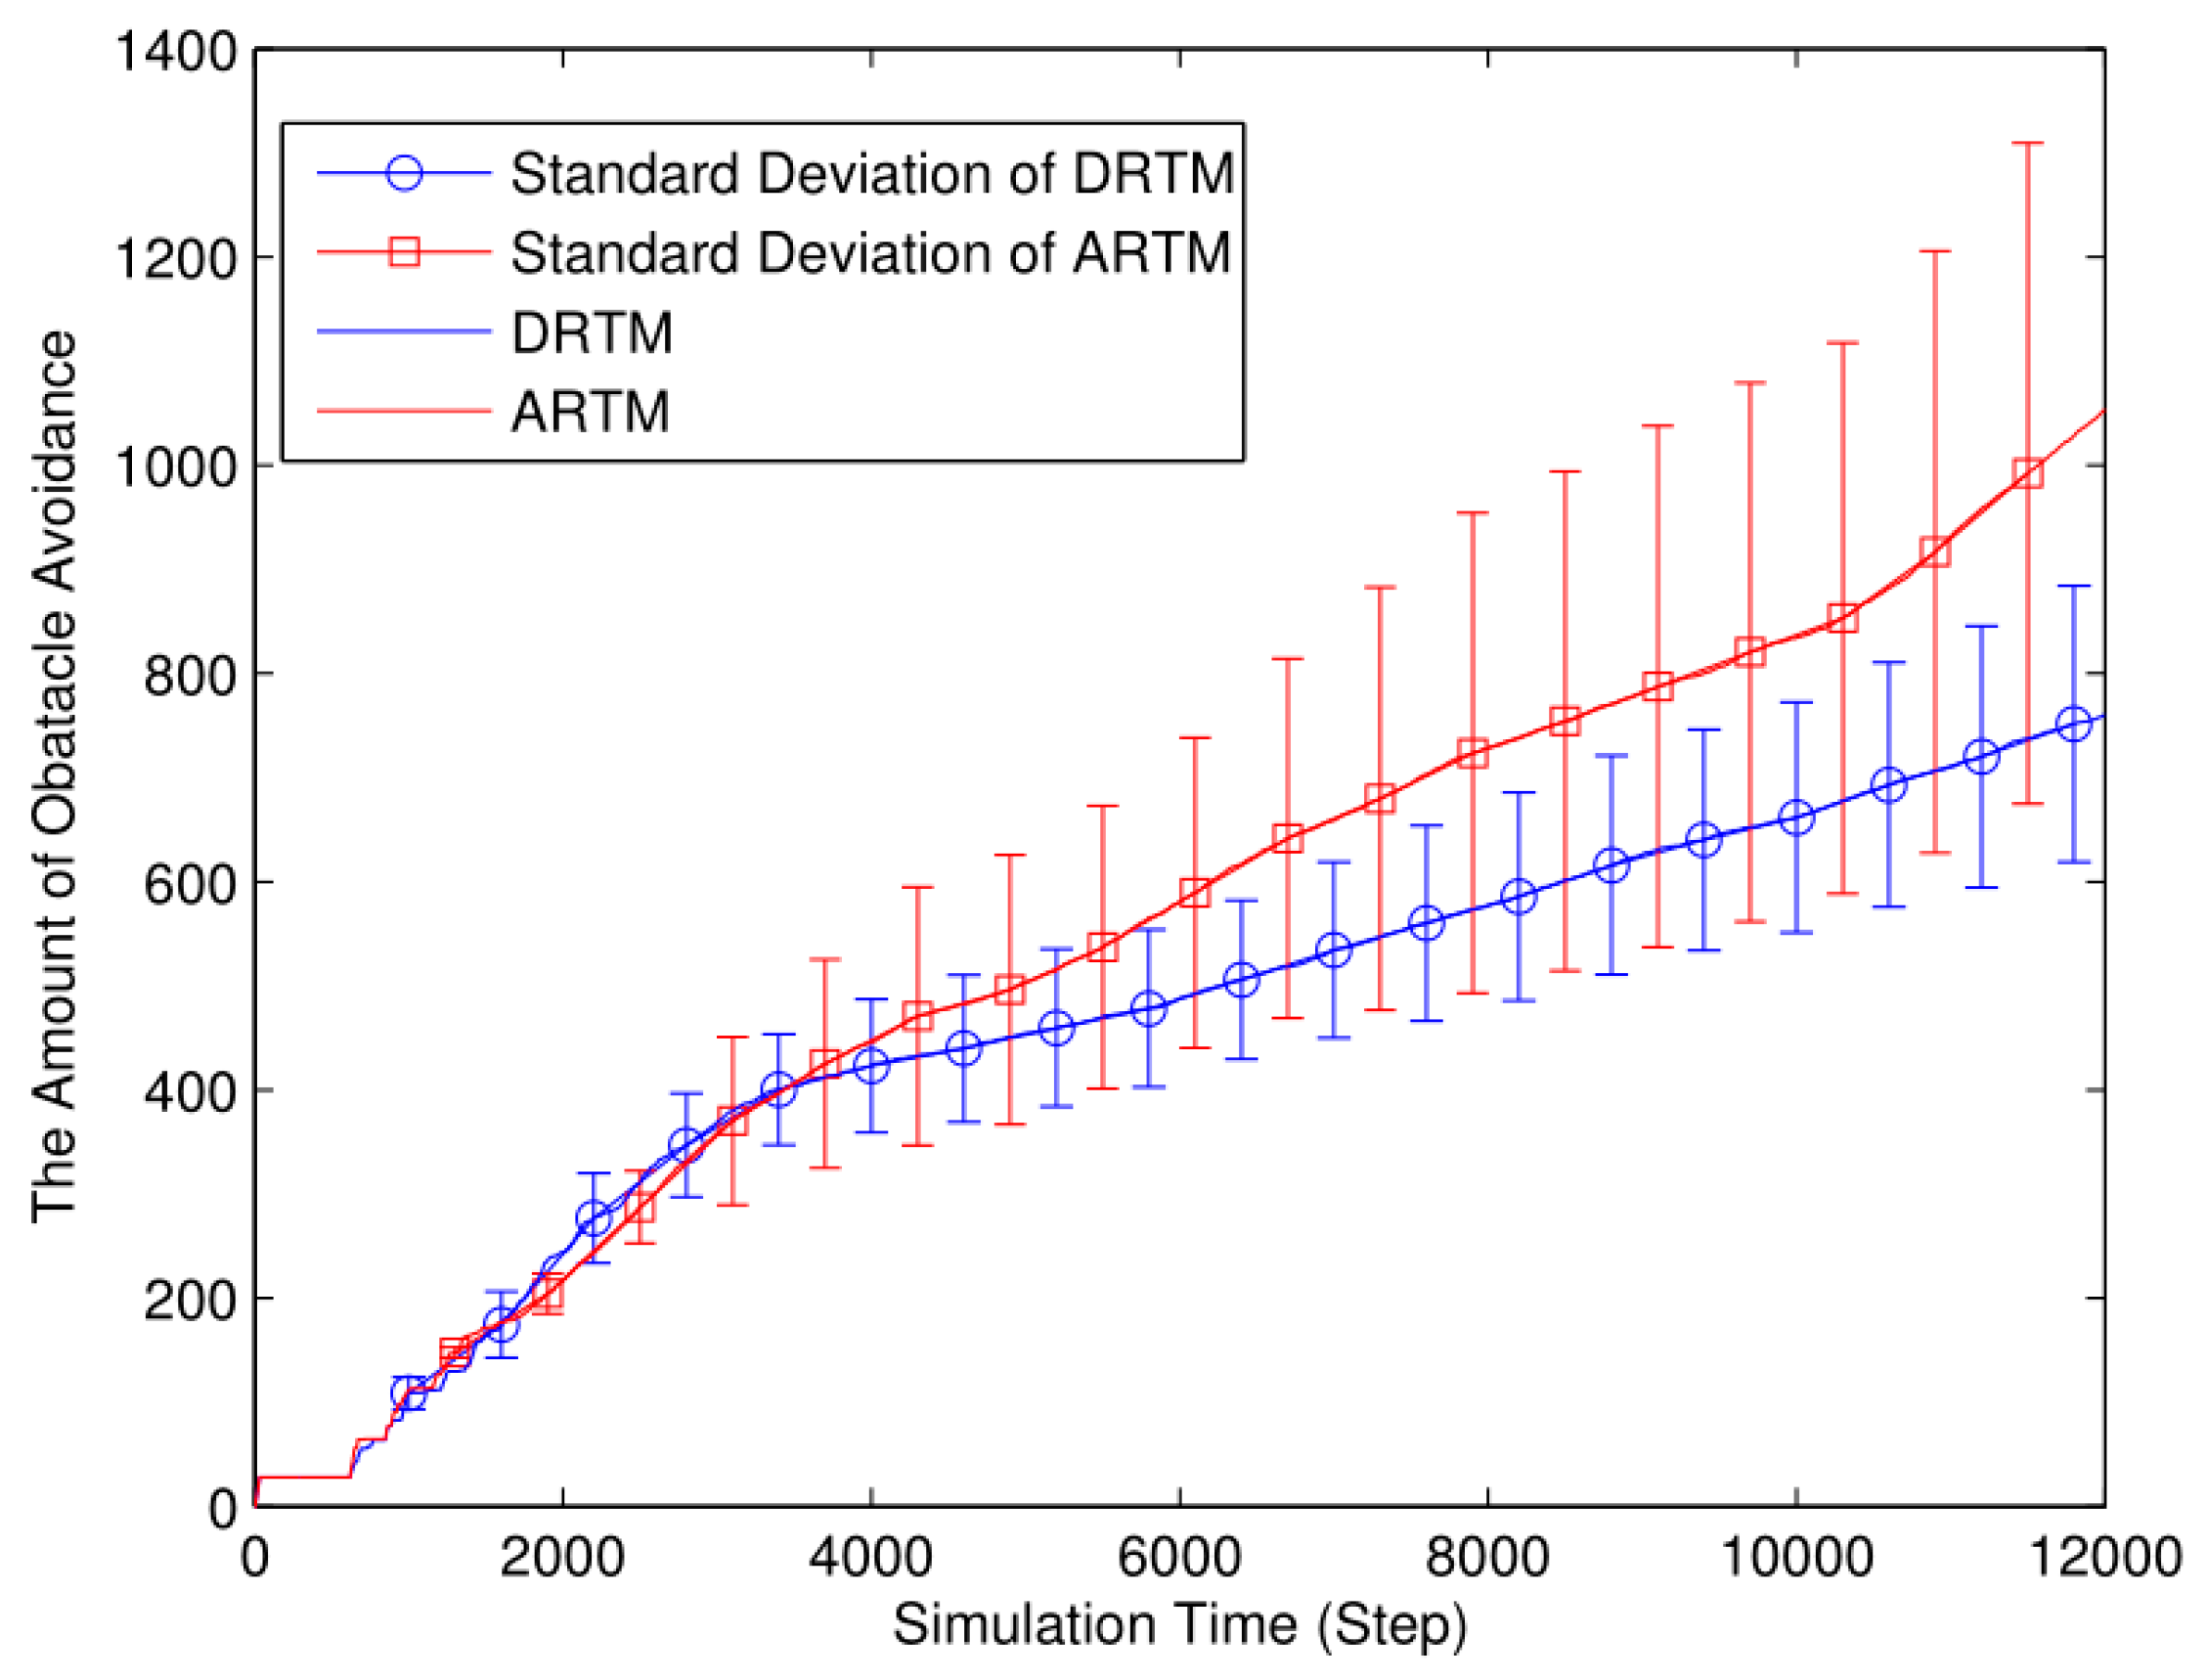
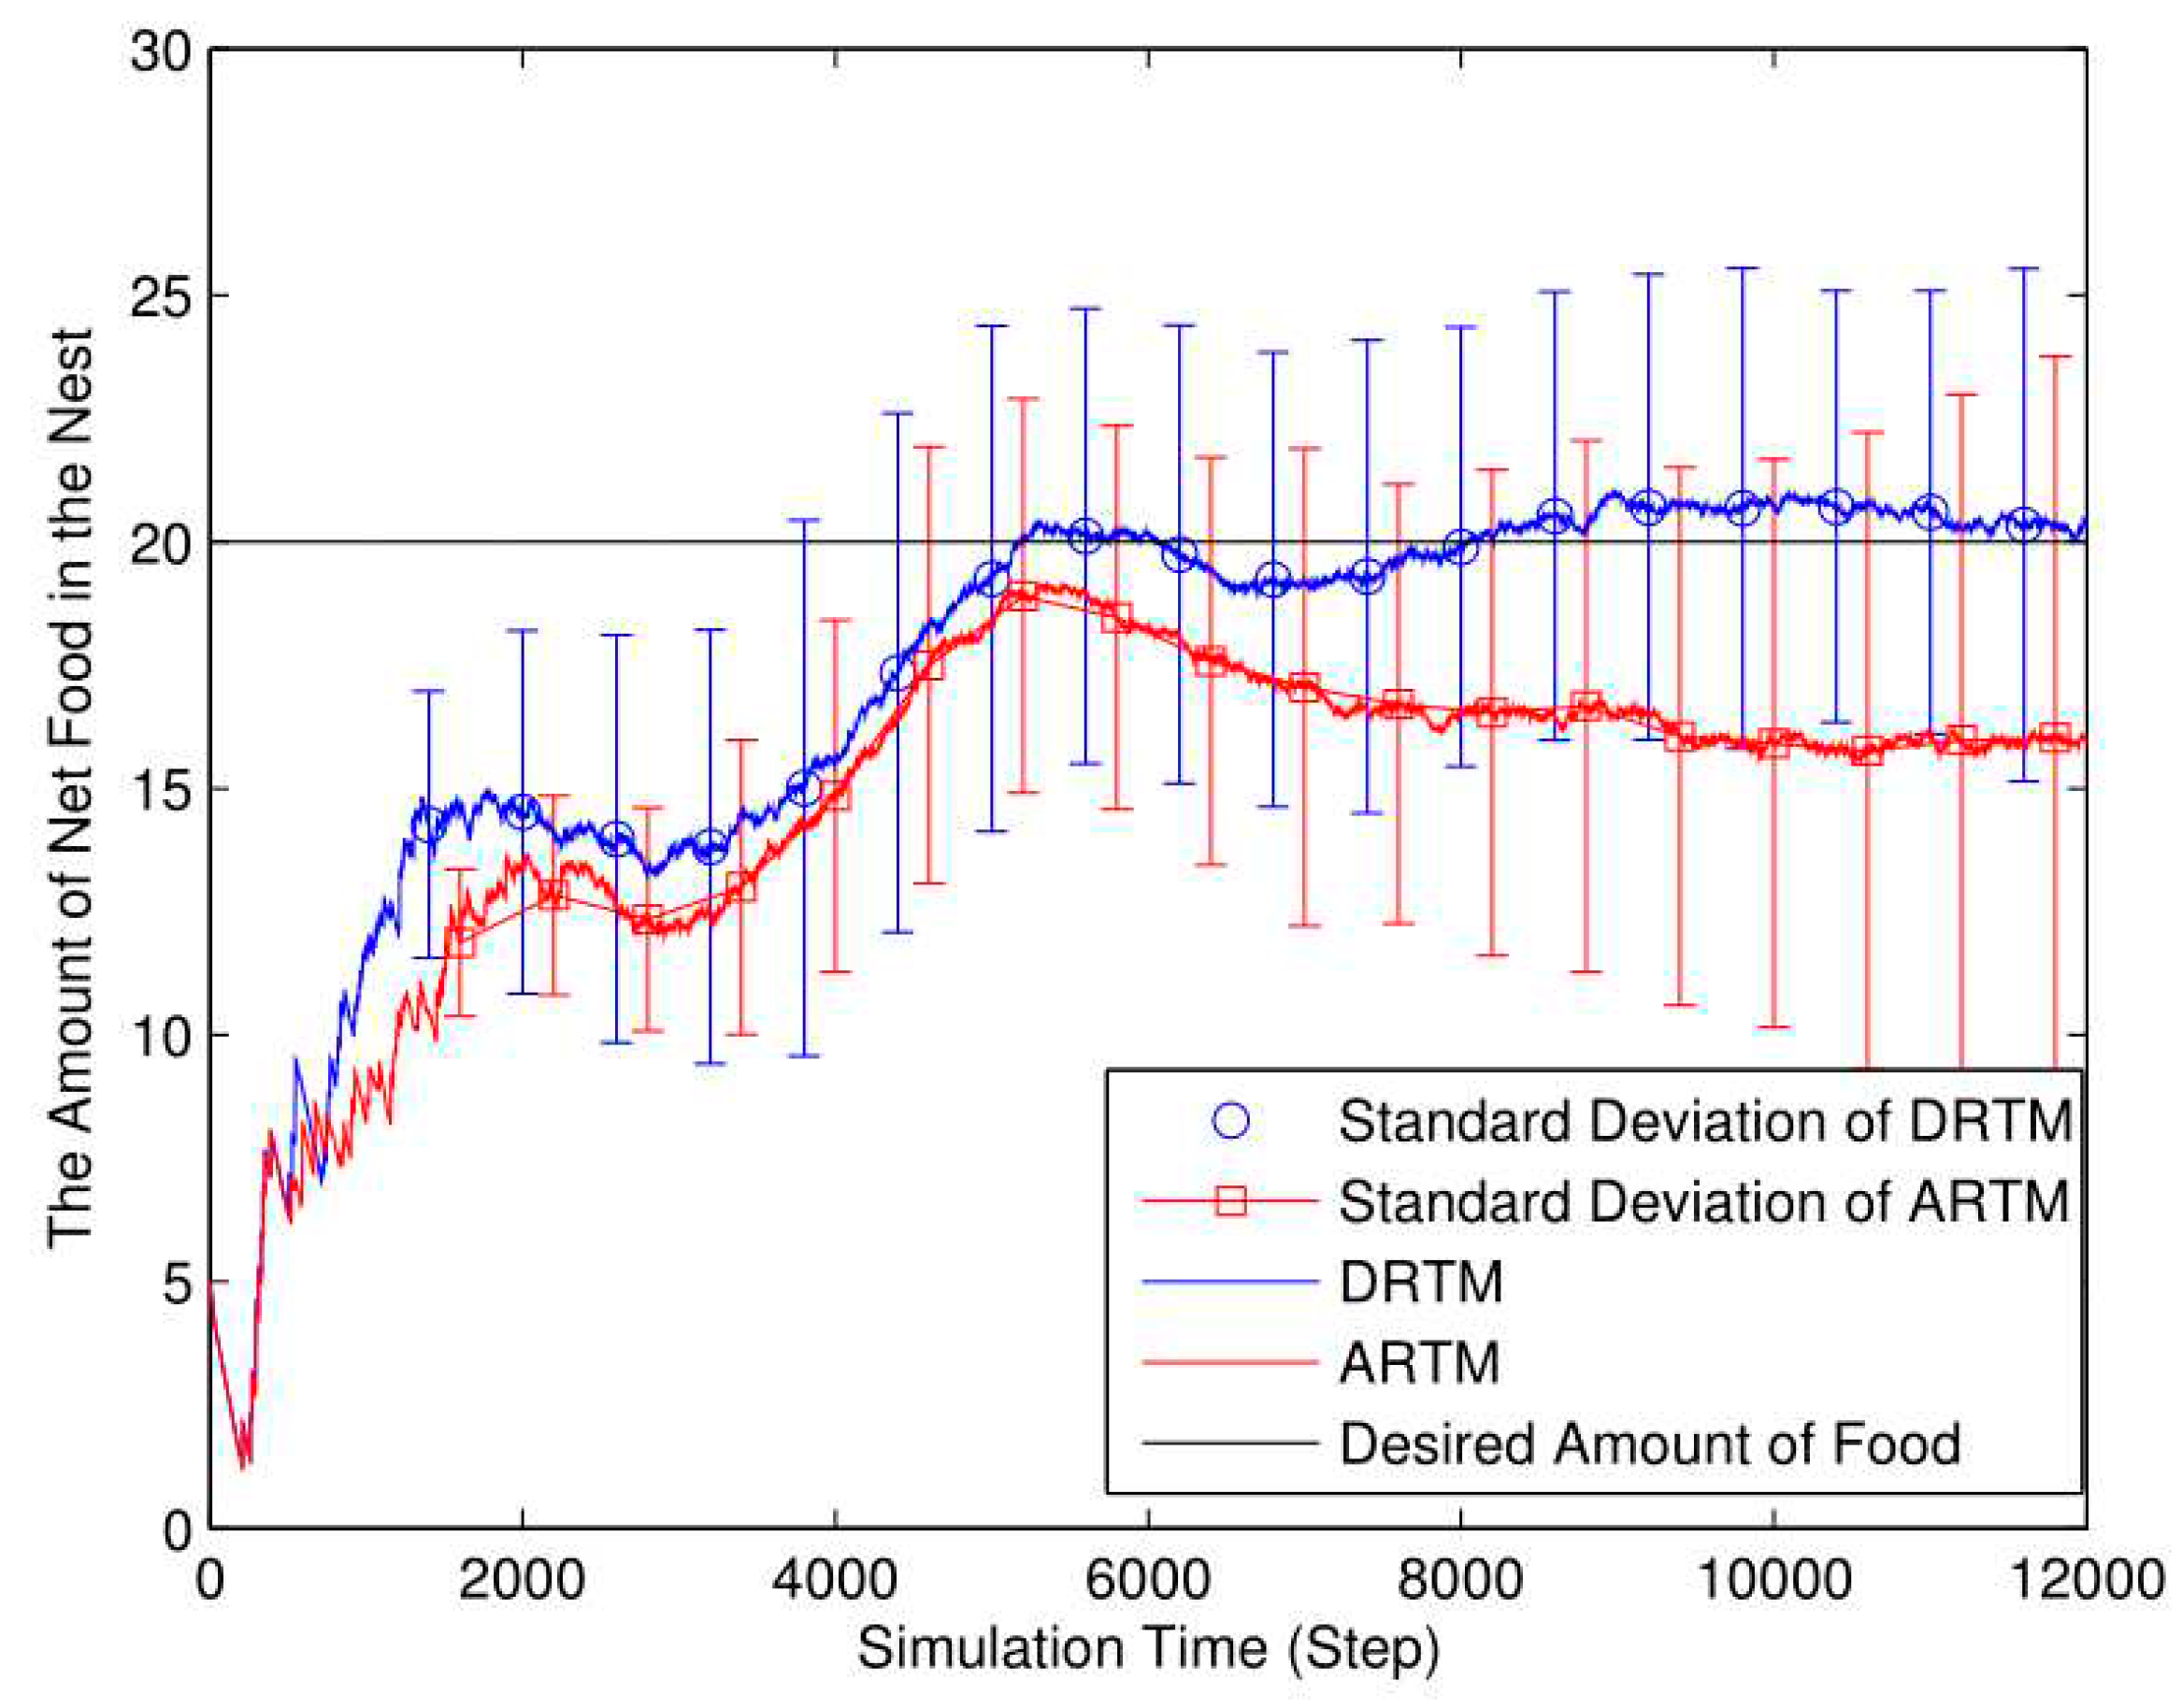
4.1. Simulation Experiment
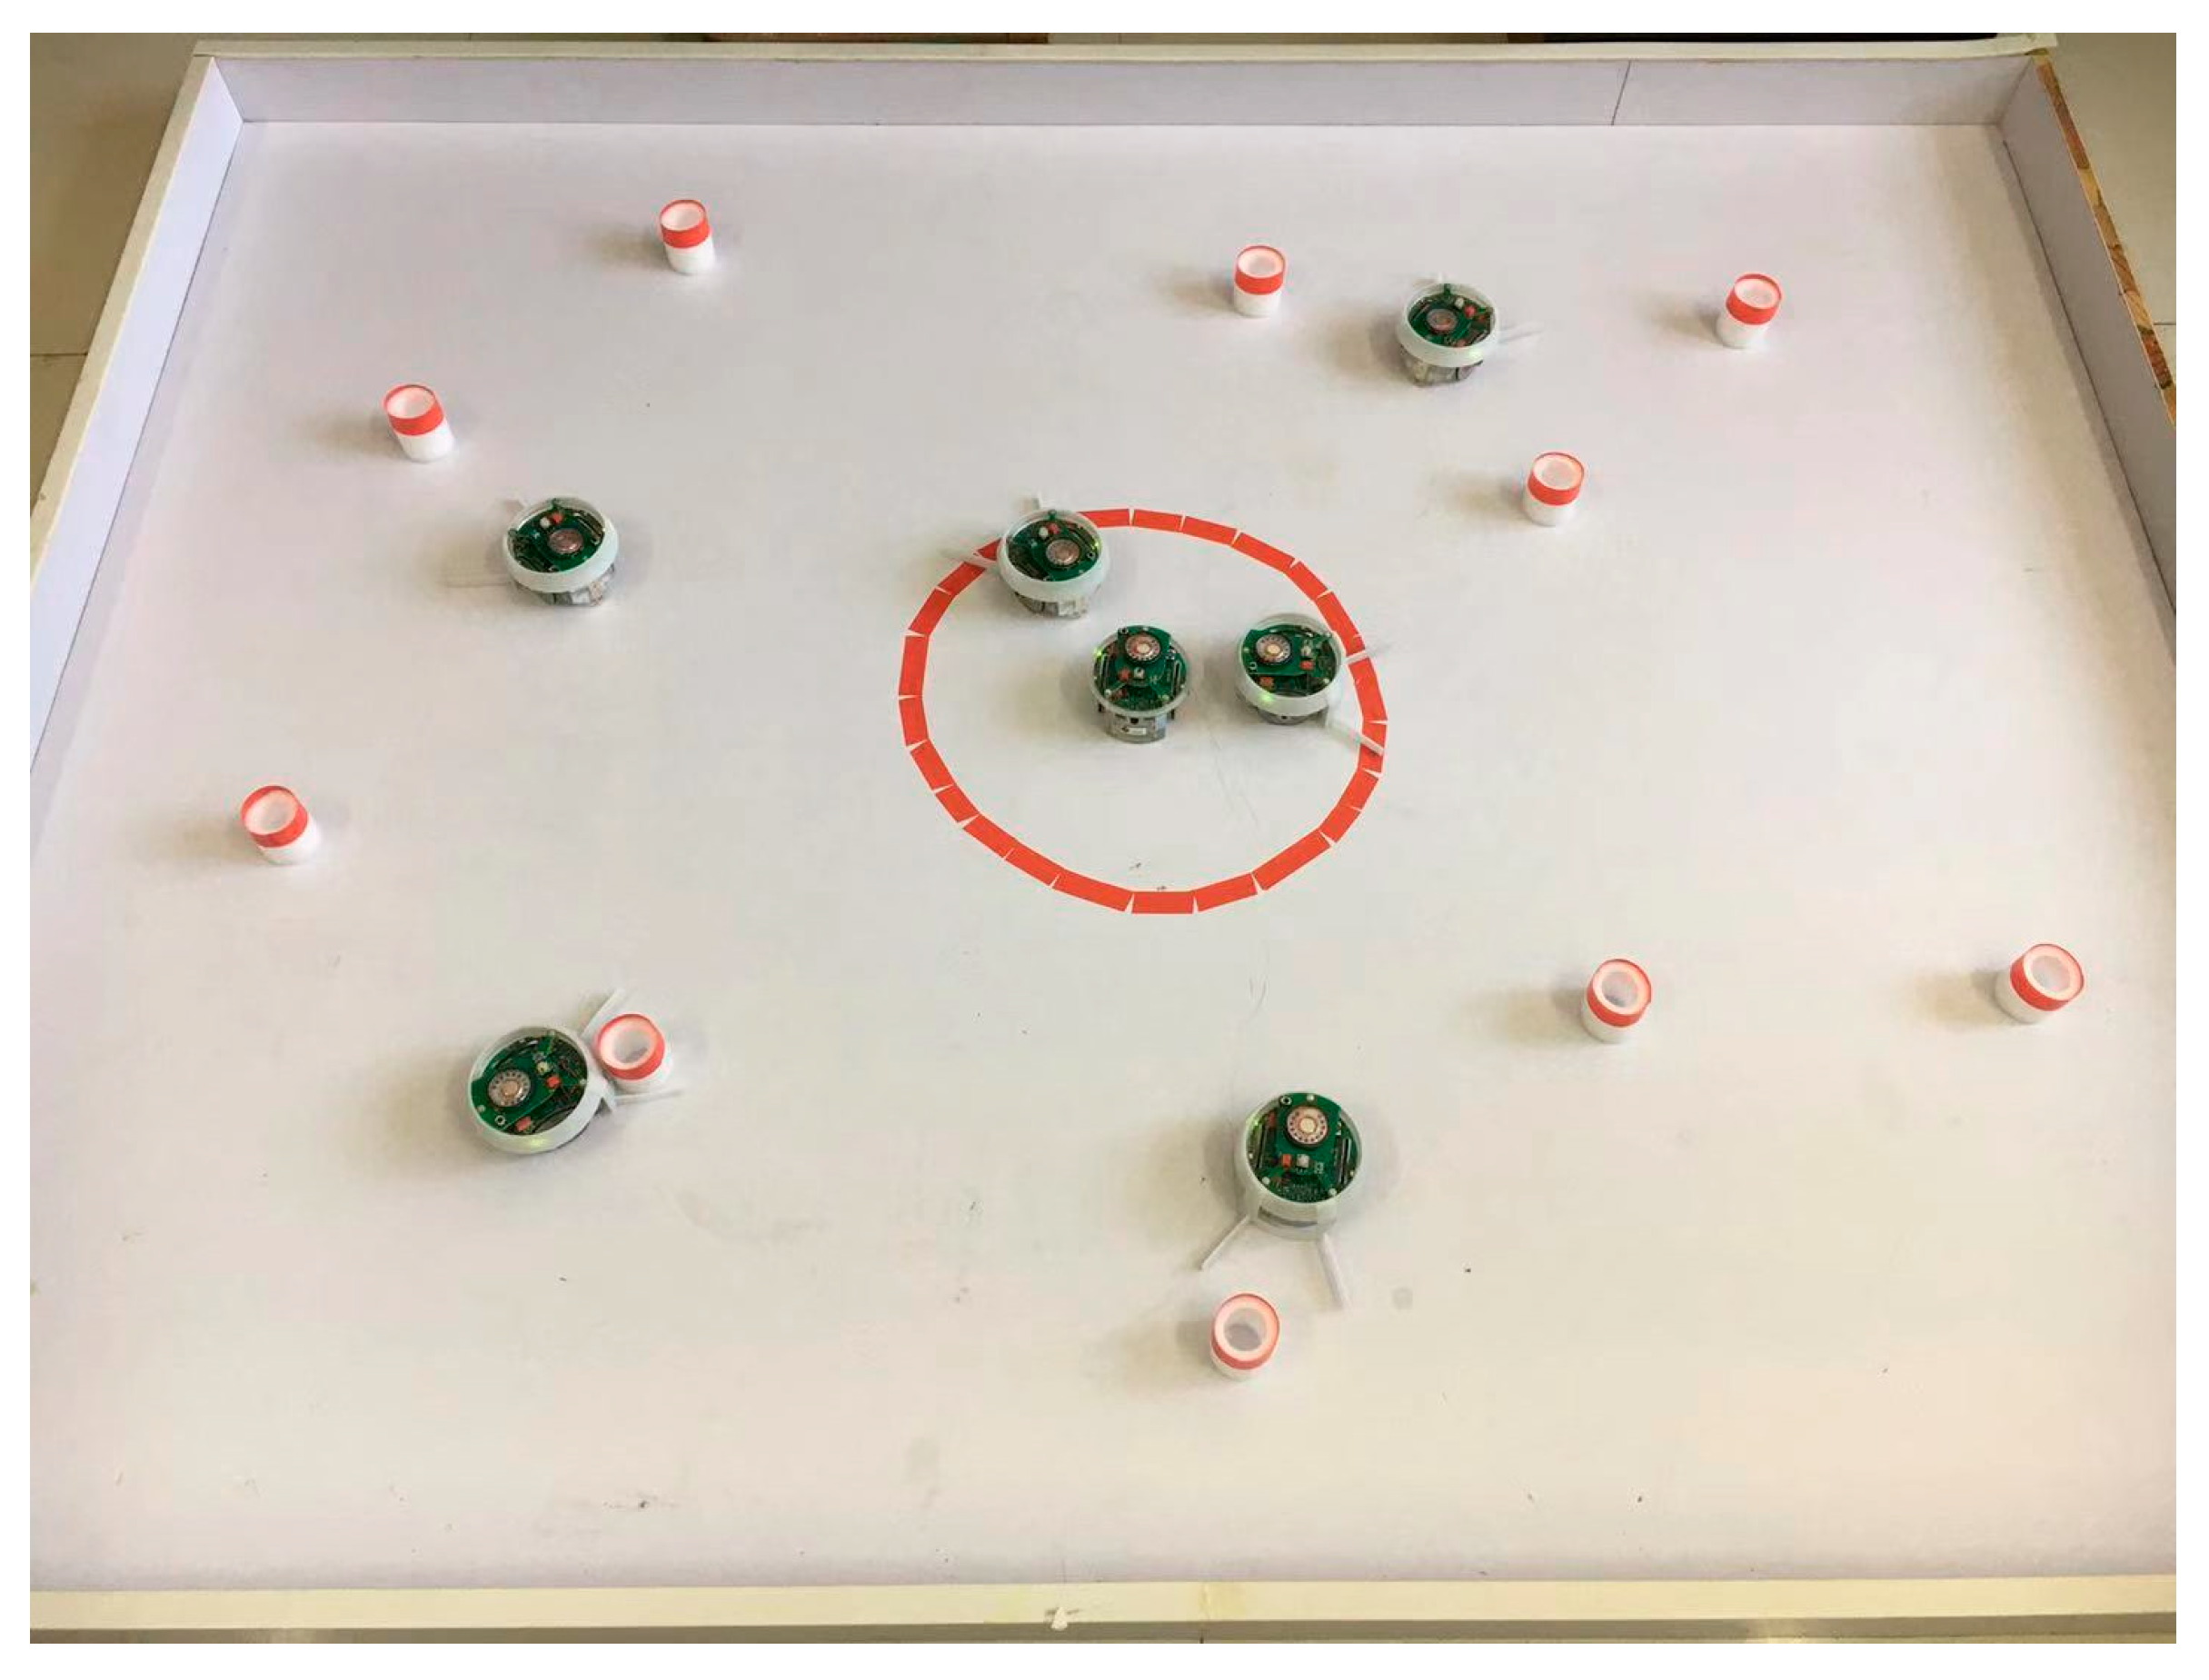
4.2. Experiments with Actual Robots
5. Discussion
5.1 Different Numbers of Food Tokens
5.2 Different Energy Consumption Due to Obstacle Avoidance
5.3 Different Numbers of Robots
5.4 Different Sizes of Foraging Arena
6. Conclusion
Author Contributions
Funding
Acknowledgments
Conflicts of Interest
References
- M. Kreiger, J. Billeter. The call of duty: Self-organized task allocation in a population of up to twelve mobile robots. Robotics Autonomous Systems, 2000, 30(1), 65–84.
- M. U. Arif, S. Haider. A Flexible Framework for Diverse Multi-Robot Task Allocation Scenarios Including Multi-Tasking. ACM Transactions on Autonomous and Adaptive Systems, 2022, 16(1), 1-23.
- B. Jin, Y. Liang, Z. Han, et. al. A hierarchical training method of generating collective foraging behavior for a robotic swarm. Artificial Life and Robotics, 2022, 27, 137–141.
- E. Castello, T. Yamamoto, Y. Nakamura, et al. Task allocation for a robotic swarm based on an adaptive response threshold model. 2013 13th International Conference on Control, Automation and Systems (ICCAS). Korea (South), 2013, 259–266.
- Q. Lu, A. D. Griego, G. M. Fricke, et al. Comparing Physical and Simulated Performance of a Deterministic and a Bio-inspired Stochastic Foraging Strategy for Robot Swarms. 2019 IEEE International Conference on Robotics and Automation (ICRA), Canada, 2019, 9285-9291.
- K. Di, Y. Zhou, F. Yan, et al. A Foraging Strategy with Risk Response for Individual Robots in Adversarial Environments. ACM Transactions on Intelligent Systems and Technology, 2022, 13(5), 83.
- R. Miletitch, A. Reina, M. Dorigo, et. al. Emergent naming conventions in a foraging robot swarm. Swarm Intelligence, 2022, 16, 211–232.
- Y. Khaluf, M. Birattari, F. Rammig. Analysis of long-term swarm performance based on short-term experiments. Soft Computing, 2016, 20(1), 37–48.
- E. Castello, T. Yamamoto, Y. Nakamura, et al. Foraging optimization in swarm robotic systems based on an adaptive response threshold model. Advanced Robotics, 2014, 28(20), 1343–1356.
- T. H. Labella, M. Dorigo, J. L. Deneubourg. Division of labor in a group of robots inspired by ants’ foraging behavior. ACM Transactions on Autonomous and Adaptive Systems (TAAS), 2006, 1(1), 4–25.
- E. Castello, T. Yamamoto, F. D. Libera, et al. Adaptive foraging for simulated and real robotic swarms: the dynamical response threshold approach. Swarm Intelligence, 2016, 10(1), 1–31.
- S. Shaw, E. Wenzel, A. Walker, et. al. ForMIC: Foraging via Multiagent RL With Implicit Communication. IEEE Robotics and Automation Letters, 2022, 7(2), 4877-4884.
- D. Lee, Q. Lu, T. C. Au. Multiple-Place Swarm Foraging with Dynamic Robot Chains. 2021 IEEE International Conference on Robotics and Automation (ICRA), China, 2021, 11337-11342.
- E. Ordaz-Rivas, A. Rodriguez-Linan, L. Torres-Trevino. Autonomous foraging with a pack of robots based on repulsion, attraction and influence. Autonomous Robots, 2021, 45, 919–935.
- M. S. Talamali, T. Bose, M. Haire, et. al. Sophisticated collective foraging with minimalist agents: a swarm robotics test. Swarm Intelligence, 2020, 14, 25–56.
- S. Adams, D. J. Ornia, M. Mazo. A self-guided approach for navigation in a minimalistic foraging robotic swarm. Autonomous Robots, 2023.
- D. Lee, Q. Lu and T. C. Au. Dynamic Robot Chain Networks for Swarm Foraging. 2022 International Conference on Robotics and Automation (ICRA), USA, 2022, 4965-4971.
- K. Di, Y. Zhou, J. Jiang,et. al. Risk-aware collection strategies for multirobot foraging in hazardous environments. ACM Transactions on Autonomous and Adaptive Systems (TAAS), 2022, 16(3-4) 1-38.
- S. O. Obute, P. Kilby, M. R. Dogar, et. al. Swarm Foraging Under Communication and Vision Uncertainties, IEEE Transactions on Automation Science and Engineering, 2022, 19(3), 1446-1457.
- J. C. Loftus, A. Perez, A. Sih. Task syndromes: linking personality and task allocation in social animal groups. 2021, 32(1), 1-17.
- A. Swain, S. D. Williams, L. J. Felice, et. al. Interactions and information: exploring task allocation in ant colonies using network analysis. 2022, 189, 69–81.
- E. Bonabeau, G. Theraulaz, J. L. Deneubourg. Fixed response thresholds and the regulation of division of labor in insect societies. Bulletin of Mathematical Biology, 1998, 60(4), 753–807.
- W. Agassounon, A. Martinoli. Efficiency and robustness of threshold-based distributed allocation algorithms in multi-agent systems. International Joint Conference on Autonomous Agents and Multiagent Systems, 2002, 1090–1097.
- W. Liu, A. F. Winfield. Modeling and optimization of adaptive foraging in swarm robotic systems. International Journal of Robotics Research, 2010, 29(14), 1743–1760.
- E. Buchanan, K. Alden, A. Pomfret, et. al. A study of error diversity in robotic swarms for task partitioning in foraging tasks.Frontiers in Robotics and AI, 2023, 9: 904341.
- A. Brutschy, G.Pini, C.Pinciroli, et al. Self-organized task allocation to sequentially interdependent tasks in swarm robotics. Autonomous Agents and Multi-Agent Systems, 2014, 28(1), 101–125.
- L. Pitonakova, R. Crowder, S. Bullock. Task allocation in foraging robot swarms: The role of information sharing. in Proceedings of the Fifteenth International Conference on the Synthesis and Simulation of Living Systems (ALIFE XV). MIT Press, 2016, 306–313.
- E. Bonabeau. Adaptive task allocation inspired by a model of division of labor in social insects. Biocomputing and Emergent Computation: Proceedings of BCEC97, 1997, 36–45.
- W. Lee, N. Vaughan, D. Kim. Task Allocation Into a Foraging Task With a Series of Subtasks in Swarm Robotic System. IEEE Access, 2020, 8, 107549–107561.
- J. D. Lope, D. Maravall, Y. Quinonez. Self-organizing techniques to improve the decentralized multi-task distribution in multi-robot systems. Neurocomputing, 2015, 163, 47–55.
- A. Kanakia, J. Klingner, N. Correll. A Response Threshold Sigmoid Function Model for Swarm Robot Collaboration. Distributed Autonomous Robotic Systems. Springer, Tokyo, 2016.
- A. Kanakia, B. Touri, N. Correll. Modeling multi-robot task allocation with limited information as global game. Swarm Intelligence, 2016, 10(2), 147–160.
- T. Yanagida, M. Ueda, T. Murata, et al. Brownian motion, fluctuation and life. Biosystems, 2007, 88(3), 228–242.
- A. Kashiwagi, I. Urabe, K. Kaneko, et al. Adaptive response of a gene network to environmental changes by fitness-induced attractor selection. PloS one, 2006, 1(1), e49.
- C. F. Daganzo and L. J. Lehe, “Traffic flow on signalized streets,” Transportation Research Part B: Methodological, vol. 90, pp. 56–69, 2016.
- A. Pradhan, M. Boavida, D. Fontanelli, A Comparative Analysis of Foraging Strategies for Swarm Robotics using ARGoS Simulator. 2020 IEEE 44th Annual Computers, Software, and Applications Conference (COMPSAC), Spain, 2020, 30-35.
| State | Detect attractors | ASM’s input: A(t) | Robot’s motion |
|---|---|---|---|
| SW | No | 0 | random walk |
| SW | Yes | 1 | approach to the food |
| SW | No | 0 | random walk |
| SW | Yes | 1 | approach to the light |
| Compare | t-value | Two-tailed P | Significance |
| Ft | 3.1918 | 0.0019 | YES |
| MT | 2.2899 | 0.0242 | YES |
| Section | Compare | t-value | Two-tailed P | Significance |
| 5.1 | Ft | 4.9663 | 2.89×10⁻⁶ | YES |
| MT | 2.7761 | 6.59×10⁻³ | YES | |
| 5.2 | Ft | 3.2744 | 1.46×10⁻³ | YES |
| MT | 2.3803 | 0.0192 | YES | |
| 5.3 | Ft | 4.7869 | 6.00×10⁻⁶ | YES |
| MT | 3.9267 | 1.60×10⁻⁴ | YES | |
| 5.4 | Ft | 2.1899 | 0.0310 | YES |
| MT | 2.6984 | 8.21×10⁻³ | YES |
Disclaimer/Publisher’s Note: The statements, opinions and data contained in all publications are solely those of the individual author(s) and contributor(s) and not of MDPI and/or the editor(s). MDPI and/or the editor(s) disclaim responsibility for any injury to people or property resulting from any ideas, methods, instructions or products referred to in the content. |
© 2023 by the authors. Licensee MDPI, Basel, Switzerland. This article is an open access article distributed under the terms and conditions of the Creative Commons Attribution (CC BY) license (http://creativecommons.org/licenses/by/4.0/).


