Submitted:
11 July 2023
Posted:
13 July 2023
You are already at the latest version
Abstract
CO2 is widely used in the prevention and control of coal spontaneous combustion. In this manuscript, three low-rank coals with different metamorphic degrees were selected as the research objects. The temperature-programmed experiments, in-situ infrared cooling experiments, simulation of competitive adsorption of CO2 and O2 in coal pores, and simulation study of CO2 inhibition of coal oxygen composite reaction were used to obtain the role and effect of CO2 in preventing oxygen adsorption in coal at low-temperature oxidation stage. It is concluded that CO2 can displace the O2 near the pore wall to physically prevent the adsorption of O2. Through the change law of heating rate and kinetic analysis, it is found that CO2 can increase its activation energy by 5.3%-108.3% during the slow heating stage of coal, and reduce its heating rate. At around 120°C, coal loses the protective effect of CO2. From the changes of functional groups, it can be seen that when coal is cooled in CO2 atmosphere, mainly pyrolysis and condensation reactions occur due to the lack of O2. In addition, CO2 can also inhibit the chain reaction of coal's chemical adsorption of oxygen. This work provides a theoretical basis for CO2 prevention and control of coal spontaneous combustion.
Keywords:
CO2
; Prevent oxygen adsorption
; Fire prevention and extinguishing
; Activation energy
; Heat release
; Competitive adsorption
1. Introduction
Coal spontaneous combustion is one of the five major disasters in coal mines [1-3], which restricts the safe and efficient exploitation and utilization of coal resources in our country [4-6]. With the continuous in-depth research on the mechanism of coal spontaneous combustion for a long time, scholars have proposed various theories from different angles to explain the coal spontaneous combustion phenomenon, among which the coal-oxygen composite theory [7-11] has been widely recognized. At the microscopic level, coal is viewed as a porous media material. The coal-oxygen recombination reaction at the gas-solid interface inside the medium first requires the physical adsorption of oxygen by means of intermolecular force (van der Waals force). Based on this, the inert gas injection fire-fighting method, which can reduce the O2 concentration in the goaf, has been widely used in the process of coal spontaneous combustion fire control [12,13].
Among them, N2 and CO2 are widely used due to their advantages of inerting, cooling, explosion suppression, large diffusion range, no damage to instruments and equipment, and the ability to bypass obstacles [14]. At the same time, many scholars have done a lot of research on the effect of inert gas on preventing spontaneous combustion of coal. Most of the researches focus on comparing the oxidation characteristics [15-20]; ignition characteristics [21]; combustion characteristics [22]; changes in functional groups [23] and the generation of index gases [24] of coal samples in O2/N2 and O2/CO2 atmospheres. These results show that the presence of N2 and CO2 is helpful to prevent CSC, and the effect of CO2 injection is better than that of N2. However, the timeliness of CO2 protection of coal to prevent its spontaneous combustion is not described. Therefore, it is necessary to further clarify the mechanism of CO2 fire prevention in order to better serve the prevention and control of coal spontaneous combustion.
In explaining the mechanism of CO2 fire prevention, the predecessors mostly studied from the adsorption and desorption mechanism of the gas. Many scholars have used the Grand Canonical Monte Carlo method to study the competitive adsorption mechanism of multiple gases on the coal unit cell model. Wu et al. [25] revealed the competitive adsorption mechanism of CO2/O2/N2 in coal through GCMC and MD simulations, indicating that CO2 occupies a stronger adsorption site and has a stronger interaction energy with coal, so it is easier to adsorbed in coal. Zhang et al. [26] used the GCMC simulation method and concluded that the adsorption capacity of gas in lignite is greater than that of O2 for both single and binary components. Long et al. [27] studied the adsorption and diffusion characteristics of CO2 and N2 in the micropores and mesopores of coal by means of molecular dynamics. Dong et al. [28] used an adsorption simulation method to reveal the adsorption properties of two kinds of bituminous coals for CO, CO2, and O2 at different pressures and temperatures. CO2 is more easily adsorbed than O2. Liu et al. [29] combined thermogravimetric analysis with adsorption-desorption mechanism and confirmed that CO2 and H2O chemisorption occurred in non-isothermal experiments. Liu et al. [30] simulated the gas transport law under the condition of inert gas injection into the goaf, and explored the O2 distribution under the condition of inert gas injection in the goaf.
Coal is an extremely heterogeneous substance with abundant pores and complex chemical structure [31,32]. Coal pore structure plays a crucial role in the process of gas adsorption, migration and generation [33]. The above studies either did not consider the influence of pore structure on it or considered the pore structure, but mostly used graphene slit pore and carbon nanotube models to simulate the nanopore structure of coal with different pore sizes. Although the above methods can effectively simplify the calculation, the coal surface has complex chemical heterogeneity and contains various functional groups, which cannot reflect the actual situation. Some scholars have confirmed that functional groups have an important influence on the adsorption of gases. Most of the above studies explain the mechanism of CO2 fire prevention and extinguishing from the perspective of gas competitive adsorption. In addition to the above physical effects, CO2 also has the effect of inhibiting the coal-oxygen composite chain reaction, and it is necessary to further reveal its inhibiting oxygen adsorption mechanism from a chemical point of view.
We innovatively used the macromolecular model of low-rank coal to construct the pore structure of coal, revealing the microscopic mechanism of gas displacement more realistically. This manuscript also creatively simulates the effect of CO2 on the coal-oxygen complex chain reaction, and has experiments to verify it. This work explains both the physical and chemical effects of CO2 in preventing oxygen adsorption. The aging time and mechanism of preventing oxygen adsorption were clarified, and a model of CO2 preventing oxygen adsorption was constructed, which provided a theoretical basis for inert fire prevention and extinguishing.
2. Coal samples and methods
2.1. Experimental
2.1.1. Low-rank Coal sample preparation
This manuscript selects lignite from the Huolinhe mining area, long-flame coal from the Yuheng mining area, and gas coal from the Aiweiergou mining area as the research objects, denoted as HL, YH, and AW, respectively [34]. The low-rank coal samples were crushed into 120 mesh pulverized coal for industrial analysis, organic element (C, H, O, N) content determination, S element content determination and vitrinite reflectance analysis. The analysis results are shown in Table 1.
2.1.2. Device and process of temperature-programmed adiabatic oxidation experiment
Under the same conditions as coal type, particle size, air flow rate, heating rate, initial temperature and final temperature, two coal spontaneous combustion adiabatic oxidation temperature programming tests were carried out for each coal sample. That is, under the condition of 30 °C, air or CO2 was respectively introduced into the coal sample with a weight of 200 g and a diameter of about 1.5-2.4 mm, and the temperature-programmed adiabatic oxidation experiment was started after holding for 2 hours. The temperature was raised to 200 °C with a heating rate of 1 K/min and then kept at a constant temperature for 5 hours.
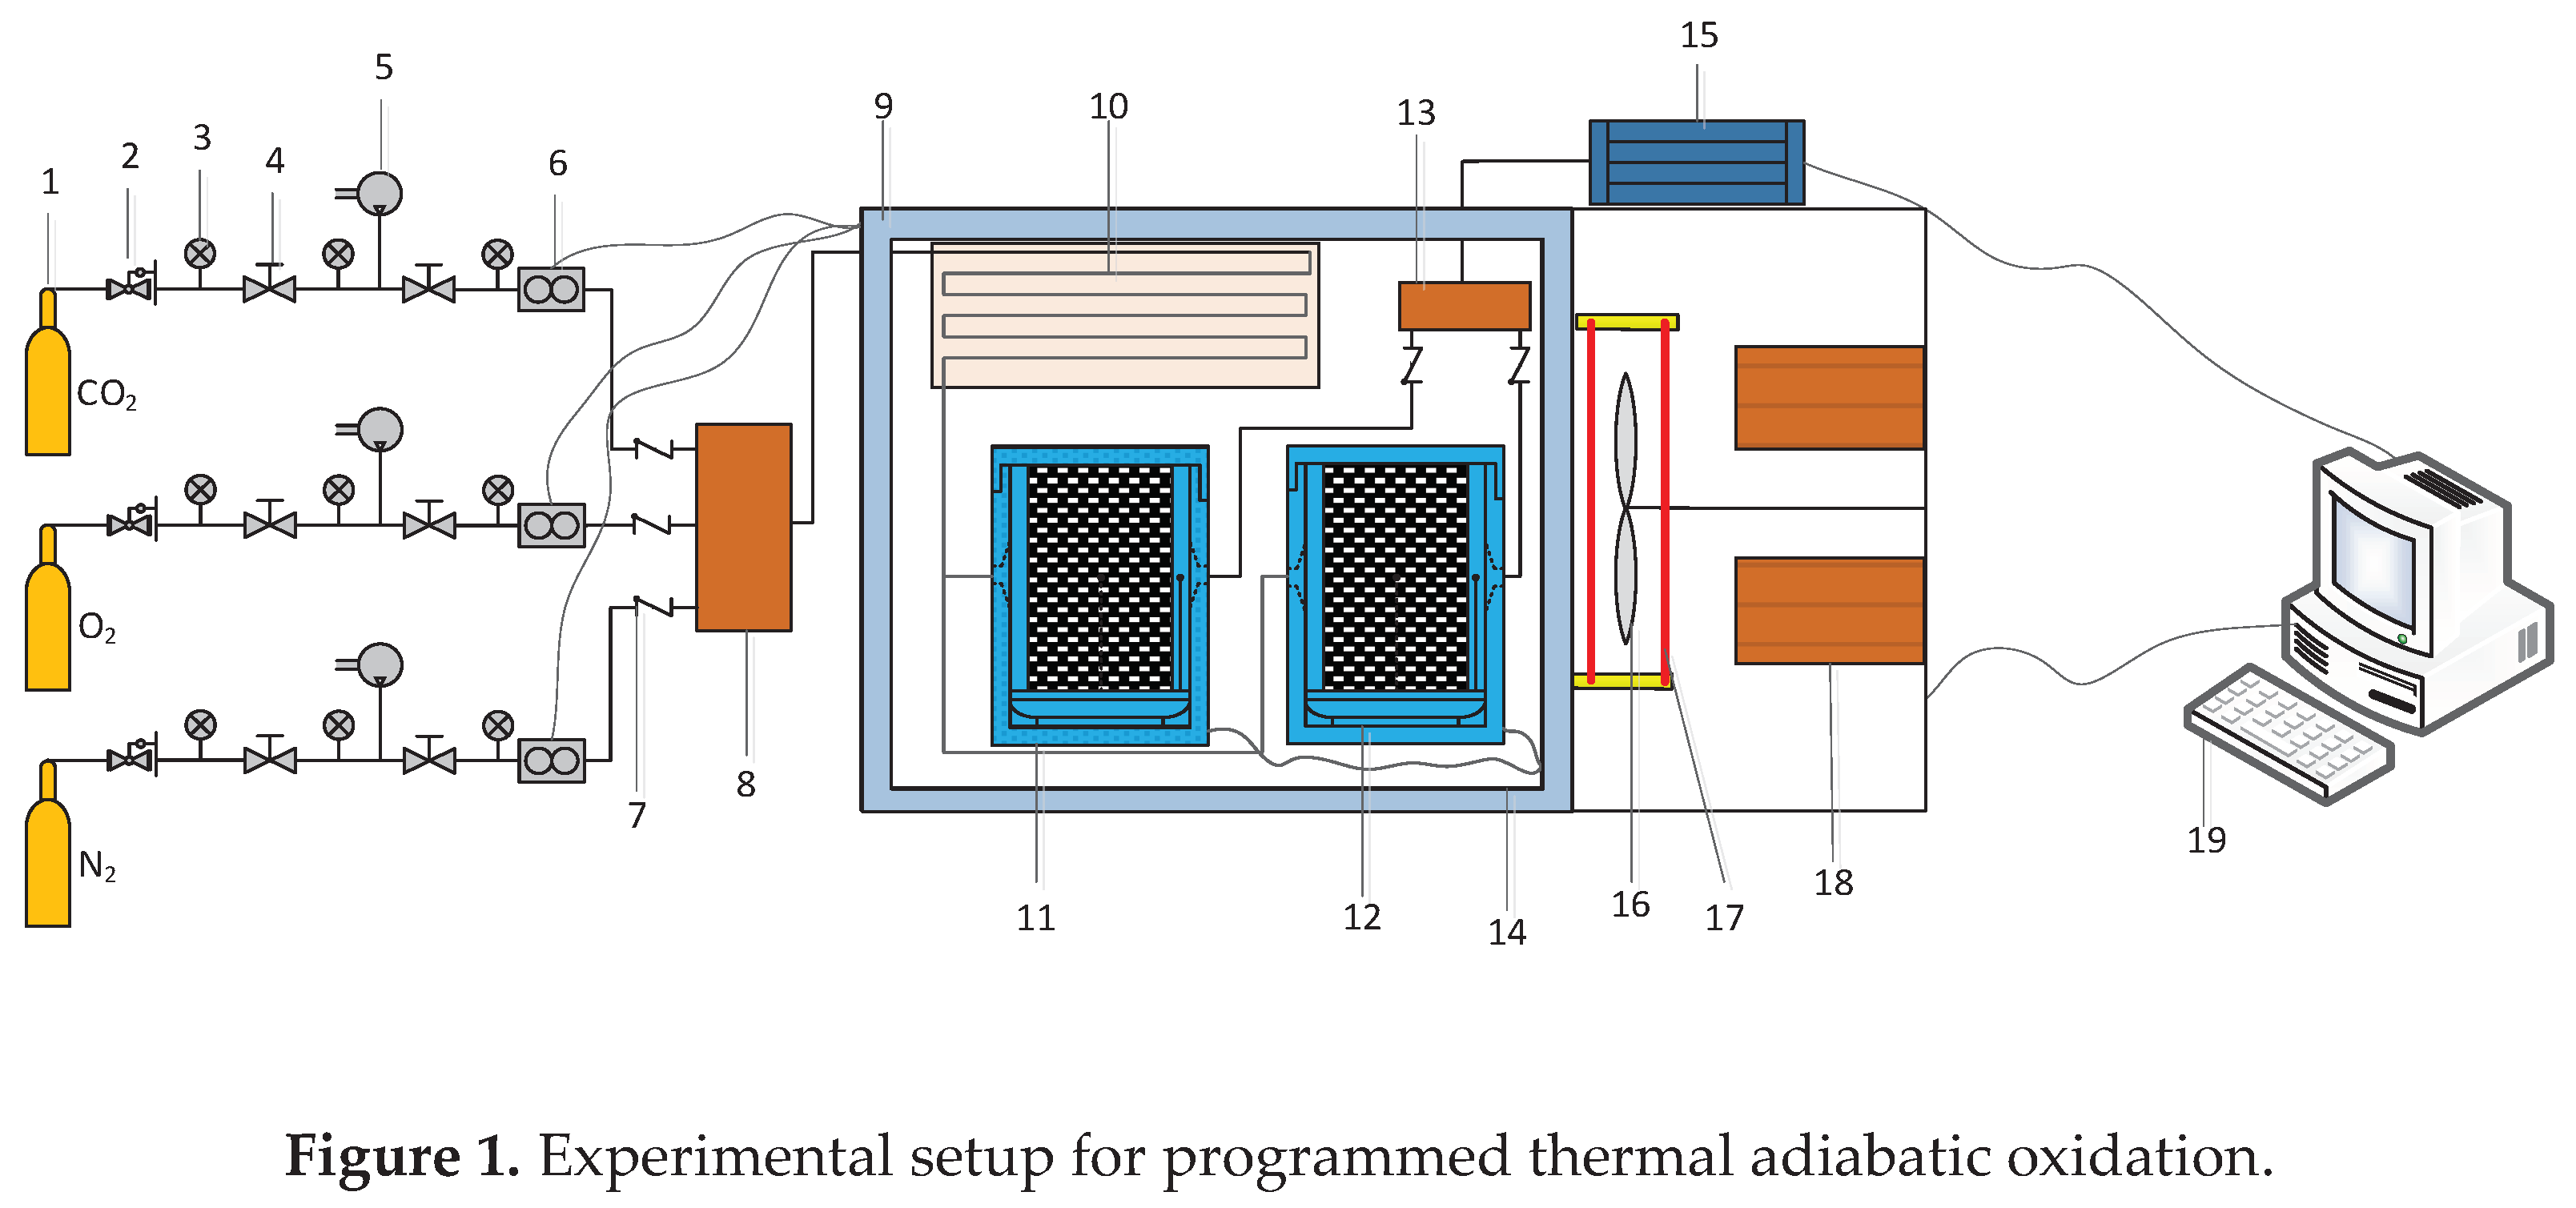
Legend: 1- gas cylinder; 2- pressure reducing valve; 3- pressure gauge; 4- pressure regulator valve; 5- air compressor; 6- flow meter; 7- check valve; 8- intake mixing bin; 9-Insulation layer; 10-Gas preheating copper pipe; 11-Insulation coal sample tank; 12-Heat transfer coal sample tank; 13-Outlet gas mixing chamber; 14-Program temperature control box; 15-Cooler; 16-fan; 17-heater; 18-refrigerator; 19-PC
2.1.3. Device and process of in situ infrared cooling experiment
After each coal sample of 200 mesh was inerted by nitrogen for 6 hours, 5 g of coal sample was selected and put into the in-situ reaction tank. In the atmosphere of air (80%N2 and 20%O2), it was raised to 200 °C, and then CO2 and air (80%N2 and 20%O2) were introduced to cool it down. The coal samples of the two treatments were recorded as “CO2-Coal” and “Air-Coal” respectively. The cooling atmosphere flow rate is 50ml/min, the resolution of the infrared test program is 4cm-1, the spectral scanning range is 800~4000cm-1, and data is collected every 30s, and the collection time is 20 to 25 minutes. The experimental instrument was a TENSOR27 Fourier transform infrared spectrometer from BLUKE, Germany.
2.2. Simulation method
2.2.1. Simulation of Competitive Adsorption of CO2 and O2 in Coal Surface Pores
The HL coal pore model is constructed in Materials Studio 8.0 as shown in Figure 2, and HL coal molecules were used as pore walls to construct pores with a diameter of 20 Å and a length of 155 Å. The left side of Figure 2 is the graphene structure “piston”. Under the conditions of 30°C, 60°C, 90°C, and 120°C, the “piston” moves 1Å per 100ps to push the mixture of CO2 and O2 to the intake side. The length of the intake side is set to 85 Å, and the piston pushes forward a total of 75 Å. The mixed gas consists of 747 CO2 molecules and 747 O2 molecules. The height and width of the entire model are 55 Å. In the Forcite module of Materials Studio 8.0, set the task to Dynamics, use the NVT ensemble, the step size is 1fs, the dynamics simulation time is 100ps, and the temperature control method is set to Nose.
2.2.2. Chain Reaction Simulation of Coal Chemisorption of Oxygen
Calculations were performed using density functional theory (DFT), the Gaussian09 package and the M06-2x/6-31G(d,p) method. The structure optimization and frequency calculation of the reactants, transition states (TS) and products during the chemisorption chain reaction of coal oxidation were carried out. In order to verify the rationality of the transition state, an intrinsic reaction coordinate (IRC) analysis was carried out at the same method and basis set level.
3. Results and analysis
3.1. Analysis on the Physical Mechanism of CO2 Preventing O2 Adsorption
It can be seen from the author’s previous work that the adsorption capacity of CO2 in coal is stronger than that of O2, and CO2 can displace O2 in coal [35]. The mechanism of this macroscopic phenomenon is unknown, so this study uses Materials Studio 8.0 software to simulate this phenomenon to explain its cause from a microscopic perspective. According to the simulation results in Materials Studio 8.0, the adsorption and diffusion of O2 and CO2 in the coal pore structure in each time period can be known, as shown in Figure 3.
Figure 4 shows the time-dependent changes of O2 and CO2 at the gas outlet port of the coal surface pore model at different temperatures. Under the same conditions, the number of CO2 at the gas outlet port is always less than the number of O2. At 30°C, 60°C, 90°C, and 120°C, O2 appeared at the gas outlet port at 1500ps, 1000ps, 500ps, and 100ps, respectively, while CO2 appeared at 2500ps, 1500ps, 500ps, and 100ps, respectively. It can be seen that O2 can be desorbed from the coal pore structure earlier. This is consistent with the experimental results [30]. The diffusion rate of O2 is greater, that is, CO2 is more easily adsorbed in the coal. With the increase of temperature, the gas molecules at the gas outlet port continued to increase at the same time, indicating that the increase of temperature is conducive to the diffusion of gas in the coal pore structure. From the perspective of the proportion of gas at the outlet port of the pore model at 7500ps at different temperatures, it can be seen that with the increase of temperature, the proportion of O2 continues to decrease, indicating that temperature has a greater impact on the adsorption of CO2 in coal pores.
Based on gas density profile, the pore space was split into three zones. In order to observe the microscopic mechanism of CO2 replacing O2 in pores, taking the pore center of the coal as the center, the number of O2 and CO2 molecules in the range of 0~10 Å, 10~15 Å and 15~20 Å from the center were calculated at a temperature of 30 °C, respectively. The results are shown in Figure 5.
It can be seen that in the whole adsorption process, the number of CO2 molecules in the pores increases for a longer time than that of O2. At the same time, the total CO2 molecules in the pores are more, that is, the adsorption capacity of CO2 is stronger. CO2 molecules are mainly distributed in the range of 15~20Å from the center of the pores, and its number in the pores increases rapidly before 1500ps, and increases slowly from 1500ps to 4500ps. After 4500ps, the numbers in the 0~10Å and 10~15Å spatial ranges remained unchanged, while the numbers in the 15~20Å spatial range increased. O2 molecules are mainly distributed in the range of 0~10Å from the center in coal pores. The O2 molecules in the pores increased rapidly before 1500ps, and the growth rate slowed down from 1500ps to 3500ps. After 3500ps, the number of O2 in the range of 10~15Å and 15~20Å decreased slowly, while the number of CO2 molecules in the same spatial range increased, indicating that CO2 replaced O2 molecules in this space. And this effect is stronger in the range of 15-20 Å. The number of O2 and CO2 molecules fluctuates in the range of 0~10Å, that is, CO2 has almost no replacement effect on them.
In a word, in coal pores, CO2 tends to be adsorbed more near the pore wall and O2 tends to be adsorbed in the center of the pores, and the adsorption capacity of coal for CO2 is stronger than that of O2. CO2 can displace O2 adsorbed in coal, and this effect is stronger near the pore wall.
3.2. Analysis on the Chemical Mechanism of CO2 Preventing O2 Adsorption
3.2.1. Influence of pre-injection of CO2 into coal on its heating process
From the temperature-programmed experiment, the relationship between the heating rate and the temperature of each coal sample in the oxidation heating process between 30 and 200 °C can be obtained, as shown in Figure 6.
It can be seen from the experimental results that at 124°C, 50°C and 120°C, the heating rates of the AW, YH, and HL coal samples pre-treated with CO2 injection exceeded that of the coal without CO2 injection. The above temperatures are respectively in the initial adsorption stage and the fast reaction stage of coal. The turning points of the heating rate curve from rising to falling are all around the slow chemisorption temperature point. Overall, the heating rate of the coal samples injected with CO2 was lower than that of the coal samples without CO2 injection (except for YH coal) before the slow chemisorption temperature point. At 170°C, 120°C and 141°C, the temperatures of the AW, YH, and HL coal samples injected with CO2 exceeded that of the coal without CO2 injection, and these temperatures were all in the fast reaction stage.
Before the rapid reaction stage, with the increase of coal temperature, the CO2 adsorbed in the coal sample was gradually desorbed, and O2 was adsorbed and participated in the reaction to release heat. The slower heating rate of the CO2-injected coal samples is because the desorbed CO2 absorbs heat. And because more CO2 in coal occupies the adsorption site of O2, less O2 is adsorbed during the reaction, which slows down the oxidation reaction process, so the heat release is slower. After reaching the slow chemisorption temperature point, the coal loses the protective effect of CO2 due to a large amount of CO2 extraction. In the early stage, due to the inerting effect of CO2, the consumption of active groups in coal was slow. At this time, a large number of active groups combined with O2 to react, releasing a lot of heat, so the heating rate was faster. The heating rate decreases when the number of active groups decreases. CO2 is mainly adsorbed in the micropores of coal, and the gas in the micropores is not easily desorbed. The proportion of mesopores in YH coal is larger than that of micropores, while the opposite is true for AW coal samples and HL coal samples. Therefore, the temperature at which the YH coal sample loses the protective effect of CO2 is earlier.
The Arrhenius formula is often introduced in the analysis of coal oxidation kinetics, and its expression is shown in formula (1). The Arrhenius formula is based on the elementary reactions of substances and characterizes the relationship between the reaction rate constant and the apparent activation energy.
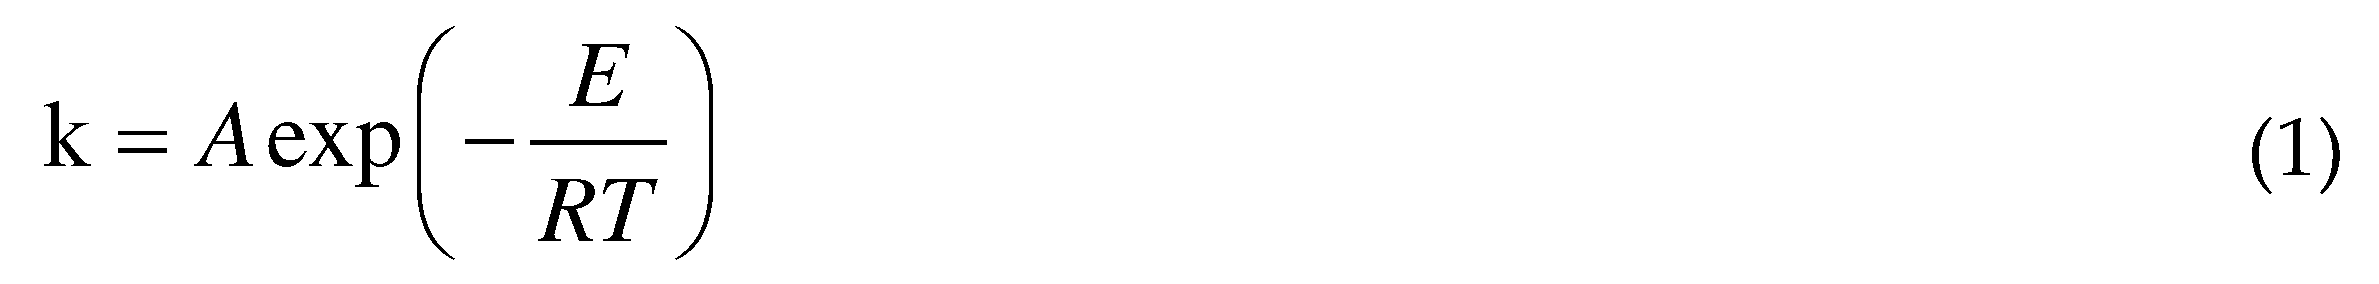
Among them, k is the reaction rate constant, dimensionless; A is the exponent factor, s-1; E is the activation energy, kJ/mol; R is the gas state constant.
Assuming that there is no heat convection, heat conduction and moisture evaporation during the adiabatic oxidation process of the coal sample, equation (1) can be transformed into:
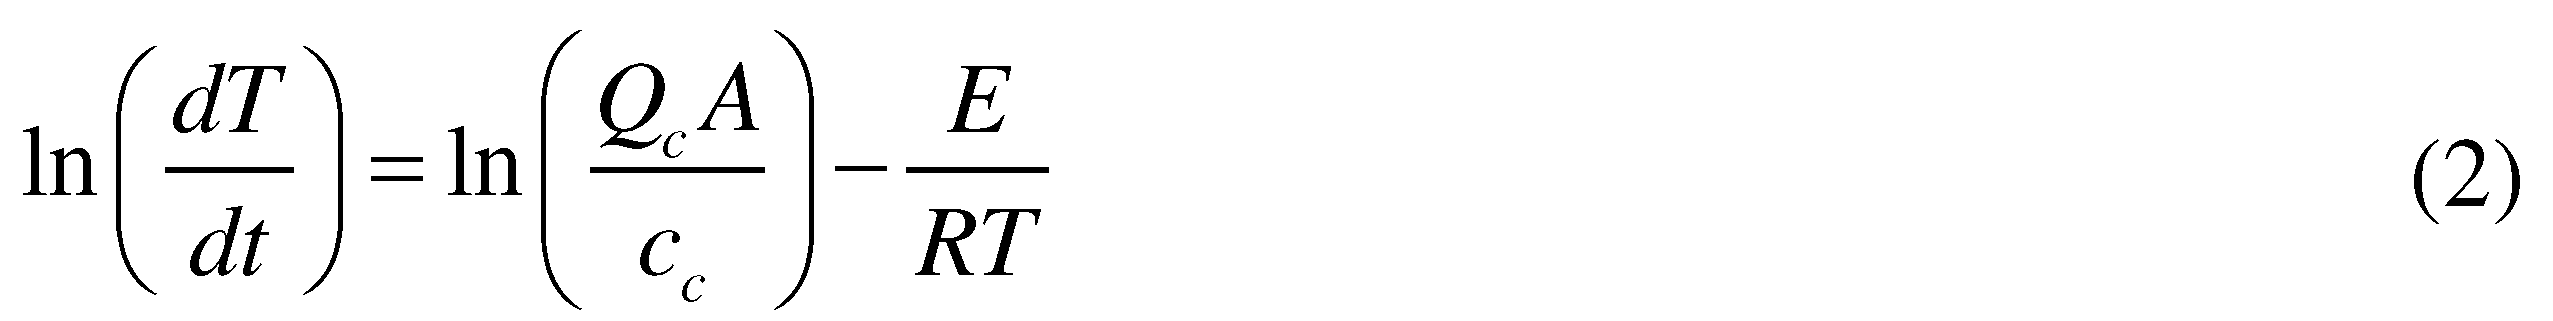
Among them, dT/dt is the heating rate of adiabatic oxidation of coal, and its value is approximately equal to (T1-T2)/(t1-t2). Using this formula, the apparent activation energy of the experimental coal sample can be obtained.
The relationship between the heating rate of coal and the reciprocal temperature is obtained by formula (2). It is divided into four stages according to the characteristics of adsorption and consumption of oxygen, and the fitted straight line of each stage is obtained by linear fitting. And calculate the activation energy of coal in each stage of low temperature oxidation process, as shown in Figure 7 to Figure 9.
When the slope of the fitted line is negative, it indicates that the coal is in the slow heating stage in the early stage of low-temperature oxidation; when the slope is positive, it indicates that the coal has entered the stage of autothermal oxidation. The temperature corresponding to the turning point where the slope changes from negative to positive is the critical temperature of autoignition. It can be seen from the figure that the whole process of temperature programming can be divided into four stages. In stage I to stage III, each coal is mainly in the early and slow heating process, and stage IV is the autothermal oxidation stage. Table 2 shows the activation energy of each coal sample at each stage.
It can be seen from Table 2 that in both stage I and stage II, for the same coal type, the activation energy of coal injected with CO2 is higher than that of coal without CO2 injection. It shows that the injected CO2 can hinder the coal’s adsorption of O2 in both stages. In stage III, the activation energy of the CO2-injected YH coal was lower than that of the non-injected coal, while the opposite was true for the other two coal samples. As previously known, this is because the YH coal sample loses the CO2 adsorption resistance to oxygen at 50 °C. In stage IV, the activation energy of coal injected with CO2 is lower than that of coal not injected with CO2, indicating that CO2 loses the effect of CO2 on oxygen barrier adsorption at about 120°C.
At about 120°C, the oxidation process transitioned from stage III to stage IV, and each coal sample reached the critical temperature of coal spontaneous combustion. And for the same type of coal, the critical temperature of spontaneous combustion of the coal injected with CO2 is higher than that of the coal without CO2 injection, which further shows that the adsorption of CO2 in the coal has the inerting effect of preventing oxygen adsorption.
From the above analysis, it can be concluded that the injection of CO2 into the coal can hinder the O2 adsorption of its low-temperature oxidation process. Its hindering effect is mainly reflected in stage I to stage III, which is manifested as increasing the activation energy of coal low-temperature oxidation and reducing the heating rate of coal. As the temperature increases, CO2 will be desorbed from the coal. Due to the adsorption of CO2 in the early stage, the consumption of active groups is small. At this time, the active groups adsorb O2 in large quantities and react, resulting in intensified low-temperature oxidation of coal. At the same time, the activation energy decrease, the heating rate increases. That is, at stage IV, the coal loses the protective effect of CO2.
3.2.2. Analysis of Functional Group Changes of CO2 Injection During Coal Cooling
Through the in-situ infrared experiments, the in-situ infrared 3D spectra of the coal samples in each interval during the reaction process under the air atmosphere and CO2 atmosphere can be obtained. Decomposition of the in-situ infrared 3D spectrum can obtain the temperature change of the main functional groups of each coal sample under different atmospheric conditions, as shown in Figure 10, Figure 11, Figure 12, Figure 13, Figure 14 and Figure 15.
(1)Peroxide(C-O-O·)
As shown in Figure 10, in the air atmosphere, the peroxides of the AW and HL coal samples showed a trend of first decreasing and then increasing, but the change range was different. The decrease of AW coal samples is larger, while the increase of HL coal samples is larger. The YH coal sample is mainly reflected in an increasing trend. The main reason is that during the cooling process of the air atmosphere, the coal sample will chemically adsorb oxygen and then autocatalyze into peroxides, but when the temperature is further lowered, the chemical adsorption of oxygen will not catalyze into oxides, resulting in an increase in its content. The YH coal sample has a larger proportion of mesopores, so the O2 adsorption is more rapid, and the peroxide content has been increasing. This is consistent with the result that the critical temperature of spontaneous combustion of YH coal is the lowest above.
In the CO2 atmosphere, the absorbance of the peroxides of the AW and HL coal samples first decreased and then increased, and the change range was smaller than that in the air atmosphere. In the YH coal sample, it showed a downward trend. It shows that the reaction and generation of peroxides do not change much under anoxic conditions, mainly relying on the partial autocatalytic reaction in the pyrolysis process.
(2)Free hydroxyl(HO·)
The change process of free hydroxyl (HO·)is shown in Figure 11. Under the air atmosphere, in the AW coal sample, it first decreases and then tends to be smooth, and in the YH coal sample, it first increases and then tends to be smooth. However, in the HL coal samples, it first decreased and then increased. The free hydroxyl group is the product after peroxide autocatalysis, so it can be found that the change trend of the absorbance of free hydroxyl group and peroxide is similar in air atmosphere. In the CO2 atmosphere, the absorbance of free hydroxyl groups in each coal sample first increased and then tended to be smooth, which was similar to the change trend of the peroxide absorbance in the CO2 atmosphere.
(3)Aldehyde group(-CH=O)
As shown in Figure 12, in the air atmosphere, the Aldehyde groups in the AW and YH coal samples first increased and then tended to be smooth, and in the HL coal samples, they showed a trend of first decreasing and then increasing. Aldehyde group is an intermediate product of coal chemisorption oxygen reaction, which is related to the difference of coal oxidation characteristics. Compared with AW and YH coal samples, HL coal samples have more aliphatic side chains, which are easy to react to generate CO or carboxyl groups. In the CO2 atmosphere, the aldehyde group first increased and then decreased in the AW coal sample, gradually increased in the YH coal sample, and gradually decreased first and then increased in the HL coal sample, but the overall change range was not high. This indicates that a small amount of aldehyde group generation and decomposition reactions occurred, and further indicates that the molecular structure of coal changes little during the cooling process under CO2 atmosphere.
(4)Carboxyl(-COOH)
As shown in Figure 13, in the air atmosphere, the carboxyl groups first decreased and then tended to be smooth in the AW coal sample, first smoothed and then increased in the YH coal sample, and showed an increasing trend in the HL coal sample. It shows that during the cooling process, the carboxyl group of the AW coal sample is generated and the decomposition reaction also occurs. When the temperature decreases, the decomposition reaction weakens, while the YH coal samples and the HL coal samples will be continuously oxidized to form carboxyl groups. In the CO2 atmosphere, the carboxyl group first increased and then decreased in the AW coal sample, gradually increased in the YH coal sample, and gradually decreased first and then increased in the HL coal sample, but the overall change range was not high. This is the same as for carbonyl changes. It shows that in CO2 atmosphere, most carbonyl groups are converted into carboxyl groups, but due to the lack of O2 in the environment, the main way to generate carboxyl groups is the combination of free hydroxyl groups and carbonyl radicals.
(5)Methyl (-CH3) and methylene (-CH2-)
It can be seen from Figure 14 and Figure 15 that in the air atmosphere, the methyl group and the methylene group showed a trend of increasing first and then decreasing. The main reason is that pyrolysis breaks aliphatic chains in coal to generate methyl and methylene groups. They are then contacted with oxygen for chemisorption reactions and low-temperature condensation.
In the CO2 atmosphere, the absorbance of methyl and methylene increased first and then decreased, which was caused by the pyrolysis reaction and the condensation of aliphatic chains. In an oxygen-deficient environment, the aliphatic chain of the coal molecule is broken to form methyl and methylene at high temperature, and methyl and methylene are condensed at low temperature. However, the changes of methyl and methylene in the air atmosphere are not as large as those in the CO2 atmosphere.
Through the above analysis, it can be concluded that when the coal is cooled in the air atmosphere, the chemisorption products of coal oxide such as ·OH and C-O-O·, -CH=O and -COOH will increase. When the coal is cooled in the CO2 atmosphere, the main pyrolysis and condensation reactions occur due to the lack of O2, and CO2 can hinder the decomposition of -COOH, etc., which will eventually lead to the increase of -CH=O and -COOH in the coal. Other structural changes were smaller.
3.2.3. Effect of CO2 on the Reaction Process of Coal Chemical Adsorption of O2
While hindering the adsorption of O2 by coal, CO2 will have weak interaction with coal molecules and O2 molecules, which will affect the activation energy and exothermic conditions of the reaction process of coal chemical adsorption of oxygen, and then affect the reaction process. Taking methyl as an example, the chemical adsorption reaction process of coal is constructed as follows [28]:
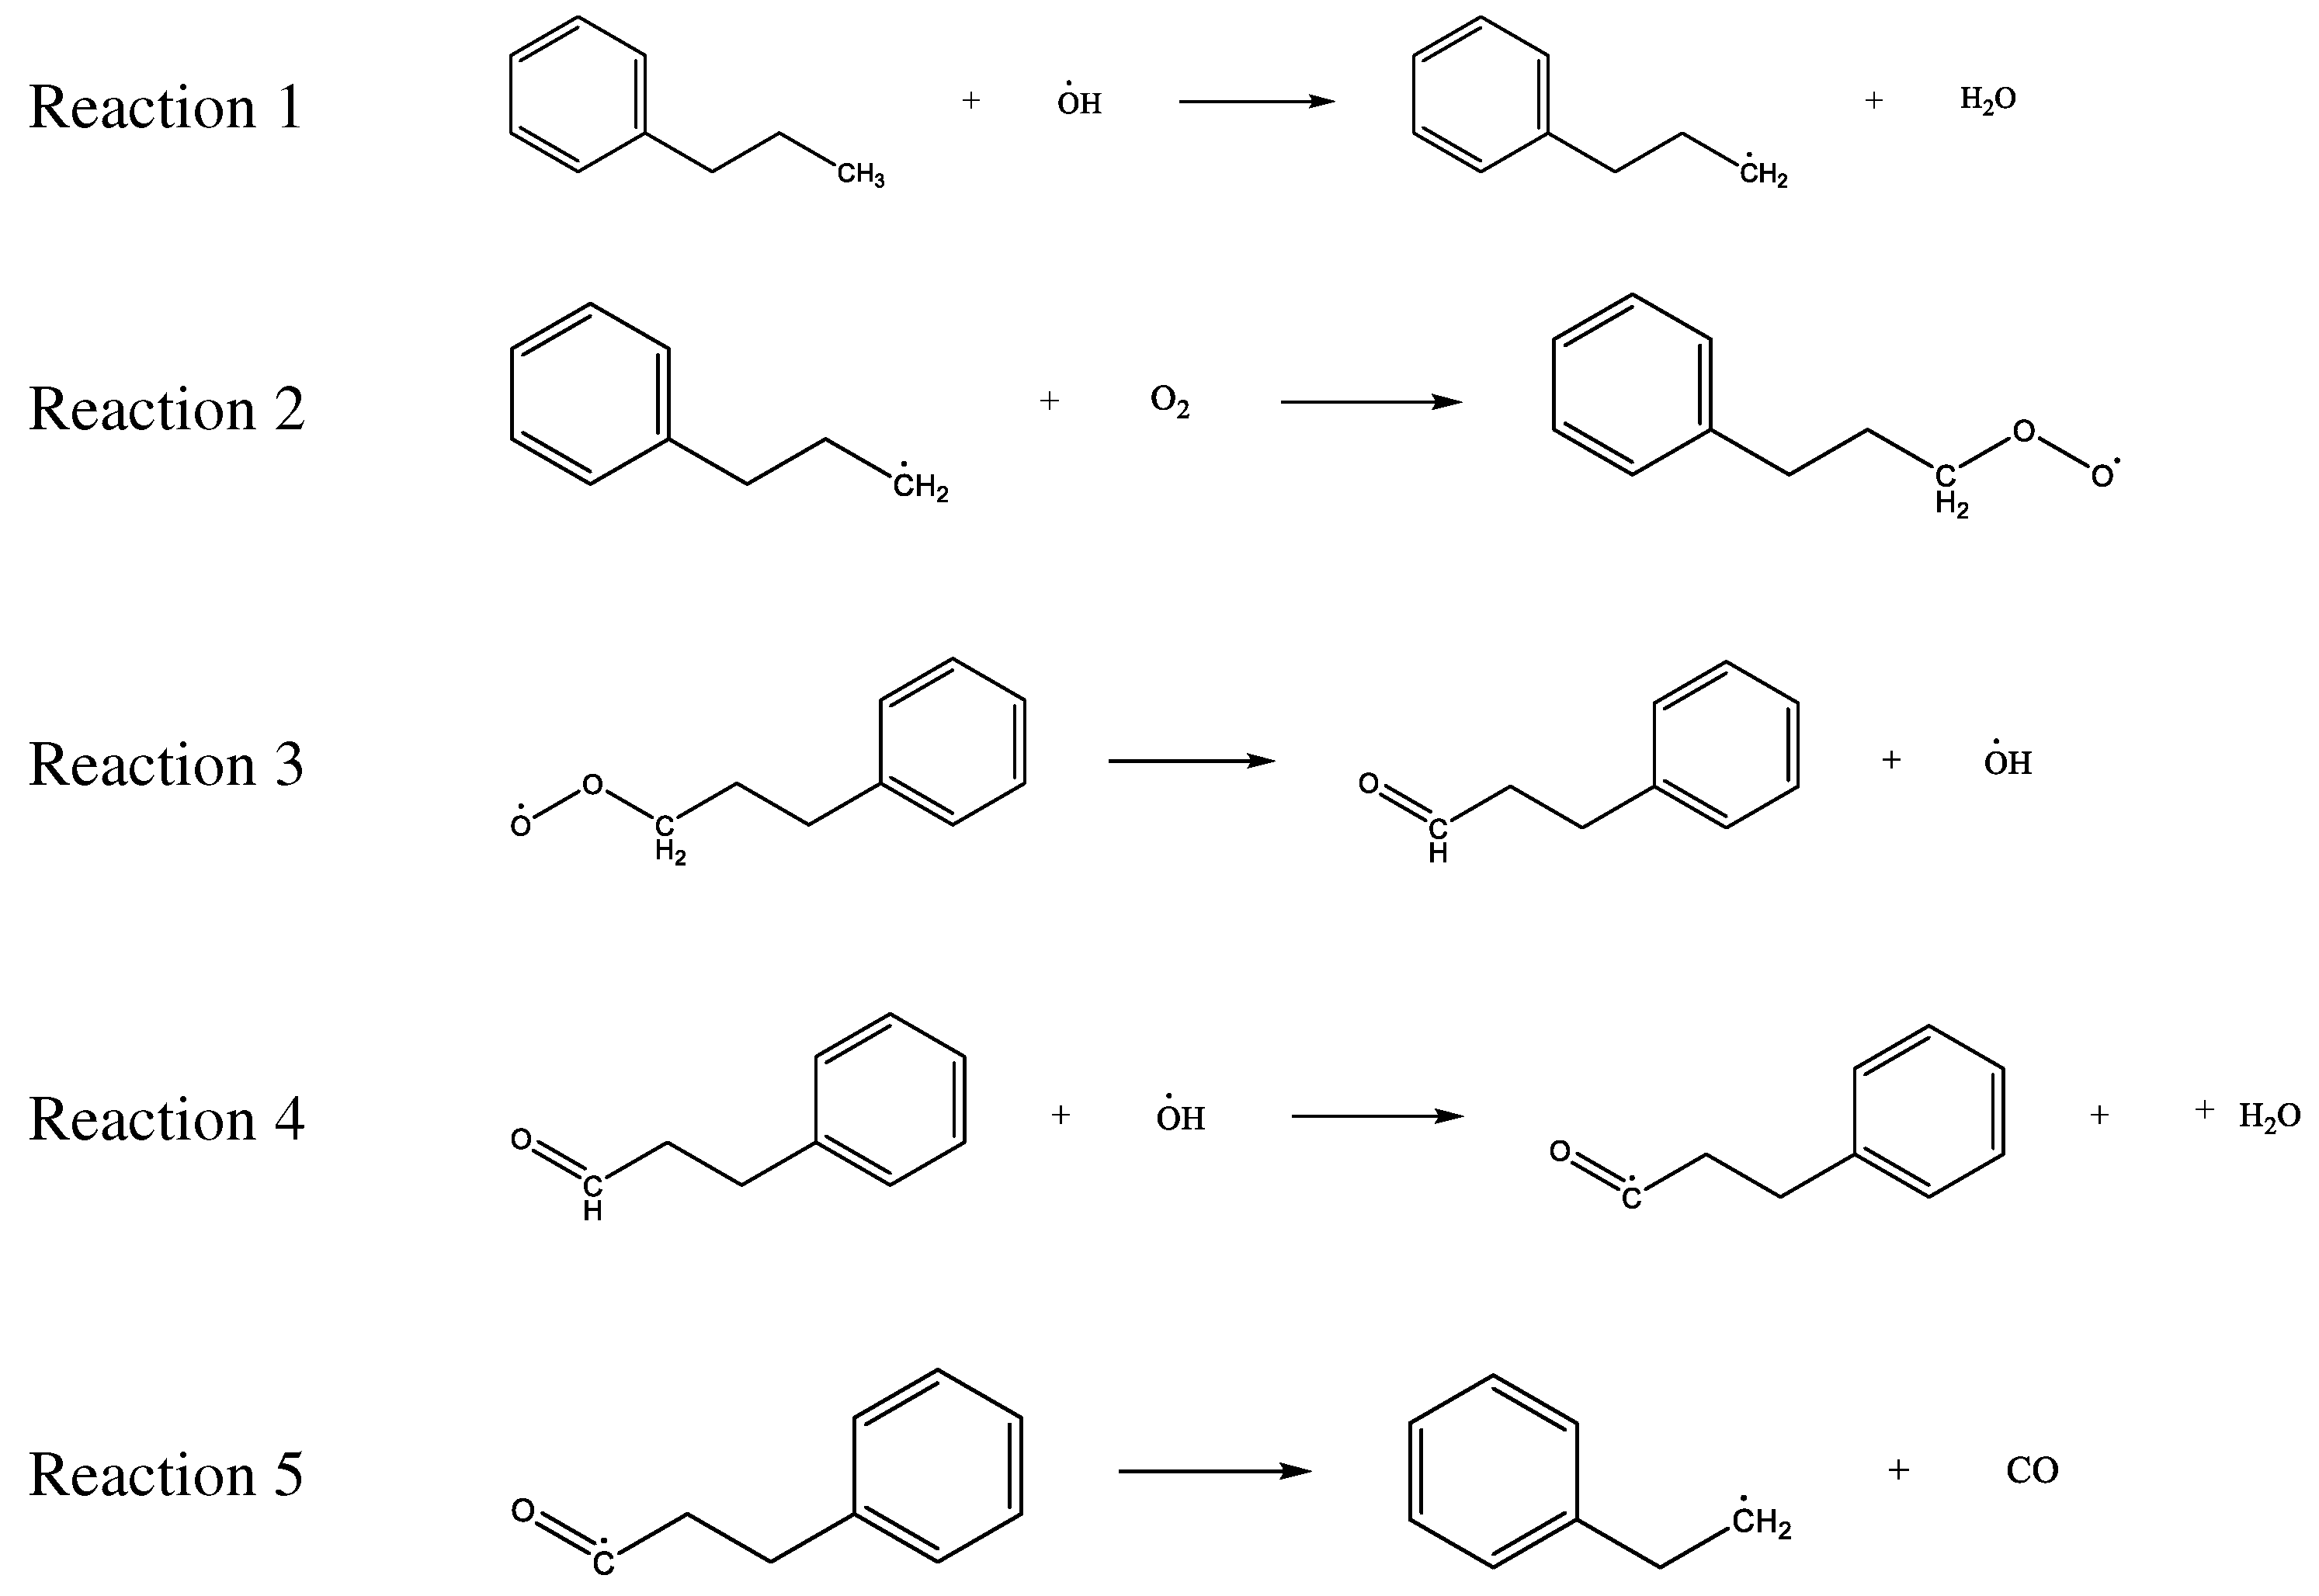
The above reactions were simulated with and without CO2, respectively. CO2 has little effect on the activation energy of reaction 1, but has a significant effect on its heat release. When CO2 is present, the heat release increases from 54.07KJ/mol to 59.19KJ/mol. The reaction 2 is the chemisorption of O2, which does not require activation energy, and its exothermic heat is reduced from 141.49KJ/mol to 125.37KJ/mol in the presence of CO2. The reaction 3 is that the active group in the chemisorbed state abstracts the surrounding hydrogen atoms. The presence of CO2 reduces the activation energy of the reaction from 66.98KJ/mol to 60.34KJ/mol, and at the same time increases the heat release from 103.14KJ/mol to 110.39KJ/mol. The presence of CO2 has little effect on the activation energy of reaction 4, but it can reduce the heat release from 99.73KJ/mol to 90.22KJ/mol. The effect of CO2 on the activation energy and heat change of the reaction 5 is more prominent, the activation energy increases from 48.55KJ/mol to 61.49KJ/mol, and the heat absorption increases from 26.29 KJ/mol to 49.21 KJ/mol. The detailed heat change is shown in Figure 16.
To sum up, CO2 has no significant effect on reaction 1 and reaction 4, it will reduce the exothermic heat of reaction 2, and then affect the subsequent reaction process, and it can promote reaction 3 and hinder reaction 5.
It can be seen from the above that the injection of CO2 will increase the carboxyl and aldehyde groups in the coal. According to the simulation results, it can be explained that this is because CO2 has a weak effect on the reaction of hydroxyl radicals and can hinder the generation of CO, thus reducing the consumption of the above functional groups. CO2 hinders the chemical adsorption reaction between O2 and coal surface molecules, resulting in the inability of continuous generation of hydroxyl radicals, thus playing a role in chemical inhibition. On the whole, CO2 has an inhibitory effect on the reaction of coal chemical adsorption of O2.
3.3. Construction of the Model of CO2 Preventing O2 Adsorption
It can be seen from the above that CO2 can inhibit oxygen adsorption during the low temperature oxidation of coal, and this effect includes physical inhibition and chemical inhibition. And according to the experimental results and molecular simulation results, it is found that the effect of CO2 to prevent O2 adsorption is also different in different stages of coal low-temperature oxidation. Therefore, the model of CO2 physical-chemical inhibition of O2 adsorption is established as shown in Figure 17:
At low temperature, injecting CO2 into the coal can form a protective layer on the surface of the coal, thereby blocking the contact between the coal and O2, and achieving the effect of inhibiting the low-temperature oxidation of the coal. At the same time, it can also replace the O2 adsorbed on the coal surface, resulting in physical inhibition. However, it is found through experiments that when the temperature rises to the point of slow chemical adsorption, CO2 loses its protective effect on the coal surface, and the coal and O2 will produce low-temperature oxidation after contacting again, resulting in an increase in the heating rate of coal. When the coal temperature rises, a chemical adsorption chain reaction has been formed inside the coal. The injection of CO2 at high temperature will dilute the O2 concentration in the coal, thereby reducing the chemical adsorption reaction between coal and O2, and at the same time increasing the activation energy and reducing the reaction heat. This creates a chemical inhibition. At the same time, due to the reduction of the coal chemical adsorption oxygen reaction, the free radicals cannot be generated and are continuously consumed, which slows down the low temperature oxidation reaction process of coal and reduces the heat release. This achieves the effect of preventing the reaction from occurring.
4. Conclusion
In this study, a coal pore model was constructed to simulate the competitive adsorption of CO2 and O2 in coal pores, and to reveal the law of CO2 preventing O2 adsorption from the physical level. Through temperature-programmed experiments and in-situ infrared experiments, the effect of CO2 in preventing oxygen adsorption during low temperature oxidation of coal was explored from both macroscopic and microscopic perspectives. The microscopic mechanism of CO2 chemical inhibition of oxygen adsorption was investigated by chemical reaction simulation. In this study, a CO2 physical-chemical oxygen barrier adsorption model was constructed. The specific conclusions are as follows:
(1)The adsorption capacity of coal pores to CO2 is stronger than that of O2. CO2 tends to be adsorbed near the pore wall and O2 tends to be adsorbed in the center of the pores. Moreover, CO2 can replace O2 adsorbed in coal, and the replacement mostly occurs in the area near the pore wall.
(2)The injection of CO2 can block the adsorption of O2 in the low temperature oxidation process of coal, and its hindering effect is mainly reflected in the slow heating stage, which is manifested as increasing the activation energy of coal and reducing the heating rate of coal. As the temperature increases, CO2 will be desorbed from the coal, and at about 120 ° C, the coal loses the protective effect of CO2.
(3)When coal is cooled in air atmosphere, the increased functional groups are mainly ·OH and C-O-O·, -C=O and -COOH, which are all products of coal oxygen adsorption. When the coal is cooled in the CO2 atmosphere, the coal will mainly undergo pyrolysis and condensation reactions, which will eventually lead to the increase of -CH=O and -COOH in the coal, and the changes of other structures are small.
(4)In the chemisorption chain reaction of coal oxide, the effect of CO2 on each step of the reaction chain is not the same, but in general, it increases the activation energy and reduces the heat release, which has the effect of inhibiting the chemical reaction.
(5)At low temperature, CO2 prevents the adsorption of O2 in the form of preempting the adsorption space. After the temperature rises, CO2 prevents the chemical reaction of coal adsorption of O2 in the form of increasing the activation energy and reducing the heat release.
Author Contributions
Gang Cheng writing original draft, experiments and simulation methods and data arrangement; Haiyan Wang provide coal sample and editing. Bo Tan writing review ; Shuhui Fu simulating that the coal adsorbs oxygen;
Funding
This research was supported by the National Natural Science Foundation of China (52074156, 51804355, 51864045, 51774291), the Fundamental Research Funds for the Central Universities (2022YJSAQ13), Introduction Plan for "Tianchi Talent" in Xinjiang Uygur Autonomous Region.
Institutional Review Board Statement
Not applicable.
Informed Consent Statement
Not applicable.
Data Availability Statement
Not applicable.
Conflicts of Interest
The authors declare no conflict of interest.
References
- Song, Z. , et al., Analysis of coal fire dynamics in the Wuda syncline impacted by fire-fighting activities based on in-situ observations and Landsat-8 remote sensing data. International Journal of Coal Geology, 2015. 141-142: p. 91-102. [CrossRef]
- Liu, J.; Wang, Y.; Yan, S.; Zhao, F.; Li, Y.; Dang, L.; Liu, X.; Shao, Y.; Peng, B. Underground Coal Fire Detection and Monitoring Based on Landsat-8 and Sentinel-1 Data Sets in Miquan Fire Area, XinJiang. Remote Sens. 2021, 13, 1141. [Google Scholar] [CrossRef]
- Tan, B. , Zhang, F., Zhang, Q. et al. Firefighting of subsurface coal fires with comprehensive techniques for detection and control: a case study of the Fukang coal fire in the Xinjiang region of China. Environ Sci Pollut Res 26, 29570–29584 (2019). [CrossRef]
- Wang, T. , et al., A spatio-temporal temperature-based thresholding algorithm for underground coal fire detection with satellite thermal infrared and radar remote sensing. International Journal of Applied Earth Observation and Geoinformation, 2022. 110: p. 102805. [CrossRef]
- Song, Z. and C. Kuenzer, Coal fires in China over the last decade: A comprehensive review. International Journal of Coal Geology, 2014. 133: p. 72-99. [CrossRef]
- Shao Z, Jia X, Zhong X, Wang D, Wei J, Wang Y, Chen L. Detection,extinguishing, and monitoring of a coal fire in Xinjiang, China. Environ SciPollut Res Int. 2018 Sep;25(26):26603-26616. [CrossRef]
- Ge Shirong, Guo Guangli and Wang Yuehan. “Mining Science and Technology : Proceedings of the 5th International Symposium on Mining Science and Technology, Xuzhou, China 20-22 October 2004.
- Wang, H., B. Z. Dlugogorski and E.M. Kennedy, Kinetic modeling of low-temperature oxidation of coal. Combustion and Flame, 2002. 131(4): p. 452-464. [CrossRef]
- Tan, B. , Cheng, G., Zhu, X. et al. Experimental Study on the Physisorption Characteristics of O2 in Coal Powder are Effected by Coal Nanopore Structure. Sci Rep 10, 6946 (2020). [CrossRef]
- Grant G. Karsner, Daniel D. Perlmutter, Model for coal oxidation kinetics. 1. Reaction under chemical control [J], Fuel, 1982, 29-34. [CrossRef]
- Wang, H., B. Z. Dlugogorski and E.M. Kennedy, Coal oxidation at low temperatures: oxygen consumption, oxidation products, reaction mechanism and kinetic modelling. Progress in Energy and Combustion Science, 2003. 29(6): p. 487-513. [CrossRef]
- Xue, D. , et al., Carbon dioxide sealing-based inhibition of coal spontaneous combustion: A temperature-sensitive micro-encapsulated fire-retardant foamed gel. Fuel, 2020. 266: p. 117036. [CrossRef]
- Liu Y, Wen H, Guo J, et al. Coal spontaneous combustion and N2 suppression in triple goafs: A numerical simulation and experimental study[J]. Fuel, 2020,271:117625.
- Zhang, Y.; Xu, J.; Wang, D. Experimental Study on the Inhibition Effects of Nitrogen and Carbon Dioxide on Coal Spontaneous Combustion. Energies 2020, 13, 5256. [Google Scholar] [CrossRef]
- Deng, Jun & Ren, Li-Feng & Ma, Li & Qin, Xiao-Yang & Wang, Wei-Feng & Liu, Chang-Chun. (2019). Low-temperature oxidation and reactivity of coal in O2/N2 and O2/CO2 atmospheres, a case of carboniferous–permian coal in Shaanxi, China. Environmental Earth Sciences. [CrossRef]
- Reza Khatami, Chris Stivers, Yiannis A. Levendis, Ignition characteristics of single coal particles from three different ranks in O2/N2 and O2/CO2 atmospheres [J], Combustion and Flame, 2012, 3554-3568. [CrossRef]
- Wang F, Liu H W. Comparative experiment study on fire prevention and extinguishing in goaf by N-2-water mist and CO2-water mist[J]. ARABIAN JOURNAL OF GEOSCIENCES, 2020,13(17).
- Liu W, Chu X Y, Xu H, et al. Oxidation reaction constants for coal spontaneous combustion under inert gas environments: An experimental investigation[J]. ENERGY, 2022,247.
- Su H T, Kang N, Shi B B, et al. Simultaneous thermal analysis on the dynamical oxygen-lean combustion behaviors of coal in a O-2/N-2/CO2 atmosphere[J]. JOURNAL OF THE ENERGY INSTITUTE, 2021,96:128-139.
- Liu H W, Wang F. Thermal characteristics and kinetic analysis of coal-oxygen reaction under the condition of inert gas[J]. INTERNATIONAL JOURNAL OF COAL PREPARATION AND UTILIZATION, 2022,42(3):846-862.
- Wu L, Qiao Y, Yao H. Experimental and numerical study of pulverized bituminous coal ignition characteristics in O2/N2 and O2/CO2 atmospheres[J]. ASIA-PACIFIC JOURNAL OF CHEMICAL ENGINEERING, 2012,7:S195-S200.
- Li, Q. , et al., Properties of char particles obtained under O2/N2 and O2/CO2 combustion environments. Chemical Engineering and Processing: Process Intensification, 2010. 49(5): p. 449-459.
- Ma, L. , et al., Micro-characteristics of low-temperature coal oxidation in CO2/O2 and N2/O2 atmospheres. Fuel, 2019. 246: p. 259-267.
- Zhou B Z, Yang S Q, Yang W M, et al. Variation characteristics of active groups and macroscopic gas products during low-temperature oxidation of coal under the action of inert gases N-2 and CO2[J]. FUEL, 2022,307.
- Wu, S., Z. Jin and C. Deng, Molecular simulation of coal-fired plant flue gas competitive adsorption and diffusion on coal. Fuel, 2019. 239: p. 87-96. [CrossRef]
- Zhang J, Wang J, Zhang C, et al. Molecular simulation of gases competitive adsorption in lignite and analysis of original CO desorption[J]. Scientific Reports, 2021,11(1).
- Long H, Lin H F, Yan M, et al. Adsorption and diffusion characteristics of CH4, CO2, and N2 in micropores and mesopores of bituminous coal: Molecular dynamics[J]. FUEL, 2021,292.
- Dong, X. , et al., Investigation of Competitive Adsorption Properties of CO/CO2/O2 onto the Kailuan Coals by Molecular Simulation. ACS Omega, 2022. 7.
- Liu Y, Fu P F, Bie K, et al. The intrinsic reactivity of coal char conversion compared under different conditions of O2/CO2, O-2/H2O and air atmospheres[J]. JOURNAL OF THE ENERGY INSTITUTE, 2020,93(5):1883-1891.
- Liu, M. , et al., 3-D simulation of gases transport under condition of inert gas injection into goaf. Heat and Mass Transfer, 2016. 52(12): p. 2723-2734. [CrossRef]
- Yan Fazhi, Xu Jiang, Peng Shoujian, et al. Breakdown process and fragmentation characteristics of anthracite subjected to high-voltage electrical pulses treatment[J]. Fuel, 2020,275(C).
- Yan Fazhi, Xu Jiang, Lin Baiquan, et al. Changes in pore structure and permeability of anthracite coal before and after high-voltage electrical pulses treatment[J]. Powder Technology, 2019,343.
- Ren J G, Song Z M, Li B, et al. Structure feature and evolution mechanism of pores in different metamorphism and deformation coals[J]. FUEL, 2021,283.
- Fu, S. , et al., Study of Adsorption Characteristics of CO2, O2, and N2 in Coal Micropores and Mesopores at Normal Pressure. Industrial & Engineering Chemistry Research, 2022.
- Cheng Gang, Tan Bo, Zhang Zhaolun, Fu Shuhui, Wang Haiyan, Wang Feiran, Characteristics of coal-oxygen chemisorption at the low-temperature oxidation stage: DFT and experimental study, Fuel, 2022,123120. [CrossRef]
Figure 2.
Gas adsorption model of coal surface pore.
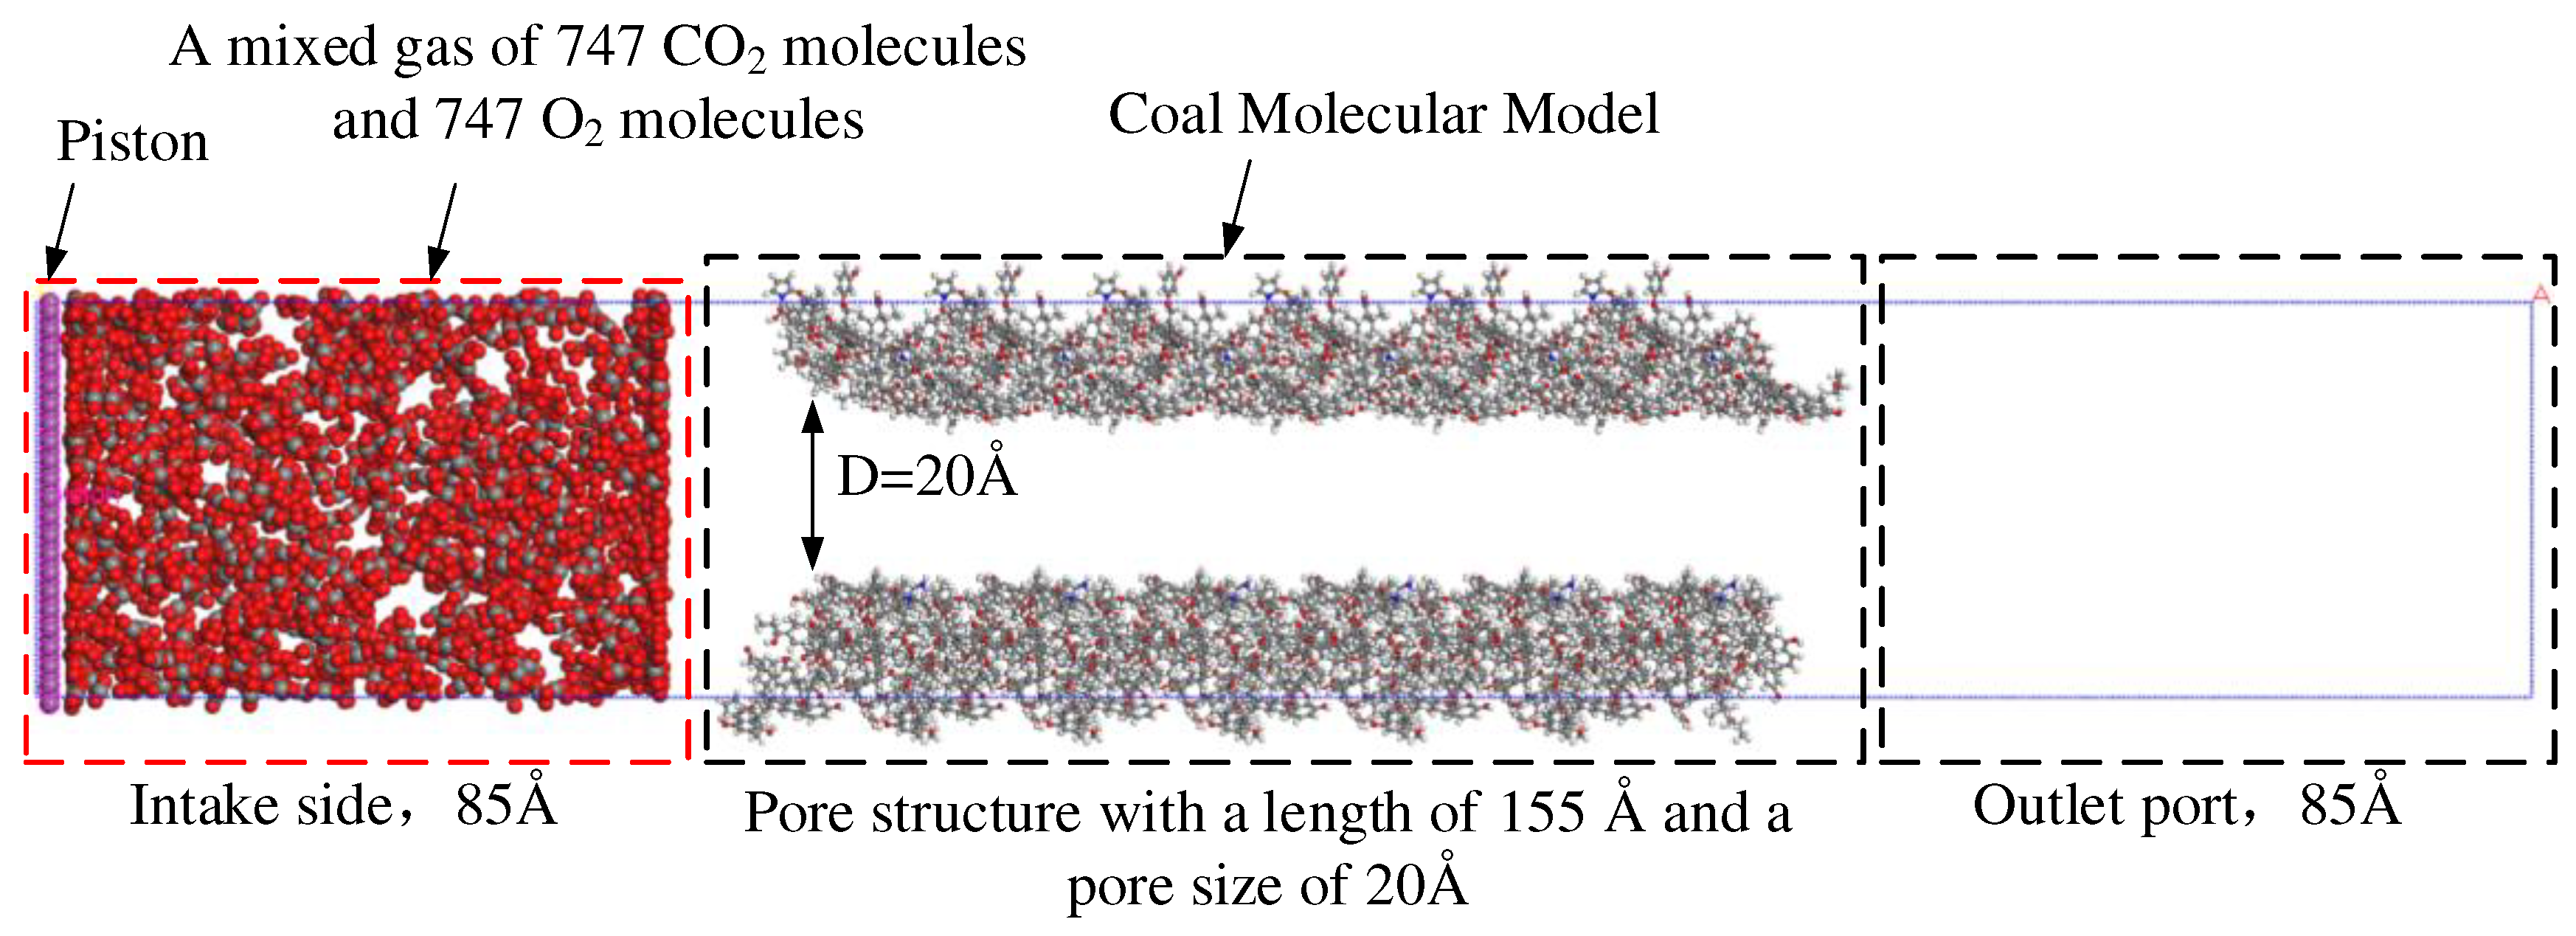
Figure 3.
Adsorption and diffusion of O2 and CO2 in coal pore structure at 30℃.
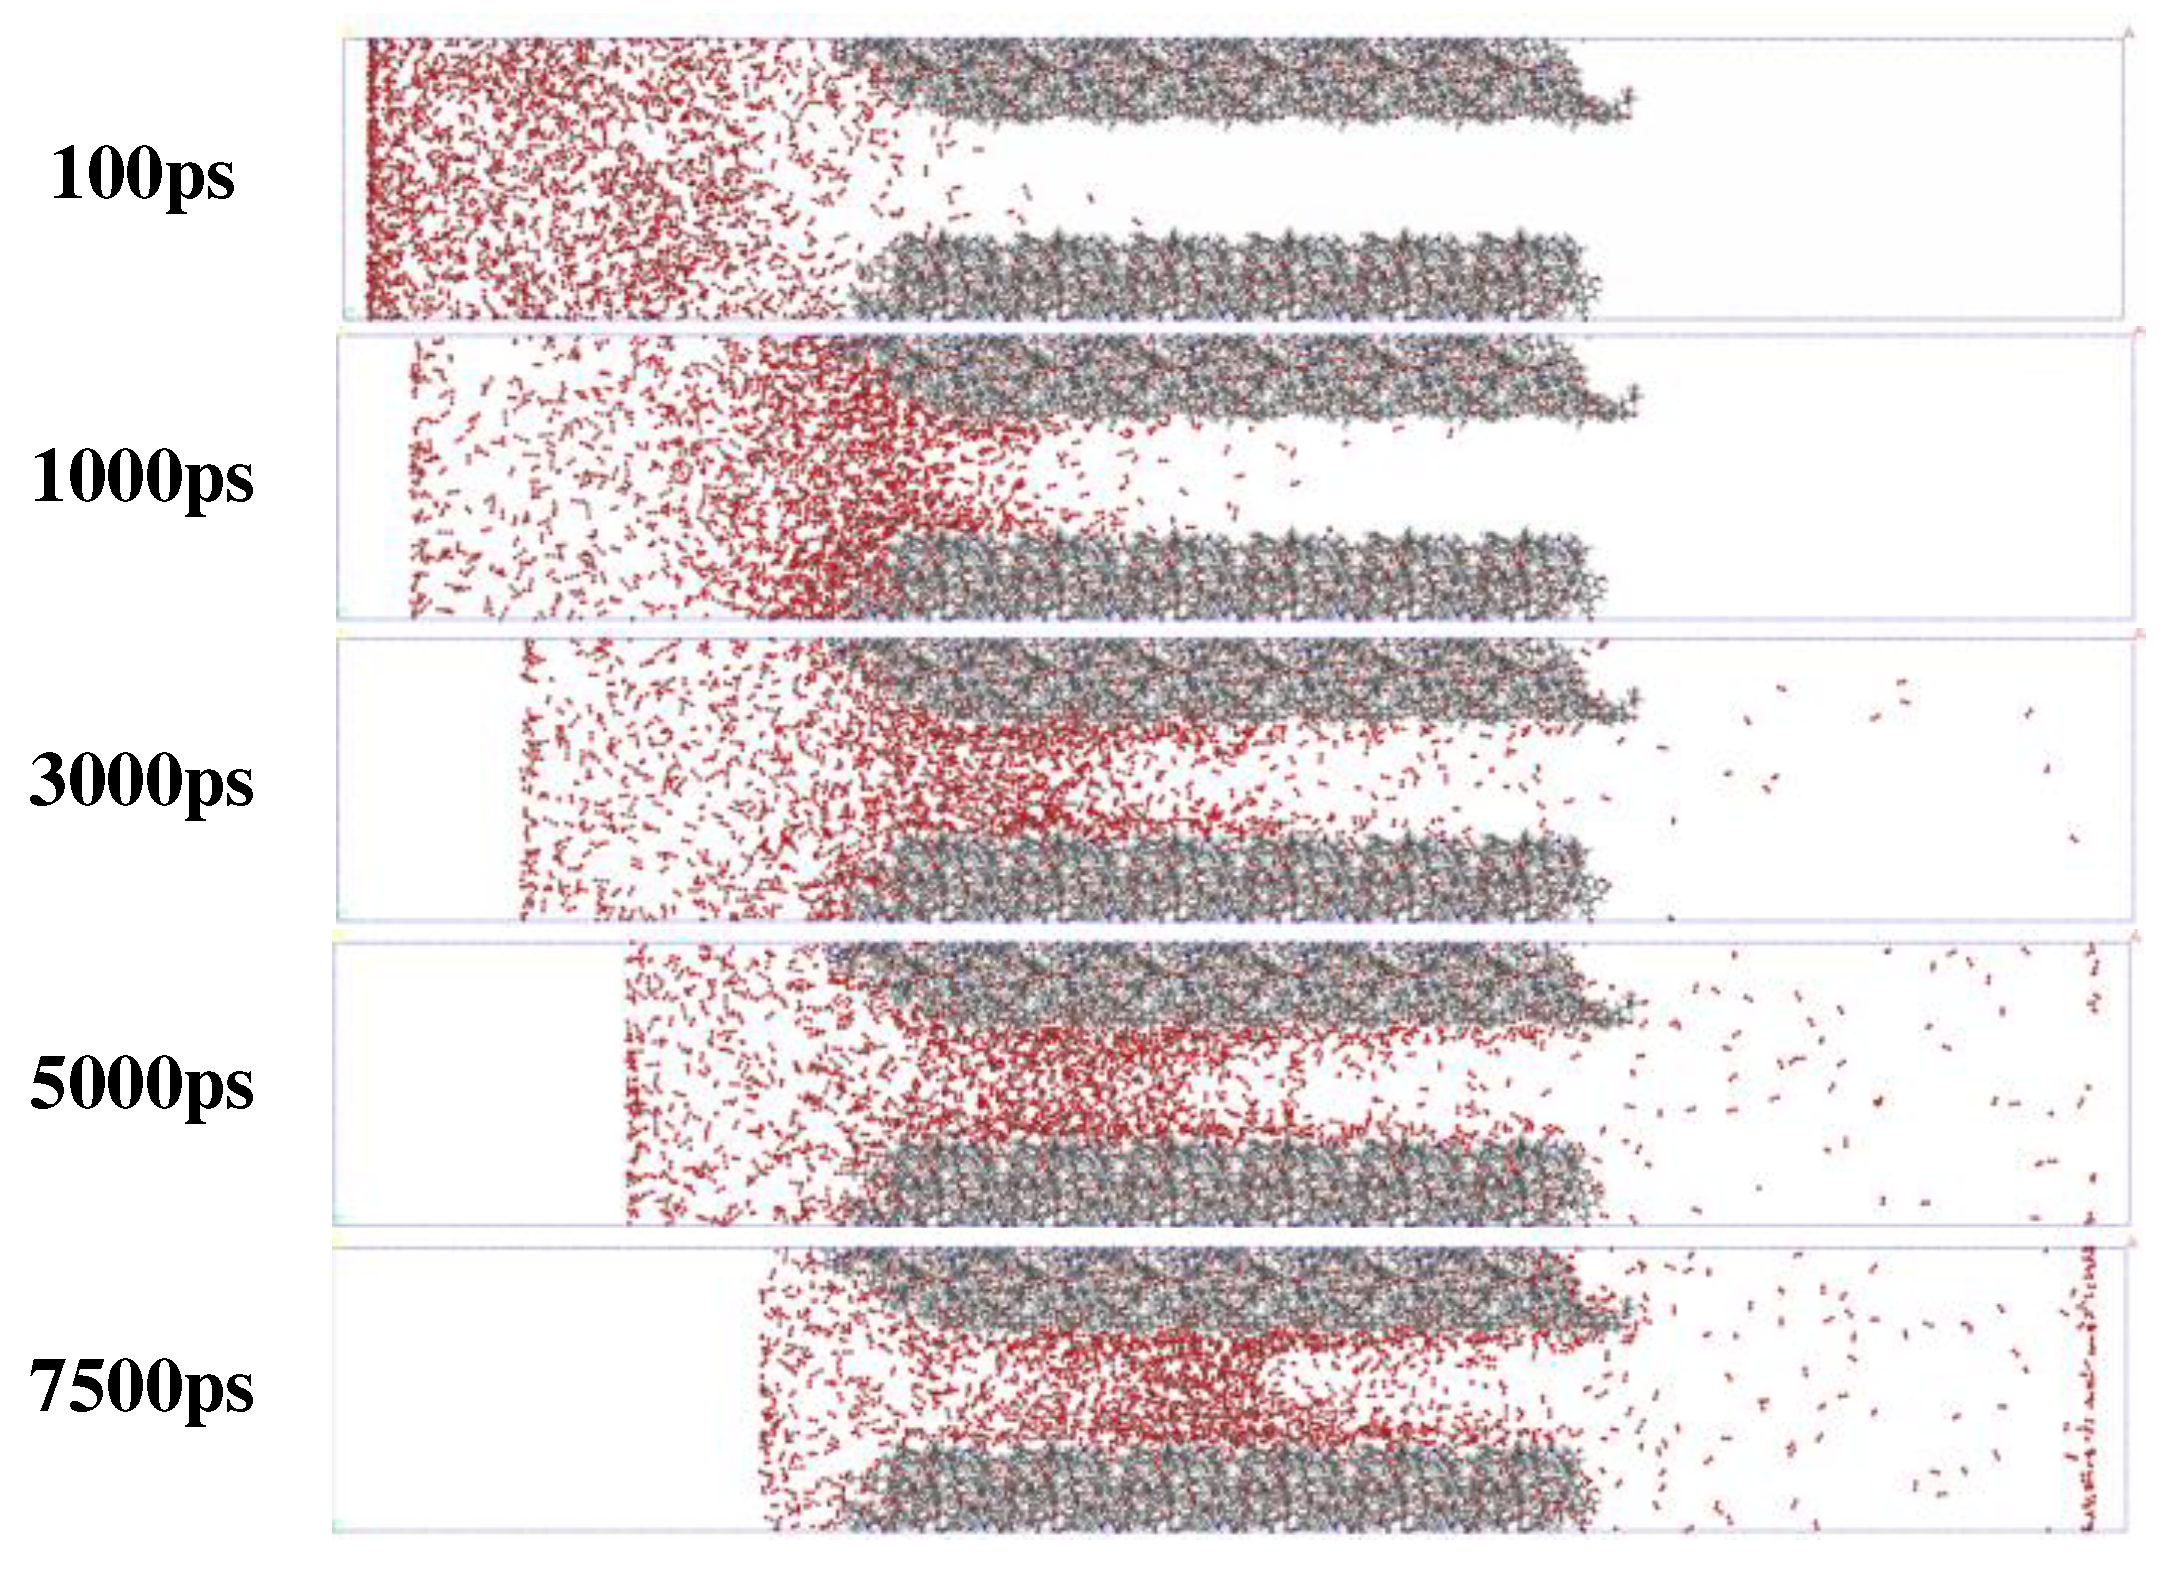
Figure 4.
Variations of O2 and CO2 with time at the gas outlet port of the coal surface pore model at different temperatures.
Figure 4.
Variations of O2 and CO2 with time at the gas outlet port of the coal surface pore model at different temperatures.
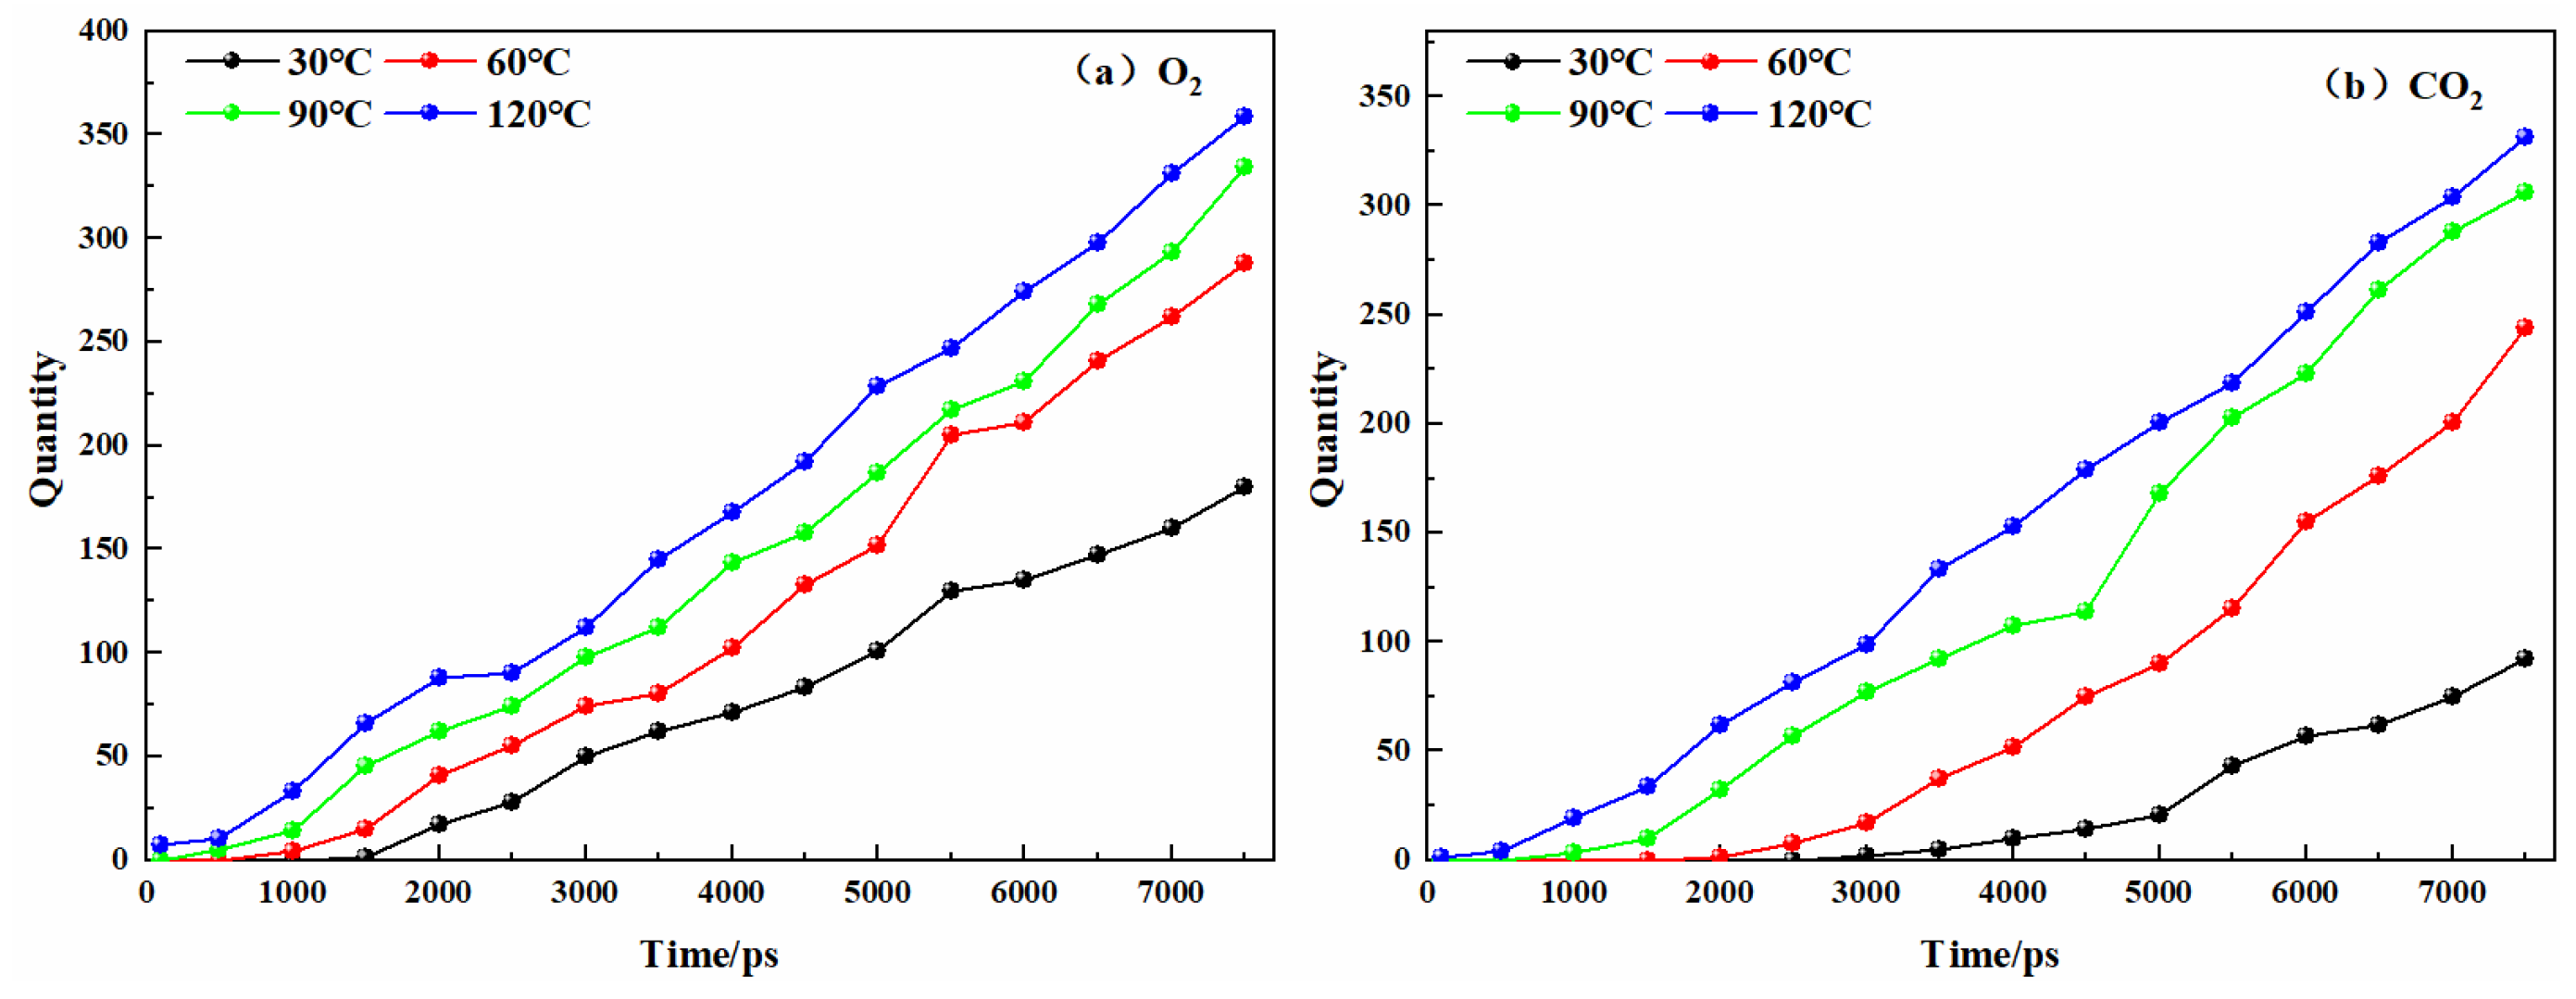
Figure 5.
Quantities of O2 and CO2 adsorbed in coal pores at 30℃.

Figure 6.
Variation of temperature and heating rate of each coal sample with time.
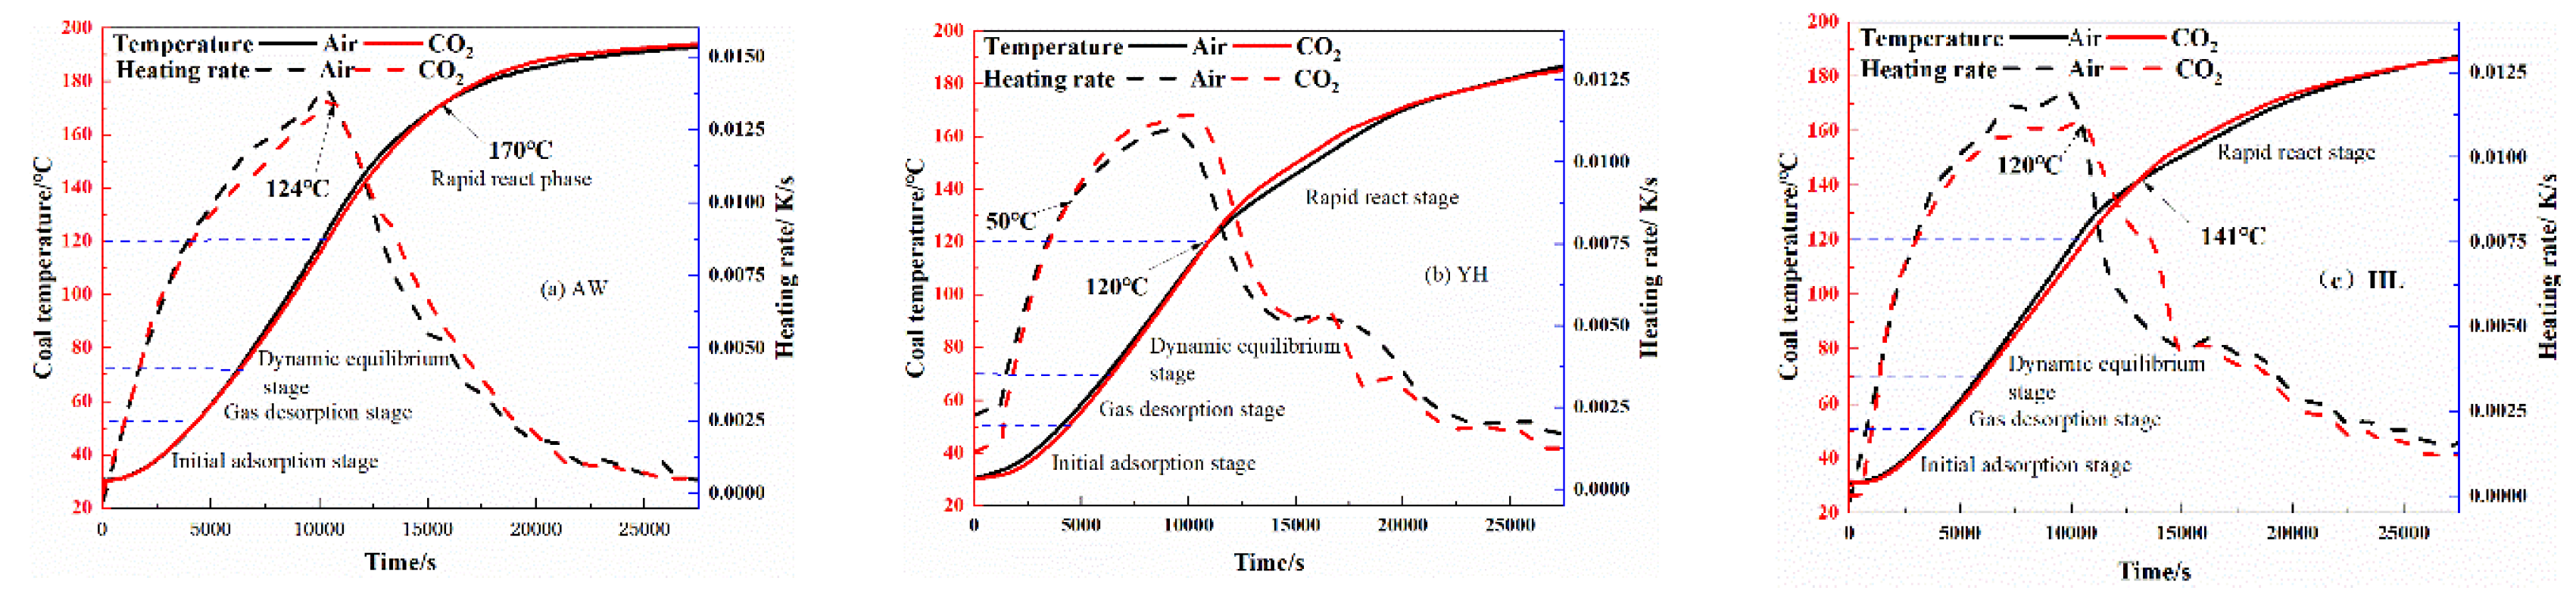
Figure 7.
Diagram of the relationship between ln(dT/dt) vs. 1000/T for AW coal sample.
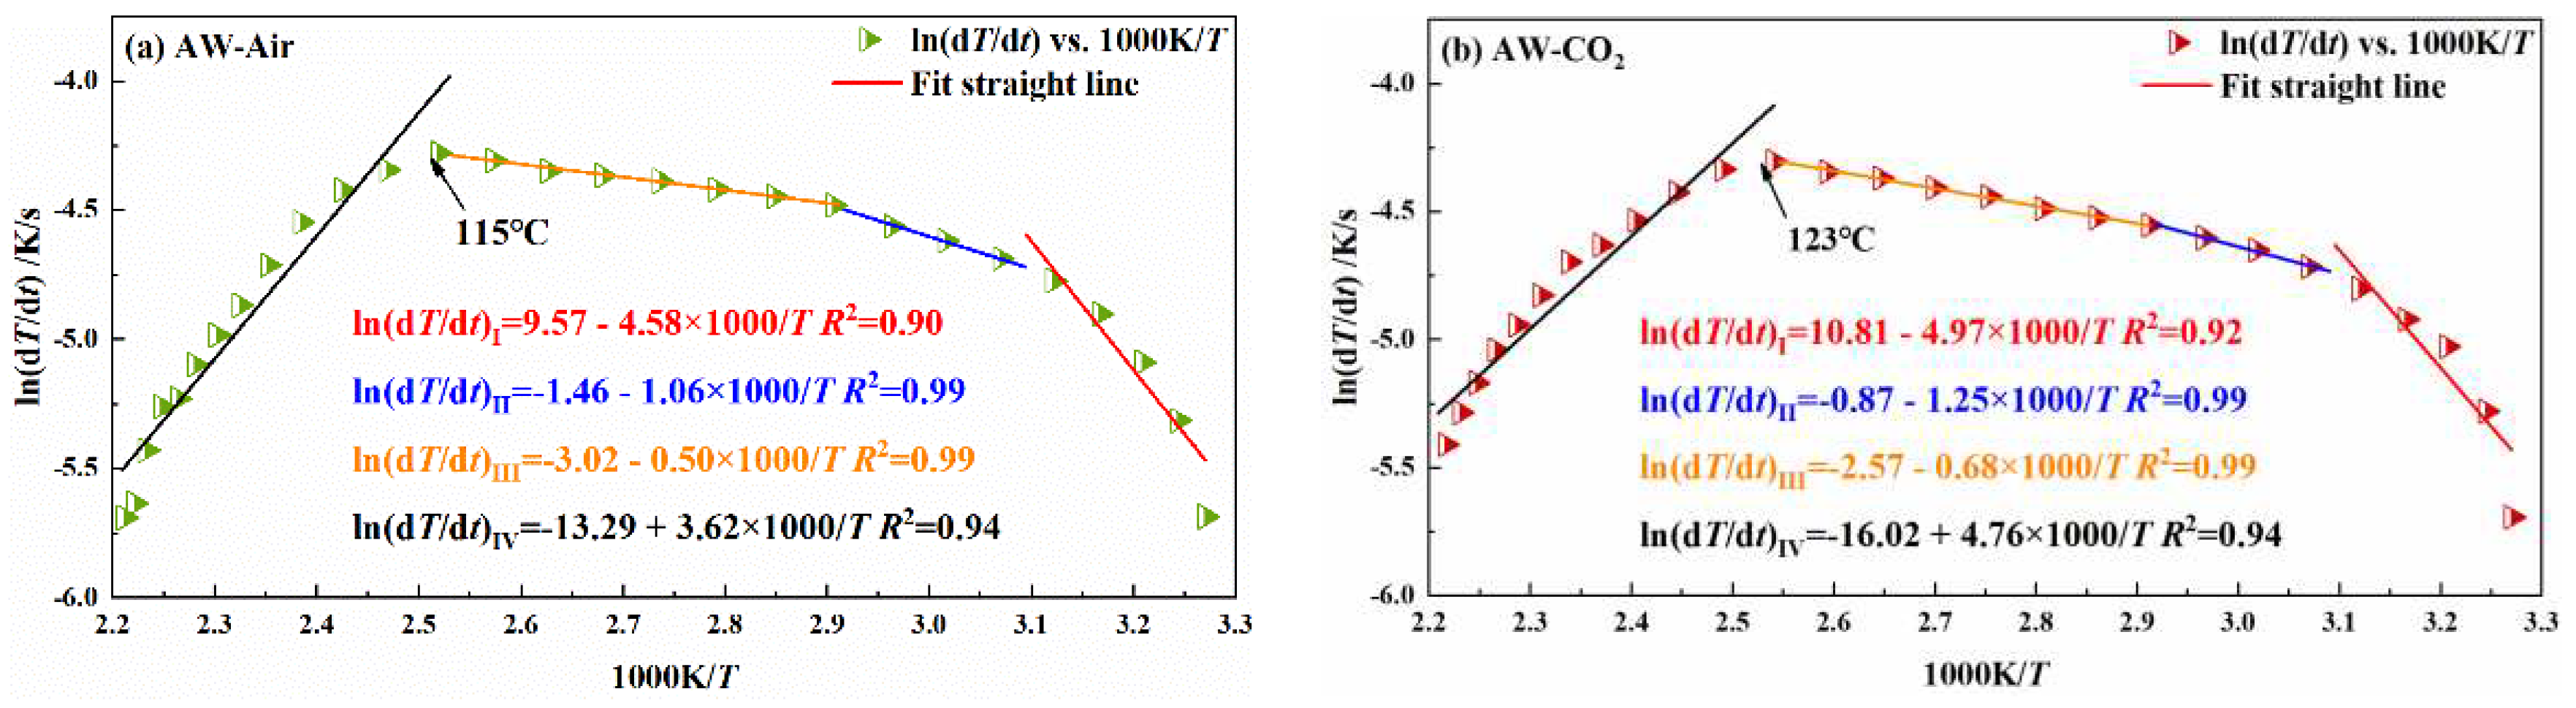
Figure 8.
Diagram of the relationship between ln(dT/dt) vs. 1000/T for YH coal sample.
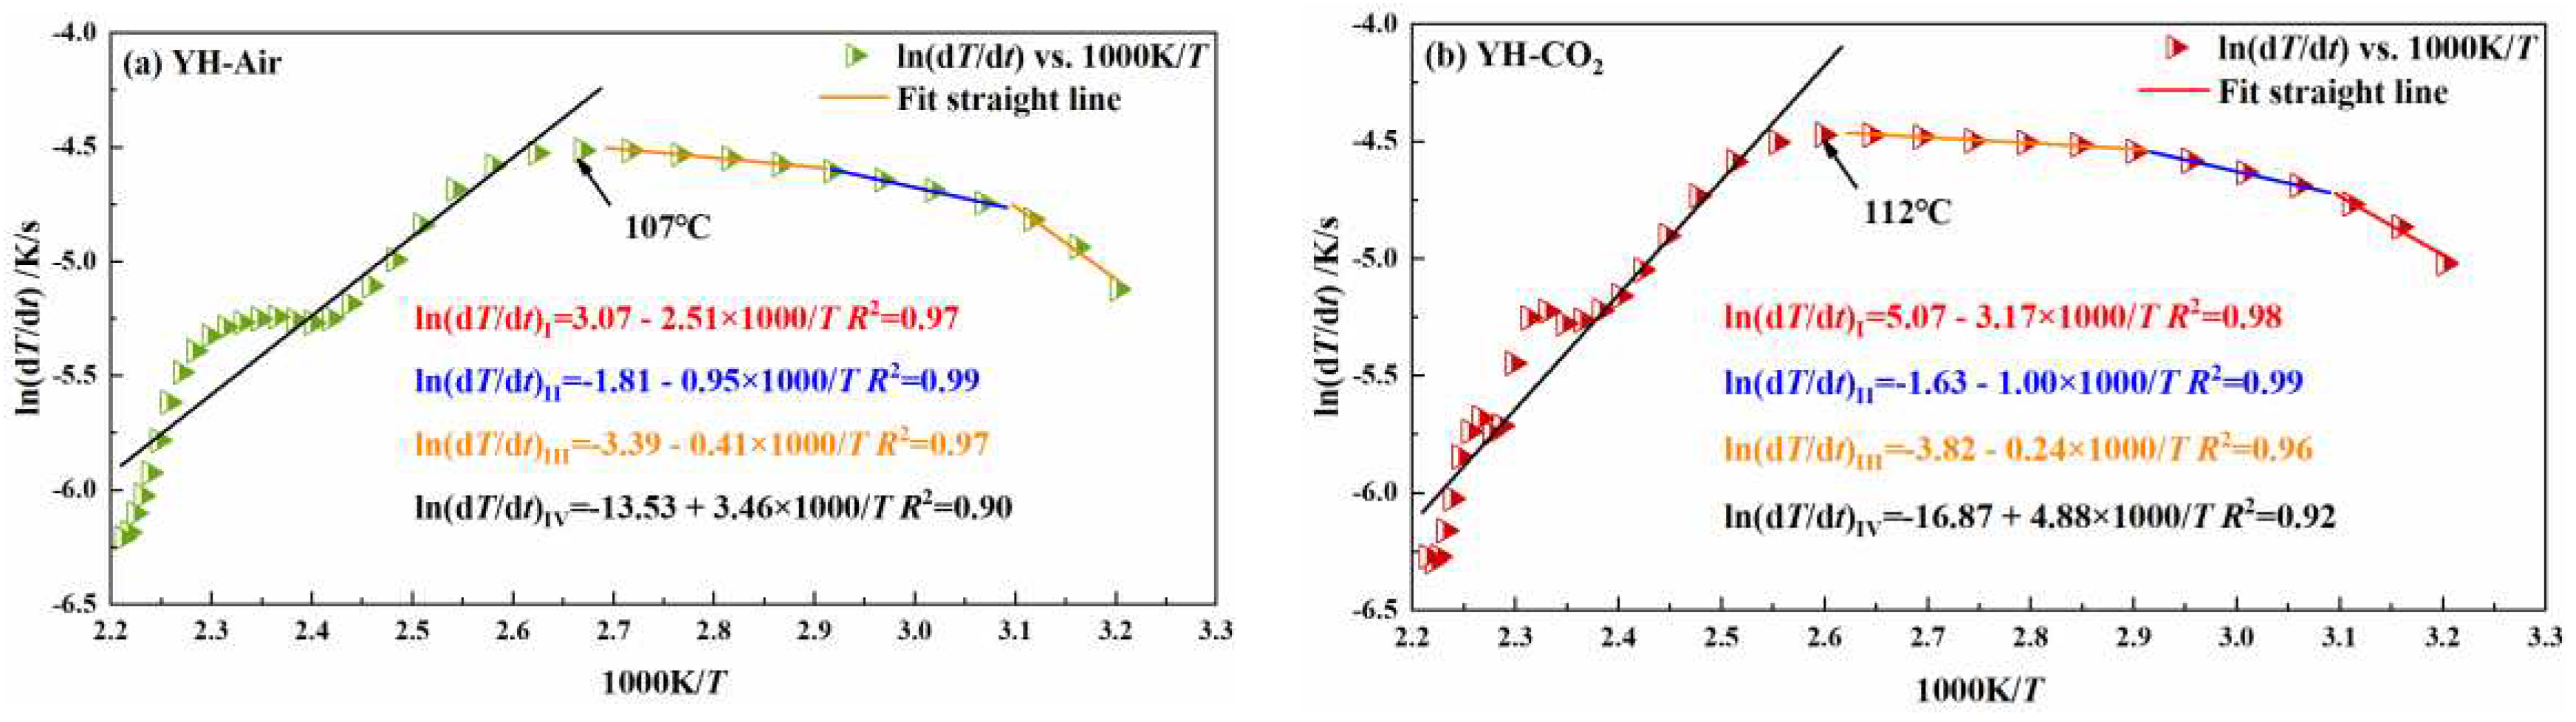
Figure 9.
Diagram of the relationship between ln(dT/dt) vs. 1000/T for HL coal sample.
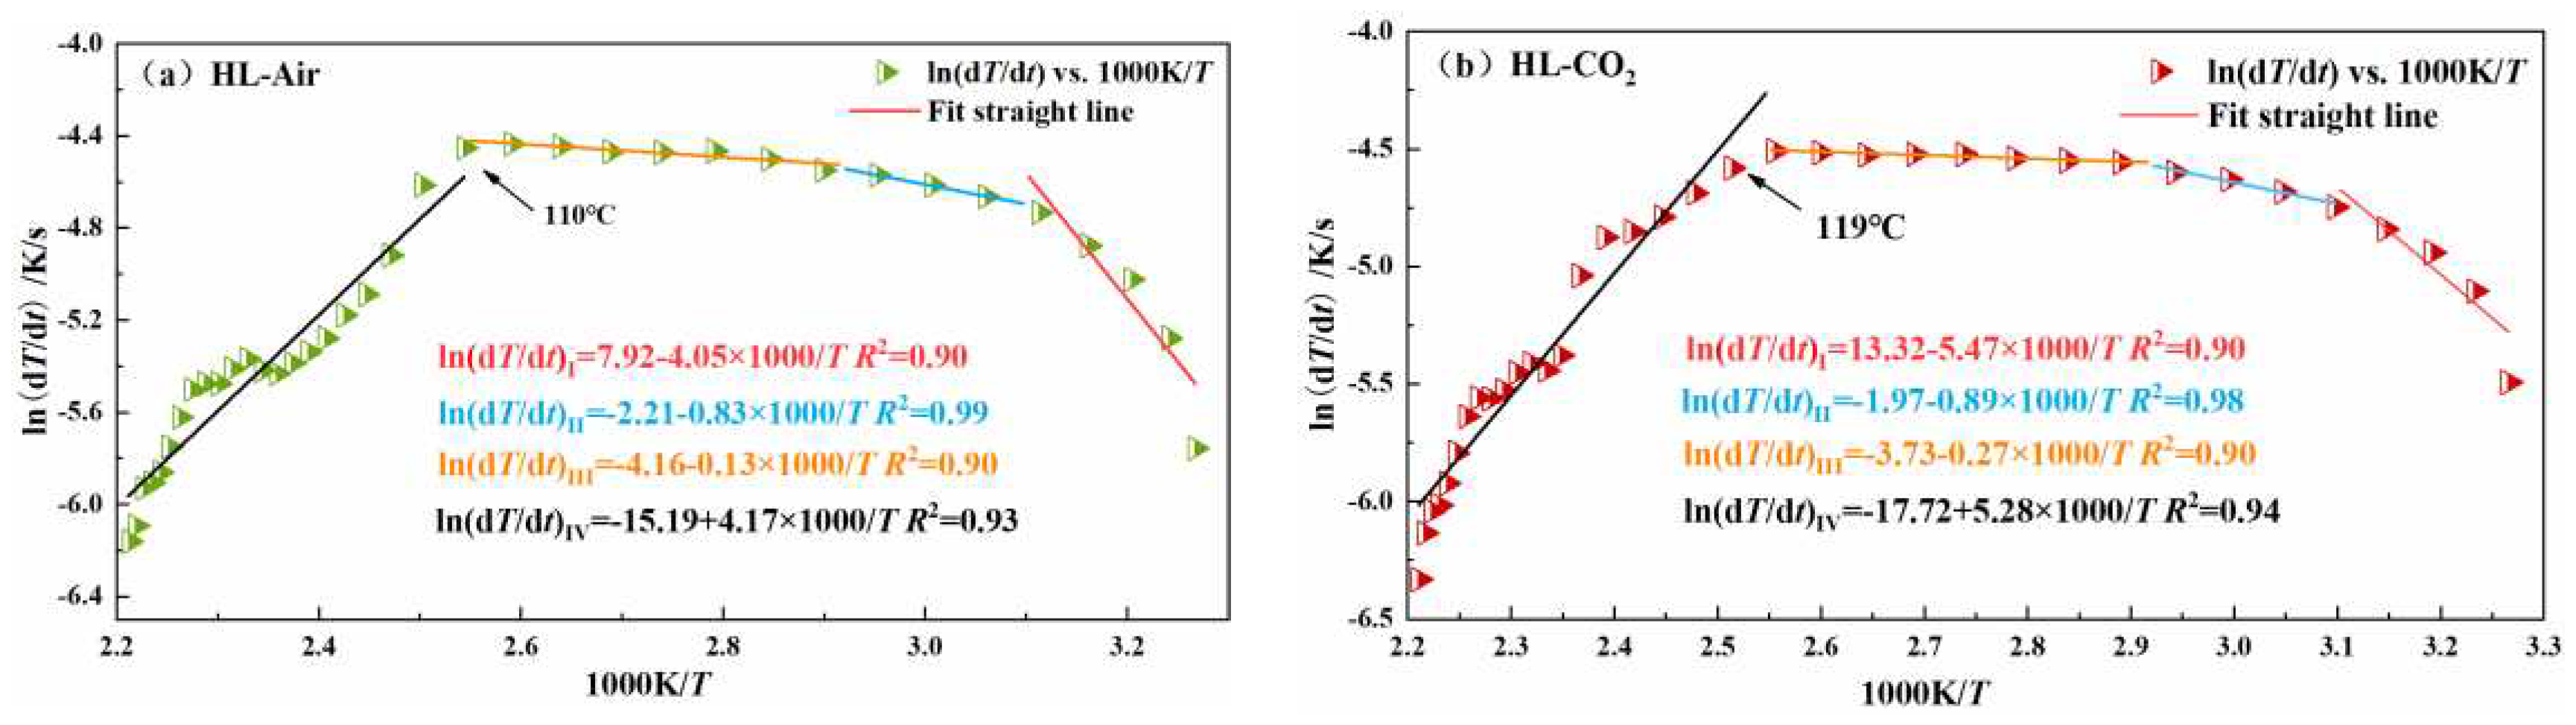
Figure 10.
Peroxide Changes of Coal in Cooling Process in Air and CO2 Atmospheres.
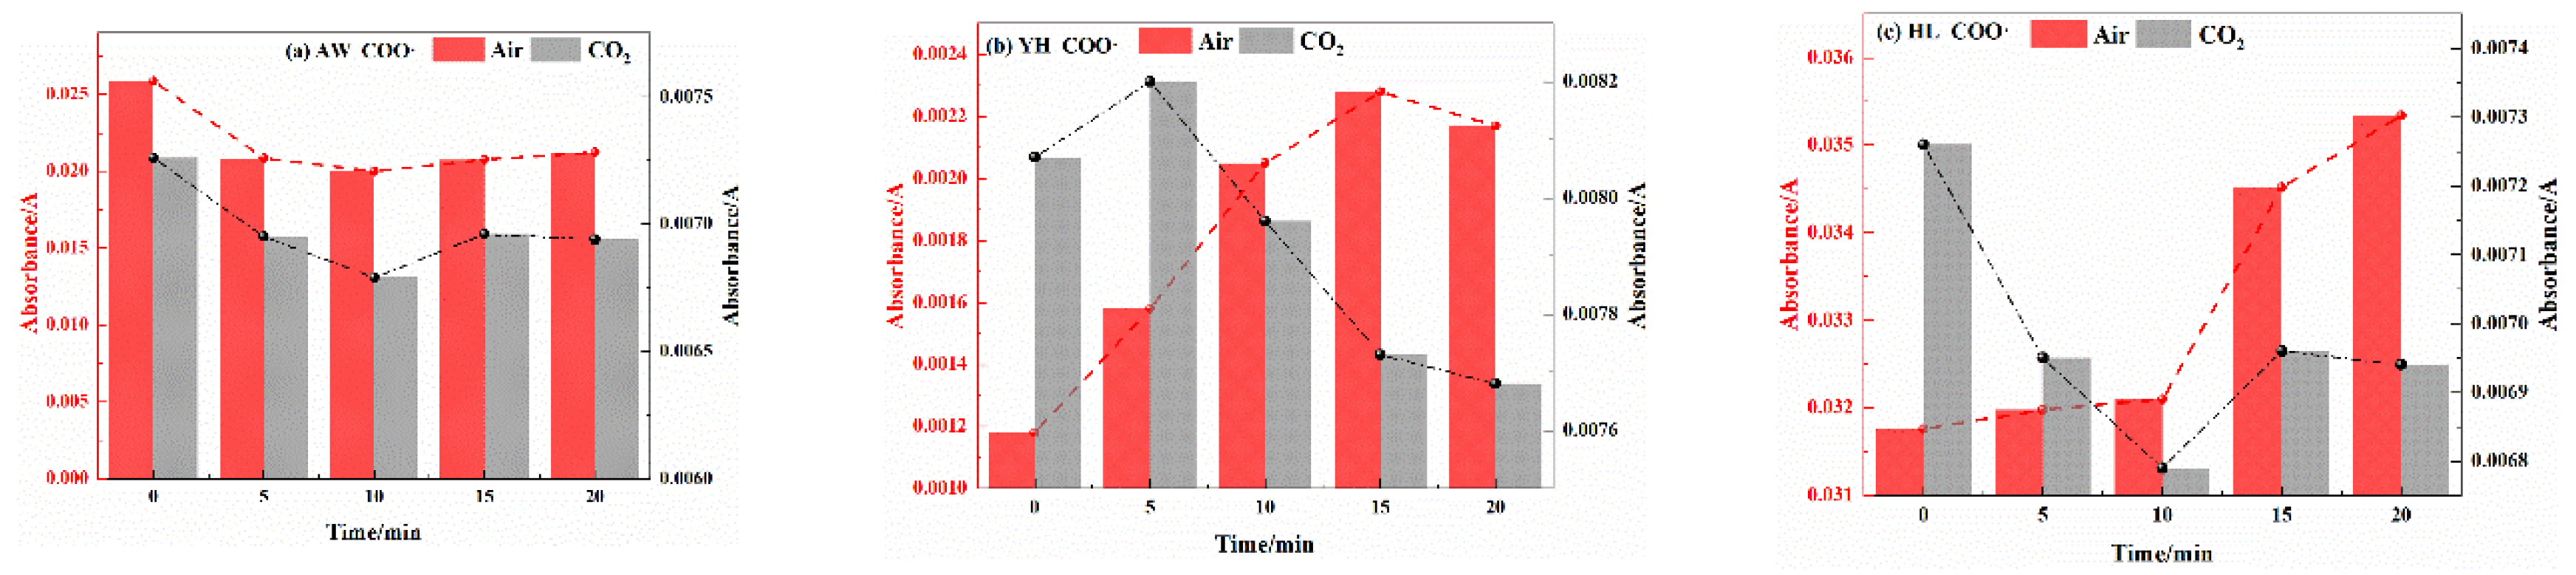
Figure 11.
Free Hydroxyl Changes of Coal in Cooling Process in Air and CO2 Atmospheres.
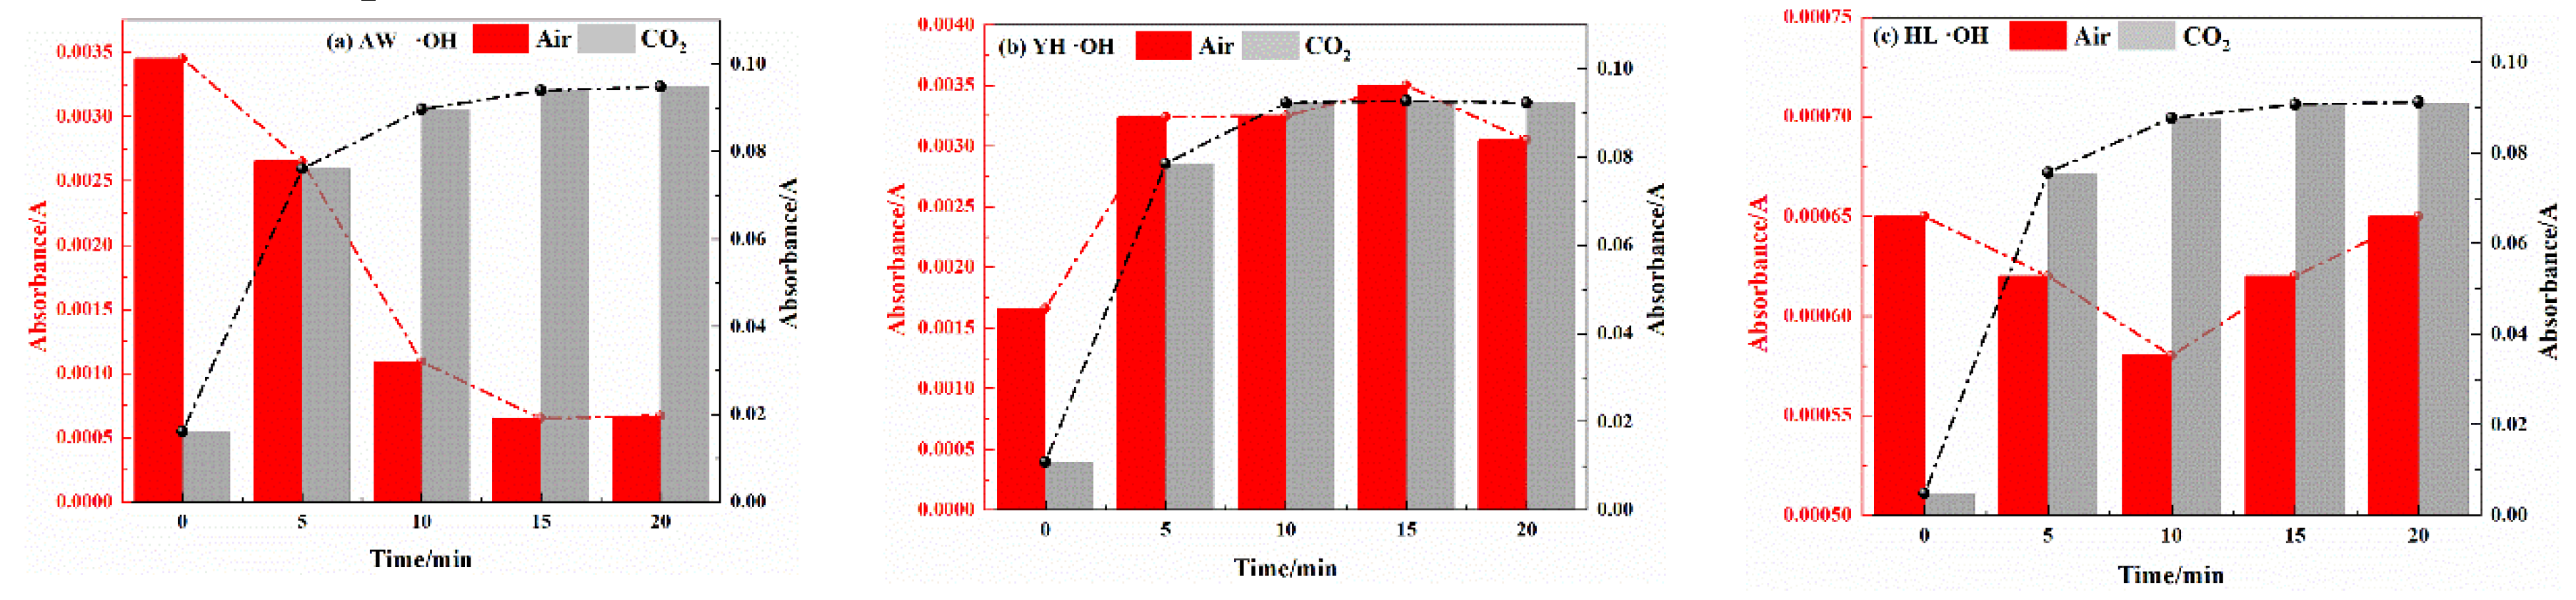
Figure 12.
Carbonyl Changes of Coal in Cooling Process in Air and CO2 Atmospheres.
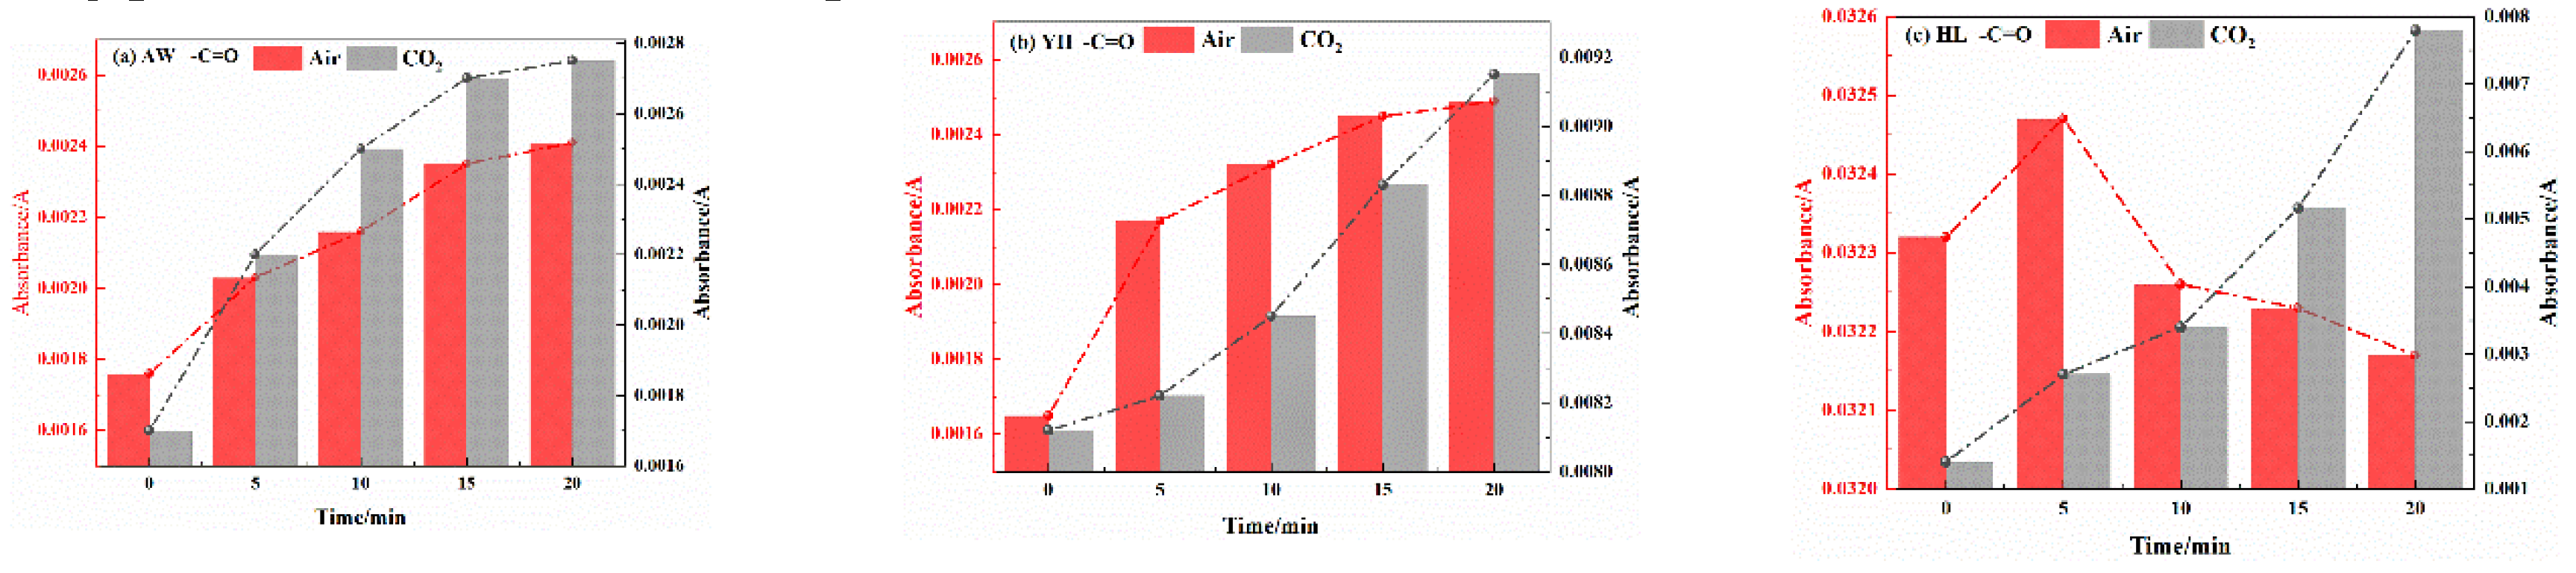
Figure 13.
Carboxyl Changes of Coal in Cooling Process in Air and CO2 Atmospheres.
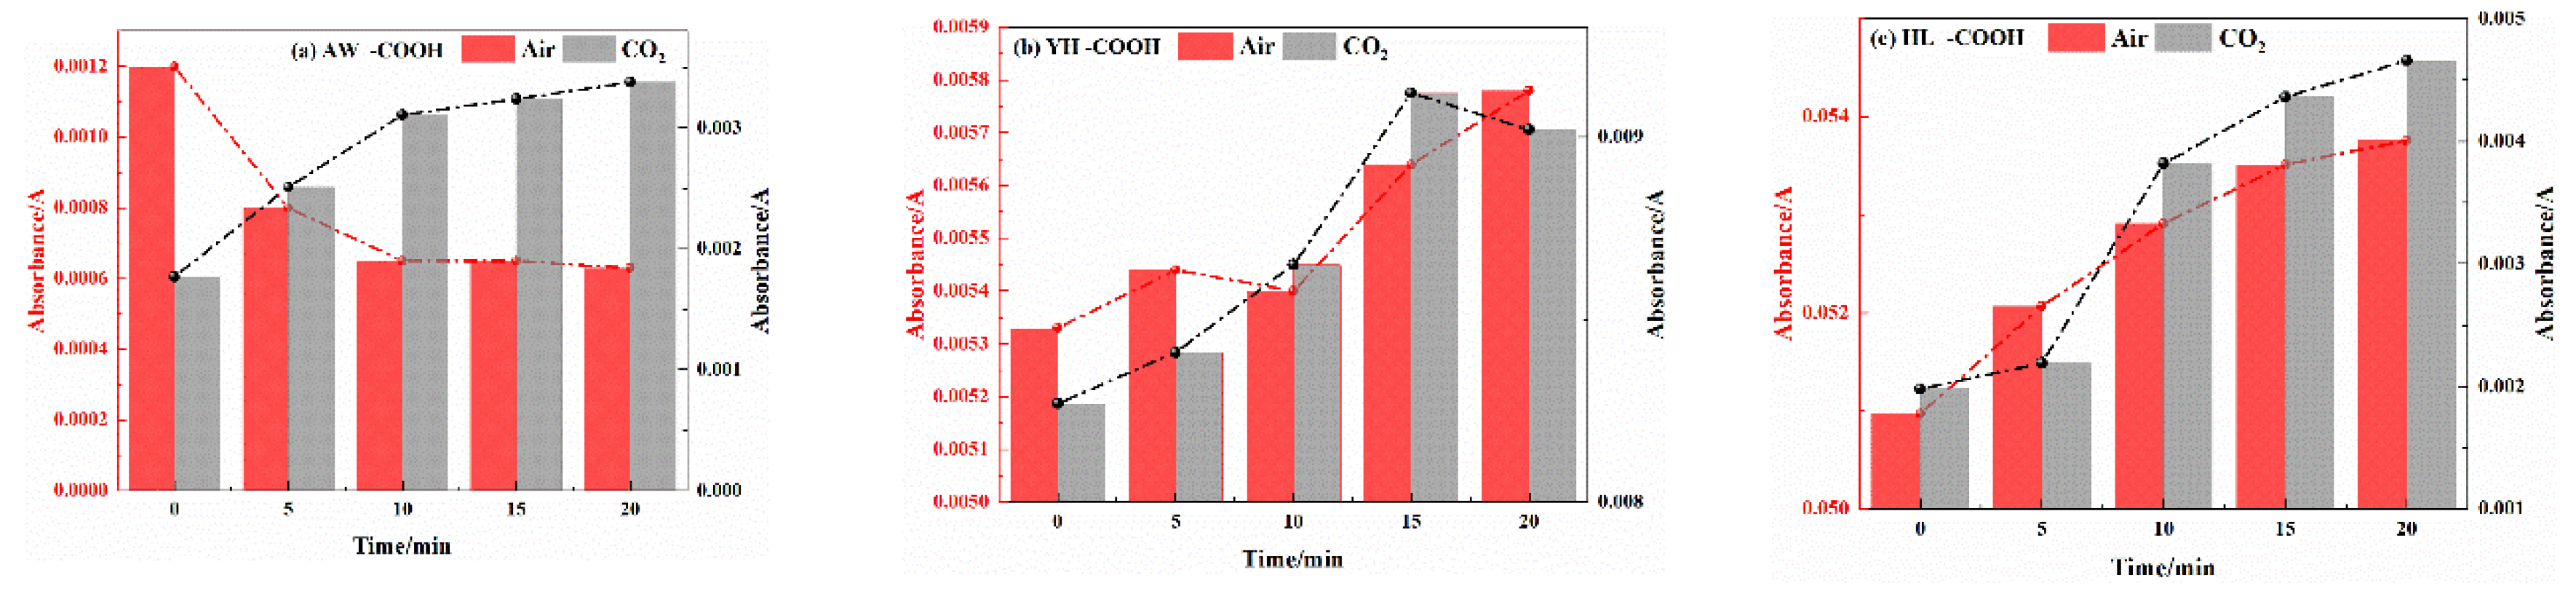
Figure 14.
Carboxyl Changes of Coal in Cooling Process in Air and CO2 Atmospheres.
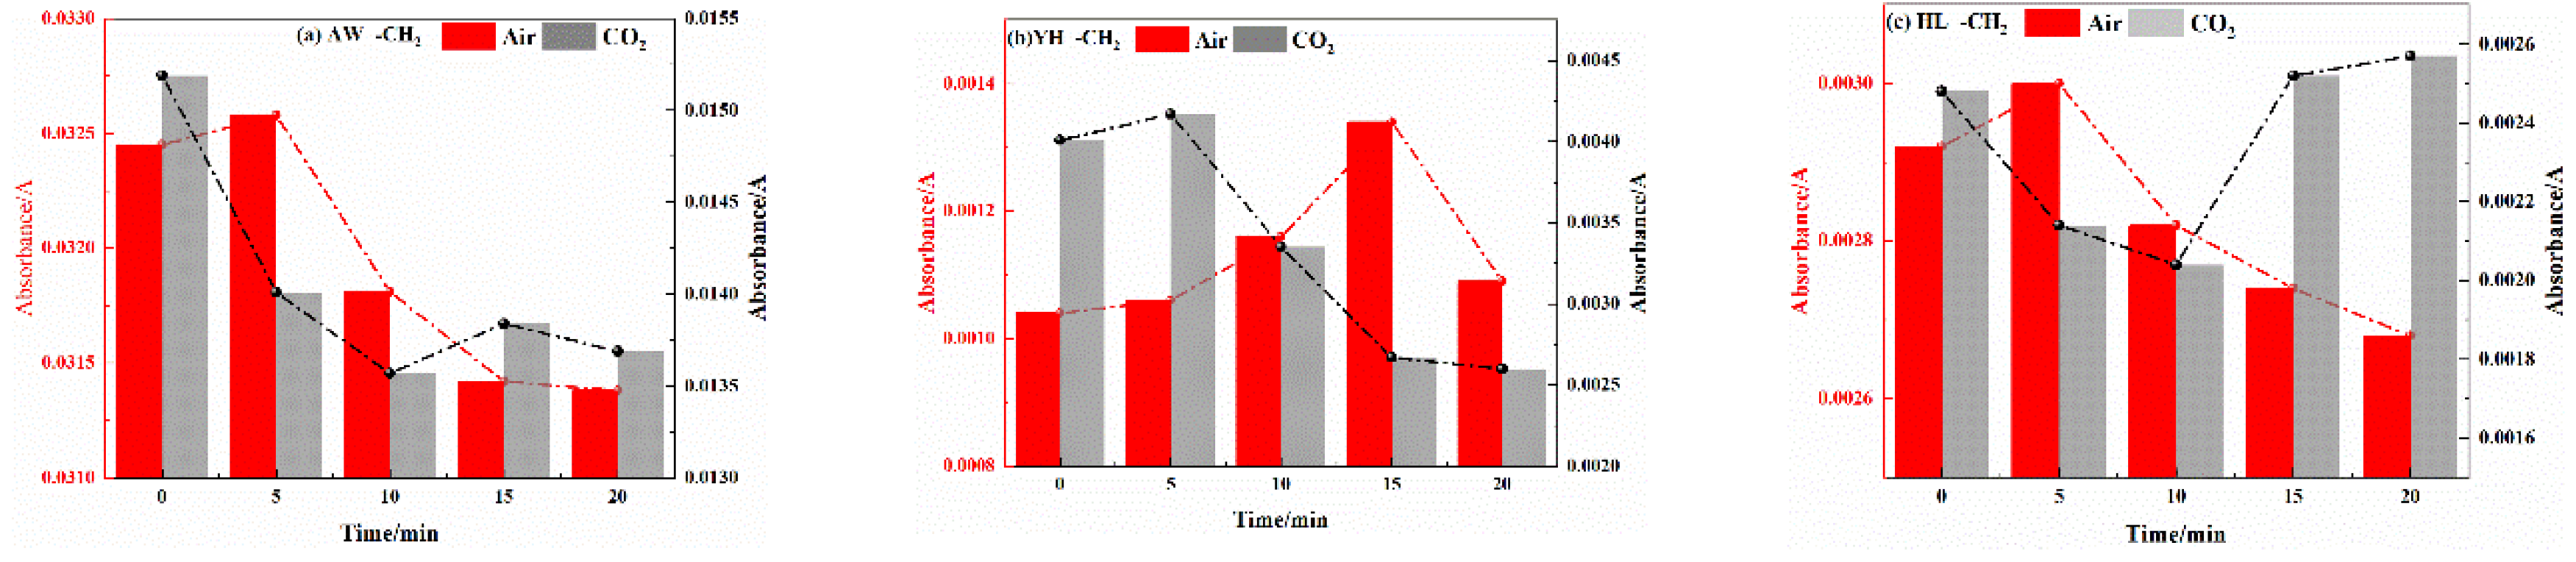
Figure 15.
Methyl Changes of Coal in Cooling Process in Air and CO2 Atmospheres.
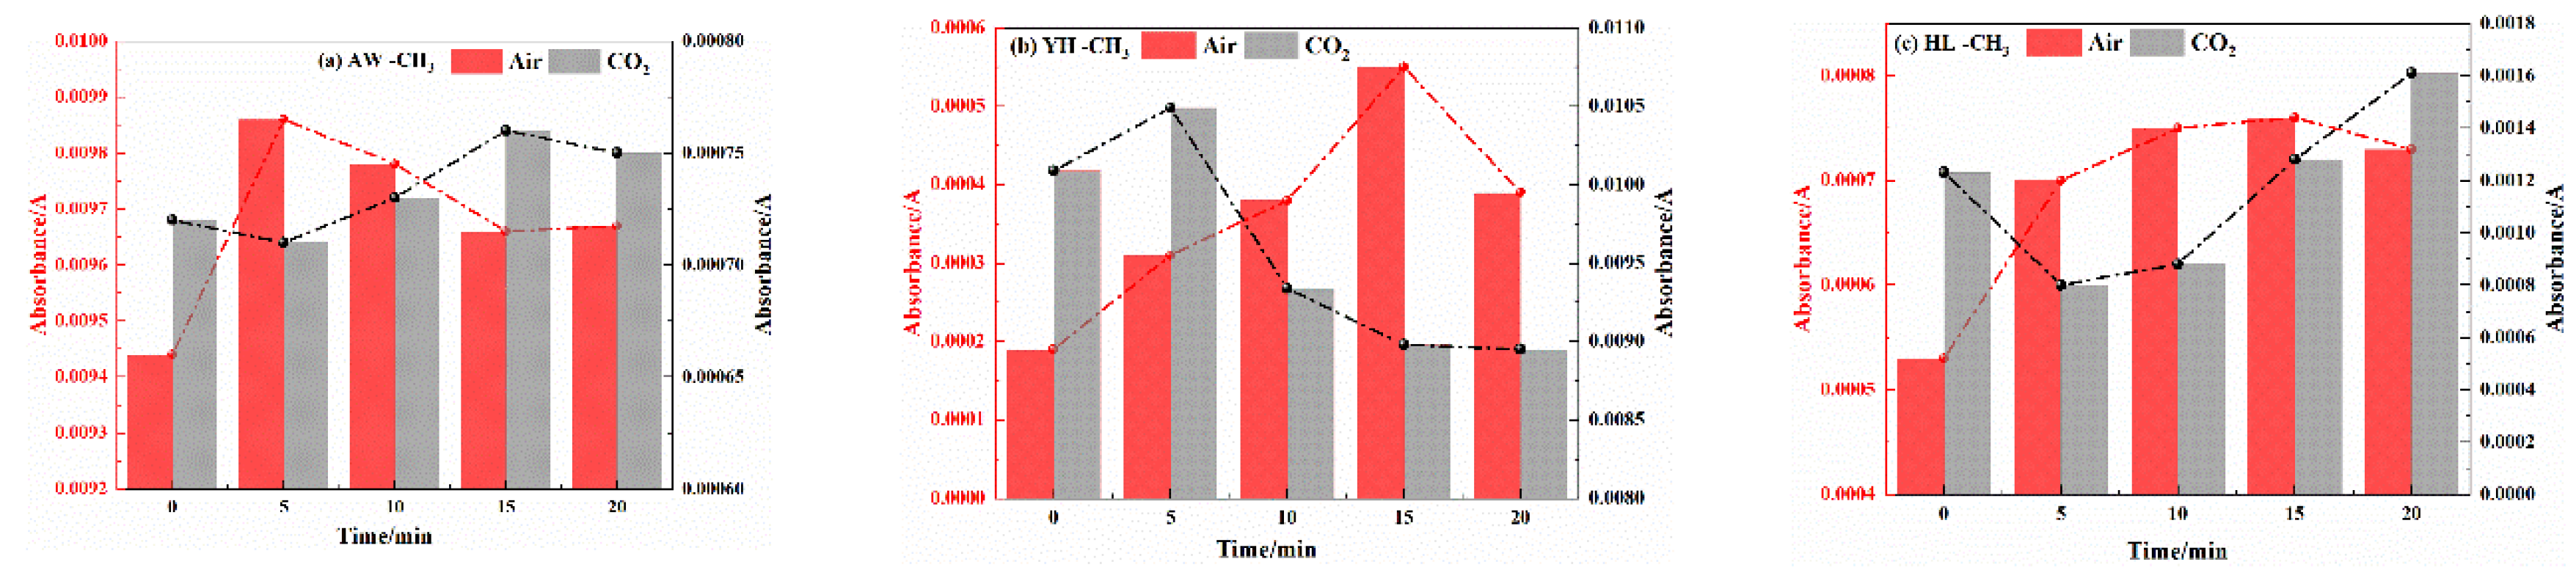
Figure 16.
Changes of reaction energy in the absence and presence of CO2.
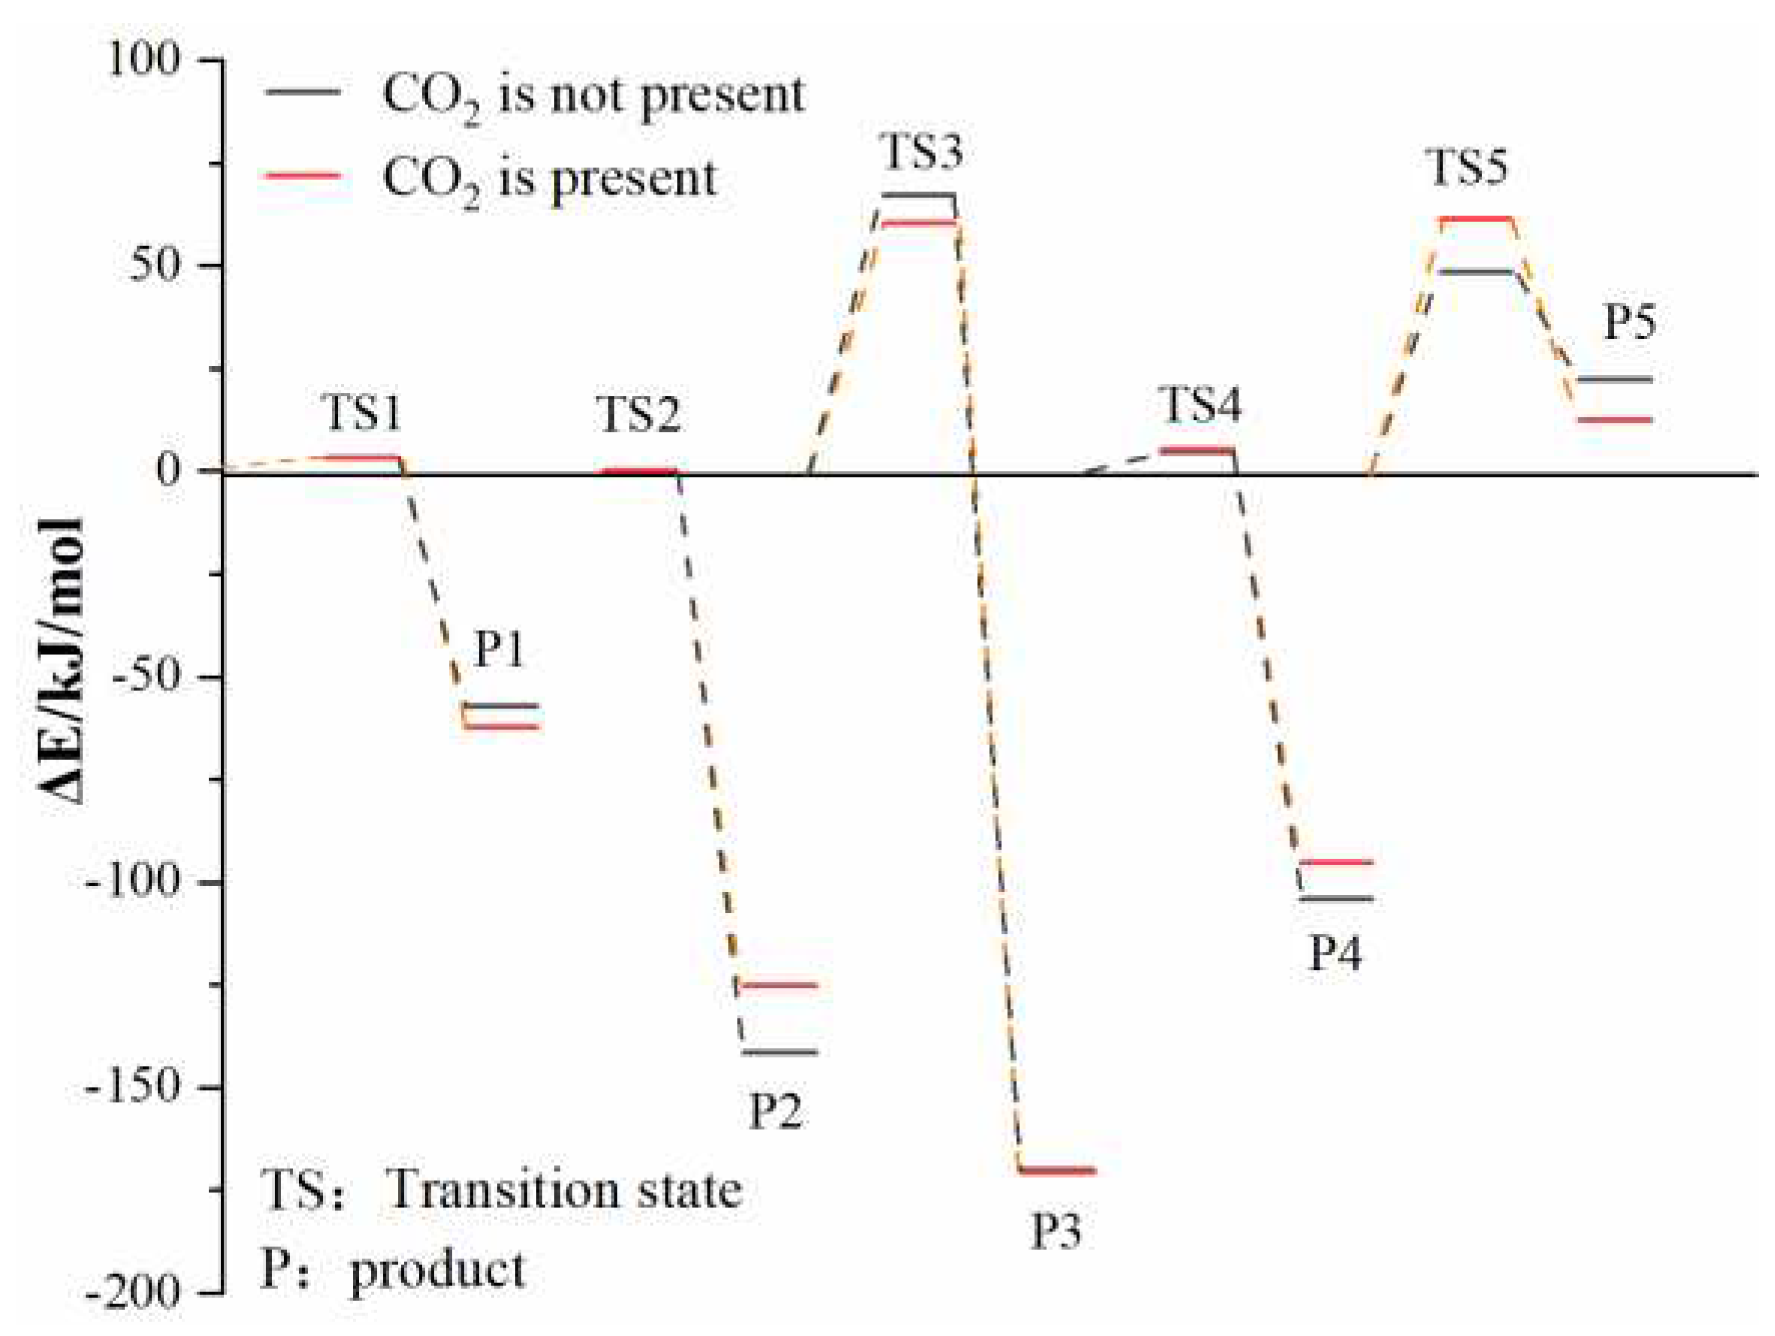
Figure 17.
A model of CO2 physico-chemical inhibition of O2 adsorption.
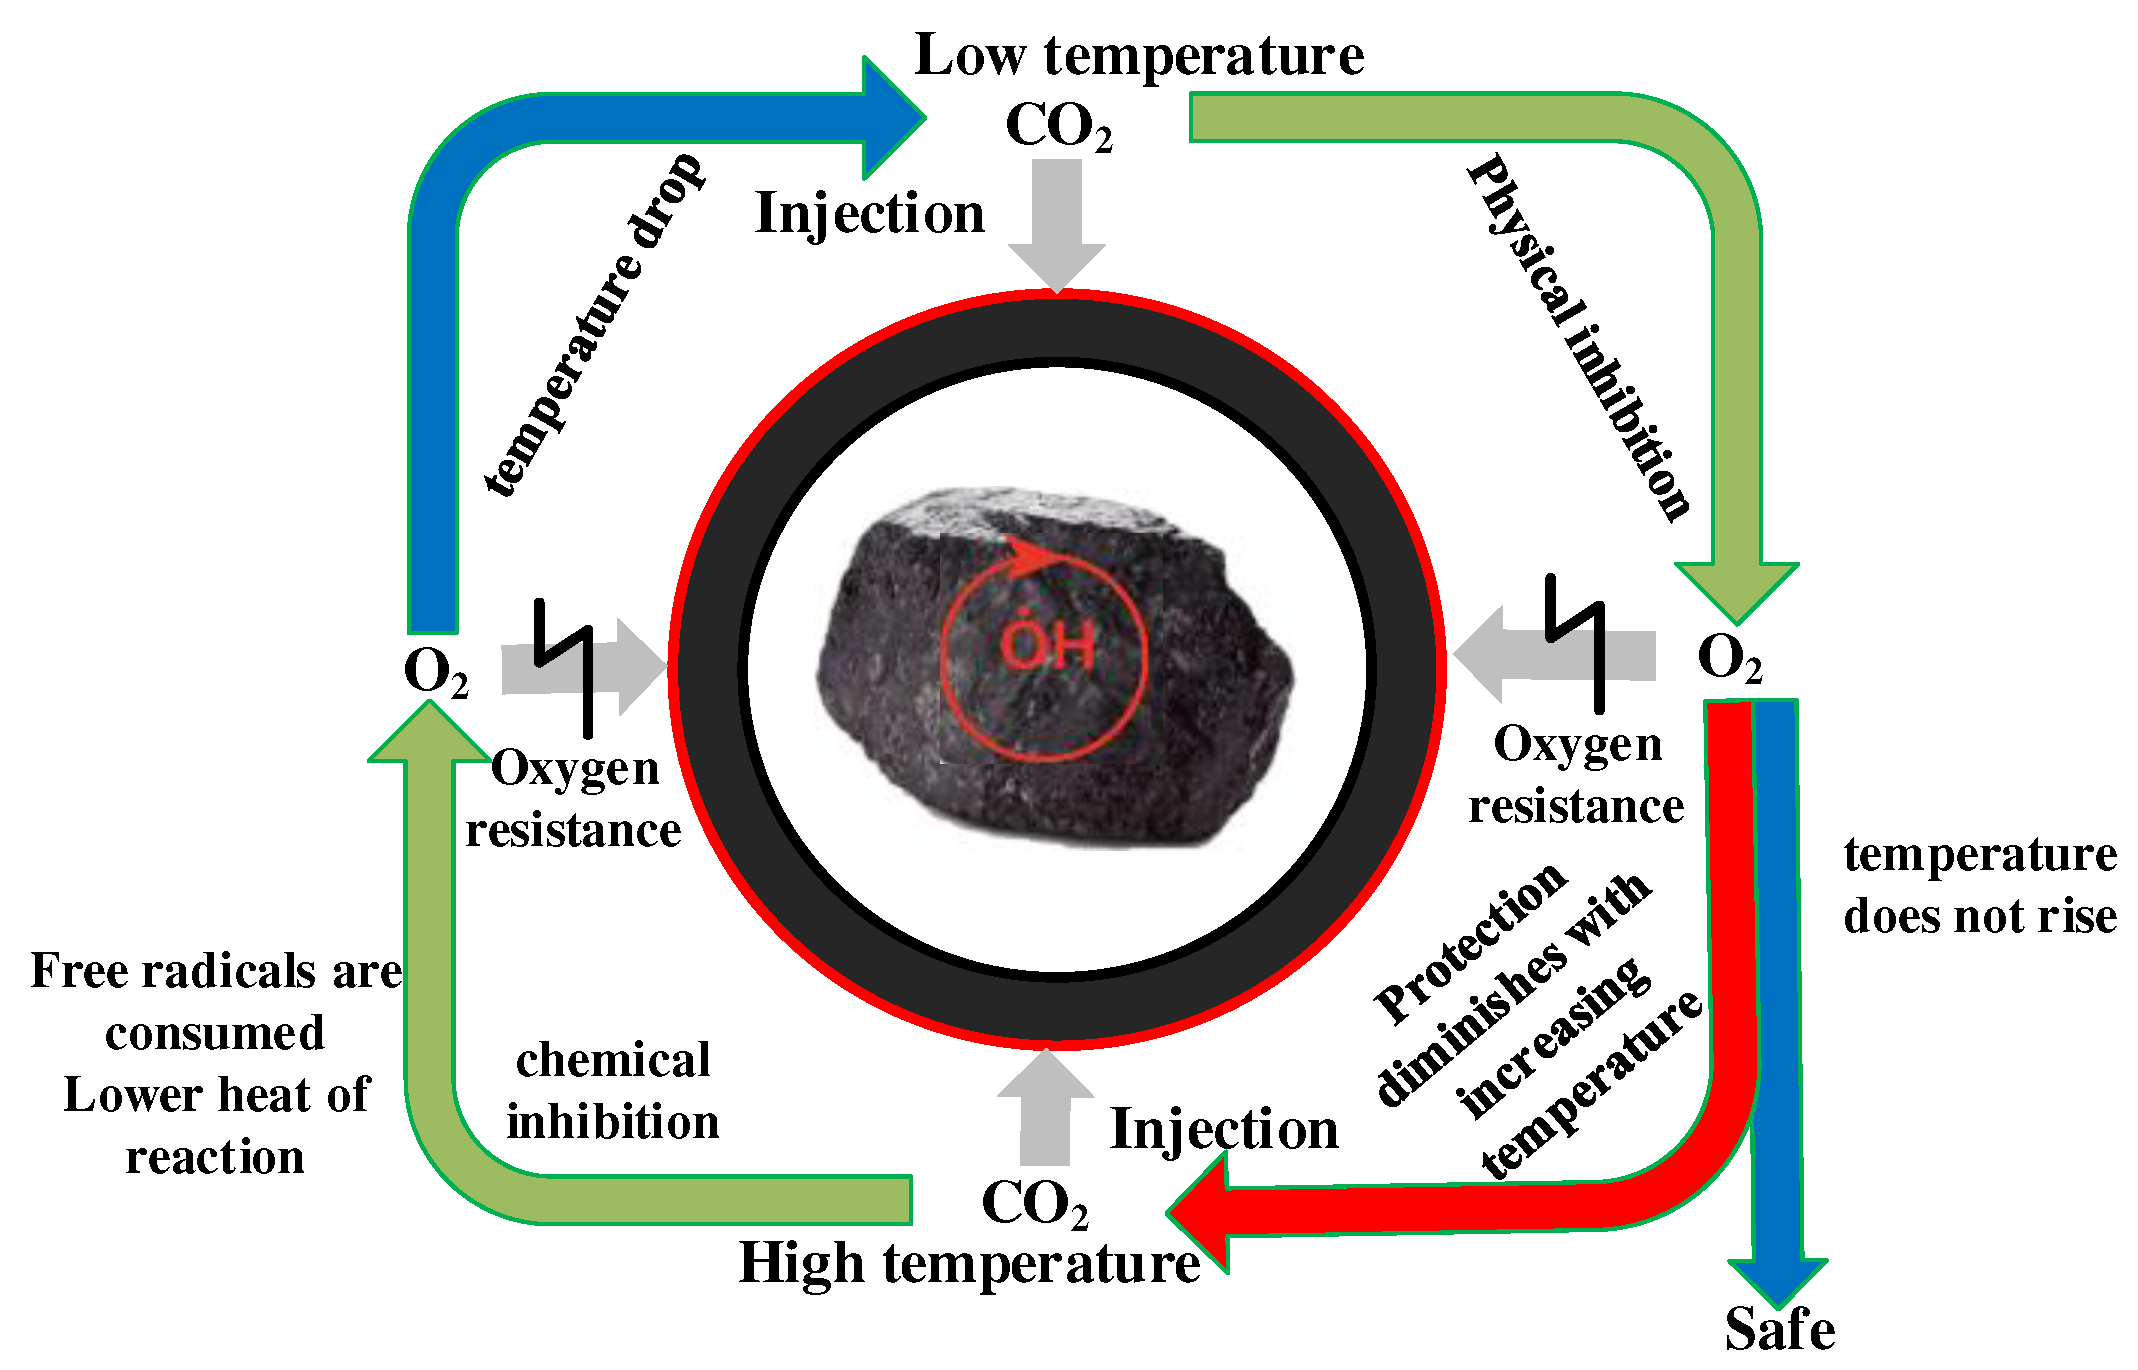

Table 1.
Each low-rank coal sample’s analysis results.
| Coal sample | Mad | Ad | Vdaf | FCad | Cdaf | Hdaf | Ndaf | Odaf | St,ad/% | Ro, ran/% |
| HL | 14.35 | 6.92 | 42.46 | 36.27 | 73.29 | 5.16 | 1.06 | 19.22 | 1.27 | 0.35 |
| YH | 4.67 | 6.18 | 38.09 | 51.06 | 81.92 | 5.24 | 0.93 | 9.32 | 2.68 | 0.58 |
| AW | 0.82 | 8.73 | 35.82 | 54.63 | 86.25 | 5.91 | 1.13 | 6.37 | 0.34 | 0.78 |
| Notes:Mad- moisture;Ad- Ash,Vdaf - Volatile,FCad- Fixed carbon;Cdaf- Carbon content,Hdaf- Hydrogen content,Ndaf- Nitrogen content,Odaf- Oxygen content,St,ad- Sulfur content; Ro, ran- Vitrinite Reflectance | ||||||||||
Table 2.
Comparison of activation energy and critical temperature at each stage for the three coal samples with and without CO2 injecting.
Table 2.
Comparison of activation energy and critical temperature at each stage for the three coal samples with and without CO2 injecting.
| coal sample | oxidation stage | Inject Air | Inject CO2 | ||
| activation energy Ea /kJ/mol | critical temperature of spontaneous combustionT /℃ | activation energyEa /kJ/mol | critical temperature of spontaneous combustionT /℃ | ||
| AW | I | 38.08 | 115 | 41.32 | 123 |
| II | 8.81 | 10.39 | |||
| III | 4.16 | 5.65 | |||
| IV | -30.10 | -39.58 | |||
| YH | I | 20.87 | 107 | 26.36 | 112 |
| II | 7.90 | 8.32 | |||
| III | 3.41 | 2.00 | |||
| IV | -28.77 | -40.57 | |||
| HL | I | 33.67 | 110 | 47.72 | 119 |
| II | 6.90 | 7.40 | |||
| III | 1.08 | 2.25 | |||
| IV | -34.67 | -43.90 | |||
Disclaimer/Publisher’s Note: The statements, opinions and data contained in all publications are solely those of the individual author(s) and contributor(s) and not of MDPI and/or the editor(s). MDPI and/or the editor(s) disclaim responsibility for any injury to people or property resulting from any ideas, methods, instructions or products referred to in the content. |
© 2023 by the authors. Licensee MDPI, Basel, Switzerland. This article is an open access article distributed under the terms and conditions of the Creative Commons Attribution (CC BY) license (https://creativecommons.org/licenses/by/4.0/).
Copyright: This open access article is published under a Creative Commons CC BY 4.0 license, which permit the free download, distribution, and reuse, provided that the author and preprint are cited in any reuse.


