
Submitted:
11 July 2023
Posted:
12 July 2023
You are already at the latest version
Abstract
Purpose: We aimed to evaluate the impact of preconditioning adipose-derived mesenchymal stem cells (ADMSCs) with the autophagy inducer rapamycin (Rapa) on Cisplatin (Cis) induced ovarian toxicity in a rat model.
Methods: ADMSCs were pretreated with 50 nmol/L rapa for two h in vitro. Another in vivo study included 96 female Sprague-Dawley rats divided into four equal groups: control, Cis, Cis +ADMSCs, and Cis +ADMSCs + Rapa. Rats were sacrificed after 2 and 6 weeks. Each group was subdivided into two equal subgroups: 6 rats were sacrificed to study ovarian parameters, and six were left for mating to evaluate the fertility index.
Results: Autophagy activation was detected in ADMSCs + Rapa by increasing autophagosomes, high autophagy-specific LC3-II gene and protein expression, and low expression of p62 and mTOR genes. Moreover, transplantation of ADMSCs + Rapa restored balance between E2, FSH, and LH, increased antioxidant activity, and improved follicular count and quality after 2 and 6 weeks of treatment. Fertility index analysis manifested restoring reproductive capacity in the ADMSCs+ Rapa group at both intervals.
Conclusions: Autophagy induction could enhance the therapeutic capability of ADMSCs by deactivating the mTOR pathway, which in turn promotes the ovarian folliculogenesis process after exposure to Cis.
Keywords:
Autophagy
; Cisplatin
; MSCs
; Ovaries
; Rapamycin
; Rats
1. Introduction
Cisplatin (Cis- diamminedichloroplatinum- II) (Cis) is a platinum alkylating agent used widely for treating patients with various solid and gynecological tumors. But the clinical use of Cis is limited due to the resulting side effects, such as kidney, liver, brain, nervous and reproductive toxicity [1]. Cis has contributed to ovarian follicles damage and premature ovarian failure leading to premature menopause that ends with female infertility [2]. Therefore, females of reproductive age undergoing chemotherapy must follow safe reproductive guidelines.
Although the precise mechanisms of Cis toxicity are not well known, the reactive oxygen species (ROS) is thought to induce oxidative stress on the body, such as the hydrogen peroxide (H2O2), superoxide anion (O2-), and hydroxyl radical (OH-) which are expected to induce toxicity by interactions with DNA, lipids, and proteins [3]. Besides, inflammation is considered one of the potential Cis pathways that by activated by the pro-inflammatory cytokines [4]. Moreover, Cis toxicity can also be triggered by cell apoptosis by generating DNA cross-links that eventually cause DNA breaks and adduct formation [5].
Oocytes and surrounding follicles are most affected in the early stages of cisplatin with follicular abnormalities, stromal tissue damage, and low estradiol (E2) levels [6]. Cisplatin reduces ovarian reserve through apoptosis of developing follicles and stimulation of resting follicles with further apoptosis, causing a burn-out effect [7]. The antral, total viable, and atretic follicle discrepancies indicate ovarian injury. Depletion of follicles diminishes estradiol secretion, which raises serum FSH levels, attracting additional follicles, which are similarly destroyed [8].
Several studies have pointed to the ability of mesenchymal stem cells (MSCs) to treat the injured tissues or even replace the damaged tissue by their anti-inflammatory, anti-fibrotic, and anti-apoptotic properties enhancing angiogenesis and decreasing oxidative stress, thus improving the microenvironment to promote the recovery of the damaged tissue [9].
Moreover, Wang et al., 2022 demonstrated that MSCs could restore ovarian function after Cis induction by decreasing granulosa cell apoptosis, which raises E2 level production, promotes follicular growth and maturation, and reduces FSH and LH hormonal levels [10].
However, the MSCs die within the first few hours after transplantation due to different environmental stresses after transplantation and the harsh microenvironment in the injury result [11, 12]. Therefore, it is highly recommended to precondition the cells with chemicals that could maintain their survival in the damaged tissue site.
Lately, autophagy induction has been reported as a novel method to enhance the survival rate of cells and protect them from apoptosis [13]. Autophagy is negatively controlled through the mammalian target of rapamycin (mTOR). Rapamycin (Rapa) can induce autophagy through inhibition of mTOR and enhancement of light chain 3 (LC3 –I) proteins for maturations of phagophores required for the formation of autophagy-lysosome, under which cells undergo degradation and recycling their intracellular constituents, including organelles and proteins. Based on the process, reactive oxygen species (ROS) accumulation subsequently reduces DNA damage, and cells restore the proliferation capacity in response to cell cycle arrest [14].
Autophagy is essential for cellular mechanisms in eukaryotic cells. It regulates cellular growth, metabolism, and homeostasis [15]. Moreover, autophagy promotes cell proliferation and differentiation [16]. Therefore, it is considered a new approach potentially for improving the therapeutic efficiency of MSCs.
Currently, modulation of autophagy as a unique process for improvement of therapeutic features of MSCs has been evaluated in several diseases such as osteoporosis [17], diabetes [18], and myocardial infarction [19] in animal models. To our knowledge, this is the first study evaluating the impact of MSC preconditioned with autophagy inducer (Rapa) on the ovarian folliculogenesis impairments induced by Cis.
2. Materials and Methods
2.1. In vitro Study
2.1.1. Isolation and Expansion of Adipose-Derived Mesenchymal Stem Cells (ADMSCs)
Paragonadal fats of Sprague-Dawley rat testis were isolated, minced, and digested with 0.075% type I Collagenase (Invitrogen, US) at 37°C for 1 hour. Then they were centrifuged for 5 min at 600 g. Cellular pellets were cultured in DMEM media containing 10% fetal bovine serum (FBS) and streptomycin (100 µg/ml) (Gibco, Thermo, USA) in an incubator with 5% carbon dioxide at 37°C. When these cells reached 70%–80% confluence, they were trypsinized and sub-cultured, and cells were used at passages three in the following experiments.
2.1.2. Characterization of ADMSCs by Flow Cytometry
50 µl/106 ADMSCs incubated with antibodies conjugated with different fluorescent probes (Becton, Dikinson) CD 105 PE and CD 45 FITC at room temperature for 30 min in the dark. After that, wash with stain buffer 2ml and centrifugate for 10min 2000 rm. Discard the supernatant, then dissolve the pellet with 500um of stain buffer. The labeled cells were identified by BD Accuri C6 flow cytometry and result analysis by Flow JO BD software.
2.1.3. Assessment of Cells Viability by MTT Assay
Cellular viability was determined using MTT [3-(4, 5-Dimethylthiazol-2-Yl)-2, 5-Diphenyl-2 HtetrazoliumBromide] assay. In a 96-well plate, the cells were seeded and pretreated with Rapa with different concentrations (0, 25, 50, 75, 100 nM) for two h. Subsequently, 10μL MTT (5 mg/mL; Kumamoto, Japan) was added to the wells and incubated for four h. The supernatant was discarded, and 100 μl DMSO was added to dissolve the formazan crystal. Absorbance was measured at 570 nm using an Infinite F50 microplate Reader (Tecan, Mannedort, Switzerland).
2.1.4. Ethidium Bromide /Acridine Orange Staining for Rapa-ADMSCs
Acridine orange (AO) (Sigma-Aldrich) was used to detect the acidic vesicular organelles (AVO) in cell autophagy, as mentioned before [20, 21]. Briefly, the cell suspension was prepared by minsing with 10 ml PBS with 2 ml MgCl2, and then the suspension was added to 1M of HCL solution at pH 1.2 and incubated on ice for 45 sec. Finally, cells were stained with 1 mg/ml AO and then analyzed using the labeled cells identified by BD Accuri C6 flow cytometry and result analysis by Flow JO BD software.
2.1.5. Gene Expression for Rapa-ADMSCs
The impact of Rapa treatment on gene expression of the autophagic markers P62, LC3-II, mTOR, and the anti-apoptotic marker BCL2 were analyzed using a Rotor gene PCR system (Qiagen, Germany). RNA was extracted from ADMSCs and Rapa-ADMSCs groups using the RNeasy Mini Kit (Qiagen, 74104, Germany) according to the manufacturer's protocol. cDNA was obtained by cDNA Reverse Transcription Kit (Applied Biosystem, USA) according to the manufacturer's protocol. Quantitative RT-PCR analysis was performed using SYBER Green PCR Master Mix (Applied Biosystems, USA) and primers. Primer and the reference gene GAPDH used were listed in Table 1. The cycling parameters were carried out as mentioned before [22]. Data analysis was done by the 2-ΔΔCt method.
2.1.6. Immunostaining of LC3 for Autophagic Structures for Rapa-ADMSCs
LC3 is a specific autophagic structure marker mainly expressed on autophagosomes. After two h of Rapa treatment, the cells were fixed and permeabilized, then incubated overnight with rabbit anti-LC3 antibody (Cat no: YPA1652) with dilution 1:100. The slides were rinsed with PBS and then stained with DAB to determine the response color. The tissue sections were counterstained with hematoxylin, dehydrated, mounted on a cover slip, and analyzed using an Olympus light microscope for five randomly chosen fields on each slide [23]. As previously mentioned, immunohistochemically stained ovarian cells were scanned under light microscopy. Slides were photographed using an Olympus® digital camera attached to an Olympus® microscope with a 1/2 X photo adapter and a 40 X objective and then analyzed using a computer with an Intel® Core I5® processor and video Test Morphology® software (Russia) with a specific built-in procedure for measuring area, percentage area, and object counting [21].
2.1.7. Transmission Electron Microscope Examination for Rapa-ADMSCs
The Rapamycin-ADMSCs were fixed overnight in 3% glutaraldehyde and then for 2 hours in 1% osmic acid. Dehydrated cells were inserted in epoxy resin. The ultramicrotome was then employed to obtain ultrathin sections. Cells were stained with the use of lead citrate and uranyl acetate. Using a transmission electron microscope (JEOL JEM-2100 at 160 KV, Electron Microscope Unit, Mansoura University, Egypt), phagosomes were subsequently identified in Rapa-ADMSCs. The structures of autophagy were detected in 200 cells from each group.
2.2. Experimental Animals
Ninety-six mature female Sprague-Dawley rats weighing 180 ± 20 g and aged 8-10 weeks were kept at a density of 4 rats for each polycarbonate cage. They were placed in a controlled environment with a 12-hour light/dark cycle, 24oC air conditioning, and 50-70 % relative humidity. Food and water were available ad libitum throughout the experiment. All care and procedures adapted for the present study were according to the NIH guide, and animals used the approval of the Institutional Animal Ethics Committee of the Faculty of Science, Mansoura University MU-ACUC (SC.MS.23.03.20).
2.3. Animal Groups
The rats were divided into four equal groups (24 in each):1) control group: animals were injected intraperitoneally (i.p.) with 0.9% saline, 2) Cis group: animals were i.p. injected with 2.5 mg/kg of Cis for five days, followed by a seven-day recovery and a second series of five i.p. injection as previous to induce a sub-chronic exposure to Cis that mimics chemotherapy treatment regimens[24].3) ADMSCs group: as Cis group with a single 0.1 mL intravenous (i.v.) administration of 2*106ADMSCs after one week of the last injection of Cis [25], and 4)ADMSCs+ Rapa: as Cis group with 0.1 mL i.v. administration of 2*106ADMSCs cells pretreated with 50nM of Rapa 2h before injection after one week of the last injection of Cis. Rats were sacrificed at two different times after two weeks and six weeks. Each group was subdivided into two equal subgroups (12 each). In each subgroup, six rats were sacrificed to study ovarian parameters [25], and six were left to mate with sexually mature normal males to evaluate fertility capacity.
2.4. Fertility Index
Every two females in pro-estrus were mated with one male rat overnight in a separate cage. The female rats were checked the next morning for the presence of a vaginal plug, considered day 1 of gestation. At the end of the gestation period, the number of corpora lutea, implants, and resorptions were detected [26].
2.5. Collection of Blood and Tissue Samples
At the end of the experiment, the female rats were weighed, blood samples were collected from the heart under inhalational general anesthesia, and serum was isolated and stored at -20 °C for measurement of fertility hormones. Then, animals were sacrificed by cervical dislocation, a midline laparotomy was done, and both ovaries were removed. One ovary was placed in 10% buffered formalin for histopathological examination, and the other was stored at -80°C for molecular and biochemical studies.
2.6. Detection of Fertility Hormones
Follicle-stimulating hormone (FSH), luteinizing hormone (LH), and estradiol hormone (E2) were measured in serum using an RT ELISA kit (Cusabio, USA) by using an Infinite F50 microplate Reader (Tecan, Mannedort, Switzerland).
2.7. Evaluation of Ovarian Oxidative Stress Status
Ovarian tissues were evaluated for their catalase (CAT) activity and malondialdehyde (MDA) level. The samples were weighed, sliced, homogenized, then centrifuged for 15 minutes at 10000x g. Following the manufacturer's instructions, those markers were measured in the supernatant using the commercial colorimetric kit (Bio-Diagnostics, Giza, Egypt).
2.8. Gene Expression Assays for Ovarian Tissues:
The impact of Rapa-MSCs on apoptotic, autophagic, stemness, and ovarian gene expression was assessed by measuring the gene expression of apoptotic markers [BCL-2], autophagic marker [P62 and LC3], stemness marker [OCT4], inflammatory markers [ IL-6, TGF-b1], and ovarian marker [GDF-9] in ovarian tissues using real-time PCR. Briefly, RNA was isolated from tissue samples of all groups, followed by cDNA synthesis, and the RT-PCR reaction was performed as pronounced before [17].
2.9. Histopathological and Immuno-Histochemical Investigation:
The ovarian tissues were fixed in buffered formalin and embedded in paraffin. Paraffin sections with five μmthickness were stained with hematoxylin and eosin (H&E). Finally, dehydrated, counted, covered, slipped, and examined under the light microscope (Olympus, Japan). The number of primordial, primary, secondary, and graffian follicles were counted under the microscope, five fields per slide [27, 28].
Ovarian deparaffinized sections were subjected to immunohistochemistry staining of the anti-apoptotic marker BCL-2 (cat no: 60-0005-7). As previously mentioned, immunohistochemically stained ovarian cells were scanned under light microscopy [21]. Slides were photographed using an Olympus® digital camera attached to an Olympus® microscope with a 1/2 X photo adapter and a 40 X objective and then analyzed using a computer with an Intel® Core I5® processor and video Test Morphology® software (Russia) with a specific built-in procedure for measuring area, percentage area, and object counting [23].
2.10. Statistical Analysis
Normally distributed variables have existed as mean ± SD. The significance between two comparisons was detected by student t-test, while significance between multiple comparisons was carried out using one-way ANOVA and post hoc test. The SPSS program (IBM Corp., USA) performed a correlation between parameters. Statistical significance was considered for p-value <0.05.
3. Results
3.1. Characteristics of ADMSCs
After 10-12 days, the ADMSCs reached 70 – 80 % confluence with long- spindle-shaped fibroblast-like cells, as shown in Figure 1A.The phenotypic characterization showed that the isolated ADMSCs were negative for the hematopoietic markers CD45 (92%) and positive for the mesenchymal markers CD105 (91.2%) (Figure 1B, Figure 1C).
3.2. Impact of Rapamycin Treatment on the Viability and Activation of Autophagy on ADMSCs
MTT assay results showed that pretreatment of ADMSCs with 50nmol/l Rapa for 2hrs showed the highest cellular viability (Figure 2A). Moreover, Flow cytometric analysis showed a significant increase in the autophagic activity of Rapa-ADMSCscompared to untreated cells, that activation was indicated by the increased rate of AVO-positive cells in G1and S phase (Figure 2B). Furthermore, gene expression analysis for the autophagic marker P62 and mTORmanifested a significant decrease in ADMSCs treated with Rapa compared to the control group (p < 0.05). In contrast, LC3 showed a considerable increase in ADMSCs treated with Rapa compared to the control group(p < 0.05). Additionally, the anti-apoptotic marker BCL2 showed a significant increase in ADMSCs treated with Rapa compared to the control group (p < 0.05) (Figure 2C). On the other hand, the immunohistochemical staining showed a more significant number of LC3-positive expression in ADMSCs treated with Rapa than the control group (Figure 3A, B). Electron micrographs showed an increase in the autophagic ultra-structures in the cells after induction of Rapa (Figure 3 C, D).
3.3. Changes in Body and Ovarian Weight after Treatment
Compared to the control group, the Cis group exhibited a significant decrease in body and ovarian weight (p< 0.05). Moreover, ADMSCs and ADMSCs + Rapa showed a considerable increase in body weight compared to the Cis group at 2 and 6 weeks (p< 0.05), and the body weight was more increased in ADMSCs + Rapa compared to ADMSCs at six weeks (p<0.05). Also, the reduction in ovarian weight was improved by treatment with ADMSCs + Rapa (p< 0.05) (Table 2).
3.4. Impact of ADMSC Treated with Rapamycin on Ovarian Function
Hormonal levels of FSH, LH, and E2 were evaluated in the studied groups (Figure 4). Cis group revealed a significant increase in FSH and LH levels compared to the control group (p <0.05). This increase was attenuated with the administration of ADMSCs and ADMSCs treated with Rapa at 2 and 6 weeks (p <0.05). In contrast, E2 levels showed a significant drop in the Cis group compared to the control group (p <0.05). Estradiol levels exhibit a considerable increase in the ADMSCs pretreated with Rapa and ADMSCs treated groups compared to the Cis group at 2 and 6 weeks (p< 0.05).
3.5. Assessment of Oxidative Stress Markers on Ovarian Tissue
The MDA levels in the ovarian tissue were expressively higher in the Cis group than in the control group (p< 0.05). In contrast, ADMSCs and ADMSCs pretreated with Rapa groups reduced MDA concentration at six weeks. In contrast, the activity of the catalase enzyme was significantly decreased in the Cis group compared to the control group. The administration of ADMSCs elevated the MDA level and showed more improvement with ADMSCs pretreated with Rapa groups(p<0.05) (Table 3).
3.6. Gene Expression
The anti-apoptotic gene BCL2 revealed a significant reduction in its expression in Cis group compared to the control group (p < 0 .05), whereas its expression was increased with the treatment of ADMSCs, and was more increased in ADMSCs pretreated with Rapa group at 6 weeks (p < 0 .05) (Figure 5A). Furthermore, Cis administration amplified the expression of autophagic marker p62 in ovaries in comparison with the control group (p < 0.05), while injection of ADMSCs and ADMSCs treated with Rapa considerably declined P62 levels in the ovaries at 2 and 6 weeks (p < 0 .05) (Figure 5B). Ovarian marker (GDF-9) decreased significantly in Cis group (p < 0 .05), while, ADMSCs and ADMSCs treated with Rapa groups showed a significant increase in the GDF-9 expression compared with Cis group at 2 and 6 weeks (p < 0 .05) (Figure 5CD).
Additionally, the pro-inflammatory markers IL-6 and TGF-b1 were significantly upregulated in the Cis group at 2 and 6 weeks groups compared to the control group (p < 0 .05). At the same time, and their levels were downregulated to a preferable level in ADMSCs and ADMSCs + Rapa at 2 and 6 weeks groups compared to Cis group (p < 0 .05) (Figure 5E, F).
3.7. Impact of ADMSCs Treated with Rapamycin on Ovarian Structure
The microscopic examination of ovarian tissue revealed fewer primary and secondary follicles, with approximately no graafian follicles in the Cis group compared to the control group. The interstitial tissues showed hyperemia besides many atretic follicles and mononucleated cells penetrations. In the ADMSCs group, primary and secondary follicles were increased, contrasted to the Cis group. Mild hyperemia with low infiltration of mononuclear cells and minor degenerated follicles in the interstitial tissue were also illustrated. In the ADMSCs+ Rapa group, the most improvement of the ovarian structures and stroma was observed. Furthermore, primordial, primary, secondary, and graafian follicles were achieved near the control at 2 and 6 weeks (Table 4; Figure 6).
3.8. Effects of ADMSCs Pretreated with Rapa on the Expression of Bcl-2 in the Ovarian Tissues
The immune-scoring of BCl-2 in the ovarian sections was shown in Figure 7A. Control group showed high expression of BCL-2 in 2 and 6 weeks (Figure 7B). While the expression of Bcl-2 was significantly lower in the Cis group compared to the control group (Figure 7C). ADMSC sand ADMSCs treated with Rapa showed a significant increase in BCL2 protein expression compared to Cis group at 2 and 6 weeks (Figure 7D, E)
3.9. Fertility Evaluation
The transplantation of ADMSCs pretreated with Rapa improved ovarian function and increased the reproductive outcome parameters. It showed a significant increase in the number of live embryos and a reduction in the percentage of absorbed fetuses compared toCis group at 2 and 6 weeks (p < 0 .05) (Table 5 and Table 6).
4. Discussion
Despite the significant increase in cancer survivor patients, many troubles with chemotherapeutic side effects remain a critical concern. Ovarian toxicity is one of the main complications of chemotherapy that negatively affects the reproduction capacity in premenopausal women. Moreover, alterations in folliculogenesis after exposure to Cis strongly correlate to the risk of female infertility [29]. To the best of our knowledge, the present study was conducted to assess the potential role of autophagy in enhancing ADMSC survival and evaluate their capacity in folliculogenesis recovery after receiving Cis.
Our study showed that ADMSCs pretreated with Rapa promote the cells' survival and differentiation capacity. Rapacould enhance the cellular viability at a dose of 50nM for 2 hours in accordance with Zhi-hua et al. [30]. Moreover, Rapa-induced autophagy in the cells was confirmed by increasing in the gene and protein expression of the autophagic marker LC3 II, the down-regulating of P62 and mTOR genes expression, the augmenting of acidic vesicular organelles (AVO) found on the surface of autophagosomes in G0/1 phase of interphase, and increasing the autophagic ultra-structures. These findings agree with Karim et al. [29] and Li et al. [30], who demonstrated that LC3-II is expressed specifically on the membrane of theautophagic structures and increased with Rapa treatment.
Wang et al. [31] reported that mice treated withCis (2 mg/kg) for seven consecutive days showed a significant decrease in their body and ovarian weight at 21 days, suggesting that Cis induced ovarian failure, which did not recover naturally until 21 days after treatment [31]. Our results are similar to these findings, which showed that Cis caused a significant reduction in the body and ovarian weights, and their weights weren't restored until six weeks after Cis injection. Treatment with ADMSCs showed enhancement in the body and ovaries' weight. This argument was compatible with the findings of Chen et al. [32]. Moreover, preconditioning of the cells with Rapa showed more improvement in body weight and ovarian weight, suggesting its therapeutic role in the ovaries.
Follicular growth is principally controlled by gonadotropins FSH hormone produced through the anterior pituitary gonadotrophic cells. FSH induces the granulosa cells to produce aromatase, which transforms the androgens from thecal cells to estrogen, promoting follicle proliferation and protecting them against apoptosis by autocrine mechanisms [33]. FSH peaks at the same time as LH, causing ovulation. Several studies reported that Cis would damage folliculogenesis, causing ovaries to produce little to no estrogen. This damage disturbs the negative feedback system to the hypothalamus and pituitary gland, producing high levels of FSH [25, 34]. This mechanism confirms our results that showed a significant decrease in E2 levels and an increase in FSH and LH levels in the Cis group.
On the other hand, treatment with ADMSCs showed a significant rise in E2 levels and reduction in FSH and LH hormonal levels and became more significant with ADMSC pretreated with Rapa. Our findings have demonstrated that Rapa pretreated ADMSCs can effectively minimize ovarian lesions and boost ovarian function by improving coordination between fertility hormones. These results were in the same line with previous studies that described the role of MSCs in improving ovarian function in rats with chemotherapy induction [19, 35].
In pathological cases, long-term exposure to Cis contributes to mitochondrial malfunction leading to a reduction in ATP synthesis that puts the cells under stress. These results in unbalance between the reactive oxygen species (ROS) production and antioxidant defense mechanisms. Abnormal lipid peroxidation formed due to the stressed cells ends with ROS production as MDA [35-37].CAT enzyme can decompose H2O2 and degrade O2, reducing oxidative stress [38]. Our results showed a remarkable elevation in the MDA levels in the Cis group and a drop in CAT activity. In contrast, injection of ADMSCs pretreated with Rapa could restore the balance between the antioxidant and oxidant system by increasing CAT activity and decreasing MDA level, suggesting its role in enhancing the antioxidant activity.
The apoptosis process is one of the main consequences of disrupting the balance between oxidant and antioxidant systems [39]. Cis is known to induce ROS, which is associated with apoptosis in cancer cells and normal cells [40]. That was observed in the Cis group through the significant drop in the gene and protein expression of the anti-apoptotic marker BCL-2. In contrast, the ADMSCs+ Rapa group showed modulation in the BCL-2 gene and protein expression. These results indicated that Cis-induced ovarian damage might be related to decreased Bcl-2 expression in ovaries, and ADMSCs preconditioned with Rapa could promote Bcl-2 in the ovaries.
Previous studies have recommended that apoptosis and autophagy might be triggered by common pathways [41]. Regarding Cis-induced ovarian toxicity, alleviating endoplasmic reticulum stress protects against granulosa cell apoptosis and ovarian damage [42]. In this study, we demonstrated that ADMSCs pretreated with Rapa could modulate autophagy in the damaged ovary as a protective mechanism for cell survival by decreasing the p62 level that was increased with Cis induction. Our findings were compatible with the studies indicating that extra oxidative stress causes permanent damage that reduces autophagy and enhances apoptosis [41]. Rapa, as an autophagy inducer, could improve the ability of ADMSCs to reduce the p62 gene expression in ovarian tissues [14].
Octamer binding transcription factor (Oct4) is mainly expressed in embryonic stem cells and primordial germ cells in mice and humans [43]. Its potential role is the oocyte enrollment for their development [44]. The Cis group showed a significant down-regulation in Oct4 expression. That confirms the toxic effect of Cis on ovaries that inhabit the folliculogenesis and oogenesis [41]. On the other hand, overexpression of Oct4 was observed in the Rapa-ADMSCs group. These results agree with the data reported by Liu et al. [18]. Cisplatin-induced ovarian toxicity includes multiple complicated multifactorial mechanisms, and inflammation is viewed as a critical component. In response to ovarian damage, leukocyte infiltration induces inflammation, by which neutrophils, monocytes, and lymphocytes contribute to the development of ovarian injury. Several cytokines, such as transforming growth factor b1 (TGF-b1) and interleukin-6 (IL-6), are elevated in the ovary during the inflammatory cascade caused by cisplatin; these cytokines can be used as diagnostic markers to determine the severity of the lesion[45]. Down-regulation of the inflammatory response is an effective strategy to prevent cisplatin-induced ovarian damage. This study indicated that treatment with ADMSCs decreased cisplatin-induced production of pro-inflammatory cytokines, TGF-b1 and IL-6 compared to cisplatin-treated rats. In addition, rapa-pretreated MSCs displayed significant anti-inflammatory action that was crucial for protecting cisplatin-induced ovarian impairment.
Our findings are harmonious with Sun et al., 2019 [45], who conducted their study to determine the underlying mechanisms of cisplatin-induced renal toxicity. They found that rats treated with Cis exhibited upregulated levels of TGF-b and IL-6.
Similarly, Takahashi et al., 2019 [46] reported that MSCs could migrate to injured tissues by increasing peripheral immunological tolerance and inhibiting the production of pro-inflammatory cytokines such as TGF-b and IL-6, promoting the survival of damaged cells. Moreover, Takahashi et al. 2019observed that MSCs transplantation in a premature ovarian failure model was related to the reduction in TGF-b and IL-6 cytokines and restored ovarian function, suggesting that MSCs had a regenerative effect through their anti-inflammatory properties.
Growth differentiation Factor-9 (GDF-9) is a significant member of the TGF-β family that encodes proteins secreted by the oocytes into the ovarian follicles[47].GDF-9 is essential for female reproduction. It promotes ovarian follicle growth, ovulation, and fertilization and optimizes the oocyte microenvironment [48]. Therefore, GDF-9 mRNA expression may represent new biomarkers for predicting the potentiality of oocyte development [49]. Our result showed a significant decrease in GDF-9 gene expression in the Cis group, which was compatible with Liu et al. [18] findings that revealed a considerable reduction in GDF-9 level in the premature ovarian failure group. Interestingly, the ADMSCs+ Rapa group showed a significant increase in GDF-9 expression. Our result contrasts with the findings of Bahrehbar et al. [39], who found no significant difference in GDF-9 expression in both MSC transplantation groups compared to premature ovarian failure groups.
Experimental studies showed high doses of Cislead to aggressive loss of ovarian reserve due to the over-activation of undeveloped primordial follicles [50]. Also, it's thought that the gonadal toxicity is due to direct oocyte damage, depletion of the primordial and primary follicles, and atresia of the growing follicular population [6]. When ovaries were examined histopathologically, there was a decreased number of primary, secondary, and graffian follicles in the Cis group. These findings are in the same line with Liu et al. [18]. Administration of ADMSCs pretreated with Rapa could restore the normal architecture of the ovary with a significant improvement in the follicles, indicating its therapeutic role in promoting folliculogenesis.
Interestingly, the results of the fertility index showed that Cis increased the embryonic loss compared to the control, while transplantation of Rapa pretreated ADMSCs showed the greatest pregnancy rate.
5. Conclusion
In the present study, the results manifested that autophagy induction could enhance the survival of ADMSCs, which in turn promoted the folliculogenesis process after exposure to Cis. Therefore, targeting the autophagic pathway may provide a promising strategy for improving the transplanted MSCs.
Author Contributions
Conceptualization, Amira Sarhan and Amoura M. Abou el-Naga; methodology, Amira Sarhan, Amira Awadalla and Saleh A. K. Saleh; Formal analysis, Ahmed A shokeir, Heba M. Adly, Mohamed El-Sherbiny and Amoura M. Abou el-Naga; data curation, Ikhlas A. Sindi, Mamdouh Eldesoqui, Amira Sarhan and Amira Awadalla; validation, Ahmed A shokeir, Amoura M. Abou el-Naga; writing—original draft preparation, Amira Sarhan.; writing-review and editing, Mohamed El-Sherbiny and Ahmed A shokeir; Resources, Saleh A. K. Saleh, Heba M. Adly, Ikhlas A. Sindi, Mamdouh Eldesoqui and Mohamed El-Sherbiny. All authors have read and agreed to the published version of the manuscript.
Funding
This research received no specific grant from funding agencies in the public, commercial, or not-for-profit sectors.
Acknowledgment
The authors are grateful to participants from Umm Al-Qura University for their assistance.
Declarations Ethics approval
All care and procedures adapted for the present study was according to the NIH guide, and animal used the approval of the Institutional Animal Ethics Committee of Faculty of Science, Mansoura University.
Consent for publication
Not applicable.
Availability of data and materials
All data generated or analyzed during this study are included in this published article.
Competing Interests
The authors declare that they have no competing interests.
Declarations of interest
none.
References
- Xing, F., M. Wang, Z. Ding, J. Zhang, S. Ding, L. Shi, et al., Protective effect and mechanism of melatonin on cisplatin-induced ovarian damage in mice. J Clin Med, 2022. 11(24): p. 50-58. [CrossRef]
- Zhang, S., Q. Liu, M. Chang, Y. Pan, B.H. Yahaya, Y. Liu, et al., Chemotherapy impairs ovarian function through excessive ROS-induced ferroptosis. Cell Death Dis, 2023. 14(5): p. 340-346. [CrossRef]
- Khan, R., A.Q. Khan, W. Qamar, A. Lateef, M. Tahir, M.U. Rehman, et al., Chrysin protects against cisplatin-induced colon. toxicity via amelioration of oxidative stress and apoptosis: probable role of p38MAPK and p53. Toxicol Appl Pharmacol, 2012. 258(3): p. 315-29. [CrossRef]
- Faubel, S., E.C. Lewis, L. Reznikov, D. Ljubanovic, T.S. Hoke, H. Somerset, et al., Cisplatin-induced acute renal failure is associated with an increase in the cytokines interleukin (IL)-1beta, IL-18, IL-6, and neutrophil infiltration in the kidney. J Pharmacol Exp Ther, 2007. 322(1): p. 8-15.
- Camano, S., A. Lazaro, E. Moreno-Gordaliza, A.M. Torres, C. de Lucas, B. Humanes, et al., Cilastatin attenuates cisplatin-induced proximal tubular cell damage. J Pharmacol Exp Ther, 2010. 334(2): p. 419-29. [CrossRef]
- Morgan, S., F. Lopes, C. Gourley, R.A. Anderson, and N. Spears, Cisplatin and doxorubicin induce distinct mechanisms of ovarian follicle loss; imatinib provides selective protection only against cisplatin. PLoS One, 2013. 8(7): p. 17-24. [CrossRef]
- Mahajan, N., Fertility preservation in female cancer patients: an overview. J Hum Reprod Sci, 2015. 8(1): p. 3-8. [CrossRef]
- Diedrich, K., B. Fauser, and P. Devroey, Cancer and fertility: strategies to preserve fertility. Reprod Biomed Online, 2011. 22(3): p. 232-248. [CrossRef]
- Sun, L., D. Li, K. Song, J. Wei, S. Yao, Z. Li, et al., Exosomes derived from human umbilical cord mesenchymal stem cells protect against cisplatin-induced ovarian granulosa cell stress and apoptosis in vitro. Sci Rep, 2017. 7(1): p. 52-60. [CrossRef]
- Wang, R., W. Wang, L. Wang, L. Yuan, F. Cheng, X. Guan, et al., FTO protects human granulosa cells from chemotherapy-induced cytotoxicity. Reprod Biol Endocrinol, 2022. 20(1): p. 39-45. [CrossRef]
- Trounson, A. and C. McDonald, Stem cell therapies in clinical trials: Progress and challenges. Cell Stem Cell, 2015. 17(1): p. 11-22. [CrossRef]
- Copland, I.B. and J. Galipeau, Death and inflammation following somatic cell transplantation. Semin Immunopathol, 2011. 33(6): p. 535-50. [CrossRef]
- Hou, J., Z.P. Han, Y.Y. Jing, X. Yang, S.S. Zhang, K. Sun, et al., autophagy prevents irradiation injury and maintains stemness through decreasing ROS generation in mesenchymal stem cells. Cell Death Dis, 2013. 4(10): p. 44-48. [CrossRef]
- Chen, T., L. Shen, J. Yu, H. Wan, A. Guo, J. Chen, et al., Rapamycin and other longevity-promoting compounds enhance the generation of mouse induced pluripotent stem cells. Aging Cell, 2011. 10(5): p. 908-911. [CrossRef]
- Virgin, H.W. and B. Levine, Autophagy genes in immunity. Nat Immunol, 2009. 10(5): p. 461-70. [CrossRef]
- Wullschleger, S., R. Loewith, and M.N. Hall, TOR signaling in growth and metabolism. Cell, 2006. 124(3): p. 471-84. [CrossRef]
- Zhang, S., Y. Liu, and Q. Liang, Low-dose dexamethasone affects osteoblast viability by inducing autophagy via intracellular ROS. Mol Med Rep, 2018. 17(3): p. 4307-4316. [CrossRef]
- Liu, J., H. Hao, H. Huang, C. Tong, D. Ti, L. Dong, et al., Hypoxia regulates the therapeutic potential of mesenchymal stem cells through enhanced autophagy. Int J Low Extrem Wounds, 2015. 14(1): p. 63-72. [CrossRef]
- Zhang, Q., S. Bu, J. Sun, M. Xu, X. Yao, K. He, et al., Paracrine effects of human amniotic epithelial cells protect against chemotherapy-induced ovarian damage. Stem Cell Res Ther, 2017. 8(1): p. 270-276. [CrossRef]
- Paglin, S., T. Hollister, T. Delohery, N. Hackett, M. McMahill, E. Sphicas, et al., A novel response of cancer cells to radiation involves autophagy and formation of acidic vesicles. Cancer Res, 2001. 61(2): p. 439-44.
- Milano, V., Y. Piao, T. LaFortune, and J. de Groot, Dasatinib-induced autophagy is enhanced in combination with temozolomide in glioma. Mol Cancer Ther, 2009. 8(2): p. 394-406. [CrossRef]
- Aboul-Naga, A.M., E.T. Hamam, A. Awadalla, and A.A. Shokeir, The protective role of l-carnitine on spermatogenesis after cisplatin treatment during prepubertal period in rats: A pathophysiological study. Life Sciences, 2020. 258: p. 82-90. [CrossRef]
- Hasanin, N.A., N.M. Sayed, F.M. Ghoneim, and S.A. Al-Sherief, Histological and ultrastructure study of the testes of acrylamide exposed adult male albino rat and evaluation of the possible protective effect of vitamin E intake. J Microsc Ultrastruct, 2018. 6(1): p. 23-30. [CrossRef]
- Ayres, L.S., M. Berger, I.C.L. de Oliveira Durli, C.P. Kuhl, P.B. Terraciano, T.N.A. Garcez, et al., Kallikrein-kinin system and oxidative stress in cisplatin-induced ovarian toxicity. Reproductive Toxicology, 2020. 93: p. 1-9. [CrossRef]
- Omar, F., N. Amin, H. Elsherif, and D. Mohamed, Role of adipose-derived stem cells in restoring ovarian structure of adult albino rats with chemotherapy-induced ovarian failure: a histological and immunohistochemical study. J Carcinog Mutagen, 2016. 7(254-251): p. 2. [CrossRef]
- Wan, J.X., Z.H. Zou, D.Y. You, J. Cui, and Y.B. Pan, Bone marrow-derived mesenchymal stem cells differentiation into tubular epithelial-like cells in vitro. Cell Biochem Funct, 2012. 30(2): p. 129-38. [CrossRef]
- Erdal kaygusuzoglua, C.C., ⁎, Fatih Mehmet Kandemirc, Serkan Yıldırımd,Sefa Kucuklerc, Mehmet Akif Kılınca, Yavuz Selim Saglamd, Zingerone ameliorates cisplatin-induced ovarian and uterine toxicity viasuppression of sex hormone imbalances, oxidative stress, inflammationand apoptosis in female wistar rats. Biomed Pharmacother, 2018. 102 (2018): p. 517–530.
- Nevin Sag˘so¨z1, U.c.l.K.a.A.A., Ischaemia–reperfusion injury of rat ovary and the effects of vitamin C, mannitol and verapamil. Hum Reprod Update, 2002. 17(11): p. 2972–2976.
- Di Maio, M., E. Basch, J. Bryce, and F. Perrone, Patient-reported outcomes in the evaluation of toxicity of anticancer treatments. Nat Rev Clin Oncol, 2016. 13(5): p. 319-25. [CrossRef]
- Li, Z.-h., Y.-l. Wang, H.-j. Wang, J.-h. Wu, and Y.-z. Tan, Rapamycin-preactivated autophagy enhances survival and differentiation of mesenchymal stem cells after transplantation into infarcted myocardium. Stem Cell Rev Rep, 2020. 16(2): p. 344-356. [CrossRef]
- Wang, Z., Y. Wang, T. Yang, J. Li, and X. Yang, Study of the reparative effects of menstrual-derived stem cells on premature ovarian failure in mice. Stem Cell Res Ther, 2017. 8(1): p. 11-20.
- Chen, X., Q. Wang, X. Li, Q. Wang, J. Xie, and X. Fu, Heat shock pretreatment of mesenchymal stem cells for inhibiting the apoptosis of ovarian granulosa cells enhanced the repair effect on chemotherapy-induced premature ovarian failure. Stem Cell Res Ther, 2018. 9(1): p. 240-246. [CrossRef]
- Richards, J.S., Y.A. Ren, N. Candelaria, J.E. Adams, and A. Rajkovic, Ovarian Follicular Theca Cell Recruitment, Differentiation, and Impact on Fertility: 2017 Update. Endocr Rev, 2018. 39(1): p. 1-20. [CrossRef]
- Lappi, M. and A. Borini, Fertility preservation in women after the cancer. Curr Pharm Des, 2012. 18(3): p. 293-302. [CrossRef]
- Ling, L., X. Feng, T. Wei, Y. Wang, Y. Wang, W. Zhang, et al., Effects of low-intensity pulsed ultrasound (LIPUS)-pretreated human amnion-derived mesenchymal stem cell (hAD-MSC) transplantation on primary ovarian insufficiency in rats. Stem Cell Res Ther, 2017. 8(1): p. 283-290. [CrossRef]
- Manohar, S. and N. Leung, Cisplatin nephrotoxicity: a review of the literature. J Nephrol, 2018. 31(1): p. 15-25. [CrossRef]
- Kim, S.H., I.C. Lee, H.S. Baek, I.S. Shin, C. Moon, C.S. Bae, et al., Mechanism for the protective effect of diallyl disulfide against cyclophosphamide acute urotoxicity in rats. Food Chem Toxicol, 2014. 64: p. 110-8. [CrossRef]
- Li, X., S. Yang, X. Lv, H. Sun, J. Weng, Y. Liang, et al., The mechanism of mesna in protection from cisplatin-induced ovarian damage in female rats. J Gynecol Oncol, 2013. 24(2): p. 177-85. [CrossRef]
- Bahrehbar, K., M. Rezazadeh Valojerdi, F. Esfandiari, R. Fathi, S.N. Hassani, and H. Baharvand, Human embryonic stem cell-derived mesenchymal stem cells improved premature ovarian failure. World J Stem Cells, 2020. 12(8): p. 857-878. [CrossRef]
- Kirici, M., C. Türk, C. çağlayan, and M. Kirici, Toxic effects of copper sulphate pentahydrate on antioxidant enzyme activities and lipid peroxidation of freshwater fish capoeta Umbla (Heckel, 1843) tissues. Appl Ecol Environ Res 2017. 15: p. 1685-1696.
- Ornatowski, W., Q. Lu, M. Yegambaram, A.E. Garcia, E.A. Zemskov, E. Maltepe, et al., Complex interplay between autophagy and oxidative stress in the development of pulmonary disease. Redox Biol, 2020. 36: p. 10-16. [CrossRef]
- Wu, Y., C. Ma, H. Zhao, Y. Zhou, and Z. Chen, Alleviation of endoplasmic reticulum stress protects against cisplatin-induced ovarian damage. Reprod Biol Endocrinol, 2018. 16(1): p. 85-90. [CrossRef]
- Akl, H., T. Vervloessem, S. Kiviluoto, M. Bittremieux, J.B. Parys, H. De Smedt, et al., A dual role for the anti-apoptotic Bcl-2 protein in cancer: mitochondria versus endoplasmic reticulum. Biochim Biophys Acta, 2014. 1843(10): p. 2240-52. [CrossRef]
- Cheng, L., M.T. Sung, P. Cossu-Rocca, T.D. Jones, G.T. MacLennan, J. De Jong, et al., OCT4: biological functions and clinical applications as a marker of germ cell neoplasia. J Pathol, 2007. 211(1): p. 1-9. [CrossRef]
- Sun, C.-Y., J. Nie, Z.-L. Zheng, J. Zhao, L.-M. Wu, Y. Zhu, et al., Renoprotective effect of scutellarin on cisplatin-induced renal injury in mice: Impact on inflammation, apoptosis, and autophagy. Biomed Pharmacother, 2019. 112: p. 86-91. [CrossRef]
- Takahashi, A., A. Yousif, L. Hong, and I. Chefetz, Premature ovarian insufficiency: pathogenesis and therapeutic potential of mesenchymal stem cell. J Mol Med, 2021. 99(5): p. 637-650. [CrossRef]
- Lee, Y.M., T.H. Kim, J.H. Lee, W.J. Lee, R.H. Jeon, S.J. Jang, et al., Overexpression of Oct4 in porcine ovarian stem/stromal cells enhances differentiation of oocyte-like cells in vitro and ovarian follicular formation in vivo. J Ovarian Res, 2016. 9: p. 24. [CrossRef]
- Paulini, F. and E.O. Melo, The role of oocyte-secreted factors GDF9 and BMP15 in follicular development and oogenesis. Reprod Domest Anim, 2011. 46(2): p. 354-61. [CrossRef]
- Orisaka, M., J.Y. Jiang, S. Orisaka, F. Kotsuji, and B.K. Tsang, Growth differentiation factor 9 promotes rat preantral follicle growth by upregulating follicular androgen biosynthesis. Endocrinol, 2009. 150(6): p. 2740-8. [CrossRef]
- Chang, E.M., E. Lim, S. Yoon, K. Jeong, S. Bae, D.R. Lee, et al., Cisplatin Induces Overactivation of the Dormant Primordial Follicle through PTEN/AKT/FOXO3a Pathway which Leads to Loss of Ovarian Reserve in Mice. PLoS One, 2015. 10(12): p. 144-154.
Figure 1.
A) ADMSC safter 5 days from isolation, B) ADMSCs at passage 3 pretreated with rapamycin, C) Cells acquired positive high expression of CD105 (91.2%), and D) negative expression of CD45 (92%).
Figure 1.
A) ADMSC safter 5 days from isolation, B) ADMSCs at passage 3 pretreated with rapamycin, C) Cells acquired positive high expression of CD105 (91.2%), and D) negative expression of CD45 (92%).
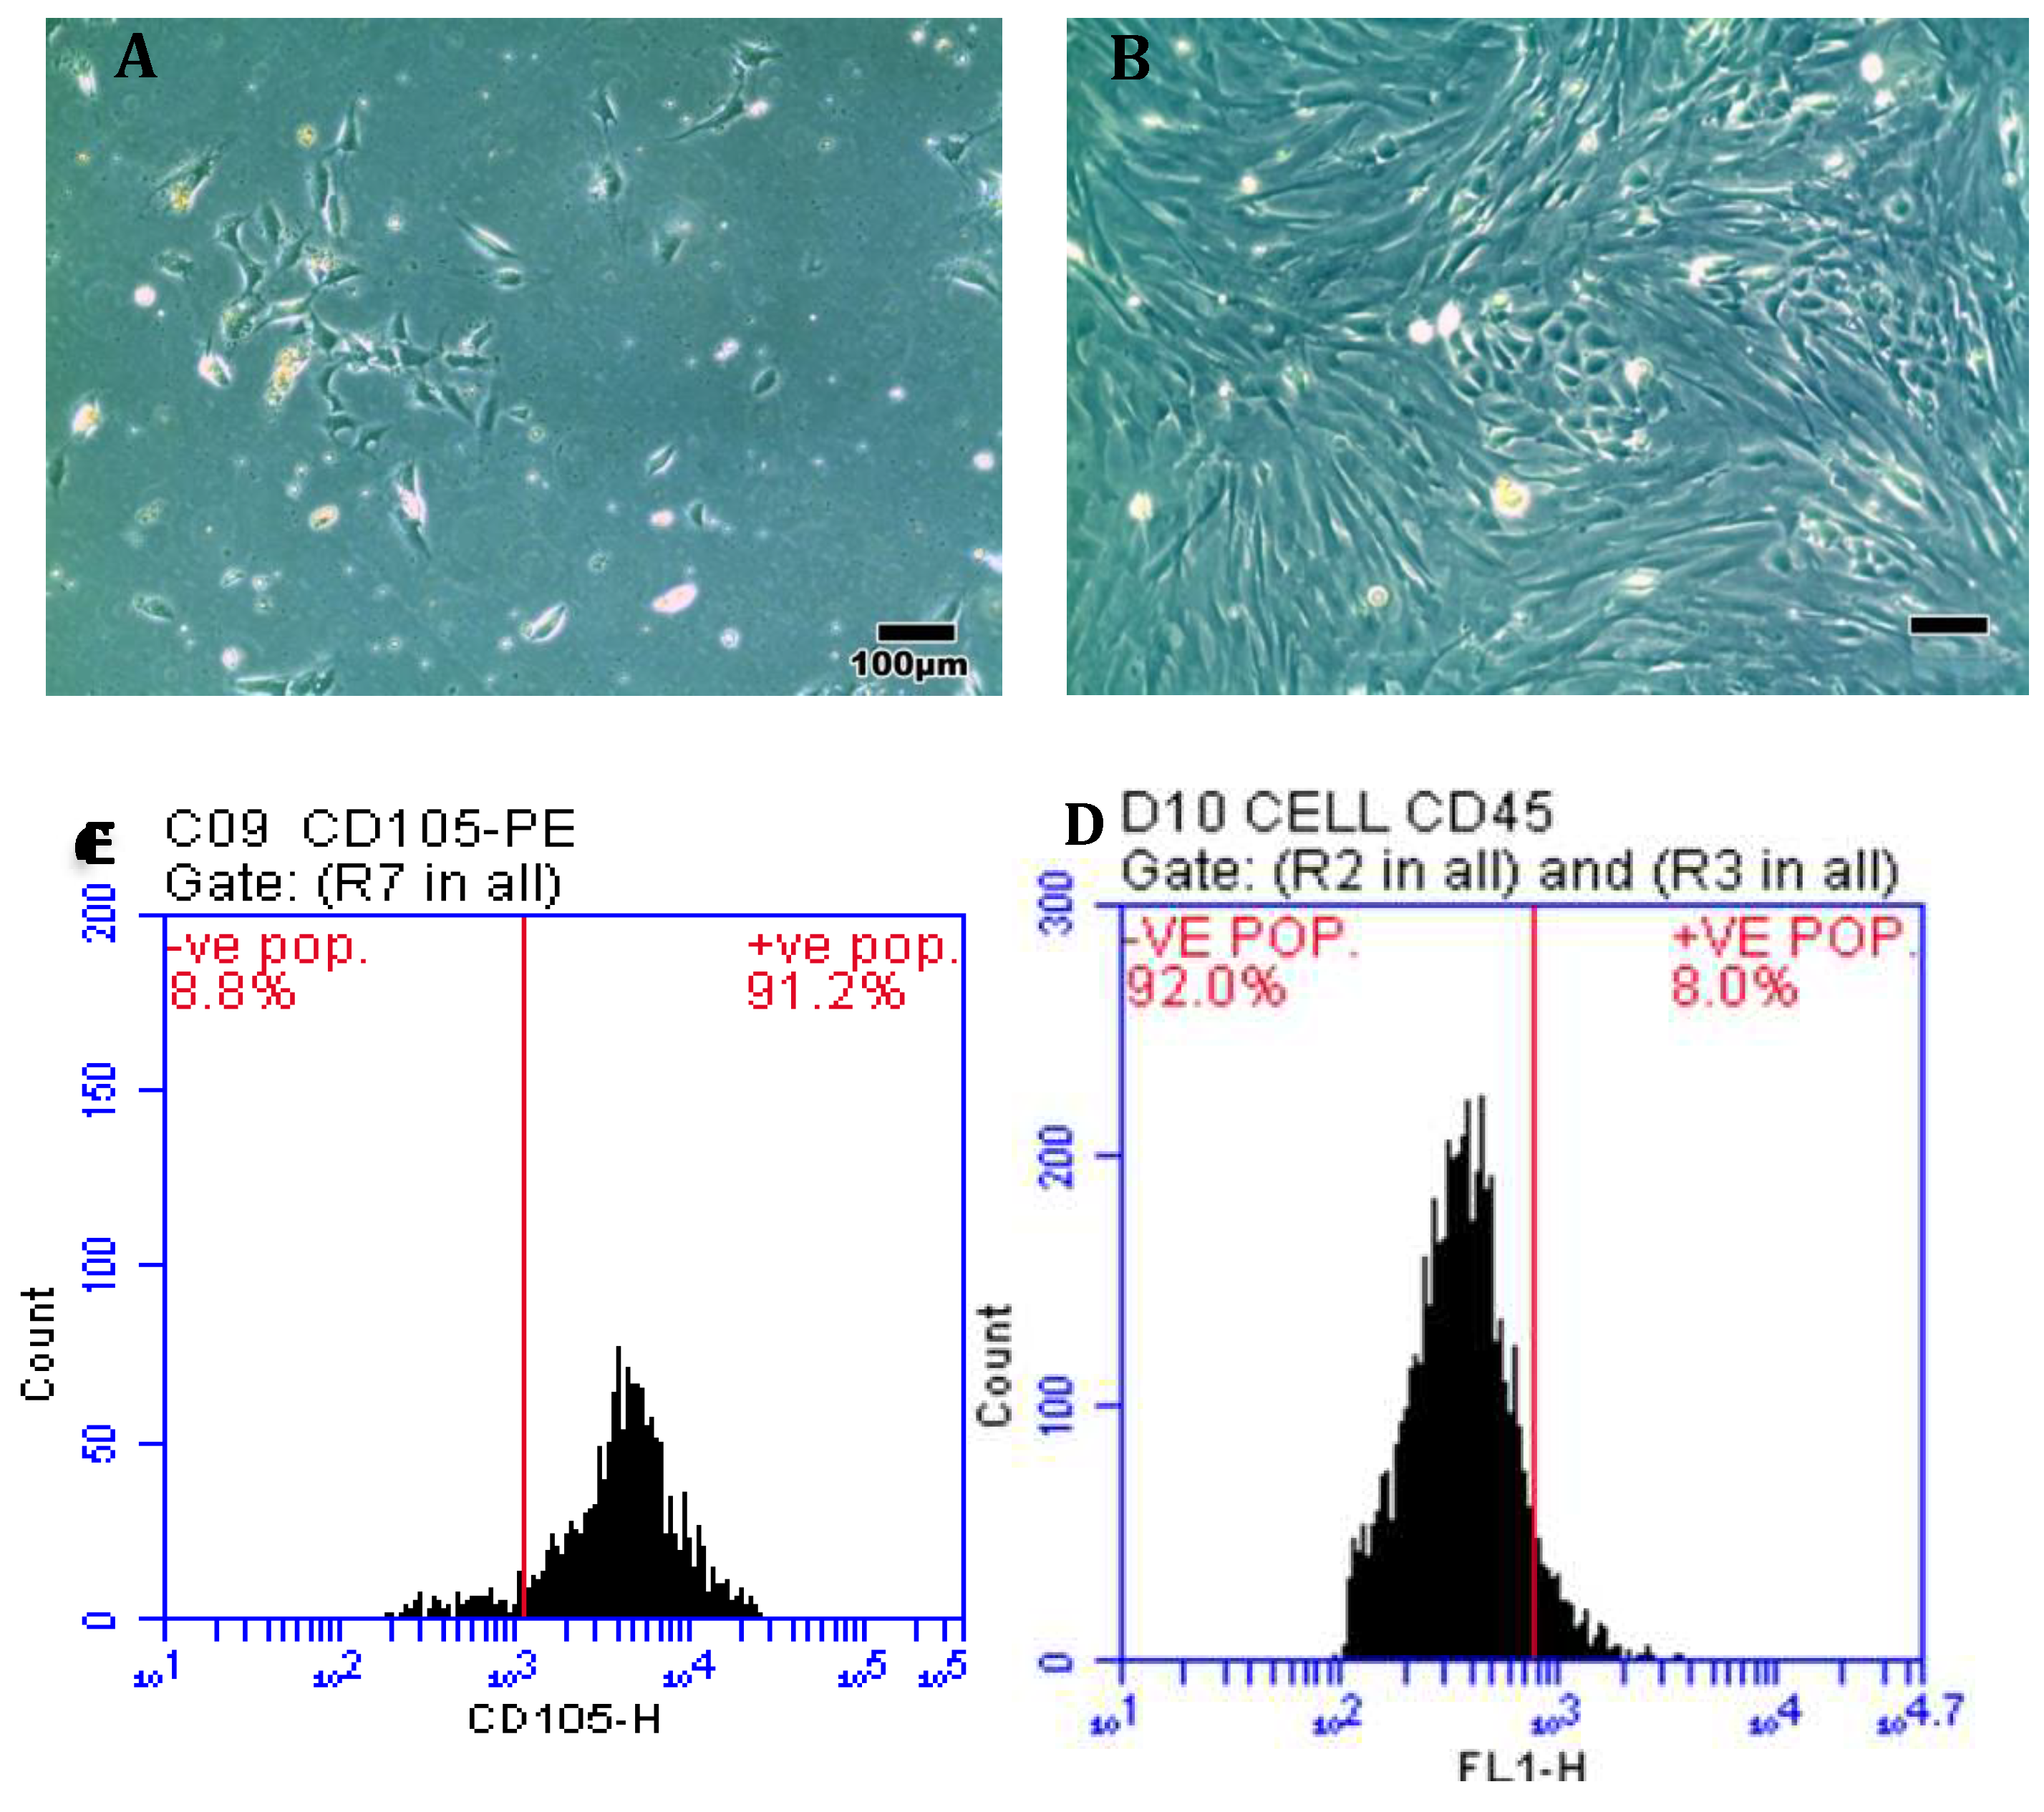
Figure 2.
Impact of ADMSCs treated with Rapa on A) Autophagy using a fluorescent dye AO through flow cytometric assay, B) Cell viability by MTT assay.
Figure 2.
Impact of ADMSCs treated with Rapa on A) Autophagy using a fluorescent dye AO through flow cytometric assay, B) Cell viability by MTT assay.
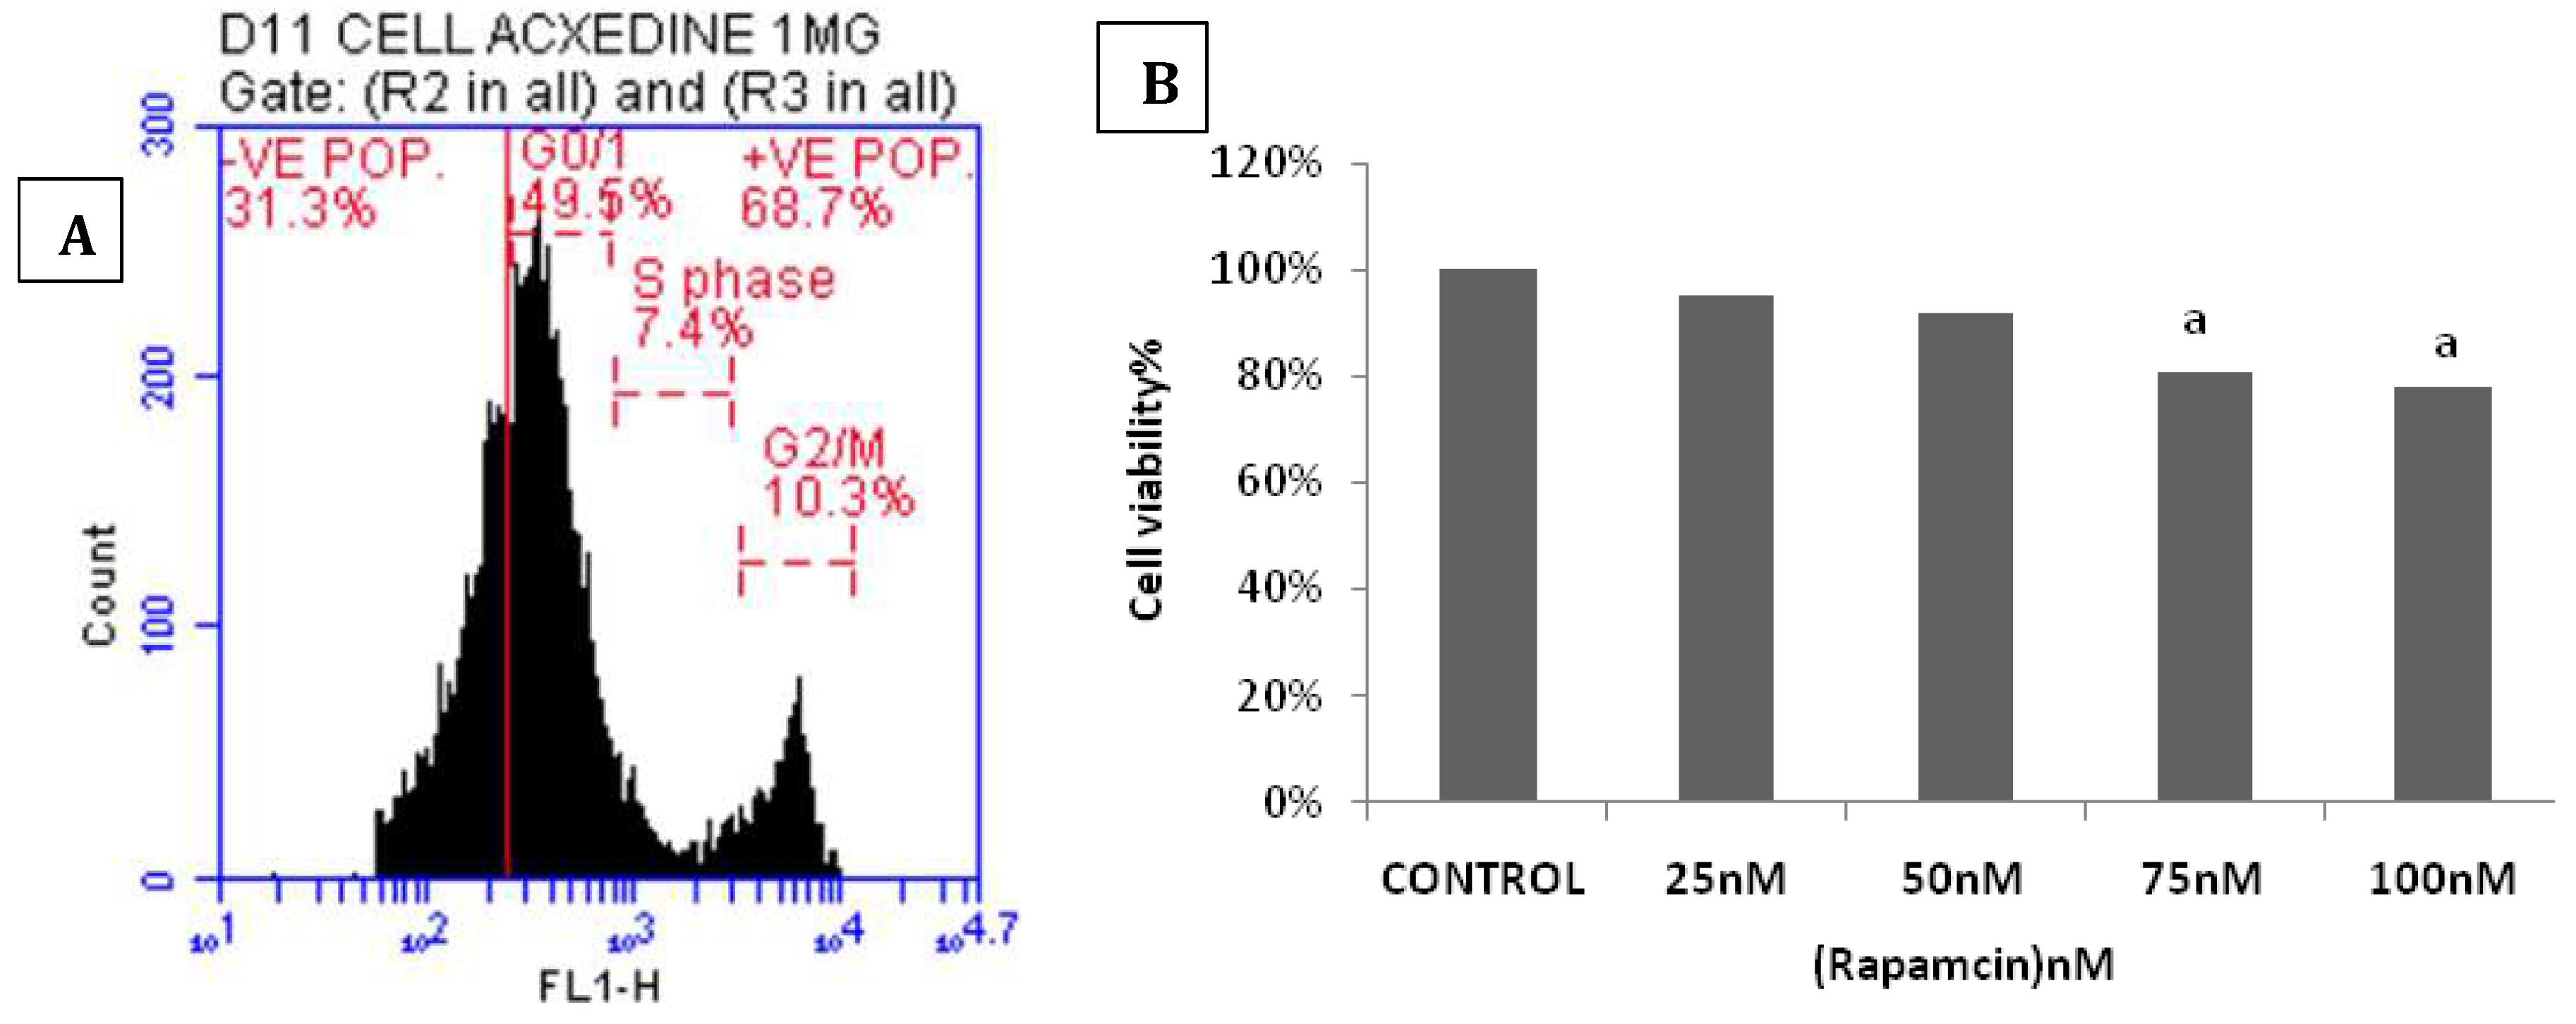
Figure 3.
ADMSCs treated with Rapa illustrated A) increase of LC3-positive puncta by immunohistochemistry Scale bar = 20μm, B) increase of autophagic ultra-structures (autophagosomes) through electron micrograph Scale bar = 100 nm. C) The mRNA level of LC3, mTOR, P62 and BCL2 by real-time PCR. * Significance compared to ADMSCs.
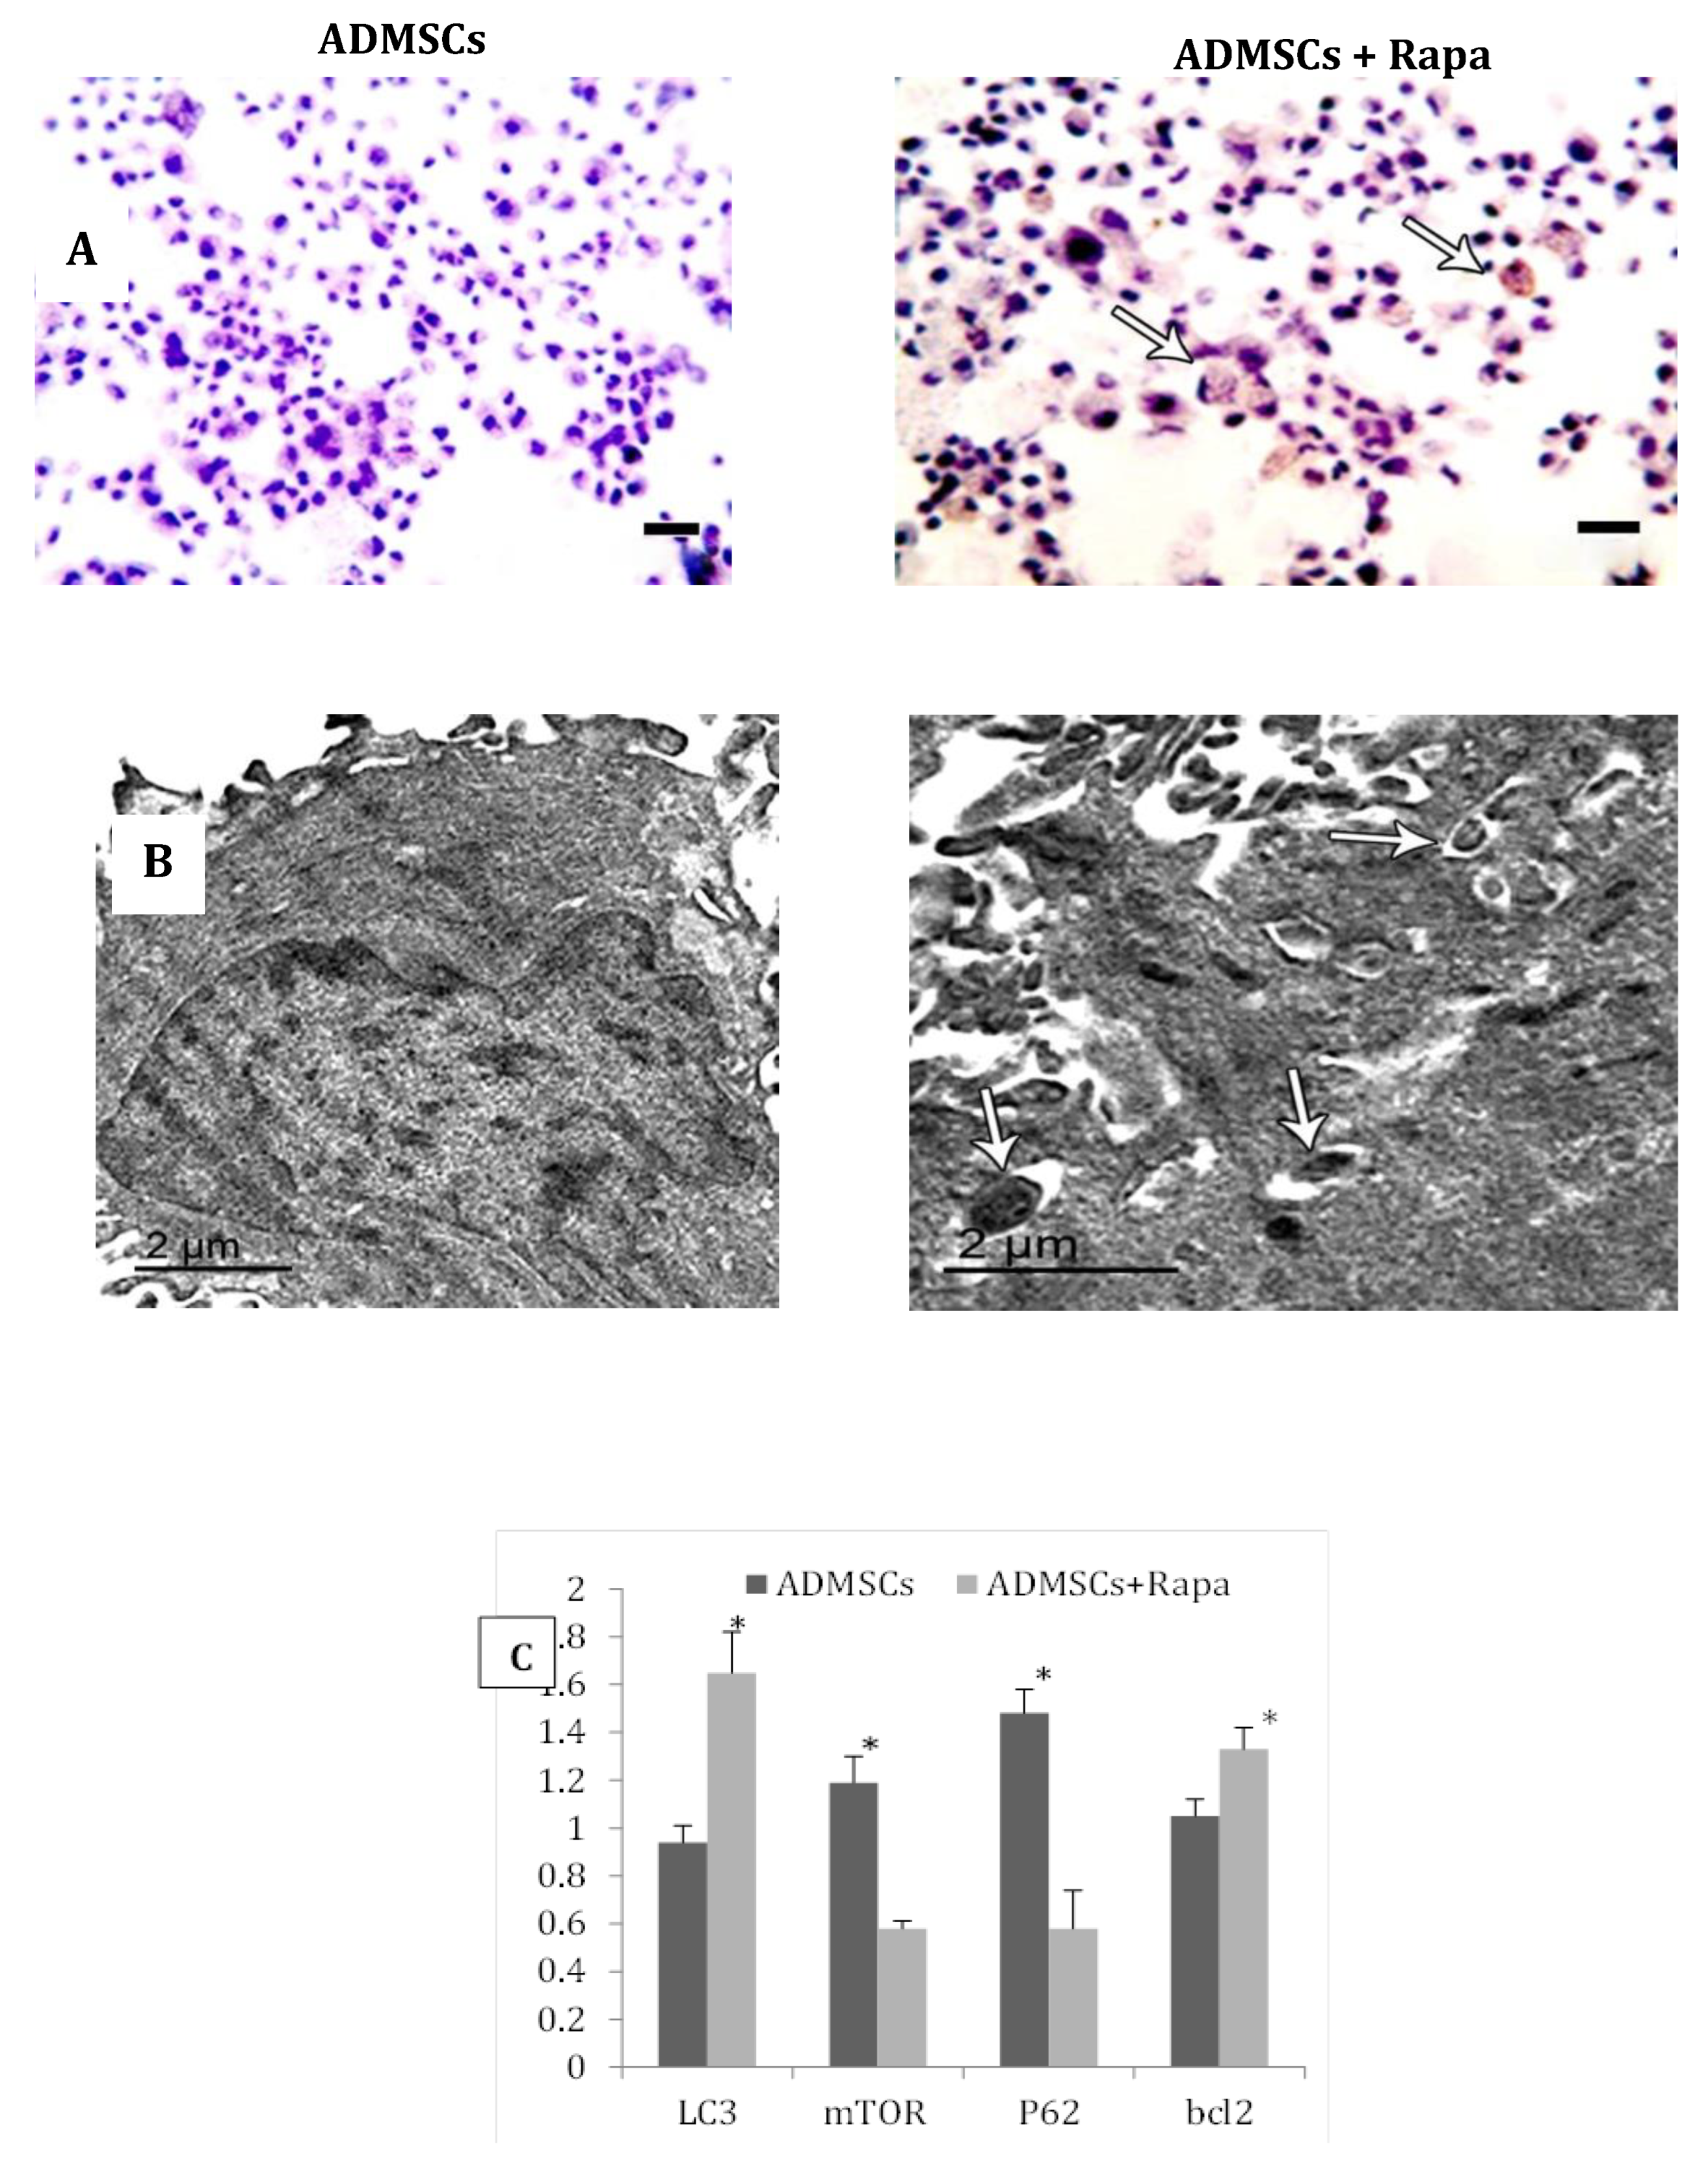
Figure 4.
The effect of ADMSCs pretreated with rapamycin on the mean level of FSH, LH and E2 hormones in all studied groups at 2 and 6 weeks.
Figure 4.
The effect of ADMSCs pretreated with rapamycin on the mean level of FSH, LH and E2 hormones in all studied groups at 2 and 6 weeks.
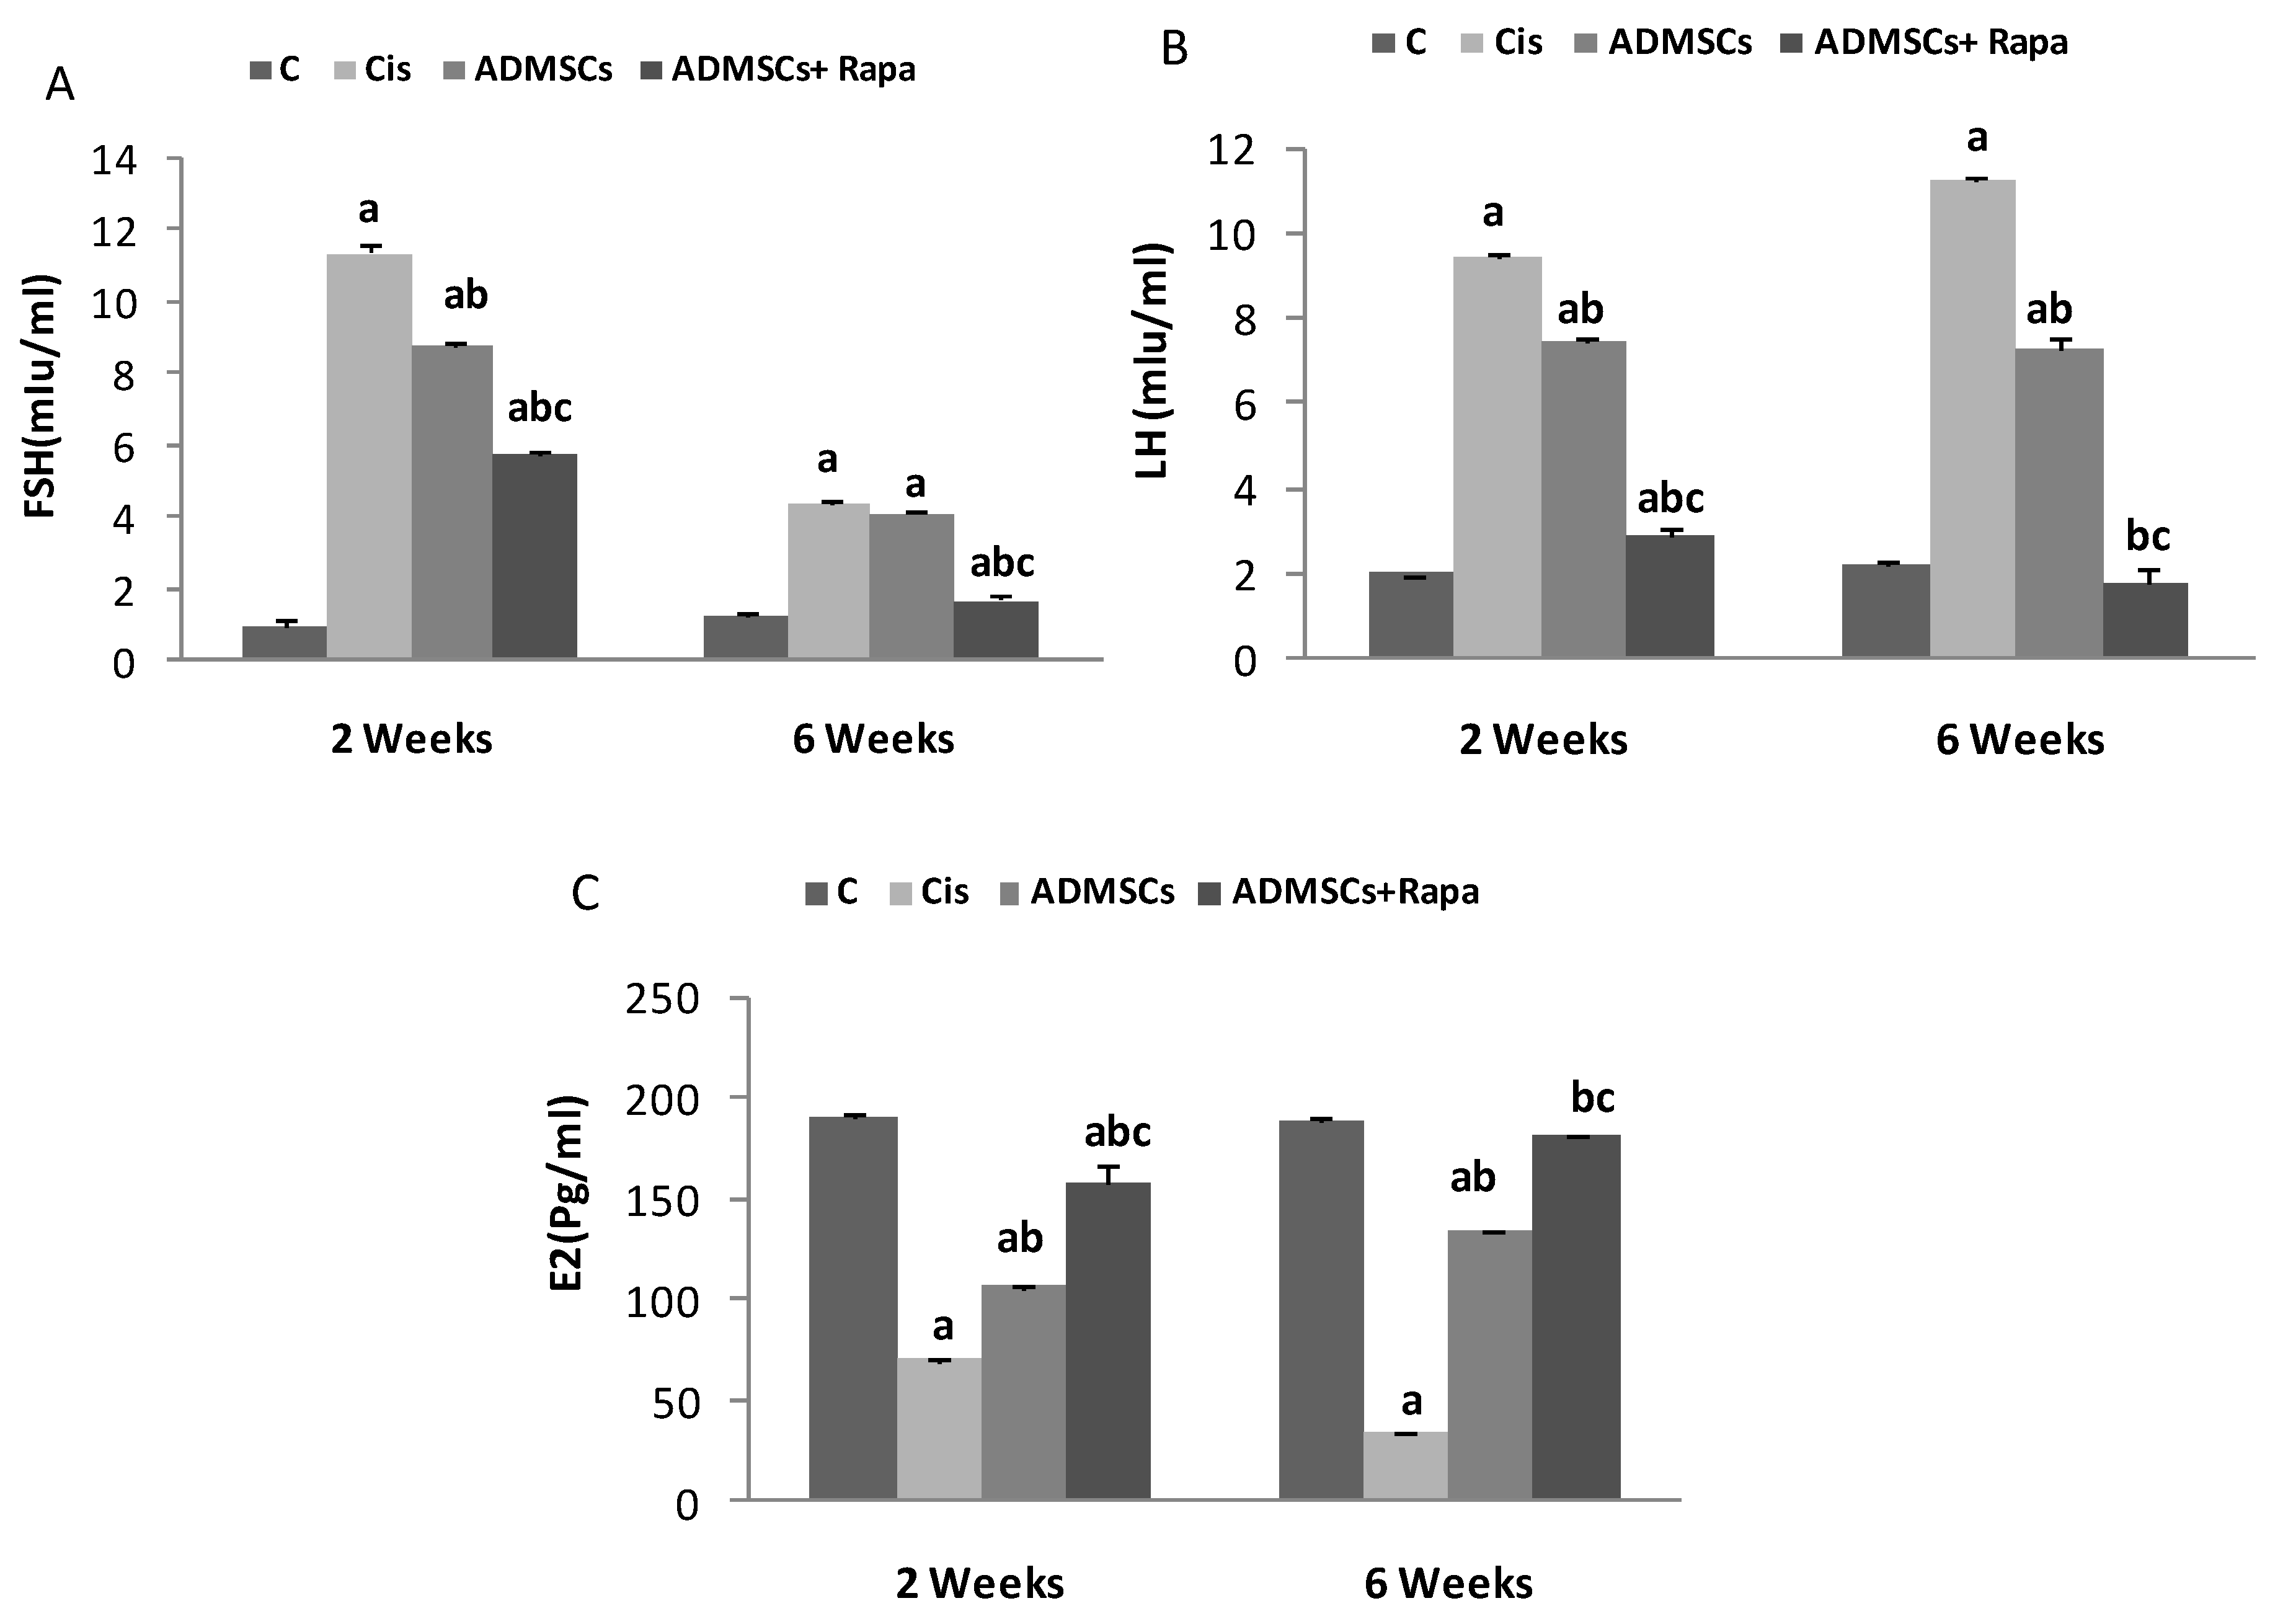
Figure 5.
The effect of ADMSCs pretreated with rapamycin on the gene expression of a) BCL2 b) P62 c) GDF9 d) OCT4 e) TGF-b f) IL-6g) LC3-II in all experimental groups at 2 and 6 weeks.
Figure 5.
The effect of ADMSCs pretreated with rapamycin on the gene expression of a) BCL2 b) P62 c) GDF9 d) OCT4 e) TGF-b f) IL-6g) LC3-II in all experimental groups at 2 and 6 weeks.
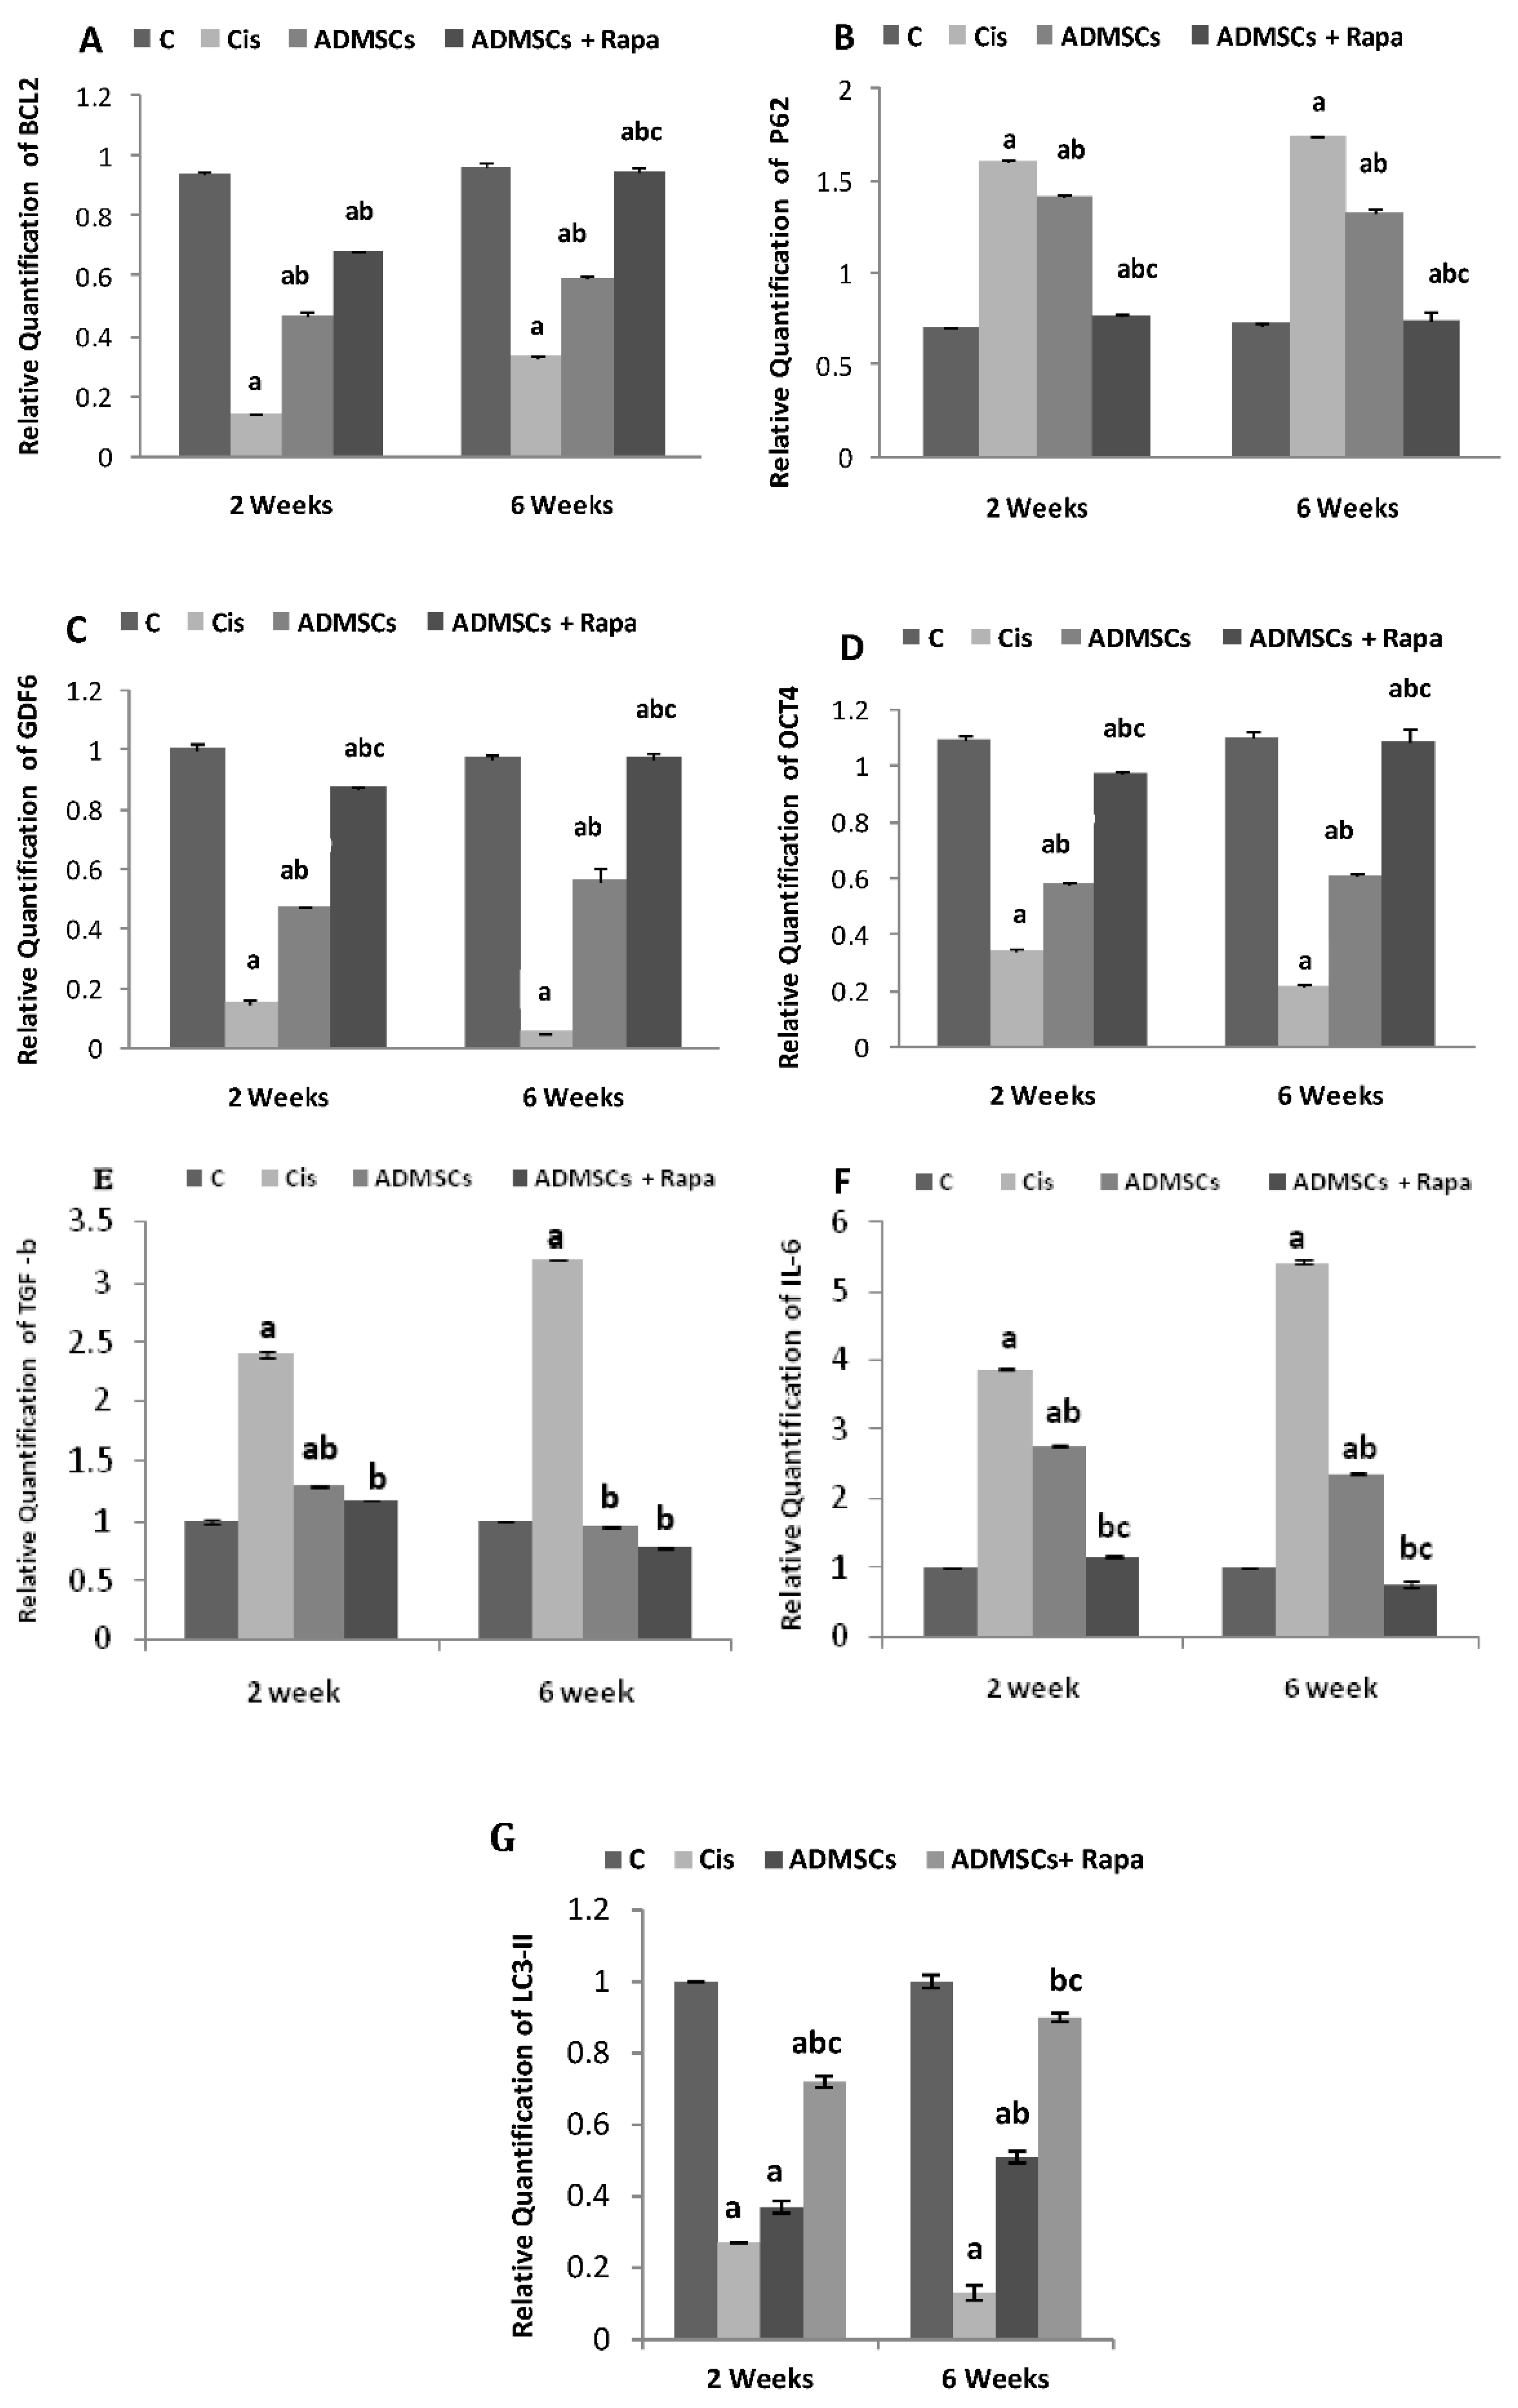
Figure 6.
Microscopic investigation of H&E stained ovarian tissue at 2, 6 weeks respectively, exhibited; A,E) standard histological findings in control group; oocyte (O),follicles (F), graafian follicles (GF), and corpus luteum (CL). B, F) Ovarian tissue from Cisplatin group showing hyperemia (star), many dilated follicles (cross arrow), degenerated follicles (twisted arrows), degenerated corpus luteum (arrowhead) and congested zona granulosa (tailed arrow). C, G) ADMSCs group and D, H) ADMSCs +Rapa group showing significant modification of ovarian structures. X: 400.
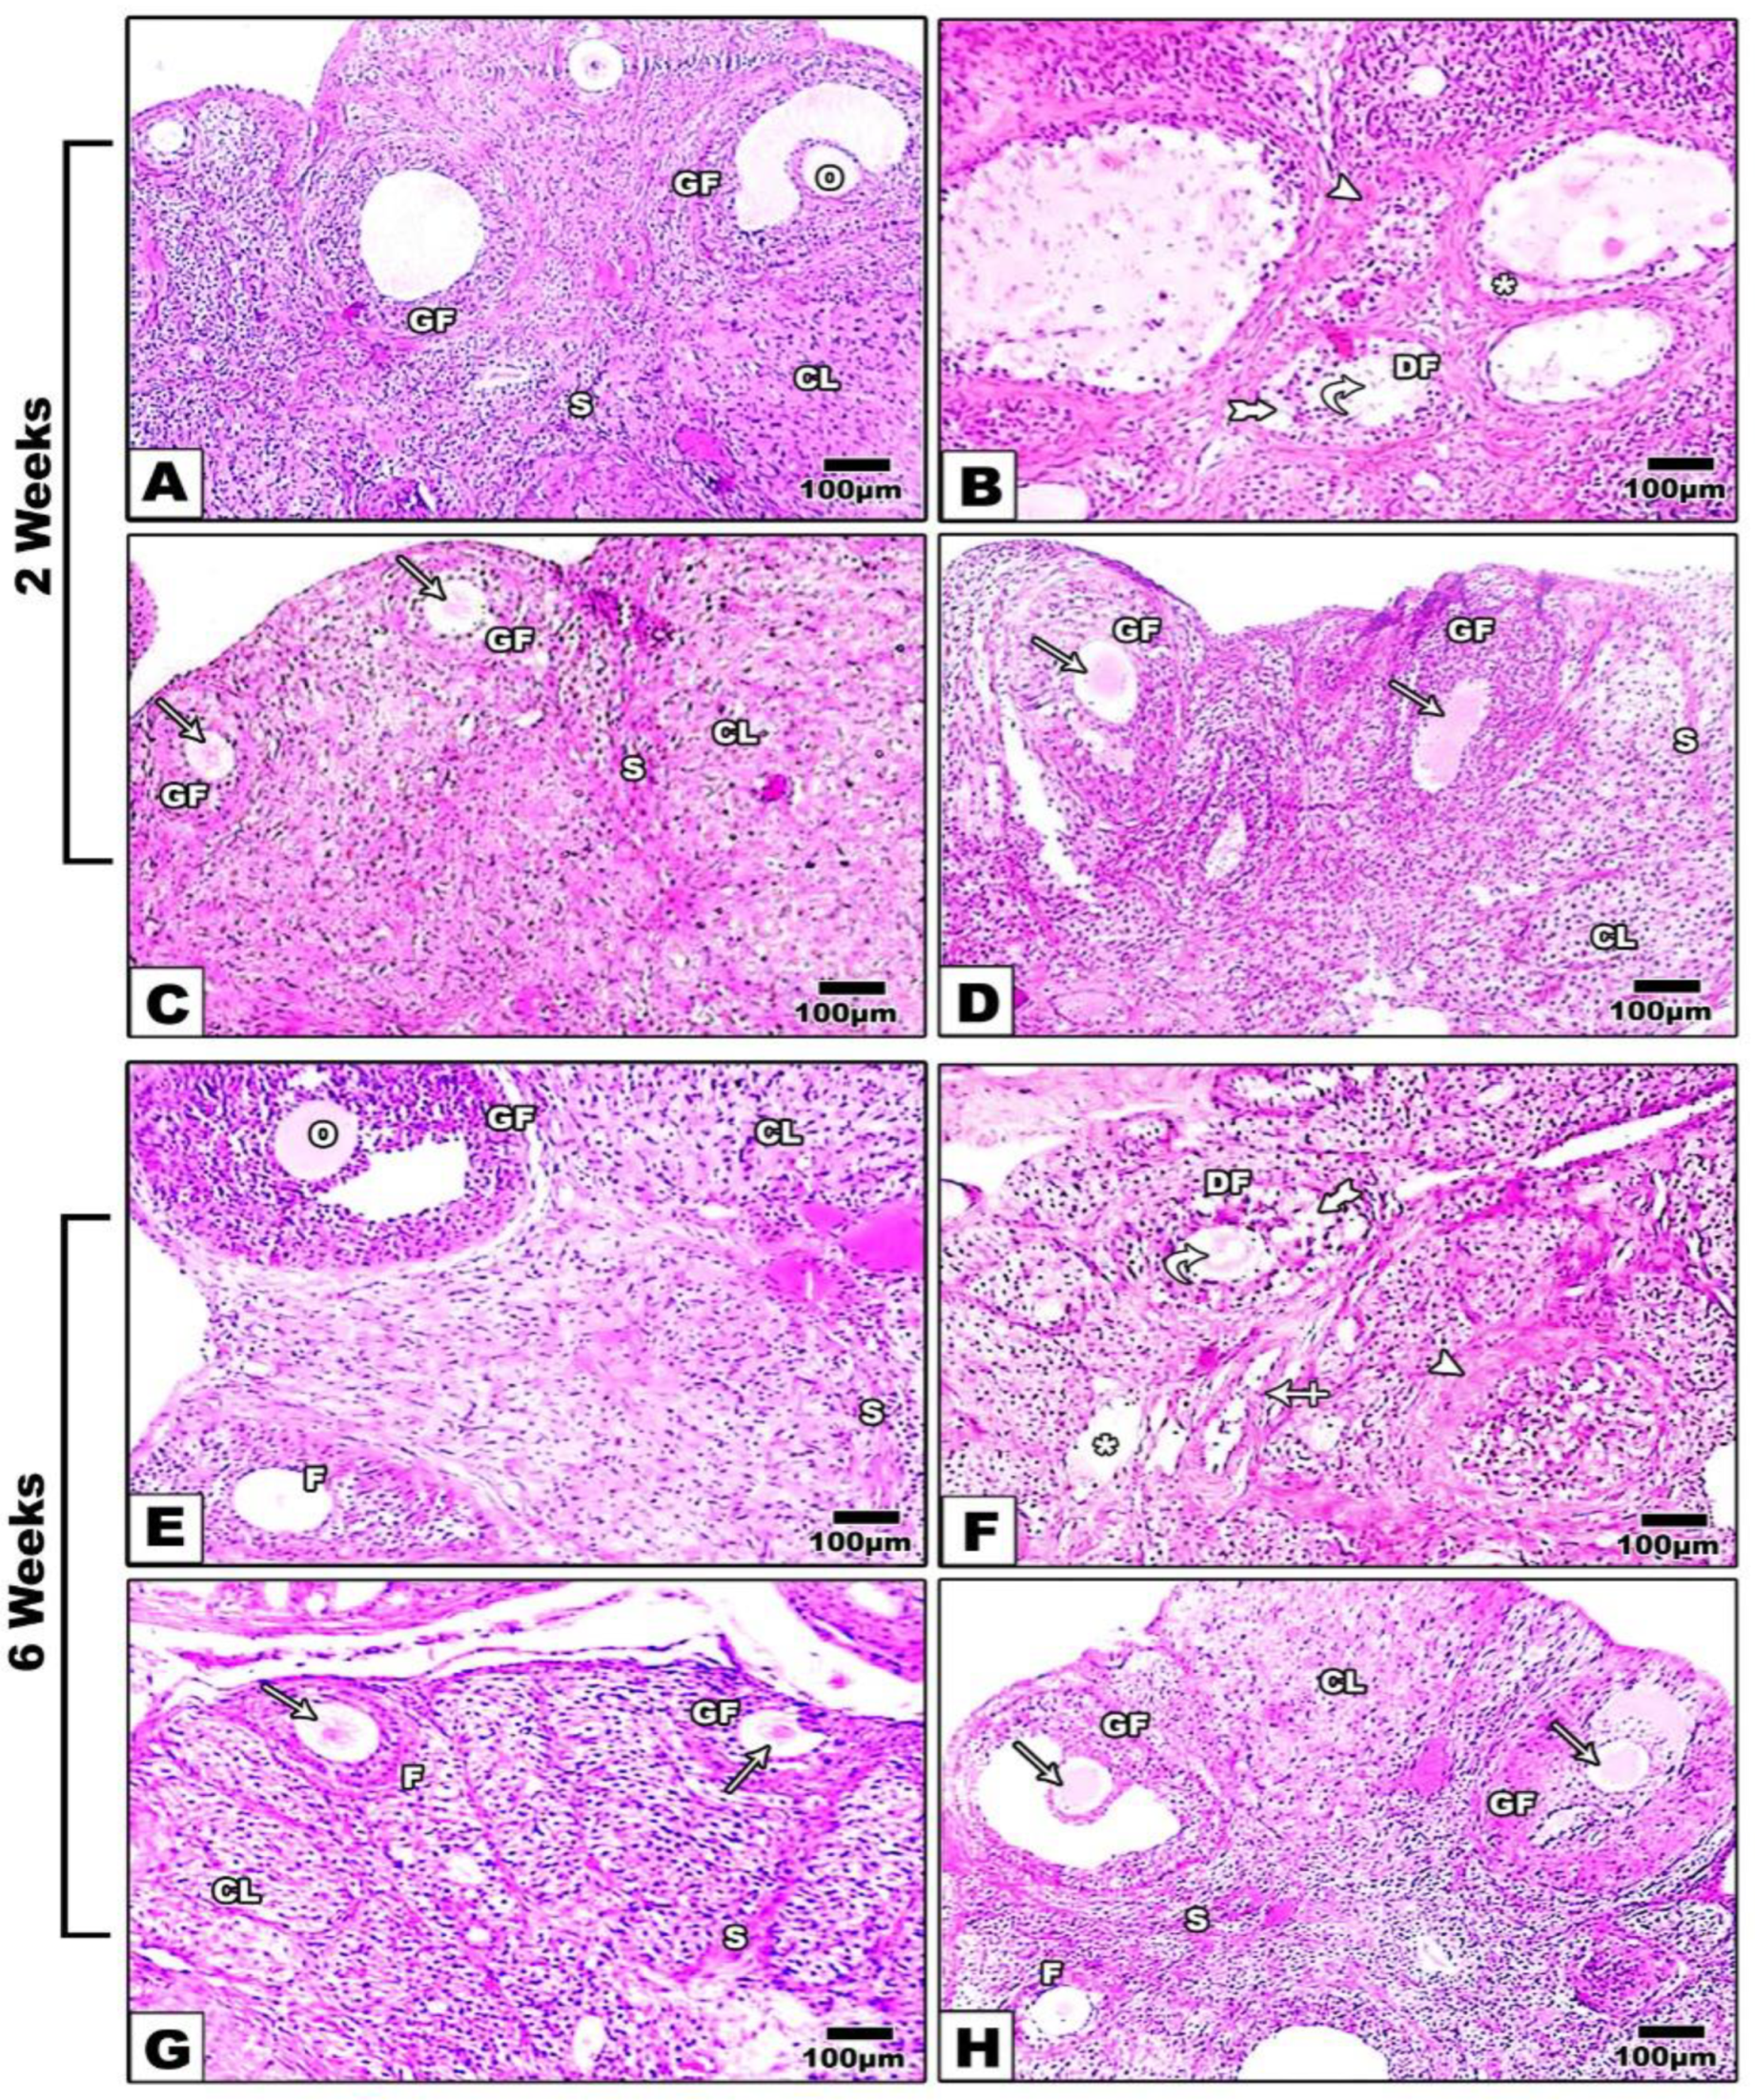
Figure 7.
A)Microscopic pictures of immunostained ovarian sections against BCl-2 at 2 and 6 weeks, respectively showing;(A,E) Positive brown staining in follicular cells , stromal cells and leuteal cells in control group. (B, F) The BCl-2 expression disappeared in Cisplatin group. (C, G) The positive brown expression is re-appeared in follicular cells, stromal cells and luteal cells in ADMSCs treated groups. (D, H) The highest levels of BCl-2 are seen in ovarian sections from ADMSCs + Rapa group. I) Immunoreactivity score of BCL2.White arrows point to positive staining. IHC counterstained with Mayer's hematoxylin. X: 400.
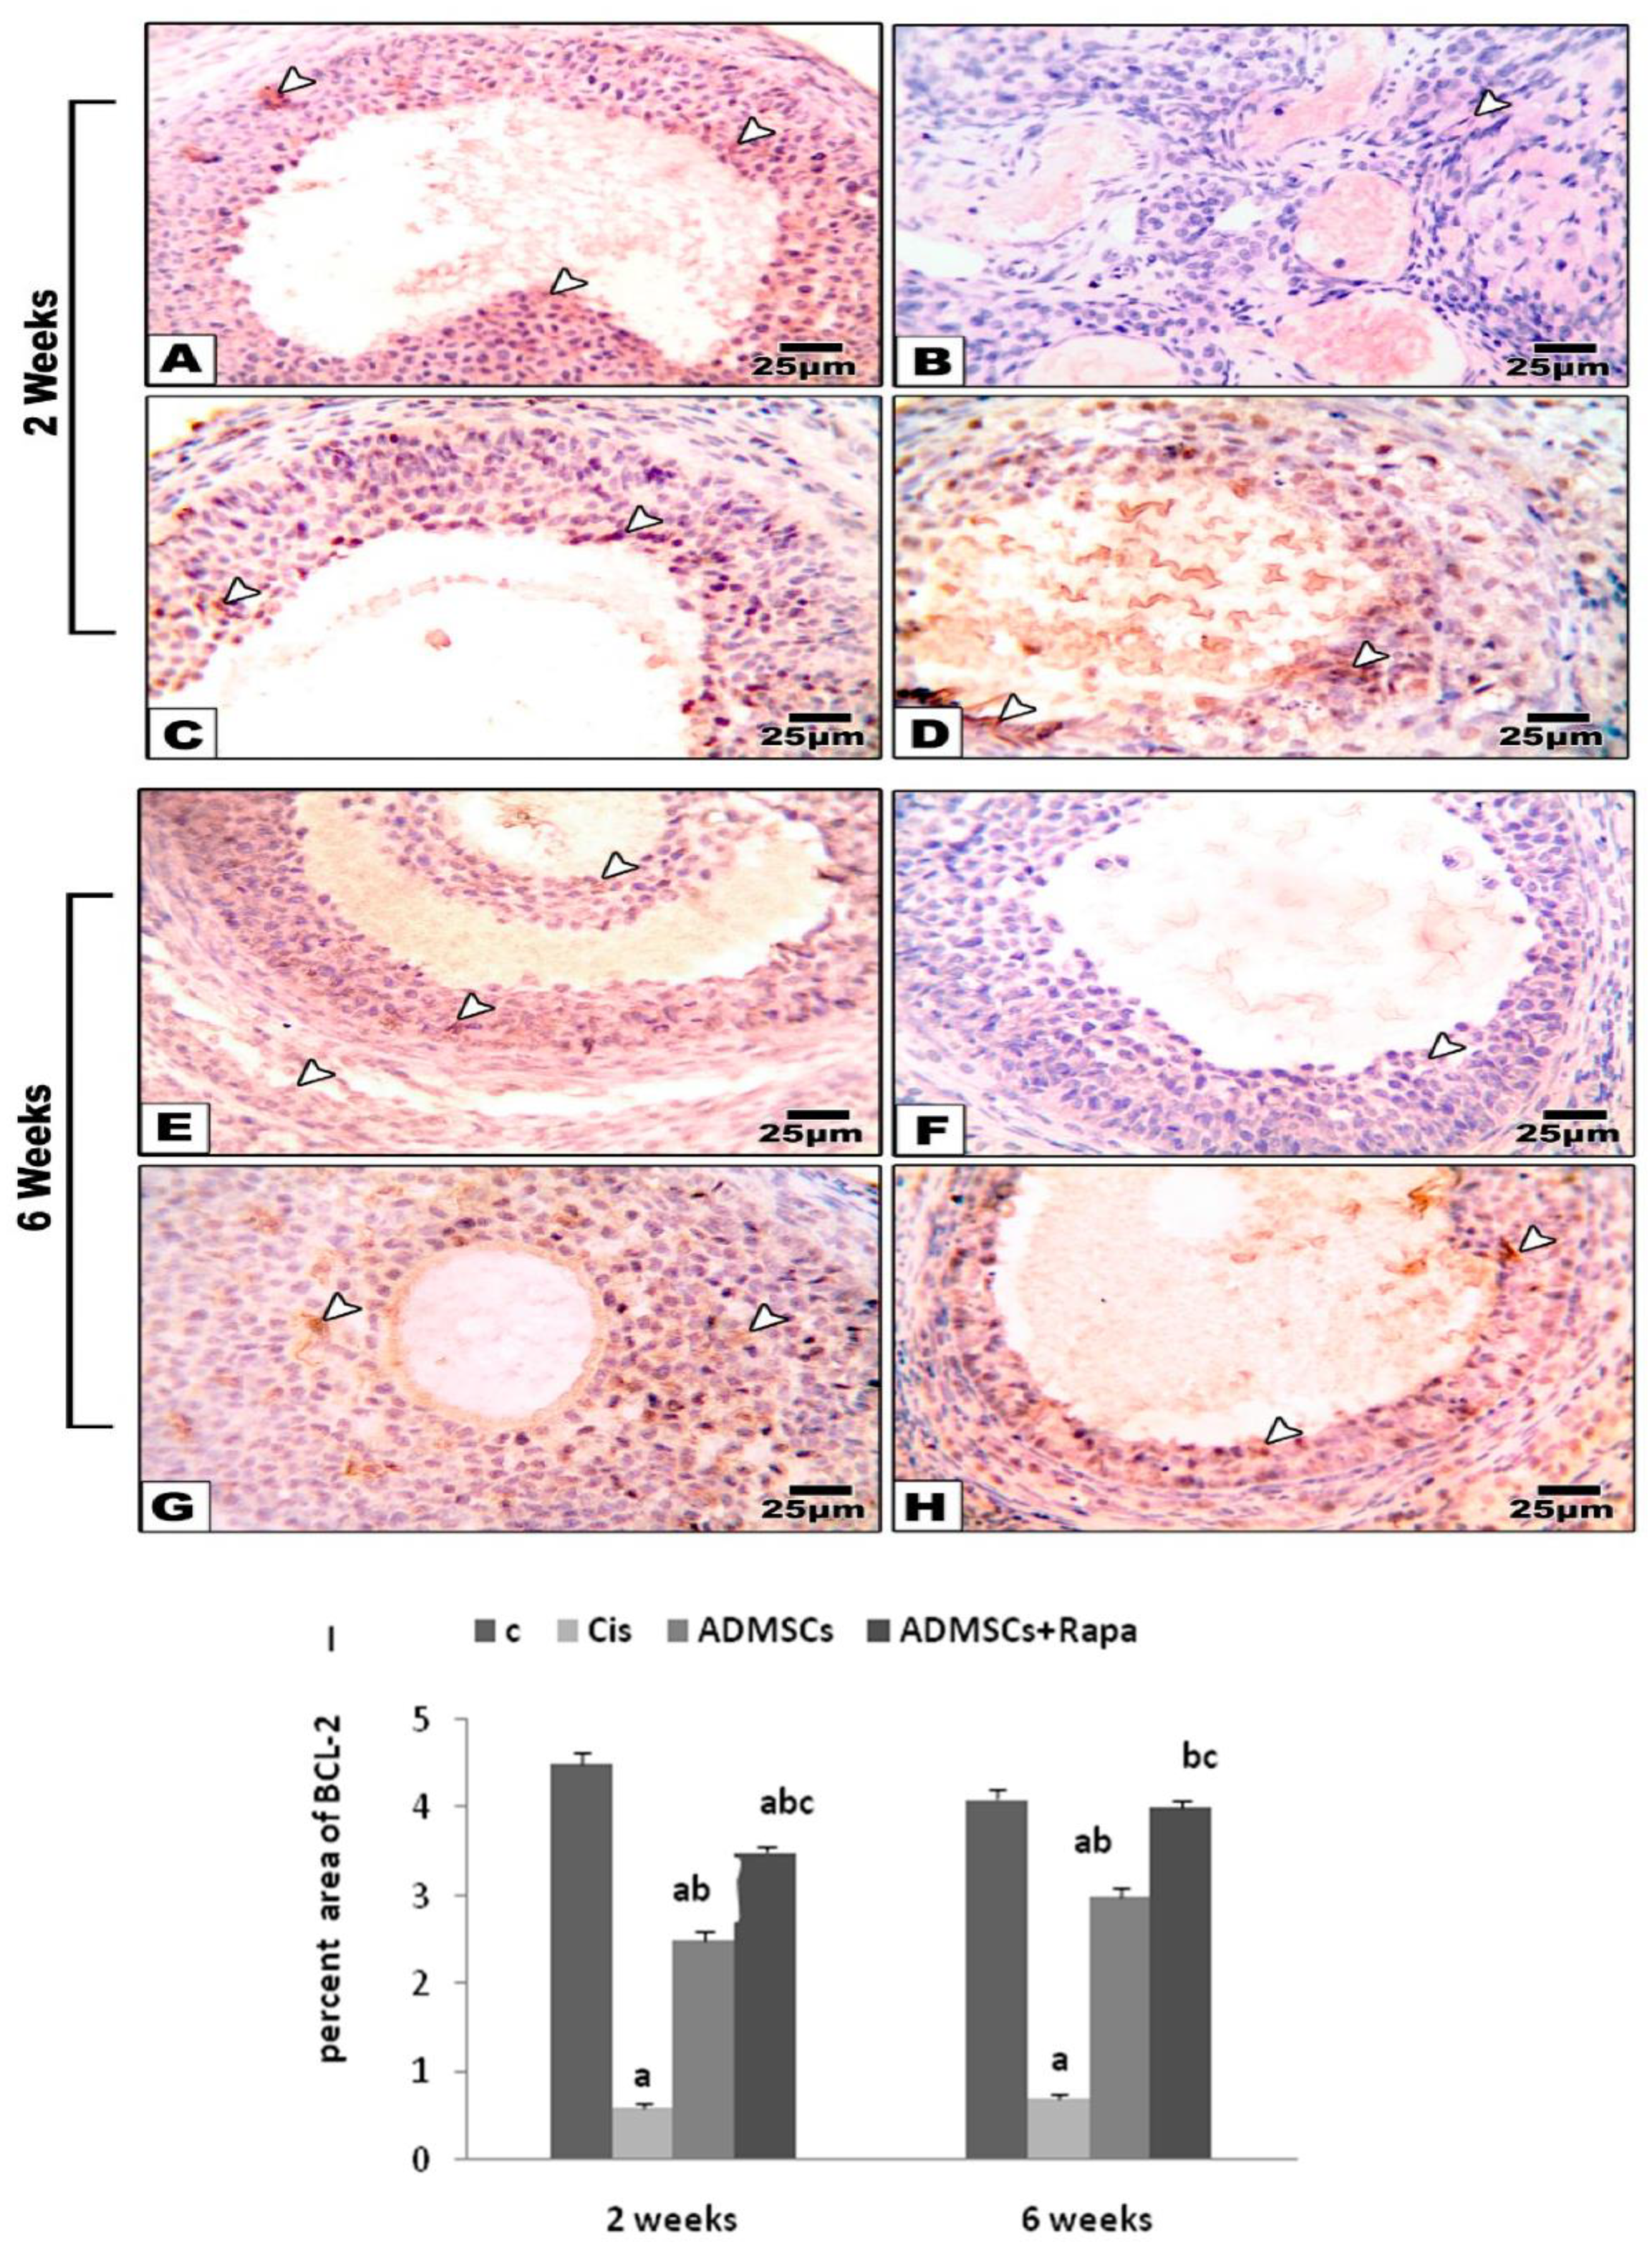

Table 1.
The primer sequence utilized for gene expression.
| Genes | Accession number | Sequence (5’-3’) |
|---|---|---|
| P62 | NM_175843.4 | F: TCCTGCAGACCAAGAACTATGACATCG R: TCTACGCAAGCTTAACACAACTATGAGACA |
| LC3 | NM_022867.2 | F- CCAGGAGGAAGAAGGCTTGG R- GAGTGGAAGATGTCCGGCTC |
| mTOR | NM_019906.2 | R- GCTCTTTGTAGTGTAGTGCTTTGG F: GGCGATGAACTGGACAACAA |
| BCL2 | NM_016993.1 | F: GGTGAACTGGGGGAGGATTG R: GCATGCTGGGGCCATATAGT |
| GDF9 | NM_021672.1 | F: GTTCCCAAACCCAGCAGAAGTC R: GTCCAGGTTAAACAGCAGGTCCA |
| OCT4 | NM_001009178.2 | F: CTGTAACCGGCGCCAGAA R: TGCATGGGAGAGCCCAGA |
| TGFβ1 | NM_021578.2 | F- CACTCCCGTGGCTTCTAGTG R- GGACTGGCGAGCCTTAGTTT |
| IL-6 | NM_012589.2 | F: GCCCTTCAGGAACAGCTATGA R: TGTCAACAACATCAGTCCCAAGA |
| GAPDH | NM_017008.4 | F: AGACAGCCGCATCTTCTTGTR: TTCCCATTCTCAGCCTTGAC |
Table 2.
Body and ovarian weight of the studied groups at 2 and 6 weeks.
| ADMSCs + Rapa | ADMSCs | Cis | C | Scarification time(weeks) |
| Body weight (g) mean ±SD | ||||
| 199±1.9ab | 170±5.7a | 167±2.8a | 223±2.9 | 2 |
| 210 ±3.8abc | 187±2.4ab | 154±9.8a | 225±6.07 | 6 |
| Ovarian weight (g) mean ±SD | ||||
| 0.18±0.01ab | 0.13±0.01a | 0.11±0.02a | 0.27±0.01 | 2 |
| 0.21±0.01ab | 0.17±0.01a | 0.09±0.01a | 0.32±0.02 | 6 |
C: control group, Cis: cisplatin group, Cis + ADMSCs: cisplatin treated ADMSCs and ADMSCs + Rapa: cisplatin treated with ADMSCs preconditioned with rapamycin.
Significant difference compared to a control, b Cis group and c ADMSCs group by ANOVA test accompanied by post hoc multiple comparisons (Scheffé test) at p≤0.05.
Table 3.
CAT and MDA levels of the studied groups at 2 and 6 weeks.
|
ADMSCs+ Rapa |
ADMSCs |
Cis |
C |
Scarification time(weeks) |
| CAT (U/ gm) mean ±SD | ||||
| 20.46±0.76bc | 12.85±0.49ab | 8.25±0.33a | 22.58±0.49 | 2 |
| 22.91±0.49bc | 13.46±0.76ab | 4.3±0.38a | 23.33±0.51 | 6 |
| MDA (nmol/gm) mean ±SD | ||||
| 21.7±2.86b | 26.91±0.39a | 30.5±0.44a | 19.26±0.37 | 2 |
| 18.31±0.57bc | 25.78±0.35ab | 50.91±0.66a | 19.93±0.43 | 6 |
C: control group, Cis: cisplatin group, Cis + ADMSCs: cisplatin treated ADMSCs and ADMSCs + Rapa: cisplatin treated with ADMSCs preconditioned with rapamycin.
Significant difference compared to a control, b Cis group and c ADMSCs group by ANOVA test accompanied by post hoc multiple comparisons (Scheffé test) at p≤0.05.
Table 4.
The histological scores of the microscopic examined ovarian tissues in all considered groups at 2 and 6 weeks.
Table 4.
The histological scores of the microscopic examined ovarian tissues in all considered groups at 2 and 6 weeks.
| Variables | C | Cis | ADMSCs | ADMSCs+ Rapa |
| 2 weeks mean ±SD | ||||
| Primordial follicle | 6.2 ± 0.14 | 3.6 ± 0.12a | 4.3 ± 0.13ab | 5.2 ± 0.14bc |
| Primary follicle | 5.8 ± 0.12 | 2.7 ± 0.14a | 2.8 ± 0.1a | 4 ± 0.1abc |
| Secondary follicle | 4.7 ± 0.13 | 1.9 ± 0.11a | 2.3 ± 0.81a | 3.5 ± 0.81bc |
| Graafian follicles | 2.5 ± 0.12 | 0.25 ± 0.1a | 0.95 ± 0.12ab | 2 ± 0.09bc |
| 6 weeks mean ±SD | ||||
| Primordial follicle | 7.2 ± 0.21 | 2.2 ± 0.17a | 4.8 ± 0.17ab | 5.9 ± 0.1ab |
| Primary follicle | 6.7 ± 0.1 | 2 ± 0.09a | 3 ± 0.09a | 4.8 ± 0.14abc |
| Secondary follicle | 5.1 ± 0.89 | 0.7 ± 0.16a | 2.1 ± 0.81ab | 3.1 ± 0.1b |
| Graafian follicles | 3.6 ± 0.08 | 0.35 ± 0.1a | 1.4 ± 0.11ab | 2.2 ± 0.15bc |
C: control group, Cis: cisplatin group, Cis + ADMSCs: cisplatin treated ADMSCs and ADMSCs + Rapa: cisplatin treated with ADMSCs preconditioned with rapamycin.
Significant difference compared to a control, b Cis group and c ADMSCs group by ANOVA test accompanied by post hoc multiple comparisons (Scheffé test) at p≤0.05.
Table 5.
Fertility guidelines for examination the pregnancy achievement and the well-being of the pups for different studied groups at 2 and 6 weeks.
Table 5.
Fertility guidelines for examination the pregnancy achievement and the well-being of the pups for different studied groups at 2 and 6 weeks.
| Guidelines | C | Cis | ADMSCs | ADMSCs+ Rapa |
| 2 weeks | ||||
| No. of females | 6 | 6 | 6 | 6 |
| No. of dams | 6 | 2 | 3 | 4 |
| No. of born pups/ dam mean ±SD |
8±1.26 | 2.83±0.4a | 4.66±1.12a | 6.16±3.7b |
| No. of live pups / dam mean ±SD |
6.83±1.32 | 1.5±0.34a | 3.16±0.4ab | 4.66± 1.72b |
| No. of dead pups / dam mean ±SD |
1.16±0.4 | 1.6±0.06a | 1.5±0.6a | 1.3±0.1b |
| No. of resorbed embryos/ dam mean ±SD |
0 | 0.6±0.23a | 0.4±0.1a | 0.2±0.04b |
| 6 weeks | ||||
| No. of females | 6 | 6 | 6 | 6 |
| No. of dams | 6 | 2 | 3 | 5 |
| No. of born pups/ dam mean ±SD |
6.5±0.8 | 2±3.1a | 4.16±1.57ab | 5.5±1.8b |
| No. of live pups / dam mean ±SD |
5.5±0.83 | 1.16±0.5a | 3.16±1.48a | 5.5±1.88bc |
| No. of dead pups / dam mean ±SD |
0.1±0.03 | 0.83±0.32a | 0.69±0.15a | 0.4±0.09abc |
| No. of resorbed embryos/ dam mean ±SD | 0 | 0.5±0.13a | 0.33±0.08a | 0.15±0.05bc |
C: control group, Cis: cisplatin group, Cis + ADMSCs: cisplatin treated ADMSCs and ADMSCs + Rapa: cisplatin treated with ADMSCs preconditioned with rapamycin.
Significant difference compared to a control, b Cis group and c ADMSCs group by ANOVA test accompanied by post hoc multiple comparisons (Scheffé test) at p≤0.05.
Disclaimer/Publisher’s Note: The statements, opinions and data contained in all publications are solely those of the individual author(s) and contributor(s) and not of MDPI and/or the editor(s). MDPI and/or the editor(s) disclaim responsibility for any injury to people or property resulting from any ideas, methods, instructions or products referred to in the content. |
© 2023 by the authors. Licensee MDPI, Basel, Switzerland. This article is an open access article distributed under the terms and conditions of the Creative Commons Attribution (CC BY) license (http://creativecommons.org/licenses/by/4.0/).
Copyright: This open access article is published under a Creative Commons CC BY 4.0 license, which permit the free download, distribution, and reuse, provided that the author and preprint are cited in any reuse.


