

Submitted:
02 August 2024
Posted:
05 August 2024
You are already at the latest version
Abstract
This paper considers the problem of predicting earthquakes. It uses a small amount of information to create a descriptive key that can be used as a footprint to describe an event. A frequency grid clusters events that occurred at the same time and then the algorithm averages the history of these events over preceding days, in particular the gaps when the events did not occur. The gaps are measured for the clustered events only and can be used to create a description that is quite unique. Results suggest that seismic events can in fact be traced using this key and subsequently recognised again, if the same conditions reoccur. They also suggest that force direction may be more important than magnitude, for this type of earthquake. Greek and USA datasets have been looked at and the prediction accuracy can be 70% or better. The author therefore suggests that this is an interesting method that deserves attention.
Keywords:
earthquake
; footprint
; predict events
; cluster
; frequency grid
1. Introduction
This paper considers the problem of predicting earthquakes. This difficult problem is a relatively new science that has been approached from different directions, but primarily by studying seismic and electromagnetic activity. What exactly causes earthquakes is still not clear, including the underlying mechanisms, and modelling this to allow a system to predict future events has to date yielded only modest results. After an earthquake has happened for example, do the same conditions still exist, so that a future event could be predicted. This is in fact a known problem where the answer is that some earthquakes, called repeaters, repeat under similar criteria, and some do not [18]. This would mean that only some future earthquakes would be predictable using the proposed method, which is based on evidence only. Most research is knowledge-based, attempting to understand how the earthquake works and building a model of that. If the model contains real knowledge, then maybe it can be applied to new situations as well. Due to the difficulty of the problem however, a reliable modelling approach has not yet been realised. Until recently, the available data has been a bit patchy, but now it is possible to map the whole planet, regarding its electromagnetic footprint, and this should make it easier to build machine learning models in the future. This paper therefore suggests a machine-learning approach that uses a relatively small amount of data. It proposes that earthquakes do in fact have a footprint, or set of characteristics, that can be traced and recognised. Rather than trying to understand the underlying mechanisms that cause the earthquake, the clustering method is evidence-based and builds up a lightweight picture based only on the evidence that is provided. This has some advantages over knowledge or model-based methods, including neural networks, because it can more easily learn stochastic data where random events may occur and this may be more appropriate for environmental data. A modelling approach should adhere to the internal structure of the model and so it cannot be as flexible as an evidence-based approach. The new method uses a slightly different clustering technique, which means that it may be possible to realise different conclusions from earlier similar methods.
The rest of the paper is organised as follows: section 2 gives some related work. Section 3 describes the methodology of the new prediction algorithm. Section 4 gives the Geology theory for why the proposed method may work, while section 5 gives the results of running tests using the new method. Finally, section 6 gives some conclusions on the work.
2. Related Work
Modelling repeating earthquakes is a popular topic, for example [3,18], where they are indicators of slow fault slip, or creep. The paper [18] gives some validity to the proposed method by stating that inter-event timing (recurrence interval) and/or the duration of a sequence’s activity are good diagnostic features for finding appropriate detection parameters, and that spline functions have been used to measure spatio-temporal change. It then states that the disadvantages of repeater analysis include their uneven spatial distribution and the uncertainty of the estimates of slip amount, requiring a scaling relationship between earthquake size and slip. Both papers suggest cohesion or variation measurements, but dealing with the earthquake magnitude. Section 5.3.3 suggests an alternative cohesion factor.
An earlier machine learning system called VAN [19,20] was shown to produce better results for the Greece earthquakes and was a temporal clustering method. The VAN method tries to recognise changes in the rock’s electromagnetic emissions, with the underlying theory that rocks under stress emit different types of signal. It has since been updated [19] with the concept of natural time, which is a time series analysis technique that puts weight on a process based on the ordering of events. However, the prediction results of the method were questioned and it has both supporters and critics. As stated in [10]: ‘Why is temporal clustering such an important issue? Primarily because some variation in natural phenomena, such as electric field variation, which might follow earthquakes, would typically precede late events in a cluster. The electrical variations might thus appear to have some predictive capability, but this would actually come purely from the clustering of earthquakes.’ This indicates that clustering methods are relevant. The paper [15] introduces a new model which considers that the fundamental aspects of the strain accumulation and release processes are critical to causing earthquakes. They also state that a problem with current models is that they assume that large earthquakes release all accumulated strain, despite evidence for partial strain release in earthquake histories showing clusters and gaps. The following sections will show an agreement with both these papers. While their design may be model-based however, this paper uses an evidence-based approach.
In [14] they suggest that an acceptable test for earthquake accuracy might be the ability to predict an earthquake in a region of 50km from the epicentre and up to 21 days before the event. However, only a 5% success rate with these criteria is deemed a good result. A more recent summary about machine learning methods can be found in [2], for example. It notes that much of the progress has been in developing the data catalogs to train the AI models on, such as their own STEAD dataset. In fact, there have been recent claims of success using AI models [1,11,12,17], where some accuracy quotes are over 90%. It seems to be the case that reported results can vary quite widely. The paper [1] measures the upper atmosphere’s Ionospheric total electron content, which originates in the rock, while the paper [17] considers water vapour in volcanic regions. The existence of thermal anomalies prior to large earthquakes [13] has also been demonstrated recently. That paper notes the 2 different types of earthquake as being ‘brittle fracture’ or ‘stick-slip’. The competing forces theory of this paper relates to a change from stick-slip to brittle fracture, which is also mentioned in [13,16]. Not only different methods, but also different aspects of the earthquake are now predicted. The design of this paper makes use of a new clustering algorithm called a Frequency Grid [9]. This was also used in [8] to predict energy usage in households, where Dr. Yaxin Bi is also an expert in modelling electromagnetic data [4]. The frequency grid is described further in the next section.
3. Methodology
The proposed method is to try to recognise the events that lead-up to a major earthquake and represent them in some unique way. If clusters of earthquakes that occur together can be realised, then it should be easier to produce a unique description. If these clusters produced one major event, then they were not involved in a different major event, for example. The method uses the frequency grid to cluster the seismic events, which are represented by their location, magnitude, and time that they occurred. From these clusters, the larger seismic events can be found and it can be determined what occurred with them.
3.1. The Frequence Grid
The frequency grid is an event-based clustering method that was first used in [9] to cluster events for a brain model. It reads a dataset where each row lists events that occurred at the same time. These associations produce sets of count values that represent which events more often occurred together. The grid is entropy-based however, rather than maximising local scores, where the aggregation into a single table can produce a holistic view of the associations. Because the clustering process is event-based, it does not have to produce a consistent underlying model or theory. A neural network, for example, may need to map from input to output using a consistent or continuous function, but the frequency grid does not have to do this. As a result, it can maybe model stochastic data more easily and so environmental data, which may include random elements, can be modelled more easily. Another idea taken from the energy paper [8] is to discretise the seismic data into bands, thus allowing the grid a finer level of granularity. The frequency grid is not numerical, but is category-based and tries to map similar scores for each category together. The seismic events therefore need to be translated from numerical values to text-based values, where the discrete bands allow each band to be given a token name. Each event can therefore be represented by a key that stores its longitude – latitude location, and then a magnitude representation. The magnitude part is discretised into bands as follows: 1 band represents 0.5 of a magnitude size, so an earthquake of size 5 would have a band value of 10. Therefore, a seismic event would be represented by something like 30:20:7, where the longitude of the event would be 30, the latitude would be 20 and the actual magnitude would be 3.5. Then for each time unit, which is currently set to days, all events that occurred during that time unit are added to the dataset as a row of data. When the frequency grid reads the dataset, it will try to associate the events in the same row.
3.2. Grid Clustering
The frequency grid therefore clusters data in a slightly different way to the more traditional clustering algorithms. Consider the following example, where the text is taken from [9]: There is a set of nodes A, B, C, D, E, F and G. Input patterns activate the nodes, which is then presented to the classifier as follows:
- A fires with B, C, D and E.
- B fires with A, C and D.
- C fires with A, B and D.
- D fires with A, B and C.
- E fires with A, F and G.
- F fires with E and G.
- G fires with E and F.
With basic reinforcement, a weight is incremented when a variable is present and decremented when it is not. Then the first set of counts, shown in Table 1 would occur. The whole group A-G is updated as a single entity and this would suggest that the best cluster group is B, C, D and E, with another one probably F and G, but those are not the best clusters.
3.1.1. Grid-Based Counts
It is clear from the data that A, B, C and D all reinforce each other (pattern 1), as does E, F and G (pattern 2), but there is still an inter-pattern link between A and E (in both pattern 1 and 2). With a grid format, the input is represented by a single pattern group, but this time the counts for each individual variable are included and cross-referenced, allowing the inherent structure to be included, as shown in Table 2. The grid format lists each variable both as a row and a column. Each time a pattern is presented, the related cell value for both the row and the column is incremented by 1. See [9] for full details. In row A, for example, the counts suggest that it should be clustered with B, C and D, which is the same cluster conclusion for rows B, C and D. It is probably not necessary to update a self-reference in the grid, so the leading diagonal can be empty. As the grid does not rely on prior classifications of the categories, it is really a self-organising mechanism for categorical data.
3.3. Frequency Grid for the Earthquake Data
For the earthquake data, each row or column in the frequency grid is represented by a location plus a discretised band. In this way for example, location A can be associated with location B when the seismic magnitude is small, but with location C when the magnitude value is large. Consider the following example: locations A (1,1), B (1,2) and C (2,1) all have earthquake events that occur on the same days, as shown in Table 3. On day 1, only 2 events occur, both with a magnitude of 1 and so the frequency grid would cluster A and B together with keys something like A:1 and B:1. On day 2 there are 4 events, but with different magnitudes. For the smaller magnitude, A and B still occur together, but for the larger magnitude A occurs with C. The frequency grid would therefore produce a second cluster for the larger magnitude that would be A:2 and C:2. Putting these counts into the frequency grid leads to Table 4, where tracing through this manually even, can show the clusters.
3.4. Creating the Event Footprint
The frequency grid clustering is only the first stage of the full prediction algorithm. After the dataset is created and the frequency grid clusters generated, the significant events can be found, based on their magnitude key part. Then, from the original dataset, the date of the significant event can be retrieved. The algorithm then wants to determine if the days leading up to the significant event indicated that it would occur. The algorithm can look at data rows in the dataset for x days before the event. After selecting that subset, rows in it are then removed if they do not contain any of the events in the significant cluster. This then leaves the algorithm with the cluster values and some data rows for some days before the event. It is these data rows that are then able to produce the footprint that can describe the significant event. In fact, the current version makes use of the dates only to produce the set of values, listed in Table 5. The full source code for the program can be downloaded from [7].
Not all days would store related events and so there may be gaps in the time series. A first part to the key is therefore to look at these gaps and average over them. A second part then counts how many of the cluster events occurred during each day and averages that. An event footprint can then be created using these average values and the number of days that they were created from. A sequential listing of the values appears to be sufficient, where function transposition is not required. Because the significant event itself occurs only once, it is really the more minor events clustered with it that are being traced, to create the footprint. A surprising result when looking at the key value as a footprint, was that it was mostly unique for the significant event, but the accuracy did drop when the significant threshold was reduced.
3.4.1. Algorithm Pseudo-Code
A pseudo-code description of the major steps taken is as follows:
- Read the raw earthquake dataset into data rows.
- Convert this into a new set of rows, each representing a day, with the seismic events that occurred on that day.
- Pass the event rows through the Frequency Grid to generate the event clusters.
- Note events with a large magnitude and retrieve the clusters that contain them.
- Note the date for the significant event.
- For each significant event, select a time window (before it) and select all event rows in that time window.
- Remove any event rows that do not contain any events in the significant cluster.
- From the remaining event rows, it is possible to calculate the stats to generate the footprint description.
- Save the footprint descriptions to a file.
3.5. Prediction Algorithm
The test of accuracy would then be for the program to be able to predict the significant events by summarising the days before it and creating the footprint value from them. If a recognised footprint was realised, then that would indicate that the related significant event was likely to happen. The prediction algorithm was therefore quite similar to the analysis algorithm, but with a few changes. It started at day 1 of the dataset and would cumulate the data rows in turn until a maximum number for a time window w was used. Then for each of the significant event clusters, a new subset would be created that contained only the data rows relevant to that cluster. From that subset the footprint key would be created. If the key was within a certain error margin of the known footprint key, then the significant event would be flagged for the last day in the time window. This would be repeated, a row at a time, through the whole dataset, where earlier days would be removed when the window moved past them. At the end of this process, the program would print out what days it considered each significant event to potentially occur on.
3.5.1. Algorithm Pseudo-Code
A pseudo-code description of the major steps taken is as follows:
- Read the footprint stats, the events rows and clusters data from files and create the analysis model.
- Select a number of event rows, inside a time window, and calculate the footprints for them.
- If any footprints match with the full analysis footprints, then they can be used to predict the significant event.
- The difference in the final row dates for the full analysis and the prediction window is the amount of time before the significant event that the prediction was made.
4. Earthquake Theory
The following theory is the reason why the footprint descriptions may work. The first thing to note is that a new clustering algorithm is used, which may change the results from any similar earlier attempt. Then, it is really about when the forces are working with each other, or against each other. If there is a fracture in the rock for example, then forces have created that fracture and will continue to move the rock in that direction. If the rock is allowed to consistently move, then there should not be a catastrophic event like an earthquake. The earthquake occurs when the rock wants to move but is prevented from doing so. The force behind it then builds-up until it becomes large enough for a catastrophic event. This is not a new idea and was summarised in [13], pertaining to the theory in the paper [16]. It was summarised in section 4 there, as follows:
‘They proposed a brittle failure theory of multiple locked patches in a seismogenic fault, indicating that sticking behaviour can only occur when there are high-strength obstacles in certain parts of the fault zone, where the fault movement is hindered. When these parts undergo brittle fracture due to compression, the rocks on either side of the fault would proceed to sudden ‘sliding’. That is, it is a pre-requisite that the high-strength obstacles must fracture first before the dynamic slip occurs on that fault.’
The analysis algorithm that creates the footprints recognises what smaller events are relevant to the significant ones. If these events are occurring regularly, then probably, there should not be an earthquake, but if there are gaps in the data rows, because these events do not occur, then maybe that represents a situation where there is a build-up due to forces blocking each other. These gaps are then maybe a prelude to an earthquake event, which is a known theory about earthquakes1. If one set of forces gives way to another for example, it could lead to catastrophic failure. It might also be interesting to consider that after the major earthquake and the release of energy from those forces, there may be other sets still with energy, that will cause the aftershocks and they could also be represented in the related events. Therefore, one idea when measuring day gaps was that there would be more gaps leading up to an event and so this could be a type of general indicator, but further tests did not show this as being definitive. Other tests that added the event magnitudes as a new key component also performed the same or slightly worse. This suggests that the current setup considers force direction more.
5. Testing and Results
A program has been written in the Java programming language to test the theory. The original Greece [5] and USA [6] datasets have been re-formatted slightly to be read by the program, but the raw data is not changed. These datasets were selected because they give the required information of longitude, latitude and magnitude, with a timestamp and required a minimum amount of formatting. They are also relatively small datasets, being a few megabytes in size, rather than gigabytes. This led to 200,000 rows in the Greek dataset, from 2005 to 2022, and 75,000 rows in the US dataset, over a 9 month period in 2022. They are in fact, the only 2 datasets that have been tested and so the generality possibility looks good. The accuracy measurement was a basic count of whether the program was able to predict each of the major events. It is not entirely scientific and has some human judgement about whether the prediction covers the time that the earthquake actually happened. One problem is that the prediction may be made over quite a long time-period and so it is difficult to tell exactly when in that time-period it will occur. But results suggest that it is always at the end of the time-period. The only danger is that it might just go past the actual date by a few days.
The band size was set to 0.5, which meant that an increase of this amount in the seismic magnitude would place the event in a different band category. The threshold was set to 12, meaning that only seismic events of size 6 or above would be considered as significant. The time window was set to 200, meaning that the program would look at 200 days before the significant event day, but clearly these values can be changed. The Greece dataset had patchy readings from 1968 to 2005, and from 2005 onwards, many more readings were taken. Therefore, the dataset was used from the start of 2005 only. It was decided that a time unit of days would be best and so the US dataset, which has a smaller timeframe, was aggregated to be in days rather than every few minutes, but again, using every row in the dataset. The only columns that were required was the date, longitude, latitude, and the event magnitude. The example in the following sections is for the Greece dataset.
5.1. Data Rows and Clusters
The program firstly read the dataset and created lists of events for each day in the record, where each day represents a data row. A data row could be represented by something like the following:
| Date (in days) | Events on that day |
| 01/01/2005 00:00:00 | 38:24:3, 25:20:4, 40:42:5 |
The data row describes 3 events that occurred on the 1 of January 2005. The program can process in hours, but the preferred time unit is days and so the time part is set to 0. The first event ‘38:24:3’ indicates a latitude of 38, a longitude of 24 and a discrete band size of 3, or earthquake magnitude of 1.5. The frequency grid would therefore have been able to associate these events and if this happens consistently over all data rows, they can form clusters. If any cluster includes an event that passes the threshold, then it can be considered as significant. For example, the following was a significant cluster for the Greece dataset, because one event had a discrete value of 13 and it is the association of that event with the other lesser ones in the cluster that allows for the predictions.
| Significant Cluster | 38:22:6, 40:19:7, 6:30:8, 40:23:8, 39:25:8, 38:22:13 |
5.2. Footprint Key
There are thus 6 events in the significant cluster, or 5 events that may have contributed to the major 6th event. The program then wants to know when these events were active and when they were not. The significant event is quite rare and so there is a time gap before it occurs. For the days leading up to it, each represented by a data row in a time window, the rows were removed if they did not contain any of the events in the cluster. This would leave data rows, each representing a specific day, when any of the significant events occurred. The footprint was then created from these matching data rows, which was translated over to a list of gaps between days when events occurred and also the number of related events that occurred on each day. To determine if a related event occurred, matching with the longitude, latitude and magnitude were all considered. The footprint key can then be created from this list and may look something like the following.
| Footprint (Day Count / Av Day Gap / Av Event Count) | 50 / 2.5 / 3 |
This represents the days leading up to the event as follows: there were 50 days in the time window before the significant event that contained any of the events in the cluster. In these 50 days, the average gap between relevant days was 2.5 and there was an average of 3 relevant events on each of those days.
5.3. Analysis and Predictions
The program can then run an analysis phase, where it selected a time window related to a significant event and analysed the data rows that occurred in that time window. It noted the events that were part of the significant event cluster and noted when they occurred. From this it was able to generate the footprint key and store it with the event description, as has just been described. This was then used as the marker that the prediction should try to find. These analysis markers were written to a file and then read by a simulation program that made predictions on when the significant events were likely to happen, as described in section 3.5. The footprint or marker match does not have to be exact. For this set of tests, the error margin was set to 5% difference in any of the 3 parts of the footprint key. The footprint would therefore be considered to be the same, only if all 3 parts were within an error margin of 5% of the related actual footprint part. One thing to note however is that a significant event does not necessarily have a history that can be traced. Some events appear to happen without a warning, while other events have a long history trace that can be used to calculate the footprint.
5.3.1. Greece Dataset
For the Greek dataset, most of the significant events did in fact have a footprint. Figure 1 shows the significant events with a threshold of value 12 or above (magnitude value of 6 or above) and only 1 event occurred without an earlier trace. It is therefore not possible to make a prediction for that event. For the other events however, the predictions are listed in Figure 2. Most of the significant events have been predicted and within reasonable time of the real event. Some of the time spans are very short, but if the data was tested first, then it would be known to expect a long or short time span there. One event is a lot more messy however. It occurred on 16 July 2008, but its footprint has been repeated several times over the dataset. It happens to be the case that the other flagged events were clustered mostly in the same region and so that may have produced a similar footprint. Even if that event is not included, the author would suggest that the accuracy is 6.5 good predictions from 8 plus one missing, which still gives 72% accuracy.
5.3.2. USA Dataset
For the USA dataset however, over 50% of the significant events did not have a footprint. Figure 3 shows the significant events with a threshold of value of 12 or above and only 8 have a traceable footprint, while 9 do not. Of the 8 that have a footprint, predictions could be made for 7 of them, as listed in Figure 4 . These predictions are quite close however and so in real terms that is still a 40% accuracy over the whole dataset.
5.3.3. Adding a Cohesion Factor
One other test measured when the days were continuous, as well as the day gaps. Therefore, the key would include a value representing the day gaps and another equivalent value for continuous days. It may be the case that for smaller magnitude earthquakes, continuous days can show more variation than the gaps. The test with the new 4-component footprint was then run on both datasets again, but with a threshold value ranging from 10 to 12 (magnitude 5 to 6). Table 6 gives a summary of all the results. The higher magnitude of 6 produced the same results as for the 3-component key, but for the other thresholds, the results were slightly improved. For the lower thresholds, the clusters were not predicted as accurately in any case and some of them could be very incorrect. The USA data with a 10 threshold, for example, had mostly misses, because no footprint was available. Of the 19 predictions that were made however, 17 of them would be acceptable. The table therefore gives an accuracy score for significant events, only when predictions were made and then also for all significant events. This shows that there is still room for adding new variables to the key.
6. Conclusions
This paper has suggested a method of producing a footprint key with which to recognise seismic events. It is based on the theory that competing forces can block each other, causing a build-up of pressure and eventually an earthquake. In fact, there are different types of earthquake. Brittle fracture might also occur when rising magma fractures the rock in a more consistent way, but the author wishes to focus on the proposed method only and not the Geological variations. The process requires training an algorithm on previous events and so if the conditions change, the process may not work very well. It is also evidence-based, which means that it can map more easily to the data, but that it has very little knowledge or understanding of that data. It might therefore not be possible to transfer results from one region to another region, but it is likely to be a flexible and generally applicable method. The footprint is generated from only a small amount of information and sometimes it cannot be created. When clusters are generated however, even the current key is mostly unique. Because the significant event itself occurs only once in a set of data, it is really the more minor events clustered with it that are being traced, which may be another reason why event magnitude is not helpful, because they will be more of a mixture there. The current program is only a first attempt, but it has been able to show a proof of concept and the accuracy of the predictions are probably at an acceptable level. Therefore, the author would suggest that this is an interesting method that deserves further investigation. He is unlikely to continue this work himself and so the software is available to download and use for free [7].
6.1. Future Work
The large time windows for predicting events could pose problems in the real world, if a precise declaration was required for evacuating an area, for example. So, this would need to be looked at further, but it would be known from the testing phase which events would be likely to produce the larger time windows. The end of the window was usually much closer to the actual event, but did pass the event date on a few occasions. Section 5.3.3 showed that it may be possible to add new factors to the key. The footprint is really just a list of variable values and has definitely not been examined exhaustively. The 4-component key with a cohesion factor proved to be slightly better than the 3-component key, for example. Maybe something like electromagnetic or vapour readings could be tried, or temperature is another possibility. But the current set looks to be appropriate for comparing forces. A cohesion value relating to the relative directions of the fault forces is therefore another possibility, while the paper [18] would suggest waveform coherence instead. The method is very lightweight. The tests took just seconds or minutes on a standard laptop. Therefore, it might also be used as simply one indicator in a larger system, that could incorporate some of the more detailed knowledge-based approaches as well.
References
- Asaly, S.; Gottlieb, L.-A.; Inbar, N.; Reuveni, Y. Using Support Vector Machine (SVM) with GPS Ionospheric TEC Estimations to Potentially Predict Earthquake Events. Remote Sens. 2022, 14, 2822. [Google Scholar] [CrossRef]
- Beroza, G.C.; Segou, M.; Mostafa Mousavi, S. Machine learning and earthquake forecasting - next steps. Nat Commun 2021, 12. [Google Scholar] [CrossRef] [PubMed]
- Cannata, A.; Iozzia, A.; Alparone, S.; Bonforte, A.; Cannavò, F.; Cesca, S.; Gresta, S.; Rivalta, E.; Ursino, A. Repeating earthquakes and ground deformation reveal the structure and triggering mechanisms of the Pernicana fault, Mt. Etna. Communications Earth & Environment 2021, 2, 116. [Google Scholar]
- Christodoulou, V.; Bi, Y.; Wilkie, G. A tool for Swarm satellite data analysis and anomaly detection. PLoS ONE 2019, 14, e0212098. [Google Scholar] [CrossRef] [PubMed]
- Dataset, Greece. (2023). Kaggle, https://www.kaggle.com/datasets/nickdoulos/greeces-earthquakes.
- Dataset, USA. (2023). Kaggle, https://www.kaggle.com/datasets/thedevastator/ uncovering-geophysical-insights-analyzing-usgs-e.
- Greer, K. (2023). Earthquake Footprint Software, https://github.com/discompsys/ Earthquake-Footprint.
- Greer, K.; Bi, Y. Event-Based Clustering with Energy Data. WSEAS Transactions on Design, Construction, Maintenance 2022, 2, 197–207. [Google Scholar] [CrossRef]
- Greer, K. (2019). New Ideas for Brain Modelling 3, Cognitive Systems Research, Vol. 55, pp. 1-13, Elsevier. [CrossRef]
- Kagan, Y.Y.; Jackson, D.D. Statistical tests of VAN earthquake predictions: Comments and reflections. Geophysical Research Letters 1996, 23, 1433–1436. [Google Scholar] [CrossRef]
- Kavianpour, P.; Kavianpour, M.; Jahani, E.; Ramezani, A. A cnn-bilstm model with attention mechanism for earthquake prediction. The Journal of Supercomputing 2023, 1–33. [Google Scholar] [CrossRef]
- Laurenti, L.; Tinti, E.; Galasso, F.; Franco, L.; Marone, C. Deep learning for laboratory earthquake prediction and autoregressive forecasting of fault zone stress. Earth and Planetary Science Letters 2022, 598, 117825. [Google Scholar] [CrossRef]
- Liu, W.; Liu, S.; Wei, L.; Han, X.; Zhu, A. Experimental study on the thermal response of rocks to stress change and its significance. Geophysical Journal International 2024, 238, 557–572. [Google Scholar] [CrossRef]
- Luen, B.; Stark, P.B. (2008). Testing earthquake predictions. In Probability and statistics: Essays in honor of David A. Freedman (Vol. 2, pp. 302-316). Institute of Mathematical Statistics.
- Neely, J.S.; Salditch, L.; Spencer, B.D.; Stein, S. A More Realistic Earthquake Probability Model Using Long-Term Fault Memory. Bulletin of the Seismological Society of America 2023, 113, 843–855. [Google Scholar] [CrossRef]
- Qin, S.Q.; Xu, X.W.; Hu, P.; Wang, Y.Y.; Huang, X.; Pan, X.H. Brittle failure mechanism of multiple locked patches in a seismogenic fault system and exploration on a new way for earthquake prediction (in Chinese). Chin. J. Geophys. 2010, 53, 1001–1014. [Google Scholar]
- Shiraishi, H. Earthquake Prediction Software on Global Scale. Journal of Geoscience and Environment Protection 2022, 10, 34–45. [Google Scholar] [CrossRef]
- Uchida, N. Detection of repeating earthquakes and their application in characterizing slow fault slip. Progress in Earth and Planetary Science 2019, 6, 1–21. [Google Scholar] [CrossRef]
- Varotsos, P., Sarlis, N. and Skordas, E. (2002), Long-range correlations in the electric signals that precede rupture, Physical Review E, Vol. 66, No. 1: 011902, Bibcode:2002PhRvE..66a1902V. [CrossRef] [PubMed]
- Varotsos, P.; Alexopoulos, K.; Nomicos, K. Seven-hour precursors to earthquakes determined from telluric currents. Praktika of the Academy of Athens 1981, 56, 417–433. [Google Scholar]
| 1 | Background knowledge. |
Figure 1.
Significant events for the Greece Dataset – Footprint at Event.
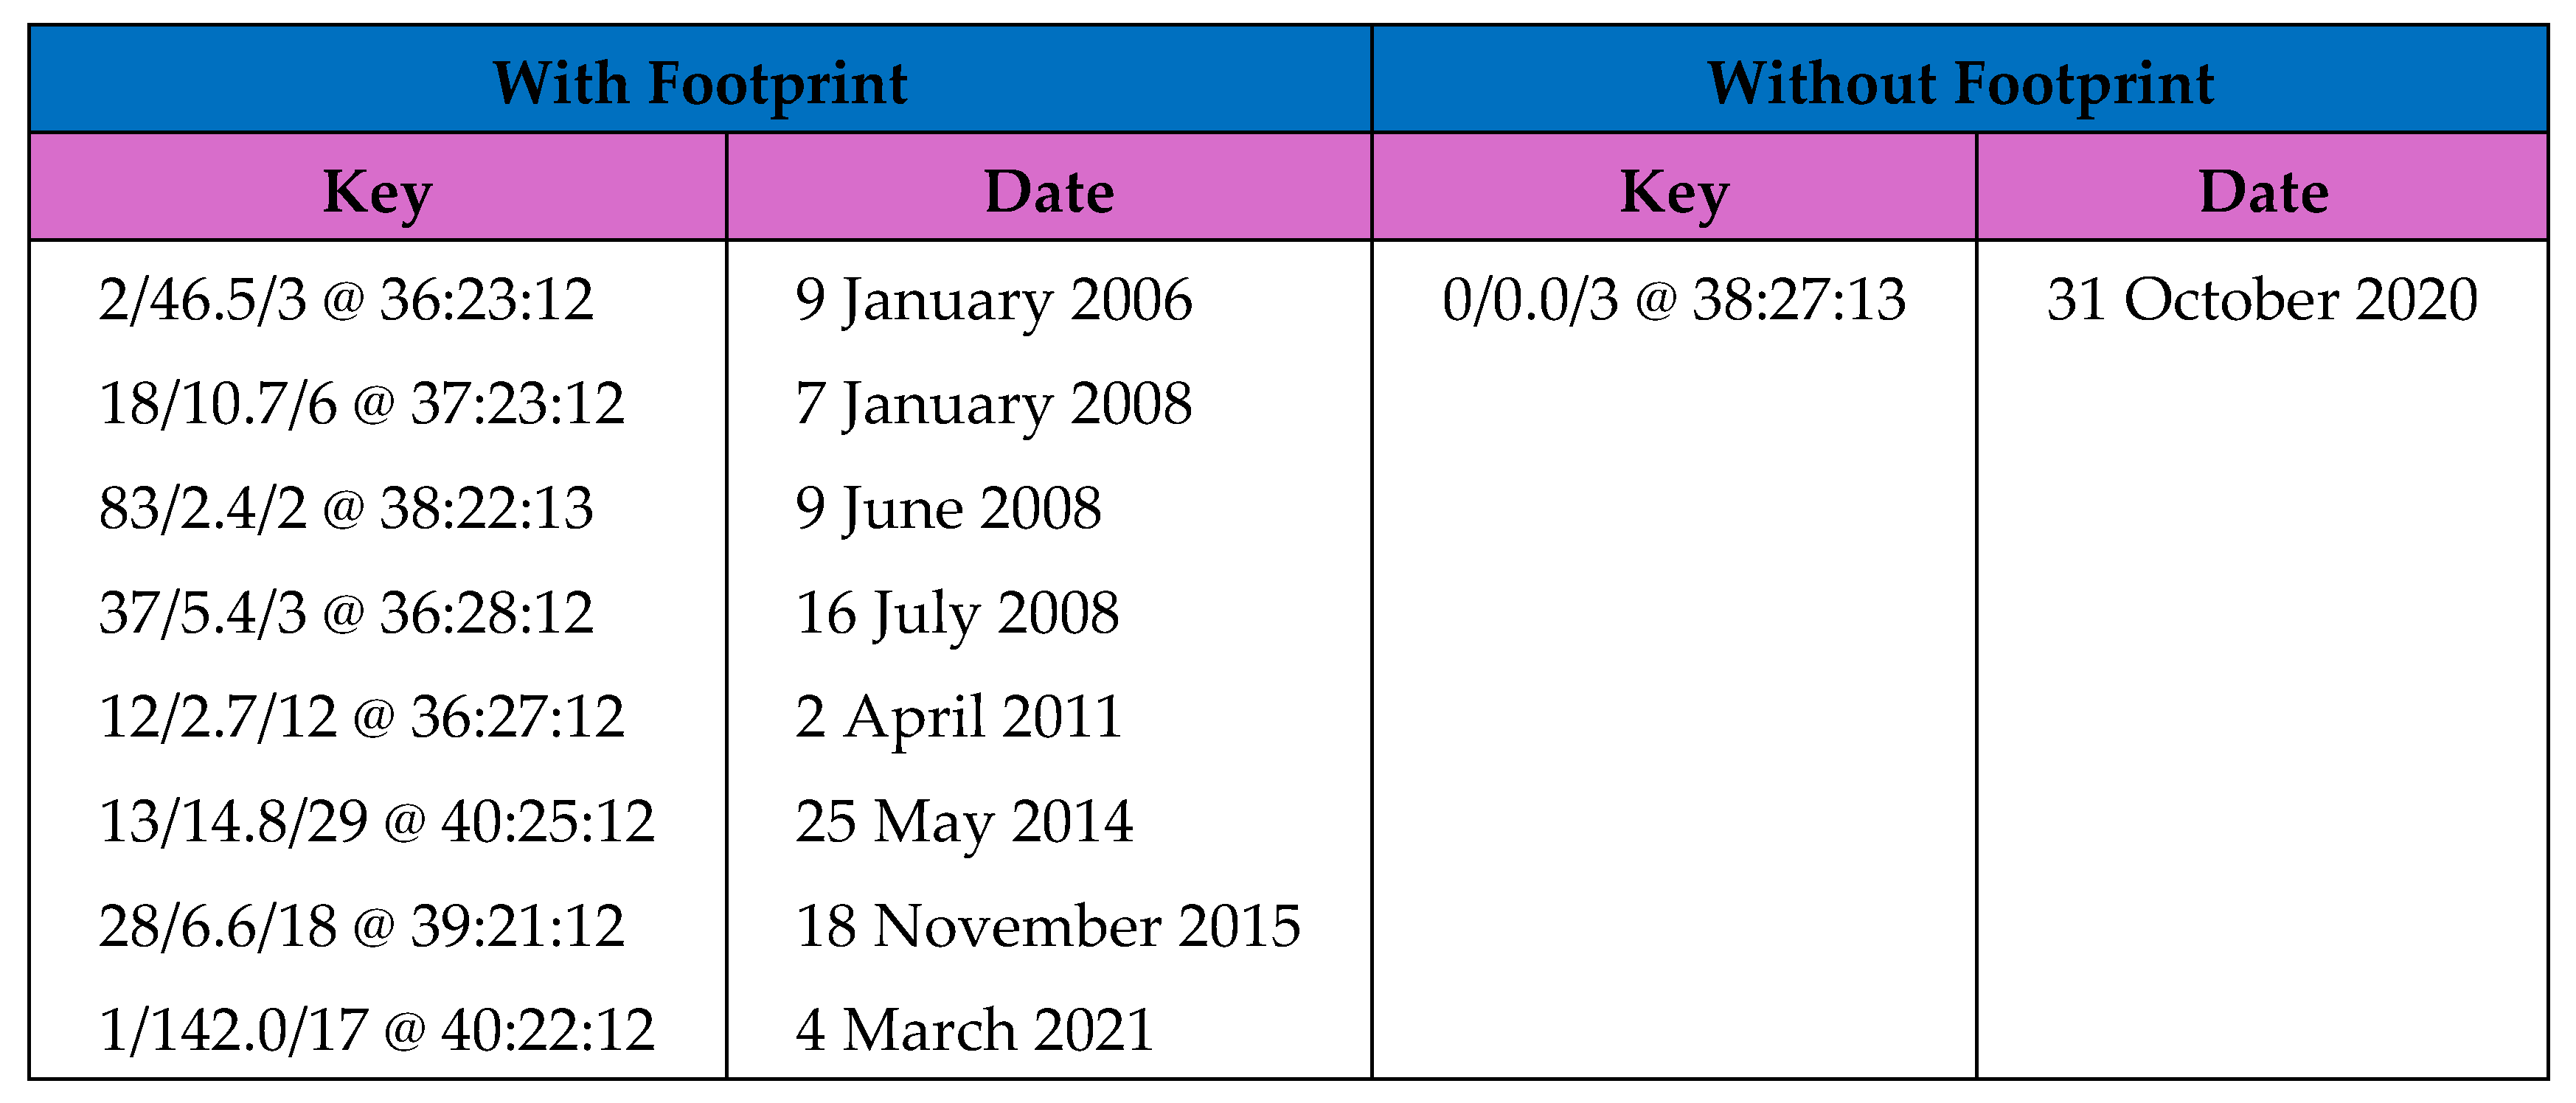
Figure 2.
Predictions for the Greece Dataset.
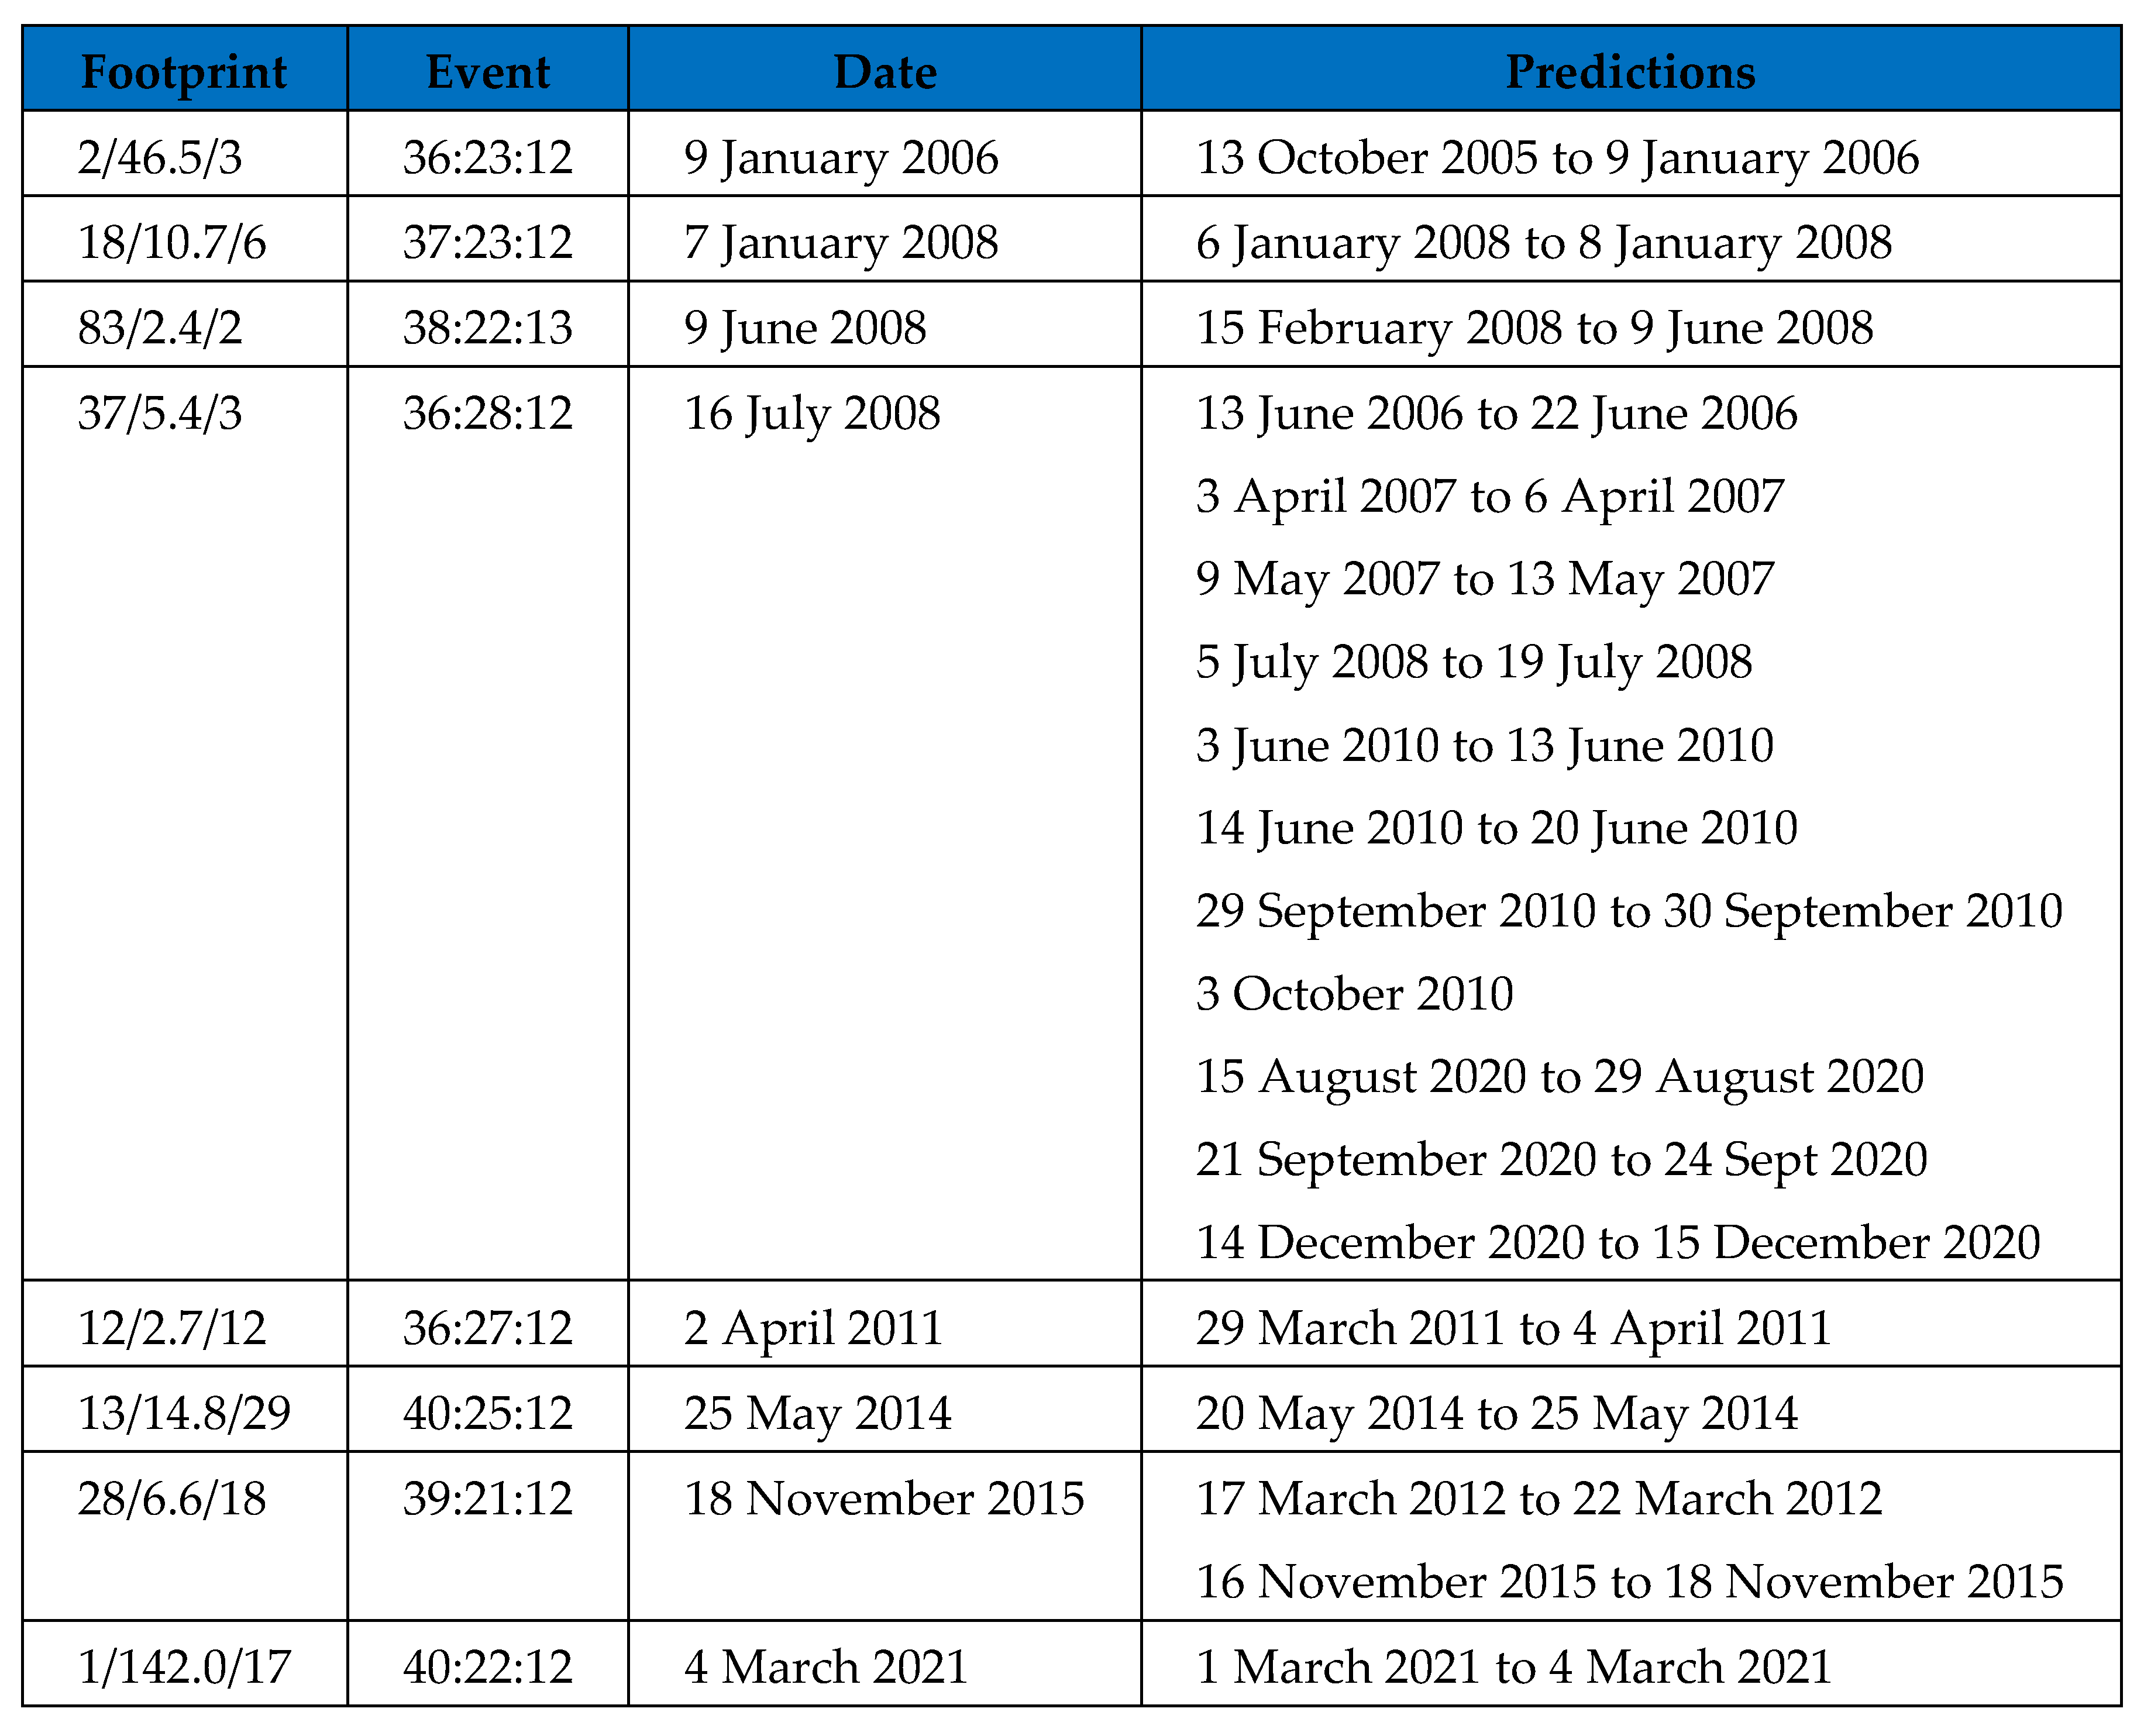
Figure 3.
Significant events for the USA Dataset – Footprint at Event.
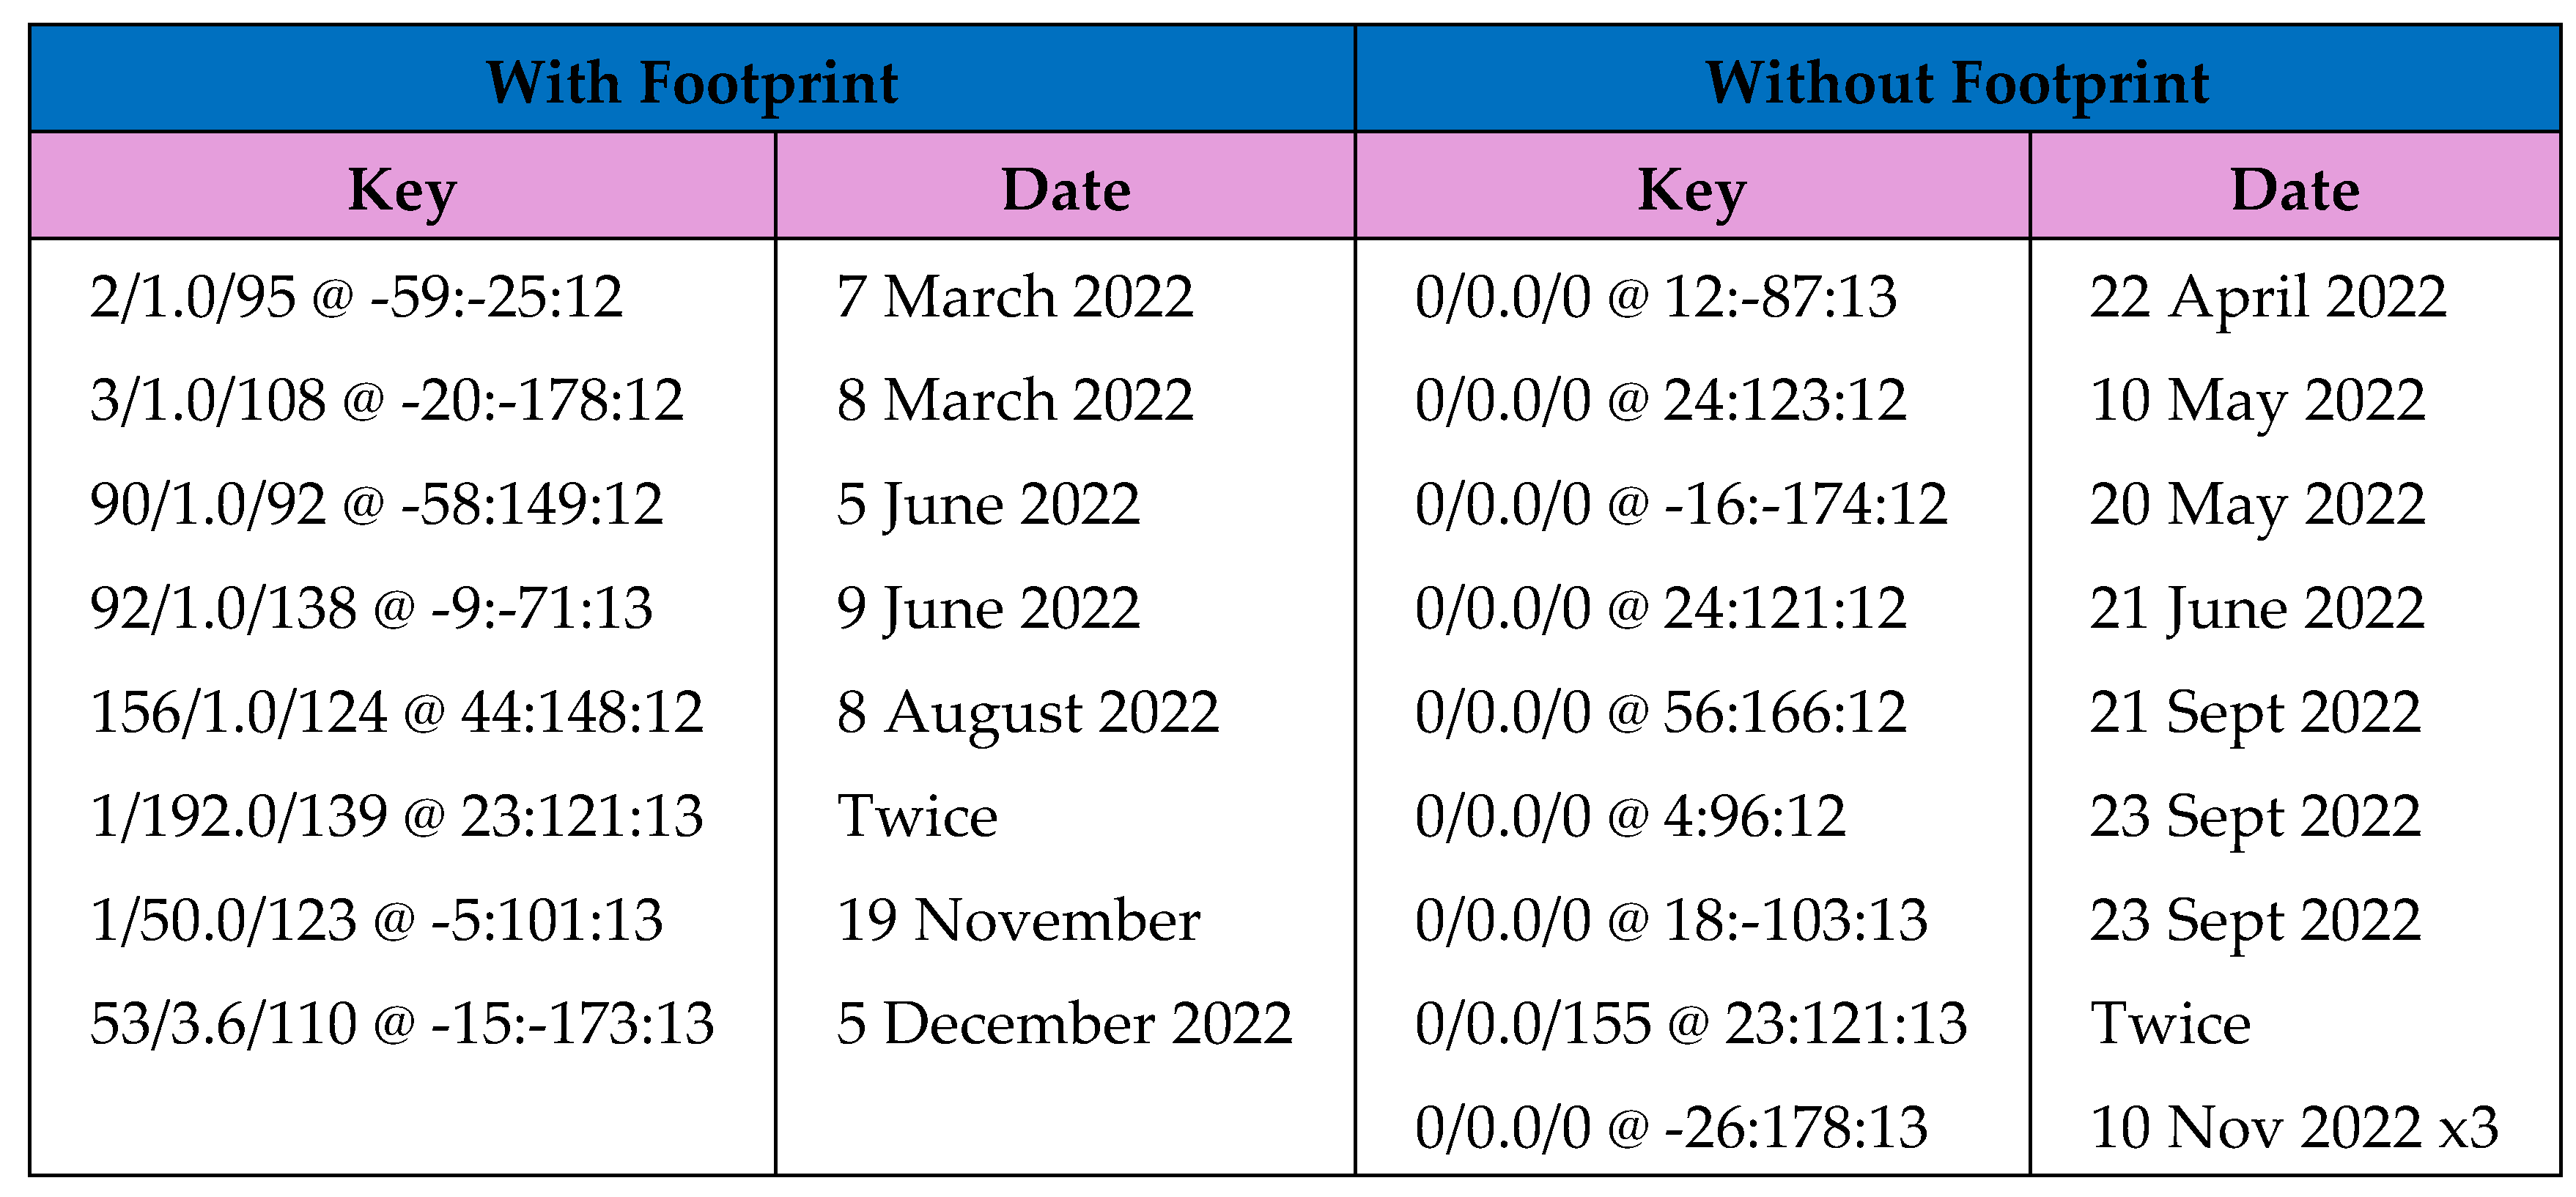
Figure 4.
Predictions for the USA Dataset.
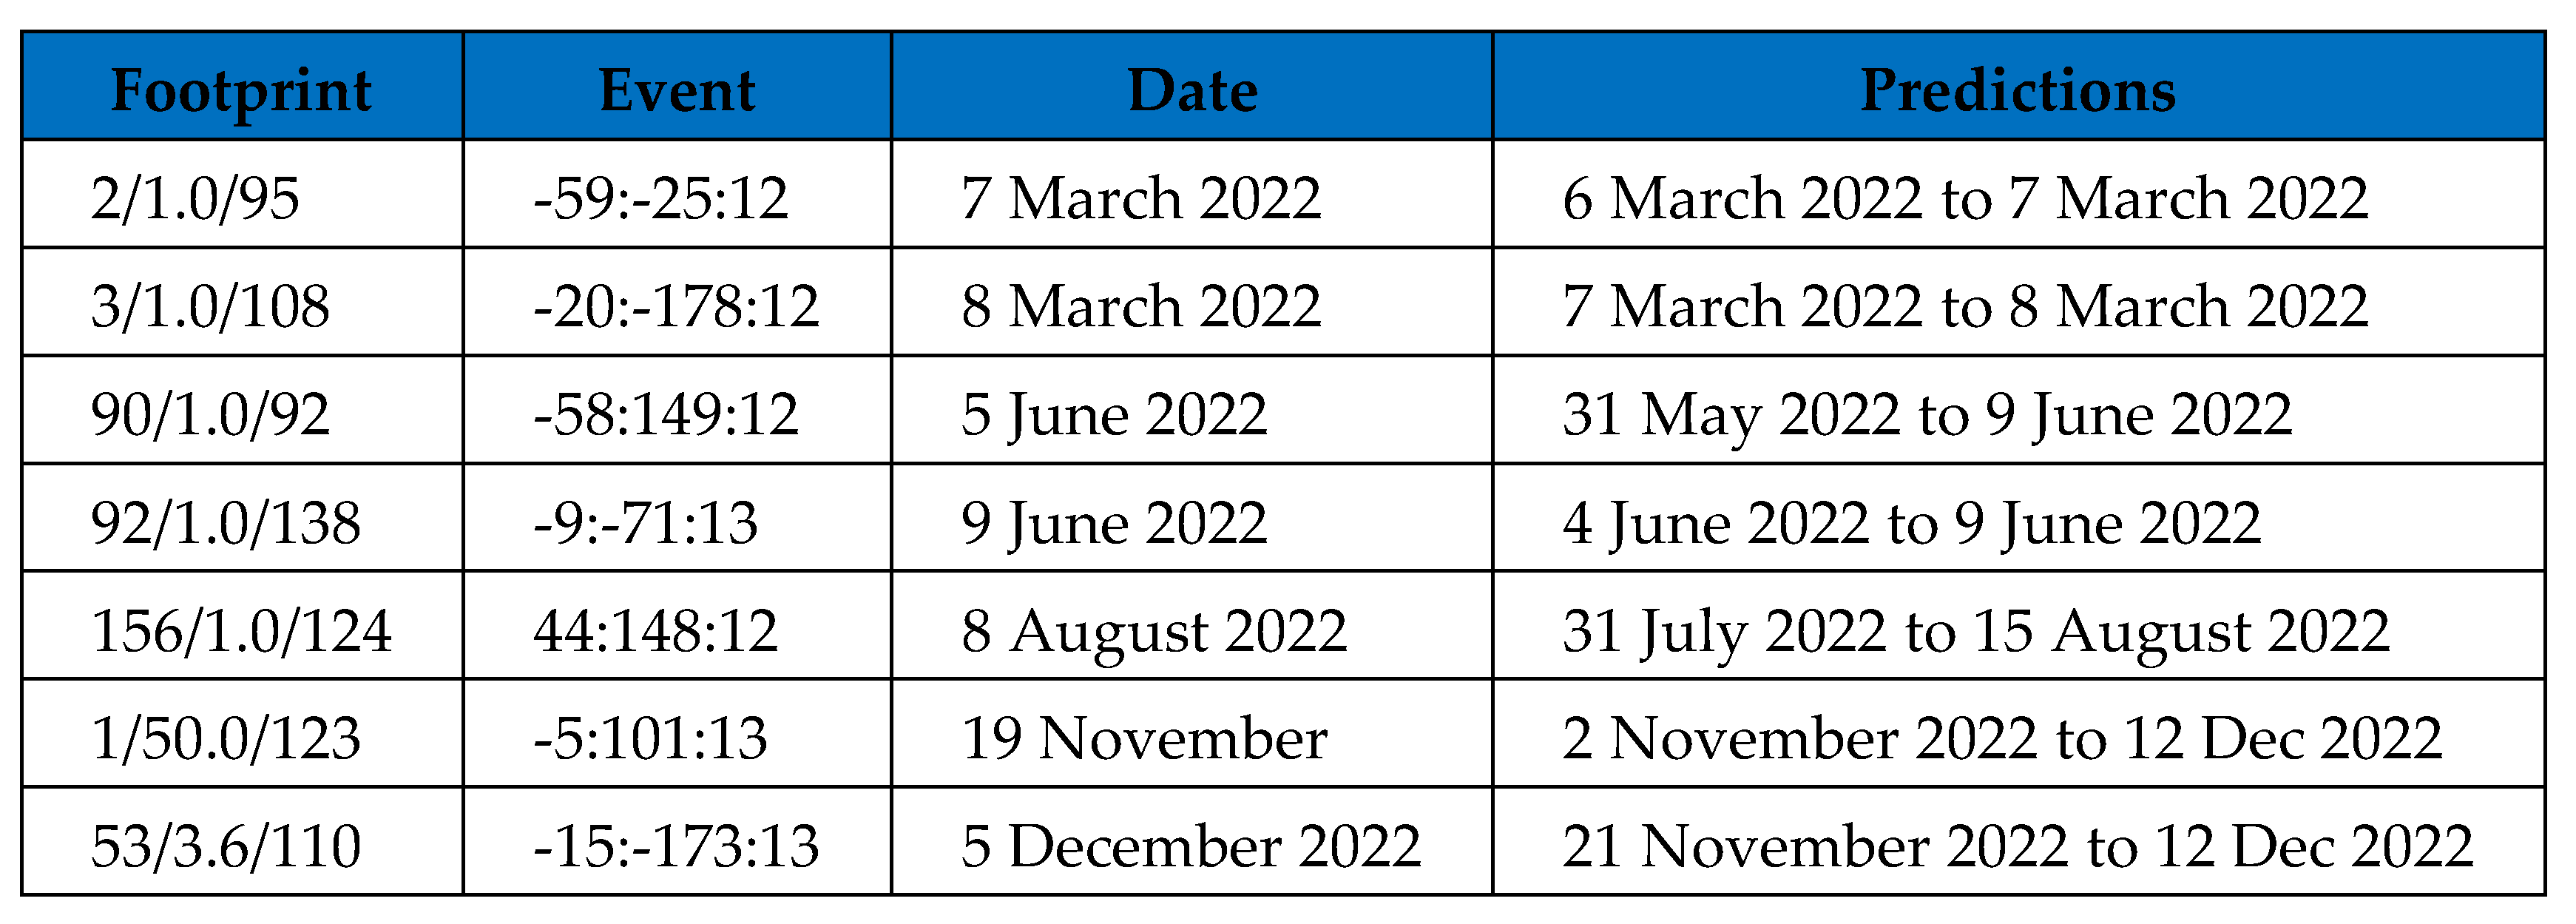

Table 1.
Count reinforcement when updating for individual variables.
| A | B | C | D | E | F | G | |
|---|---|---|---|---|---|---|---|
| I | 5 | 4 | 4 | 4 | 4 | 3 | 3 |
Table 2.
Display of the reinforcement between pattern presentations grouping A, B, C and D, plus E, F and G, with a single inter-pattern link A-E.
Table 2.
Display of the reinforcement between pattern presentations grouping A, B, C and D, plus E, F and G, with a single inter-pattern link A-E.
| A | B | C | D | E | F | G | |
|---|---|---|---|---|---|---|---|
| A | x | 4 | 4 | 4 | 2 | 1 | 1 |
| B | 4 | x | 4 | 4 | 1 | 0 | 0 |
| C | 4 | 4 | x | 4 | 1 | 0 | 0 |
| D | 4 | 4 | 4 | x | 1 | 0 | 0 |
| E | 2 | 1 | 1 | 1 | x | 3 | 3 |
| F | 1 | 0 | 0 | 0 | 3 | x | 3 |
| G | 1 | 0 | 0 | 0 | 3 | 3 | x |
Table 3.
Example of earthquake events.
| Date | Token | Longitude | Latitude | Magnitude |
| 1 | A | 1 | 1 | 1 |
| 1 | B | 1 | 2 | 1 |
| 2 | C | 2 | 1 | 2 |
| 2 | A | 1 | 1 | 2 |
| 2 | B | 1 | 2 | 1 |
| 2 | A | 1 | 1 | 1 |
Table 4.
Frequency Grid for the Earthquake Events. Clusters are A:1, B:1 and A:2, C:2.
| A:1 | A:2 | B:1 | B:2 | C:1 | C:2 | |
| A:1 | x | 0 | 2 | 0 | 0 | 0 |
| A:2 | 0 | x | 0 | 0 | 0 | 1 |
| B:1 | 2 | 0 | x | 0 | 0 | 0 |
| B:2 | 0 | 0 | 0 | x | 0 | 0 |
| C:1 | 0 | 0 | 0 | 0 | x | 0 |
| C:2 | 0 | 1 | 0 | 0 | 0 | x |
Table 5.
Set of values to describe an event.
| Day Count | Number of days over which the measurements took place. |
| Average Day Gap | Average gap between days that contained events in that time-frame. |
| Average Event Count | Average number of events that occurred on one of those days. |
Table 6.
Summary of the test results for the 4-component key (Day Count / Av Day Gap / Av Event Count / Av Continuous Day).
Table 6.
Summary of the test results for the 4-component key (Day Count / Av Day Gap / Av Event Count / Av Continuous Day).
| Dataset | Magnitude | % with Footprint | % Prediction with Result | % Prediction All |
|---|---|---|---|---|
| Greece | 6+ | 88 | 81 | 72 |
| Greece | 5.5+ | 95 | 75 | 71 |
| Greece | 5+ | 94 | 57 | 54 |
| USA | 6+ | 47 | 88 | 41 |
| USA | 5.5+ | 41 | 100 | 36 |
| USA | 5+ | 33 | 89 | 30 |
Disclaimer/Publisher’s Note: The statements, opinions and data contained in all publications are solely those of the individual author(s) and contributor(s) and not of MDPI and/or the editor(s). MDPI and/or the editor(s) disclaim responsibility for any injury to people or property resulting from any ideas, methods, instructions or products referred to in the content. |
© 2024 by the authors. Licensee MDPI, Basel, Switzerland. This article is an open access article distributed under the terms and conditions of the Creative Commons Attribution (CC BY) license (http://creativecommons.org/licenses/by/4.0/).
Copyright: This open access article is published under a Creative Commons CC BY 4.0 license, which permit the free download, distribution, and reuse, provided that the author and preprint are cited in any reuse.


