
Submitted:
07 July 2023
Posted:
10 July 2023
You are already at the latest version
Preprints on COVID-19 and SARS-CoV-2
Abstract
(1) Background: Since the onset of the SARS-CoV-2 pandemic, seven epidemic waves have been described in Spain. Our objective was to study mortality and severity, and associated factors in our hospitalized patients; (2) Method: Retrospective cohort study was conducted on COVID-19 patients admitted to the Hospital de Fuenlabrada (Madrid, Spain) from the beginning of the pandemic until December 31, 2022; (3) Results: A total of 5,510 admissions for COVID-19 were recorded. First wave accounted for 1,823 (33%) and exhibited the highest proportion of severe patients (lowest mean oxygen saturation, 88.2%; elevated levels of CRP, IL-6, D-dimer and ferri-tin), but a below-average percentage of intubated patients (5% vs. 6.5%). Overall mortality rate was 10.3%, higher during the first wave (11.5%) and the two winter waves (third: 11.3%, sixth: 12%), although the first wave represented 39% of the total. Variables associated with mortality were age (OR 1.08,1.07-1.09), need for high-flow oxygen (OR 6.10,4.94-7.52), oncological disease (OR 1.88,1.53-2.60), dementia (OR 1.82,1.2-2.75), Charlson index (OR 1.38,1.31-1.47), and maxi-mum IL-6 levels (OR 1.001,1.000-1.001); (4) Conclusions: Variables associated with mortality in-cluded age, comorbidity, respiratory failure, and inflammation. Differences on baseline charac-teristics of patients admitted explained differences on mortality in each wave
Keywords:
COVID-19
; SARS-CoV-2
; waves
; mortality
1. Introduction
COVID-19 is the disease caused by the novel coronavirus known as SARS-CoV-2. The World Health Organization (WHO) first became aware of its existence on December 31, 2019, when informed of a group of cases of "viral pneumonia" reported in Wuhan, People’s Republic of China [1]. On March 11, 2020, as the virus progressively spread worldwide, the WHO declared it a pandemic [2], which on May 05, 2023, was declared over. Until June 14, 2023, a total of 767,984,989 cases and 6,943,390 deaths had been reported worldwide [3], with Spain ranking 13th in the world in reported cases (13,890,555) and 15th in the number of deaths (121,416) [3]. Out of the total cases in our country, the Community of Madrid accounted for 14.4% according to the latest report from the Spanish Ministry of Health [4].
However, the incidence during this period has not been uniform, with up to seven epidemic waves declared by the Spanish Ministry of Health based on variations in the 14-day cumulative incidence [5]. Several factors have influenced the emergence of these waves. For example, on March 14, 2020, a state of alarm and strict lockdown measures were decreed nationwide, which were not lifted until June 21, 2020. Since then, isolation measures have varied depending on each Autonomous Community, with no new mobility restrictions reimposed in the Community of Madrid. On the other hand, the level of immunity to the virus, whether natural or through vaccination, has varied throughout this period. In Spain, the vaccination program began on December 27, 2020 [6], during the peak of the third wave. According to official data from the Spanish Ministry of Health as of January 5, 2023, 95.5% of the population in the Community of Madrid had completed vaccination [8]. Finally, three variants of concern (VOC), according to the WHO’s definition [7], have been dominant in our country since the beginning of the pandemic. In early 2021, B.1.1.7 (alpha, UK variant) displaced the original strain until approximately week 21 of that year, when it was quickly replaced by B.1.617.2 (delta, Indian variant), which remained the most common one until the final weeks of the same year, when it was replaced by B.1.1.529 (omicron), whose various lineags are still predominant [8].
Our hypothesis is that each wave exhibited a series of peculiarities, some measurable and others not, that could explain clinical and outcome differences between them, thus justifying the separate analysis of the waves. These peculiarities included the total number of available beds in the hospital and in the intensive care unit (ICU), circulating variants, vaccination status, use of masks and other isolation measures, seasonality, evidence regarding different treatments, and availability of diagnostic tests. This aspect was already observed in the first two waves [9,10] and has been corroborated in other countries that have evaluated multiple waves [11] with a different dynamic than our own environment. Our main objective was to determine the overall mortality and severity of COVID-19 in each wave, and identify factors associated with both parameters of COVID-19 during the period.
2. Materials and Methods
2.1. Study Design and Setting
Retrospective cohort study, from March 1, 2020, to December 31, 2022, carried out at the Hospital Universitario de Fuenlabrada. This is a second-level hospital that serves a population of approximately 220,000 people in the south of Madrid. Since its opening in 2004, it has been the referral hospital for patient admissions in this area [12], including all those diagnosed with COVID-19. The first case in Fuenlabrada was admitted to the hospital on March 4, 2020, and as of January 3, 2023, the total number of confirmed cases in the area was 11,547 [13].
2.2. Subjects
All adult patients (over 16 years old) admitted to the Hospital Universitario de Fuenlabrada with a diagnosis of SARS-CoV-2 infection (COVID-19) during the study period were included. The diagnosis of COVID-19 requiered the presence of compatible symptoms and microbiological confirmation (positive SARS-CoV-2 antigen test or molecular detection), except in the early months of the pandemic, when tests were not available for most patients, so the diagnosis was solely clinical. From June 2020 to April 2022, the strategy of testing all hospitalized patients, regardless of reason for admission, was implemented, since it was challenging to determine whether the patients’ symptoms were attributable to SARS-CoV-2 infection or not. Clinical information was collected using clinical forms by the investigators. Patients classified as "asymptomatic COVID-19" despite a positive test were not included in the study as their forms were not collected. From April 2022 to December 2022, diagnostic tests for microbiological confirmation were only performed in patients admitted with COVID-19 symptoms.
During the pandemic, our hospital developed a research tool to integrate all relevant clinical information of these patients into a database (FUENCOVID), which now enables us to answer the research questions of this project. This tool collects information from clinical forms, pharmacy forms (on treatment), and laboratory data.
2.3. Definition of Epidemic Waves
The Spanish Ministry of Health has accurately established the dates of seven epidemic waves based on variations in the 14-day cumulative incidence [5]. For our analysis, we decided to adapt the wave dates by considering the increase in the number of weekly COVID-19 admissions as the turning point between waves, instead of relying solely on the 14-day incidence. We believe this better reflects the impact in the hospital, as the incidence can be influenced by the number of tests performed and the 14-day lag for reporting. This definition was established before conducting the descriptive study and statistical analyses.
2.4. Variables
The main outcome variables were the need for mechanical ventilation upon admission to the hospital and any cause mortality at 3 months after admission. The following variables were recorded: admission date (defining COVID-19 wave); sociodemographic variables (age, gender, place of birth); comorbidities, including hypertension, diabetes, cardiopathy, chronic obstructive pulmonary disease ( COPD), asthma, oncological disease, HIV, dementia, and Charlson comorbidity index; vaccination status at the time of admission; disease severity, determined by chest X-ray at admission (normal/unilateral/bilateral pneumonia), oxygen saturation in the emergency department and throughout admission (absolute value and categorical: less than 94%), maximum oxygen support required during admission (no oxygen/nasal cannula or ventiMask/reservoir mask or high-flow nasal cannula/intubation), length of hospitalization and ICU stay; levels of C-reactive protein (CRP), interleukin 6 (IL-6), D-dimer, and ferritin; and use of any of these medications: remdesivir, tocilizumab, baricitinib, corticosteroids, and prophylactic low molecular weight heparin (LMWH) [14].
2.5. Statistics
The statistical software package SPSS 25.0 was used for the analysis. Categorical variables were presented as absolute values and percentages. They were compared using the chi-square test or Fisher’s exact test (if any observed frequency was less than 5 or 20%).
Quantitative variables were assessed for normal distribution using the Kolmogorov-Smirnov test. Normally distributed variables were described using the mean and standard deviation, while non-normally distributed variables were described using the median and interquartile range. Normally distributed variables were compared using the ANOVA test. Non-normally distributed variables were compared using the Kruskal-Wallis test.
A multivariate logistic regression analysis was conducted for the outcome variables "overall mortality at 3 months" and "need for mechanical ventilation," including the described predictive variables. An additional model was calculated without considering “maximum IL-6 value”, since the high number of missing cases for this variable. .
3. Results
3.1. Duration of the epidemic waves
Based on the increase in the number of weekly admissions, the following dates were defined for each epidemic wave (Figure 1).
First wave: March 4, 2020, to July 2, 2020, with a peak on March 31, 2020. Second wave: July 15, 2020, to November 25, 2020, with a peak on September 25, 2020. Third wave: November 26, 2020, to February 28, 2021, with a peak on January 25, 2021. Fourth wave: March 1, 2021, to June 30, 2021, with a peak on April 16, 2021. Fifth wave: July 1, 2021, to September 30, 2021, with a peak on August 23, 2021. Sixth wave: October 1, 2021, to April 4, 2022, with a peak on January 17, 2022. Seventh wave: April 5, 2022, to December 31, 2022, with a peak on June 28, 2022. t waves.
3.2. Description:
There were a total of 5,510 COVID admissions, corresponding to 5,001 patients with 509 readmissions (9%), regardless of the reason for readmission (Table 1). Nearly 50% of the total admissions occurred in the first two waves, while hospitalizations decreased in subsequent waves.
3.2.1. Descriptive analysis of patient characteristics by waves (excluding re-admissions) (Table 2, Table 3, Table 4 and Table 5)
Mean age was significantly higher in the last two waves (Table 2). Highest proportion of immigrant patients occurred in the second and fifth waves. Mean age of non-immigrants was higher: 66.6 years, compared to 50.4 for Latin Americans, and 52.3 for North Africans.

Table 2.
Sociodemographic characteristics by epidemic wave.
| Wave | First | Second | Third | Fourth | Fifth | Sixth | Seventh | Total | p |
|---|---|---|---|---|---|---|---|---|---|
| Patients1 | 1735 (35%) | 900 (18%) | 823 (17%) | 414 (8%) | 291 (6%) | 441 (8%) | 397 (8%) | 5001 | |
| Male sex1 | 957 (55%) | 464 (52%) | 472 (57%) | 232 (56%) | 163 (52%) | 228 (52%) | 200 (50%) | 2743 (54%) | 0.073 |
| Age2 | 63.3 (0.36) | 60.3 (0.57) | 64.5 (0.57) | 60.2 (0.74) | 55.3 (1.2) | 67.1 (0.82) | 76.5 (0.74) | 63.6 (0.24) | <0.001 |
| Place of birth | <0.001 | ||||||||
| Spain1 | 1435 (84%) | 600 (68%) | 700 (87%) | 330 (80%) | 188 (66%) | 368 (85%) | 382 (96%) | 4003 (81%) | |
| Latin America1 | 168 (10%) | 156 (17%) | 63 (8%) | 49 (12%) | 30 (11%) | 24 (6%) | 6 (2%) | 495 (10%) | |
| North Africa1 | 26 (2%) | 66 (7%) | 16 (2%) | 14 (3%) | 25 (8%) | 12 (3%) | 3 (1%) | 162 (3%) |
1 n (%). 2 Years: Mean (Standard Deviation of the mean).
Table 3.
Clinical indicators by waves.
| Wave | First | Second | Third | Fourth | Fifth | Sixth | Seventh | Total | p |
|---|---|---|---|---|---|---|---|---|---|
| Patients | 1735 (35%) | 900 (18%) | 823 (17%) | 414 (8%) | 291 (6%) | 441 (8%) | 397 (8%) | 5001 | |
| Length of total stay1 | 10.8 (0.28) | 10.7 (0.46) | 11.5 (0.50) | 12.0 (0.79) | 10.6 (0.70) | 9.8 (0.61) | 7.4 (0.66) | 10.7 (0.19) | <0.001 |
| Length of ICU stay1 | 19.4 (1.99) | 21.6 (2.23) | 22.6 (2.52) | 24.2 (3.12) | 16.8 (2.54) | 19.4 (3.16) | 18.1 (4.91) | 20.8 (1.02) | 0.611 |
| Delay until ICU admission1 | 4.70 (0.61) | 2.79 (0.38) | 3.91 (0.53) | 2.72 (0.44) | 2.20 (0.54) | 2.92 (0.72) | 1.02 (0.61) | 3.40 (0.23) | 0.009 |
1 Days: mean (standard deviation of the mean).
Table 4.
Comorbidities by waves.
| Wave | First | Second | Third | Fourth | Fifth | Sixth | Seventh | Total | p |
|---|---|---|---|---|---|---|---|---|---|
| Patients | 1735 (35%) | 900 (18%) | 823 (17%) | 414 (8%) | 291 (6%) | 441 (8%) | 397 (8%) | 5001 | |
| Charlson index1 | 1.23 (0.05) | 1.21 (0.07) | 1.35 (0.08) | 1.12 (0.10) | 1.24 (0.13) | 2.02 (0.13) | 2.31 (0.16) | 1.36 (0.03) | <0.001 |
| Hypertension2 | 816 (47%) | 371 (41%) | 425 (52%) | 185 (45%) | 114 (39%) | 253 (57%) | 150 (68%) | 2314 (48%) | <0.001 |
| Diabetes2 | 221 (13%) | 96 (11%) | 113 (14%) | 33 (8%) | 26 (9%) | 58 (13%) | 48 (22%) | 595 (12%) | <0.001 |
| Cardiopathy2 | 77 (4%) | 42 (5%) | 42 (5%) | 13 (3%) | 19 (7%) | 21 (5%) | 24 (11%) | 238 (5%) | 0.002 |
| COPD2,3 | 171 (10%) | 72 (8%) | 75 (9%) | 32 (8%) | 23 (7%) | 62 (14%) | 88 (35%) | 523 (11%) | <0.001 |
| Asthma2 | 158 (9%) | 66 (7%) | 78 (10%) | 31 (8%) | 24 (8%) | 44 (10%) | 30 (13%) | 431 (9%) | 0.148 |
| Cancer2 | 323 (19%) | 155 (17%) | 149 (18%) | 57 (14%) | 40 (14%) | 119 (27%) | 109 (45%) | 952 (20%) | <0.001 |
| Dementia2 | 51 (3%) | 30 (3%) | 27 (3%) | 12 (3%) | 10 (3%) | 34 (8%) | 52 (21%) | 216 (5%) | <0.001 |
| PLHIV4 | 5 | 2 | 1 | 2 | 0 | 1 | 3 | 14 (0.3%) | 0.228 |
1 Units: mean (standard deviation of the mean). 2 n (%). 3 COPD: chronic obstructive pulmonary disease. 4 PLHIV: people living with human immunodeficiency virus.
Table 5.
Clinical variables by waves.
| Wave | First | Second | Third | Fourth | Fifth | Sixth | Seventh | Total | p |
|---|---|---|---|---|---|---|---|---|---|
| Patients | 1735 (35%) | 900 (18%) | 823 (17%) | 414 (8%) | 291 (6%) | 441 (8%) | 397 (8%) | 5001 | |
| Oxygen saturation on admission1 | 92.7 (0.15) | 93.9 (0.14) | 92.8 (0.21) | 93.2 (0.21) | 93.3 (0.36) | 93.3 (0.31) | 93.7 (0.23) | 93.1 (0.08) | <0.001 |
| Worst oxygen saturation1 | 88.2 (0.19) | 89.7 (0.21) | 88.5 (0.28) | 89.9 (0.26) | 90.3 (0.37) | 89.8 (0.33) | 90.7 (0.37) | 89.1 (0.11) | <0.001 |
| O2 requirements: None2 | 415 (24%) | 266 (30%) | 165 (20%) | 86 (21%) | 50 (18%) | 114 (26%) | 56 (30%) | 1152 (25%) | <0.001 |
| Low O2 flow2 | 869 (51%) | 434 (50%) | 430 (53%) | 214 (53%) | 156 (55%) | 234 (53%) | 118 (64%) | 2455 (52%) | |
| High O2 flow2 | 321 (19%) | 107 (12%) | 151 (19%) | 53 (13%) | 42 (15%) | 64 (15%) | 6 (3%) | 744 (16%) | |
| Mechanical ventilation2 | 93 (6%) | 67 (8%) | 64 (8%) | 48 (12%) | 34 (12%) | 28 (6%) | 5 (3%) | 339 (7%) | |
| CRP1,3 | 12.7 (0.24) | 10.5 (0.31) | 10.8 (0.30) | 11.1 (0.43) | 10.6 (0.53) | 9.6 (0.41) | 7.7 (0.57) | 11.2 (0.13) | <0.001 |
| IL-61,4 | 378 (55) | 258 (31) | 248 (22) | 270 (39) | 313 (52) | 185 (30) | 32 (8) | 268 (15) | 0.005 |
| DD1,5 | 3764 (265) | 2524 (199) | 3471 (385) | 3370 (559) | 2637 (372) | 3132 (327) | 2097 (719) | 3276 (141) | <0.001 |
| Ferritin1,6 | 964 (74) | 920 (55) | 913 (41) | 961 (51) | 886 (81) | 752 (46) | 375 (55) | 887 (23) | 0.039 |
| Remdesivir2 | 0 | 15 (2%) | 9 (1%) | 2 | 0 | 1 | 9 (5%) | 36 (1%) | <0.001 |
| Corticosteroids2 | 715 (41%) | 609 (68%) | 679 (83%) | 324 (78%) | 236 (81%) | 337 (76%) | 123 (69%) | 3023 (63%) | <0.001 |
| Tocilizumab2 | 257 (15%) | 261 (29%) | 347 (42%) | 163 (39%) | 102 (35%) | 100 (23%) | 9 (5%) | 1239 (26%) | <0.001 |
| Baricitinib2 | 17 (1%) | 5 (15%) | 6 (1%) | 10 (2%) | 46 (16%) | 57 (13%) | 3 (2%) | 144 (3%) | <0.001 |
| pLMWH2,7 | 1450 (84%) | 801 (89%) | 750 (91%) | 398 (87%) | 284 (89%) | 365 (83%) | 121 (68%) | 4103 (86%) | <0.001 |
| Vaccinated2 | 0 | 0 | 1 (0.1%) | 20 (5%) | 112 (39%) | 328 (74%) | 159 (88%) | 620 (13%) | <0.001 |
1. Mean (Standard Deviation of the mean). 2 n (%) 3 C-reactive protein highest level, mg/dl 4 Interleukin 6 highest level, pg/ml 5 D-dimer highest level, ng/ml 6 Ferritin highest level, ng/ml 7 Prophylactic low molecular weight heparin.
Regarding some clinical indicators (Table 3), overall mean length of stay for patients was 10.7 days, being higher in the third and fourth waves and lower in the last two waves. Mean length of stay in the ICU showed no differences between waves. Patients took more days to be admitted to the ICU in the first wave (4.7 days).
The burden of comorbidity was higher in the sixth and seventh waves (Table 4). Only 14 people living with HIV (PLHIV) required admission, and only 2 needed mechanical ventilation; 1 of them deceased, who was diagnosed during the hospitalization with less than 50 CD4 count.
Patients in the first and third waves had worst mean oxygen saturations at admission and during the entire length of their hospital stay (Table 5). This was associated with a higher need of high-flow oxygen in these two waves, but not mechanical ventilation. Inflammatory parameters were higher in the first wave (Table 5), but corticosteroids and tocilizumab were less used in this wave; both drugs were administered to a higher proportion of patients during the third. The use of remdesivir was very low until the seventh wave (Table 5). Regarding patients with a maximum CRP greater than 7.5 mg/dl, 73% received steroids and 36% received tocilizumab. Regarding patients with IL-6 levels greater than 40 pg/ml before treatment, 95% received steroids and 100% received tocilizumab.
3.3. Rates of mortality and mechanical ventilation
Out of the 5,510 admissions, 358 required mechanical ventilation (6.5% of the total admissions), and 514 patients (10.3%) died within 3 months of admission (Table 6). The lowest proportions of intubated patients were observed in the first (only 5%, presumably due to a lack of ICU beds) and seventh waves (only 1%, probably due to the lower severity of the disease). The fourth and fifth waves were the only ones in which the proportion of intubated patients was higher than the proportion of deaths. The highest mortality occurred in the first wave and in the two winter waves (third and sixth), although the first one accounted for 39% of the total of deaths.
3.4. Factors associated with COVID-19 mortality
A total of 5,001 patients were analyzed, although the final model included 4,532 patients (469 lost to follow-up). Table 7 shows the results of the multivariate analysis excluding the maximum IL-6 value. When including it, the model consisted of 2,328 patients (IL-6 was not assessed in 2,673 subject), and the same variables were maintained except for the exclusion of CRP and the inclusion of IL-6, both as continuous variables (HR 1.001, CI 95% 1.000-1.001, per 1.0 pg/ml).
The following variables were not included in the final model due to lack of statistical significance in the univariate analysis (p>0.1): COVID-19 wave, birthplace, hypertension, diabetes, cardiopathy, COPD, asthma, chest X-ray at admission, oxygen saturation below 94% during hospitalization, D-dimer values, remdesivir, tocilizumab, corticosteroids, baricitinib, and full vaccination.
Mean age of deceased patients was higher, 77.3 years compared to 61.0 for non-deceased patients (p<0.001). Tocilizumab associated to survival only in those patients with overall oxygen saturation below 94% (p=0.008, HR 0.20, CI 0.06-0.66).
3.5. Factors associated with COVID-19 mechanical ventilation
A total of 5,001 patients were analyzed, although the final model included 4,782 patients (219 lost). Table 8 shows the results of the multivariate analysis excluding the IL-6 value. When including it, the model consisted of 2,328 patients (IL-6 was not assessed in 2,673 subject, the same variables were retained, along with the IL-6 level (continuous) (HR 1.001, CI 95% 1.000-1.001 per 1.0 pg/ml).
The variable "dementia" nearly reached statistical significance: HR 0.14 (CI 95% 0.02-1.14). The rest of the variables mentioned in the previous section were not included in the final model as they did not reach statistical significance
4. Discussion
The analysis of the characteristics of patients hospitalized with COVID -19 in a single institution according to the timing (waves) gives a global view of the pandemic which is worth considering. The number of patients gradually decreased in each wave until the fifth, mainly due to to progressive immunization. In the first wave, hospitals and ICUs were overwhelmed, and the entire hospital focused on COVID-19, suspending any other activities [5]. Our center, which normally has an average of 100 internal medicine patients and 12 ICU beds, reached over 600 COVID-19 patients and 50 ICU beds. This wave accounted for 35% of the total patients, 39% of all deaths and 27% of intubated patients, and oxygen saturations were the worst. Nevertheless, intubation rate was only 5%, less than half compared to the fifth wave, probably due to the fact that many patients, who in the next waves would have been intubated, did not receive mechanical ventilation given the lack of ICU beds. This could explain why this wave had the longest delay in ICU admission. Although the highest levels of inflammatory parameters were observed during the first wave, the administration of corticosteroids and tocilizumab were the lowest, because of the absence of robust evidence about their effectiveness and the low availability of tocilizumab. Despite that, the proportions of corticosteroid, tocilizumab, and prophylactic LMWH use were higher than those reported in the same period in our country [15], and the overall mortality among our patients was lower, with similar proportions of patients over 80 and 65 years in both series.
Second wave stood out by reopening measures, taken before summer 2020, and hospital trying to resume its regular activities with flexible COVID-19 and non-COVID-19 areas. Like the fifth wave, which occurred after the following summer ("summer waves"), patients were younger, with lower Charlson score, a higher proportion of immigrant patients, and the highest average oxygen saturation in the emergency department. Undoubtedly, there was a greater availability of hospital resources then, compared to the beginning of the pandemic. The main difference between the two “summer waves” was the mortality rate, much higher in the second than in the fifth wave, when a significant portion of the population was already vaccinated.
The fourth wave was associated to the emergence of the alpha variant, with ICUs still at full capacity after the third wave. A few months later, in June, the delta variant arrived and triggered the fifth wave (in summer) [8]. These waves had a higher progression to respiratory failure, reflected in the increased use of corticosteroids, tocilizumab, and baricitinib, as well as a higher percentage of ICU admissions with the lowest average delay indicating the increased availability of ICU beds. All these factors may have contributed to the lower mortality during these waves.
The third and sixth waves happened during Christmas. The usual winter flu peak was transformed into a COVID-19 peak at the end of December and throughout January. However, while in the sixth wave the population had almost completed vaccination, during the third only few people over 80 years old had received the vaccine in January, and none before Christmas [6]. Average age and Charlson score were higher in these waves . The proportion of patients over 80 years old in these two "Christmas waves" was the highest, exceeding 20%. During the third wave, despite the highest proportion of patients with high oxygen requirements, the low ratio of intubated patients and the delay in admission to ICU suggest that the healthcare system became strained again, due to the coexistence of COVID-19 and non-COVID-19 patients. Lack of evidence regarding the use of remdesivir in hospitalized patients resulted in its marginal use in our center. However, in the third wave, a higher proportion of patients received corticosteroids and tocilizumab, which may partially explain why the inflammatory parameters did not reach the levels of the first wave. It is intriguing that the sixth wave had the highest mortality rate (12%), even higher than during the first wave, although the absolute number was much lower. This wave was marked by almost universal vaccination [6], Omicron variant [8] and difficulties to distinguish COVID-19 from SARS-CoV-2 infection, due to universal screening at admission. The proportion of patients with cancer and severe dementia significantly increased compared to previous waves, making it difficult to attribute the fundamental cause of death to the coronavirus in all cases. All severity parameters (oxygen saturation at admission, worst oxygen saturation, need for high-flow oxygen, acute-phase reactants, use of tocilizumab) were better than average, and the number of patients requiring mechanical ventilation decreased compared to the previous two waves. Undoubtedly, mortality in the sixth wave was mostly associated to comorbidities.
Finally, the seventh wave (which could also be named the plateau wave) represented normality. Vaccination was almost universal, no new relevant VOC appeared, and last restrictions were gradually lifted. This wave was different from all previous ones. Its patients had the highest mean age, Charlson score index and readmission rate, but the lowest length of stay and acute-phase reactants levels, and a drastically decrease in the need for intubation was observed (only 6 [1%] patients) . The use of tocilizumab was anecdotal. In short, these were patients with significant comorbidities with a mild COVID-19, who developed a non-severe respiratory disease and whose mortality, like in the sixth wave, was mostly related to their underlying comorbidities than to COVID-19 itself.
Despite these differences, neither mortality nor intubation were associated to any specific wave in multivariant analyses. Regarding the first wave, the clustering of more severe patients, with both desaturation and higher inflammatory markers, accounted for the higher mortality during this period. Furthermore, it was offset by the less number of deaths related to poor performance status than in subsequent waves. On the other hand, anti-inflammatory treatments were used more frequently than reported in other series from the beginning of the pandemic, resulting in slightly lower mortality [15].
The variables associated with mortality were, as expected: age, cancer, dementia, Charlson score, need for high-flow oxygen, including mechanical ventilation, and inflammatory markers (PCR, IL-6). These factors had been described in previous similar studies [11,15-19]. The use of prophylactic LMWH was associated with lower mortality and this treatment is now strongly recommended in all COVID-19 hospitalized patients [20], but, as a limiting factor, we could not distinguish patients without prophylactic LMWH from those who received anticoagulated doses before or during admission, variables that are likely associated with different preexisting comorbidities and COVID-19 severity. Need for high-flow oxygen and age appeared as the most powerful predictors of mortality. Age also influences mortality outcomes by waves as well as the impact of tocilizumab and corticosteroids, which lose their association with higher mortality when age is controlled. In other words, the apparent increase in mortality among individuals who used tocilizumab and corticosteroids was due to their higher administration to older people. In fact, the use of tocilizumab seemed to decrease mortality in this group of patients with desaturation, as shown in various studies [21], and has been recommended by FDA and other panels for the treatment of subjects with COVID-19 that require supplemental oxygen [22].
It is also noteworthy that we did not find an association between vaccination and overall mortality. In this regard, whe have already assessed the impact of fourth and fifth waves in our center [23]. In summary, although the mortality rate was higher in the vaccinated group in terms of percentage, this is due to a higher accumulation of comorbidity in this group, and we can ascertain that it would have been even higher without the vaccine [24].
Regarding the variables associated with mechanical ventilation, patients with cancer (and probably dementia) had a lower probability of being intubated, while the most powerful variables associated with intubation include worse oxygen saturation at admission and those with bilateral pneumonia on chest X-ray upon admission. Once again, the association with tocilizumab and corticosteroids is lost when controlled for age or saturation variables, although the analysis does not suggest that tocilizumab prevented intubation.
Main limitations of our study include the retrospective design and being carried out at a single. We have tried to overcome these limitations with rigorous methods, with the inclusion of all patients admitted to the hospital, accounting for a large number of patients, and the quality of the variables that were prospectively collected in an electronic database for further analysis.
5. Conclusions
In this single center study, we have observed significant changes in the characteristics and evolution of hospitalized COVID-19 patients. The impact of vaccination, the emergence of new variants, and the population mobility (restrictions, summer, Christmas) influenced both the baseline profile of patients admitted during the pandemic and the severity of their condition and therapeutic needs. These factors were further influenced by the hospital burden (especially in the first and third waves) and the evidence and availability of different treatments. However, the COVID-19 wave was not independently associated with mortality or intubation, suggesting that the differences observed between waves in both variables in our serie were mainly due to the different baseline characteristics of the patients admitted during each wave.
References
- Coronavirus disease (COVID-19) [Internet]. [cited 2023 Jun 20]. Available online: https://www.who.int/emergencies/diseases/novel-coronavirus-2019/question-and-answers-hub/q-a-detail/coronavirus-disease-covid-19.
- Statement on the fifteenth meeting of the IHR (2005) Emergency Committee on the COVID-19 pandemic [cited 2023 Jun 20]. Available online: https://www.who.int/news/item/05-05-2023-statement-on-the-fifteenth-meeting-of-the-international-health-regulations-(2005)-emergency-committee-regarding-the-coronavirus-disease-(covid-19)-pandemic.
- WHO Coronavirus (COVID-19) Dashboard [Internet]. [cited 2023 Jun 20]. Available online: https://covid19.who.int/?adgroupsurvey={adgroupsurvey}&gclid=CjwKCAjwitShBhA6EiwAq3RqAwpg31quWe7lsjj7jx96i9LUgFSKQwpWelZhZvv0PLAtatHMxszeDhoC6RsQAvD_BwE.
- Ministerio de Sanidad - Profesionales - Situación actual Coronavirus [Internet]. [cited 2023 Jun 20]. Available online: https://www.sanidad.gob.es/profesionales/saludPublica/ccayes/alertasActual/nCov/situacionActual.htm.
- Informe no 169 Situación actual de COVID-19 en España a 24 de febrero de 2023.pdf [Internet]. [cited 2023 Jun 20]. Available online: https://www.isciii.es/QueHacemos/Servicios/VigilanciaSaludPublicaRENAVE/EnfermedadesTransmisibles/Documents/INFORMES/Informes%20COVID-19/INFORMES%20COVID-19%202023/Informe%20n%C2%BA%20169%20Situaci%C3%B3n%20actual%20de%20COVID-19%20en%20Espa%C3%B1a%20a%2024%20de%20febrero%20de%202023.pdf.
- Informe_GIV_comunicacion_20230105.pdf [Internet]. [cited 2023 Jun 20]. Available online: https://www.sanidad.gob.es/profesionales/saludPublica/ccayes/alertasActual/nCov/documentos/Informe_GIV_comunicacion_20230105.pdf.
- Updated working definitions and primary actions for SARSCoV2 variants [Internet]. [cited 2023 Jun 20]. Available online: https://www.who.int/publications/m/item/updated-working-definitions-and-primary-actions-for--sars-cov-2-variants.
- COVID19_Actualizacion_variantes_20230403b.pdf [Internet]. [cited 2023 Jun 20]. Available online: https://www.sanidad.gob.es/profesionales/saludPublica/ccayes/alertasActual/nCov/documentos/COVID19_Actualizacion_variantes_20230403b.pdf.
- Weber GM, Zhang HG, L’Yi S, Bonzel CL, Hong C, Avillach P, et al. International Changes in COVID-19 Clinical Trajectories Across 315 Hospitals and 6 Countries: Retrospective Cohort Study. J Med Internet Res. 2021, 23, e31400. [CrossRef] [PubMed]
- Ramos-Rincon JM, Cobos-Palacios L, López-Sampalo A, Ricci M, Rubio-Rivas M, Nuñez-Rodriguez MV, et al. Differences in clinical features and mortality in very old unvaccinated patients (≥ 80 years) hospitalized with COVID-19 during the first and successive waves from the multicenter SEMI-COVID-19 Registry (Spain). BMC Geriatr. 2022, 22, 546.
- Lee H, Chubachi S, Namkoong H, Asakura T, Tanaka H, Otake S, et al. Characteristics of hospitalized patients with COVID-19 during the first to fifth waves of infection: a report from the Japan COVID-19 Task Force. BMC Infect Dis. 2022, 22, 935. [CrossRef] [PubMed]
- El hospital en cifras [Internet]. [cited 2023 Jun 20]. Available online: https://www.comunidad.madrid/hospital/fuenlabrada/ciudadanos/hospital-cifras.
- informe_epidemiologico_semanal_covid_s52_2022.pdf [Internet]. [cited 2023 Jun 20]. Available online: https://www.comunidad.madrid/sites/default/files/doc/sanidad/epid/informe_epidemiologico_semanal_covid_s52_2022.pdf.
- COVID-19: Management in hospitalized adults - UpToDate [Internet]. [cited 2023 Apr 14]. Available online: https://www.uptodate.com/contents/covid-19-management-in-hospitalized-adults?search=coronavirus&source=search_result&selectedTitle=4~150&usage_type=default&display_rank=4.
- Casas-Rojo JM, Antón-Santos JM, Millán-Núñez-Cortés J, Lumbreras-Bermejo C, Ramos-Rincón JM, Roy-Vallejo E, et al. Clinical characteristics of patients hospitalized with COVID-19 in Spain: results from the SEMI-COVID-19 Registry. Rev Clin Esp [Internet]. 2020 Nov [cited 2023 Apr 14];220(8):480–94. Available online: https://www.ncbi.nlm.nih.gov/pmc/articles/PMC7480740/.
- Taylor CA. Severity of Disease Among Adults Hospitalized with Laboratory-Confirmed COVID-19 Before and During the Period of SARS-CoV-2 B.1.617.2 (Delta) Predominance — COVID-NET, 14 States, January–August 2021. MMWR Morb Mortal Wkly Rep [Internet]. 2021 [cited 2023 Apr 14];70. Available online: https://www.cdc.gov/mmwr/volumes/70/wr/mm7043e1.htm.
- Liu X, Wang H, Shi S, Xiao J. Association between IL-6 and severe disease and mortality in COVID-19 disease: a systematic review and meta-analysis. Postgrad Med J [Internet]. 2022 Nov 1 [cited 2023 Apr 14];98(1165):871–9. Available online: https://pmj.bmj.com/content/98/1165/871.
- The Contribution of the Age Distribution of Cases to COVID-19 Case Fatality Across Countries: A Nine-Country Demographic Study: Annals of Internal Medicine: Vol 173, No 9 [Internet]. [cited 2023 Apr 14]. Available online: https://www.acpjournals.org/doi/full/10.7326/M20-2973?rfr_dat=cr_pub++0pubmed&url_ver=Z39.88-2003&rfr_id=ori%3Arid%3Acrossref.org.
- Ghanem M, Brown SJ, EAT Mohamed A, Fuller HR. A meta-summary and bioinformatic analysis identified interleukin 6 as a master regulator of COVID-19 severity biomarkers. Cytokine [Internet]. 2022 Nov [cited 2023 Apr 14];159:156011. Available online: https://www.ncbi.nlm.nih.gov/pmc/articles/PMC9420723/.
- COVID-19: Management in hospitalized adults - UpToDate [Internet]. [cited 2023 Jun 20]. Available online: https://www.uptodate.com/contents/covid-19-hypercoagulability?search=coronavirus&topicRef=127429&source=related_link#H1789400734.
- Flisiak R, Jaroszewicz J, Rogalska M, Łapiński T, Berkan-Kawińska A, Bolewska B, et al. Tocilizumab Improves the Prognosis of COVID-19 in Patients with High IL-6. J Clin Med [Internet]. 2021 Apr 9 [cited 2023 Mar 29];10(8):1583. Available online: https://www.ncbi.nlm.nih.gov/pmc/articles/PMC8070099/.
- 2023. Available online: https://www.accessdata.fda.gov/drugsatfda_docs/label/2022/125472s049lbl.pdf (accessed on 20 June 2023).
- Ruiz-Giardin JM, Rivilla M, Mesa N, Morales A, Rivas L, Izquierdo A, et al. Comparative Study of Vaccinated and Unvaccinated Hospitalised Patients: A Retrospective Population Study of 500 Hospitalised Patients with SARS-CoV-2 Infection in a Spanish Population of 220,000 Inhabitants. Viruses [Internet]. 2022 Oct [cited 2023 Jun 20];14(10):2284. Available online: https://www.mdpi.com/1999-4915/14/10/2284.
- Brosh-Nissimov T, Orenbuch-Harroch E, Chowers M, Elbaz M, Nesher L, Stein M, et al. BNT162b2 vaccine breakthrough: clinical characteristics of 152 fully vaccinated hospitalized COVID-19 patients in Israel. Clin Microbiol Infect [Internet]. 2021 Nov [cited 2023 Apr 14];27(11):1652–7. Available online: https://www.ncbi.nlm.nih.gov/pmc/articles/PMC8261136/.
Figure 1.
Distribution of hospital admissions and ICU admissions during the study period across differen.
Figure 1.
Distribution of hospital admissions and ICU admissions during the study period across differen.
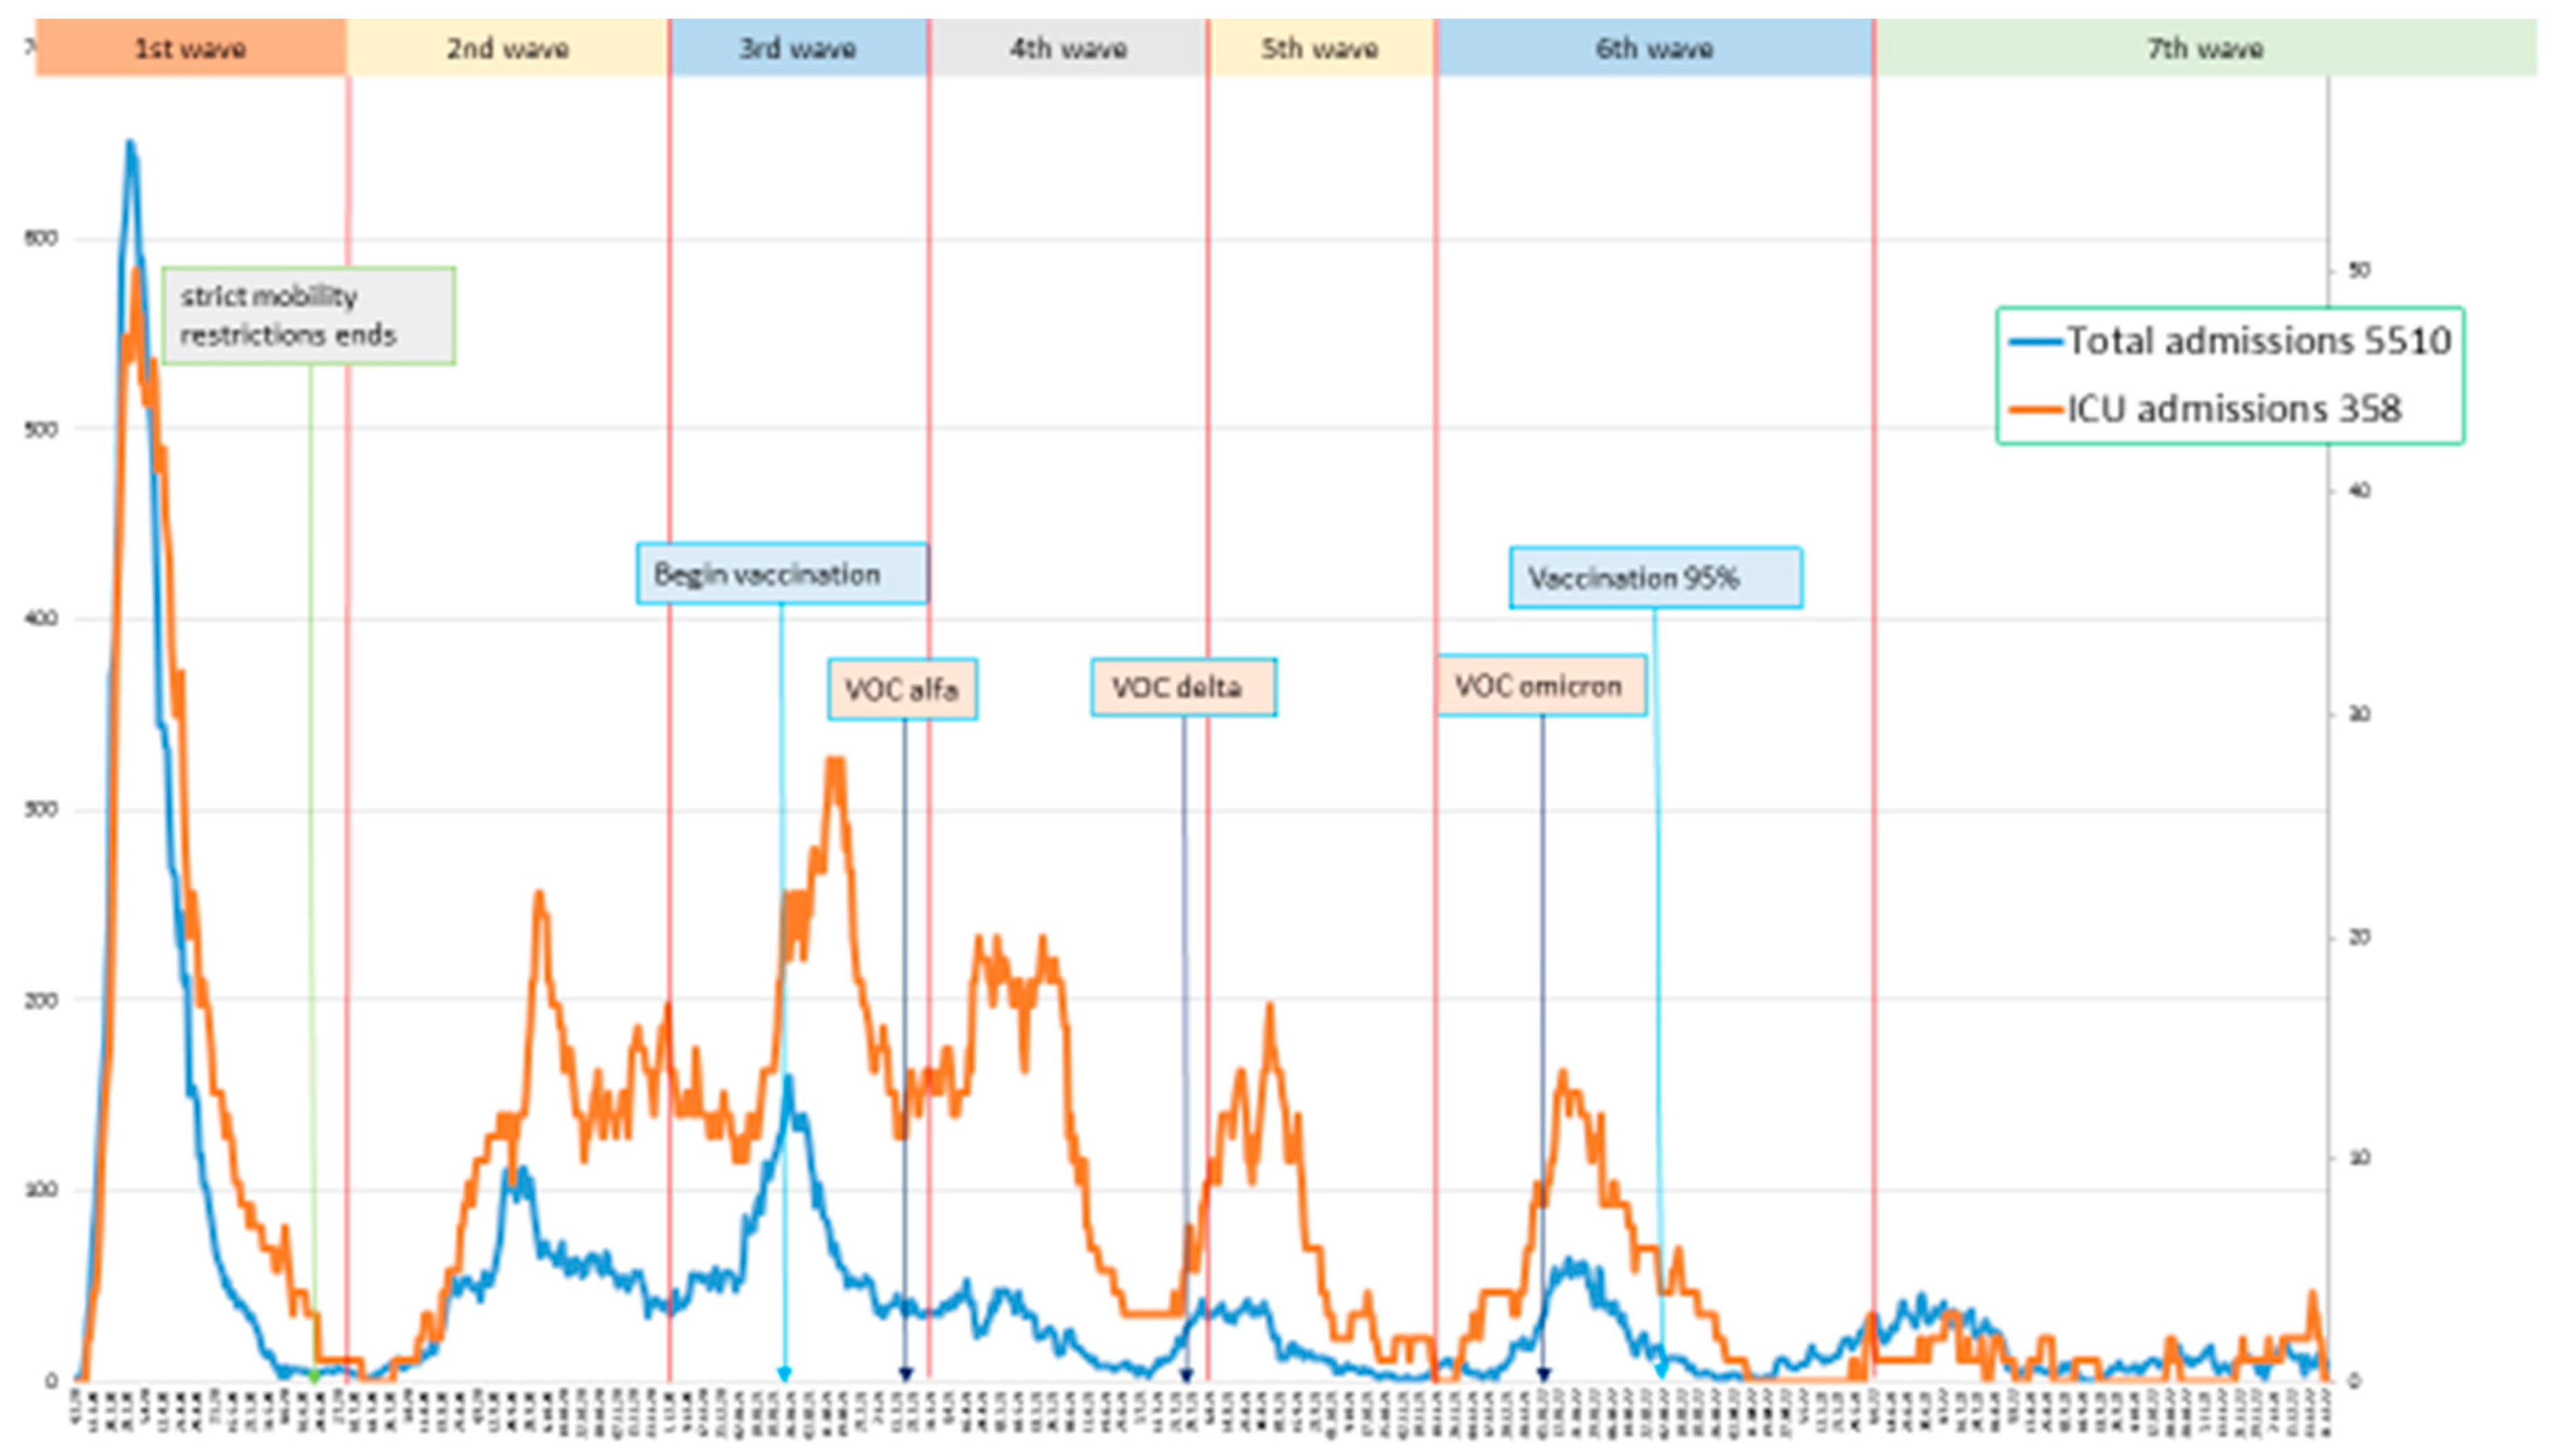
Table 1.
Total admissions, readmissions, and patients by epidemic wave*.
| Wave | First | Second | Third | Fourth | Fifth | Sixth | Seventh | Total |
|---|---|---|---|---|---|---|---|---|
| Patients | 1735 (35%) | 900 (18%) | 823 (17%) | 414 (8%) | 291 (6%) | 441 (8%) | 397 (8%) | 5001 |
| Admissions | 1823 (33%) | 980 (18%) | 900 (16%) | 472 (9%) | 322 (6%) | 522 (9%) | 491 (9%) | 5510 |
| Readmissions | 88 (5%) | 80 (8%) | 77 (9%) | 58 (12%) | 31 (10%) | 81 (16%) | 94 (19%) | 509 (9%) |
* All percentages refer to the total number of patients and admissions, except in the case of readmissions, in which percentages refer to the number of admissions in each wave.
Table 6.
Deaths and mechanical ventilation by waves.
| Wave | First | Second | Third | Fourth | Fifth | Sixth | Seventh | Total |
|---|---|---|---|---|---|---|---|---|
| Patients | 1735 | 900 | 823 | 414 | 291 | 441 | 397 | 5001 |
| Deaths1 | 200 (11.5%) | 89 (9.9%) | 93 (11.3%) | 29 (7%) | 19 (6.5%) | 53 (12%) | 31 (8%) | 514 (10.3%) |
| Admissions | 1823 | 980 | 900 | 472 | 322 | 522 | 491 | 5510 |
| Mechanical2 ventilation | 98 (5%) | 70 (7%) | 68 (8%) | 49 (10%) | 35 (11%) | 32 (9%) | 6 (1%) | 358 (6.5%) |
1 n (%). Percentage of deaths was calculated based on the total number of patients in each wave. 2 n (%). Percentage of mechanical ventilation was calculated based on the total number of admissions in each wave.
Table 7.
Multivariate analysis for 3-month mortality.
| Predictive variables included in the model | HR (CI 95%) |
|---|---|
| Age (continuous, per 1.0 year) | 1.08 (1.07-1.09) |
| Charlson index (continuous, per 1.0) | 1.38 (1.31-1.47) |
| Cancer (categorical) | 1.99 (1.53-2.60) |
| Dementia (categorical) | 1.82 (1.20-2.75) |
| High oxygen flow requirements (categorical) | 6.10 (4.94-7.52) |
| C-reactive protein (continuous, per 1.0 mg/dl) | 1.04 (1.03-1.06) |
| Low molecular weight heparin (categorical) | 0.41 (0.30-0.57) |
Table 8.
Multivariate analysis for mechanical ventilation.
| Predictive variables included in the model | HR (IC 95%) |
|---|---|
| Cancer (categorical) | 0.49 (0.30-0.81) |
| Worst oxygen saturation under 94% (categorical) | 7.36 (2.04-26.61) |
| Bilateral infiltrates (categorical) | 4.03 (3.27-4.95) |
Disclaimer/Publisher’s Note: The statements, opinions and data contained in all publications are solely those of the individual author(s) and contributor(s) and not of MDPI and/or the editor(s). MDPI and/or the editor(s) disclaim responsibility for any injury to people or property resulting from any ideas, methods, instructions or products referred to in the content. |
© 2023 by the authors. Licensee MDPI, Basel, Switzerland. This article is an open access article distributed under the terms and conditions of the Creative Commons Attribution (CC BY) license (https://creativecommons.org/licenses/by/4.0/).
Copyright: This open access article is published under a Creative Commons CC BY 4.0 license, which permit the free download, distribution, and reuse, provided that the author and preprint are cited in any reuse.


