1. Introduction
Coal is the most important primary energy in China. Deep mining has become the norm in coal resource development with depleted shallow resources [
1,
2]. Compared to shallow mining, deep mining generally faces problems such as the complex layout of development and production systems, increased gangue output, and reduced efficiency of mine hoisting [
3]. Meanwhile, the ground dressing and discharge of gangue, surface subsidence, and ecological environment deterioration seriously restrict the coordinated development of coal resource development and mining-area environmental protection [
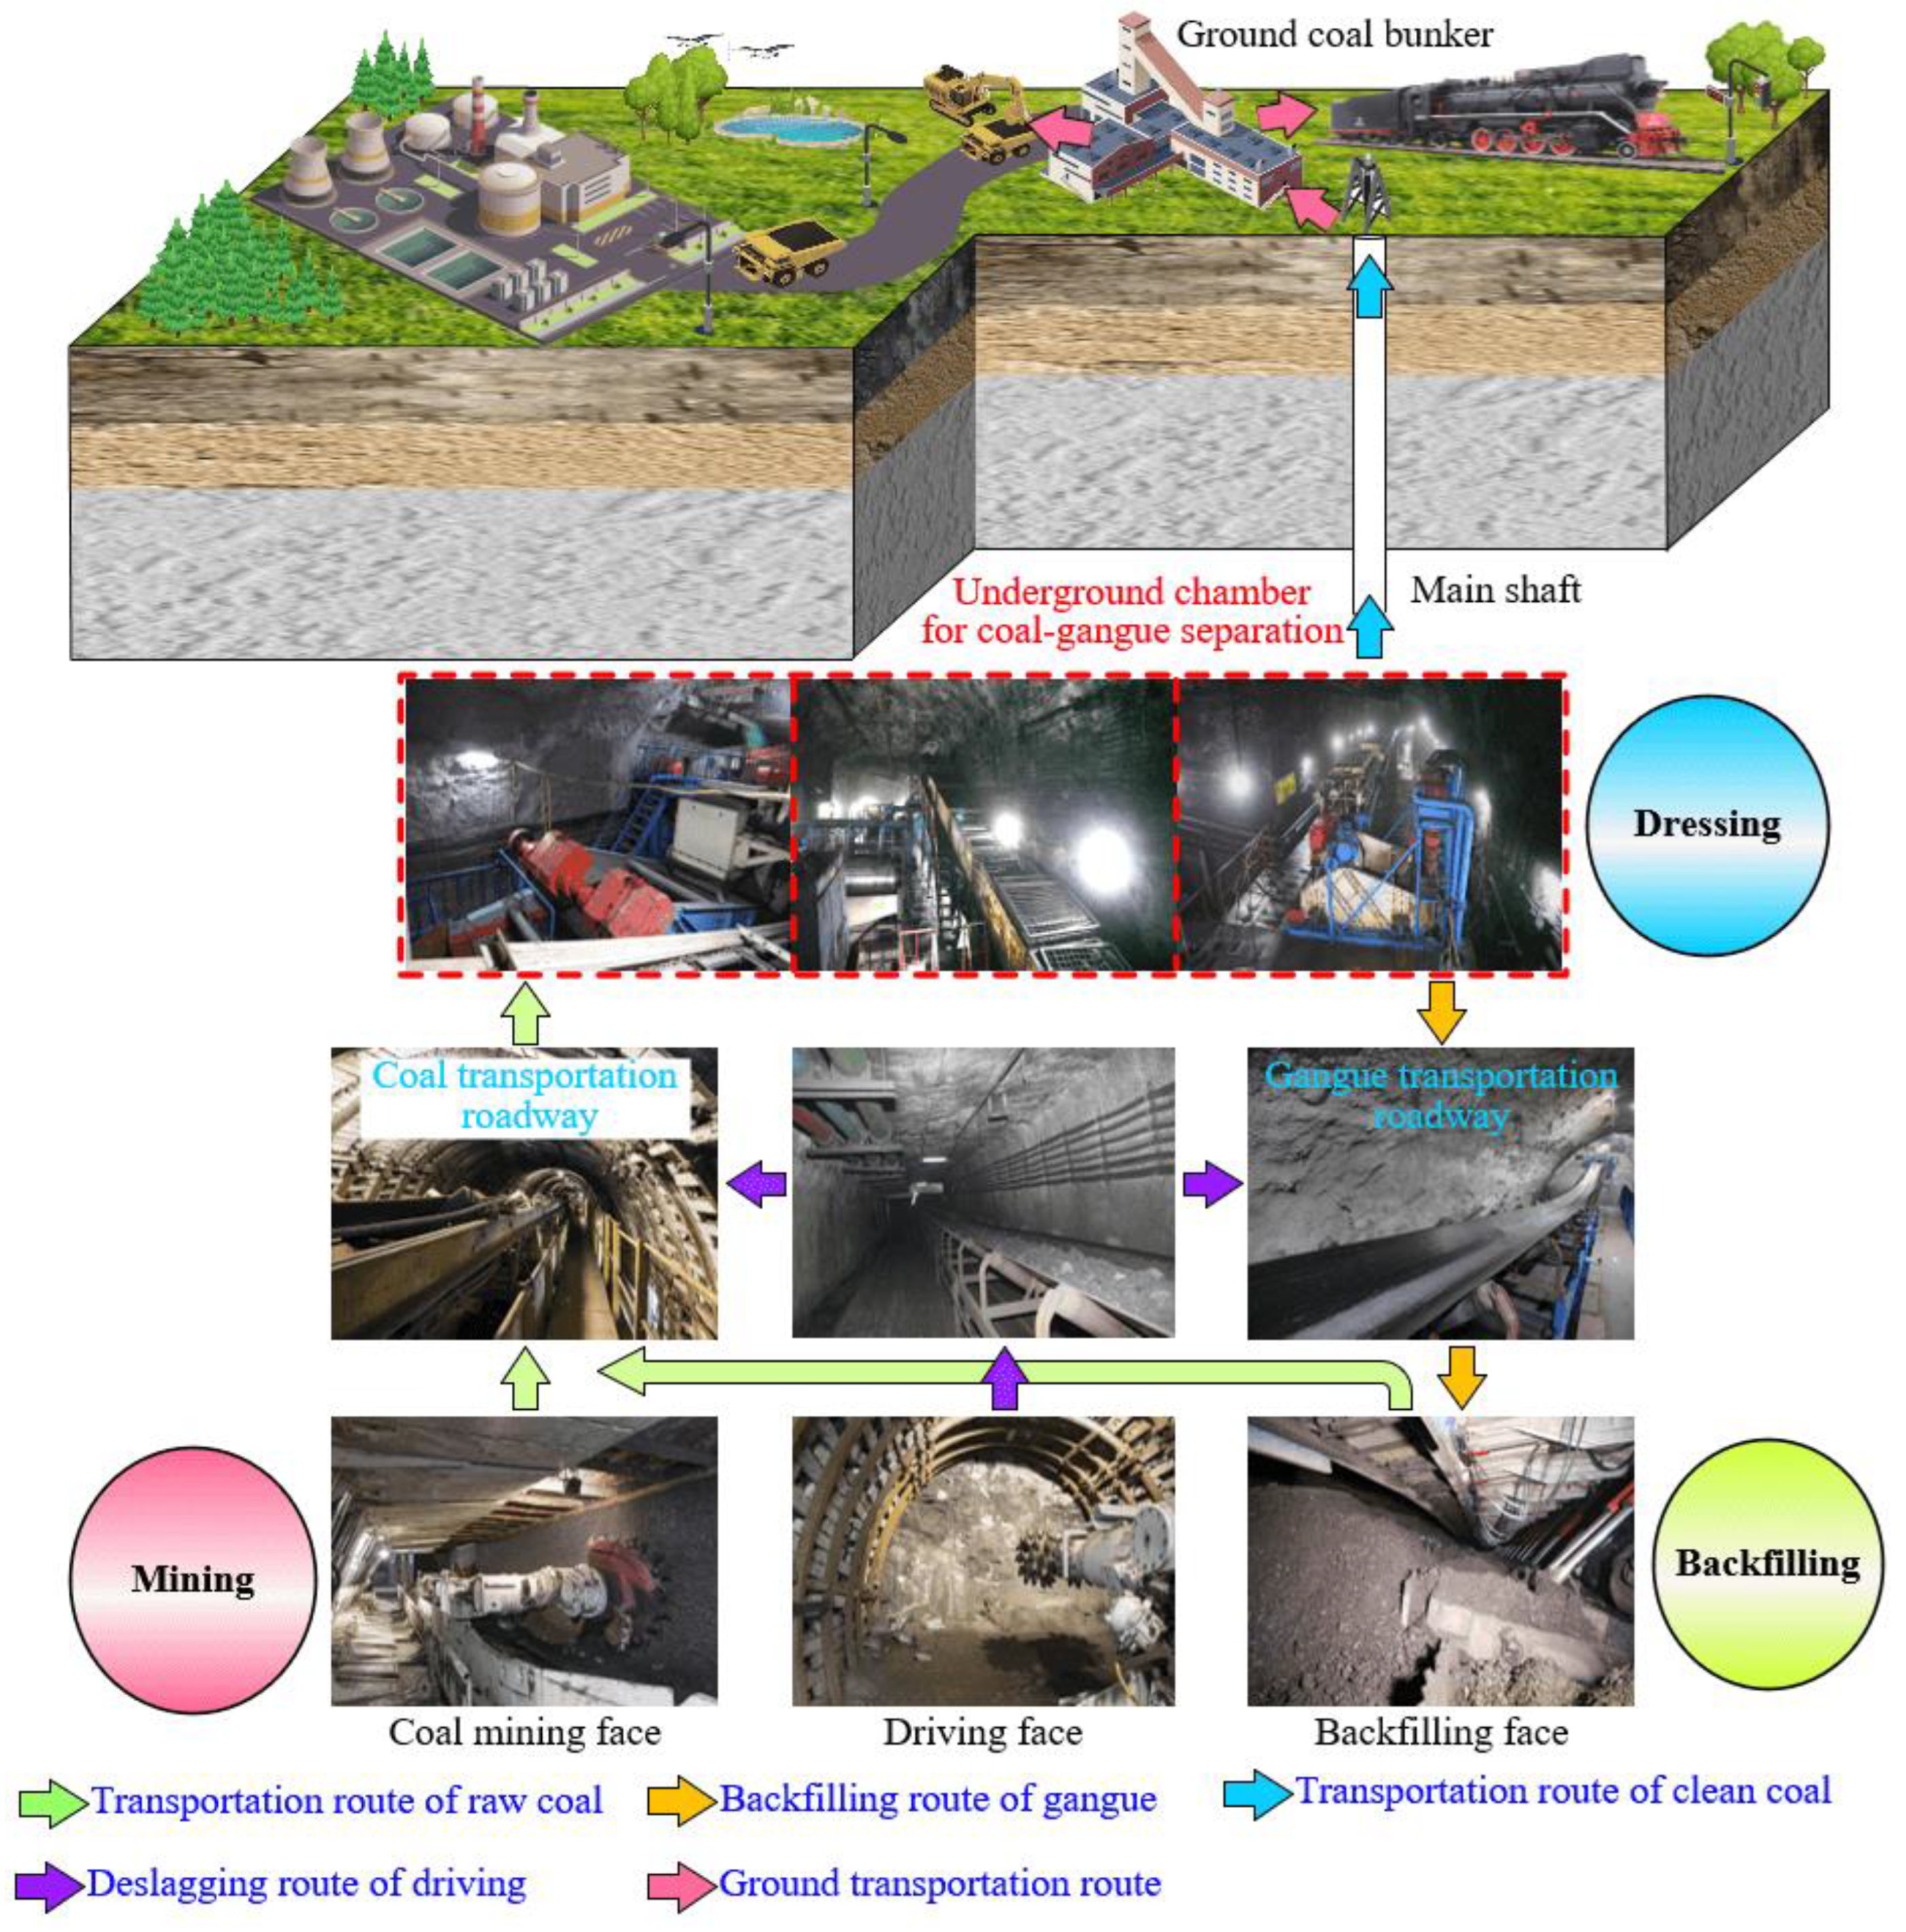
4]. Based on the concept of green mining, new paths are explored in deep coal mines to achieve safe and efficient mining and protect the surface environment and buildings. The integrated technology of mining, dressing, and backfilling can solve the above problems [
5,
6].
Figure 1 shows its technical schematic [
7,
8,
9,
10].
Chamber for coal-gangue separation is an important place for underground coal dressing, and the long-term stability control of its surrounding rocks is the premise for the efficient operation of the integrated system of mining, dressing, and backfilling in deep coal mines [
11]. The ideal spatial location of deep chamber for DCCS is in a stable rock stratum with high strength and large thickness close to the mined seam. It can reduce the failure range and difficulties in supporting surrounding rocks. The height of DCCS is relatively large (generally greater than 7.0 m), and the above-mentioned rock stratum often does not exist in the coal-measure stratum [
12]. Therefore, the surface surrounding rocks of DCCS are generally composed of multiple rock strata. The surrounding-rock stability of DCCS is directly controlled by the composition of surrounding rocks, especially the horizons of the weak stratum (such as mudstone, argillaceous sandstone, and sandy mudstone).
At present, research related to the spatial layout of chamber in coal mining mainly considers the influence of the ground stress environment, the excavation of adjacent chamber, and the mining of the adjacent working face [
10,
13,
14,
15]. Meanwhile, research on the influence of a weak stratum on the surrounding rock stability of chamber mainly focuses on the failure mechanism and reinforcement measures of the weak stratum [
16,
17]. However, there are still few reports on the optimal layout method of chamber based on the horizon of the weak stratum. Therefore, the above issues need in-depth explorations.
Based on this, the research method combining field survey, similar simulation test, and numerical simulation was adopted in the work. The main structural characteristics of DCCS were summarized to discuss the deformation and failure law of surrounding rocks of DCCS under different horizons of the weak stratum. A comprehensive evaluation method for the stability of surrounding rocks was proposed, and the optimal layout methods of DCCS were finally determined based on the horizon of the weak stratum in different ground stress environments. The research results are of positive significance for guiding the spatial layout and support design of DCCS. They can realize the active, targeted, and efficient control of the deformation and damage of surrounding rocks and have broad application prospects in deep resource mining.
2. General Engineering Background
Coal mines in China define chamber as an underground roadway with similar lengths on the three axes traditionally. Not directly connected to the ground, it has specific functions, such as the substation, pump house, and hoist house. Underground mechanical equipment has gradually developed in a large-scale, intensive, and intelligent direction recently, which has put forward new requirements for the space structure of chamber [
18].
Figure 2 shows underground chamber for the coal-gangue separation of Longgu Coal Mine, Pingdingshan 12
# coal mine, and Binhu Coal Mine [
8,
10].
Table 1 shows the spatial size statistics of chamber for coal-gangue separation. It presents the distinctive characteristics of large section size, elongated cross-sectional shape, and large difference between the axial length and section size due to the centralized placement of coal dressing, disintermediation, media recycling, and other equipment in DCCS.
At present, there is no uniform standard for the division of chamber sections in coal mining. Some researchers have proposed that chamber can be divided into small sections (< 8 m
2), medium sections (8-12 m
2), large sections (12-20 m
2), and super large sections (≥ 20 m
2) according to the cross-sectional area [
19]. Some researchers also recommended dividing chamber into ultra-small sections (< 3 m
2), small sections (3-10 m
2), medium sections (10-50 m
2), large sections (50-100 m
2), and super large sections (≥ 100 m
2) according to the section classification recommendations proposed by the International Tunneling Association [
20]. Other researchers divided chamber into small sections (≤ 3 m), medium sections (3.1-4 m), large sections (4.1-5 m), and super large sections (≥ 5.1 m) according to the span [
21]. Meanwhile, the reasonable ratio of width to the height of the roadway and chamber is 1-1.2. For example, the width of the main roadway in the Lu'an mining area is generally 4.0-5.5 m, and the height is 3.5-4.5 m [
22,
23]. The general width of the roadway is 5.0-6.5 m and the height is 3.5-4.5 m in the Shendong mining area [
24,
25]. Accordingly, when the ratio of width to height is less than 1, it is mentioned as the small ratio of the width to height in the work.
In summary, DCCS exhibits the structural characteristics of a large cross-sectional area (super large section), a small width-to-height ratio, and an axial length significantly greater than the section size. These features distinguish it from both underground roadways and traditional chamber.
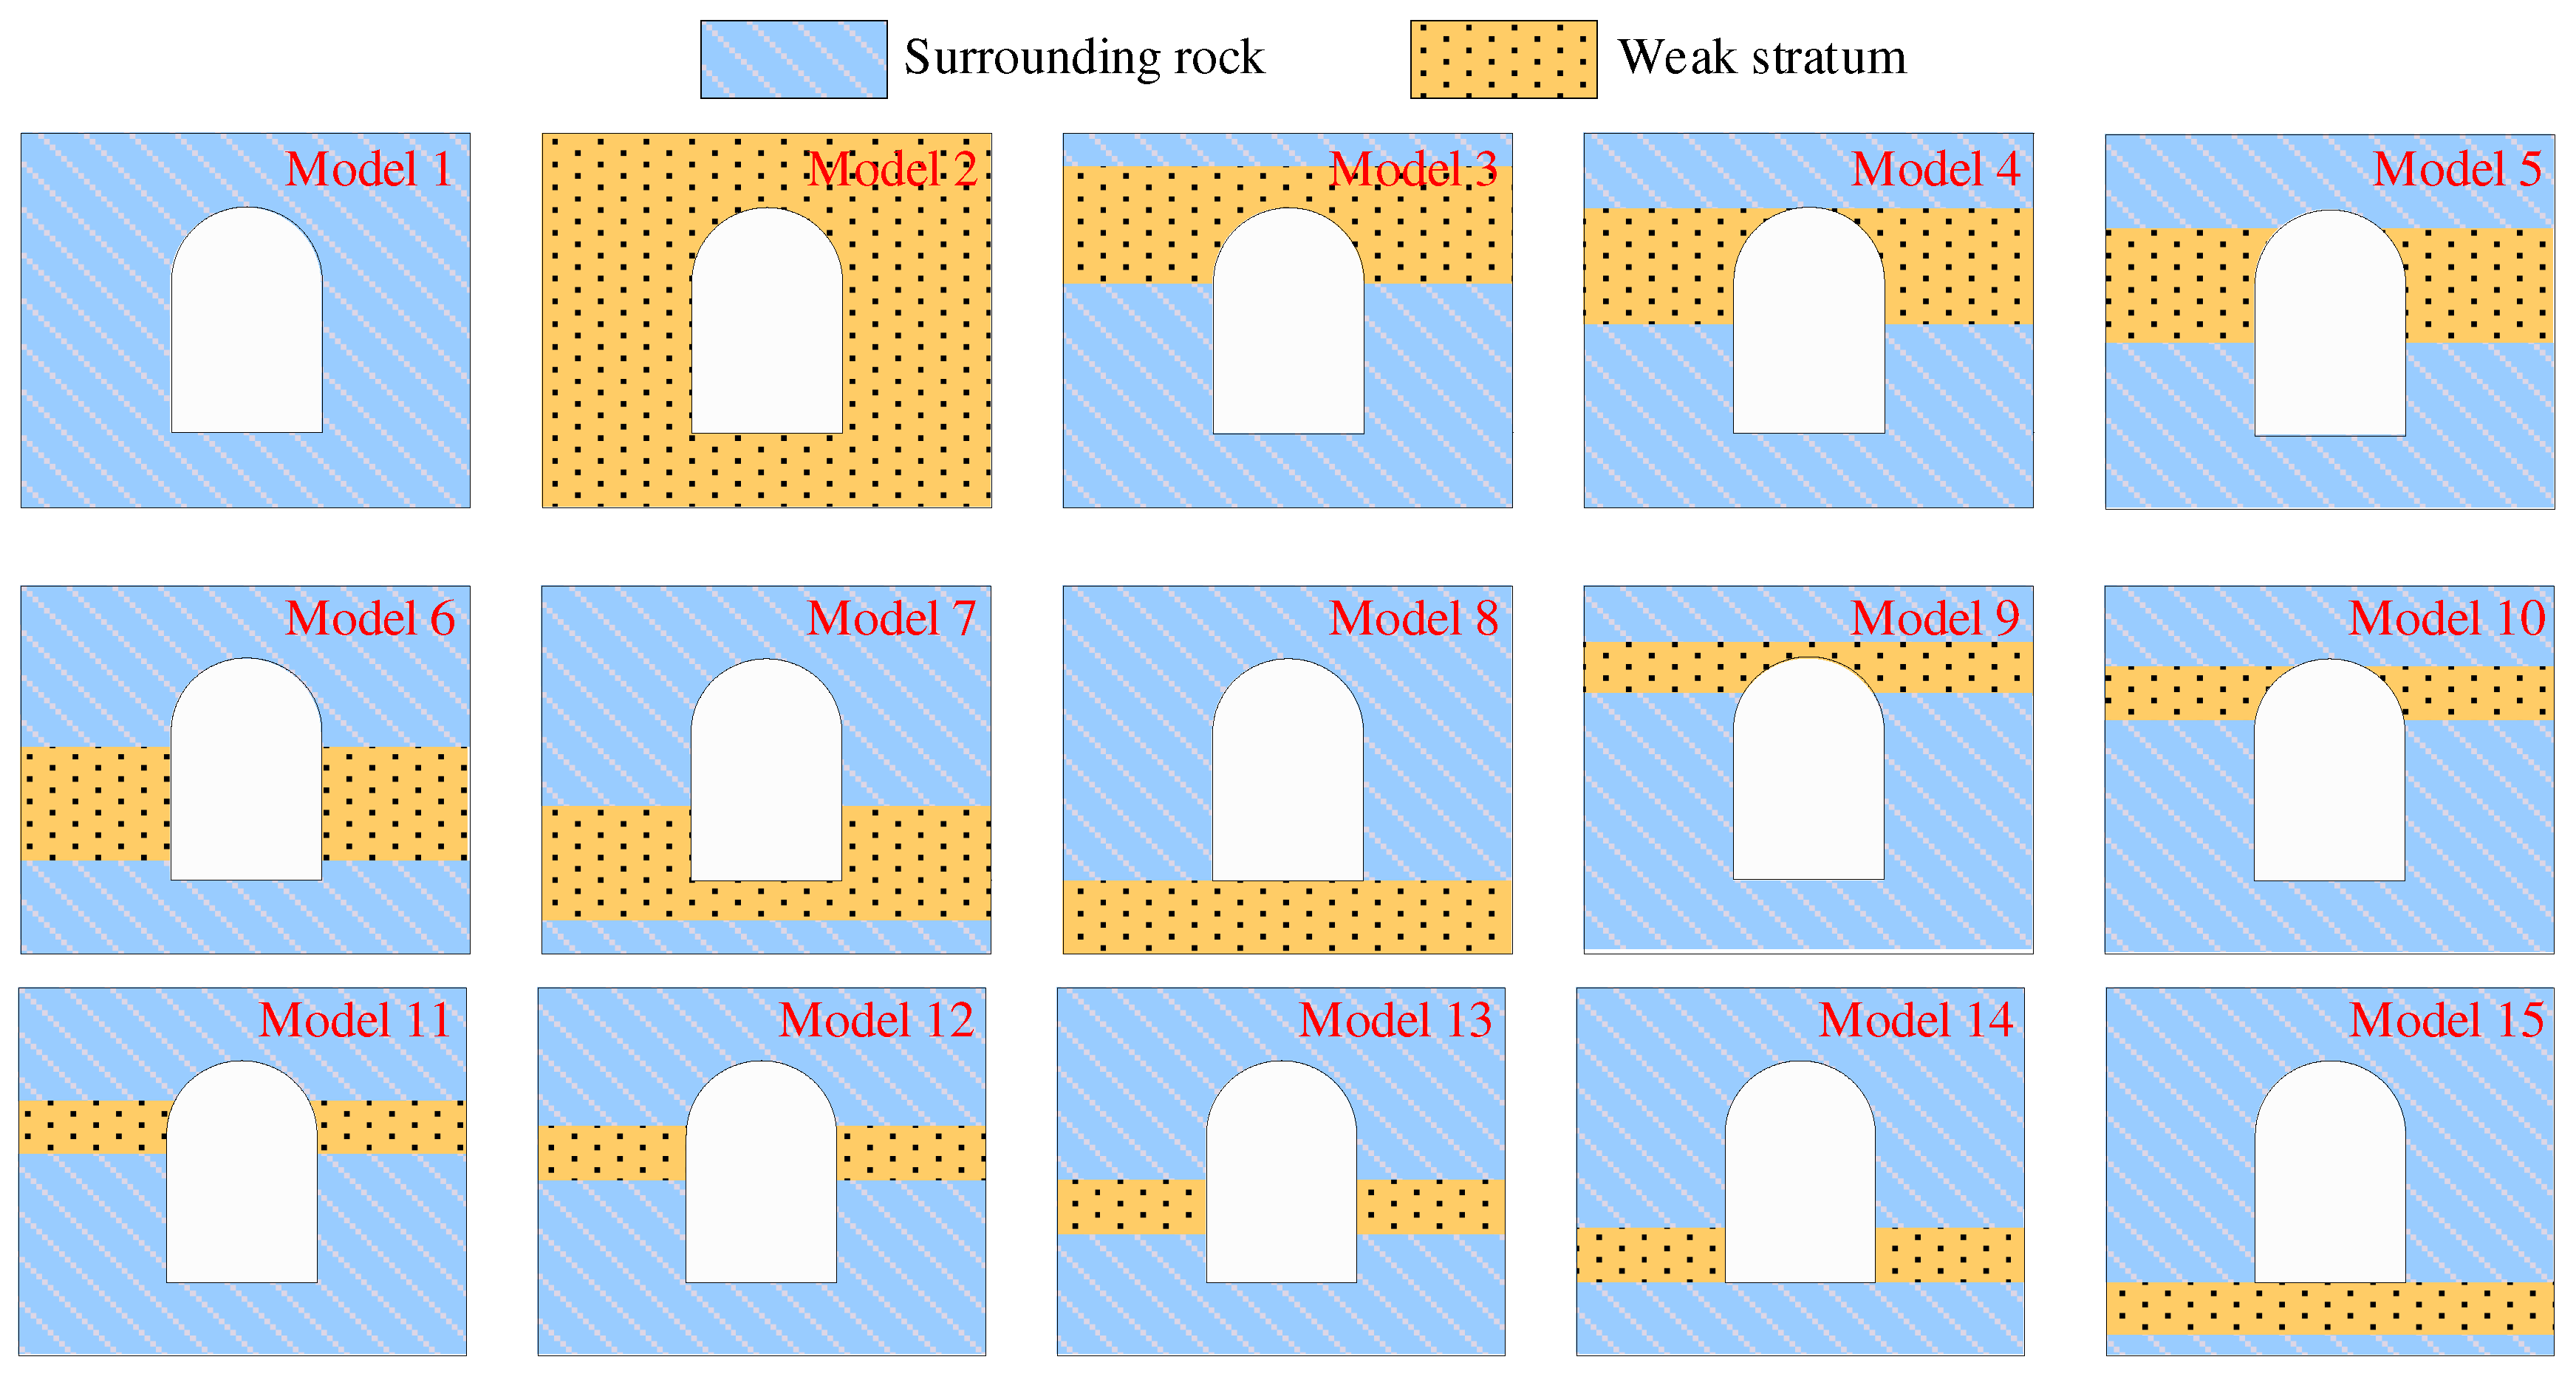
When the surface surrounding rocks of DCCS contain a single weak stratum, there are various situations on its horizon (
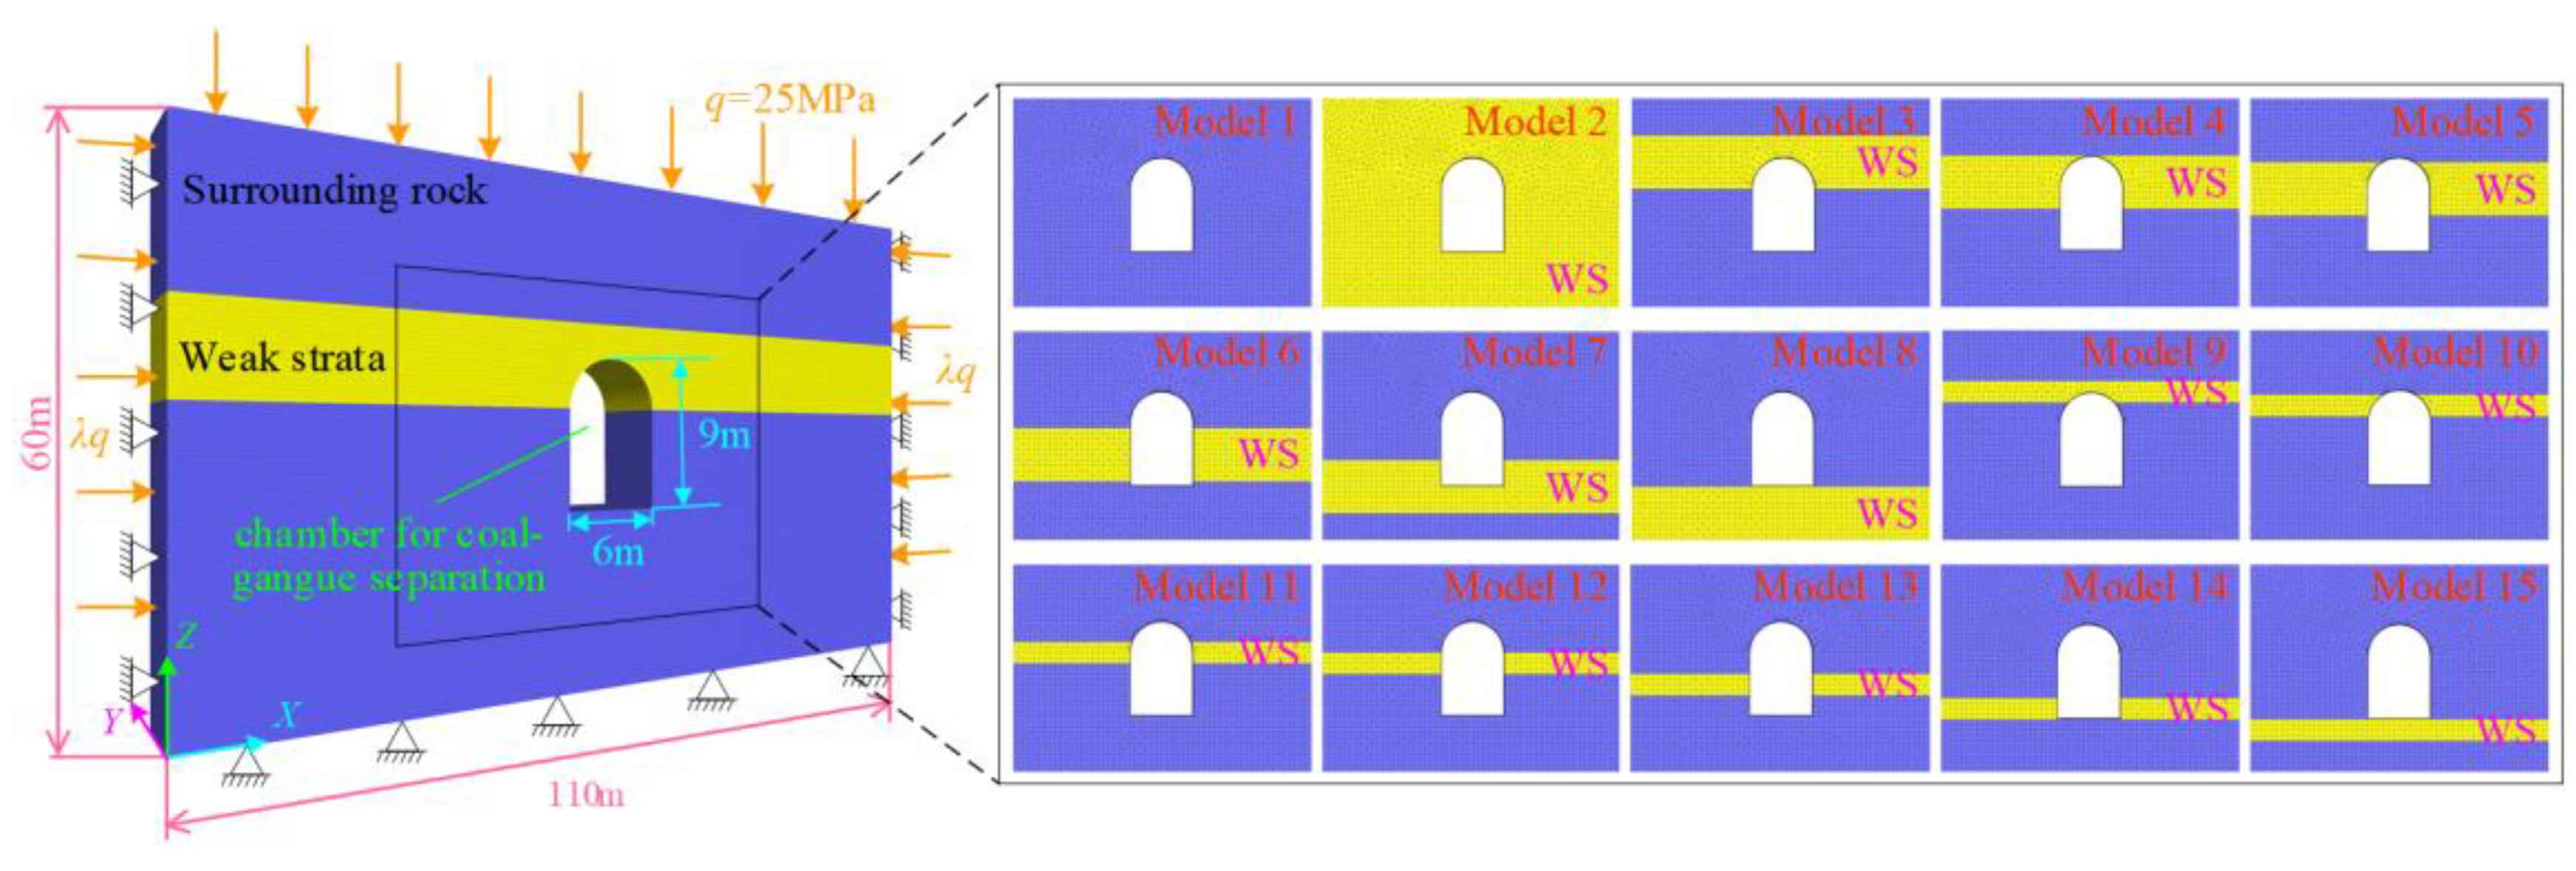
Figure 3). The following will adopt a research method that combines similar simulation tests and numerical simulations to study the influence of the horizon of the weak stratum on the stability of surrounding rocks of DCCS. Models 1 and 2 are mainly used as comparative references. Models 3 to 8 are used to analyze the weak stratum with large thickness, while models 9 to 15 are used to study the weak stratum with small thickness.
3. Similar Simulation Tests
The axial length of DCCS is significantly larger than its cross-sectional size, so the plan-strain similarity model is selected. If all the models in
Figure 3 are subjected to similar simulation tests, the workload is huge. Experiments can only be carried out in batches due to the limited number of plane-strain model frames in the laboratory, which makes it difficult to ensure consistency. Therefore, representative models 3, 6, and 8 are selected for this similar simulation tests. The deformation and failure law of the surrounding rocks of DCCS is studied when the weak stratum with large thickness is located at roof, side, and floor, respectively. The test results and numerical simulation results confirm each other.
3.1. Determination of Similar Parameters
According to the theory of similarity, test models should ideally be similar to all physical quantities in engineering practice. [
26]. However, it is difficult to achieve in testing. The geological mechanics model and prototype only need to satisfy geometric and stress similarities [
27,
28]. The similarity model and prototype should meet the following requirements base on the π law of the similarity theory.
where
P is the load on the rock mass;
E is the elastic modulus of the rock mass;
σ is stress;
δ is the deformation;
L is the geometric dimension;
R is the strength;
γ is the bulk density.
Based on Eqs. (1) to (5) [
29],
where
CL is the similarity ratio of geometric dimensions;
Cγ is the similarity ratio of the bulk density;
Cδ is the similarity ratio of the deformation;
CP is the similarity ratio of the load;
Cσ is the similarity ratio of stress;
CE is the similarity ratio of the elastic modulus;
CR is the similarity ratio of strength.
CL should be determined according to the actual sizes of DCCS and plane-strain model frame as well as the influence of the boundary effect. There is no specific engineering background for this similar simulation tests. According to the structural characteristics of DCCS, the cross-sectional shape of chamber in the geological models is designed as a straight wall semi-circular arch. The section size is 6 × 9 m, and the thickness of the weak stratum is 5 m. The frame size of the plane strain model used in this test is 0.6 × 0.1 × 0.5 m (length × width × height).
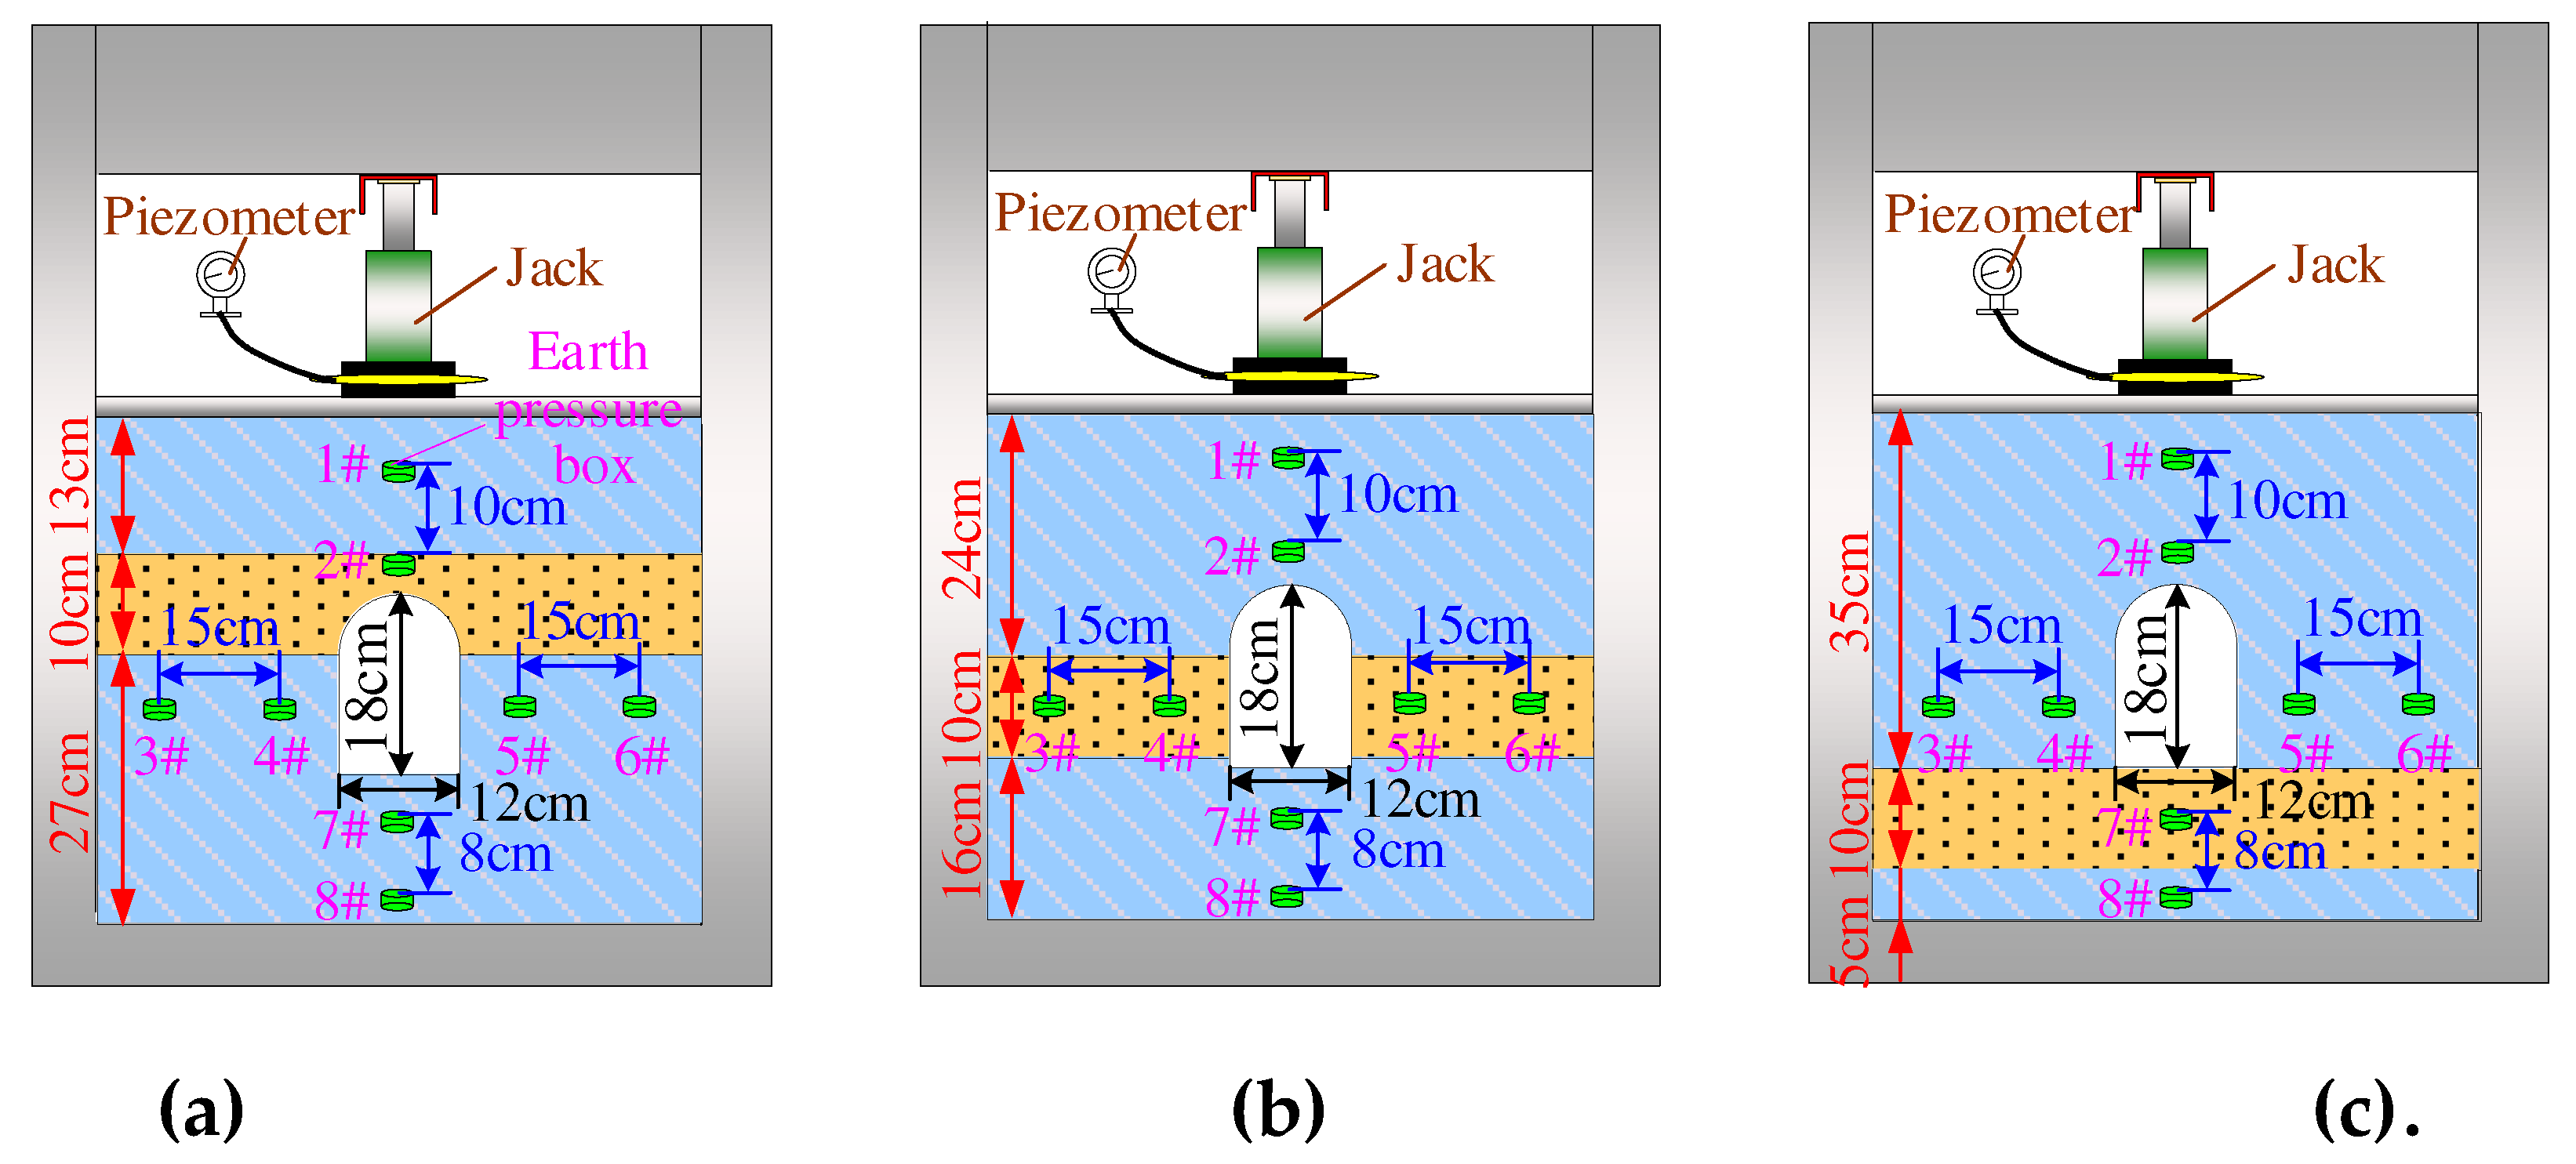
CL is 1 : 50 for the models after a comprehensive evaluation. That is, the section size of the chamber is 12 × 18 cm for coal-gangue separation in physical models, and the thickness of the weak stratum is 10 cm.
Figure 4 shows the laying schemes for three physical models.
Cγ is calculated based on the actual bulk density of rock masses and the bulk density of similar materials. The engineering community generally defines rocks with uniaxial compressive strength of less than 25 MPa as weak rocks [
30]. The physical and mechanical parameters of rock masses in the geological model are selected concerning relevant references (
Table 2) [
31,
32]. The bulk density of weak rocks is 2.46 × 10
4 N/m
3. The subsequent proportioning tests of similar materials show that the average bulk density of similar materials of weak rocks is 1.66 × 10
4 N/m
3. Therefore,
Cγ is 1:1.48.
CR and
Cσ calculated by Eq. (7) are both 1 : 74. The uniaxial compressive strength of weak rocks and other surrounding rocks calculated by
CR in physical models is 0.24 and 1.12 MPa, respectively.
3.2. Selection of Similar Materials for the Rock Stratum
The proportioning tests of similar materials should be conducted before laying physical models. The river sand, light calcium carbonate, cement, gypsum, and water are used to configure similar materials of the rock stratum based on previous research and application of similar materials [
33,
34]. River sands screened by the 2-mm standard sieve are aggregates; the primary function of light calcium carbonate is to serve as an aggregate and a component that reduces strength; cement and gypsum are cementing materials. The cement is made of ordinary Portland cement with a strength mark of C42.5. The 6 groups of similar material proportioning schemes (
Table 3) are designed regarding Ref. [
18].
Various proportioning materials are made into cube specimens with a side length of 70 mm using molds. Three specimens are made for each proportioning scheme to reduce the discreteness of test data. All specimens are naturally dried for 1 day after demolding and then put into an oven at 40℃ for drying. Then the specimens are taken out to measure the average density of similar materials.
Table 3 lists the test results. The uniaxial compressive strength of the specimens is tested by a rigid testing machine at a loading speed of 0.5 mm/min [
35].
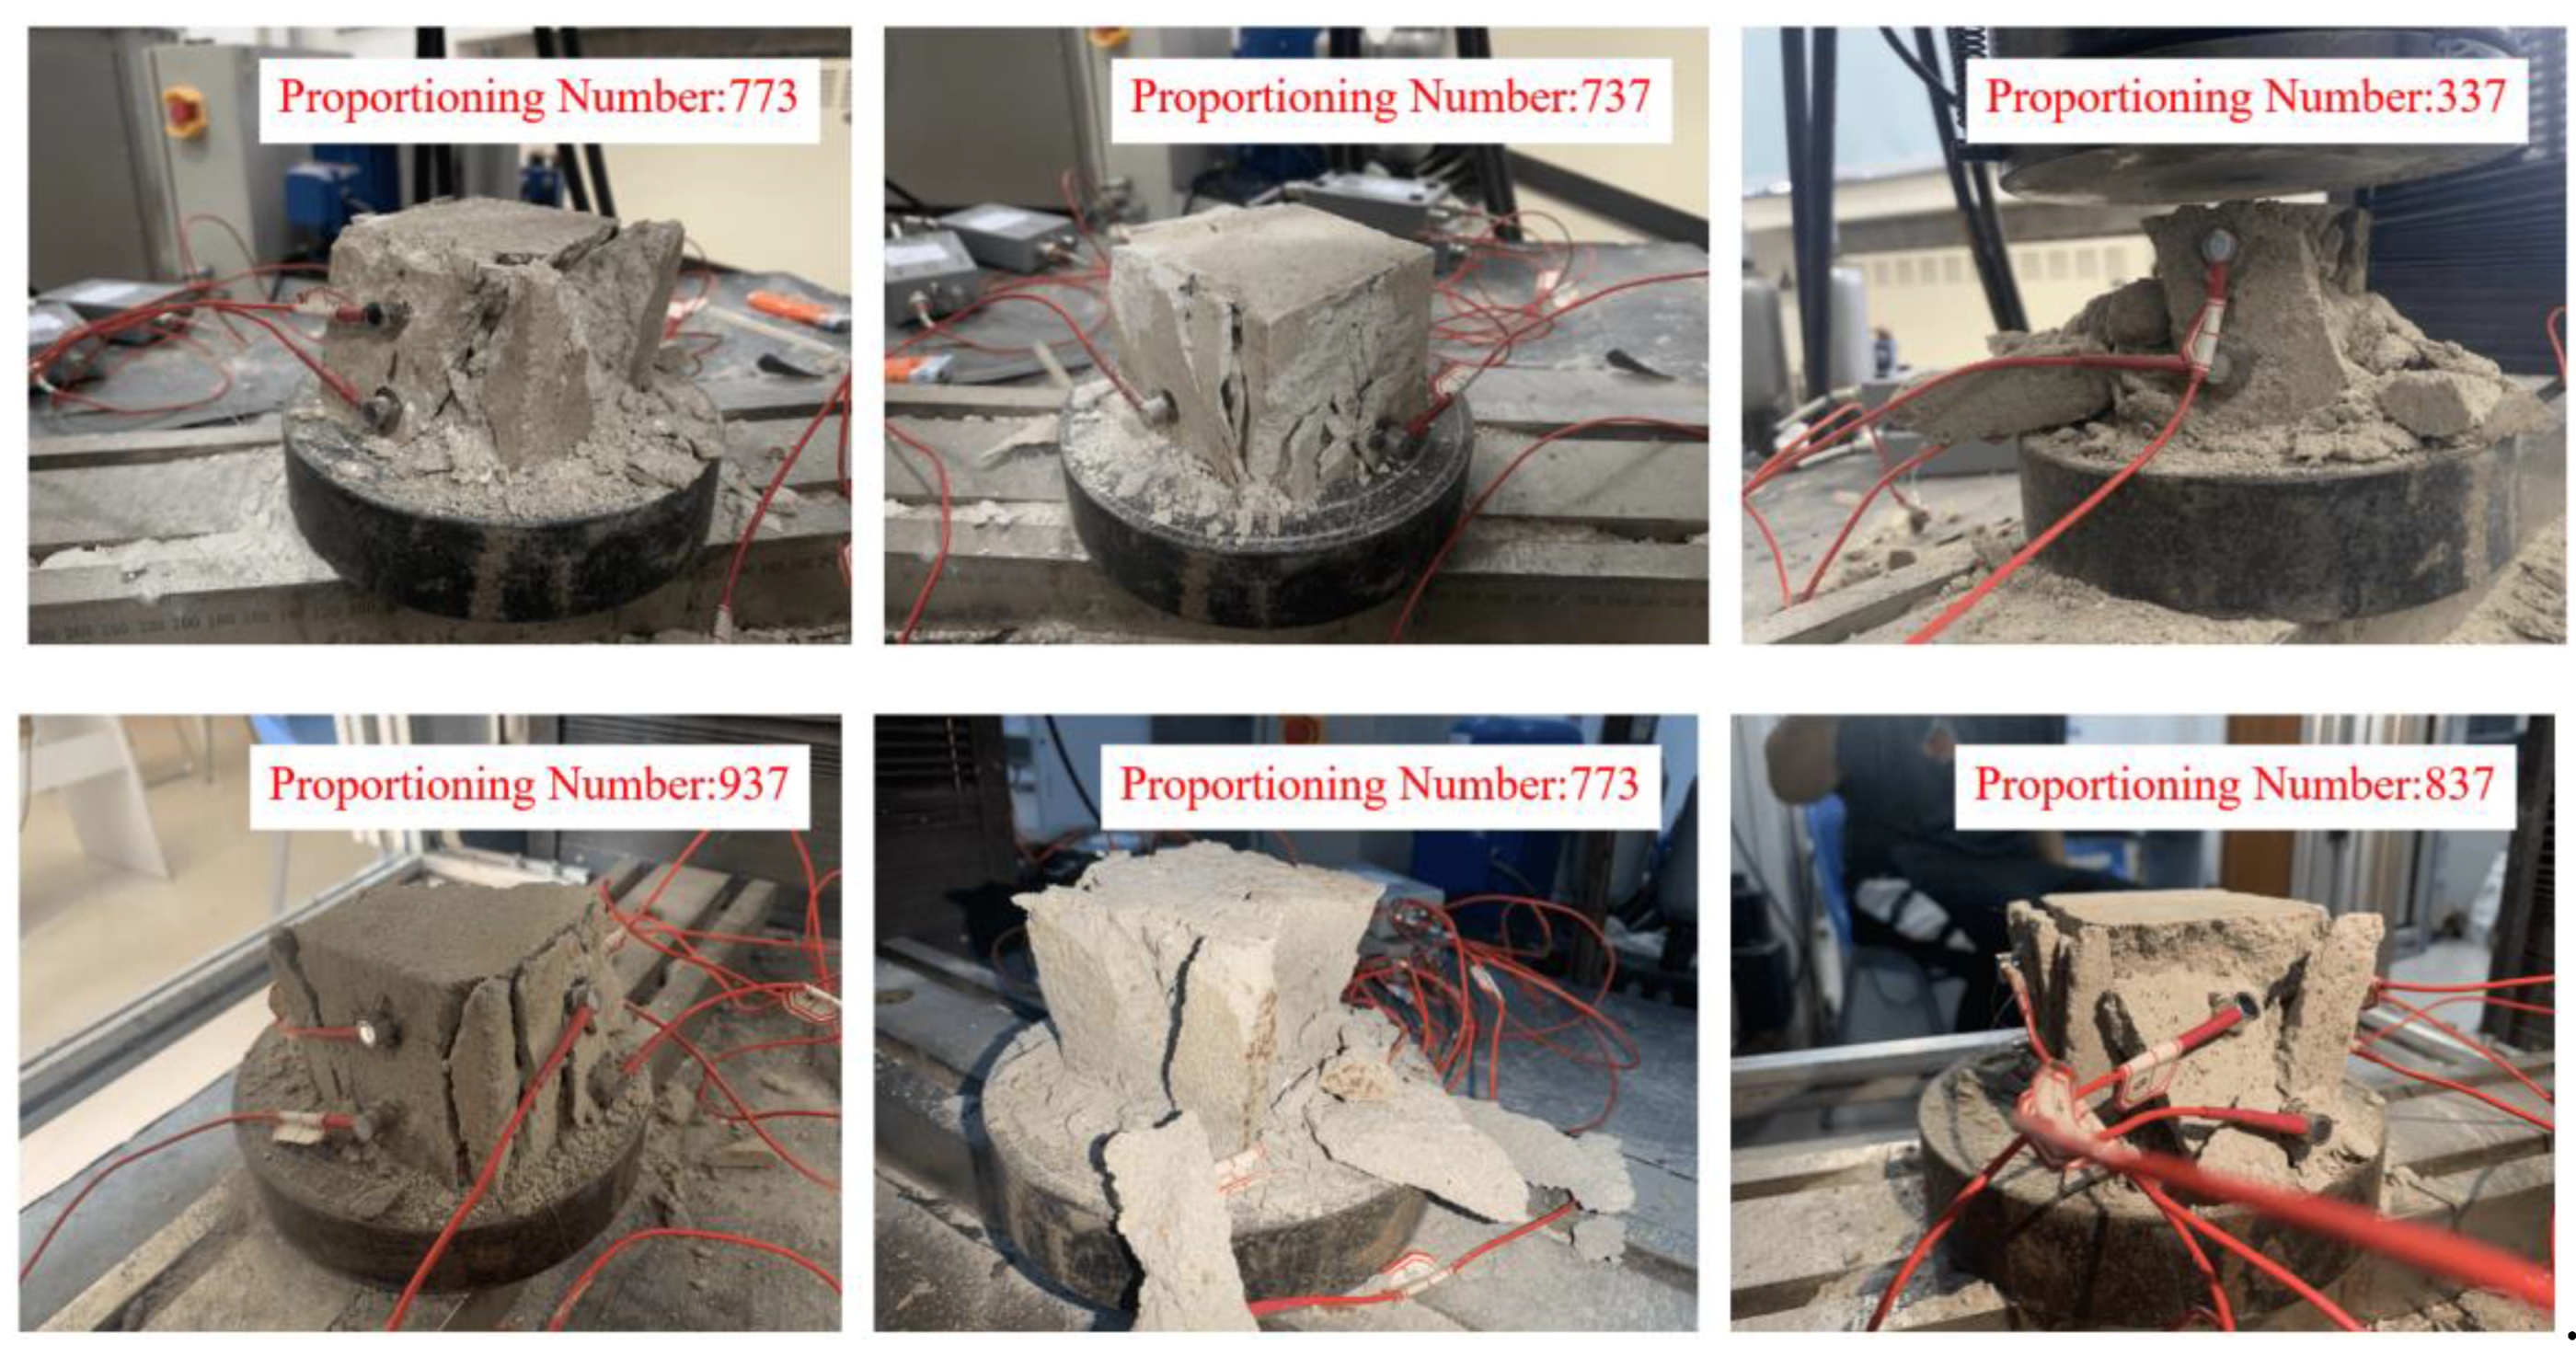
Figure 5 shows the failure states of specimens with various proportions under uniaxial compression.
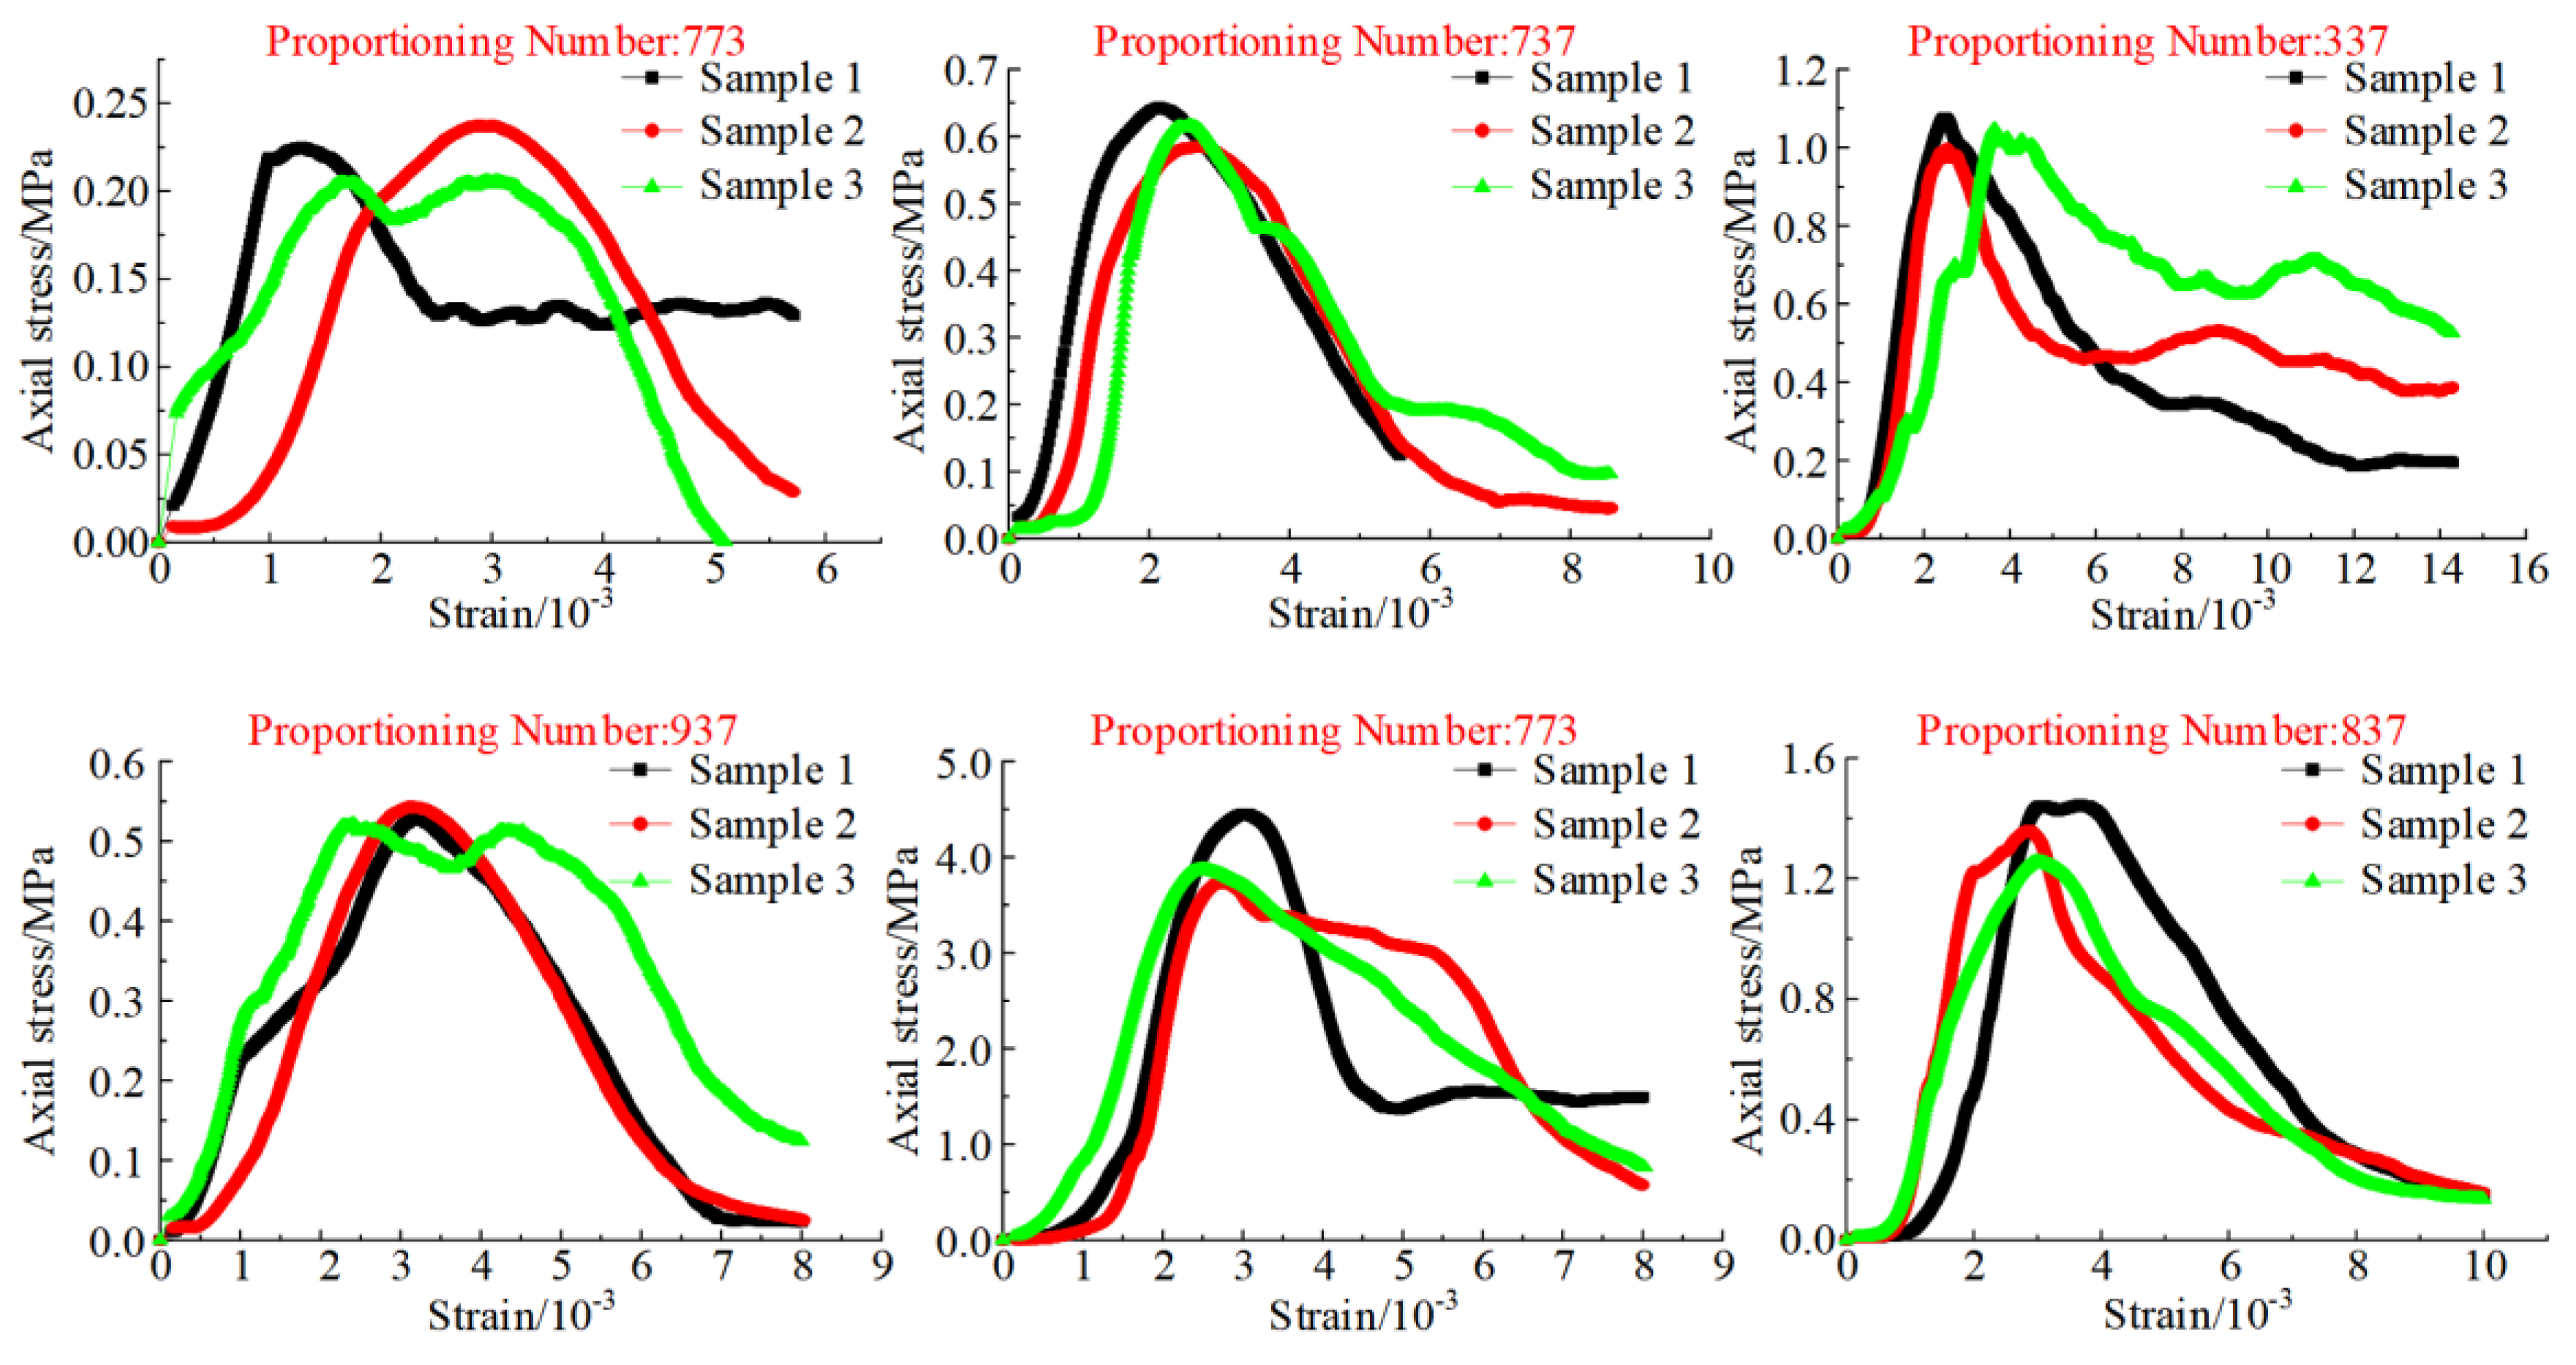
Figure 6 shows the stress-strain curves of specimens with different proportioning schemes under uniaxial compression. The average value of the uniaxial compressive strength of three specimens can be calculated. Thereby, the uniaxial compressive strength of various proportioning materials is 0.22, 0.61, 1.03, 0.53, 4.02, and 1.35 MPa in sequence. The difference between the uniaxial compressive strength and reference strength of similar materials is obvious by comparing
Table 3. According to the similarity ratio of strength, a similar material with proportioning number 773 is used to simulate weak rocks. Besides, a similar material with proportioning number 837 is used to simulate other surrounding rocks.
3.3. Test Scheme and Monitoring Method
Figure 7 shows the physical models laid according to the proportioning schemes for similar materials of the rock stratum. Plexiglass sheets with a thickness of 100 mm are installed on the front and rear sides and reinforced with a steel grating after the model is naturally dried. The frame beams and plexiglass sheets fix the displacement around and at the bottom of the model. Hydraulic jacks are used to apply vertical loads to the top of the models to simulate overlying-stratum stress. The load is determined by converting the pressure gauge reading of the hydraulic pillow.
Burial depth is designed to be 1,000 m at the top of the model due to the research background for deep mining. The load applied at the top of the models is gradually increased from 0 to 0.35 MPa with an increment of 0.07 Mpa based on
Cσ after the excavation of chamber in physical models. Eight earth pressure boxes are arranged in each physical model to monitor the evolution law of the stress field in surrounding rocks after chamber is excavated.
Figure 4 presents the specific location of each earth pressure box. Monitoring data are stored in real-time by a static strain gauge. The deformation and failure of surrounding rocks are monitored and recorded by drawing grids on the surfaces of physical models.
3.4. Analysis of Test Results
The evolution law of the stress field in the surrounding rocks of DCCS in the three physical models is analyzed according to the measured data of 1, 3, and 8
# earth pressure boxes in
Figure 8. (1) Surrounding-rock stress increases with the increased load. Besides, the increased stress of the side surrounding rocks is significantly higher than that of roof and floor. (2) Surrounding rocks near the steel plate inevitably undergo compression failure after initial loadings. As a result, vertical stress monitored by 1
# earth pressure box is always lower than the load value. (3) Based on monitoring data from 1# earth pressure box, the descending order of chamber roof damage degree is as follows: models 3, 6, and 8. (4) 3
# earth pressure box is always located in the increased zone of surrounding-rock stress. The damage degree of surrounding rocks is positively correlated with the stress concentration coefficient. Therefore, the damage degree of the side surrounding rocks of models 6, 3, and 8 is in descending order. (5) Data obtained from 8
# earth pressure box indicate that the attenuation of stress outside the weak rock area on the floor of models 6, 8, and 3 follows descending order after excavating chamber.
The measuring points are separately arranged on the roof, side, and floor of chamber to monitor the evolution of the displacement field in surrounding rocks during the loading process.
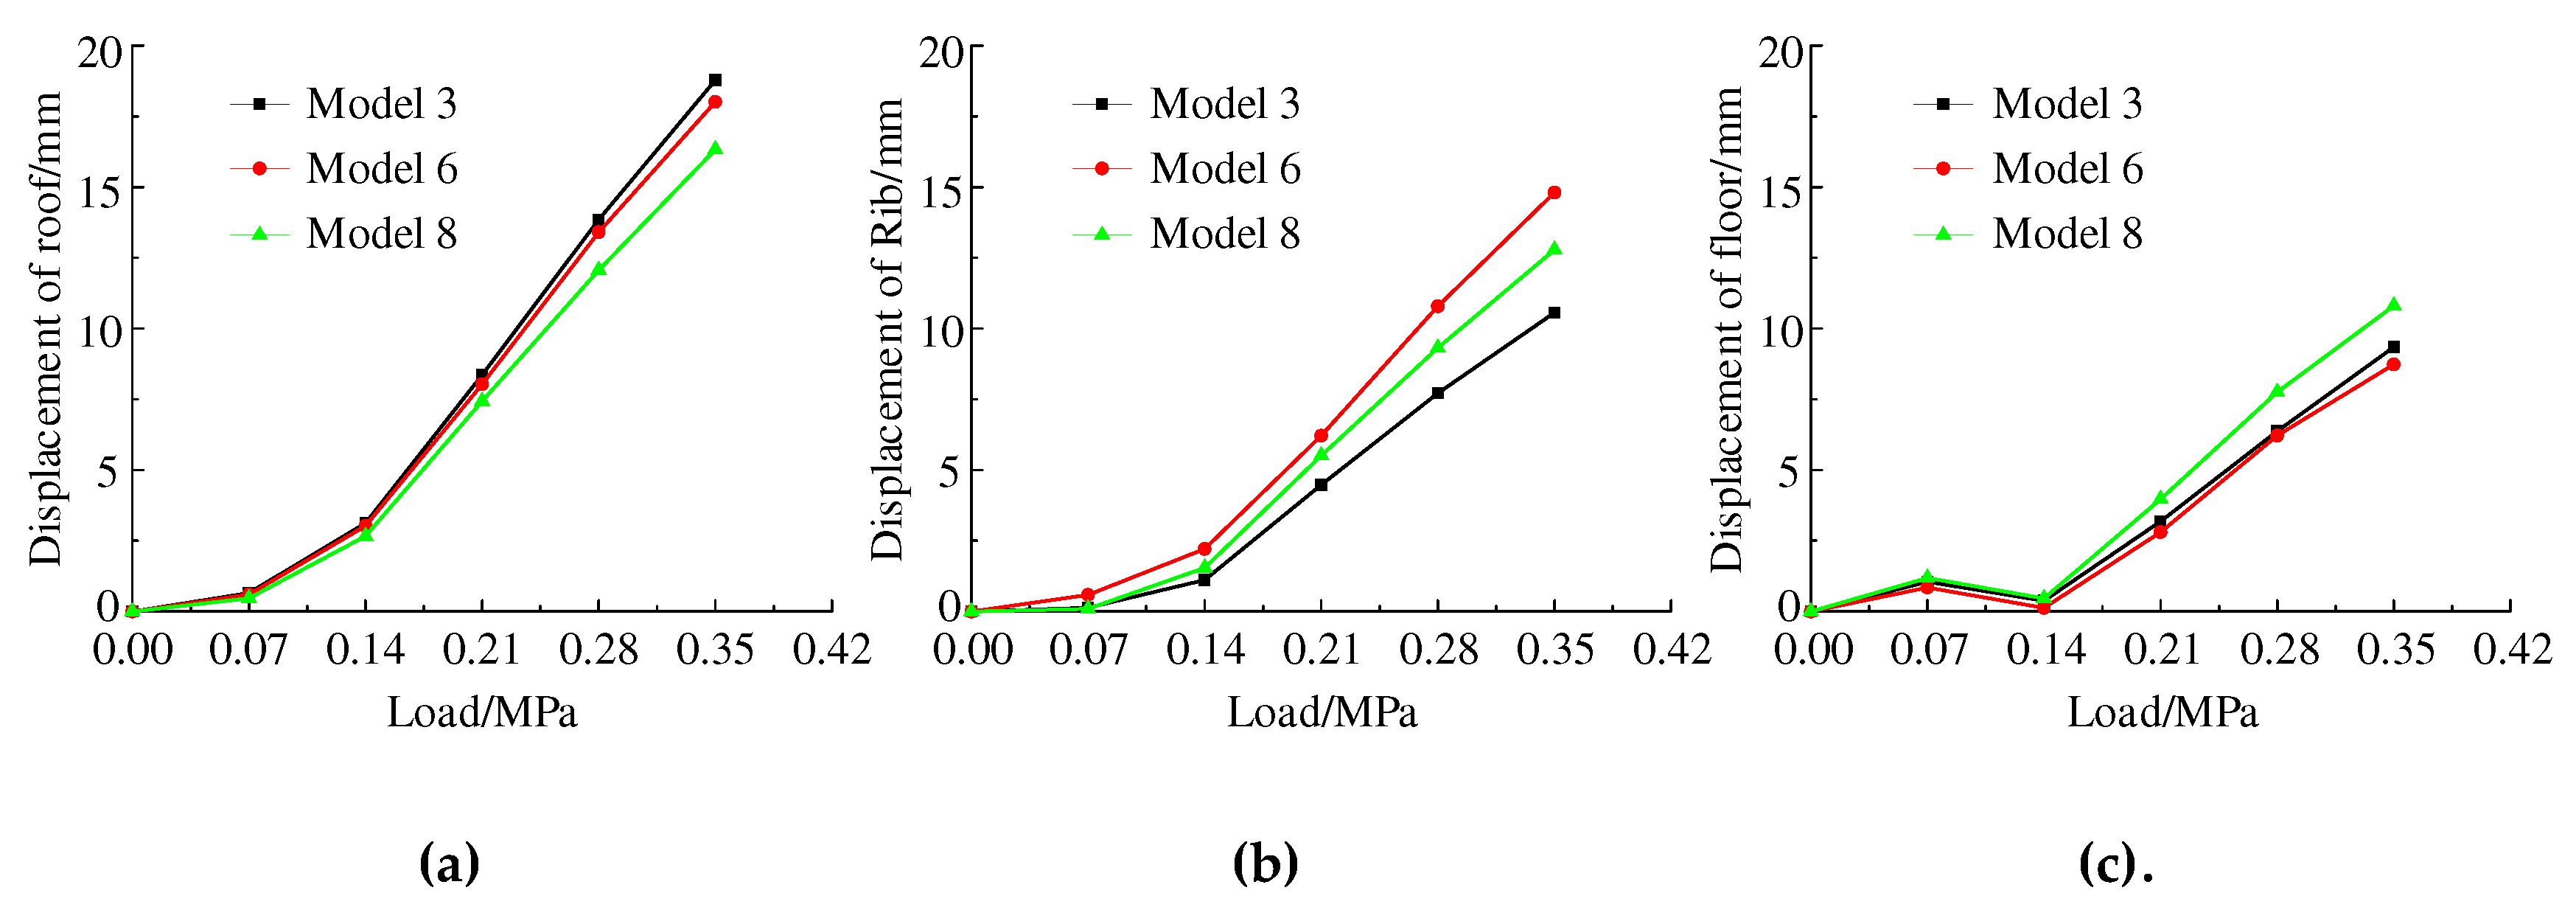
Figure 9 shows the results. (1) The maximum displacement of surrounding rocks is in the weak stratum. (2) The growth rate of the surrounding-rock displacement significantly increases when the load increase from 0.14 MPa. (3) The roof displacements of models 3, 6, and 8 are in descending order under the same loading. The displacements of the side surrounding rocks of models 6, 8, and 3 are in descending order. Besides, the floor displacements of models 8, 3, and 6 are in descending order.
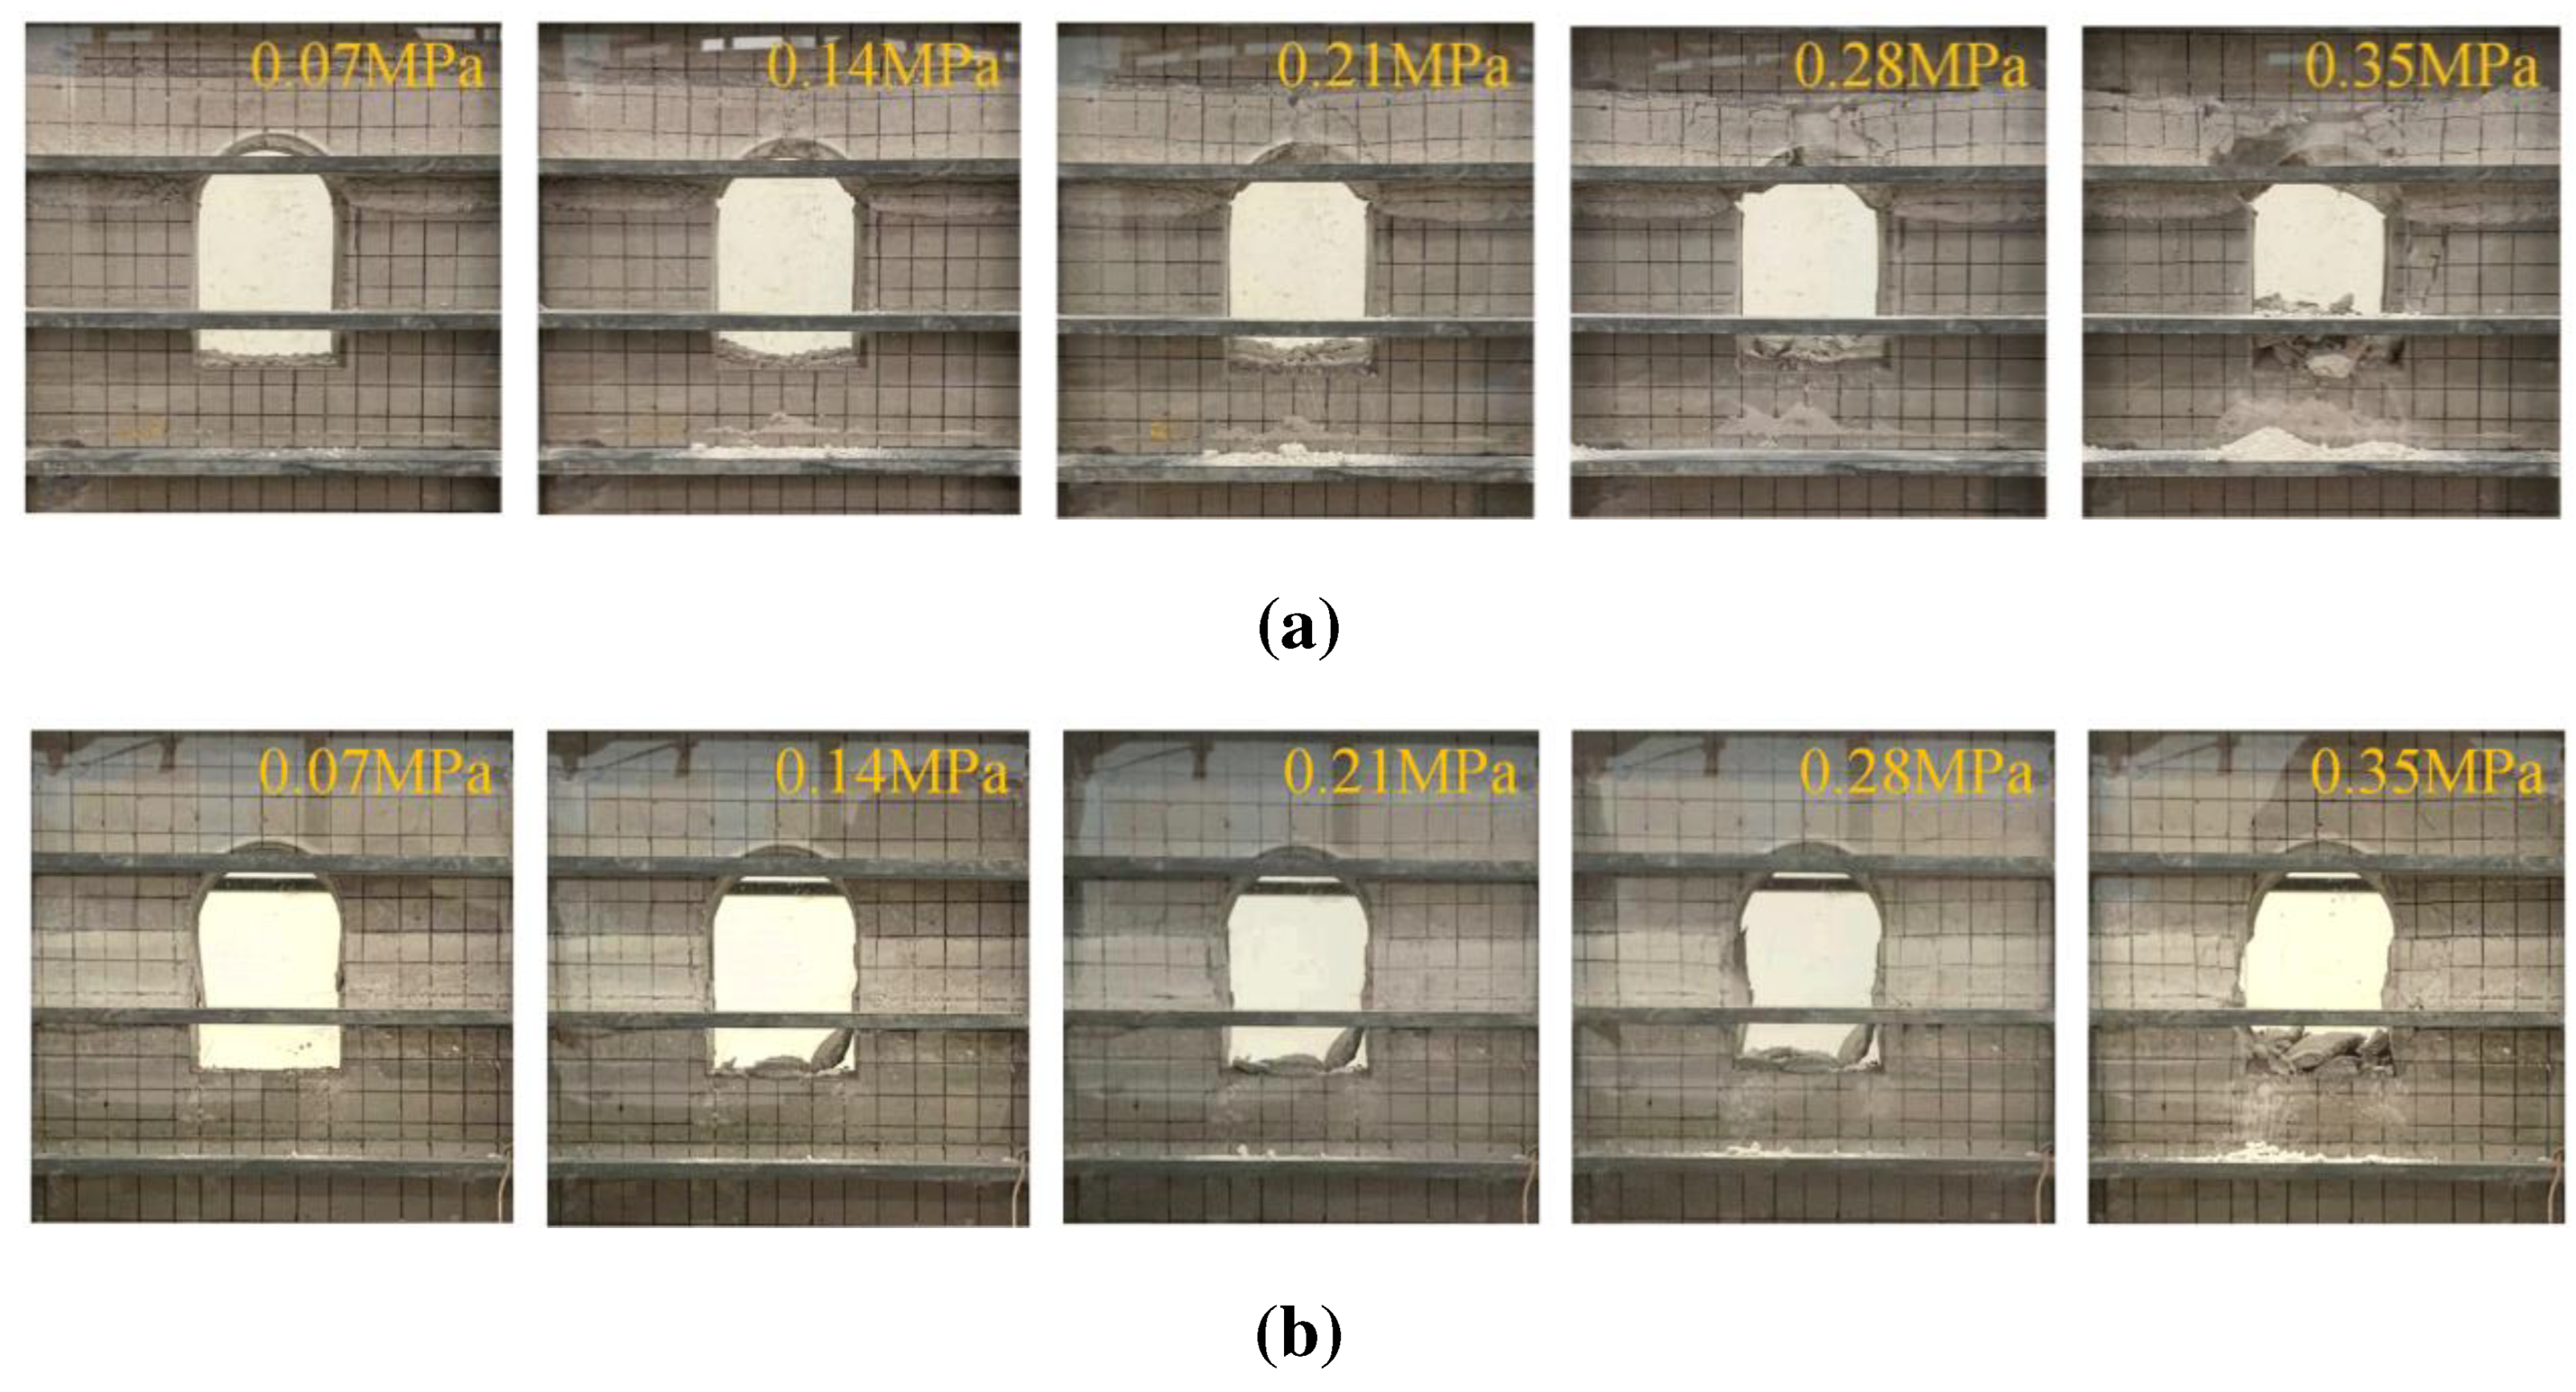
Figure 10 shows the deformation and failure of the surrounding rocks of chamber at each loading stage. (1) The weak stratum first fails within each physical model during loading. (2) When the weak stratum is located at roof, the axial tensile cracks first occur in the middle of roof with the increased load. Then roof experiences penetrating failure and bending deflection. As a result, rock masses at the shoulder arch also undergo tensile-fracture failure. The broken blocks engage with each other by friction and gradually slide off. Side surrounding rocks finally experience wedge failure due to the weakened constraint effect. (3) When a weak stratum is located on the side, weak rocks of the free surface first undergo buckling failure under squeezed roof and floor. The buckling failure of weak rocks gradually increases with the increased load, and the damage range inside weak rocks is gradually expanded. Weak rocks ultimately exhibit a concave failure pattern. (4) Floor first generates tensile cracks during loading when a weak stratum is located at floor. The tensile cracks develop, and floor eventually swells and damages. As a result, constraints on side surrounding rocks near floor are weakened, and side surrounding rocks undergo wedge failure eventually. (5) The deformation and failure of the surrounding rocks of chamber in models 3, 6, and 8 are in descending order under the same loading.
4. Numerical Simulation Schemes, Results, and Discussion
4.1. Numerical Simulation Schemes
The similar simulation tests mentioned earlier cannot consider the key factor of the lateral pressure coefficient. Therefore, the 15 groups of plane-strain numerical models for DCCS are established using FLAC
3D software (
Figure 3).
Figure 11 shows the dimensions and boundary conditions of the numerical model. Normal displacement constraints are applied to the periphery and bottom of the model. The thickness of the weak stratum is 5 m in models 3 to 8, and the thickness of the weak stratum is 2 m in models 9 to 15. The Mohr–Coulomb constitutive model is applied to all numerical models.
Table 2 lists the physical and mechanical parameters of rock masses. Numerical calculations follow the software's default convergence standards. Vertical stress applied to the top of the model is 25 MPa, and horizontal stress is specifically determined by lateral pressure coefficient
λ.
λ is 0.6, 1.0, 1.4, and 1.8. There are a total of 60 sets of numerical simulation schemes.
4.2. Analysis of Numerical Simulations
Figure 12 shows the plastic failure range and displacement distribution characteristics of surrounding rocks of DCCS in each scheme when
λ is 1.0. PFA is the plastic failure area of cross-sectional surrounding rocks calculated by the self-programmed FISH program. (1) The plastic failure range and maximum displacement of surrounding rocks are positively correlated with the thickness of the weak stratum. The maximum displacement of surrounding rocks occurs in weak rocks on the free surface. (2) The constraint effect on adjacent surrounding rocks is weakened after the failure of the weak stratum. It results in the wedge-shaped failure of adjacent surrounding rocks, which is consistent with the results of similar simulation tests. (3) The plastic failure range of surrounding rocks is the largest when the roof of DCCS is arranged along the weak stratum. The maximum displacement of surrounding rocks reaches the peak when the floor of DCCS is arranged along the weak stratum. (4) There is no direct correspondence between the plastic failure range of the surrounding rocks and the maximum displacement. For example, the plastic failure range of surrounding rocks in model 4 is larger than that in model 5. However, the maximum displacement of its surrounding rocks is smaller than that in model 5. (5) The plastic failure range of surrounding rocks in model 8 is minimum when the thickness of the weak stratum is 5 m. Besides, the maximum displacement of surrounding rocks in model 7 is the minimum value. (6) The plastic failure range and maximum displacement of surrounding rocks in model 14 are both minimum values when the thickness of the weak stratum is 2 m.
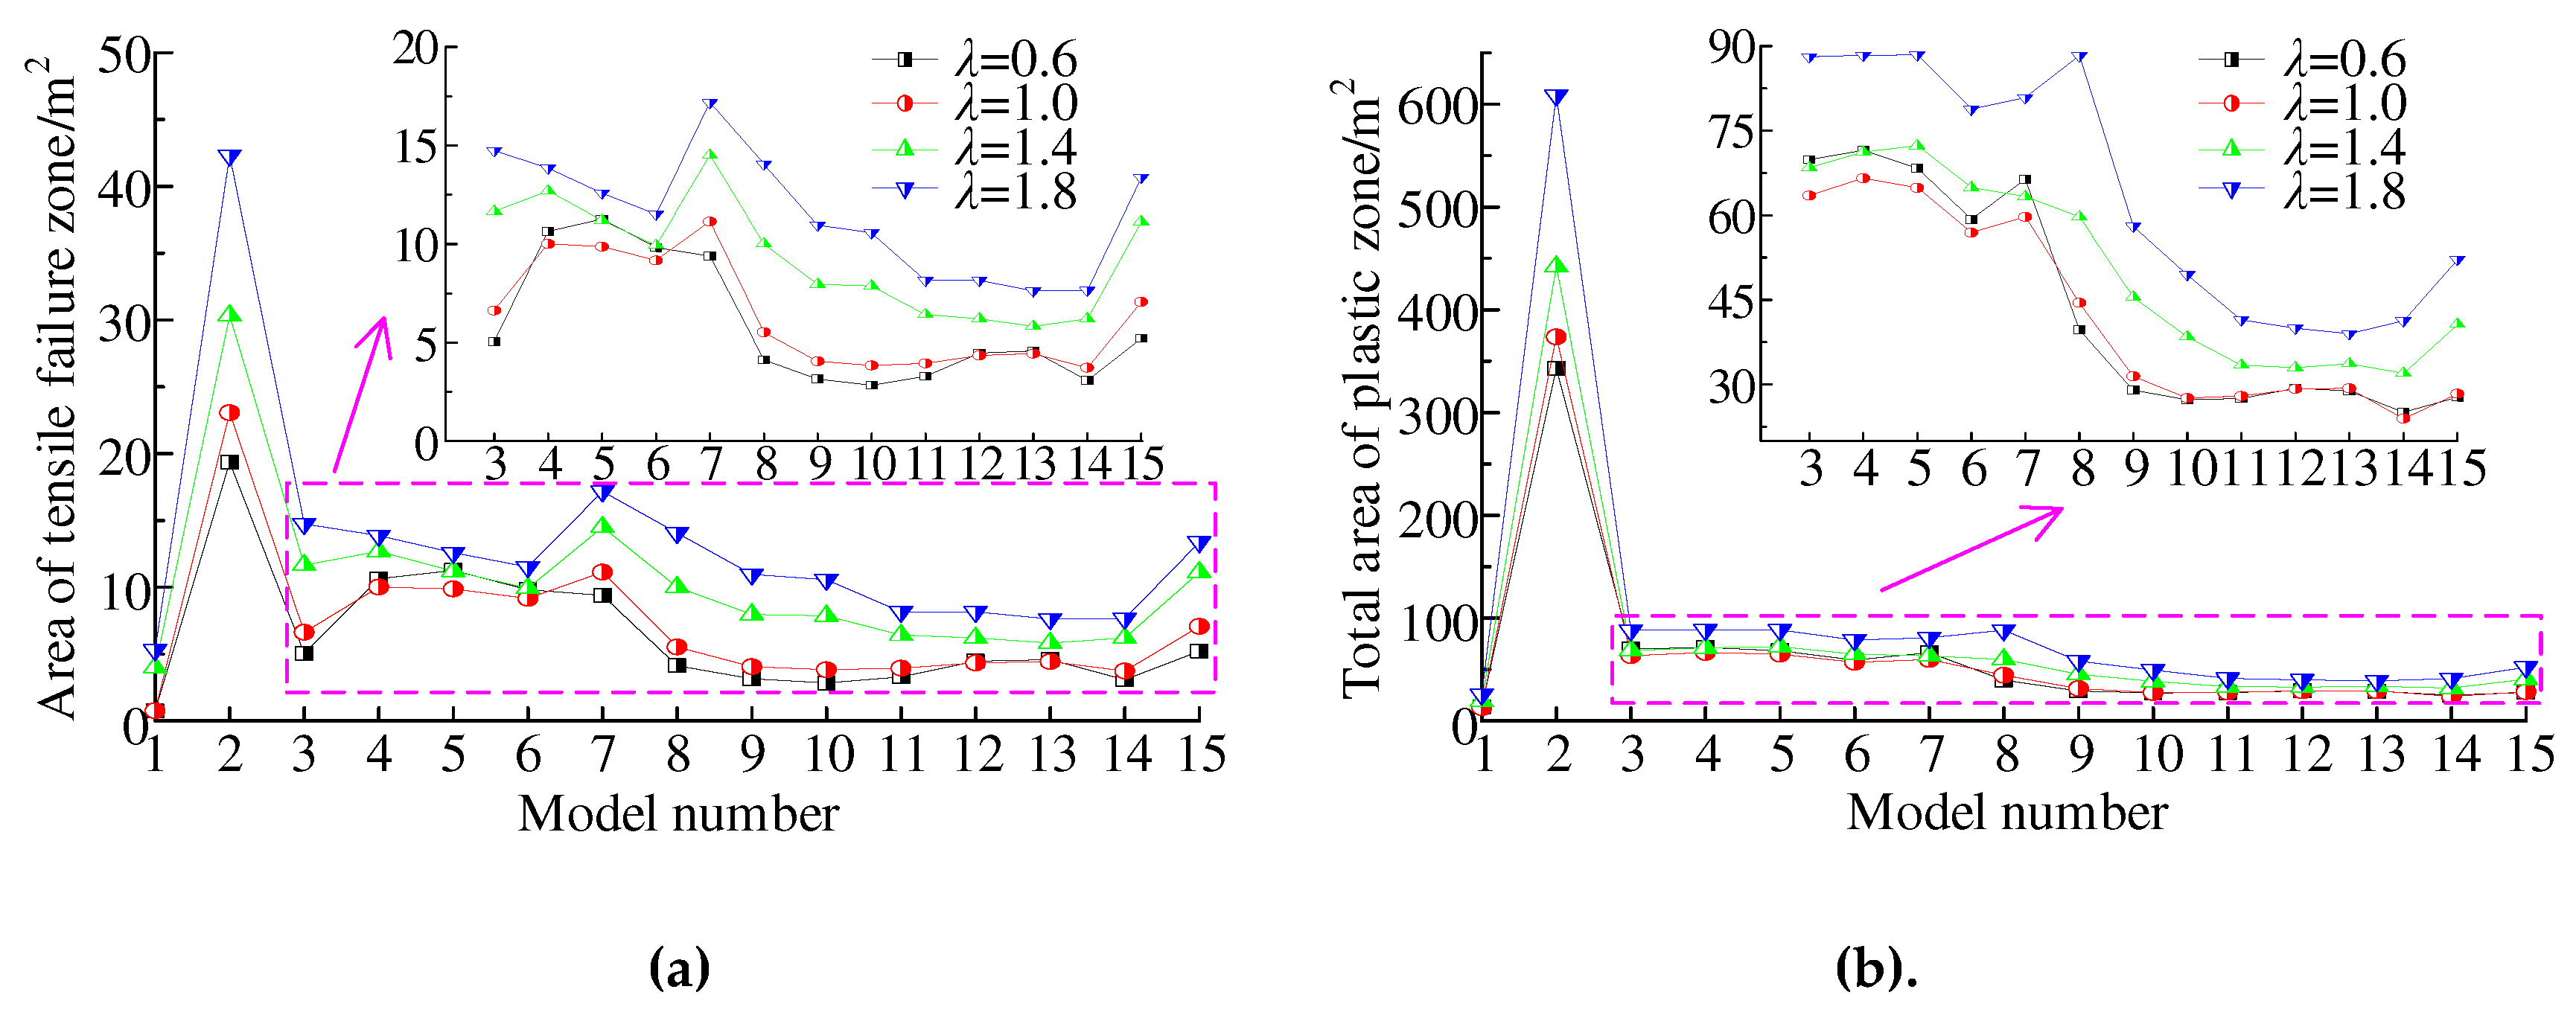
Figure 13 shows the variation curves of the PFA of DCCS’ surrounding rocks under different lateral pressure coefficients. (1) The tensile failure area (TFA) and the PFA are always positively correlated with the thickness of the weak stratum. (2) When the thickness of the weak stratum is 5 m, the TFA and PFA of surrounding rocks in model 8 are the minimum values in the interval of 0.6 ≤
λ ≤ 1.4. Arranging the floor of DCCS along the weak stratum is beneficial to reducing the plastic failure range of surrounding rocks. (3) When the thickness of the weak stratum is 5 m, the TFA and PFA of surrounding rocks in model 6 are minimum if
λ is 1.8. Arranging the side of DCCS along the weak stratum is most conducive to reducing the plastic failure range of surrounding rocks at this time. (4) When the thickness of the weak stratum is 2 m, the TFA and PFA of surrounding rocks in model 14 are minimum in the interval of 0.6 ≤
λ ≤ 1.4. Arranging the side near the floor of DCCS along the weak stratum is most conducive to reducing the plastic failure range of surrounding rocks when the thickness of the weak stratum is small. (5) If the thickness of the weak stratum is 2 m and
λ is 1.8, the plastic failure range of surrounding rocks is minimum when the weak stratum is located in the middle of the side.
Figure 14 shows the variation curves of the convergence of DCCS’ surrounding rocks. (1) The location of the weak stratum is the maximum deformation area of the surrounding rocks of DCCS. It is consistent with the results of similar simulation tests. (2) The convergence of roof and floor is maximum when the weak stratum is located at floor. (3) The convergence of the two ribs is proportional to
λ. (4) When the thickness of the weak stratum is 5 m and
λ is 0.6, the horizon of the weak stratum has little effect on the convergence of roof and floor. (5) The displacement of the weak stratum in model 7 is minimum in the interval of 0.6 ≤
λ ≤ 1 when the thickness of the weak stratum is 5 m. Besides, the displacement of the weak stratum in model 6 is minimum in the interval of
λ ≥ 1.4. (6) The displacement of the weak stratum in model 14 is minimum in the interval of 0.6 ≤
λ ≤ 1 when the thickness of the weak stratum is 2 m. Furthermore, the displacement of the weak stratum in model 12 is minimum in the interval of
λ ≥ 1.4.
The lateral pressure coefficient is consistent with the thickness of the weak stratum. However, the model with the minimum plastic failure range of surrounding rocks is not completely consistent with the model with the minimum convergence of surrounding rocks. A comprehensive evaluation coefficient of surrounding-rock stability is proposed as an evaluation index to quantitatively evaluate the optimal layout method of DCCS based on the horizon of the weak stratum. When
λ is 1, the following parameters are taken as reference quantities separately, i.e., the convergence of roof and floor, the convergence of the two sides, the maximum displacement of the weak stratum, and the PFA of the surrounding rocks of DCCS in model 3. The ratio of each quantity in other models to the corresponding reference quantity is defined as the evaluation factor of surrounding-rock stability. The comprehensive evaluation coefficient of surrounding-rock stability is obtained by multiplying evaluation factors.
Figure 15 shows the calculation results of the comprehensive evaluation coefficients of the surrounding-rock stability of DCCS in all models.
The following results can be obtained based on
Figure 15. (1) If the thickness of the weak stratum is large, the floor of DCCS arranged along the weak stratum is the most conducive to surrounding-rock control when 0.6 ≤
λ ≤1. Surrounding-rock stability is optimal with the side of DCCS arranged along the weak stratum and
λ > 1. (2) If the thickness of the weak stratum is small, the side near the floor of DCCS arranged along the weak stratum is the most conducive to surrounding-rock stability with 0.6 ≤
λ ≤1. Surrounding-rock stability is optimal when the side near the roof of DCCS is arranged along a weak stratum and
λ > 1.
5. Discussion
The work does not consider the cases of λ < 0.6 and λ > 1.8 in numerical simulations. We have studied the deformation and failure of the surrounding rocks of DCCS in both cases at the early stage. The research results show that the damage degree to the roof and floor of DCCS is significantly greater than that of the two sides when λ < 0.6 and λ > 1.8. That is, the crucial factor in controlling the surrounding rock is to manage roof and floor. Therefore, based on the horizon of the weak stratum, the optimal layout methods of DCCS when λ < 0.6 or λ > 1.8 are consistent with that when λ > 1.
At present, there are relatively few related studies on the influence of the horizon of the weak stratum on the surrounding rock stability of roadways and chamber. Ref. [
36] analyzes the instability characteristics and failure forms of roof under different horizons of the weak stratum. According to the different horizons of the weak stratum, the hierarchical reinforcement control measures of roof are proposed. Ref. [
37] points out that the surrounding rock deformation and stress concentration are relatively small when the weak stratum is located at floor or the side near floor. Moreover, the surrounding-rock stability is optimal when the weak stratum is located at the side near floor.
Above research is of great significance for guiding engineering practice. However, the research object does not involve a roadway or chamber with structural features of a small width-to-height ratio. Meanwhile, the optimal layout methods of the roadway or chamber based on the horizon of the weak stratum in different ground stress environments have not been specified. Therefore, the optimal layout methods of DCCS based on the horizon of the weak stratum proposed in the work can provide a reference for engineering practice. The research results have relatively great potential for application in deep resource mining.
6. Conclusions
Determining the optimal layout methods of DCCS based on the horizon of the weak stratum was of great significance for reducing difficulties in surrounding-rock control and ensuring safe and efficient mining. The work summarized the main structural characteristics of underground chamber for coal-gangue separation. The deformation and failure characteristics of the surrounding rocks of DCCS were analyzed with the changes in the horizon of the weak stratum based on similarity simulation tests. A comprehensive evaluation method for surrounding-rock stability was proposed. Finally, numerical simulations were used to determine the optimal layout methods of DCCS based on the horizon of the weak stratum under different lateral pressure coefficients and thicknesses of the weak stratum. The main conclusions are as follows.
(1) DCCS had the structural characteristics of a large section. A small ratio of the width to height and the axial length were significantly larger than those of the section size.
(2) The results of similar simulation tests showed that weak rocks were deformed and damaged on the free surface after DCCS was excavated. Adjacent surrounding rocks underwent wedge failure due to the weakened restraint after weak-rock failure.
(3) Lateral pressure coefficient λ and the thickness and horizon of the weak stratum affected the surrounding-rock stability of DCCS. Numerical simulation results showed that the plastic failure range and maximum displacement of surrounding rocks were positively correlated with the thickness of the weak stratum. The plastic failure range of surrounding rocks was the largest when the roof of DCCS was arranged along the weak stratum. Besides, the maximum displacement of surrounding rocks reached the peak when the floor of DCCS was arranged along the weak stratum. The convergence of two ribs was proportional to λ.
(4) If the thickness of the weak stratum was large, the floor of DCCS arranged along the weak stratum was the most conducive to surrounding-rock control when 0.6 ≤ λ ≤1. Surrounding-rock stability was optimal with the side of DCCS arranged along a weak stratum and λ < 0.6 or λ > 1. If the thickness of the weak stratum was small, the side near the floor of DCCS arranged along the weak stratum was the most conducive to surrounding-rock stability with 0.6 ≤ λ ≤1. Besides, surrounding-rock stability was optimal with the side near the roof of DCCS arranged along the weak stratum and λ < 0.6 or λ > 1.
Author Contributions
All of the authors contributed extensively to the work. C.Z. and Y.Y. proposed key ideas. H.S. provided practice guidance in the research process. C.Z. and Z.C. contributed to field measurements. C.Z., Z.C., and W.W. mainly completed similar simulation tests and numerical simulations. Z.C. and W.W. analyzed the data. C.Z. wrote the paper. C.Z. and H.S. modified the manuscript. All authors have read and agreed to the published version of the manuscript.
Funding
This work was funded by the Research Fund of Key Laboratory of Deep Coal Resource Mining (CUMT), Ministry of Education (Grant No. KLDCRM202205) and the National Natural Science Foundation of China (Grant No. 51974294).
Institutional Review Board Statement
Not applicable.
Informed Consent Statement
Not applicable.
Conflicts of Interest
The authors declare no conflict of interest.
References
- Xie, H.P.; Ju, Y.; Ren, S.H.; Gao, F.; Liu, J.z.; Zhu, Y. Theoretical and technological exploration of deep in situ fluidized coal mining. Front. Energy 2019, 13, 603–611. [Google Scholar]
- Zhao, Z.H.; Tan, Y.L.; Chen, S.J.; Ma, Q.; Gao, X.J. Theoretical analyses of stress field in surrounding rocks of weakly consolidated tunnel in a high-humidity deep environment. Int. J. Rock Mech. Min. Sci. 2019, 122, 104064. [Google Scholar]
- Yang, S.L.; Wang, J.J.; Li, M.; Yue, H. Research on intellectualized location of coal gangue logistics nodes based on particle swarm optimization and quasi-newton algorithm. Mathematics 2022, 10, 162. [Google Scholar]
- Zhang, J.X.; Li, M.; Taheri, A.; Zhang, W.Q.; Wu, Z.Y.; Song, W.J. Properties and application of backfill materials in coal mines in China. Minerals 2019, 9, 53. [Google Scholar]
- Zhang, J.X.; Zhang, Q.; Spearing, A.J.S.; Miao, X.A.; Guo, S.; Sun, Q. Green coal mining technique integrating mining-dressing-gas draining-backfilling-mining. Int. J. Min. Sci. Technol. 2017, 27, 17–27. [Google Scholar]
- Zhang, Q.; Kang, Y.; Zhang, J.X.; Yin, W.; Liu, X.W.; Wu, Z.Y.; Song, W.J.; Xu, X.L. Monitoring and measurement analysis of key indexes for the implementation of mining, dressing, backfilling, and controlling technology in coal resources-A case study of Tangshan Mine. Energy Sci. Eng. 2022, 10, 680–693. [Google Scholar]
- Zhang, Q.; Zhang, J.X.; Tai, Y.; Fang, K.; Yin, W. Horizontal roof gap of backfill hydraulic support. J. Cent. South Univ. 2015, 22, 3544–3555. [Google Scholar]
- Zhang, J.X.; Miao, X.X.; Zhang, Q.; Zhang, J.G.; Yan, H. Integrated coal and gas simultaneous mining technology: mining-dressing-gas draining-backfilling. J. China Coal Soc. 2016, 41, 1683–1693. [Google Scholar]
- Yuan, Y.; Yuan, C.F.; Zhu, C.; Wang, P. Mechanical model and application of the deformation cylinder of the surrounding rock in the deep large section chamber. J. Min. Saf. Eng. 2020, 37, 338–348. [Google Scholar]
- Zhu, C.; Yuan, Y.; Wang, W.M.; Chen, Z.S.; Wang, S.Z.; Zhong, H.W. Research on the “three shells” cooperative support technology of large-section chambers in deep mines. Int. J. Min. Sci. Technol. 2021, 31, 665–680. [Google Scholar]
- Tan, Y.L.; Fan, D.Y.; Liu, X.S.; Song, S.L.; Li, X.F.; Wang, H.L. Numerical investigation of failure evolution for the surrounding rock of a super-large section chamber group in a deep coal mine. Energy Sci. Eng. 2019, 7, 3124–3146. [Google Scholar]
- Fan, D.Y.; Liu, X.S.; Tan, Y.L; Li, X.B.; Lkhamsuren, P. Instability energy mechanism of super-large section crossing chambers in deep coal mines. Int. J. Min. Sci. Technol. 2022, 32, 1075–1086. [Google Scholar]
- Zhai, X.X.; Huang, G.S.; Chen, C.Y.; Li, R.B. Combined supporting technology with bolt-grouting and floor pressure-relief for deep chamber: An underground coal mine case study. Energies 2018, 11, 67. [Google Scholar]
- Liu, X.S.; Fan, D.Y.; Tan, Y.L.; Song, S.L.; Li, X.F.; Ning, J.G.; Gu, Q.H.; Ma, Q. Failure evolution and instability mechanism of surrounding rock for close-distance parallel chambers with super-large section in deep coal mines. Int. J. Geomech. 2021, 21, 04021049. [Google Scholar]
- Sun, X.M.; Wang, D.; Miao, C.Y.; Li, Y.; Xu, H.C. Research on dynamic pressure instability mechanism and control countermeasure of deep pump room and chamber group in Nantun Coal Mine. J. China Coal Soc. 2015, 40, 2303–2312. [Google Scholar]
- Jia, S.P.; Yang, J.W.; Gao, M.; Jia, L.F.; Wen, C.X.; Wu, G.J. Experimental and numerical analysis of deformation and failure behaviour for deep roadways in soft rocks. B. Eng. Geol. Environ. 2022, 81, 1–24. [Google Scholar]
- Liu, H.Y.; Liu, C.W.; Zhai, M.H.; Zhang, P.; Wang, L.J.; Wang, F.; Liu, J.A. Collaborative control technology of crosscut floor heave in soft rocks under deep high horizontal stress. Math. Probl. Eng. 2022, 2022, 1–13. [Google Scholar]
- Liu, X.S.; Song, S.L.; Tan, Y.L.; Fan, D.Y.; Ning, J.G.; Li, X.B.; Yin, Y.C. Similar simulation study on the deformation and failure of surrounding rock of a large section chamber group under dynamic loading. Int. J. Min. Sci. Technol. 2021, 31, 495–505. [Google Scholar]
- Kang, H.P.; Wang, J.H.; Lin, J. Case studies of rock bolting in coal mine roadways. Chin. J. Rock Mech. Eng. 2010, 29, 649–664. [Google Scholar]
- Tan, Y.L.; Fan, D.Y.; Liu, X.S.; Li, X.F.; Ma, Q.; Wang, H.L.; Fan, W.C. Discrimination method and engineering characteristics of super large section chamber in coal mine. J. Min. Saf. Eng. 2020, 37, 23–31. [Google Scholar]
- Yuan, L.; Xue, J.H.; Liu, Q.S.; Liu, B. Surrounding rock stability control theory and support technique in deep rock roadway for coal mine. J. China Coal Soc. 2011, 36, 535–543. [Google Scholar]
- Li, Z.X.; Zhang, Y.D.; Ma, Q.; Zheng, Y.; Song, G.Y.; Yan, W.Z.; Zhang, Y.; Hu, L. The floor heave mechanism and control technology of gob-side entry retaining of soft rock floor. Sustainability 2023, 15, 6074. [Google Scholar]
- Xie, S.R.; Jiang, Z.S.; Chen, D.D.; Wang, E. Study on zonal cooperative control technology of surrounding rock of super large section soft rock chamber group connected by deep vertical shaft. Adv. Civ. Eng. 2022, 2022, 1–17. [Google Scholar]
- Zhang, W. Study on stress disturbed mechanism and supporting method of weakly cemented roadway near chambers. Complexity 2023, 2023, 1–12. [Google Scholar]
- Yuan, Y.; Liu, Z.H.; Zhu, C.; Yuan, C.F.; Wang, S.Z. The effect of burnt rock on inclined shaft in shallow coal seam and its control technology. Energy Sci. Eng. 2019, 7, 1882–1895. [Google Scholar]
- Ma, Q.; Zhang, Y.D.; Li, Z.X.; Zheng, Y.; Song, G.Y.; Hu, L. The optimized roadway layouts and surrounding rock control technology of the fully mechanized mining surface with large mining heights in high-gas mines. Processes 2022, 10, 2657. [Google Scholar]
- Li, G.; Sun, Q.H.; Ma, F.S.; Guo, J.; Zhao, H.J.; Wu, Y.F. Damage evolution mechanism and deformation failure properties of a roadway in deep inclined rock strata. Eng. Fail. Anal. 2023, 143, 106820. [Google Scholar]
- Han, P.H.; Zhang, C.; Ren, Z.P.; He, X.; Jia, S. The influence of advance speed on overburden movement characteristics in longwall coal mining: insight from theoretical analysis and physical simulation. J. Geophys. Eng. 2021, 18, 163–176. [Google Scholar]
- Wang, W.M.; Yuan, Y.; Chen, Z.S.; Zhu, C. Physical modeling of floor failure above confined water: a case study in China. Environ. Earth Sci. 2022, 81, 325. [Google Scholar]
- Kang, H.P.; Yi, K. Simulation study on dilatant and rheologic properties of soft rocks surrounding deep roadway and its application. J. China Coal Soc. 2023, 48, 15–33. [Google Scholar]
- Ma, X.M.; Xue, Y.G.; Qiu, D.H.; Xia, T.; Qu, C.Q.; Kong, F.M. Classification for tunnel surrounding rock based on multiple geological methods and extension model. B. Eng. Geol. Environ. 2023, 82, 109. [Google Scholar] [CrossRef]
- He, X.; He, S.X.; Cai, Y.B.; Xu, R.Y.; Yang, K. Investigation on rational width of coal pillar and roadway support in isolated panel of extra-thick coal seam. Front. Earth Sci. 2023, 11, 1125678. [Google Scholar] [CrossRef]
- Zhu, Z.G.; Fang, Z.C.; Xu, F.; Han, Z.M.; Guo, X.L.; Ma, C.Y. Model test study on the rock mass deformation law of a soft rock tunnel under different ground stresses. Front. Earth Sci. 2022, 10, 962445. [Google Scholar] [CrossRef]
- Ning, J.G.; Wang, J.; Bu, T.T.; Hu, S.C.; Liu, X.S. An innovative support structure for gob-side entry retention in steep coal seam mining. Minerals 2017, 7, 75. [Google Scholar] [CrossRef]
- Wang, C.; Zhu, C.; Yuan, Y.; Chen, Z.S.; Wang, W.M. Study on the working resistance of a support under shallowly buried gobs according to the roof structure during periodic weighting. Sustainability 2021, 13, 10652. [Google Scholar] [CrossRef]
- Zhang, N.; LI, G.C.; Kan, J.G. Influence of soft interlayer location in coal roof on stability of roadway bolting structure. Rock Soil Mech. 2011, 32, 2753–2758. [Google Scholar]
- Zhang, Y.G.; Tu, M. The effect of weak interlayer horizon on roadway surrounding rock stability. Safety in Coal Mines. 2014, 45, 216–218. [Google Scholar]
Figure 1.
Integrated technology for mining, dressing, and backfilling.
Figure 1.
Integrated technology for mining, dressing, and backfilling.
Figure 2.
Underground chamber for coal-gangue separation.
Figure 2.
Underground chamber for coal-gangue separation.
Figure 3.
Models of different horizons of a single weak stratum.
Figure 3.
Models of different horizons of a single weak stratum.
Figure 4.
Laying schemes of physical models: (a) Model 3 with the weak stratum located above the arch shoulder of DCCS; (b) Model 6 with the weak stratum located on the side of DCCS; (c) Model 8 with the weak stratum located on the floor of DCCS.
Figure 4.
Laying schemes of physical models: (a) Model 3 with the weak stratum located above the arch shoulder of DCCS; (b) Model 6 with the weak stratum located on the side of DCCS; (c) Model 8 with the weak stratum located on the floor of DCCS.
Figure 5.
Uniaxial compression tests of specimens with different proportioning schemes.
Figure 5.
Uniaxial compression tests of specimens with different proportioning schemes.
Figure 6.
Stress-strain curves of specimens with different proportioning schemes under uniaxial compression.
Figure 6.
Stress-strain curves of specimens with different proportioning schemes under uniaxial compression.
Figure 7.
Laying, loading, and monitoring methods of physical models.
Figure 7.
Laying, loading, and monitoring methods of physical models.
Figure 8.
Monitoring results of vertical stress in surrounding rocks of chamber at different loading stages: (a) 1# earth pressure box; (b) 3# earth pressure box; (c) 8# earth pressure box.
Figure 8.
Monitoring results of vertical stress in surrounding rocks of chamber at different loading stages: (a) 1# earth pressure box; (b) 3# earth pressure box; (c) 8# earth pressure box.
Figure 9.
Monitoring results of surrounding rock displacements at different loading stages: (a) Roof displacement; (b) Displacement of the side surrounding rocks; (c) Floor displacement.
Figure 9.
Monitoring results of surrounding rock displacements at different loading stages: (a) Roof displacement; (b) Displacement of the side surrounding rocks; (c) Floor displacement.
Figure 10.
Failure modes of surrounding rocks of chamber at different loading stages: (a) Model 3; (b) Model 6; (c) Model 8.
Figure 10.
Failure modes of surrounding rocks of chamber at different loading stages: (a) Model 3; (b) Model 6; (c) Model 8.
Figure 11.
Plane-strain numerical models of DCCS. Note: WS represents a weak stratum.
Figure 11.
Plane-strain numerical models of DCCS. Note: WS represents a weak stratum.
Figure 12.
Plastic failure range and displacement distribution characteristics of the surrounding rocks of DCCS under different horizons of the weak stratum.
Figure 12.
Plastic failure range and displacement distribution characteristics of the surrounding rocks of DCCS under different horizons of the weak stratum.
Figure 13.
Variation curves of the plastic failure range in surrounding rocks under different horizons of the weak stratum: (a) Tensile failure area; (b) Plastic failure area.
Figure 13.
Variation curves of the plastic failure range in surrounding rocks under different horizons of the weak stratum: (a) Tensile failure area; (b) Plastic failure area.
Figure 14.
Variation convergence curves of surrounding rocks of DCCS under different horizons of the weak stratum: (a) Convergence of roof and floor; (b) Convergence of two ribs; (c) Maximum displacement of the weak stratum.
Figure 14.
Variation convergence curves of surrounding rocks of DCCS under different horizons of the weak stratum: (a) Convergence of roof and floor; (b) Convergence of two ribs; (c) Maximum displacement of the weak stratum.
Figure 15.
Variation curves of the comprehensive evaluation coefficient of surrounding-rock stability.
Figure 15.
Variation curves of the comprehensive evaluation coefficient of surrounding-rock stability.
Table 1.
Size statistics of underground chamber for coal-gangue separation.
Table 1.
Size statistics of underground chamber for coal-gangue separation.
| Name of Coal Mine |
Coal Preparation Technology |
Name of Chamber |
Section Shape |
Width × Height (m) |
Ratio of the Width to Height |
Axial Length
(m) |
| Longgu coal mine |
Heavy medium shallow trough |
Chamber of gangue discharge |
Three centered arch |
7.5 × 9.0 |
0.83 |
85.6 |
| Pingdingshan 12# coal mine |
Washing chamber |
Semi-circular arch |
8.0 × 9.2 |
0.87 |
75.0 |
| Jiyang coal mine |
Chamber of gangue discharge |
6.8 × 7.0 |
0.97 |
70.0 |
| Binhu coal mine |
X-ray |
Chamber of coal-gangue separation |
5.5 × 7.4 |
0.74 |
41.0 |
| Tangshan coal mine |
Moving screen jigging |
Chamber of jigging separation |
6.2 × 9.3 |
0.67 |
25.8 |
| Xiezhuang coal mine |
6.5 × 7.5 |
0.87 |
25.0 |
Table 2.
Physical and mechanical parameters of the rock stratum in the geological model.
Table 2.
Physical and mechanical parameters of the rock stratum in the geological model.
| Types of the rock strata |
Density
(kg·m-3) |
Elastic Modulus (GPa) |
Poisson's
Ratio |
Friction Angle
(º) |
Cohesion
(MPa) |
Compressive Strength
(MPa) |
Tensile Strength (MPa) |
| Weak rocks |
2460 |
6.4 |
0.26 |
30 |
1.2 |
18 |
0.58 |
| Other surrounding rocks |
2630 |
10.1 |
0.20 |
38 |
6.0 |
83 |
2.50 |
Table 3.
Proportioning schemes of similar materials.
Table 3.
Proportioning schemes of similar materials.
| Number |
Proportioning Number |
Reference strength (MPa) |
Measured Density (kg·m-3) |
River Sand (kg) |
Calcium Carbonate (kg) |
Cement
(kg) |
Gypsum (kg) |
Amount of Water |
| 1 |
773 |
0.07 |
1,660 |
0.40 |
0.12 |
|
0.05 |
1/9 |
| 2 |
737 |
0.14 |
1,925 |
0.46 |
0.06 |
|
0.14 |
1/9 |
| 3 |
337 |
0.28 |
2,009 |
0.21 |
0.14 |
|
0.34 |
1/7 |
| 4 |
937 |
1.23 |
1,866 |
0.58 |
|
0.02 |
0.04 |
1/9.5 |
| 5 |
773 |
1.55 |
1,955 |
0.49 |
|
0.19 |
0.06 |
1/16 |
| 6 |
837 |
2.06 |
2,024 |
0.56 |
|
0.04 |
0.10 |
1/11 |
|
Disclaimer/Publisher’s Note: The statements, opinions and data contained in all publications are solely those of the individual author(s) and contributor(s) and not of MDPI and/or the editor(s). MDPI and/or the editor(s) disclaim responsibility for any injury to people or property resulting from any ideas, methods, instructions or products referred to in the content. |
© 2023 by the authors. Licensee MDPI, Basel, Switzerland. This article is an open access article distributed under the terms and conditions of the Creative Commons Attribution (CC BY) license (http://creativecommons.org/licenses/by/4.0/).
