Preprint
Article

Optimizing Extraction Condition and Characterization the Structural and Physical property of the Alginate Pretreated by High-pressure Homogenization

Altmetrics

Downloads

117

Views

38

Comments

0

A peer-reviewed article of this preprint also exists.

Submitted:

05 July 2023

Posted:

07 July 2023

You are already at the latest version

Alerts
Abstract
In this study, we had investigated the use of high-pressure homogenization (HPH) as a novel pretreatment method for the extraction of sodium alginate (SA) from Laminaria japonica. Our results demonstrated that under optimal condition of 100 MPa HPH pressure, 4 cycles, pH 6.0, and 0.5% ethylene diaminetetra acetic acid tetrasodium salt (EDTA) concentration (w/v) for 3.0 hours, the extraction yield of HPH reached 34%, which was higher than that achieved by previous methods such as complex enzyme hydrolysis (CE), ultrasonic-assisted extraction (UAE), and complex enzyme-ultrasonic combined method (CE-UC). To further characterize the extracted SA, we conducted a comprehensive analysis using SEM, FTIR, MRS, NMR, XRD, TGA, and T-AOC assay. Our findings revealed the following: 1) HPH treatment significantly disrupted the structure of L. japonica cells and reduced their crystallinity to 76.27%, the lowest among all pretreatment samples; 2) the extracted SA had a greater tendency to form elastic gels; and 3) the antioxidant activity of HPH-extracted SA reached 0.02942 mgVceq∙mg-1, which was the highest among all tested methods. Based on these results, we concluded that HPH extraction not only increased the yield of SA but also enhanced its antioxidant activity.
Keywords: 
Subject: Chemistry and Materials Science  -   Polymers and Plastics

1. Introduction

Marine seaweeds as third-generation feedstock have gained a lot of attention in recent years. Brown seaweed, in particular, has garnered attention due to its high growth rate and biomass output, as well as its ability to be cultivated on a wide scale without the need for arable land [1]. Brown seaweed is currently the main source of alginate, a linear acidic polysaccharide carbohydrate composed of β-D-mannuronic acid (M) and its C5 epimer α-L-guluronic acid (G) [2]. The performance of alginate is revealed to be strongly correlated with M/G ratio [3,4]. Alginic acid and alginate are mainly existed in various types of brown seeweads, with the molecular weight sequence being Fucus vesiculosus <Ascophyllum nodosum < Sargassum fluitans < Laminaria japonica. The viscosity of alginate increases gradually with higher of molecular weight. Among these seaweed species, L. japonica is currently the main source for alginate extraction due to its high content, large molecular weight, and ease of extraction [5].
Commercial production of alginate began in the late 1920s and eventually dominated the food ingredient market in the mid-20th century [6]. Large-scale industrial production commenced in the United States in 1929. In 1938, it gained approval from Food and Drug Administration (FDA) for use in the food and pharmaceutical industries. Today, the market size of alginate is expected to reach USD 923.8 million by 2025 due to its increasing use in food and biomedical industries [7]. Alginate has numerous proven properties, such as being non-toxic, water-soluble, biodegradable, film-forming, gelling, thickening, anti-allergic, flocculating, chelating, and promoting plant growth [8,9,10,11,12,13,14]. At present, alginate finds widespread application in various industries around the world. Apart from the previously mentioned food, medicine, printing, and dyeing industries, sodium alginate is also extensively used in water treatment and bioethanol production [15,16,17].
The extraction of alginate from seaweed is based on converting all the alginate to sodium salt and dissolving it in water, then removing impurities and recovering the alginate from the aqueous solution. There are two different methods for recovery. The first method involves adding acid to form insoluble alginate acid, which can be separated from the water. The second method involves adding calcium salt to form insoluble calcium alginate, which can also be separated [18]. The extraction of alginates from brown seaweed has been the subject of study for several decades in order to develop economic systems that can achieve high yields and control the molecular weight for various applications [19,20,21,22]. However, the extraction methods using acid and alkaline can make the intermediate product alginate unstable and prone to degradation, and they also require multiple steps and are expensive [23]. Enzymatic hydrolysis, although a potential alternative, is currently hindered by high cost, high energy consumption, long extraction period and harsh conditions, and has not yet been successfully implemented on a large scale industrial production [24,25].
Currently, the calcium coagulation-ion exchange method is widely used in the extraction sodium alginate. Traditional acid and aldehyde extraction methods are gradually being phased out due to environmental pressure. However, the extraction yield of sodium alginate is affected by the compact structure of seaweed cell walls, which makes them difficult to degrade. In order to improve the extraction yield, various pretreatment methods such as microwave-assisted extraction (MAE) [26], ultrasonic-assisted extraction (UAE) [27], complex enzyme hydrolysis (CE) [28], and complex enzyme-ultrasonic combined method (CE-UC) [29,30] have been introduced. These pretreatment methods are considered necessary and helpful in the extraction process. Therefore, selecting a suitable pretreatment method is a crucial step in the extraction process.
Alginate oligosaccharides (AOS) obtained from the degradation of alginate have attracted significant attention due to their physiological characteristics, which include antioxidant, antimicrobial, anticancer, anti-inflammatory, immune regulation, and promotion of plant growth [31,32,33,34]. Among the various methods used to produce AOS, the enzymatic method is considered the most promising due to its several advantages, such as higher specificity and efficiency, mild reaction conditions, and high reaction yields [35]. Alginate lyases (Alys) are enzymes that can cleave glycosidic bonds through β-elimination reaction to depolymerize alginate into AOS. Sodium alginate, which has low crystallinity and large porosity, is more suitable as a substrate for the production of AOS.
HPH is a highly practical technology that is widely used in the pretreatment of various material, including milk emulsion, lignocellulose pretreatment and cell disruption [36,37,38,39]. However, to date, this technique has not been applied to extract of SA from L. japonica cells. Annually, approximately 23 kt of alginate, 7.5 kt of agar, and 28 kt of carrageenan are extracted from 1000 kt wet seaweed [40]. Considering the growing demand for seaweed and seaweed-derived products, the objective of this study is to develop a green extraction method for obtaining sodium alginate from L. japonica. HPH is an efficient technology and widely-used technology. Therefore, we have replaced the traditional method with a novel HPH pretreated method, resulting in the development of a green extraction method with exhibiting excellent industrial potential for producing SA that is suitable as substrate for enzyme degradation.

2. Materials and Methods

2.1. Materials and reagents

L. japonica was obtained from Yantai, Shandong province, China. Cellulase (3.5 × 10⁴ U/g) and pectinase (1.0 × 10⁵ U/g) were purchased from Guangxi Pangbo Biological Engineering Co., Ltd. (Guangxi, China). Papain (6.0 × 10⁵ U/g) was provided by the Institute of Biology, Guangxi Academy of Sciences (Guangxi, China).

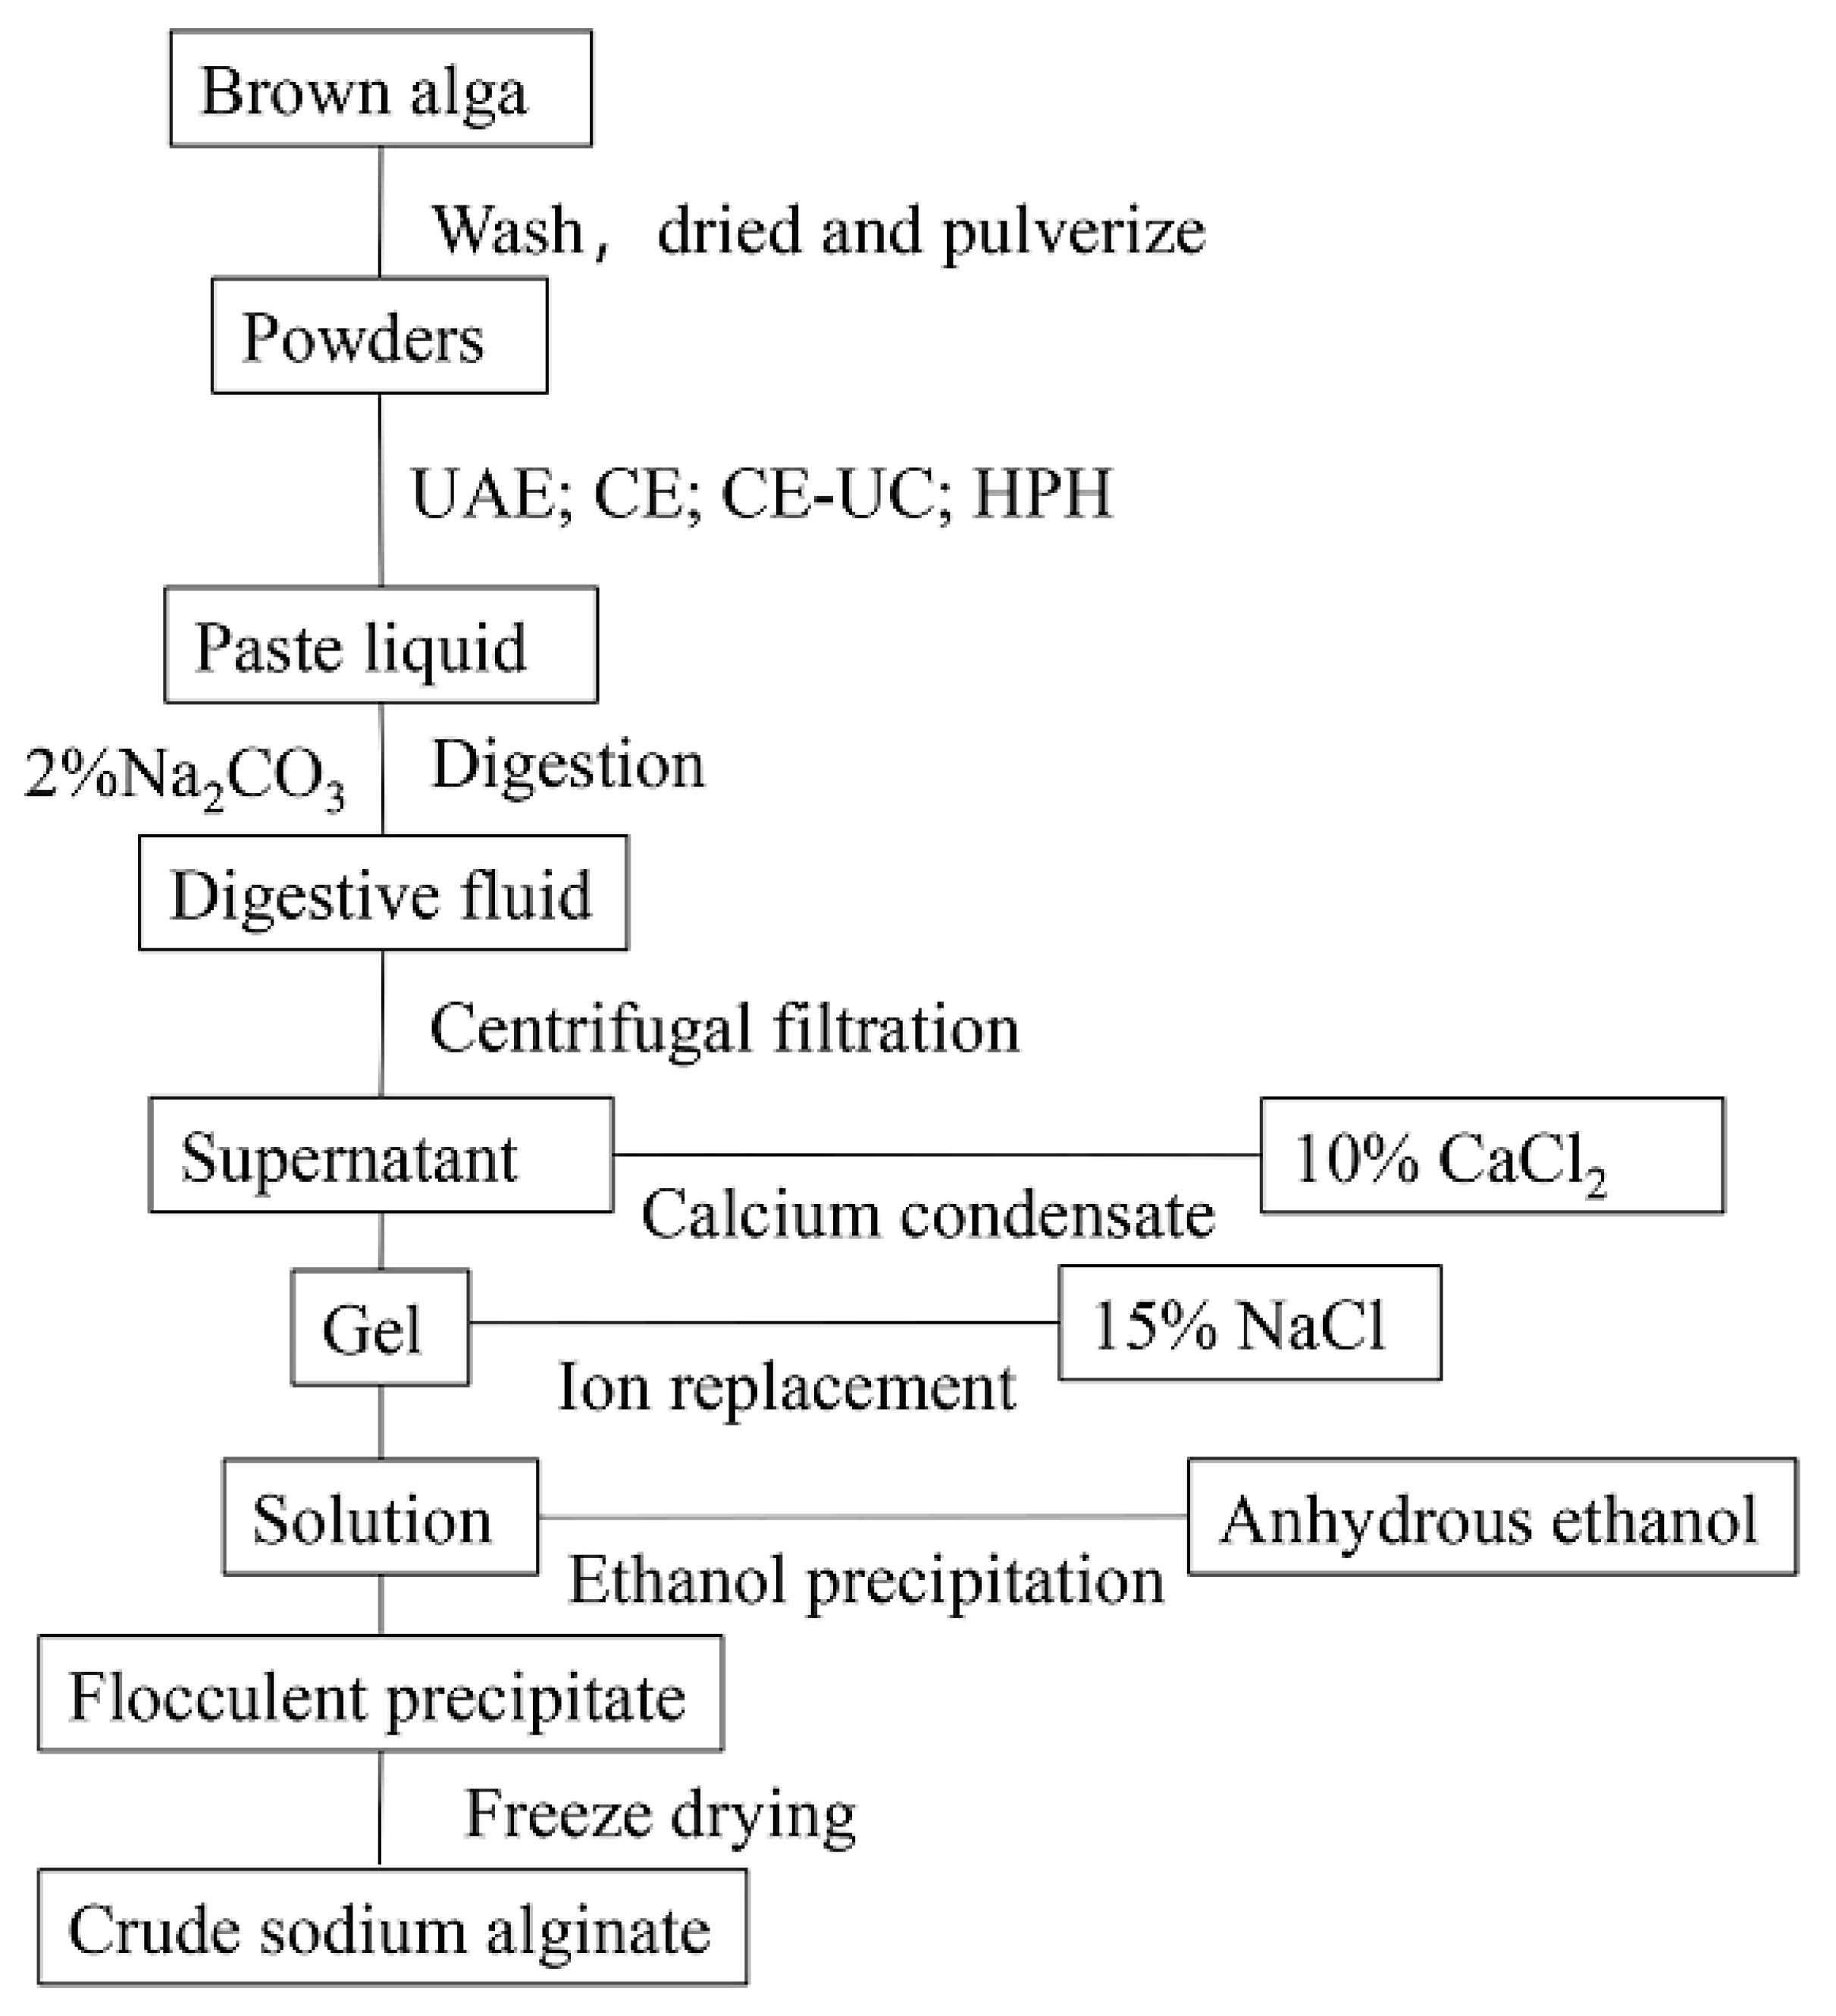
2.1. Extraction process

  • L. japonica was soaked in fresh water for 4 hours and washed three times with distilled water to remove impurities. The plant material was then dried and ground into powder.
  • A solution of L. japonica was prepared by soaking 2.0 g of the plant material in 200 mL of pure water for 1 hour. The L. japonica solution was then subjected to different pretreatment methods, including HPH, UAE, CE, and CE-UC.
  • After adding 30 mL of a 2% Na2CO3 and EDTA (with or without) solution, the homogenate was incubated at 50°C for 3 hours. The mixture was then centrifuged, and the supernatant was adjusted to the desired pH using 1 M HCl.
  • Following this, 20 mL of 10% calcium chloride was added and the mixture was allowed to stand. The resulting precipitate was then filtered and washed twice with distilled water to obtain a yellow-white gelatinous precipitate.
  • The precipitate was dissolved in 20 mL 15% sodium chloride solution for ion exchange. The solution was then filtrated using medical gauze. Subsequently, 100 mL of anhydrous ethanol was added to induce precipitation. The resulting white flocculent precipitates were obtained through filtration.
  • The precipitates were collected and frozen at -80°C for 12 hours, followed by freeze-dried for 8 hours using a vacuum freeze dryer. The dried precipitates were then crushed to obtain crude sodium alginate.
The yield of SA was calculated using the following equation:
SA yield (%) = (m1/m2) × 100
where, m1 is the dry weight of obtained SA, and m2 is the dry weight of L. japonica. The full yield (100 %) means
All experiments were performed in triplicate. The standard deviations are illustrated as error bars in the figures.
Figure 1. Design of experiments for extraction.
Preprints 78697 g001

2.1.1. Extraction process of the CE method

  • Take 2.00 g of L. japonica powder with a 100-mesh size and add tap water in a 1:50 ratio to obtain a total volume of 100 mL.
  • Adjust the pH value to 6 and add 3% cellulase of L. japonica powder, 3% pectinase, and 1% papain. Stir the mixture well and transfer it to a 50℃ water bath for 3 hours. After the reaction, inactivate the enzyme solution by boiling it in water for 15 minutes.
  • Add 24 mL of a 2% sodium carbonate solution and digest the mixture in a 50℃ water bath for 3 hours. Centrifuge the digested enzyme solution at 8500 r/min for 10 minutes and remove the supernatant. Adjust the pH of the supernatant to 6. Proceed with the subsequent operations as described in section 2.2 from step (4) to step (6).

2.1.1. Extraction process of the UAE method

  • Take 2.00g of L. japonica powder with a 100-mesh size and stir it into tap water at a material-to-liquid ratio of 1:50.
  • Use an ultrasonic cell crusher to break the samples for 10 minutes with the following conditions: 350 W of output power, a temperature of 30℃, and a working time and interval of 2 seconds.
  • Add 24 mL of a 2% sodium carbonate and digest it in a water bath at 50℃ for 3 hours. After digestion, centrifuge the enzymolysis solution at 8500 r/min for 10 min. Collect the supernatant and adjust its pH to 6. The subsequent operations are the same as section 2.2, from (4) - (6).

2.1.1. Extraction process of the CE-UC method

  • Take 2.00g of 100-mesh L. japonica powder and stir it into tap water at a material to liquid ratio of 1:50. The samples were then subjected to ultrasonic cell crushing for 10 minutes using a 350 W power, 30℃ temperature, and 2 s working time and intervals.
  • Adjust the pH value to 6 and add L. japonica powder with 3% cellulase, 3% pectinase, and 1% papain. Stir the mixture well and place it in a 50℃ constant temperature water bath for enzymolysis for 3 hours. After the enzymolysis reaction, the enzyme solution was inactivated by boiling and heating for 15 minutes.
  • Add 24 mL of L. japonica powder in a 2% sodium carbonate solution and digest it in a 50℃ water bath for 3 hours. After digestion, the enzymolysis solution was centrifuged at 8500 r/min for 10 minutes, and the supernatant was collected and adjusted to pH 6. Subsequent operations are the same as section 2.2, steps (4) - (6).

2.1.1. Single factor experiment of the HPH method

In order to optimize the extraction conditions using the HPH method, various factors were investigated that have an impact on the yield of sodium alginate. These factors include pressure, cycle times, pH, EDTA, and digestion time.
Homogeneous pressure (bar): The pressure of 400, 600, 800, 1000, 1200, and 1400 bar were selected respectively, and the yield of sodium alginate was determined while keeping other steps unchanged.
Homogenization times: Under the aforementioned optimal conditions, extraction was conducted with homogenization performed 2, 3, 4, 5, and 6 times, respectively, while keeping the other steps unchanged. The yield of sodium alginate was determined.
pH Adjustment: Under the aforementioned optimal conditions, the pH values of 5, 5.5, 6, 6.5, and 7 were utilized to adjust the extraction process. The remaining steps of the procedure were kept constant in order to determine the yield of sodium alginate.
EDTA addition amount (%): 0%, 0.25%, 0.5%, 0.75% and 1% EDTA were added to the extraction process without changing any other steps. The yield of sodium alginate was determined under these conditions.
Digestion time (h): Under the aforementioned optimal conditions, digestion was conducted for 1 h, 1.5 h, 2 h, 2.5 h, 3 h, and 3.5h respectively, Extraction was carried out with all other steps unchanged in order to determine the yield of sodium alginate.

2.1. Characterization of sodium alginate

For the SEM analysis, the untreated and the pretreated L. japonica power samples were examined to analyze the effect of pretreatment on their structure and morphological properties. To do this, small amounts of the dried L. japonica samples were placed on double-sided carbon tape adhered to aluminum stubs. These stubs were then coated with a layer of gold using sputter-plating. Finally, the samples were observed using an S-3400N electron microscope from Hitachi, Japan.
For the FTIR analysis, sodium alginate samples were analyzed using the Nicolet IS 10 Fourier Transform Infrared spectrometer (Thermo Fisher Scientific). The samples were scanned from 4000 to 600 cm−1 for 32 times at a resolution of 4 cm−1. This was done to investigate any changes in the functional groups.
For the MRS analysis, the sodium alginate powder was initially spread evenly on the groove of a glass slide. The Raman spectrum was measured in the range of 3378 cm-1 to 50 cm-1, with an exposure time of 10 s for 30 repetitions.
For the NMR analysis, the procedure was performed following the guidelines of ASTM-F2259-10 (2012) using an Agilent NMR Systems 800MHz NMR Spectrometer. Initially, the sodium alginate underwent depolymerization through acid hydrolysis. A 100 mL solution of sodium alginate with a concentration of 1 mg/mL was prepared, and the pH was adjusted to 5.6 using 1 M hydrochloric acid. The solution was then heated in a water bath at 100 ℃ for 1 hour. Subsequently, the pH was readjusted to 3.8 using 1 M hydrochloric acid, and again, heated in the water bath at 100℃ for 30 minutes. The pH was then neutralized to 7.2 with 1 M sodium hydroxide, and the sample was freeze-dried overnight. The resulting freeze-dried sample was dissolved in 5 mL of 99.9% D2O and then freeze-dried once more. Next, 10-12 mg of the sample was dissolved in 1 mL of 99.9% D2O. Subsequently, 0.7 mL of the alginate solution was added to an NMR tube, along with 20 μL of 0.3 M TTHA (triethylenetetraminehexaacetic acid). The pH of the TTHA was adjusted to 5.2 using sodium deuterium chloride (DCl) and deuteroxide (NaOD), as the TTHA served as a chelator to hinder the reaction of divalent cations with sodium alginate.
For the XRD analysis, the sodium alginate samples underwent various pretreatment and were commercial recorded using an X-ray diffractometer (Ultima IV, Japan). The diffraction pattern was obtained by scanning the samples at a rate of 5°/s within a range of 2θ angles of 5° to 80°. Cu radiation (40 mA, 40 kV) was used during the analysis.
TGA analysis was performed on various sodium alginate samples using a TGA Q50 Thermogravimetric Analyzer instrument. To obtain thermograms, 10 mg of sodium alginate samples were placed in an alumina pan and nitrogen was purged at a rate of 30 mL/min. The temperature was then increased from 20℃ to 600℃ at a heating rate of 20℃/min.
For T-AOC analysis, the assay is based on the reduction of molybdate-IV (Mo IV) to molybdate-V (Mo V) by the extracts, and the subsequent formation of a green phosphate/Mo V complex in an acidic pH. In this study, the total antioxidant capacities (T-AOC) of different sodium alginate samples were evaluated using the ammonium molybdate method, as previously described [41]. Specifically, 0.5 mL of the sample (10 mg/mL) was dissolved in 10% double distilled water and mixed with 5 mL of the reagent, which consisted of 28 mM sodium phosphate, 0.6 M sulfuric acid, and 4 mM ammonium molybdate. The mixture was then incubated at 95℃ for 90 min and subsequently cooled. The absorbance was measured at 695 nm against the blank. The antioxidant activity was expressed as the vitamin C equivalent antioxidant capacity (VCEAC) using a standard plot.
Statistical analysis and graphing were performed using the GraphPad software program.

3. Results and Discussion

3.1. Optimization for the single factor extraction condition for the HPH extraction

Effect of HPH pressure on yield: The effect of HPH pressure (40-140 MPa) on the yield of sodium alginate was investigate while keeping other parameters constant, including 3 cycles, pH 6.0, 0.25% EDTA concentration, and 4.0 h digestion time. The results showed that the yield of sodium alginate increased significantly with increasing pressure from 40 to 100 MPa, but decreased after reaching 100 MPa (Figure 2A). This observed trend is likely due to the cavitation, turbulence, and collision phenomena induced by HPH. These mechanical forces cause the material to break down and achieve super refinement, facilitating the dissolution of sodium alginate. However, at higher pressure (>100 MPa), the yield decreased as cells were severely damaged. This may result in sodium alginate molecules being damaged into smaller sizes, which hinders the extraction process.
Effect of HPH cycle times on the yield: As depicted in Figure 2B, the yield of sodium alginate demonstrated a gradual increase with increasing cycle times. The maximum yield was achieved after 4 cycles. It should be noted that exceeding 4 cycle times would lead to the conversion of mechanical energy into thermal energy, resulting in the degradation of sodium alginate molecules. As a result, the extraction of sodium alginate would be impeded. Hence, 4 cycle times were identified as the optimal homogenization number.
Effect of pH on yield: The influence of pH values ranging from 5 to 7 on the yield of sodium alginate was investigated under fixed conditions of HPH pressure at 100 MPa, 4 cycles, EDTA concentration at 0.25%, and digestion time of 4.0 hours. The results showed that the yield of sodium alginate initially increased and then then decreased as the pH increased (Figure 2C). Sodium alginate demonstrated excellent stability within the pH range of 6-11. When the pH was lower than 6, alginate precipitated and the yield decreased. On the other hand, when the pH exceeded 11, the alginate coagulated again.
Effect of EDTA concentration on the yield: The influence of EDTA concentration on the yield of sodium alginate was evaluated under the following conditions: 100 MPa HPH pressure, 4 cycle times, pH 6.0, and 4.0 hours of digestion time. The data shown in Figure 2D clearly revealed that increasing concentration of EDTA resulted in an increase in the yield of sodium alginate, reaching a maximum of 33.5% when using a concentration of 0.5% (w/v) of EDTA. This finding was significantly higher than previous reports on the extraction of sodium alginate from brown algae. The extraction process heavily relied on the complexation of calcium in the cell wall by EDTA. The optimal concentration of 0.5% (w/v) EDTA for maximizing sodium alginate yield was consistent with previous studies [42]. Additionally, including 0.5% EDTA at the digestion stage facilitated pH adjustment to 6, reducing the amount of acid and base required for pH adjustment. However, higher concentrations of EDTA led to higher pH value, which was detrimental to the extraction process of sodium alginate. Therefore, a concentration of 0.5% (w/v) was determined to be the most effective.
Effect of digestion time on the yield: In order to investigate how digestion time affects the yield of sodium alginate, the extraction process was carried out under the aforementioned optimal conditions (Figure 2E). It was observed that the yield increased as digestion time was extended, reaching its highest value (33.5%) at 3.0 hours. This remarkably reduced the production cycle. However, excessively short digestion times might result in incomplete destruction of L. japonica. On the other hand, if digestion time was too long, the alginate might degrade, leading to a reduction in yield and making subsequent separation process more challenging. Therefore, a digestion time of 3.0 hours was taken as the optimal condition.
Subsequently, the optimal conditions for sodium alginate extraction were determined to be 100 MPa HPH pressure, 4 cycle times, a pH of 6.0, a 0.5% concentration (w/v) of EDTA, and a digestion time of 3.0 hours.

3.2. Compared with yield with other extraction methods

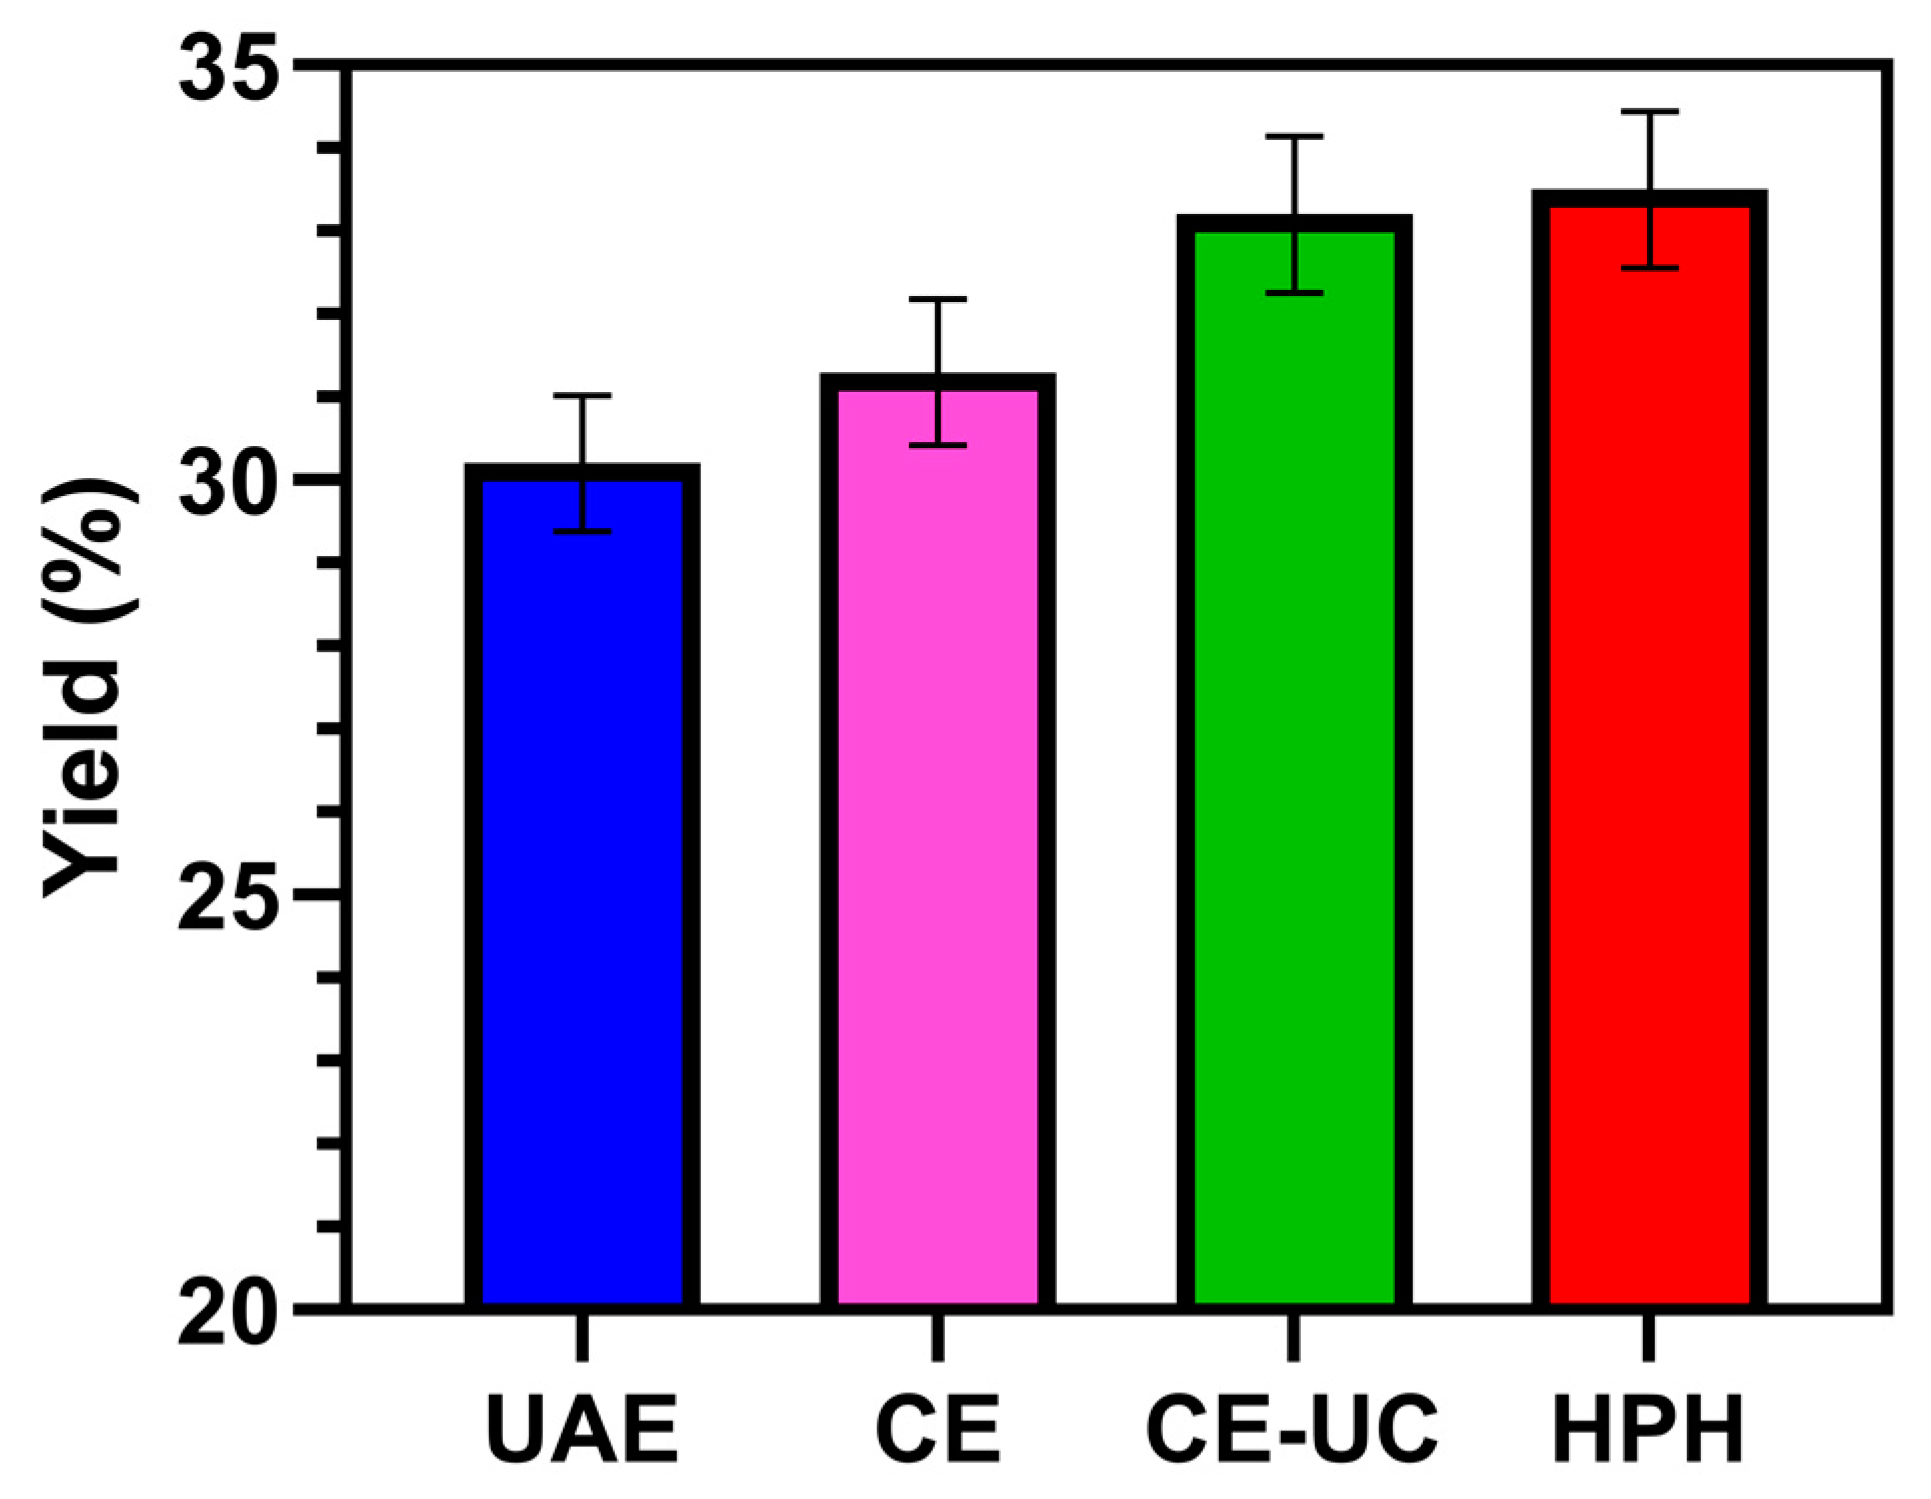
At present, numerous pretreatment methods had been reported for the extraction of SA. However, most of them had certain deficiencies, such as harsh reaction condition and high costs. In this study, we applied the HPH method to extract SA from L. japonica and compared it with four other methods, namely, UAE, CE, and CE-UC. The results showed that the UAE method obtained the lowest yield at 30.2%, while the HPH method acquired the highest yield at 33.5%. These findings demonstrated that the HPH method significantly improved the extraction yield.

3.3. Scanning electron microscopy (SEM) analysis

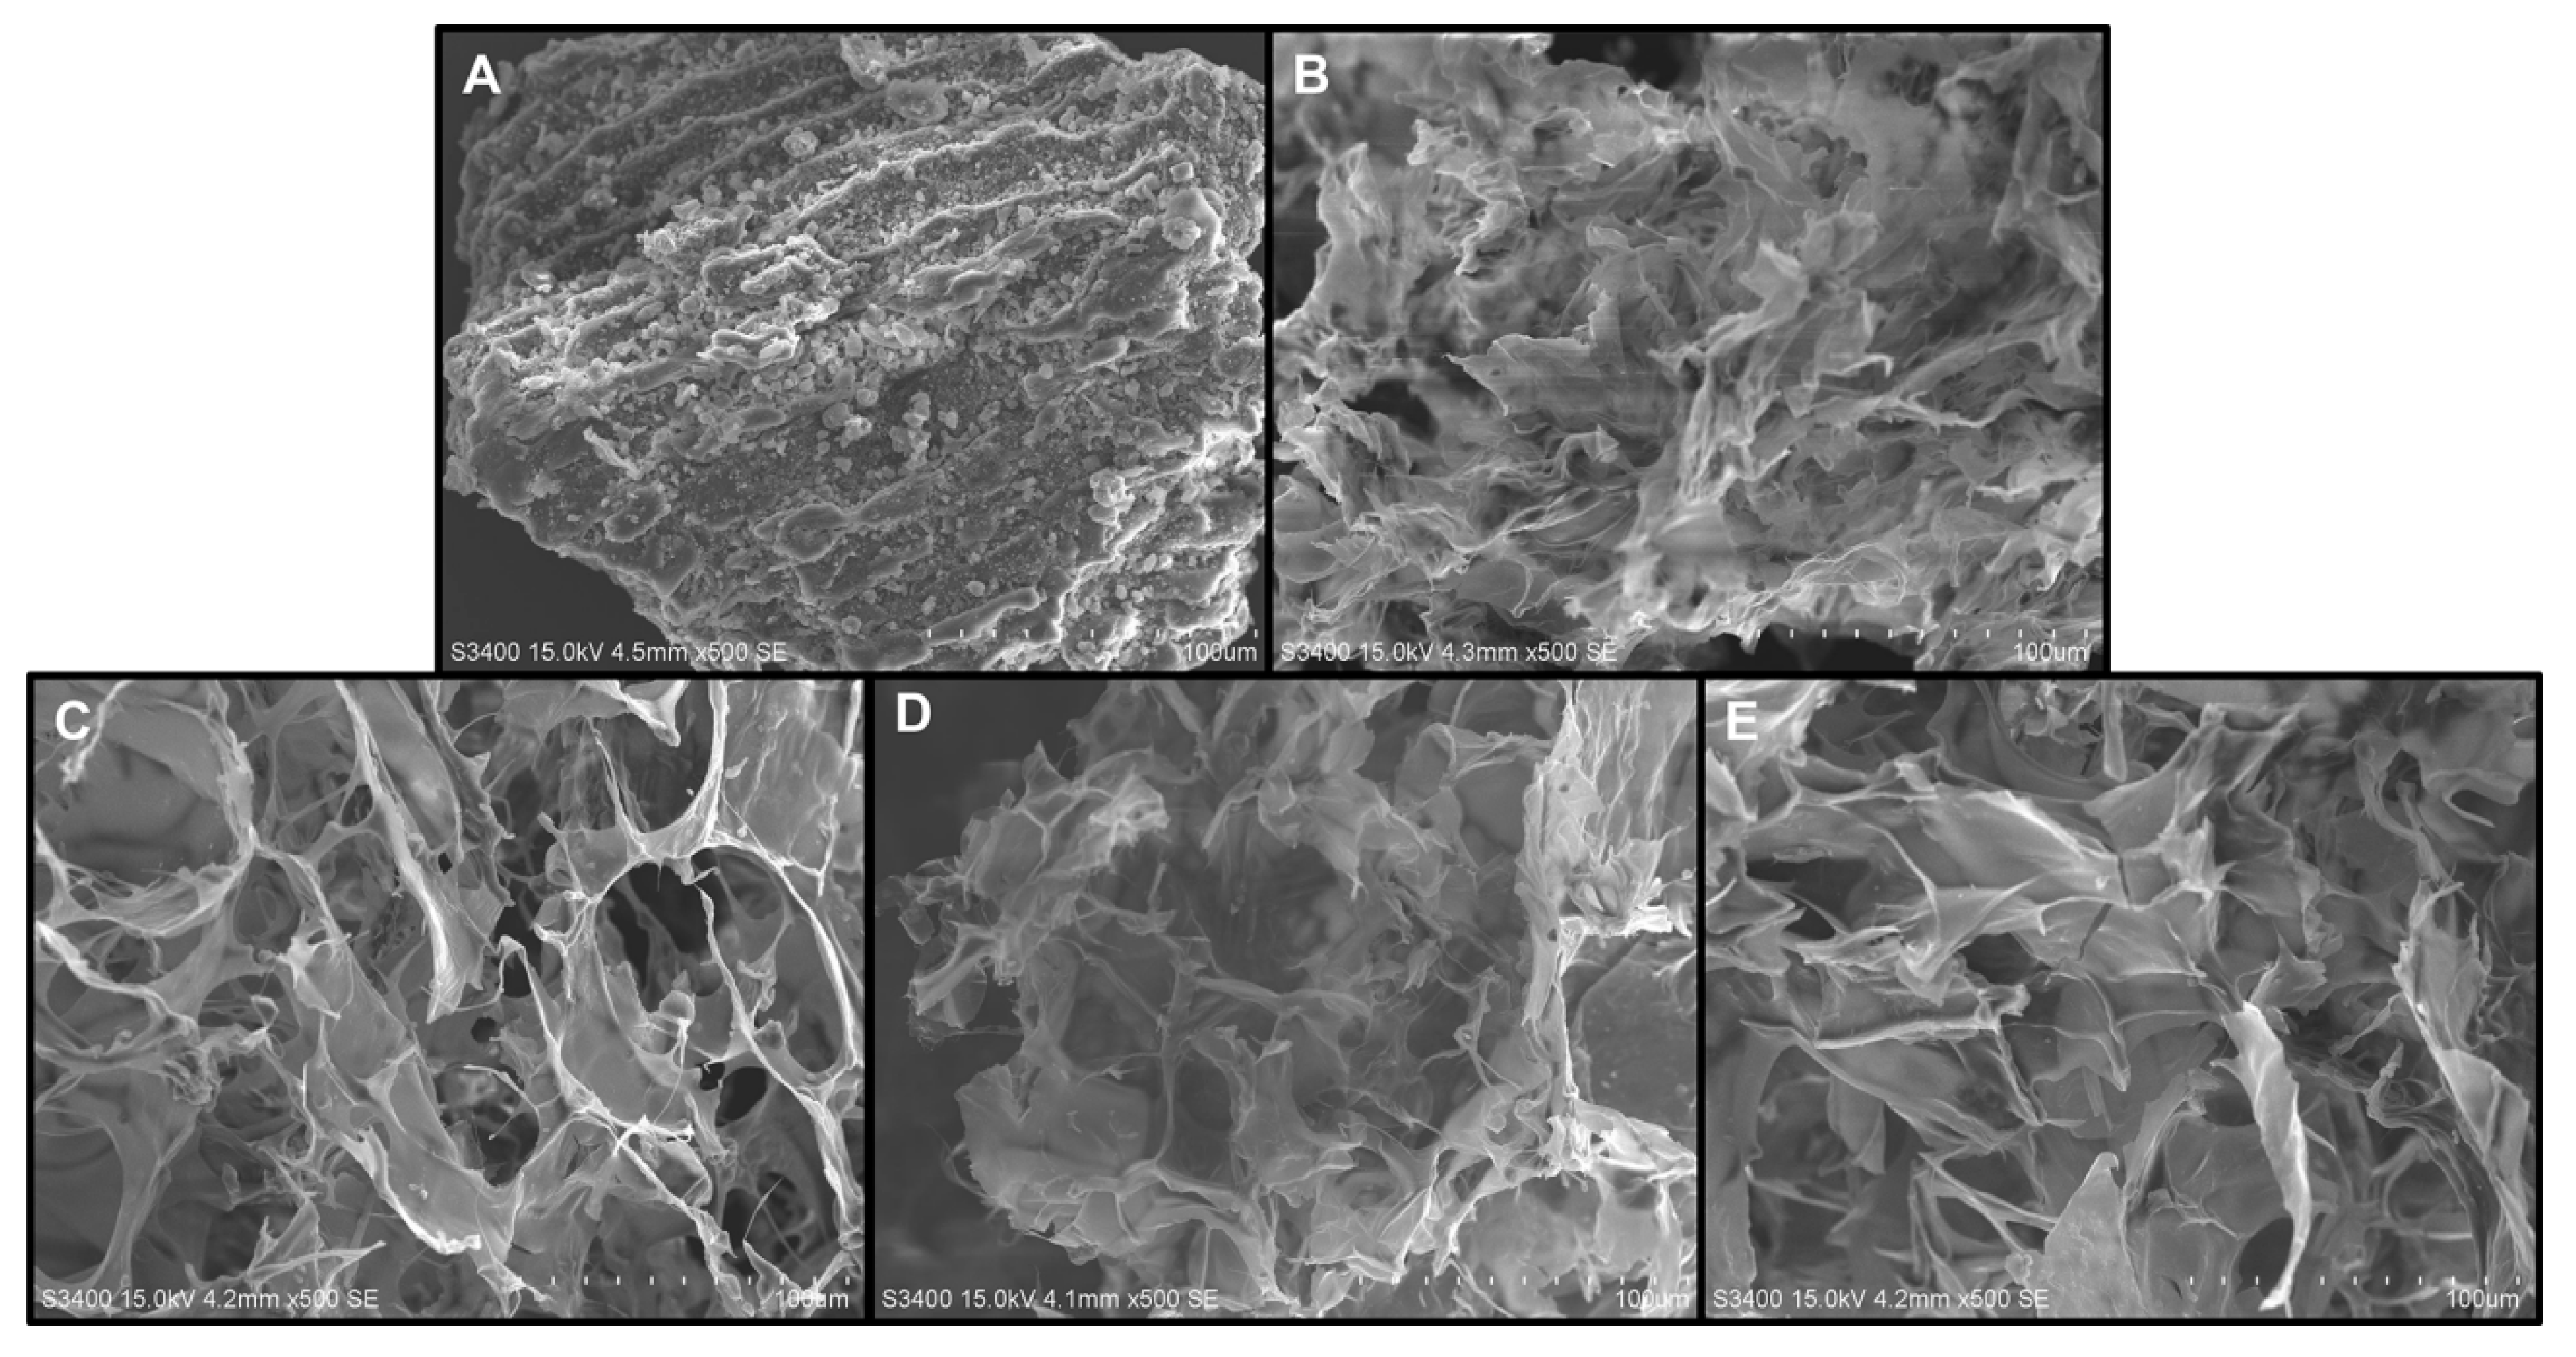
The scanning electron micrographs of untreated and pretreated L. japonica power samples were taken at a magnification of 500x and a resolution of 100 µm. By comparing these images, significant differences in surface morphology could be observed.
The pretreated samples appeared a noticeable change in the surface condition compared to the original sample (Figure 4). The untreated sample exhibited a tightly packed structure with intact cell walls, possibly due to the presence of strong inter- and intra-molecular hydrogen bonds in the cell wall. In contrast, the pretreated samples, including those treated with UAE, CE, CE-U, and HPH, exhibited a greater degree of surface decomposition compared to the untreated L. japonica powder. This observation indicated that the cell wall was significantly damaged by these pretreatment methods. Among these four methods, the sample pretreated with HPH exhibited a highly porous structure, which is likely to result in a higher extraction yield.

3.4. Fourier transform infrared (FTIR) spectrum analysis

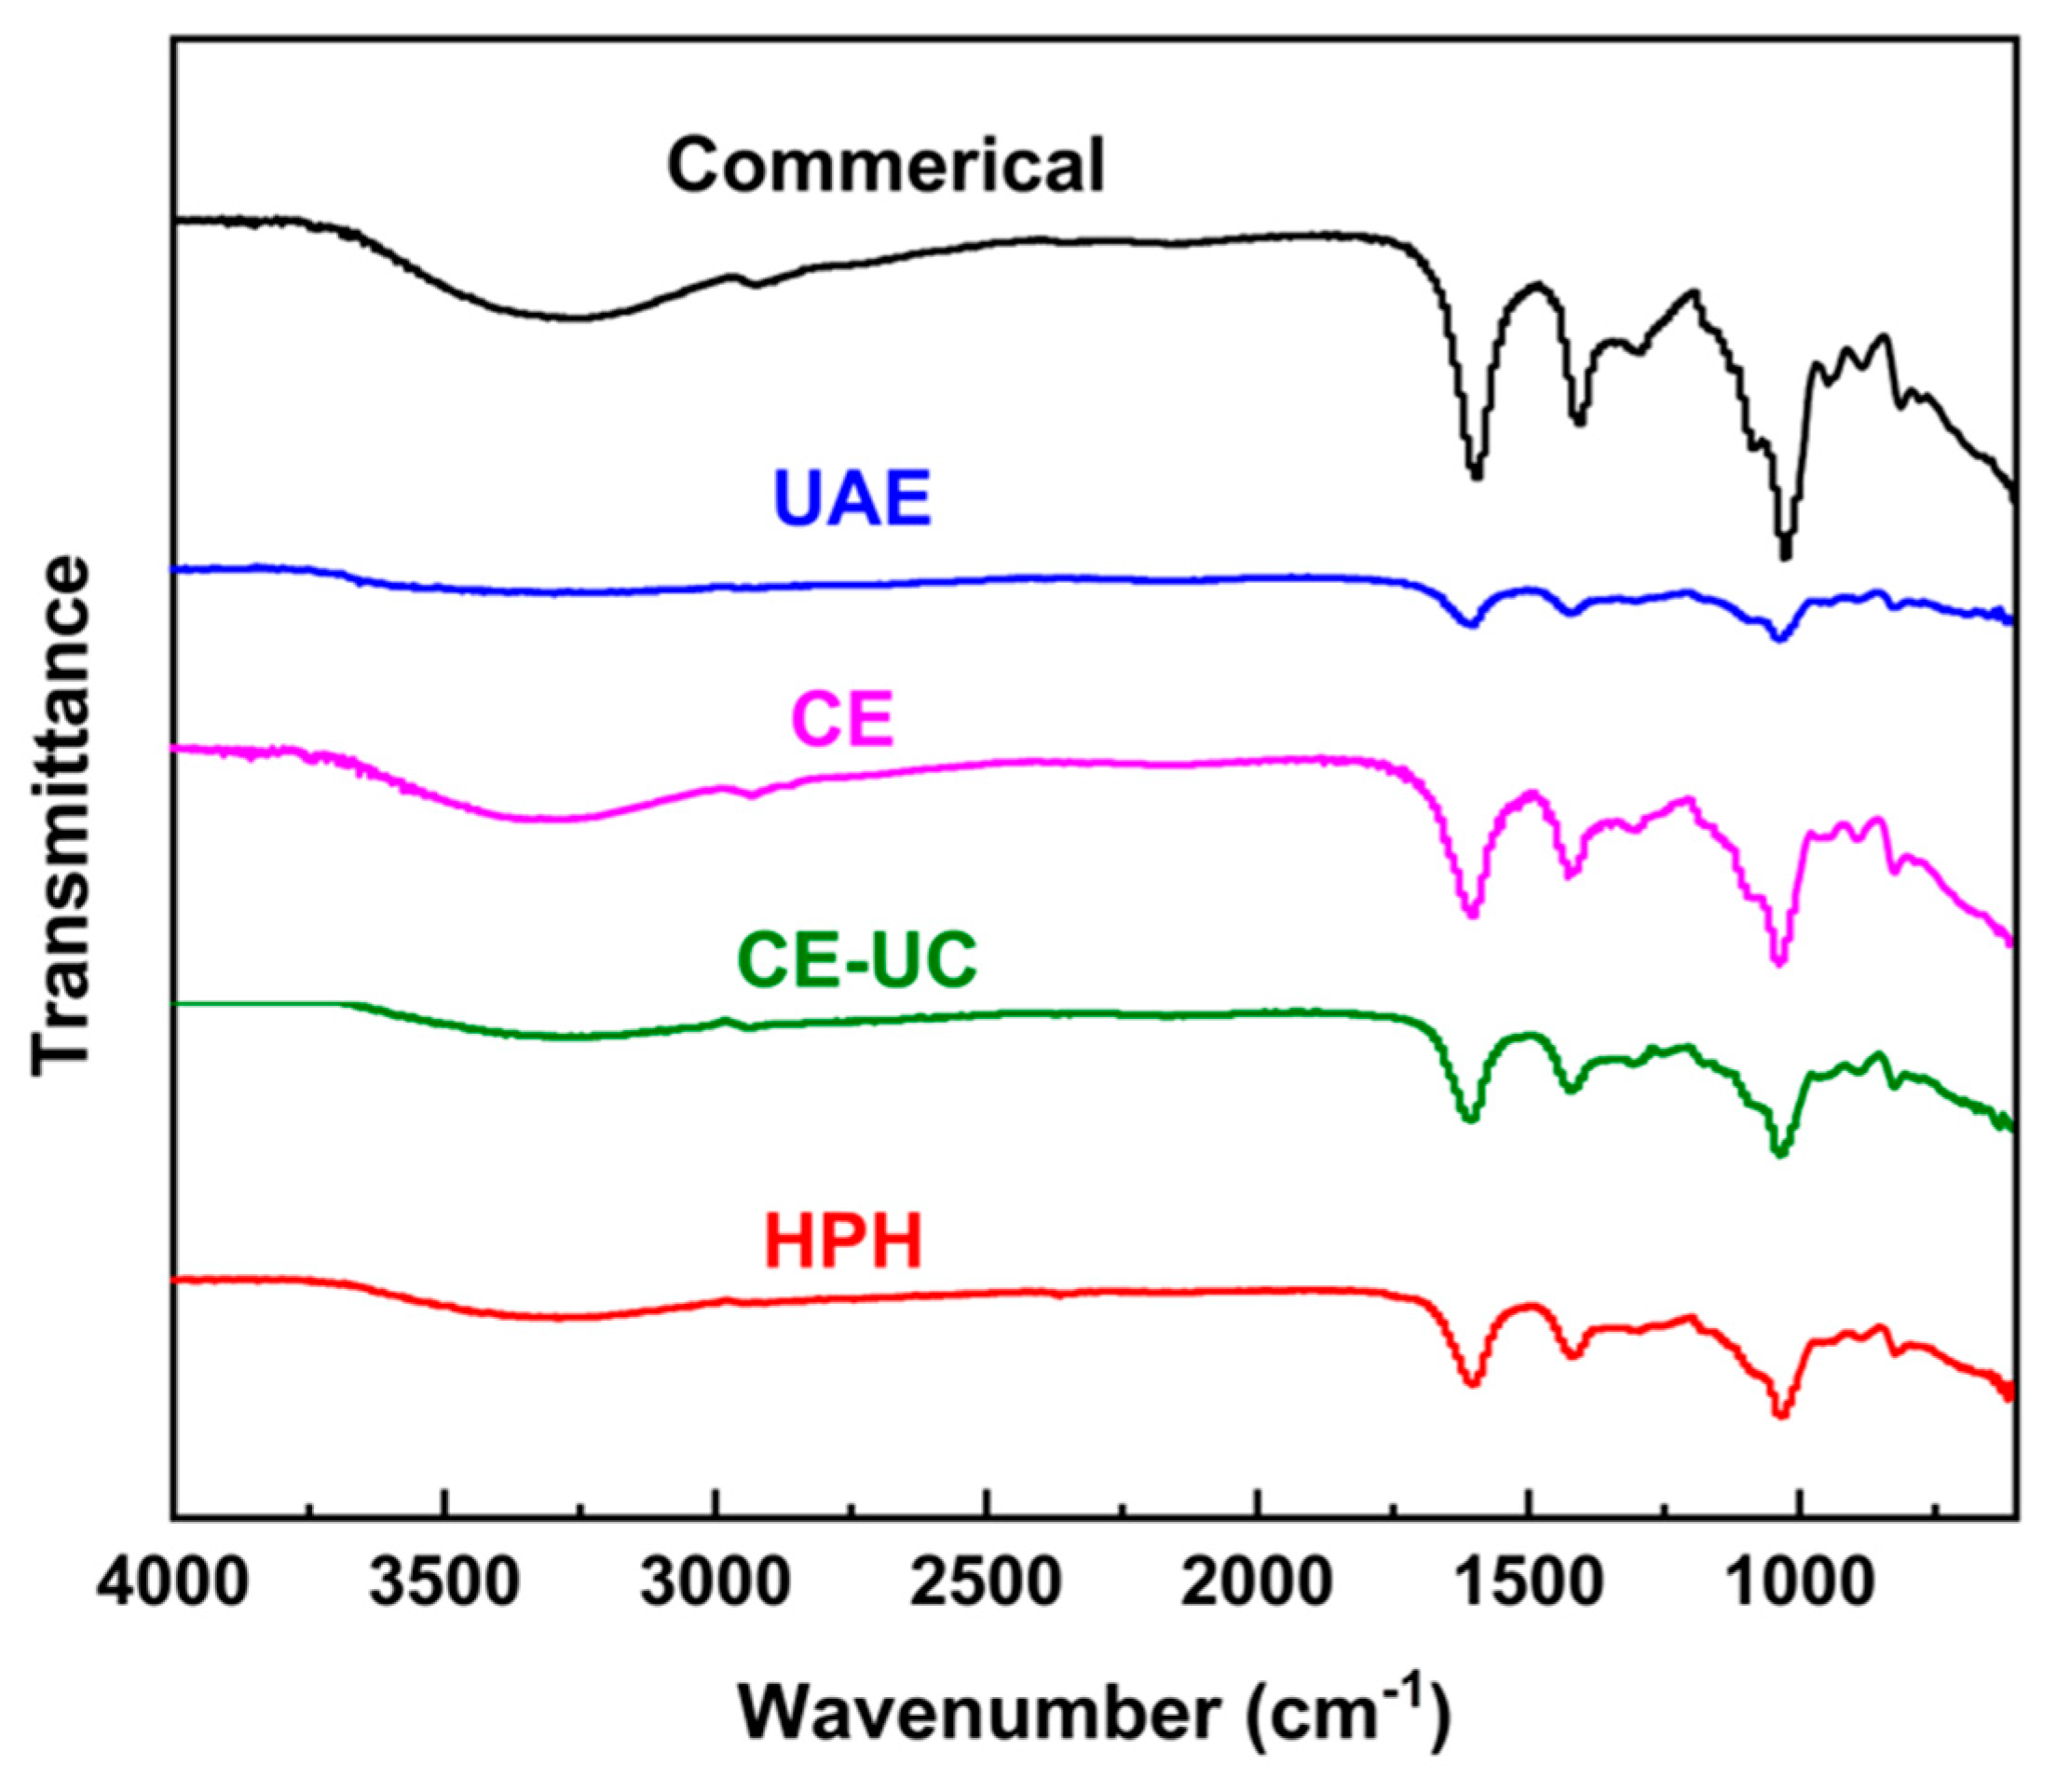
The FTIR spectroscopy results of various sodium alginate samples were shown in Figure 5, with characteristic peaks consistent with those previously reported [23,43,44]. These peaks confirmed the presence of the main functional groups in all samples, confirming the identity of the extracted sample as sodium alginate.
The broad band that shifted from 3400.0 to 3200.0 cm-1 was assigned to the O-H stretching vibration, while the peak at around 2921.80 cm-1 was attributed to C-H stretching vibrations, including the CH, CH2, and CH3 groups. The peak that shifted from 1620 to 1590 cm-1, as well as the peak that shifted from 1420 to 1400 cm-1, were derived from the symmetrical stretching of the carbonyl (C=O) vibration. The peak that shifted from 1200 to 1000 cm-1 was attributed to C-O-C and C-O-H vibrations. Additionally, the characteristic ring stretching band of a β 1, 4-glycosidic bond was observed at around 886 cm-1. It could be observed that the intensity of the peaks was reduced in the HPH method, indicating that the HPH method effectively destroyed β 1, 4-glycosidic bonds and improved the yield of sodium alginate.

3.5. Microscope raman spectrometer (MRS) analysis

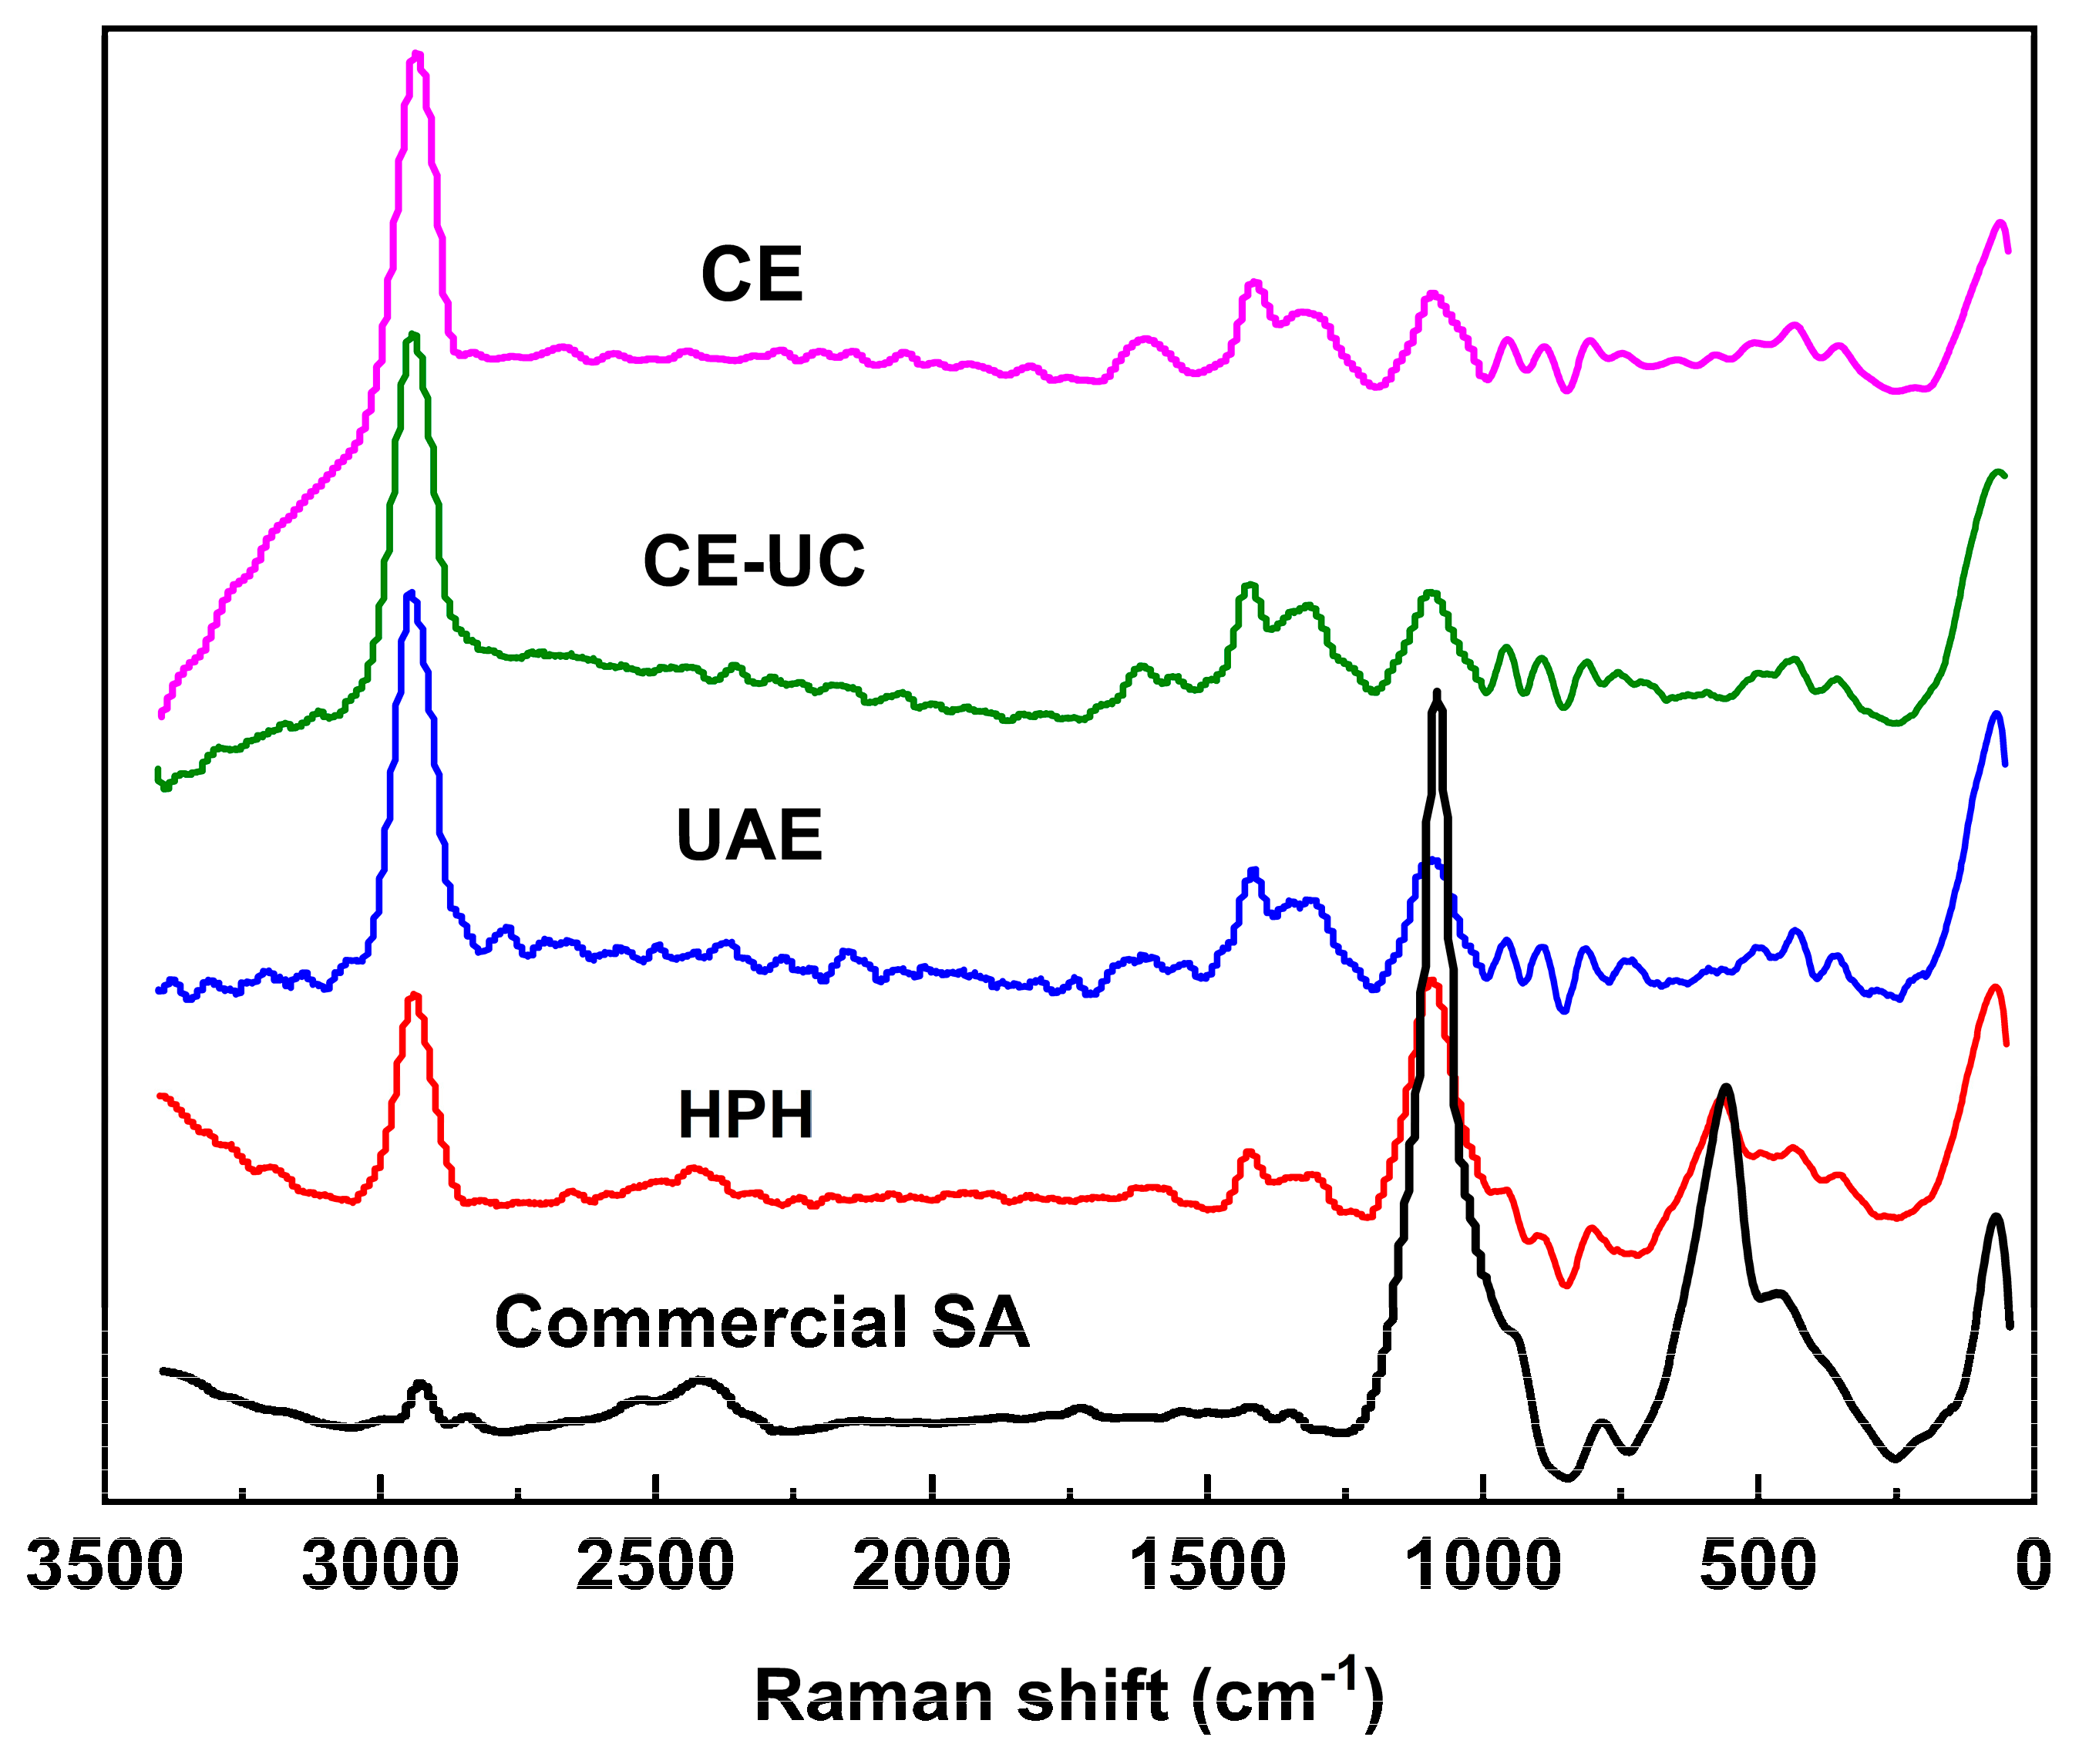
The characteristic peaks of SA (Figure 6) exhibited asymmetric and symmetrical stretching vibration absorption peaks corresponding to COO- bond at approximately 1612 cm-1 and 1415 cm-1. The stretching vibration absorption peaks assigned to the deformed C-O-H bond, C-O bond, and C-C bond could be observed within the range of 1200-900 cm-1. Furthermore, the deformation vibration absorption peak of the pyranose ring and the C-O-C glycosidic bond was observed below 700 cm-1 [45].

3.6. Nuclear magnetic resonance (NMR) analysis

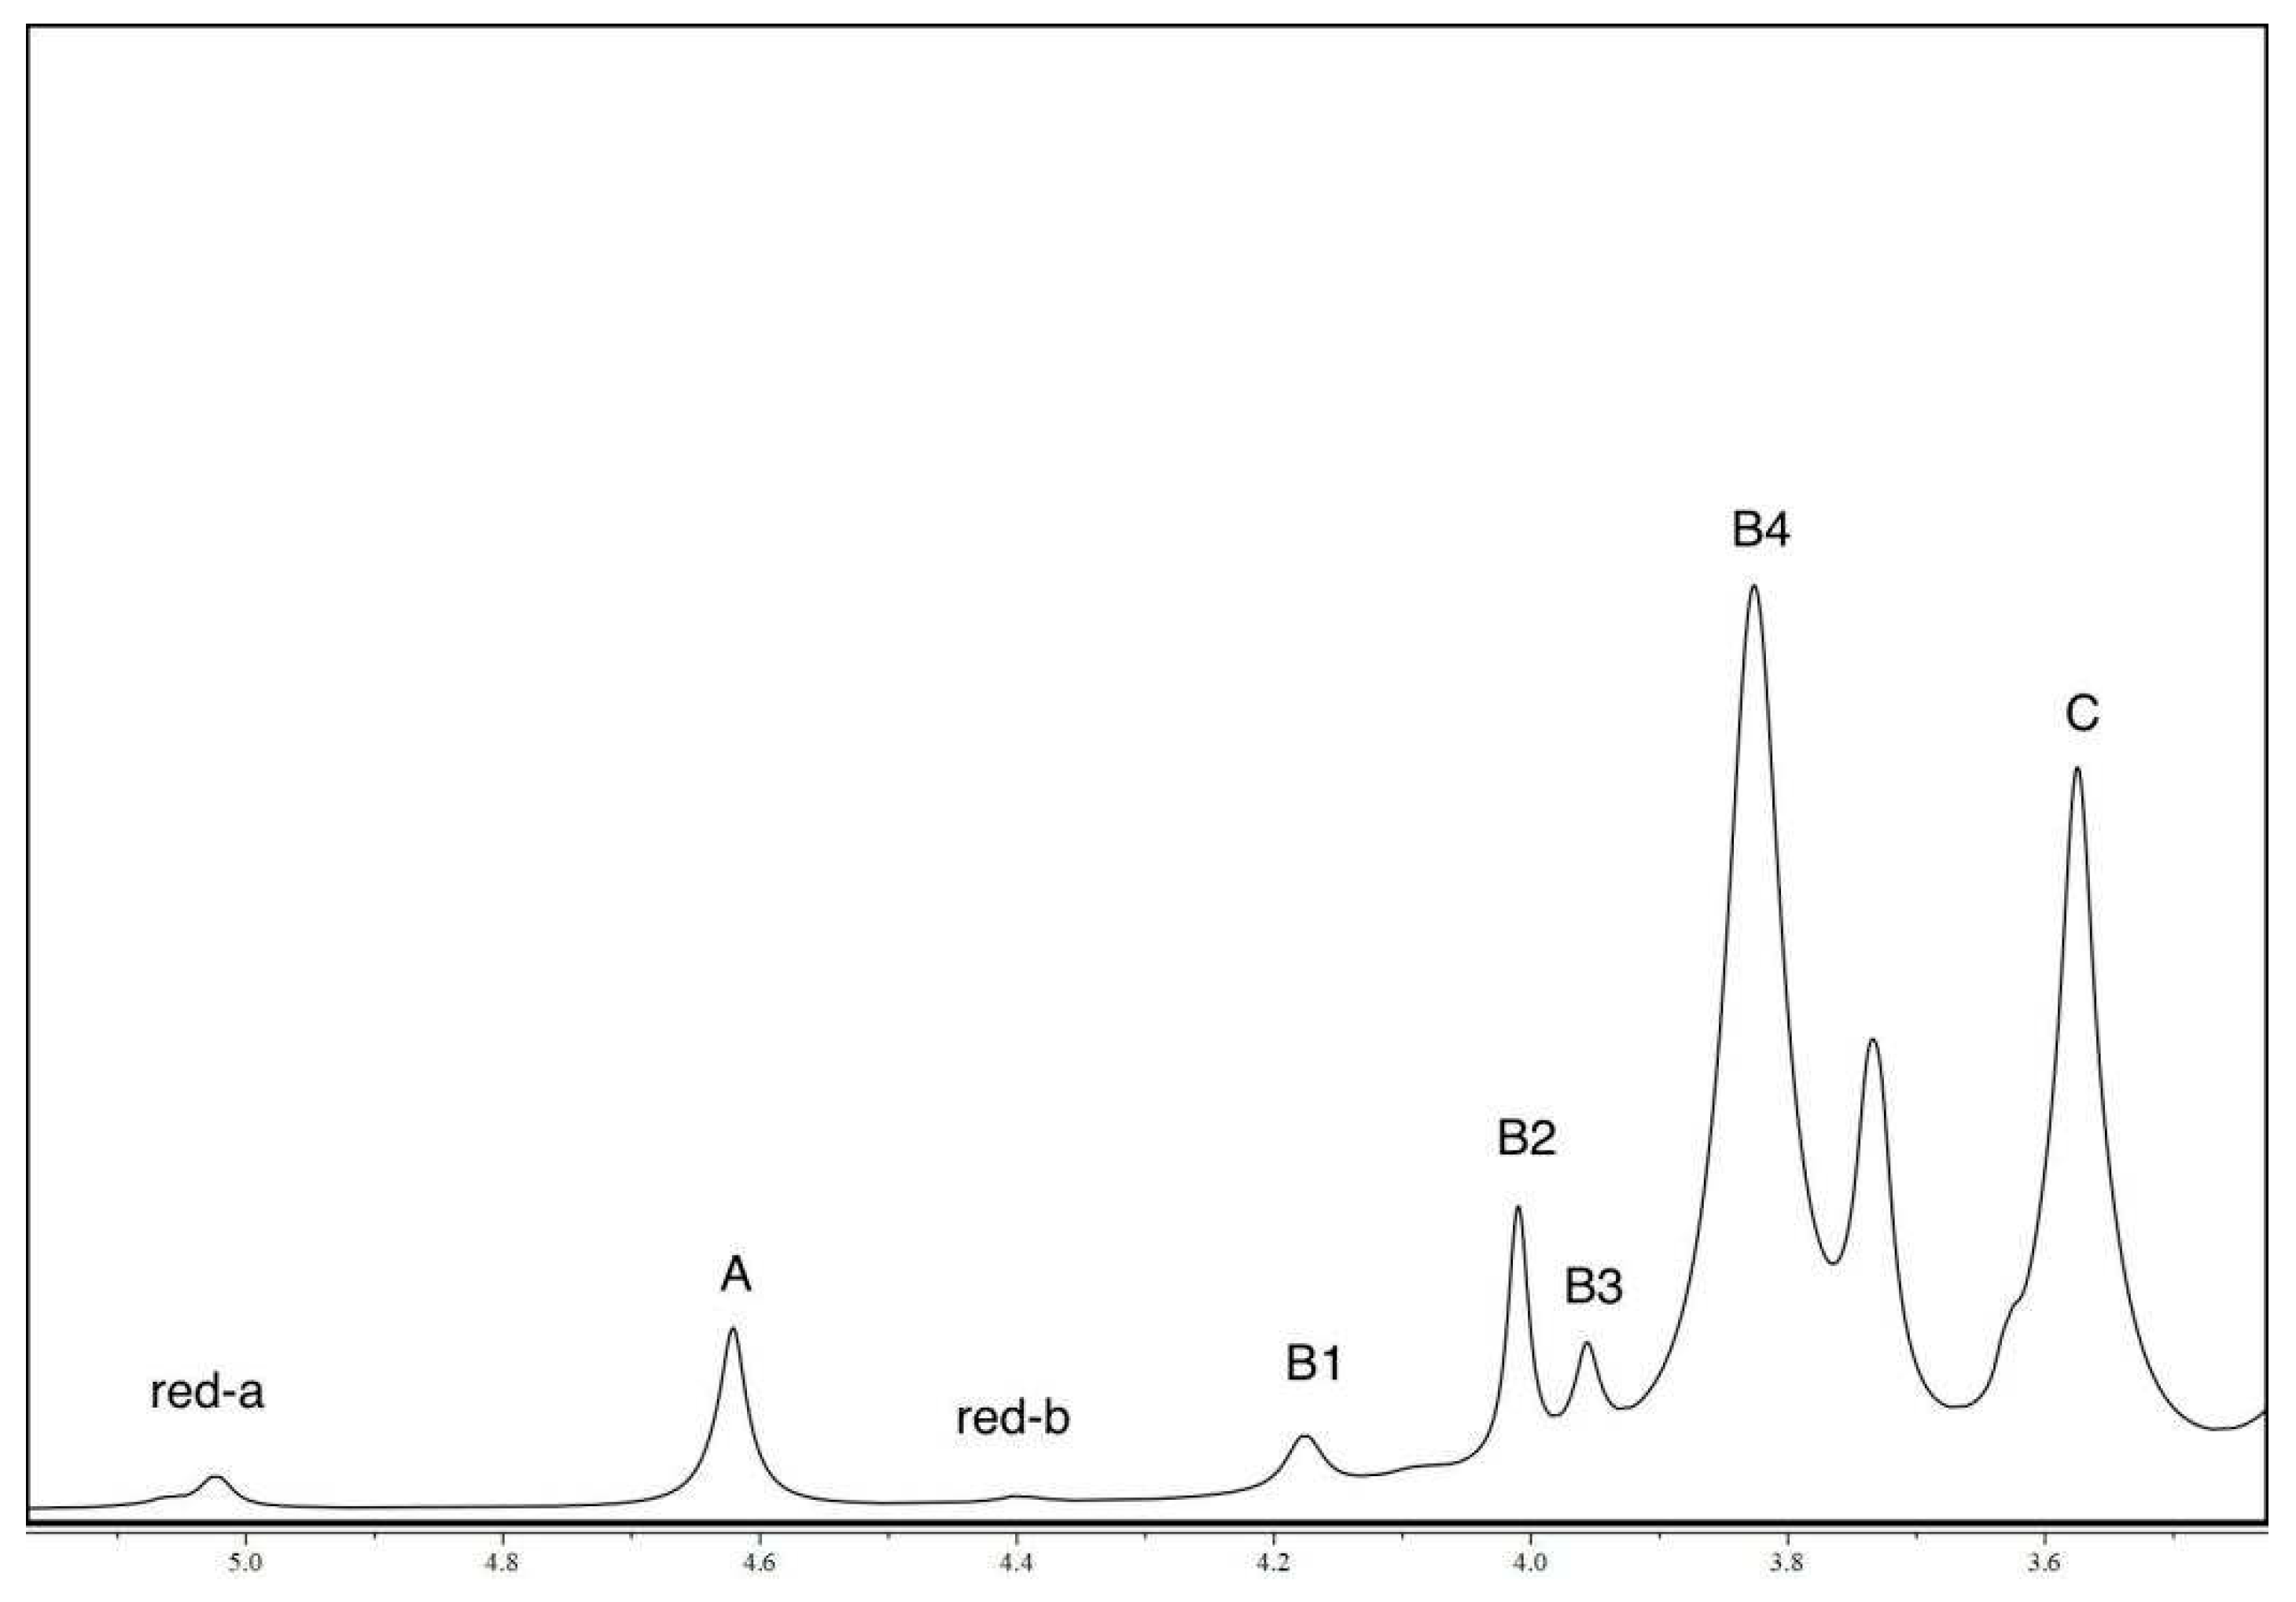
Figure 7 presented the NMR spectra of the sodium alginate sample that was extracted using HPH. The peaks observed in the spectra were indicative of the presence of anomeric and other protons located at different carbon positions within the uronic acid sequence. The chemical shifts were observed at approximately 5.02, 4.62, 4.40, 4.17, 4.01, 3.96, 3.82, and 3.58 ppm, which could be attributed to A (anomeric proton of guluronic acid), B1 (H-5 proton of the central guluronic acid residue in a GGM traid), B2 (H-5 proton of the central guluronic acid residue in a MGM traid), B3 (anomeric proton of the mannuronic acid residue neighboring a mannuronic acid), B4 (anomeric proton of the mannuronic acid residue neighboring a guluronic acid), and C (proton 5 of guluronic acid), respectively. It was important to note that these chemical shifts differed slightly from those observed in the alginate extracted using the ASTM standard. This variation could be attributed to the presence of trace amounts of metal ions in the extracted alginate and differences in its chemical composition, properties, and molecular weight. The presence of the metal ions, such as calcium, could lead to broadening of the signal lines and selective loss of signal intensity.
The block structure and M/G ratio were calculated following the calculation method outlined in the ASTM standard F2259-10 (2012). Table 1 displayed the calculated values for FG, FM, FGG, FMM, FMG, FGM, FGGG, FMGM, FGGM, FMGG, NG, NM, DPn, and M/G ratio. The M/G ratio of alginate extracted from HPH was found to be 2.03, which fell within the range of M/G ratios observed in commercially available alginate extracted from Laminaria (1.2-2.2) [46].
The physicochemical properties of alginate were greatly influenced by its structure, including factors such as the M/G ratio and the arrangement of M and G residues [47]. The uronic acid sequence played a crucial role in determining the gel-forming ability of alginate. Alginates with a high M/G ratio tended to form gels that were soft and elastic [48]. Therefore, as the extracted alginate in this study had a high mannuronic acid content of 67%, it was likely to form soft and elastic gels.

3.7. X-ray diffraction (XRD) analysis

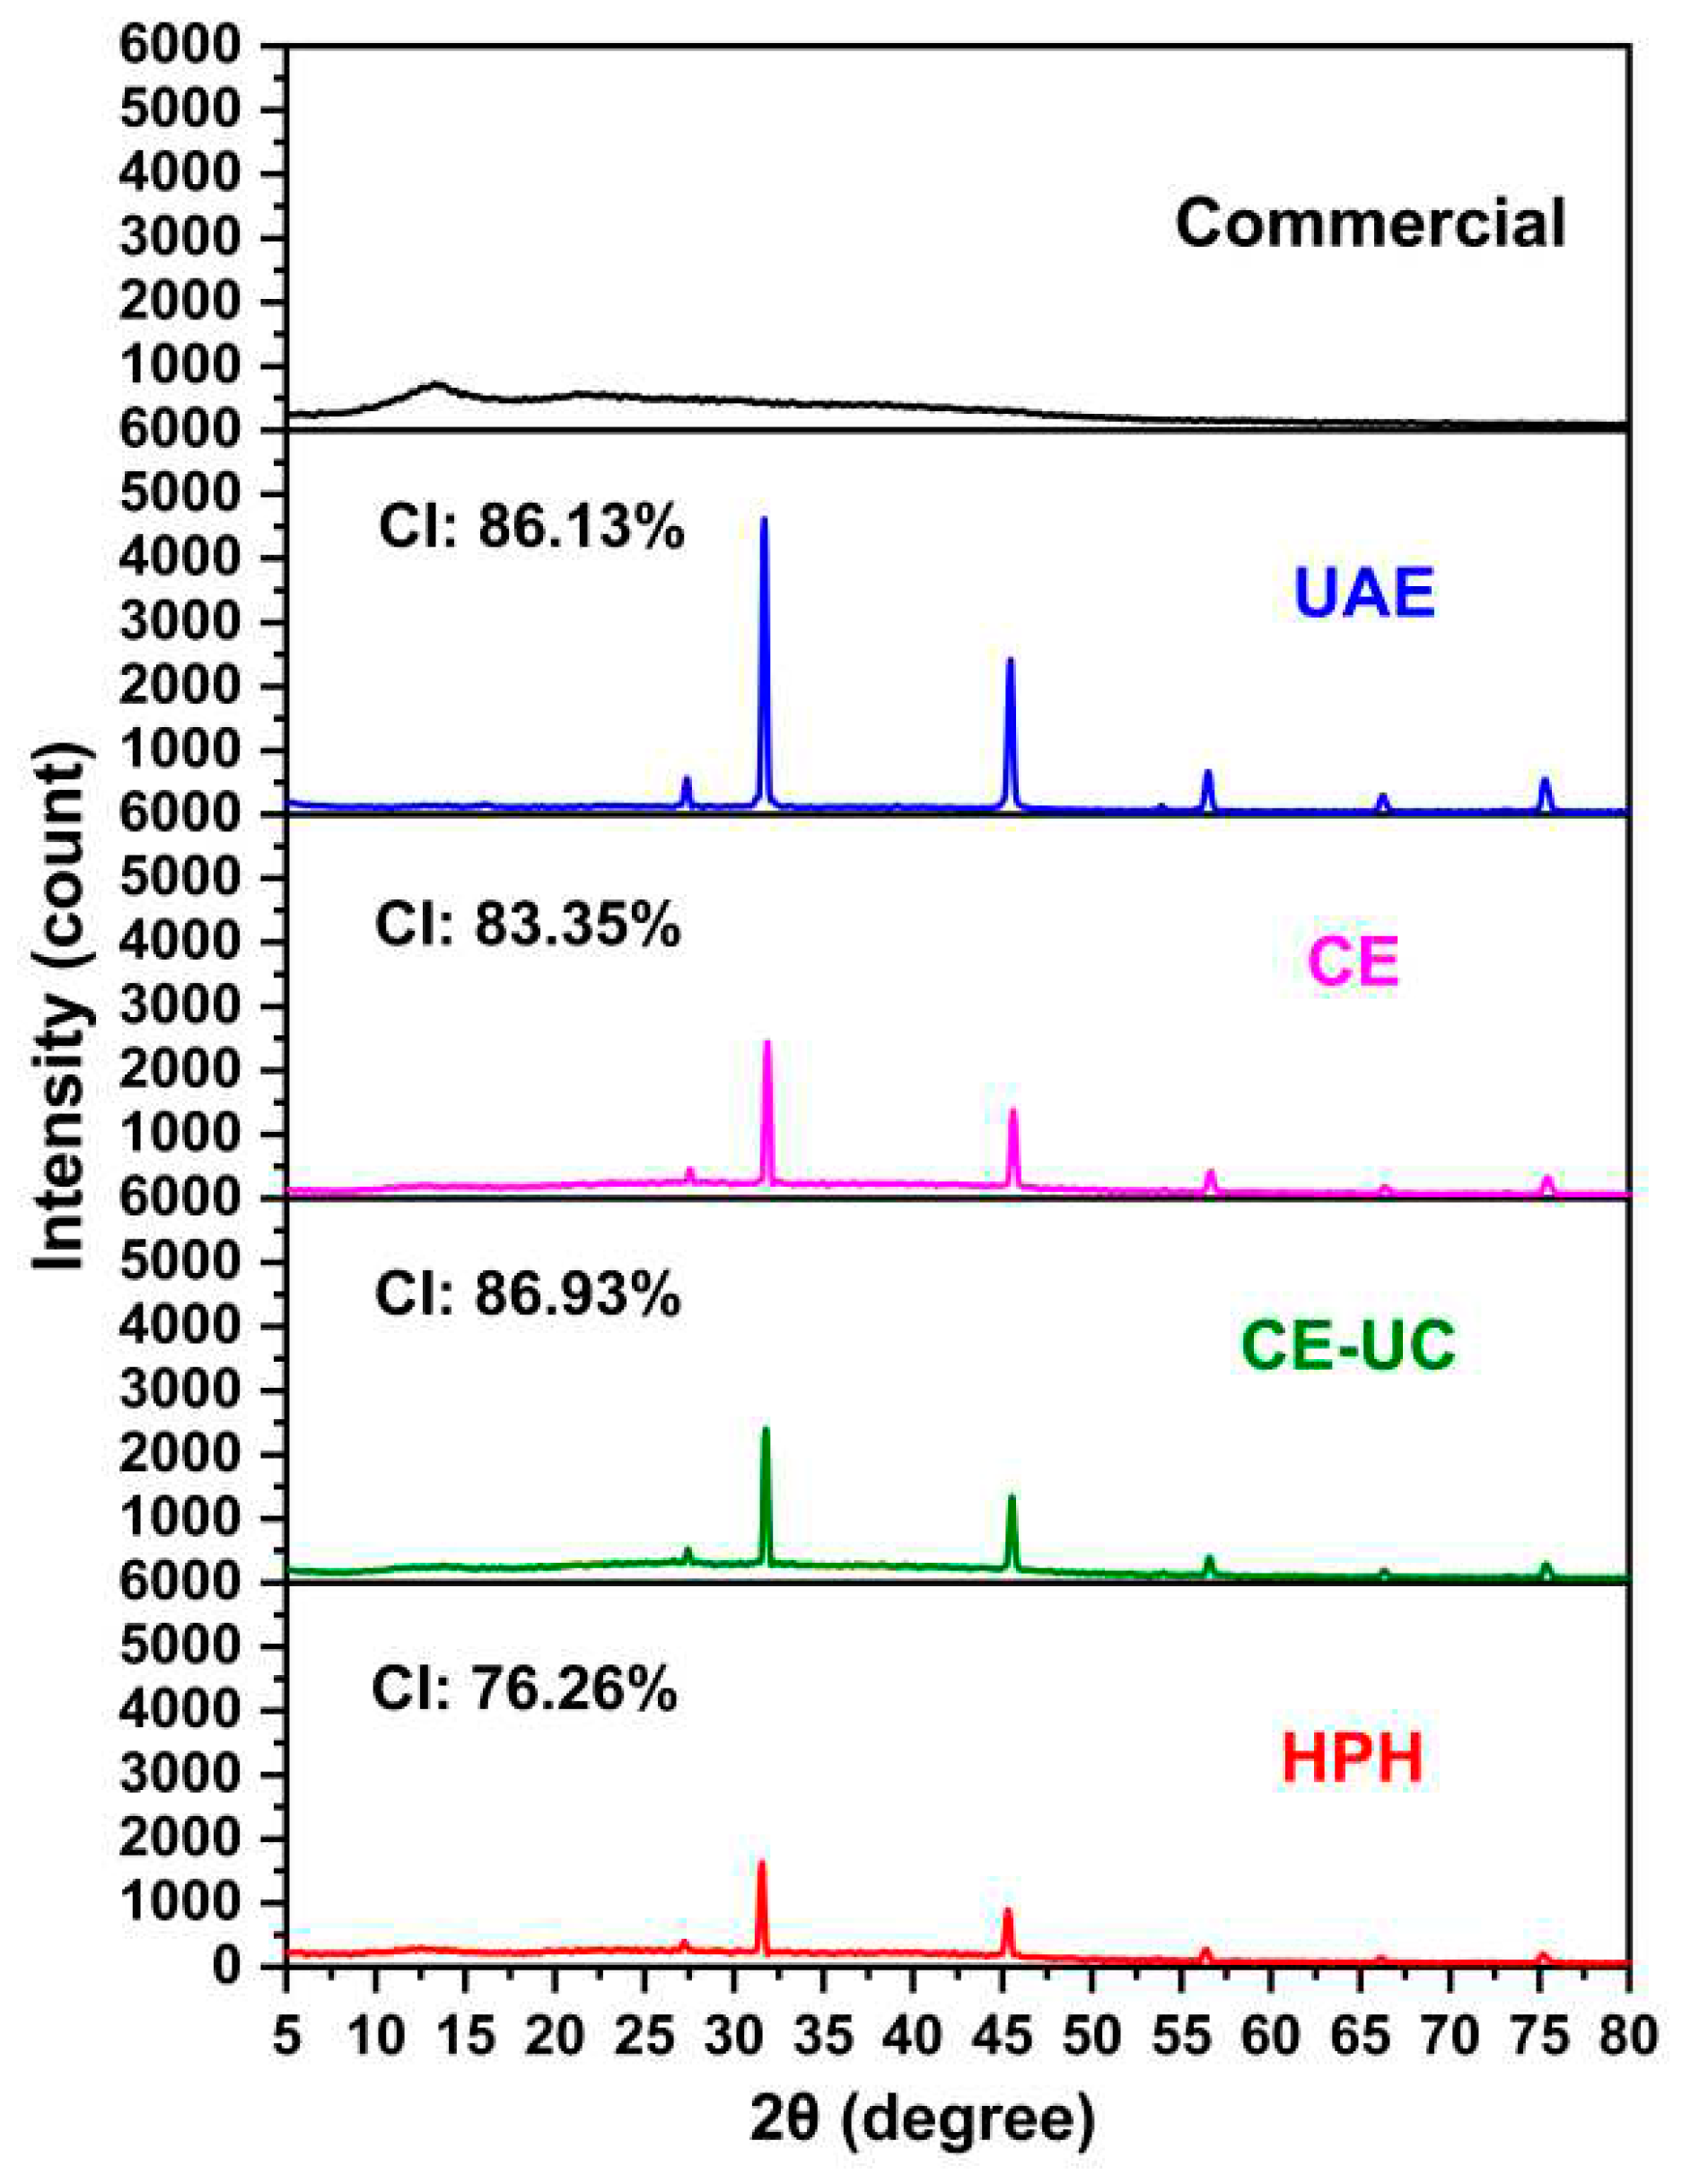
XRD analysis was conducted on various sodium alginate samples to investigate their crystallinity and recalcitrance properties. The crystallinity of sodium alginate was a key attribute in determining its efficiency for enzymatic hydrolysis. A comparative X-ray diffractogram of the different sodium alginate samples was shown in Figure 8. The HPH method resulted in a crystallinity of 76.26%, which was the lowest among all the samples, excluding commercial sodium alginate. The diffraction pattern of commercial sodium alginate only showed a peak at around 13.3° and a very weak diffraction peak at 22.5° [49]. The other samples exhibited characteristic strong peaks at 2θ values of 31.8°, 45.4°, 56.6°, and 66.2°[50]. Notably, the sodium alginate extracted through the HPH method displayed decreased intensities of the characteristic peaks, suggesting that the HPH method induced amorphousness in sodium alginate, enhancing the accessibility of alginate lyase, and promoting the production of alginate oligosaccharides.

3.8. Thermal gravimetric analysis (TGA) analysis

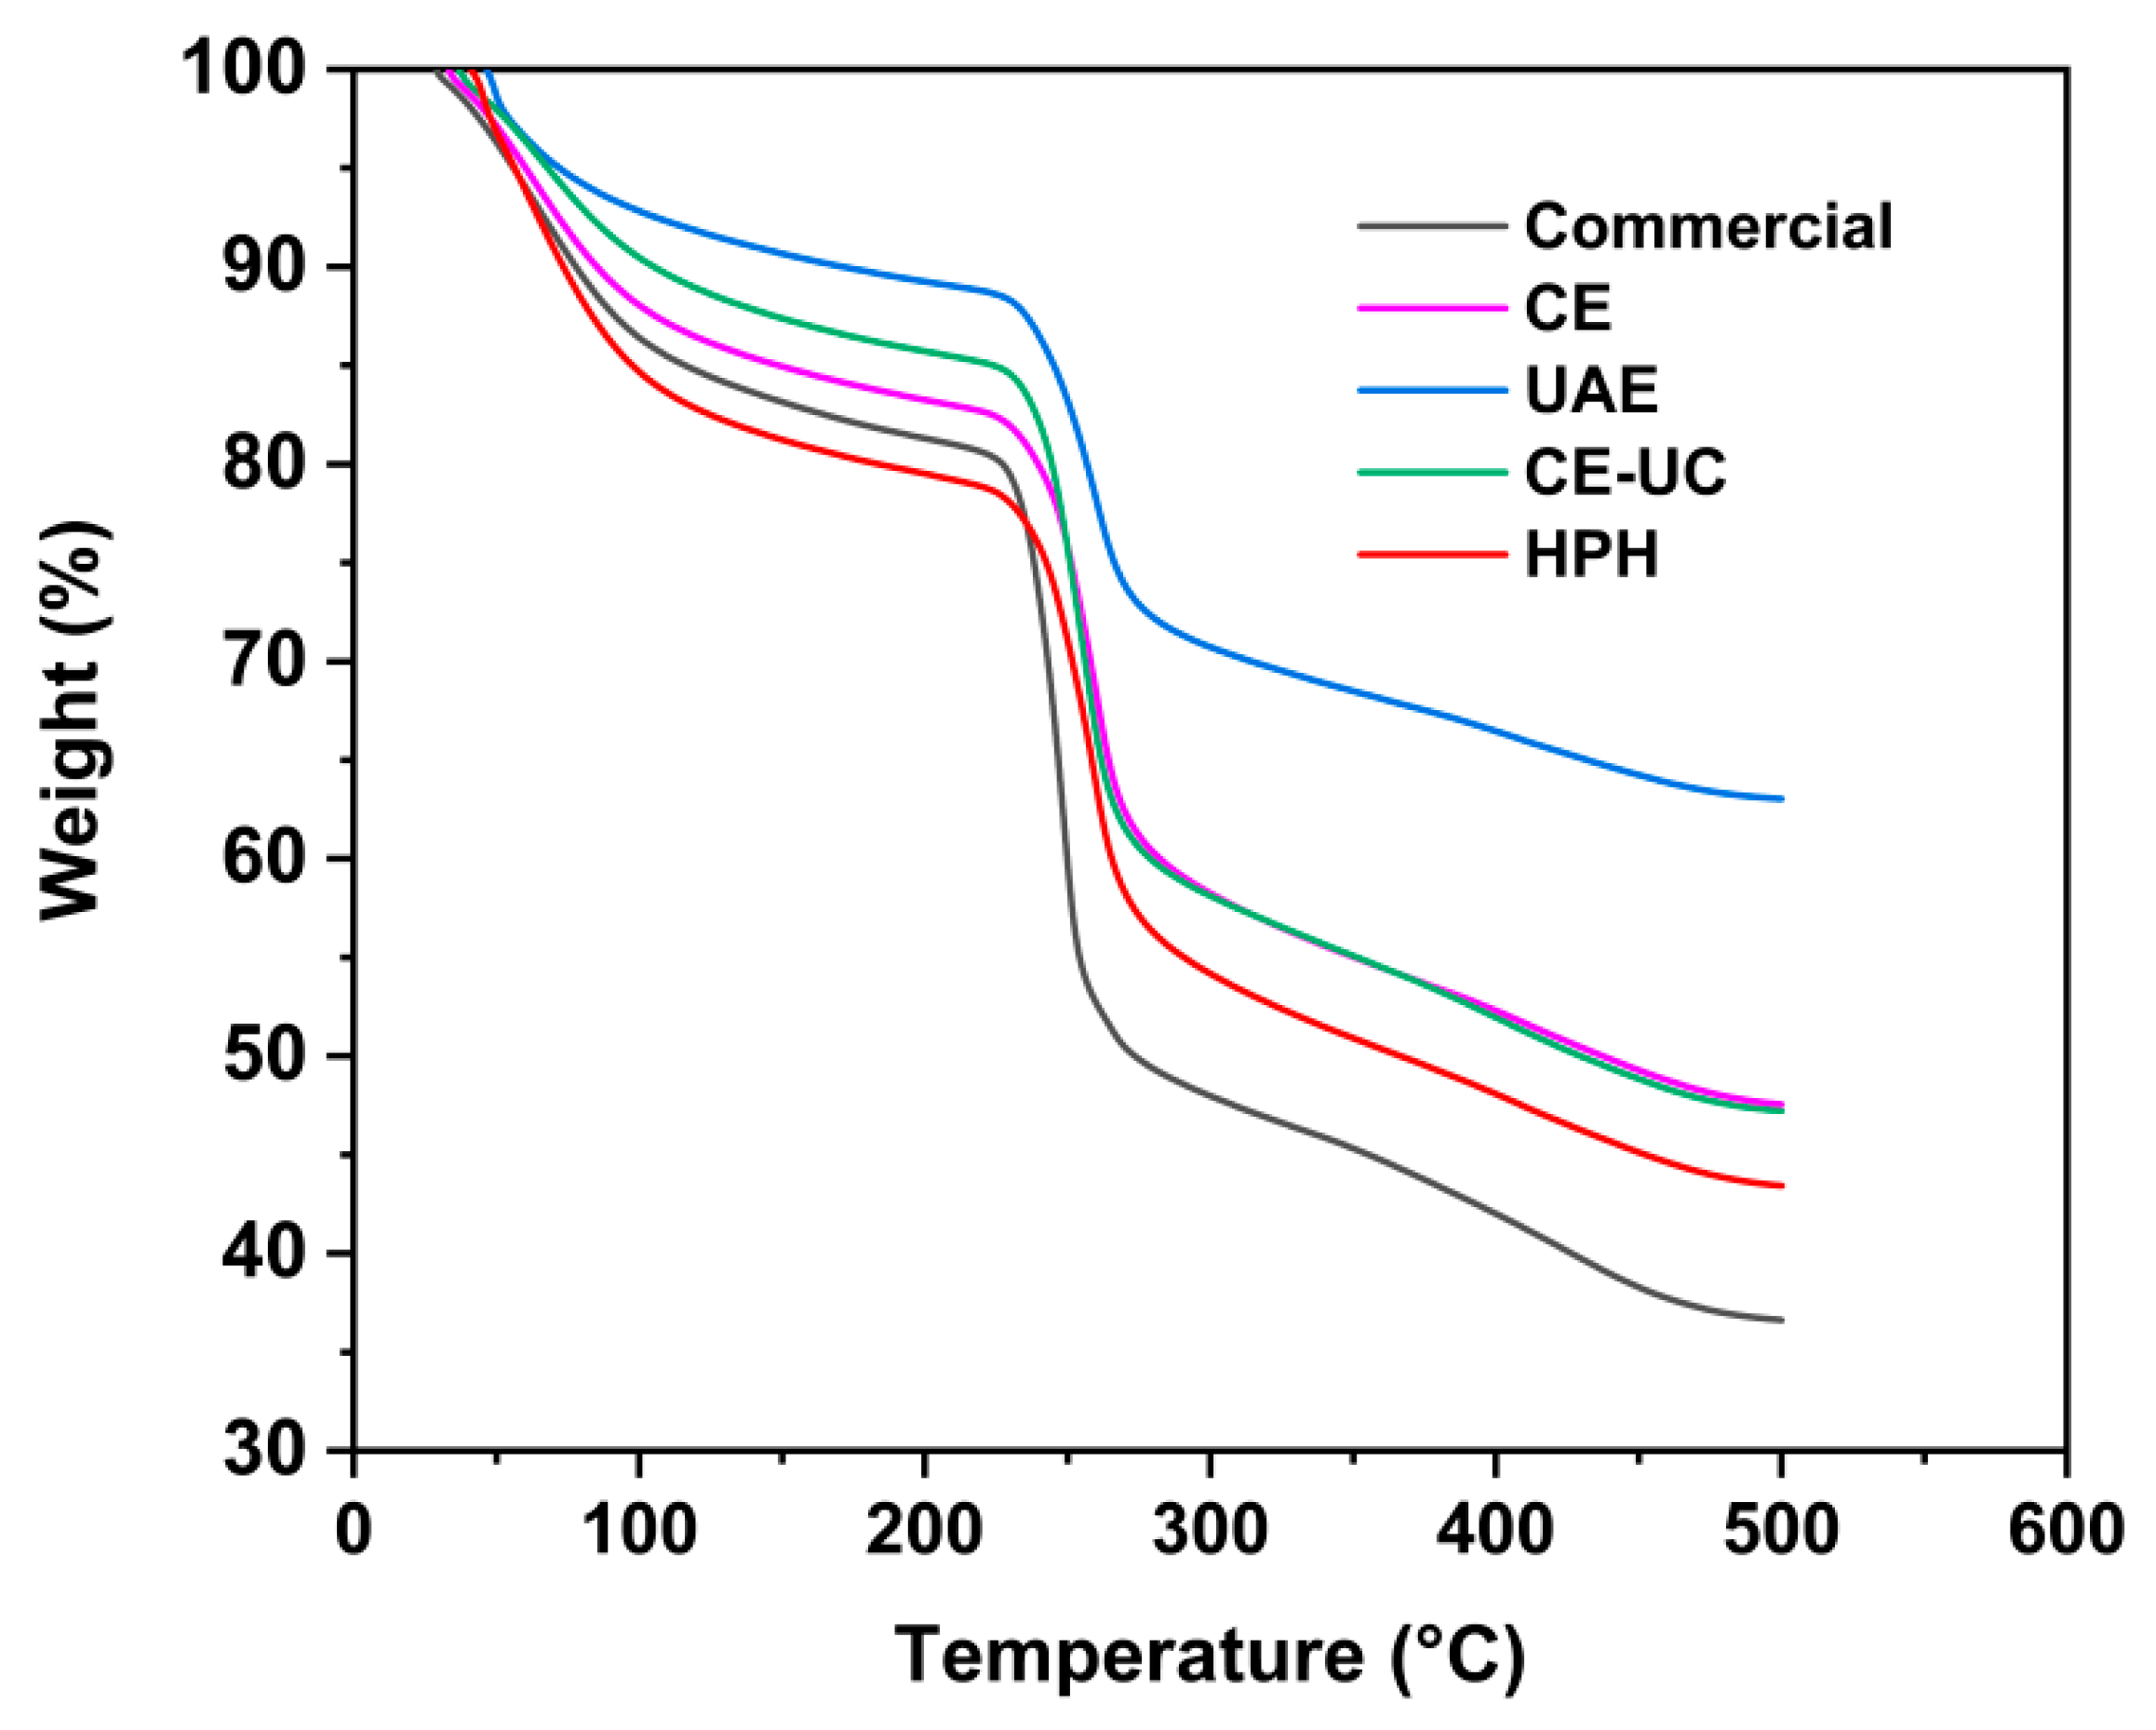
Thermal gravimetric analysis (TGA) was performed to investigate the thermal stability of various sodium alginate samples. The TGA curve for sodium alginate displayed three distinct weight loss steps during thermal decomposition (Figure 9). In contrast to the commercial sodium alginate, the TGA curves of extracted samples exhibited a tendency towards higher temperature, indicating an enhanced thermal stability. The removal of water molecules from sodium alginate occurred within the temperature range of room temperature to 120°C. During this interval, the sodium alginate extracted using the HPH method exhibited the highest weight loss (17%), while the sodium alginate extracted using the ultrasonic method experienced the lowest weight loss (8%).
After the loss of water, sodium alginate decomposed at temperature ranging from 210°C to 300°C. For commercial samples, decomposition occurred at 220°C, with completion at 260°C. Sodium alginate extracted by HPH degraded within a temperature range of 240°C to 280°C. The result of TGA displayed a strong correlation with the result of XRD, indicating that the reduction in crystallinity facilitated the degradation of the HPH-extracted sample. These finding were consistent with previous studies [51].

3.8. Total antioxidant capacity assay (T-AOC)

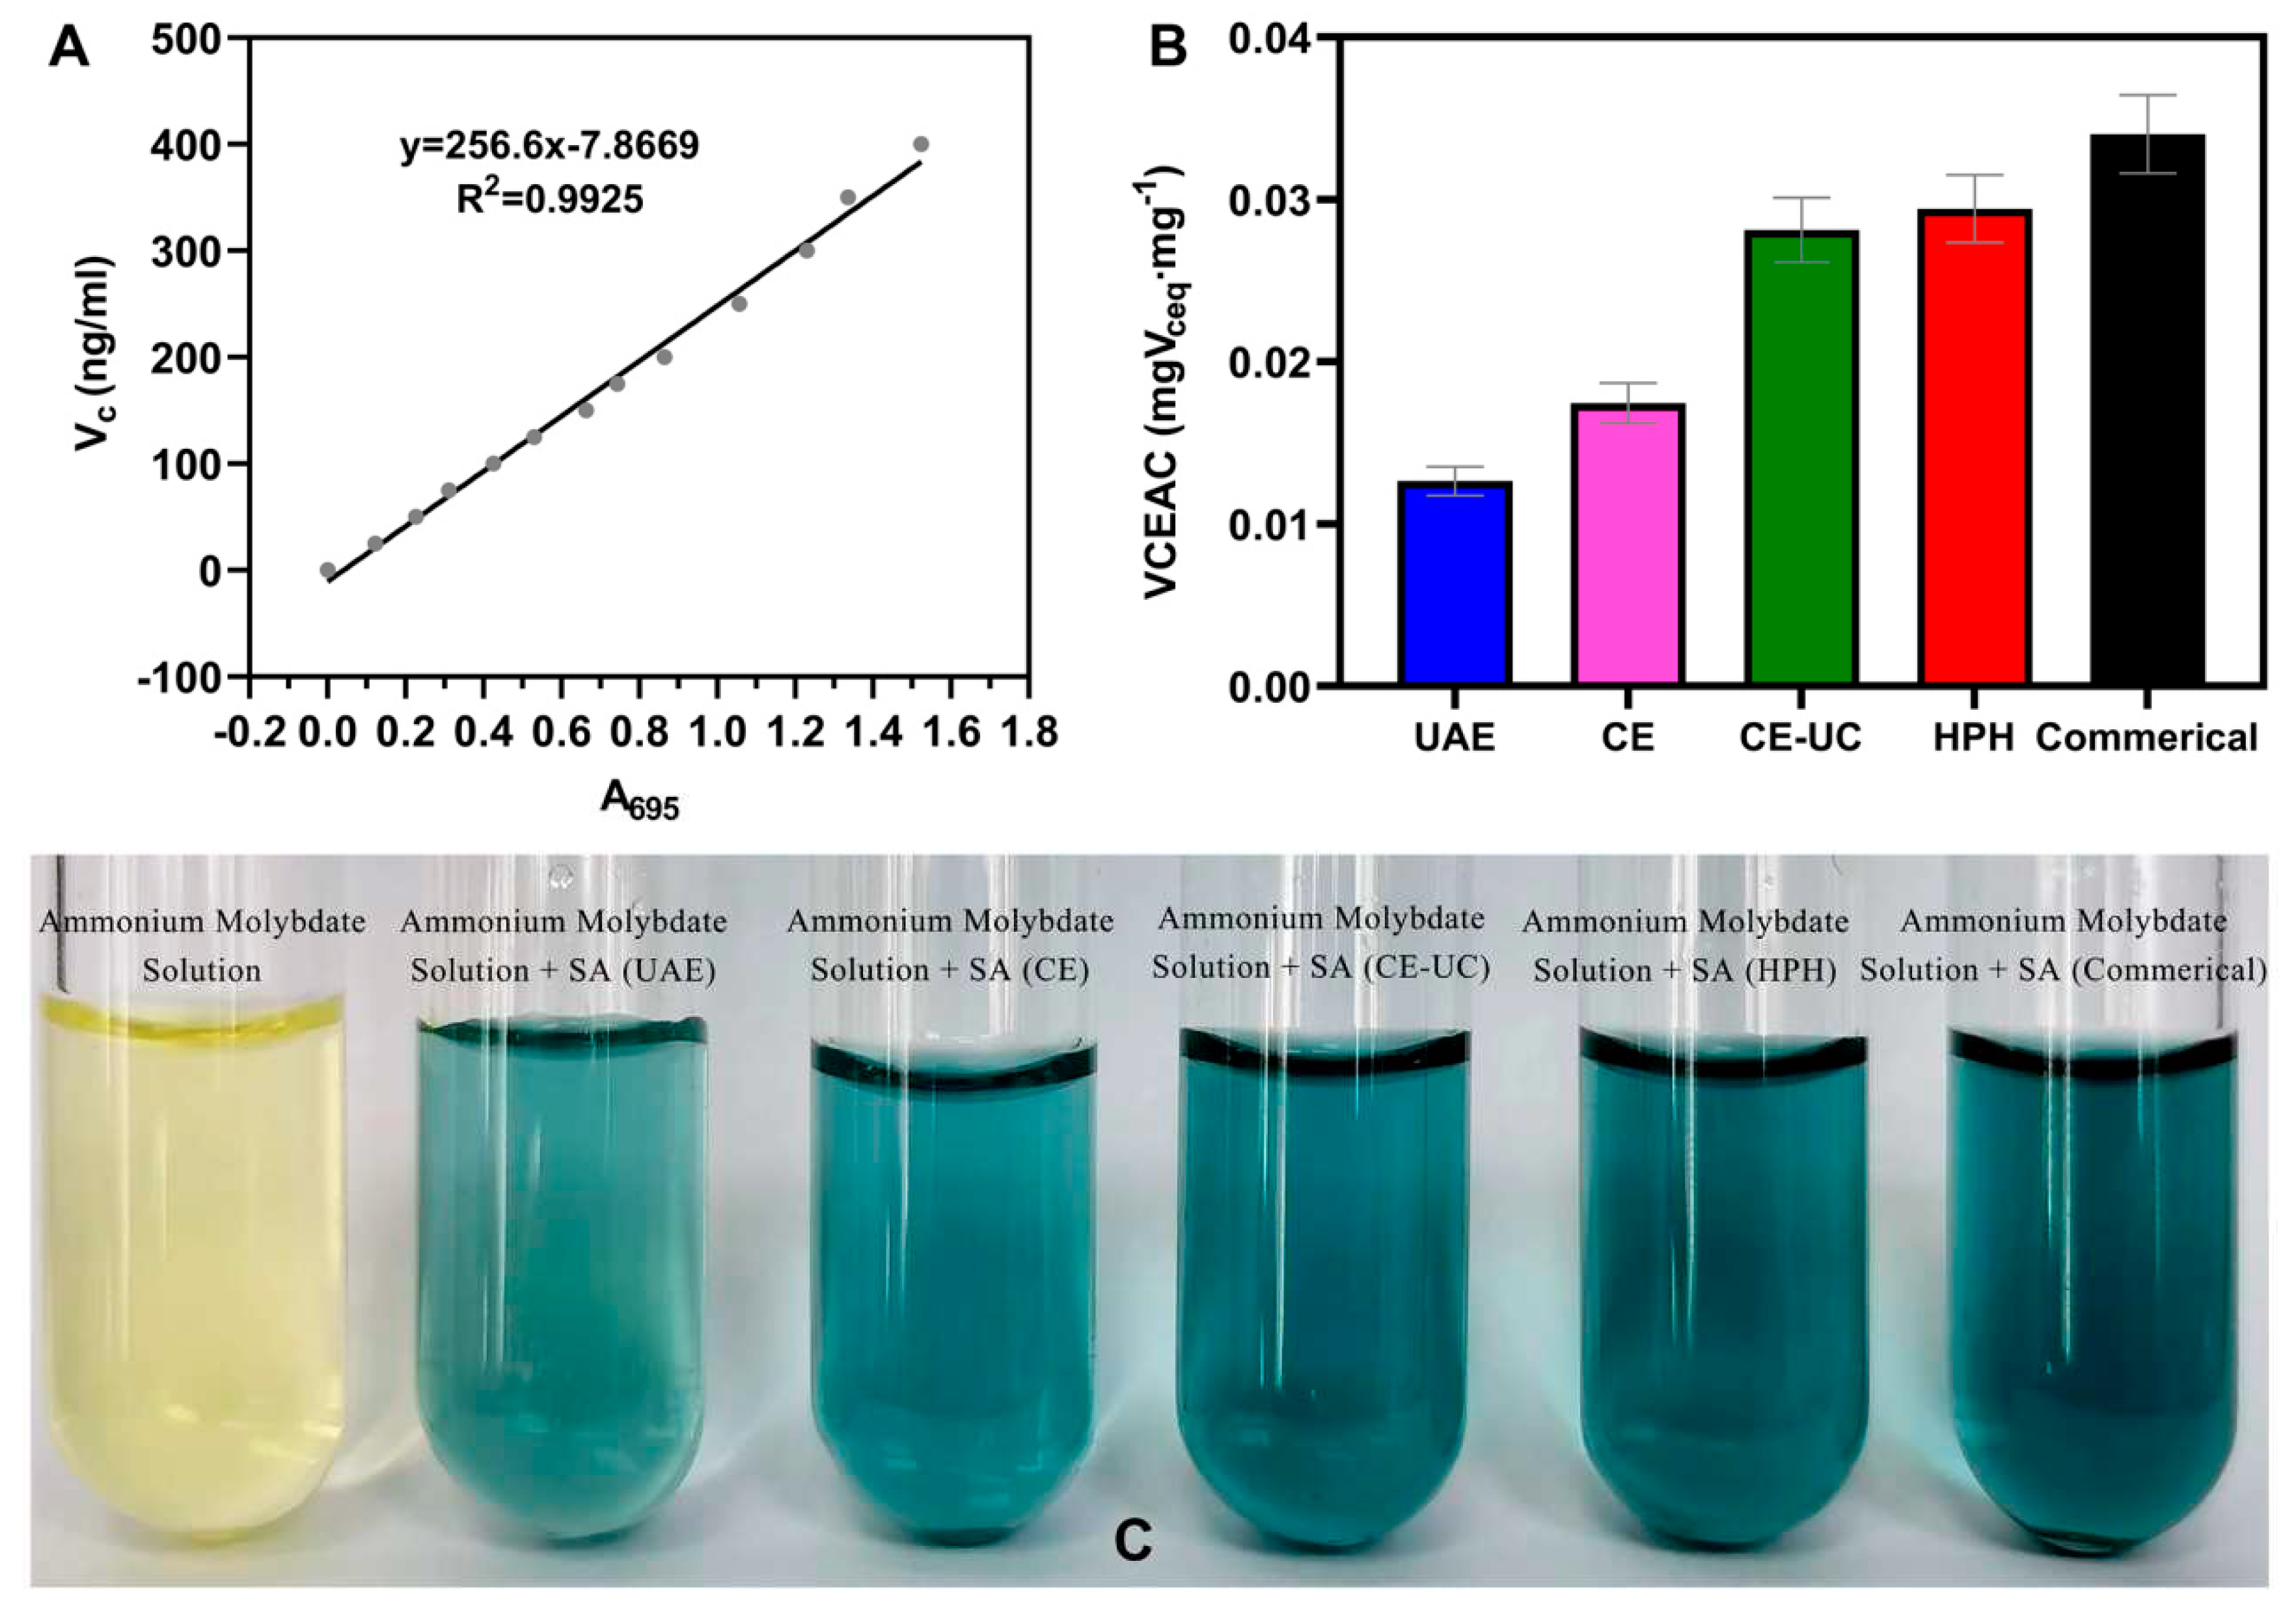
The results of antioxidant capacity of various extracted sodium alginate samples were presented in Figure 10, and their antioxidant activities were evaluated as vitamin C equivalent antioxidant capacity (VCEAC). Among these samples, sodium alginate extracted using UAE showed the lowest antioxidant capacity (0.01264 mgVceq∙mg-1), whereas the sodium alginate extracted using HPH displayed the strongest antioxidant capacity (0.02942 mgVceq∙mg-1), second only to commercially available sodium alginate. These findings could be partially explained by the different molecular weights of sodium alginate extracted using different methods. It was well-known that polysaccharides with lower molecular weight exhibited better antioxidant activity.

4. Conclusions

In this paper, we investigated the successful application of calcium coagulation-ion exchange combined with high-pressure homogenization for extracting sodium alginate from brown seaweed. We found that HPH effectively broke the cell wall of the L. japonica, resulting in improved yield, faster production, and reduced costs. Moreover, the sodium alginate extracted using this method exhibited stronger antioxidant activity. These finding presented a promising new strategy for the industrial extraction of sodium alginate.
Furthermore, alginate oligosaccharides, which were degradation products of alginate, had attracted considerable attention owing to their notable physiological characteristics. These included immune regulation, antimicrobial properties, antioxidant activity, antitumor effects, anti-inflammatory properties, and promotion of plant growth. The low crystallinity of sodium alginate extracted in this work was advantageous for the production of AOS and effectively supported the advancement of their industrial production.

Conflicts of Interests

The authors declare that they have no competing interests.

Acknowledgments

The authors are grateful for the financial support from the National Natural Science Foundation of China (Grant No. 31960203), Guangxi Science and Technology Base and Talent Project (AD23023007) and Basic Science and Research Foundation of Guangxi Academy of Sciences (CQ-C-202302).

Abbreviations

HPH; high pressure homogenization method; MAE; microwave-assisted extraction; UAE; ultrasonic-assisted extraction; CE; complex enzyme hydrolysis; CE-UC; complex enzyme-ultrasonic combined method; SEM; scanning electron microscopic; FTIR; Fourier transform infrared; MRS; Microscope Raman spectrometer; NMR; Nuclear magnetic resonance; XRD; X-ray diffraction; TGA; Thermal gravimetric analysis; T-AOC; Total Antioxidant Capacity Assay

References

  1. C. Sun, J. Zhou, G. Duan, and X. Yu, “Hydrolyzing Laminaria japonica with a combination of microbial alginate lyase and cellulase,” Bioresour Technol, vol. 311, 2020. [CrossRef]
  2. G. Roesijadi, S. B. Jones, L. J. Snowden-Swan, and Y. Zhu, “Macroalgae as a Biomass Feedstock: A Preliminary Analysis (PNNL-19944),” 2010.
  3. X. Yang, H. Sui, H. Liang, J. Li, and B. Li, “Effects of M/G Ratios of Sodium Alginate on Physicochemical Stability and Calcium Release Behavior of Pickering Emulsion Stabilized by Calcium Carbonate,” Front Nutr, vol. 8, Jan. 2022. [CrossRef]
  4. L. G. Gómez-Mascaraque, M. Martínez-Sanz, S. A. Hogan, A. López-Rubio, and A. Brodkorb, “Nano- and microstructural evolution of alginate beads in simulated gastrointestinal fluids. Impact of M/G ratio, molecular weight and pH,” Carbohydr Polym, vol. 223, Nov. 2019. [CrossRef]
  5. E. Fourest and B. Volesky, “Alginate Properties and Heavy Metal Biosorption by Marine Algae,” 1997.
  6. D. J. McHugh, Production and utilization of products from commercial seaweeds, vol. 288. Food and Agriculture Organization of the United Nations, 1987.
  7. Inc. Grand View Research, “Alginate Market Size Worth $923.8 Million by 2025 | CAGR: 4.5%: Grand View Research, Inc.,” Dec. 11, 2017. https://www.prnewswire.com/news-releases/alginate-market-size-worth-9238-million-by-2025--cagr-45-grand-view-research-inc-663335343.html (accessed Sep. 25, 2022).
  8. S. A. Ghumman et al., “Formulation and evaluation of quince seeds mucilage – sodium alginate microspheres for sustained delivery of cefixime and its toxicological studies,” Arabian Journal of Chemistry, vol. 15, no. 6, p. 103811, Jun. 2022. [CrossRef]
  9. X. Song et al., “Preparation and characterization of multi-network hydrogels based on sodium alginate/krill protein/polyacrylamide—Strength, shape memory, conductivity and biocompatibility,” Int J Biol Macromol, vol. 207, pp. 140–151, May 2022. [CrossRef]
  10. Y. Gong, G. T. Han, Y. M. Zhang, J. F. Zhang, W. Jiang, and Y. Pan, “Research on the degradation performance of the lotus nanofibers-alginate porous materials,” Polym Degrad Stab, vol. 118, pp. 104–110, Aug. 2015. [CrossRef]
  11. Y. Zhong et al., “Fabrication and characterization of oil-in-water emulsions stabilized by macadamia protein isolate/chitosan hydrochloride composite polymers,” Food Hydrocoll, vol. 103, Jun. 2020. [CrossRef]
  12. C. Luo, A. Guo, Y. Zhao, and X. Sun, “A high strength, low friction, and biocompatible hydrogel from PVA, chitosan and sodium alginate for articular cartilage,” Carbohydr Polym, vol. 286, p. 119268, Jun. 2022. [CrossRef]
  13. Alzarea et al., “Development and Characterization of Gentamicin-Loaded Arabinoxylan-Sodium Alginate Films as Antibacterial Wound Dressing,” Int J Mol Sci, vol. 23, no. 5, p. 2899, Mar. 2022. [CrossRef]
  14. Y. Zhang et al., “The promoting effects of alginate oligosaccharides on root development in Oryza sativa L. mediated by auxin signaling,” Carbohydr Polym, vol. 113, pp. 446–454, Nov. 2014. [CrossRef]
  15. S. K. Papageorgiou, E. P. Kouvelos, and F. K. Katsaros, “Calcium alginate beads from Laminaria digitata for the removal of Cu+2 and Cd+2 from dilute aqueous metal solutions,” Desalination, vol. 224, no. 1–3, pp. 293–306, Apr. 2008. [CrossRef]
  16. S. Kirdponpattara and M. Phisalaphong, “Bacterial cellulose-alginate composite sponge as a yeast cell carrier for ethanol production,” Biochem Eng J, vol. 77, pp. 103–109, Aug. 2013. [CrossRef]
  17. Y. Sasaki, T. Takagi, K. Motone, T. Shibata, K. Kuroda, and M. Ueda, “Direct bioethanol production from brown macroalgae by co-culture of two engineered saccharomyces cerevisiae strains,” Biosci Biotechnol Biochem, vol. 82, no. 8, pp. 1459–1462, 2018. [CrossRef]
  18. D. J. McHugh, “A guide to the seaweed industry.,” FAO Fisheries Technical Paper , vol. 441, 2003.
  19. T. A. Fenoradosoa et al., “Extraction and characterization of an alginate from the brown seaweed Sargassum turbinarioides Grunow,” J Appl Phycol, vol. 22, no. 2, pp. 131–137, Apr. 2010. [CrossRef]
  20. S. Y. Chee, P. K. Wong, and C. L. Wong, “Extraction and characterisation of alginate from brown seaweeds (Fucales, Phaeophyceae) collected from Port Dickson, Peninsular Malaysia,” J Appl Phycol, vol. 23, no. 2, pp. 191–196, Apr. 2011. [CrossRef]
  21. M. Fertah, A. Belfkira, E. montassir Dahmane, M. Taourirte, and F. Brouillette, “Extraction and characterization of sodium alginate from Moroccan Laminaria digitata brown seaweed,” Arabian Journal of Chemistry, vol. 10, pp. S3707–S3714, May 2017. [CrossRef]
  22. C. G. Gomez, M. v. Pérez Lambrecht, J. E. Lozano, M. Rinaudo, and M. A. Villar, “Influence of the extraction-purification conditions on final properties of alginates obtained from brown algae (Macrocystis pyrifera),” Int J Biol Macromol, vol. 44, no. 4, pp. 365–371, May 2009. [CrossRef]
  23. R. A. Khajouei et al., “Extraction and characterization of an alginate from the Iranian brown seaweed Nizimuddinia zanardini,” Int J Biol Macromol, vol. 118, pp. 1073–1081, Oct. 2018. [CrossRef]
  24. H. Chen, X. Zhou, and J. Zhang, “Optimization of enzyme assisted extraction of polysaccharides from Astragalus membranaceus,” Carbohydr Polym, vol. 111, pp. 567–575, Oct. 2014. [CrossRef]
  25. Y. Zhu et al., “Optimization of enzyme-assisted extraction and characterization of polysaccharides from Hericium erinaceus,” Carbohydr Polym, vol. 101, no. 1, pp. 606–613, 2014. [CrossRef]
  26. B. Ren, C. Chen, C. Li, X. Fu, L. You, and R. H. Liu, “Optimization of microwave-assisted extraction of Sargassum thunbergii polysaccharides and its antioxidant and hypoglycemic activities,” Carbohydr Polym, vol. 173, pp. 192–201, Oct. 2017. [CrossRef]
  27. L. Montes, M. Gisbert, I. Hinojosa, J. Sineiro, and R. Moreira, “Impact of drying on the sodium alginate obtained after polyphenols ultrasound-assisted extraction from Ascophyllum nodosum seaweeds,” Carbohydr Polym, vol. 272, Nov. 2021. [CrossRef]
  28. B. Du, L. J. Zheng, and Q. Wei, “Screening and identification of Providencia rettgeri for brown alga degradation and anion sodium alginate/poly (vinyl alcohol)/tourmaline fiber preparation,” Journal of the Textile Institute, vol. 106, no. 7, pp. 787–791, Jul. 2015. [CrossRef]
  29. Y. Jin, L. Li, Q. Liu, and N. AI, “Optimization of Extraction Process of Sodium Alginate from Laminaria japonica by Ultrasonic-Complex Enzymatic Hydrolysis,” Science and Technology of Food Idustry, vol. 42, no. 5, pp. 132–137, 2021.
  30. Y. Lei, B. Du, Y. Qian, F. Ye, and L. Zheng, “Sodium alginate extraction by enzyme-ultrasonic combined method,” in Advanced Materials Research, 2012, pp. 2326–2329. [CrossRef]
  31. Q. Li, Y. Zeng, L. Wang, H. Guan, C. Li, and L. Zhang, “The heparin-like activities of negatively charged derivatives of low-molecular-weight polymannuronate and polyguluronate,” Carbohydr Polym, vol. 155, pp. 313–320, Jan. 2017. [CrossRef]
  32. Y. Zhu, L. Wu, Y. Chen, H. Ni, A. Xiao, and H. Cai, “Characterization of an extracellular biofunctional alginate lyase from marine Microbulbifer sp. ALW1 and antioxidant activity of enzymatic hydrolysates,” Microbiol Res, vol. 182, pp. 49–58, Jan. 2016. [CrossRef]
  33. J. Chen et al., “Alginate oligosaccharide DP5 exhibits antitumor effects in osteosarcoma patients following surgery,” Front Pharmacol, vol. 8, no. SEP, Sep. 2017. [CrossRef]
  34. W. Fang et al., “Identification and activation of TLR4-mediated signalling pathways by alginate-derived guluronate oligosaccharide in RAW264.7 macrophages,” Sci Rep, vol. 7, no. 1, Dec. 2017. [CrossRef]
  35. B. Zhu and H. Yin, “Alginate lyase: Review of major sources and classification, properties, structure-function analysis and applications,” Bioengineered, vol. 6, no. 3. Taylor and Francis Inc., pp. 125–131, 2015. [CrossRef]
  36. R. Levy, Z. Okun, M. Davidovich-Pinhas, and A. Shpigelman, “Utilization of high-pressure homogenization of potato protein isolate for the production of dairy-free yogurt-like fermented product,” Food Hydrocoll, vol. 113, Apr. 2021. [CrossRef]
  37. V. Lenhart, J. Quodbach, and P. Kleinebudde, “Fibrillated Cellulose via High Pressure Homogenization: Analysis and Application for Orodispersible Films,” AAPS PharmSciTech, vol. 21, no. 1, Jan. 2020. [CrossRef]
  38. C. Wu et al., “Preparation and characterization of okara nanocellulose fabricated using sonication or high-pressure homogenization treatments,” Carbohydr Polym, vol. 255, Mar. 2021. [CrossRef]
  39. J. Magpusao, S. Giteru, I. Oey, and B. Kebede, “Effect of high pressure homogenization on microstructural and rheological properties of A. platensis, Isochrysis, Nannochloropsis and Tetraselmis species,” Algal Res, vol. 56, Jun. 2021. [CrossRef]
  40. T. Hahn, S. Kelly, K. Muffl, N. Tippk, and R. Ulber, Extraction of Lignocellulose and Algae for the Production of Bulk and Fine Chemicals. 2011.
  41. P. Prieto, M. Pineda, and M. Aguilar, “Spectrophotometric Quantitation of Antioxidant Capacity through the Formation of a Phosphomolybdenum Complex: Specific Application to the Determination of Vitamin E 1,” 1999. [Online]. Available: http://www.idealibrary.comon.
  42. M. P. Rahelivao, H. Andriamanantoanina, A. Heyraud, and M. Rinaudo, “Structure and properties of three alginates from madagascar seacoast algae,” Food Hydrocoll, vol. 32, no. 1, pp. 143–146, Jul. 2013. [CrossRef]
  43. A. Mohammed et al., “Multistage extraction and purification of waste Sargassum natans to produce sodium alginate: An optimization approach,” Carbohydr Polym, vol. 198, pp. 109–118, Oct. 2018. [CrossRef]
  44. M. J. Costa, A. M. Marques, L. M. Pastrana, J. A. Teixeira, S. M. Sillankorva, and M. A. Cerqueira, “Physicochemical properties of alginate-based films: Effect of ionic crosslinking and mannuronic and guluronic acid ratio,” Food Hydrocoll, vol. 81, pp. 442–448, Aug. 2018. [CrossRef]
  45. M. M. Campos-Vallette et al., “Characterization of sodium alginate and its block fractions by surface-enhanced Raman spectroscopy,” Journal of Raman Spectroscopy, vol. 41, no. 7, pp. 758–763, Jul. 2010. [CrossRef]
  46. H. Grasdalen, “Note High-field, ’H-n.m.r. spectroscopy of alginate: sequential structure and linkage conformations,” 1983.
  47. C. H. Goh, P. W. S. Heng, and L. W. Chan, “Alginates as a useful natural polymer for microencapsulation and therapeutic applications,” Carbohydrate Polymers, vol. 88, no. 1. pp. 1–12, Mar. 17, 2012. [CrossRef]
  48. Penman and G. R. Sanderson, “A method for the determination of uronic acid sequence in alginates,” Carbohydr Polym, vol. 25, no. 2, pp. 273–282, 1972. [CrossRef]
  49. Z. Guo et al., “Fabrication of efficient alginate composite beads embedded with N-doped carbon dots and their application for enhanced rare earth elements adsorption from aqueous solutions,” J Colloid Interface Sci, vol. 562, pp. 224–234, Mar. 2020. [CrossRef]
  50. Y.-X. Feng and B.-G. Li, “Preparation and adsorption properties of novel Fe 3 O 4 @SA/La gel composite microspheres”. [CrossRef]
  51. Y. Li, H. Zhang, X. Wang, J. Ma, L. Lian, and D. Lou, “Preparation and Flocculation Performance of Polysilicate Aluminum-Cationic Starch Composite Flocculant,” Water Air Soil Pollut, vol. 231, no. 7, Jul. 2020. [CrossRef]
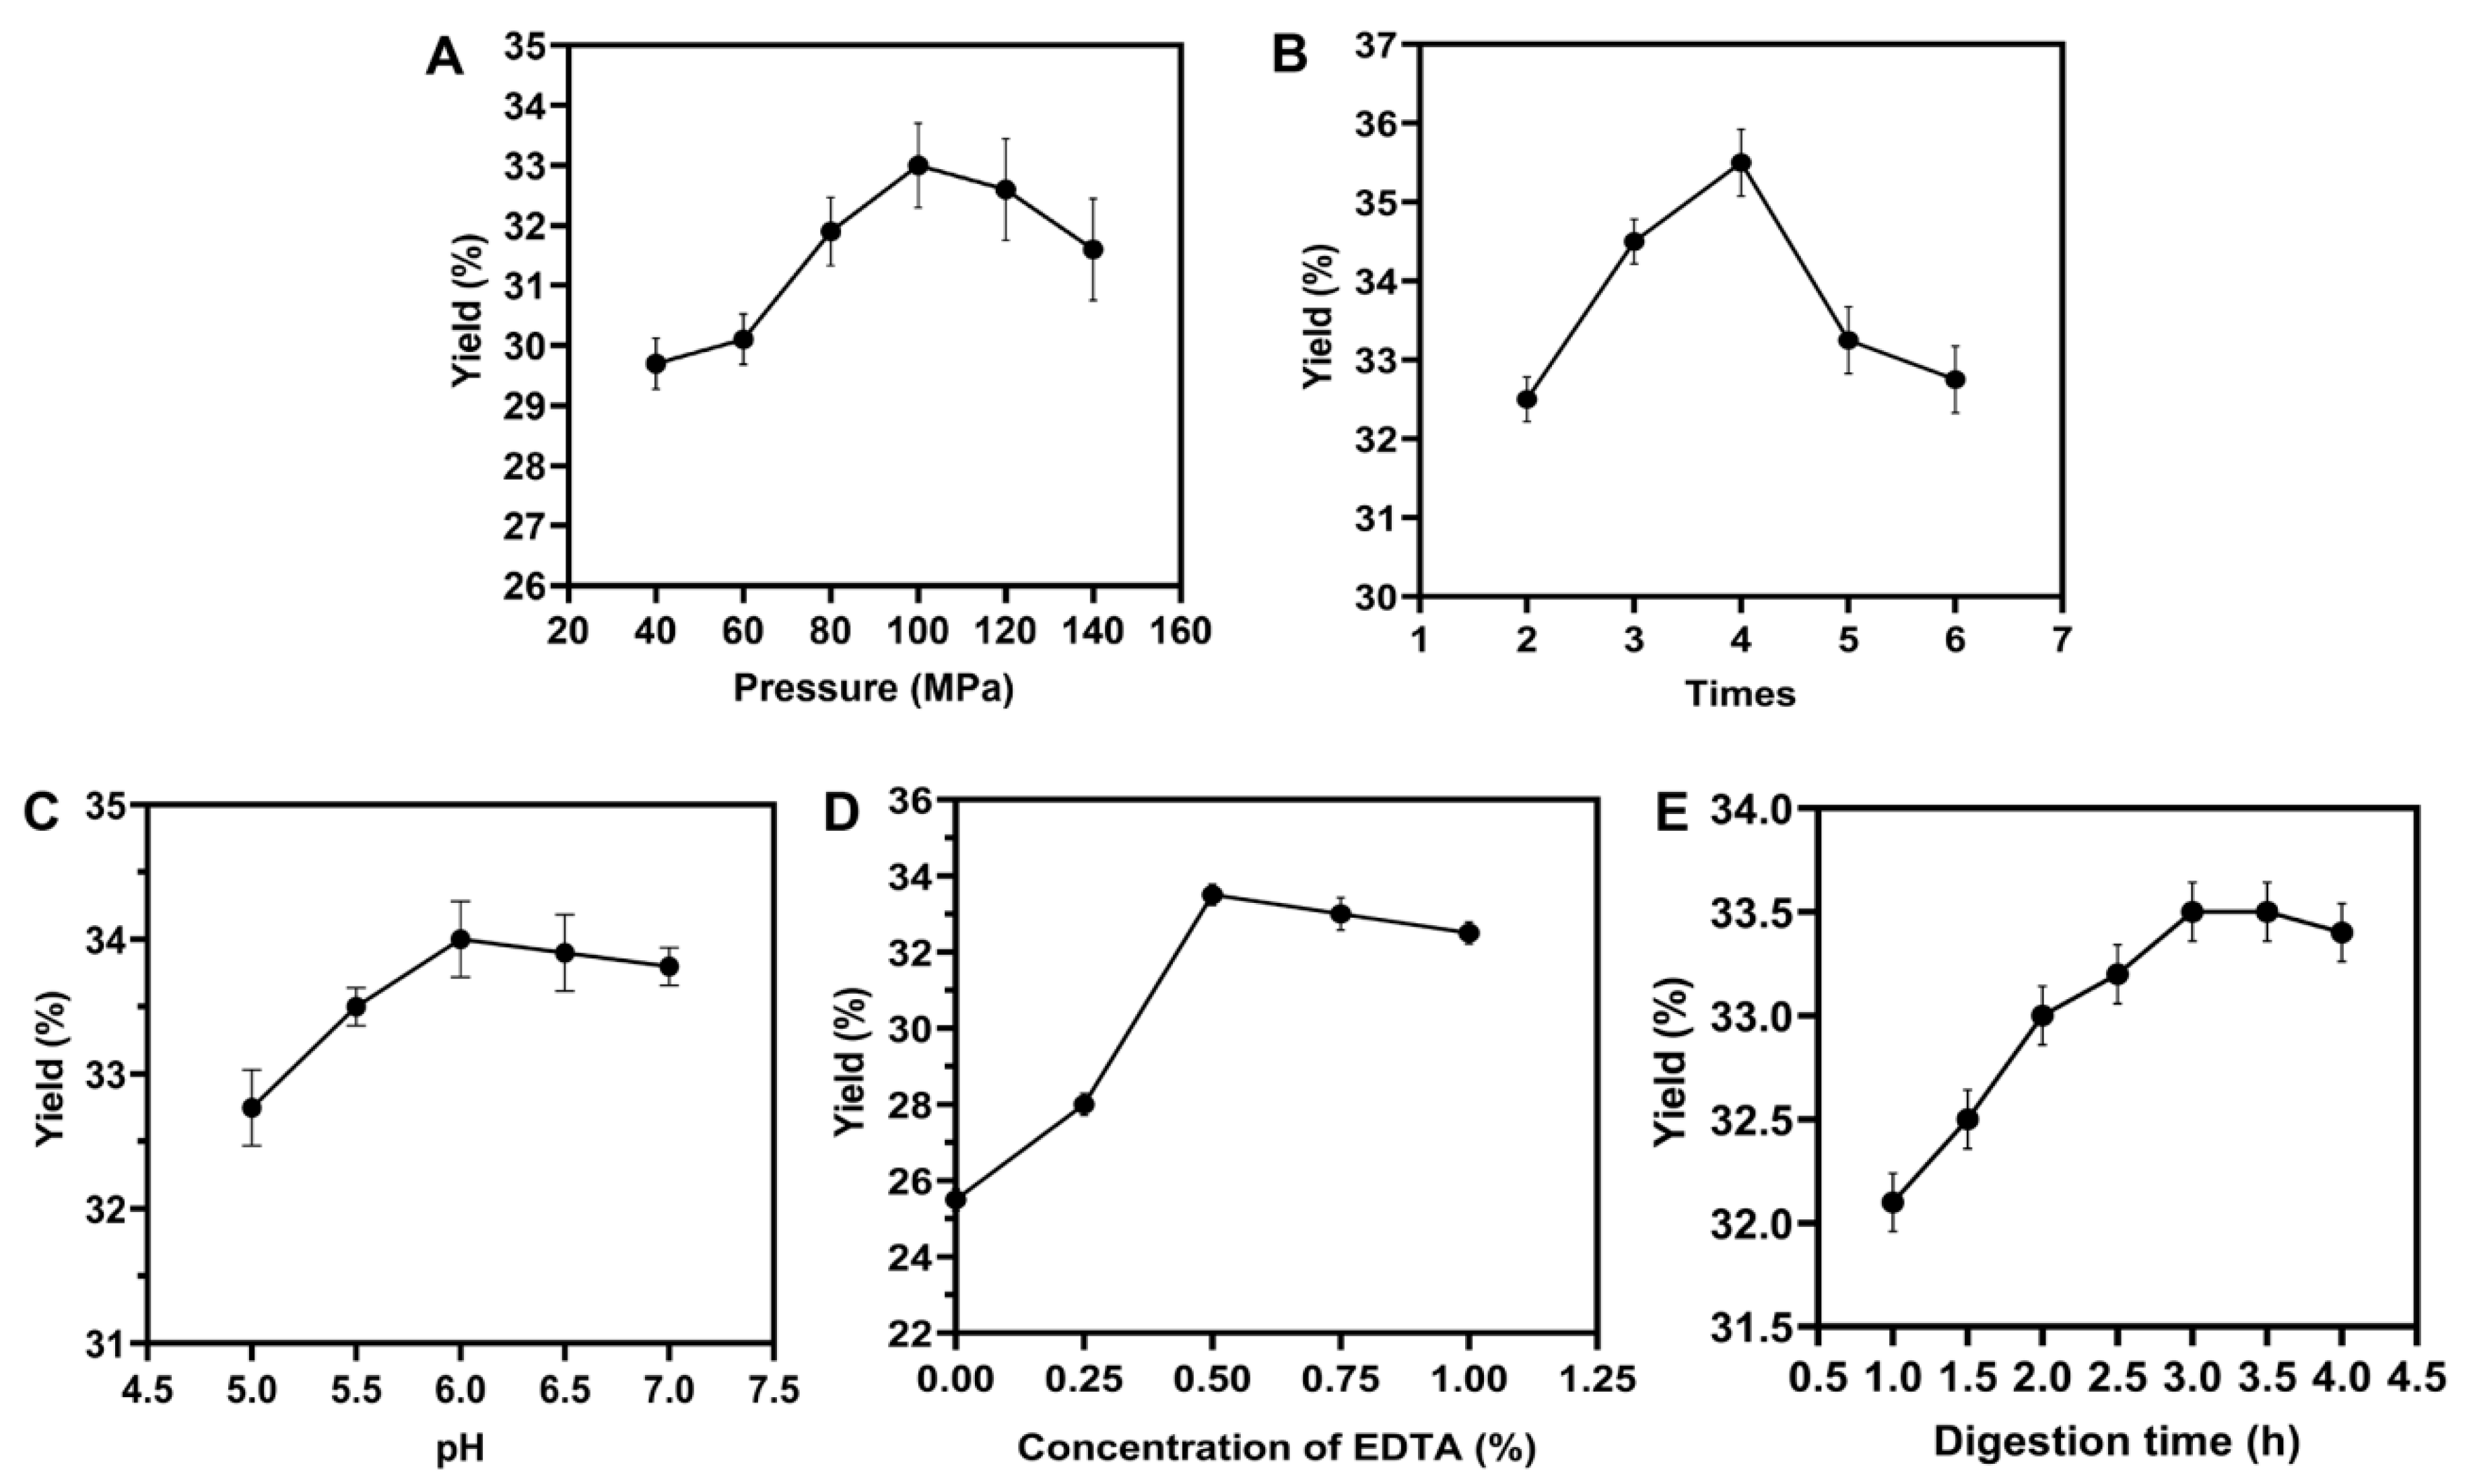
Figure 2. Illustration of the impact of various factors on yield, including: (A) high-pressure homogenization pressure, (B) cycle times, (C) digestion time, (D) pH, and (E) concentration of EDTA. A yield of 100% indicated that the weight of sodium alginate extracted was equivalent to the weight of L. japonica.
Preprints 78697 g002
Figure 3. Yield of sodium alginate by different extraction methods.
Preprints 78697 g003
Figure 4. SEM micrographs of untreated and pretreated L. japonica power. Here (A) Untreated, (B) HPH, (C) CE, (D) UAE and (E) CE-UC pretreated L. japonica power at 500× magnification.
Preprints 78697 g004
Figure 5. FTIR diagrams of commercial and different pretreated sodium alginate.
Preprints 78697 g005
Figure 6. Raman spectra of different sodium alginate samples.
Preprints 78697 g006
Figure 7. H-NMR spectra of alginate extracted by HPH.
Preprints 78697 g007
Figure 8. X-ray diffraction spectra of different sodium alginate samples.
Preprints 78697 g008
Figure 9. TGA thermograms of different sodium alginate samples.
Preprints 78697 g009
Figure 10. Standard curve of (a) VC and (b) (c) VC equivalent of five sodium alginate.
Preprints 78697 g010
Table 1. Uronic acid sequence and M/G ratio of sodium alginate extracted by HPH.
Preprints 78697 i001
Disclaimer/Publisher’s Note: The statements, opinions and data contained in all publications are solely those of the individual author(s) and contributor(s) and not of MDPI and/or the editor(s). MDPI and/or the editor(s) disclaim responsibility for any injury to people or property resulting from any ideas, methods, instructions or products referred to in the content.
Copyright: This open access article is published under a Creative Commons CC BY 4.0 license, which permit the free download, distribution, and reuse, provided that the author and preprint are cited in any reuse.
Prerpints.org logo

Preprints.org is a free preprint server supported by MDPI in Basel, Switzerland.

Subscribe

© 2024 MDPI (Basel, Switzerland) unless otherwise stated