
Submitted:
04 July 2023
Posted:
05 July 2023
You are already at the latest version
Abstract
Phoenixin-14 (PNX) - a bioactive peptide recently discovered in the rat brain, is highly conserved among many animal species: rodents (rat, mouse), pig, dog as well as humans. In rodents, PNX is expressed in areas responsible for the transmission of sensory information dorsal root ganglia (DRG) neurons, where it is present at relatively high levels and may preferentially suppress visceral pain. However, so far the presence of PNX has not been investigated in DRG in pigs, a species which, due to its anatomical and histological similarity to humans, is considered a better model for biomedical studies than rodents. The present study aimed to investigate the immunoreactivity of PNX in the DRG of the domestic pig. The collected spinal ganglia from the cervical (C), thoracic (Th), lumbar (L) and sacral (S) sections were transversely divided into serial sections of 10 μm thickness. DRG sections from each level of the spinal cord were double-labeled immunohistochemically using antibodies to PNX in a mixture with antibodies to: cocaine and amphetamine related transcript (CART), calretinin (CRT), calcytonin gene-related peptide (CGRP), galanin (GAL), nitric oxide synthase (nNOS), pituitary adenylate cyclase-acrivating polypeptide (PACAP), substance P (SP) or somatostatin (SOM), respectively. Immunohistochemical studies revealed PNX immunoreactivity in approximately 20% of nerve cells in all DRG examined, highlighting mainly the presence of the peptide in cells of small diameter (approximately 74% of all PNX-positive neurons found). Double labeling of DRG sections showed that PNX-immunopositive neurons stained also for CGRP (96.1%), SP (88.5%), nNOS (52.1%), GAL (20.7%), CRT (10.05%), PACAP (7.4%), CART (5.1%), or SOM (4.7%). Our research revealed for the first time the presence of the new peptide PNX in the sensory ganglia of the domestic pig, its co-localization with other important neurotransmitters involved in sensory transmission and its percentage distribution in ganglion domains. The exact function of PNX in DRG is not yet known, however, the high degree of co-localization of this peptide with the main nociceptive transmitters SP and CGRP may indicate its function in modulation of pain transmission.
Keywords:
phoenixin-14
; pig
; dorsal root ganglia
; neuropeptides
; immunofluorescence
; mass spectrometry
1. Introduction
Phoenixin-14 (PNX) is a recently identified peptide, first described by Yosten et al. in 2013 [1]. Initially, PNX functions were mainly linked to reproductive system control, due to the high expression of this peptide in the rodent hypothalamus and pituitary gland [1,2]. It has been found, that PNX stimulates the release of luteinizing hormone (LH) by enhancing the gonadotropin-releasing hormone (GnRH) level [1,3]. Nine years after PNX identification, further studies revealed that the presence of this peptide is not limited to the hypothalamo-pituitary complex and an engagement of PNX in the control of several biological processes, including food intake, energy homeostasis, water balance, modulation of inflammation or memory and anxiety, has also been discovered [4,5]. Most studies dealing with PNX expression in the sensory structures of the nervous system were carried out on rodents. In rats, PNX has been detected in: the spinal trigeminal tract and nucleus of the solitary tract, the superficial layers of the dorsal horn (DH), the trigeminal and nodose ganglion cells and, last but not least, in neurons located in the dorsal root ganglia (DRG) [6] However, the precise role of PNX in neurons projecting from the DRG is unclear and the occurrence of this peptide in mammalian DRG other than rodents’ has not been explored. Recently, PNX-immunoreactivity has been detected in nerve fibers (NF) forming dense plexus in laminae I and II of the porcine DH [7]. Therefore, the present study was designed to investigate, for the first time, the occurrence and distribution of PNX in the porcine DRG neurons. Moreover, the double-labeling immunohistochemistry was used to examine the co-expression pattern of PNX with other biologically active substances, as thus far the studies performed on rodents investigated only the coexistence of PNX with substance P (SP), but not with other neurotransmitters or their markers [6]. The domestic pig has been chosen, as this species is increasingly employed as an animal model in studies because of the anatomical and physiological similarity to humans concerning both the structure and function of various tissues and organs [8,9,10,11].
2. Materials and Methods
2.1. Experimental Animals
Investigations were performed on 6 juvenile female pigs (8–12 weeks old, 15–20 kg body weight - b.w.) of the Large White Polish race. The animals were kept under standard laboratory conditions. They were fed standard fodder (Grower Plus, Wipasz, Wadąg, Poland) and had free access to water. All surgical procedures were performed following the rules of the local Ethics Commission (affiliated to the National Ethics Commission for Animal Experimentation, Polish Ministry of Science and Higher Education), decision No. 40/2020 from 22 July 2020r.
2.2. Surgical Procedures
All animals were pretreated with atropine (Polfa, Poland, 0.05 mg/kg b.w., subcutaneous (s.c.) injection) and azaperone (Stresnil, Janssen Pharmaceutica, Belgium, 2.5 mg/kg b.w., intramuscular (i.m) injection) and after thirty minutes they were deeply anesthetized with sodium pentobarbital (Tiopental, Sandoz, Poland; 0.5 g per animal, administered according to the effect). The 5th lumbar DRG (L5) were collected intraoperatively from 3 out of 6 pigs, and they were used for PNX identification by mass spectroscopy (MS) method. Afterwards, anesthesia was deepened, and after cessation of breathing, all the animals were transcardially perfused with freshly prepared 4% paraformaldehyde in 0.1 M phosphate buffer (pH 7.4). Whole spinal cords, including the attached DRG, were gently dissected, sectioned into individual neuromeres (assuming the anatomical extent of their fila radicularia as boundaries) and each neuromere was fixed in the same fixative (10 min at room temperature), washed several times in 0.1 M phosphate buffer (pH 7.4; 4°C; twice daily for three days) and stored in 18% buffered sucrose at 4°C (two weeks) until sectioned.
2.3. Protein Extraction
Proteomics analysis of DRG was performed at the Mass Spectrometry Laboratory at the Institute of Biochemistry and Biophysics of the Polish Academy of Sciences. Tissue was transferred to 2 ml tubes containing the mix of 1.4 mm, 2.8 mm and 5.0 mm zirconium oxide beads. The lysis was performed in 500 µl of 25% trifluoroethanol (TFE) in 100 mM triethylammonium bicarbonate buffer (TEAB). The tissue was lysed using Precellys Evolution homogenizer (Bertin Technologies France) using 6 rounds of program with the following parameters: 6800 rpm in 10 cycles for 60s with 20s pause in between. Homogenization was performed at 4°C with dry ice cooling. After lysis, samples were centrifuged (14000 g, 30 min, 4°C) and transferred to 1.5 ml tubes with low retention. Cysteine residues were reduced by incubation with 10 mM Tris (2- carboxyethyl)phosphine (TCEP) for 60 min, followed by blocking with 25 mM chloroacetamide. 100 µl of the lysate was diluted to 500 µl with 10% aequous solution of acetonitrile (ACN), vortexed, and briefly spun to remove precipitated proteins. The sample was transferred to a 30 kDa cut-off filter (Vivacon 500, Sartorius). After centrifugation (14000 g, 2h, 25oC), the filtrate was transferred to a new eppendorf tube, dried in SpeedVac and reconstituted in 40 ul of 0.1% formic acid.
2.4. Mass Spectroscopy (MS)
Samples were analysed using liquid chromatography-mass spectrometry (LC-MS) system composed of Evosep One (Evosep Biosystems, Odense, Denmark) coupled to an Orbitrap Exploris 480 mass spectrometer (Thermo Fisher Scientific, Bremen, Germany). 20 µl of sample was loaded onto disposable Evotips C18 trap columns as described previously [12]. Chromatography was carried out at a flow rate of 250 nl/min using the 88 min (15 samples per day) preformed gradient on EV1106 analytical column (Dr Maisch C18 AQ, 1.9 µm beads, 150 µm ID, 15 cm long, Evosep Biosystems, Odense, Denmark). Data was acquired in positive mode with a data-dependent method using the following parameters. MS1 resolution was set at 120 000 with a 500% normalized automatic gain control (AGC) target, Auto maximum inject time and a scan range of 250 to 1200 m/z. Cycle time was set to 1s. Preferably the ions with m/z corresponding to PNX protein with amidation within 1.6 m/z window were subjected to fragmentation with normalized collision energy of 30%. For MS2, resolution was set at 30 000 with a 1000% normalized AGC target and auto maximum inject time. Spray voltage was set at 2.1 kV, funnel radio frequency (RF) level at 40, and a heated capillary temperature at 275°C.
2.5. MS Data Analysis
Protein identification was performed in the Proteome Discoverer software suite (version 2.4.0.305) using Sus scrofa full Uniprot database (version 2022_02). The search included no-cleave proteins, Carboamidomethylation (C) set as a fixed modification and Oxidation (M) and Amidation on Protein C-term as a variable ones. Fixed Value PSM (peptide-spectra match) Validator was used for PSM validation. At the consensus step the basic Proteome Discoverer settings were used.
2.6. Sectioning of the Tissue Samples
Three representative DRG from each level of the spinal cord were selected for this study. Bilateral DRG from cervical (C: C1, C4, C7), thoracic (Th: Th1, Th7, Th15), lumbar (L: L1, L3, L6) and sacral (S: S1, S3) neuromeres were pairwise located on a pre-cooled block of the optimal cutting temperature compound (OCT) -medium in a way that allows to easily determine the position of individual subdomains of DRG sections under the microscope. Frozen ganglia were cut with a HM525 Zeiss freezing microtome on transverse 10-µm-thick serial sections (four sections on each slide) and mounted on chrome alum-gelatine-coated slides.
2.7. Immunohistochemical Procedure and Estimation of the Total Number of PNX-containing DRG Neurons
Serial 10-µm-thick DRG sections were processed for double-labelling immunofluorescence (following the details of an earlier described protocol [13]) using the combinations of primary immunosera raised in different species. After immersion of tissues in a blocking solution containing 0.1% bovine serum albumin, 1% Triton X 100, 0.01% sodium azide (NaN3), 0.05% thimerosal and 10% normal goat serum in 0.01 M phosphate buffered saline (PBS) for 1h at room temperature to reduce non-specific background staining, sections were repeatedly rinsed in PBS, and then incubated overnight at room temperature with PNX antiserum applied in a mixture with antisera against: cocaine and amphetamine regulated transcript (CART), calcitonin gene-related peptide (CGRP), calretynin (CRT), galanin (GAL), neuronal nitric oxide synthase (nNOS), pituitary adenylate cyclase-activating polypeptide (PACAP), somatostatin (SOM) and SP. Combination of antisera towards PNX and protein gene product 9.5 (PGP 9.5) was used to accurately determine the distribution pattern and the total number of PNX cells in the right and left DRG selected from the particular levels of spinal cord (C, Th, L and S, respectively). Primary antisera were visualised by fluorescein isothiocyanate (FITC)-conjugated rat-, guinea pig- or mouse- immunoglobulin G (IgG) specific secondary antisera or streptavidin (CY3) rabbit- specific antiserum (Table 1).
PNX/PGP 9.5-positive perikarya were counted in every fourth section of six slides per DRG studied, while the colocalization of PNX with other biologically active substances were assesed from three slides (one section on the slide for each layout) taken from all DRG studied: C (C1, C4, C7), Th (Th1, Th7, Th15), L (L1, L3, L6) and S (S1, S3). The diameters of PNX-positive (PNX+) perikarya were measured using image analysis software (AnalySIS version 3.0, Soft Imaging System GmbH, Germany). The neurons were divided into three size classes: small- (Sl-average diameter up to 40 µm), medium- (M-sized diameter 41-70 µm) and large cells (Lg-diameter ≥ 71 µm). Cell counting was carried out with 20× and 40× magnifications. Only neuronal profiles with a visible nucleus were considered in each section. Double-labeled combinations employed in this study are presented in Table 2.
The labeled sections were viewed under an Olympus BX61 microscope (Olympus, Hamburg, Germany) equipped with an appropriate filter set for CY3 and FITC. Micrographs were taken using an Olympus XM10 digital camera (Tokyo, Japan). The microscope was equipped with cellSens Dimension 1.7 Image Processing software (Olympus Soft Imaging Solutions, Münster, Germany). Finally, the obtained data were pooled in all the animals and presented as mean ± standard deviation (SD), with referring to the number of animals and statistically analysed by the Student’s two-tailed t test for unpaired data and by one-way ANOVA with mean values compared using Tukey’s multiple comparison test. The results were statistically analyzed using GraphPad PRISM 8.0 software (GraphPad Software, La Jolla, CA, USA). The differences were considered to be significant at p < 0.05.
2.8. Control of Specificity of Immunohistochemical Procedures
Standard controls, i.e., preabsorption for the neuropeptide antisera (20 μg of appropriate antigen per 1 ml of the corresponding antibody at working dilution; all antigens purchased from Peninsula, R&D Systems, SWANT, Sigma, Phoenix - Table 3), as well as omission and replacement of the respective primary antiserum with the corresponding non-immune serum completely abolished immunofluorescence and eliminated specific stainings. Photos showing the preabsorption performed are presented in Figure 1.
3. Results
3.1. Mass Spectrometry Detection of PNX in Pigs DRG.
The presence of “true” PNX in the porcine DRG was analysed in ganglia of the L5 neuromere. Mass spectrometry analyses confirmed the identity of the peptide with a molecular weight of 1583 +/- 1.5Da. The above study identified the fractional spectra of most of the amino acids that make up PNX: DVQPPGLKVQSDPF. The list of mass spectra of each amino acid that makes up PNX is shown in Supplementary Figure S1. Below is an example DRG1 chromatogram in Figure 2.
3.2. Distribution Pattern and Morphometrical Characteristics of PNX-Containing Sensory Neurons in DRG Studied
3.2.1. Distribution Pattern of PNX+ Neurons
PNX+ nerve cells were observed bilaterally in all the studied DRG. The total number of PNX+ sensory neurons counted in all the DRG studied per animal ranged from 16714 to 19675 (18481 ± 1562; mean ± SD), representing 19.7 ± 1.0% of all sensory neurons counted in the investigated DRG. In the left ganglia, the number of PNX-containing sensory neurons ranged from 7806 to 9963 per animal (9092 ± 1137) and accounted for 19.07 ± 0.6% of all sensory neurons. A very similar result regarding both the number and percentage of PNX+ nerve cells was obtained in the right ganglia in which the number of PNX-labelled perikarya ranged from 8908 to 9712 per animal (9390 ± 425) and accounted for 20.4 ± 1.5% of all the sensory neurons.
PNX+ sensory neurons were observed in all the selected C, Th, L and S DRG (19.8 ± 1.4%, 17.9 ± 1.5%, 19.4 ± 1.0% and 19.0 ± 2.5%, respectively). No statistically significant differences in the number of PNX-containing sensory nerve cells were observed between the left and right ganglia from the same level of the spinal cord and between the ganglia located in various levels of the spinal cord examined. Details concerning the relative frequency of PNX+ sensory neurons observed in the selected left and the right DRG taken from the C, Th, L and S levels of the spinal cord are shown in Table 4 and Figure 3.
3.2.2. Morphometrical Characteristics of PNX+ Neurons
In the present study, PNX+ DRG neurons belonged to all cell sizes: Sl (neurons with an average diameter of up to 40 µm), M (neurons with a diameter from 41 µm to 70 µm) and Lg (neurons with diameter up to 71 µm). In general, the vast majority of PNX+ sensory neurons belonged to Sl-sized cells (73.9 ± 4.7%) which prevailed over the M-sized sensory neurons (24.9 ± 4.7%), while the Lg nerve cells (1.2 ± 0.8%) were only occasionally found in all the DRG studied. There were no significant differences in the number of PNX-containing sensory neurons belonging to these three size classes between the left and the right DRG. When compared the relative frequencies of Sl, M and Lg perikarya in the left and right DRG studied, Sl cells constituted the largest population of PNX+ neurons (70.6 ± 13.9% vs. 73.8 ± 4.9%) and M-sized cells constituted a smaller population (24.8 ± 5.3% vs. 25.1 ± 4.9%), while only a few Lg-sized cells (1.0 ± 0.9% vs. 1.1 ± 0.8%) were found. Moreover, no statistically significant differences in the number of PNX-labelled neurons belonging to the Sl-, M- and Lg- sized population of sensory nerve cells were observed between the C, Th, L and S DRG. Details concerning the relative frequency of PNX+ sensory neurons of the different size classes observed in the selected left and right DRG taken from the C, Th, L and S levels of spinal cord are shown in Table 5 and Figure 4. Representative pictures of the PNX+ DRG nerve cells belonging to the different size classes are shown in Figure 5.
3.2.3. Intraganglionic Distribution Patterns of PNX+ Neurons.
To determine the intraganglionic distribution pattern(s) of PNX+ sensory neurons in all the DRG studied, the 'mask' shown in Figure 6 was applied to each ganglion section analyzed.
PNX-containing sensory nerve cells were present in all five ganglia domains: central (Cn), peripheral (P), cranial (Cr), caudal (Cd) and middle part (Md). In both the left and the right ganglia, the vast majority of observed nerve cells were accumulated in the Cn part of the ganglion (29.1 ± 6.2% and 27.4 ± 2.2%, respectively), while fewer PNX+ sensory neurons (10.9 ± 3.6% and 12.1 ± 5.3%) have been observed in the P domain of the DRG. The rest of the PNX+ perikarya was dispersed quite evenly in the Md (21.4 ± 3.1% and 21.5 ± 0.9%), Cr (19.7 ± 1.5% and 19.1 ± 2.2%) and Cd (18.9 ± 1.3% and 19.9 ± 1.2%) domains of the ganglion. There were no statistically significant differences in the number of PNX+ nerve cells observed in the same domains of the left and the right DRG studied. Moreover, a similar intraganglionic distribution pattern of PNX+ neurons has been observed in all the DRG studied, taken from the C, Th, L and S segments of spinal cord. Details concerning the intraganglionic distribution pattern of PNX+ sensory neurons in particular domains of the left and the right DRG studied are shown in Table 6.
3.2.4. Immunohistochemical Characteristic of PNX-Containing Perikarya in DRG Studied.
Comprehensive analysis of double immunohistochemical staining showed the presence of PNX-immunoreactive (IR) sensory nerve cells together with the other biologically active substances like CGRP, SP, nNOS, GAL, CRT, PACAP, CART or SOM in all DRG studied.
3.2.4.1. PNX+/CGRP+ Nerve Cells
The largest subpopulation of PNX+ DRG sensory nerve cells were neurons containing simultaneously CGRP (Figure 7a,b). Such coded cells accounted for 96.1 ± 0.8% of the total population of PNX-IR neurons located in all examined DRG, while only a very small number of PNX+ nerve cells (3.9 ± 0.8%) did not simultaneously express CGRP. PNX+/CGRP+ neurons were observed in all the studied DRG of C, Th, L and S segments of the spinal cord (96.9 ± 3.3%; 95.1 ± 4.0%; 96.9 ± 2.7% and 96.1 ± 3.2%, respectively). Statistically significant differences in the numbers of PNX+/CGRP+ neurons were neither observed between selected DRG of a given level of the spinal cord, nor between DRG of the particular spinal cord levels.
Regarding their diameter, PNX/CGRP-containing cells belonged to all the three classes of afferent perikarya. The most numerous subpopulation of PNX+/CGRP+ neurons was that of Sl-sized cells (69.2 ± 8.8%); the M-sized neurons were found to be distinctly less numerous (29.1 ± 8.3%), while the Lg PNX+ and CGRP-containig nerve cells (1.7 ± 0.5%) were observed only sporadically. No significant differences in the number of PNX+/CGRP+ DRG neurons belonging to different size-classes were observed between particular levels of the spinal cord (Table 7).
PNX+/CGRP+ sensory neurons were fairly evenly dispersed in the individual DRG sections; a clear accumulation of these cells was observed in the Cn, the Md as well as in the Cr ganglion domains (25.3 ± 2.5%; 25.3 ± 0.7% and 20.6 ± 1.3%, respectively), while a smaller number of PNX+/CGRP+ nerve cells was found in the Cd and the P parts (18.1 ± 1.8% and 10.7 ± 1.3%) of all DRG studied. Distribution pattern of PNX+ and CGRP-containing sensory neurons in the different domains of DRG has been showed in Figure 8a.
3.2.4.2. PNX+/SP+ Nerve Cells
The second most numerous subpopulation of PNX+ sensory neurons in the investigated DRG was that containing SP (88.5 ± 5.9%; Figure 7c,d) being present in all the selected DRG of C, Th, L and S levels of the spinal cord (88.8 ± 4.9%; 87.5 ± 6.5%; 87.4 ± 7.3% and 90.3 ± 4.5%, respectively). No statistically significant differences were observed in the number of PNX+/SP+ sensory nerve cells between selected DRG in a given level of the spinal cord as well as between the individual levels of the spinal cord.
In general, SP-IR was observed in all three size classes of PNX+ afferent perikarya, being present in 62.05 ± 6.7% of Sl, 36.9 ± 7.1% of M and 1.05 ± 0.4% of Lg cells, respectively. There were no significant differences in the number of PNX+/SP+ DRG neurons representing different size classes between the particular levels of the spinal cord (for details see Table 8).
Additionally, most of the PNX+/SP+ neurons were unevenly distributed in different sensory ganglion domains. A clear accumulation of PNX+ and SP-containig sensory nerve cells was found in the Cn, Md, Cr and Cd domains of DRG (27.9 ± 4.6%; 22.2 ± 6.5%; 20.1 ± 2.1% and 18.9 ± 7.6%, respectively). A smaller number of PNX+/SP+ sensory neurons was found in the P part (10.9 ± 1.9%) of DRG studied. Distribution pattern of PNX+ and SP-containing sensory neurons in the different domains of DRG has been shown in Figure 8b.
3.2.4.3. PNX+/nNOS+ Nerve Cells
The third largest subpopulation of PNX+ neurons in all studied DRG was that containing nNOS (52.1 ± 11.2%; Figure 7e,f). PNX+/nNOS+ sensory nerve cells were observed in all studied DRG of C, Th, L and S levels of spinal cord (50.1 ± 16.5%; 56.9 ± 11.6%; 49.8 ± 7.0% and 51.7 ± 9.5%, respectively). Statistically significant differences in the numbers of PNX+/nNOS+ neurons were neither observed between selected DRG of a given level of the spinal cord, nor between DRG of the particular spinal cord levels.
In terms of their diameters, three classes of the PNX+/nNOS+ DRG neurons have been determined. The most numerous subpopulation were formed by M-sized cells (52.4 ± 6.6%) and less numerous by Sl-sized perikarya (46.1 ± 6.9%), while the Lg PNX+/nNOS+ neurons (1.5 ± 0.4%) were observed only sporadically. There were no significant differences in the number of PNX+/nNOS+ DRG neurons representing different size classes between the particular levels of the spinal cord (for details see Table 9).
PNX+/nNOS+ sensory neurons were unevenly dispersed inside the ganglia, mainly in their Md (25.6 ± 2.4%) and Cn (25.5 ± 1.4%) regions. The remainder of nNOS-containing, PNX+ nerve cells were present in the Cr, Cd and P (19.7 ± 1.4%, 17.3 ± 2.9% and 11.9 ± 0.9%, respectively) domains of DRG studied. Distribution pattern of PNX+ and nNOS-containing sensory neurons in the particular ganglionic domains is shown in Figure 8c.
3.2.4.4. PNX+/GAL+ Nerve Cells
PNX+/GAL-containing cells constituted one of the smaller populations of DRG cells (20.7 ± 5.7%; Figure 7g,h), and were observed in all studied DRG of C, Th, L and S spinal cord levels (constituting 16.1 ± 5.3%; 18.7 ± 7.7%; 22.8 ± 4.9% and 25.5 ± 7.0% of all cells, respectively). Statistically significant differences in the numbers of PNX+/GAL+ neurons were neither observed between selected DRG of a given level of the spinal cord, nor between DRG of the particular spinal cord levels.
Regarding their diameter, PNX+/GAL+ DRG cells belonged only to two classes of afferent perikarya: the most numerous subpopulation of Sl-sized cells (99.1 ± 1.3%) and distinctly less numerous subset of M-sized perikarya (0.9 ± 1.3%); PNX+/GAL+ Lg neurons were not found during the present study. There were no significant differences in the number of such encoded DRG neurons representing different size classes between the particular levels of the spinal cord (for details see Table 10).
The largest accumulation of PNX+/GAL+ cells was observed in the Cn region of DRG studied (31.9 ± 4.1%), while the lowest number of these neurons was found in the P subdomain (9.3 ± 1.9%). Relative frequencies of PNX+/GAL+ neurons were similar in the Md, Cr and Cd intraganglionic domains (21.6 ± 4.4%, 18.9 ± 0.7% and 18.3 ± 1.9%, respectively). Distribution pattern of PNX+ and GAL-containing sensory neurons in the different domains of DRG has been showed in Figure 8d.
3.2.4.5. PNX+/CRT+ Nerve Cells
A colocalization study of PNX with CRT allowed to unveil the co-occurrence of these two biologically active substances in a small population (10.05 ± 1.6%; Figure 7i,j) of all the DRG cells studied. PNX+/CRT+ sensory neurons were observed in all the selected DRG of C, Th, L and S levels of the spinal cord (constituting 11.2 ± 1.3%; 11.2 ± 4.9%; 10.5 ± 6.0% and 7.3 ± 1.5% of all cells, respectively). Statistically significant differences in the numbers of PNX+/CRT+ neurons were neither observed between selected DRG of a given level of the spinal cord, nor between DRG of the particular spinal cord levels..
In terms of their diameter, three classes of the PNX+/CRT+ DRG neurons have been determined. The vast majority of these cells belonged to Sl size neurons (94.2 ± 6.2%). In addition, a small number of M-sized PNX+/CRT+ sensory nerve cells (5.1 ± 6.3%) have been observed, while Lg cells (0.7 ± 0.8%) were only occasionally present in the examined DRG. While there were no significant differences in the numbers of PNX+/CRT+ neurons belonging to different size-classes in DRG of the C, Th and L segments of the spinal cord, large PNX+/CRT+ neurons have not been observed in sacral DRG (for details see Table 11).
PNX+/CRT+ neurons were unevenly distributed in particular intraganglionic domains. The vast majority of PNX+ and CRT-containg sensory nerve cells were found in the Cn domain (33.4 ± 3.8%), while a definitely smaller numbers of PNX+/CRT+ neurons were found in the Md, Cr, Cd and P subdomains (18.6 ± 8.1%, 16.7 ± 0.7%, 16.5 ± 0.7% and 14.8 ± 1.4%, respectively). The distribution pattern of PNX+ and CRT-containing sensory neurons in the different domains of DRG has been showed in Figure 8e.
3.2.4.6. PNX+/PACAP+ Nerve Cells
PACAP was found in 7.4 ± 0.8% (Figure 7k,l) of all PNX-containing neurons and it has been present in all the selected DRG of C, Th, L and S levels of the spinal cord (7.5 ± 1.8%, 6.4 ± 0.6%, 7.4 ± 2.3% and 8.6 ± 2.2%, respectively). Statistically significant differences in the numbers of PNX+/PACAP+ neurons were neither observed between selected DRG of a given level of the spinal cord, nor between DRG of the particular spinal cord levels.
In general, PACAP-IR was observed in all three size-classes of PNX+ afferent perikarya, being present in 87.2 ± 4.5% of Sl, 12.1 ± 4.0% of M and 0.7 ± 0.6% of Lg cells, respectively. It should be stressed that the statisticaly significant differences in the number of Sl- and M-sized PNX/PACAP-containing nerve cells have been observed between the C and Th as well as the Th and S levels of the spinal cord. It should also be noted that the large PNX+/PACAP+ sensory neurons were present only in DRG located in the C level of the spinal cord. (see Table 12, Figure 9).
PNX+/PACAP+ sensory neurons were dispersed inside the ganglia, mainly in its Cn (26.5 ± 2.6%) and in the Md (21.0 ± 4.1%) regions. The remainder of PACAP-containing, PNX+ nerve cells were present in the P, Cr and Cd domains of DRG studied (19.5 ± 2.2%, 18.3 ± 7.5% and 14.7 ± 5.1%, respectively). Distribution pattern of PNX+ and PACAP-containing sensory neurons in the particular domains of DRG has been showed in Figure 8f.
3.2.4.7. PNX+/CART+ Nerve Cells
Another small population of PNX+ DRG neurons was that containing CART (5.1 ± 4.1%; Figure 7m,n), being present in all the selected DRG of C, Th, L and S levels of the spinal cord (5.4 ± 4,3%; 4.6 ± 3.6%; 4.9 ± 4.6% and 5.4 ± 5.0%, respectively). Statistically significant differences in the numbers of PNX+/CART+ neurons were neither observed between selected DRG of a given level of the spinal cord, nor between DRG of the particular spinal cord levels.
In general, CART-IR was observed in all three size-classes of afferent perikarya, being present in 55.1 ± 8.6% of M, 44.3 ± 8.6% of Sl and 0.6 ± 11.5% of Lg cells, respectively. No significant differences in the size of PNX+/CART+ DRG neurons between particular levels of the spinal cord were observed (see Table 13).
Although PNX+/CART+ sensory neurons were unevenly scattered throughout the individual ganglionic sections, a distinct accumulation of these cells was found in the Cn (31.9 ± 22.02%) ganglionic domains, while the smaller number of PNX+/CART+ sensory neurons was found in the Md, Cd, P and Cr parts (21.5 ± 12.1%, 18.1 ± 4.7%, 15.0 ± 6.4% and 13.5 ± 12.1%, respectively). Distribution pattern of PNX+ and CART-containing sensory neurons in the different domains of DRG has been showed in Figure 8g.
3.2.4.7. PNX+/SOM+ Nerve Cells
SOM-containing sensory neurons constituted the smallest subpopulation (4.7 ± 2.5%; Figure 7o,p) of all PNX+ perykaria, being observed in all the investigated C, Th, L and S DRG (7.8 ± 6.0%; 6.3 ± 3.5%; 2.8 ± 1.5% and 2.1 ± 0.9%, respectively). Statistically significant differences in the numbers of PNX+/SOM+ neurons were neither observed between selected DRG of a given level of the spinal cord, nor between DRG of the particular spinal cord levels.
In terms of their diameter, three classes of the PNX+/SOM+ DRG neurons have been determined. The most numerous subpopulation of Sl-sized cells (85.2 ± 9.4%) and distinctly less numerous subset of M-sized perikarya (14.6 ± 5,3%) have been observed, while the Lg PNX+/SOM+ neurons (0.2 ± 1.1%) have been found sporadically in all the DRG studied. There were no significant differences in the number of PNX+/SOM+ DRG neurons representing different size classes between the particular levels of spinal cord; however, it should be noted that the Lg sensory neurons have not been observed in this subpopulation of PNX+ nerve cells in both the C and S ganglia of the spinal cord (for details see Table 14).
A distinct accumulation of PNX-labeled and SOM+ cells was found in the Cn (28.2 ± 7.1%) and in the Md ganglionic region (24.7 ± 2.5%), while these cells were less numerous in the Cr, P and Cd part of the ganglia (17.0 ± 3.8%, 15.7 ± 8.1% and 14.4 ± 0.7%, respectively). Distribution pattern of PNX+ and SOM-containing sensory neurons in the different domains of DRG has been showed in Figure 8h.
4. Discussion
PNX is a newly identified peptide which, in the rat brain, is highly expressed in the hypothalamus, medial division of the central amygdaloid nucleus, the spinal trigeminal tract of the medulla and the spinocerebellar tract [14]. Moreover, enzyme immunoassay detected high level of PNX (> 4.5 ng/g of tissue) also in the spinal cords of rats [6]. Immunohistochemical studies in rat revealed presence of PNX also in trigeminal ganglia, as well as in ganglia comprising of neurons projecting to the superficial layers of the spinal cord, such as DRG and nodose ganglia [6]. These projections may belong to Aδ-terminals – thin myelinated fibers capable of responding to both thermal and mechanical stimuli, or to C-fibers, which are unmyelinated, slow-conducting axons and, due to their high activation threshold, detect painful stimuli. Both of these types of NF are assigned to nociceptors as they respond to destructive, thermal, mechanical or chemical stimuli [15]. Furthermore, PNX+ afferent NF targeting the spinal cord were revealed in mouse and pig and were present in all spinal cord segments at equal levels [7,16], where PNX was observed mainly in NF located in the superficial DH layer, in lamina I and II [6,7]. It is also worth noting that PNX-IR NF were participate in the skin innervation in rodents: subcutaneous injections of a fluorescent retrograde tracer Fluorogold labeled a population of DRG cells, some of which also contained PNX, thus raising the possibility that PNX released from these terminals could affect other sensory NF/sensory signaling pattern from the skin to the spinal cord [16].
In addition, the presence of the “true” PNX was confirmed by use of mass spectrometry (not only by showing that the major peak corresponds to the peptide, but also by veryfing its presence by the fragmentation spectra of its individual amino acids) in the extracts of DRG cells (present study) as well as of the spinal cord (both rat [6] and mouse [16]).
Available literature implicate that PNX is involved in pain transmission, and it has been found that the intrathecal injection of amidated PNX suppresses visceral pain, however, does not affect thermal pain sensation [6]. Moreover, PNX contribution in sensing modulation is also supported by its participation in inducing the itching effect, as revealed in an elegant study of Cowan and colleagues [16].
To date, the presence of PNX in DRG neurons has only been studied in rodents [6,16]. Thus, our study for the first time demonstrated presence of PNX in afferent neurons of porcine DRG. We have found that PNX+ neurons accounted for a relatively large subpopulation (approximately 20% of all cells) in all DRG of each segments of the spinal cord. Furthermore, considering differences in the size (diameter) of PNX-containing cells, it was demonstrated that the vast majority of PNX-IR neurons belonged to the Sl-sized neurons (average diameter up to 40 µm). Cells of the M size (40 µm-70 µm) were distictly less numerous, while Lg PNX+ cells (diameter >71 µm) were only occasionally observed. This finding appears to be inconsistent with previous results described in rodents, where many of PNX+ neurons belonged to the M-sized DRG perikarya [6]. As there is a consensus that the size of the sensory cell can be associated with its belonging to different "physiological functional classes", the data presented above may suggest a different involvement of PNX-positive cells in sensory modalities in rodents and the domestic pig. However, this hypothesis requires further verification.
The present study, for the first time, focused also on immunohistochemical characteristics of PNX+ DRG neurons. To this end, we examined PNX colocalization patterns with several neurotransmitters/their markers that were previously revealed in DRG neurons, paying particular attention to those biologically active molecules previously described in Sl and/or M diameter afferent cells: CGRP, SP, nNOS, GAL, CRT, PACAP, CART and SOM [17,18].
As shown in previous studies, CGRP appears to be, together with SP (see below), the "canonical" transmission molecule of afferent neurons in all mammalian species studied so far (human, horse, dromedary camel, pig, cat, rat and mouse) [19,20,21,22,23]. According to the available data, the number of sensory neurons containing CGRP (or expressing mRNA encoding this peptide [24,25]) oscillates on average between 50 and 60% of all DRG cells, regardless of the species studied. Furthermore, their axonal processes constitute the largest population of nerve fibers forming not only individual laminae of the dorsal horns of the spinal cord (especially laminae I-III, lamina V and X), but also Lissauer's tract [20]. Interestingly, this pattern of intraspinal distribution of CGRP-positive central projections of DRG cells persists in all spinal cord neuromeres, being most prominent in the thoracic ones [19].
Additionally to being involved in the conduction of sensory and pain stimuli in wide variety of mammals, including human [20,21,26,27,28], CGRP is also known to be very potent vasodilator [29] and the deficiency in CGRP release is related to a lack of vasodilation reflex [30]; thus, blockade of CGRP secretion exerted analgesic effect in people suffering from migraine [31].
However, CGRP along with SP, released from the terminals of DRG neurons in response to noxious mechanical, chemical or thermal stimuli [32], may also contribute to the development and maitenance of the neurogenic inflammation: CGRP acts as an extremely potent vasodilator [33] while SP, acting on NK1 receptors, evokes increased vascular permeability [34]. Therefore, it can be concluded that the intensified secretion of these peptides may contribute to the formation of edema, increased blood flow and the influx of inflammatory cells at the site of inflammation.
The above-mentioned close interdependence and cooperation of CGRP and SP in numerous regulatory loops seems to result from the fact that both substances coexist very often in the same sensory cell [17,20,23] from which they are released together and interact with target cells in a synergistic way, supporting each other. For example, as revealed by Biella and co-workers [35], the excitatory effects of SP arising from spontaneous and noxious activity were significantly enhanced by CGRP in the rat. Although the mechanism by which CGRP may potentiate the effects of SP is not fully clear, there is evidence that CGRP may delay the enzymatic degradation of SP [36,37]. CGRP has also been reported to increase the release of SP [38] as well as excitatory amino acid transmitters glutamate and aspartate [39] from central terminals of DRG neurons, possibly leading to strengthening the synaptic connections in the spinal dorsal horn, as well as increasing the effectiveness of these substances on the peripheral targets (for details, see [40]).
The second largest population of PNX+ DRG cells observed in this study were SP-containing neurons, accounting for approximately 89% of all PNX+ afferent cells. This observation seems to be in stark contrast to the data obtained in studies of the co-occurrence of PNX and SP in mouse DRG cells, where both neurotransmitters were present in separate cell subpopulations [6]. It therefore seems reasonable to hypothesize that PNX is probably involved in regulating different functions of DRG sensory cells in both species.
As shortly mentioned above, SP, like CGRP, is considered primarily a transmitter of sensory and pain stimuli, the presence of which has been shown in DRG cells in every species studied so far, including humans [41,42,43,44]. So far, studies on the presence and distribution patterns of SP+ cells in the DRG of the domestic pig have shown the presence of cells containing this tachykinin, essentially in subpopulations of Sl- and M-sized neurons. Moreover, there is incontrovertible evidence that SP occurs in both the somatic, as well as visceral subclasses of these perikarya [17,45]. This is consistent with the data obtained in other species studied so far, including human [24], guinea pig [42], mouse [6] and rat [46,47] both with regard to the number of chemically encoded afferent cells and their classification into individual size classes.
While the co-existence of PNX with CGRP in studied porcine DRG cells was shown in a very high percentage (approximately 96% of all PNX+ cells), on the other hand only slightly more than half of the CGRP+ cells (56%) also contained PNX. Moreover, a very similar picture emerges from the studies on the co-occurrence pattern of PNX and SP performed in this paper: almost 90% (exactly 88.5%) of all PNX+ cells contain SP, and approximately 50% of all SP+ cells are also PNX-immunoreactive. Co-localization of both peptide pairs were observed mainly in Sl- and M-sized ganglion cells.
Thus, based on the comparison of the relative numbers of DRG cells containing the individual transmitters studied, there is no mathematical possibility that all three peptides are not co-occurring in at least approximately 80-85% of all PNX+ cells. This suggestion is further, although indirectly, supported by the observation of the high degree of co-occurrence of PNX with SP and/or CGRP in the axonal fibers of DRG cells forming the dorsal horn laminae of the porcine spinal cord [7].
Moreover, considering the degree of co-localization of PNX and nNOS in DRG cells (approximately 50% of all PNX+ cells; see below), it seems that neurons containing all four transmitting substances must also be present in at least 30% of all the porcine DRG cells. Unfortunately, at present, insufficient knowledge of the possible functions of PNX in peripheral sensory pathways does not allow to suggest its physiological significance, neither in the case of hypothetical PNX+/CGRP+/SP+ cells, nor in the population of cells co-expressing additionally nNOS.
The above-mentioned nNOS is a marker of the nitregic subpopulation of afferent cells, involved in the regulation of numerous physiological processes in the peripheral and central nervous systems. Nitric oxide (NO), produced by nNOS is an important neurotransmitter engaged in the periphery mainly in the control of, among others, neuronal plasticity [48], neurogenesis [49], neuroprotection [50] as well as modulation of nociceptive transmission in neuropathic pain [51] and it is believed that inhibition of nNOS may be a valuable strategy in the treatment of not only neuropathic pain [52], but also several other illnesses [53].
In the present study, PNX+/nNOS-containing neurons formed the third largest (approximately 50%) population among all afferent cells capable of synthesizing and releasing PNX as their transmitter; the vast majority of these neurons belonged to Sl- and M-sized cells. This is well in line with data obtained in other species (human, rat, mouse, sheep, dromedary camel; [23,54,55,56]) where nitrergic afferent neurons were found in an average of 40-50% of all DRG cells, with the highest percentage in the subpopulation of Sl- and M-sized neurons. It should be emphasized that the high degree of nNOS co-localization with SP and CGRP, reported by Russo and colleagues [56] additionally supports the hypothesis implied above, suggesting the existence of a PNX+/SP+/CGRP+/NOS+ population of DRG cells.
The co-existence of PNX and GAL was found in the porcine DRG exlusively in approximately one-fifth (20.7%) of Sl-sized neurons. As neither the immunoreactivity to GAL alone, nor the co-occurrence of PNX and GAL immunoreactivities were observed in M- or Lg-sized cells, this may strongly suggest the involvement of cells containing these two peptides in the regulation of nociceptive activities in the domestic pig. This suggestion corresponds well with data from studies in other species, especially rats: GAL was also found in Sl-sized DRG cells in rodents (in a few cells [57] and in humans (approximately 12% [25]) moreover, it has also been observed that their number increases dramatically after peripheral nerve damage [58,59]. Numerous studies indicate that GAL may reduce the perception and transmission of pain by increasing the pain threshold as a result of increasing K+ conductance or decreasing Ca2+ conductance in the brain, spinal cord, and peripheral neurons [60,61]. Moreover, in behavioral studies, it has been found that reducing the effect of GAL leads to an increase in neuropathic pain-like behaviors, and on the contrary, upregulation of GAL leads to a decrease in neuropathic pain in animal models [59].
In contrast to its co-occurrence pattern with CGRP, SP or GAL, PNX co-localized with the other substances studied (neuropeptides: PACAP, CART and SOM, calcium-binding protein: CRT) only in relatively few porcine DRG cells.
In the case of the co-occurrence of PNX and PACAP, a significantly lower degree of colocalization was observed in this study (about 7% of all PNX+ cells contained simultaneously PACAP); at the same time, however, it should be emphasized that the vast majority of neurons chemically coded by the presence of both peptides belonged to the population of small, probably nociceptive, neurons. These observations agree fairly well with data obtained in rodents, where PACAP-positive cells were part of a Sl-diameter neuronal population [62,63]. It should be noted, however, that the number of PACAP+ cells in rat DRG was slightly higher, reaching approximately 10-17.5% of all sensory nerve cells [64], suggesting interspecies differences.
It is worth to note that both PACAP and GAL are dramatically up-regulated in damaged DRG cells (up to 75% in the rat [63], especially those Sl-sized, probably nociceptive perikarya, acting as neuroprotective and/or pro-regenerative peptides at this point [65,66,67]. Unfortunately, so far there is no data on the possible function of PNX in these regulatory mechanisms, therefore the question of both the possible existence of a subpopulation of PNX+/GAL+/PACAP+ cells, as well as their presumed targets and possible regulatory functions remains open and requires further, more detailed research.
In contrast to the patterns of PNX co-localization with other biologically active agents discussed above, where the vast majority of observed PNX+ cells belonged almost exclusively to cells of Sl or M diameter, PNX and CART co-localization was observed in the pig in all three neuronal size classes, with the M-sized PNX+/CART+ cells being the most numerous. While the data on the presence of CART in porcine DRG cells collected in this study appear to be in full agreement with the results previously obtained by Zacharko-Siembida and colleagues [68] in the lumbar porcine DRG (in both studies, the relative number of CART+ cells oscillated around 5% of all DRG cells), a slightly more numerous (approximately 10%) population was observed in rodents [69]. Remarkably, Zacharko-Siembida and colleagues found that the vast majority (approximately 70%) of porcine CART+ DRG cells simultaneously contain CGRP. This allows for the assumption that some of the sensory cells may contain, in addition to PNX+/CGRP+/SP+/NOS+, also CART, which additionally suggests the need for in-depth research on both the chemistry and the functional significance of these sensory cells.
The last of the neuropeptides whose pattern of co-occurrence with PNX was the subject of interest in this work was SOM, a substance present in both the pig and the rat [70] in a small (up to 10%) subpopulation of the DRG cells. It has been shown that a small fraction (about 6% of all PNX+ cells) co-contains SOM, which in the light of the available literature data (both PNX and SOM are implicated as transmitters subserving the itch conduction pathway [16,71,72] the most recent data, see [73], suggests that these cells are representatives of pruriceptors. However, further studies are needed in order to unveil the exact relevace of PNX in this neural modality.
Intracellular calcium-binding proteins may play an important role in the nociceptive excitability of neurons [74,75], as well as in proprioception [76], as evidenced by the presence of calbibdin (CB) in excitatory interneurons within the superficial DH [77]. Taking this into account, we decided to analyze the eventual co-occurrence of CRT (protein closely related to above-mentioned CB) with PNX in porcine primary afferent cells. It has been found that PNX coexisted with CRT in a relatively small population of DRG neurons (approximately 10.5% of all PNX-containing cells), due to the fact, that CRT was expressed mainly in Lg-sized neurons, and the vast majority of PNX+ neurons belonged to the population of small-sized cells. These data are in line with reports camin out from studies concerning the CB- or CRT-expression patterns in rat and fowl [18,76,78] which showed that the vast majority of CB or CRT-positive neurons were of M to Lg in size [76].
5. Conclusions
To sum up, our research is the second work to show the location of PNX in the DRG, and the first performed in a large mammal (pig). Moreover, we have revealed the coexistence pattern(s) of PNX with a plethora of other neurotransmitters in the examined nerve cells, suggesting the existence of multiple-transmitters using DRG cells (i.e., PNX/CGRP/SP/NOS/CART), that may, most probably, be involved in the control of blood vessel tone, maintaining/regulation of neurogenic inflammation process, as well as in the conveyance of itching sensations. These data may be helpful in better understanding the functional role of PNX in transmitting various types of sensory information and its possible impact on the functioning of many organs in the body. Additionally, present data indicates that PNX-IR appears in a heterogeneous group of sensory ganglion cells, from small to large, suggesting that this peptide can be subordinated to different sensory modalities.
Supplementary Materials
The following supporting information can be downloaded at the website of this paper posted on Preprints.org.
Author Contributions
conceptualization, A.B. and M.K.M.; methodology, A.B.; validation, A.B. and E.Ł.-B.; surgical procedures, A.B., E.L. and M.K.M.; formal analysis, U.M. and A.B.; investigation, U.M. and P.J.; resources, U.M. and A.B.; writing—original draft preparation, U.M. and A.B.; writing—review and editing, A.B., E.L. and M.K.M.; visualization, U.M., E.L. and E.Ł.-B.; supervision, A.B.; project administration, U.M. and A.B.; funding acquisition, A.B. All authors have read and agreed to the published version of the manuscript.
Funding
Agnieszka Bossowska was the recipient of the Statutory Fund of the School of Medicine, Collegium Medicum (61.610.008-110), University of Warmia and Mazury in Olsztyn.
Institutional Review Board Statement
The study was conducted in accordance with the Declaration of Helsinki and approved by the Ethics Committee for Animal Experimentation in Olsztyn, Poland (affiliated with the National Ethics Committee for Animal Experimentation, Polish Ministry of Science and Higher Education; decision No. 40/2020 from 22 July 2020).
Informed Consent Statement
Not applicable.
Data Availability Statement
The data that support the findings of this study are available from the corresponding author upon reasonable request.
Conflicts of Interest
The authors declare no conflict of interest. The funders had no role in the design of the study; in the collection, analyses, or interpretation of data; in the writing of the manuscript; or in the decision to publish the results.
References
- Yosten, G.L.C.; Lyu, R.M.; Hsueh, A.J.W.; Avsian-Kretchmer, O.; Chang, J.K.; Tullock, C.W.; Dun, S.L.; Dun, N.; Samson, W.K. A Novel Reproductive Peptide, Phoenixin. J Neuroendocrinol 2013, 25, 206. [Google Scholar] [CrossRef] [PubMed]
- Treen, A.K.; Luo, V.; Belsham, D.D. Phoenixin Activates Immortalized GnRH and Kisspeptin Neurons Through the Novel Receptor GPR173. Mol Endocrinol 2016, 30, 872–888. [Google Scholar] [CrossRef] [PubMed]
- Gołyszny, M.; Obuchowicz, E.; Zieliński, M. Neuropeptides as Regulators of the Hypothalamus-Pituitary-Gonadal (HPG) Axis Activity and Their Putative Roles in Stress-Induced Fertility Disorders. Neuropeptides 2022, 91. [Google Scholar] [CrossRef]
- McIlwraith, E.K.; Zhang, N.; Belsham, D.D. The Regulation of Phoenixin: A Fascinating Multidimensional Peptide. J Endocr Soc 2022, 6, bvab192. [Google Scholar] [CrossRef]
- Liang, H.; Zhao, Q.; Lv, S.; Ji, X. Regulation and Physiological Functions of Phoenixin. Front Mol Biosci 2022, 9, 956500. [Google Scholar] [CrossRef] [PubMed]
- Lyu, R.M.; Huang, X.F.; Zhang, Y.; Dun, S.L.; Luo, J.J.; Chang, J.K.; Dun, N.J. Phoenixin: A Novel Peptide in Rodent Sensory Ganglia. Neuroscience 2013, 250, 622. [Google Scholar] [CrossRef]
- Lepiarczyk, E.; Bossowska, A.; Majewska, M.; Skowrońska, A.; Kaleczyc, J.; Majewski, M. Distribution and Chemical Coding of Phoenixin-Immunoreactive Nerve Structures in the Spinal Cord of the Pig. Ann Anat 2020, 232. [Google Scholar] [CrossRef]
- Dalmose, A.L.; Hvistendahl, J.J.; Olsen, L.H.; Eskild-Jensen, A.; Djurhuus, J.C.; Swindle, M.M. Surgically Induced Urologic Models in Swine. J Invest Surg 2000, 13, 133–145. [Google Scholar] [CrossRef]
- Kuzmuk, K.N.; Schook, L.B. Pigs as a Model for Biomedical Sciences. The Genetics of the Pig: Second Edition 2011, 426–444. [Google Scholar] [CrossRef]
- Swindle, M.M.; Makin, A.; Herron, A.J.; Clubb, F.J.; Frazier, K.S. Swine as Models in Biomedical Research and Toxicology Testing. Vet Pathol 2012, 49, 344–356. [Google Scholar] [CrossRef]
- Gromadziński, L.; Skowrońska, A.; Holak, P.; Smoliński, M.; Lepiarczyk, E.; Żurada, A.; Majewski, M.K.; Skowroński, M.T.; Majewska, M. A New Experimental Porcine Model of Venous Thromboembolism. J Clin Med 2021, 10. [Google Scholar] [CrossRef] [PubMed]
- Orzechowska, K.; Dobrzyń, K.; Kieżun, M.; Malinowska, A.; Świderska, B.; Kamiński, T.; Smolińska, N. Chemerin Effect on the Endometrial Proteome of the Domestic Pig during Implantation Obtained by LC-MS/MS Analysis. Cells 2022, 11. [Google Scholar] [CrossRef] [PubMed]
- Bossowska, A.; Majewski, M. Tetrodotoxin Induced Changes in the Chemical Coding of Dorsal Root Ganglion Neurons Supplying the Porcine Urinary Bladder. Pol J Vet Sci 2012, 15, 355–363. [Google Scholar] [CrossRef]
- Prinz, P.; Scharner, S.; Friedrich, T.; Schalla, M.; Goebel-Stengel, M.; Rose, M.; Stengel, A. Central and Peripheral Expression Sites of Phoenixin-14 Immunoreactivity in Rats. Biochem Biophys Res Commun 2017, 493, 195–201. [Google Scholar] [CrossRef] [PubMed]
- D’Mello, R.; Dickenson, A.H. Spinal Cord Mechanisms of Pain. Br J Anaesth 2008, 101, 8–16. [Google Scholar] [CrossRef]
- Cowan, A.; Lyu, R.M.; Chen, Y.H.; Dun, S.L.; Chang, J.K.; Dun, N.J. Phoenixin: A Candidate Pruritogen in the Mouse. Neuroscience 2015, 310, 541–548. [Google Scholar] [CrossRef]
- Bossowska, A.; Crayton, R.; Radziszewski, P.; Kmiec, Z.; Majewski, M. Distribution and Neurochemical Characterization of Sensory Dorsal Root Ganglia Neurons Supplying Porcine Urinary Bladder. J Physiol Pharmacol 2009, 60 Suppl 4, 77–81. [Google Scholar]
- Cheng, X.; Xiao, F.; Xie, R.; Hu, H.; Wan, Y. Alternate Thermal Stimulation Ameliorates Thermal Sensitivity and Modulates Calbindin-D 28K Expression in Lamina I and II and Dorsal Root Ganglia in a Mouse Spinal Cord Contusion Injury Model. FASEB J 2021, 35. [Google Scholar] [CrossRef] [PubMed]
- Cervero, F.; Iggo, A. THE SUBSTANTIA GELATINOSA OF THE SPINAL CORDA CRITICAL REVIEW. Brain 1980, 103, 717–772. [Google Scholar] [CrossRef]
- Gibson, S.J.; Polak, J.M.; Bloom, ’ S R; Sabate, $ I M; Mulderry, P.M.; Ghatei, M.A.; Mcgregor, $ G P; Morrison, J.F.B.; Kelly, J.S.; Evans, R.M.; et al. CALCITONIN GENE-RELATED PEPTIDE IMMUNOREACTIVITY IN THE SPINAL CORD OF MAN AND OF EIGHT OTHER SPECIES1. 1984, 4, 3101–3111.
- Nordlind, K.; Eriksson, L.; Seiger, Å.; Bakhiet, M. Expression of Interleukin-6 in Human Dorsal Root Ganglion Cells. Neurosci Lett 2000, 280, 139–142. [Google Scholar] [CrossRef] [PubMed]
- Nakamura, K.; Ajijola, O.A.; Aliotta, E.; Armour, J.A.; Ardell, J.L.; Shivkumar, K. PATHOLOGICAL EFFECTS OF CHRONIC MYOCARDIAL INFARCTION ON PERIPHERAL NEURONS MEDIATING CARDIAC NEUROTRANSMISSION. Auton Neurosci 2016, 197, 34. [Google Scholar] [CrossRef] [PubMed]
- Javed, H.; Rehmathulla, S.; Tariq, S.; Ali, M.A.; Emerald, B.S.; Shehab, S. Co-Localization of Nociceptive Markers in the Lumbar Dorsal Root Ganglion and Spinal Cord of Dromedary Camel. Journal of Comparative Neurology 2021, 529, 3710–3725. [Google Scholar] [CrossRef] [PubMed]
- Giaid, A.; Gibson, S.J.; Ibrahim, N.B.N.; Legon, S.; Bloom, S.R.; Yanagisawa, M.; Masaki, T.; Varndell, I.M.; Polak, J.M. Endothelin 1, an Endothelium-Derived Peptide, Is Expressed in Neurons of the Human Spinal Cord and Dorsal Root Ganglia. Proc Natl Acad Sci U S A 1989, 86, 7634. [Google Scholar] [CrossRef]
- Landry, M.; Åman, K.; Dostrovsky, J.; Lozano, A.M.; Carlstedt, T.; Spenger, C.; Josephson, A.; Wiesenfeld-Hallin, Z.; Hökfelt, T. Galanin Expression in Adult Human Dorsal Root Ganglion Neurons: Initial Observations. Neuroscience 2003, 117, 795–809. [Google Scholar] [CrossRef] [PubMed]
- Merighi, A.; Kar, S.; Gibson, S.J.; Ghidella, S.; Gobetto, A.; Peirone, S.M.; Polak, J.M. The Immunocytochemical Distribution of Seven Peptides in the Spinal Cord and Dorsal Root Ganglia of Horse and Pig. Anat Embryol (Berl) 1990, 181, 271–280. [Google Scholar] [CrossRef] [PubMed]
- Iyengar, S.; Johnson, K.W.; Ossipov, M.H.; Aurora, S.K. CGRP and the Trigeminal System in Migraine. Headache 2019, 59, 659–681. [Google Scholar] [CrossRef] [PubMed]
- Dodds, K.N.; Kyloh, M.A.; Travis, L.; Cox, M.; Hibberd, T.J.; Spencer, N.J. Anatomical Distribution of CGRP-Containing Lumbosacral Spinal Afferent Neurons in the Mouse Uterine Horn. Front Neurosci 2022, 16. [Google Scholar] [CrossRef] [PubMed]
- Brain, S.D.; Tippins, J.R.; Morris, H.R.; MacIntyre, I.; Williams, T.J. Potent Vasodilator Activity of Calcitonin Gene-Related Peptide in Human Skin. J Invest Dermatol 1986, 87, 533–536. [Google Scholar] [CrossRef] [PubMed]
- Bunker, C.B.; Reavley, C.; Dowd, P.M.; O’Shaughnessy, D.J. Calcitonin Gene-Related Peptide in Treatment of Severe Peripheral Vascular Insufficiency in Raynaud’s Phenomenon. Lancet 1993, 342, 80–83. [Google Scholar] [CrossRef] [PubMed]
- Mitsikostas, D.D.; Reuter, U. Calcitonin Gene-Related Peptide Monoclonal Antibodies for Migraine Prevention: Comparisons across Randomized Controlled Studies. Curr Opin Neurol 2017, 30, 272–280. [Google Scholar] [CrossRef] [PubMed]
- Garry, M.G.; Hargreaves, K.M. Enhanced Release of Immunoreactive CGRP and Substance P from Spinal Dorsal Horn Slices Occurs during Carrageenan Inflammation. Brain Res 1992, 582, 139–142. [Google Scholar] [CrossRef] [PubMed]
- Kawasaki, H.; Takasaki, K.; Saito, A.; Goto, K. Calcitonin Gene-Related Peptide Acts as a Novel Vasodilator Neurotransmitter in Mesenteric Resistance Vessels of the Rat. Nature 1988, 335, 164–167. [Google Scholar] [CrossRef] [PubMed]
- Cao, T.; Pintér, E.; Al-Rashed, S.; Gerard, N.; Hoult, J.R.; Brain, S.D. Neurokinin-1 Receptor Agonists Are Involved in Mediating Neutrophil Accumulation in the Inflamed, but Not Normal, Cutaneous Microvasculature: An in Vivo Study Using Neurokinin-1 Receptor Knockout Mice. J Immunol 2000, 164, 5424–5429. [Google Scholar] [CrossRef]
- Biella, G.; Panara, C.; Pecile, A.; Sotgiu, M.L. Facilitatory Role of Calcitonin Gene-Related Peptide (CGRP) on Excitation Induced by Substance P (SP) and Noxious Stimuli in Rat Spinal Dorsal Horn Neurons. An Iontophoretic Study in Vivo. Brain Res 1991, 559, 352–356. [Google Scholar] [CrossRef]
- Le Grevés, P.; Nyberg, F.; Hökfelt, T.; Terenius, L. Calcitonin Gene-Related Peptide Is Metabolized by an Endopeptidase Hydrolyzing Substance P. Regul Pept 1989, 25, 277–286. [Google Scholar] [CrossRef]
- Le Greves, P.; Nyberg, F.; Terenius, L.; Hökfelt, T. Calcitonin Gene-Related Peptide Is a Potent Inhibitor of Substance P Degradation. Eur J Pharmacol 1985, 115, 309–311. [Google Scholar] [CrossRef]
- Oku, R.; Satoh, M.; Fujii, N.; Otaka, A.; Yajima, H.; Takagi, H. Calcitonin Gene-Related Peptide Promotes Mechanical Nociception by Potentiating Release of Substance P from the Spinal Dorsal Horn in Rats. Brain Res 1987, 403, 350–354. [Google Scholar] [CrossRef]
- Kangrga, I.; Larew, J.S.A.; Randic, M. The Effects of Substance P and Calcitonin Gene-Related Peptide on the Efflux of Endogenous Glutamate and Aspartate from the Rat Spinal Dorsal Horn in Vitro. Neurosci Lett 1990, 108, 155–160. [Google Scholar] [CrossRef]
- Cooper, D.; Laidig, W.D.; Sappington, A.; MacGregor, G. A Pharmacological Review of Calcitonin Gene-Related Peptide Biologics and Future Use for Chronic Pain. Cureus 2023, 15. [Google Scholar] [CrossRef]
- Nicoll, R.A.; Schenker, C.; Leeman, S.E. Substance P as a Transmitter Candidate. Annu Rev Neurosci 1980, 3, 227–268. [Google Scholar] [CrossRef] [PubMed]
- Lawson, S.N.; Crepps, B.A.; Perl, E.R. Relationship of Substance P to Afferent Characteristics of Dorsal Root Ganglion Neurones in Guinea-Pig. Journal of Physiology 1997, 177–191. [Google Scholar] [CrossRef]
- Janikiewicz, P.; Wasilewska, B.; Mazur, U.; Franke-Radowiecka, A.; Majewski, M.; Bossowska, A. The Influence of an Adrenergic Antagonist Guanethidine (GUA) on the Distribution Pattern and Chemical Coding of Dorsal Root Ganglia (DRG) Neurons Supplying the Porcine Urinary Bladder. Int J Mol Sci 2021, 22. [Google Scholar] [CrossRef] [PubMed]
- Han, D.S.; Lee, C.H.; Shieh, Y.D.; Chang, C.T.; Li, M.H.; Chu, Y.C.; Wang, J.L.; Chang, K.V.; Lin, S.H.; Chen, C.C. A Role for Substance P and Acid-Sensing Ion Channel 1a in Prolotherapy with Dextrose-Mediated Analgesia in a Mouse Model of Chronic Muscle Pain. Pain 2022, 163, E622–E633. [Google Scholar] [CrossRef]
- Kozłowska, A.; Mikołajczyk, A.; Adamiak, Z.; Majewski, M. Distribution and Chemical Coding of Sensory Neurons Innervating the Skin of the Porcine Hindlimb. Neuropeptides 2017, 61, 1–14. [Google Scholar] [CrossRef] [PubMed]
- McCarthy, P.W.; Lawson, S.N. Cell Type and Conduction Velocity of Rat Primary Sensory Neurons with Substance P-like Immunoreactivity. Neuroscience 1989, 28, 745–753. [Google Scholar] [CrossRef]
- Simões, A.L.B.; Silva, G.A.R.; Giorgetto, C.; de Cassia do Carmo-Campos, E.; Dias, F.J.; Fazan, V.P.S. Substance P in Dorsal Root Ganglion Neurons in Young and Adult Rats, after Nociceptive Stimulation during the Neonatal Period. Anatomical Record 2018, 301, 849–861. [Google Scholar] [CrossRef]
- Kourosh-Arami, M.; Hosseini, N.; Mohsenzadegan, M.; Komaki, A.; Joghataei, M.T. Neurophysiologic Implications of Neuronal Nitric Oxide Synthase. Rev Neurosci 2020, 31, 617–636. [Google Scholar] [CrossRef]
- Zhou, L.; Zhu, D.Y. Neuronal Nitric Oxide Synthase: Structure, Subcellular Localization, Regulation, and Clinical Implications. Nitric Oxide 2009, 20, 223–230. [Google Scholar] [CrossRef]
- Thippeswamy, T.; Morris, R. The Roles of Nitric Oxide in Dorsal Root Ganglion Neurons. Ann N Y Acad Sci 2002, 962, 103–110. [Google Scholar] [CrossRef]
- Zheng, Q.; Dong, X.; Green, D.P.; Dong, X. Peripheral Mechanisms of Chronic Pain. Medical review (Berlin, Germany) 2022, 2, 251–270. [Google Scholar] [CrossRef] [PubMed]
- Rocha, P.A.; Ferreira, A.F.B.; Da Silva, J.T.; Alves, A.S.; Martins, D.O.; Britto, L.R.G.; Chacur, M. Effects of Selective Inhibition of NNOS and INOS on Neuropathic Pain in Rats. Mol Cell Neurosci 2020, 105. [Google Scholar] [CrossRef] [PubMed]
- Solanki, K.; Rajpoot, S.; Bezsonov, E.E.; Orekhov, A.N.; Saluja, R.; Wary, A.; Axen, C.; Wary, K.; Baig, M.S. The Expanding Roles of Neuronal Nitric Oxide Synthase (NOS1). PeerJ 2022, 10. [Google Scholar] [CrossRef] [PubMed]
- Terenghi, G.; Riveros-Moreno, V.; Hudson, L.D.; Ibrahim, N.B.N.; Polak, J.M. Immunohistochemistry of Nitric Oxide Synthase Demonstrates Immunoreactive Neurons in Spinal Cord and Dorsal Root Ganglia of Man and Rat. J Neurol Sci 1993, 118, 34–37. [Google Scholar] [CrossRef] [PubMed]
- Tan, L.L.; Bornstein, J.C.; Anderson, C.R. Distinct Chemical Classes of Medium-Sized Transient Receptor Potential Channel Vanilloid 1-Immunoreactive Dorsal Root Ganglion Neurons Innervate the Adult Mouse Jejunum and Colon. Neuroscience 2008, 156, 334–343. [Google Scholar] [CrossRef]
- Russo, D.; Clavenzani, P.; Mazzoni, M.; Chiocchetti, R.; Guardo, G. Di; Lalatta-Costerbosa, G. Immunohistochemical Characterization of TH13-L2 Spinal Ganglia Neurons in Sheep (Ovis Aries). Microsc Res Tech 2010, 73, 128–139. [Google Scholar] [CrossRef]
- Wiesenfeld-Hallin, Z.; Xu, X.J. Galanin in Somatosensory Function. Ann N Y Acad Sci 1998, 863, 383–389. [Google Scholar] [CrossRef]
- Hökfelt, T.; Wiesenfeld-Hallin, Z.; Villar, M.; Melander, T. Increase of Galanin-like Immunoreactivity in Rat Dorsal Root Ganglion Cells after Peripheral Axotomy. Neurosci Lett 1987, 83, 217–220. [Google Scholar] [CrossRef]
- Hao, J.-X.; Shi, T.-J.; Xu, I.S.; Kaupilla, T.; Xu, X.-J.; Hökfelt, T.; Bartfai, T.; Wiesenfeld-Hallin, Z. Intrathecal Galanin Alleviates Allodynia-like Behaviour in Rats after Partial Peripheral Nerve Injury. European Journal of Neuroscience 1999, 11, 427–432. [Google Scholar] [CrossRef]
- Metcalf, C.S.; Klein, B.D.; McDougle, D.R.; Zhang, L.; Smith, M.D.; Bulaj, G.; White, H.S. Analgesic Properties of a Peripherally Acting and GalR2 Receptor-Preferring Galanin Analog in Inflammatory, Neuropathic, and Acute Pain Models. J Pharmacol Exp Ther 2015, 352, 185–193. [Google Scholar] [CrossRef]
- Lang, R.; Gundlach, A.L.; Holmes, F.E.; Hobson, S.A.; Wynick, D.; Hökfelt, T.; Kofler, B. Physiology, Signaling, and Pharmacology of Galanin Peptides and Receptors: Three Decades of Emerging Diversity. Pharmacol Rev 2015, 67, 118–175. [Google Scholar] [CrossRef] [PubMed]
- Moller, K.; Zhang, Y.Z.; Håkanson, R.; Luts, A.; Sjölund, B.; Uddman, R.; Sundler, F. Pituitary Adenylate Cyclase Activating Peptide Is a Sensory Neuropeptide: Immunocytochemical and Immunochemical Evidence. Neuroscience 1993, 57, 725–732. [Google Scholar] [CrossRef] [PubMed]
- Zhang, Q.; Shi, T.J.; Ji, R.R.; Zhang, Y. then; Sundler, F.; Hannibal, J.; Fahrenkrug, J.; Hökfelt, T. Expression of Pituitary Adenylate Cyclase-Activating Polypeptide in Dorsal Root Ganglia Following Axotomy: Time Course and Coexistence. Brain Res 1995, 705, 149–158. [Google Scholar] [CrossRef]
- Mulder, H.; Uddman, R.; Moller, K.; Zhang, Y.Z.; Ekblad, E.; Alumets, J.; Sundler, F. Pituitary Adenylate Cyclase Activating Polypeptide Expression in Sensory Neurons. Neuroscience 1994, 63, 307–312. [Google Scholar] [CrossRef] [PubMed]
- Corness, J.; Shi, T.J.; Xu, Z.Q.; Brulet, P.; Hökfelt, T. Influence of Leukemia Inhibitory Factor on Galanin/GMAP and Neuropeptide Y Expression in Mouse Primary Sensory Neurons after Axotomy. Exp Brain Res 1996, 112, 79–88. [Google Scholar] [CrossRef]
- Lioudyno, M.; Skoglösa, Y.; Takei, N.; Lindholm, D. Rapid Communication Pituitary Adenylate Cyclase-Activating Polypeptide (PACAP) Protects Dorsal Root Ganglion Neurons From Death and Induces Calcitonin Gene-Related Peptide (CGRP) Immunoreactivity In Vitro. 1998, 51, 243–256. [Google Scholar]
- Xu, X.; Yang, X.; Zhang, P.; Chen, X.; Liu, H.; Li, Z. Effects of Exogenous Galanin on Neuropathic Pain State and Change of Galanin and Its Receptors in DRG and SDH after Sciatic Nerve-Pinch Injury in Rat. PLoS One 2012, 7. [Google Scholar] [CrossRef]
- Zacharko-Siembida, A.; Kulik, P.; Szalak, R.; Lalak, R.; Arciszewski, M.B. Co-Expression Patterns of Cocaine- and Amphetamine-Regulated Transcript (CART) with Neuropeptides in Dorsal Root Ganglia of the Pig. Acta Histochem 2014, 116, 390–398. [Google Scholar] [CrossRef]
- Kozsurek, M.; Lukácsi, E.; Fekete, C.; Wittmann, G.; Réthelyi, M.; Puskár, Z. Cocaine- and Amphetamine-Regulated Transcript Peptide (CART) Is Present in Peptidergic C Primary Afferents and Axons of Excitatory Interneurons with a Possible Role in Nociception in the Superficial Laminae of the Rat Spinal Cord. Eur J Neurosci 2007, 26, 1624–1631. [Google Scholar] [CrossRef]
- Hökfelt, T.; Elde, R.; Johansson, O.; Luft, R.; Nilsson, G.; Arimura, A. Immunohistochemical Evidence for Separate Populations of Somatostatin-Containing and Substance P-Containing Primary Afferent Neurons in the Rat. Neuroscience 1976, 1. [Google Scholar] [CrossRef]
- Kardon, A.P.; Polgár, E.; Hachisuka, J.; Snyder, L.M.; Cameron, D.; Savage, S.; Cai, X.; Karnup, S.; Fan, C.R.; Hemenway, G.M.; et al. Dynorphin Acts as a Neuromodulator to Inhibit Itch in the Dorsal Horn of the Spinal Cord. Neuron 2014, 82, 573–586. [Google Scholar] [CrossRef] [PubMed]
- Stantcheva, K.K.; Iovino, L.; Dhandapani, R.; Martinez, C.; Castaldi, L.; Nocchi, L.; Perlas, E.; Portulano, C.; Pesaresi, M.; Shirlekar, K.S.; et al. A Subpopulation of Itch-Sensing Neurons Marked by Ret and Somatostatin Expression. EMBO Rep 2016, 17, 585–600. [Google Scholar] [CrossRef] [PubMed]
- Friedrich, T.; Stengel, A. Current State of Phoenixin-the Implications of the Pleiotropic Peptide in Stress and Its Potential as a Therapeutic Target. Front Pharmacol 2023, 14. [Google Scholar] [CrossRef] [PubMed]
- Antal, M.; Polgár, E.; Chalmers, J.; Minson, J.B.; Llewellyn-Smith, I.; Heizmann, C.W.; Somogyi, P. Different Populations of Parvalbumin- and Calbindin-D28k-Immunoreactive Neurons Contain GABA and Accumulate 3H-D-Aspartate in the Dorsal Horn of the Rat Spinal Cord. J Comp Neurol 1991, 314, 114–124. [Google Scholar] [CrossRef]
- Egea, J.; Malmierca, E.; Rosa, A.O.; Del Barrio, L.; Negredo, P.; Nuñez, A.; López, M.G. Participation of Calbindin-D28K in Nociception: Results from Calbindin-D28K Knockout Mice. Pflugers Arch 2012, 463, 449–458. [Google Scholar] [CrossRef]
- Ren, K.; Ruda, M.A.; Jacobowitz, D.M. Immunohistochemical Localization of Calretinin in the Dorsal Root Ganglion and Spinal Cord of the Rat. Brain Res Bull 1993, 31, 13–22. [Google Scholar] [CrossRef]
- Stebbing, M.J.; Balasubramanyan, S.; Smith, P.A. Calbindin-D-28K like Immunoreactivity in Superficial Dorsal Horn Neurons and Effects of Sciatic Chronic Constriction Injury. Neuroscience 2016, 324, 330–343. [Google Scholar] [CrossRef]
- Ichikawa, H.; Jacobowitz, D.M.; Sugimoto, T. Calretinin-Immunoreactive Neurons in the Trigeminal and Dorsal Root Ganglia of the Rat. Brain Res 1993, 617, 96–102. [Google Scholar] [CrossRef]
Figure 1.
Representative examples of the immunofluorescent staining specificity control procedures used in the study: a) “classical” staining with anti-PNX antibody, visualized by CY3, b) anti-PNX antibody + 4′,6-diamidino-2-phenylindole (DAPI) as a counterstain, c) antiserum anti-PNX antibody preabsorbed with phoenixin-14 amide. Bar in all the images—50 μm.
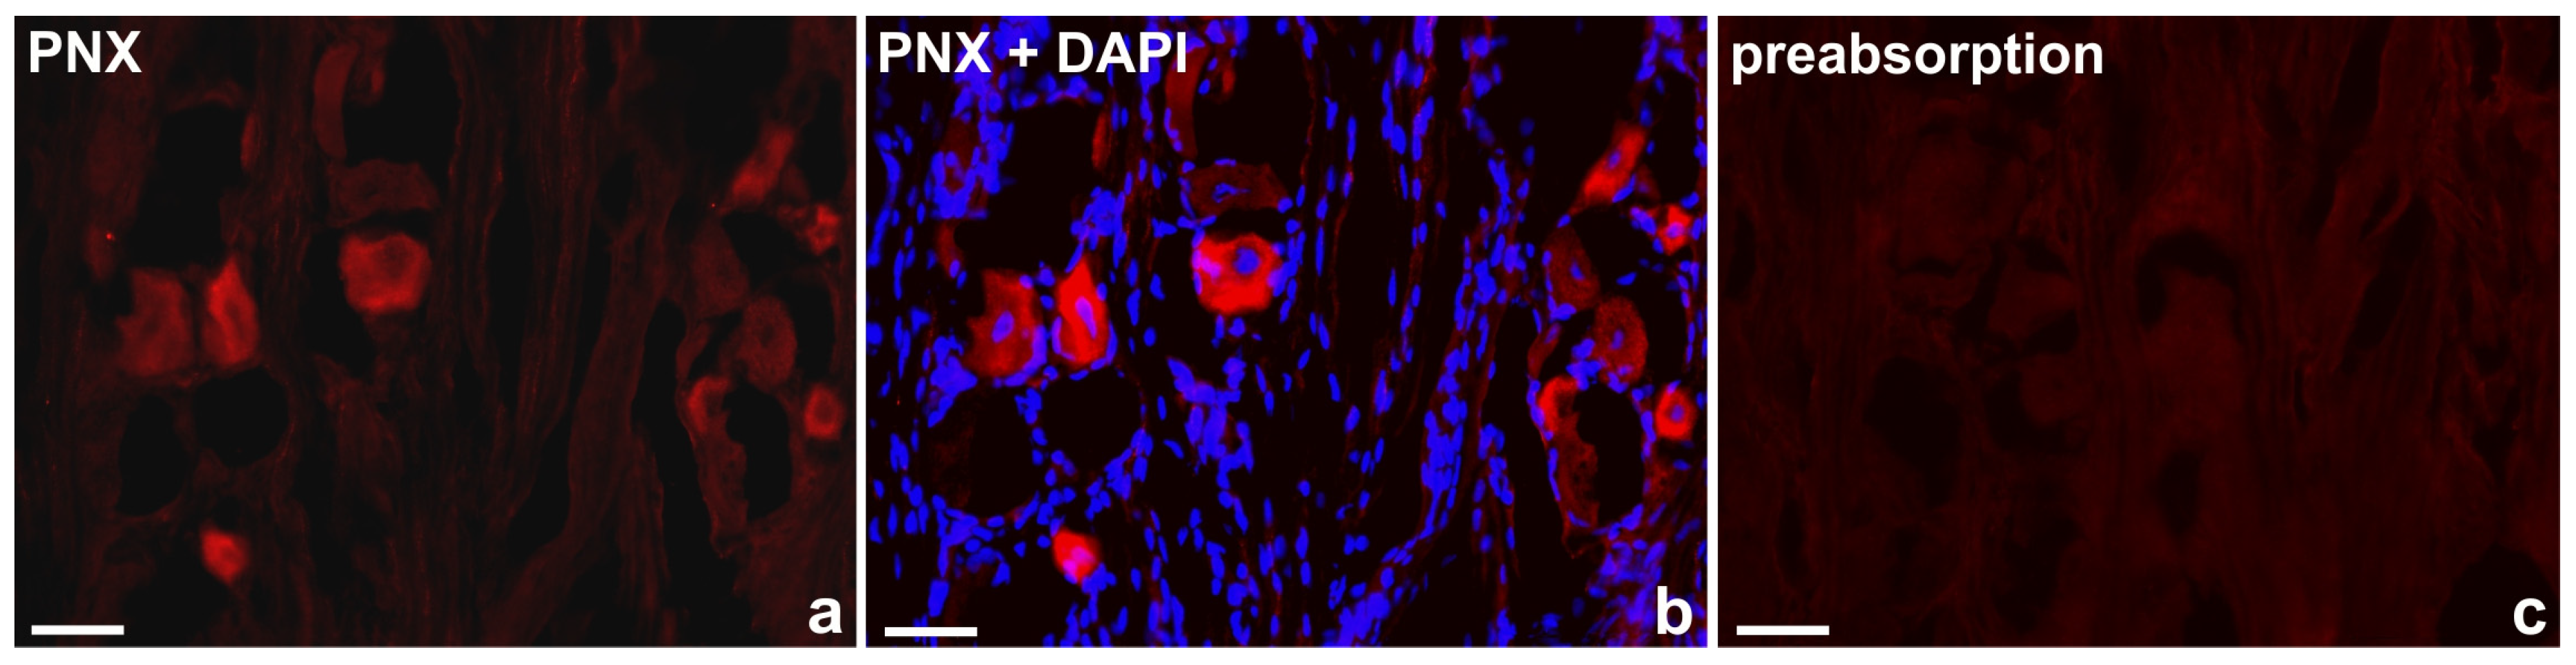
Figure 2.
Phoenixin-14 fragmentation spectrum – amidated (-0.98402 Da), derived from DRG L5 from pig number 1 (DRG1).
Figure 2.
Phoenixin-14 fragmentation spectrum – amidated (-0.98402 Da), derived from DRG L5 from pig number 1 (DRG1).
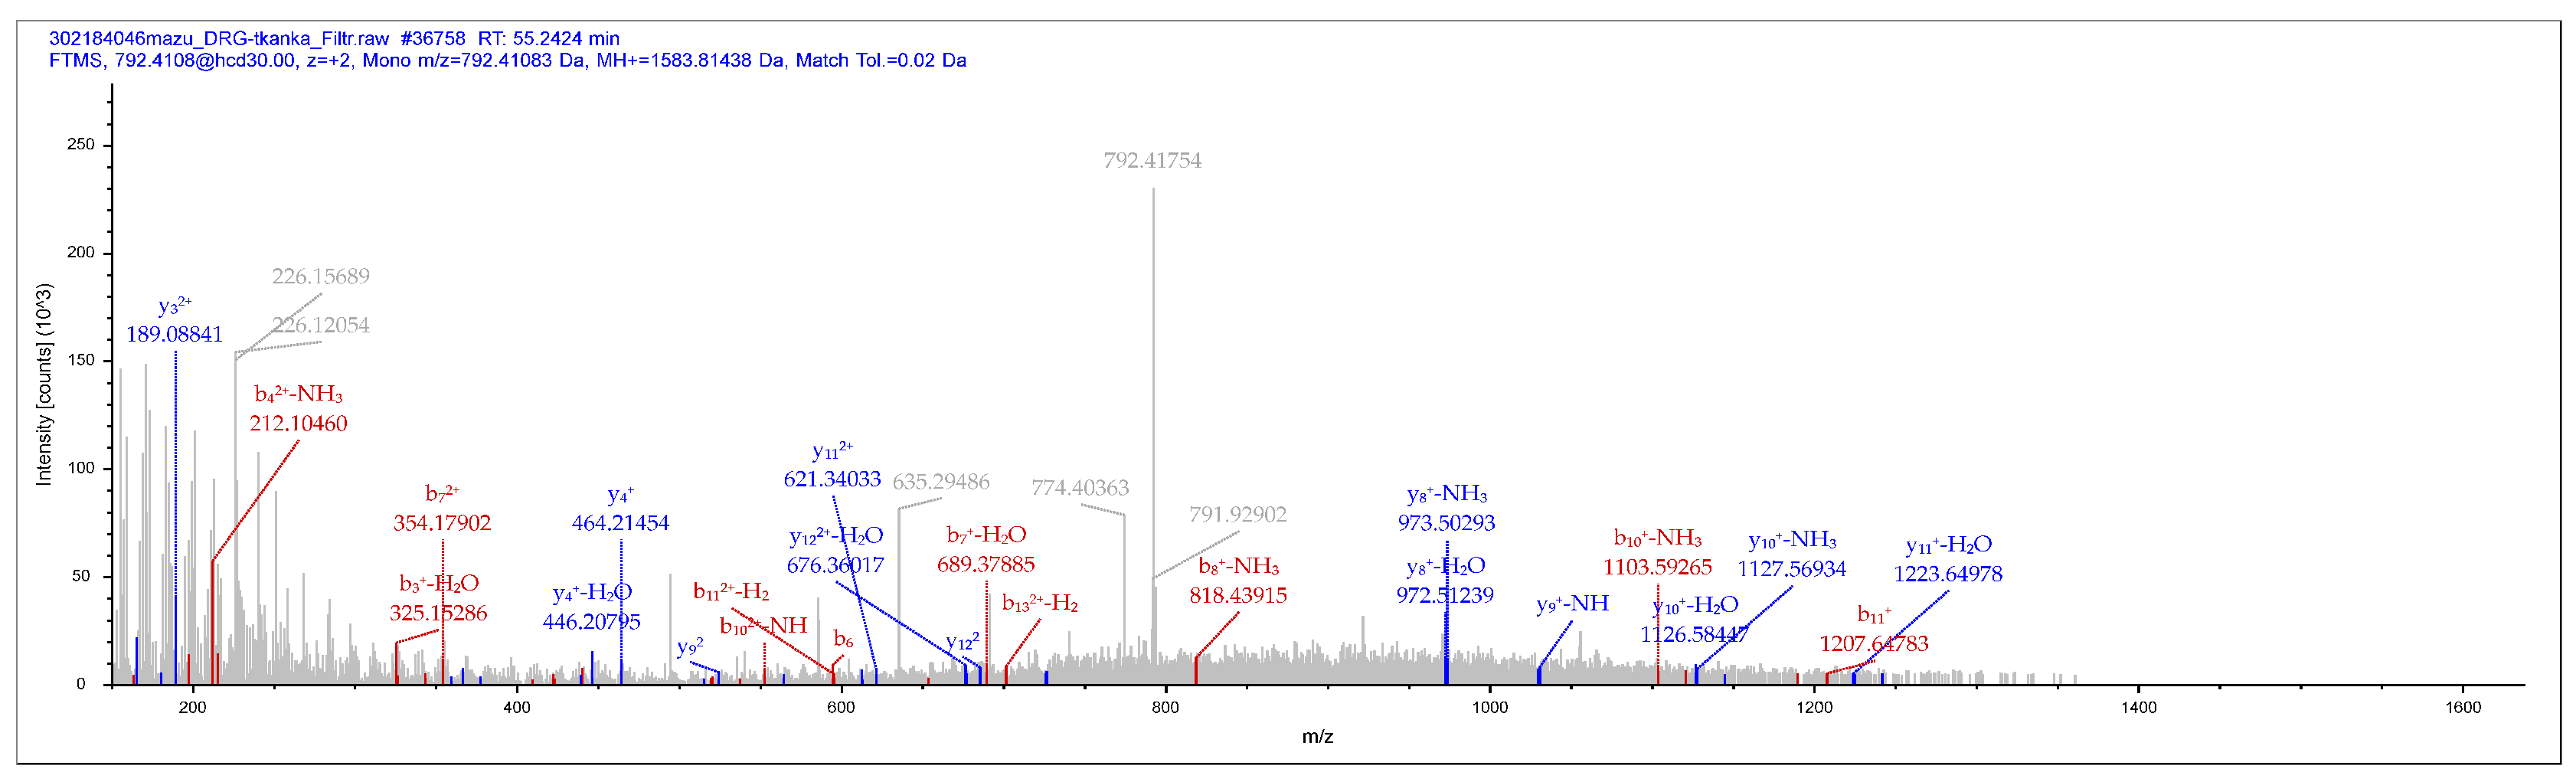
Figure 3.
Bar diagram showing the relative percentages of PNX+ sensory neurons located in the left (blue bars) and the right (yellow bars) DRG of the C, Th, L and S segments of the spinal cord. Data are pooled and presented as mean ± SD.
Figure 3.
Bar diagram showing the relative percentages of PNX+ sensory neurons located in the left (blue bars) and the right (yellow bars) DRG of the C, Th, L and S segments of the spinal cord. Data are pooled and presented as mean ± SD.
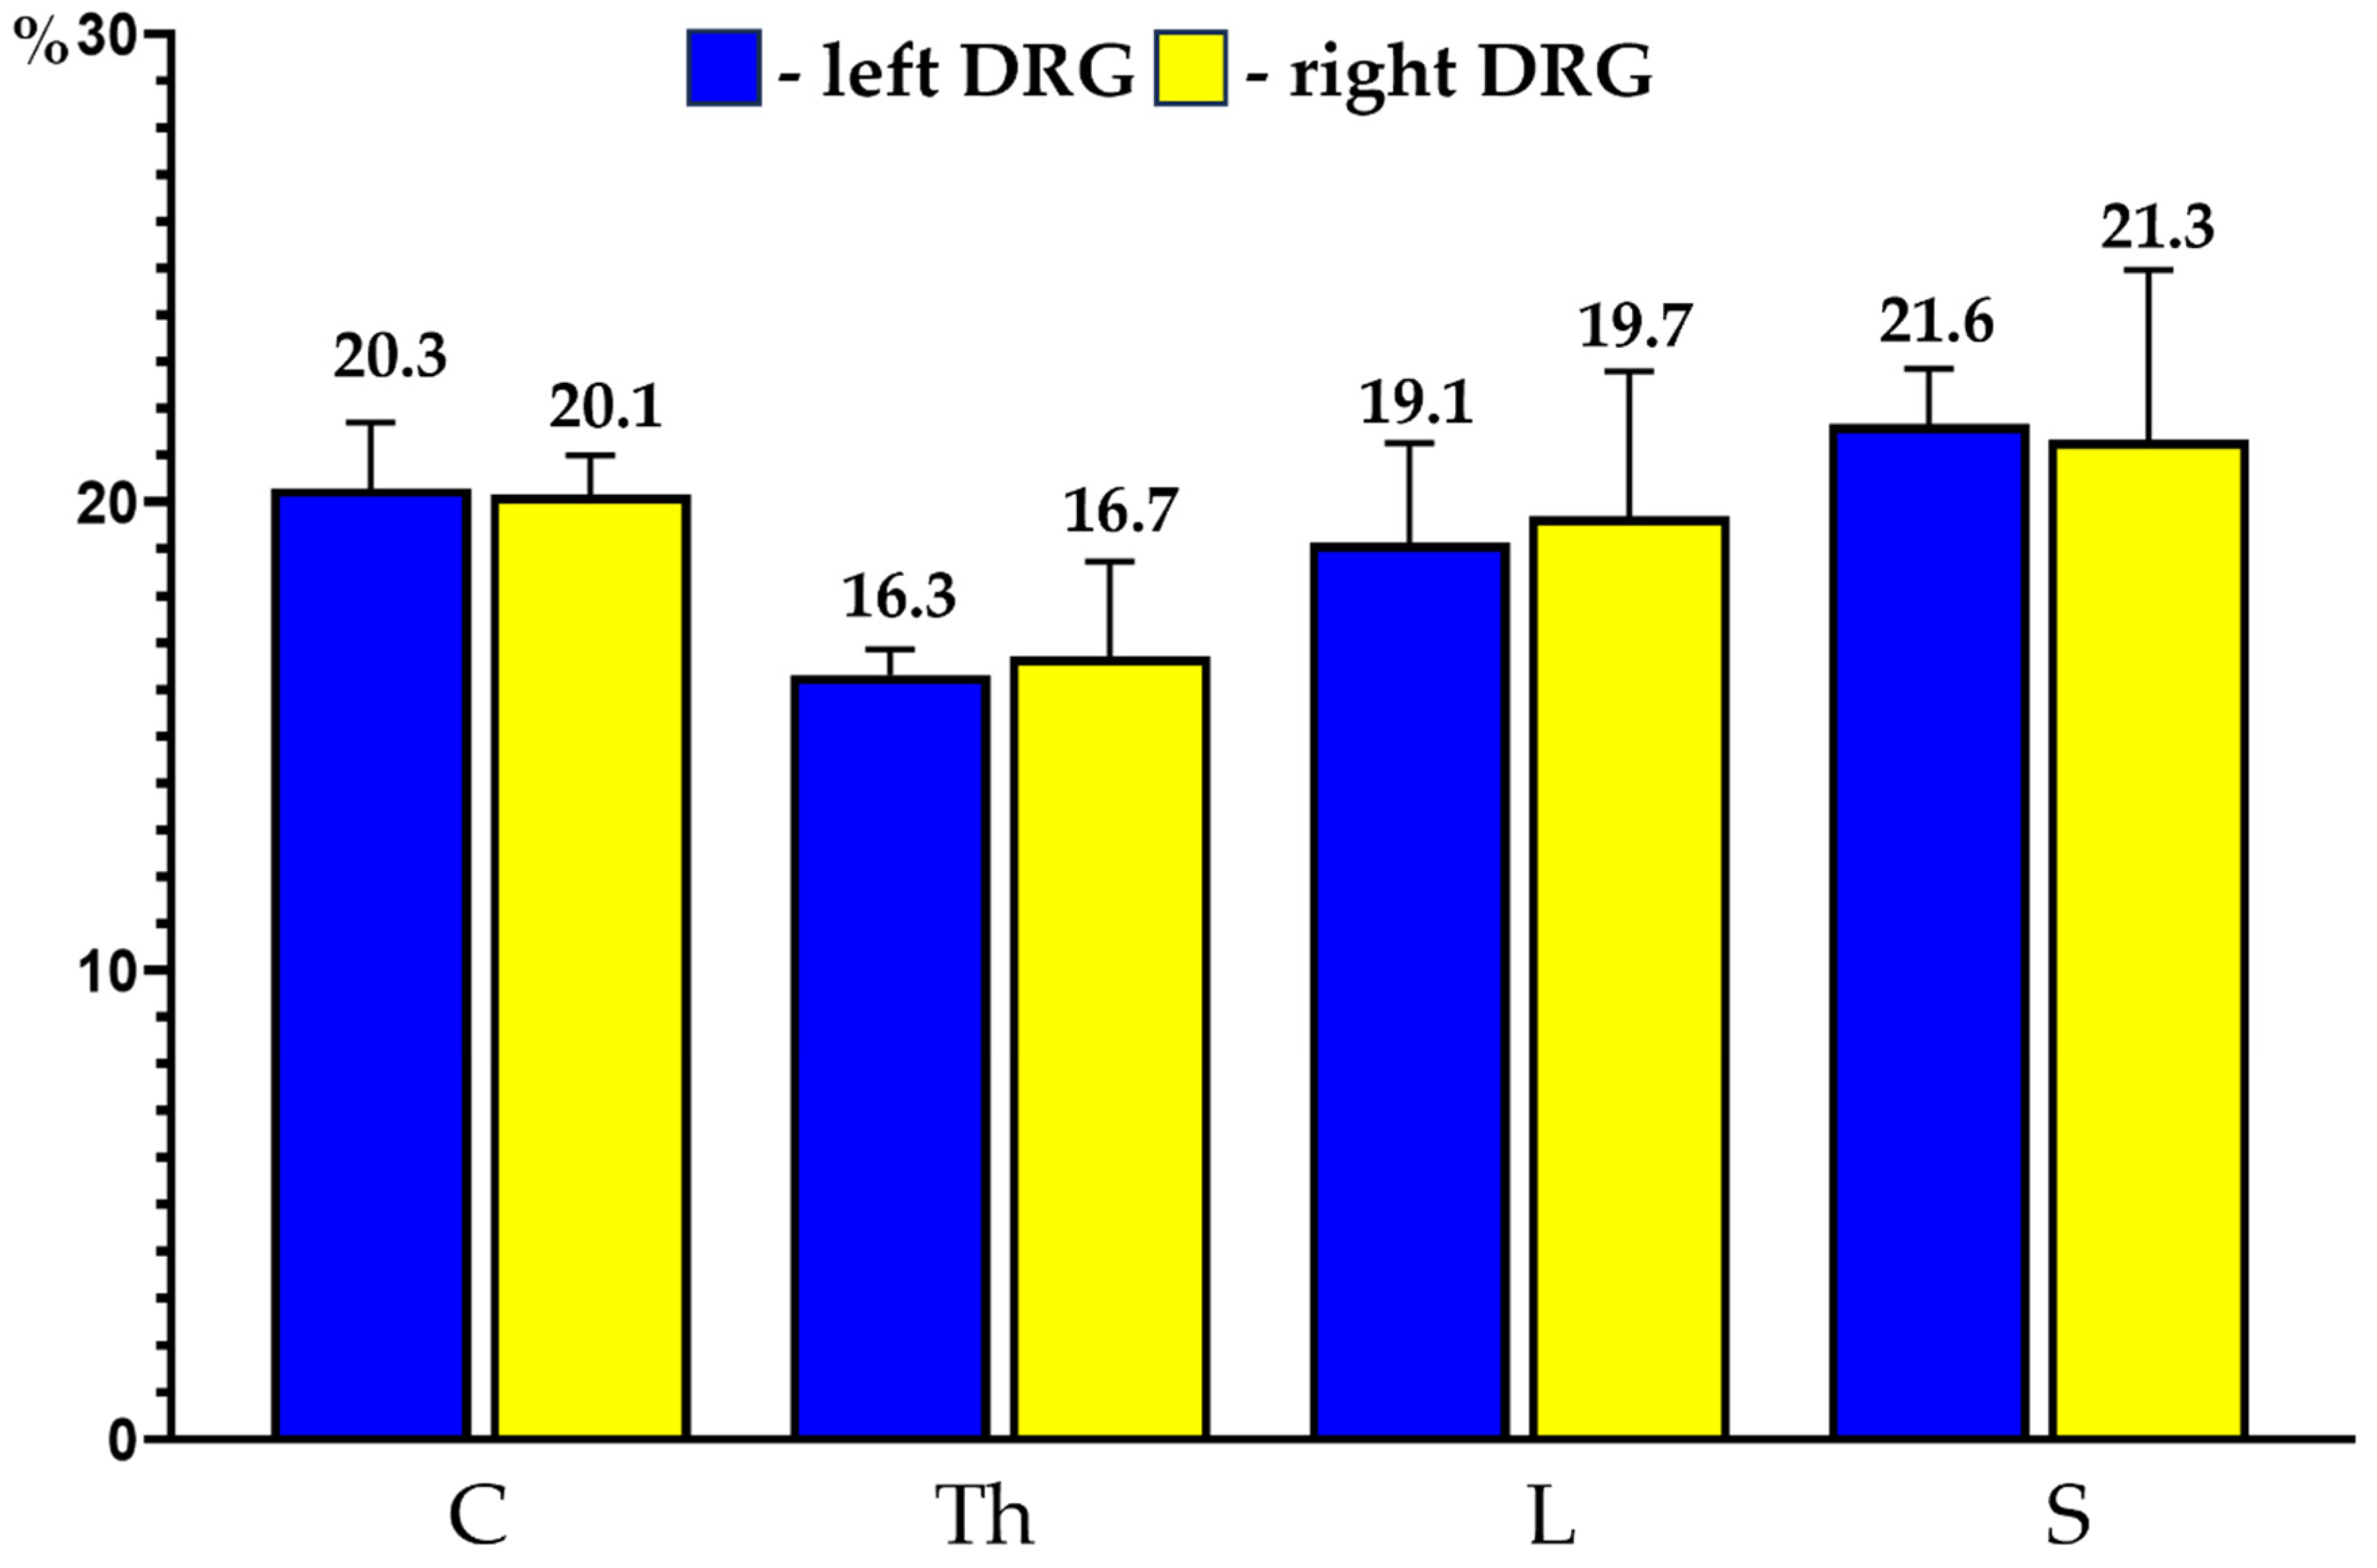
Figure 4.
Bar diagram summarizing the percentages of differently sized (Sl; M; Lg) PNX+ sensory nerve cells found in C, Th, L and S segments of the spinal cord. Data are pooled and presented as mean ± SD.
Figure 4.
Bar diagram summarizing the percentages of differently sized (Sl; M; Lg) PNX+ sensory nerve cells found in C, Th, L and S segments of the spinal cord. Data are pooled and presented as mean ± SD.
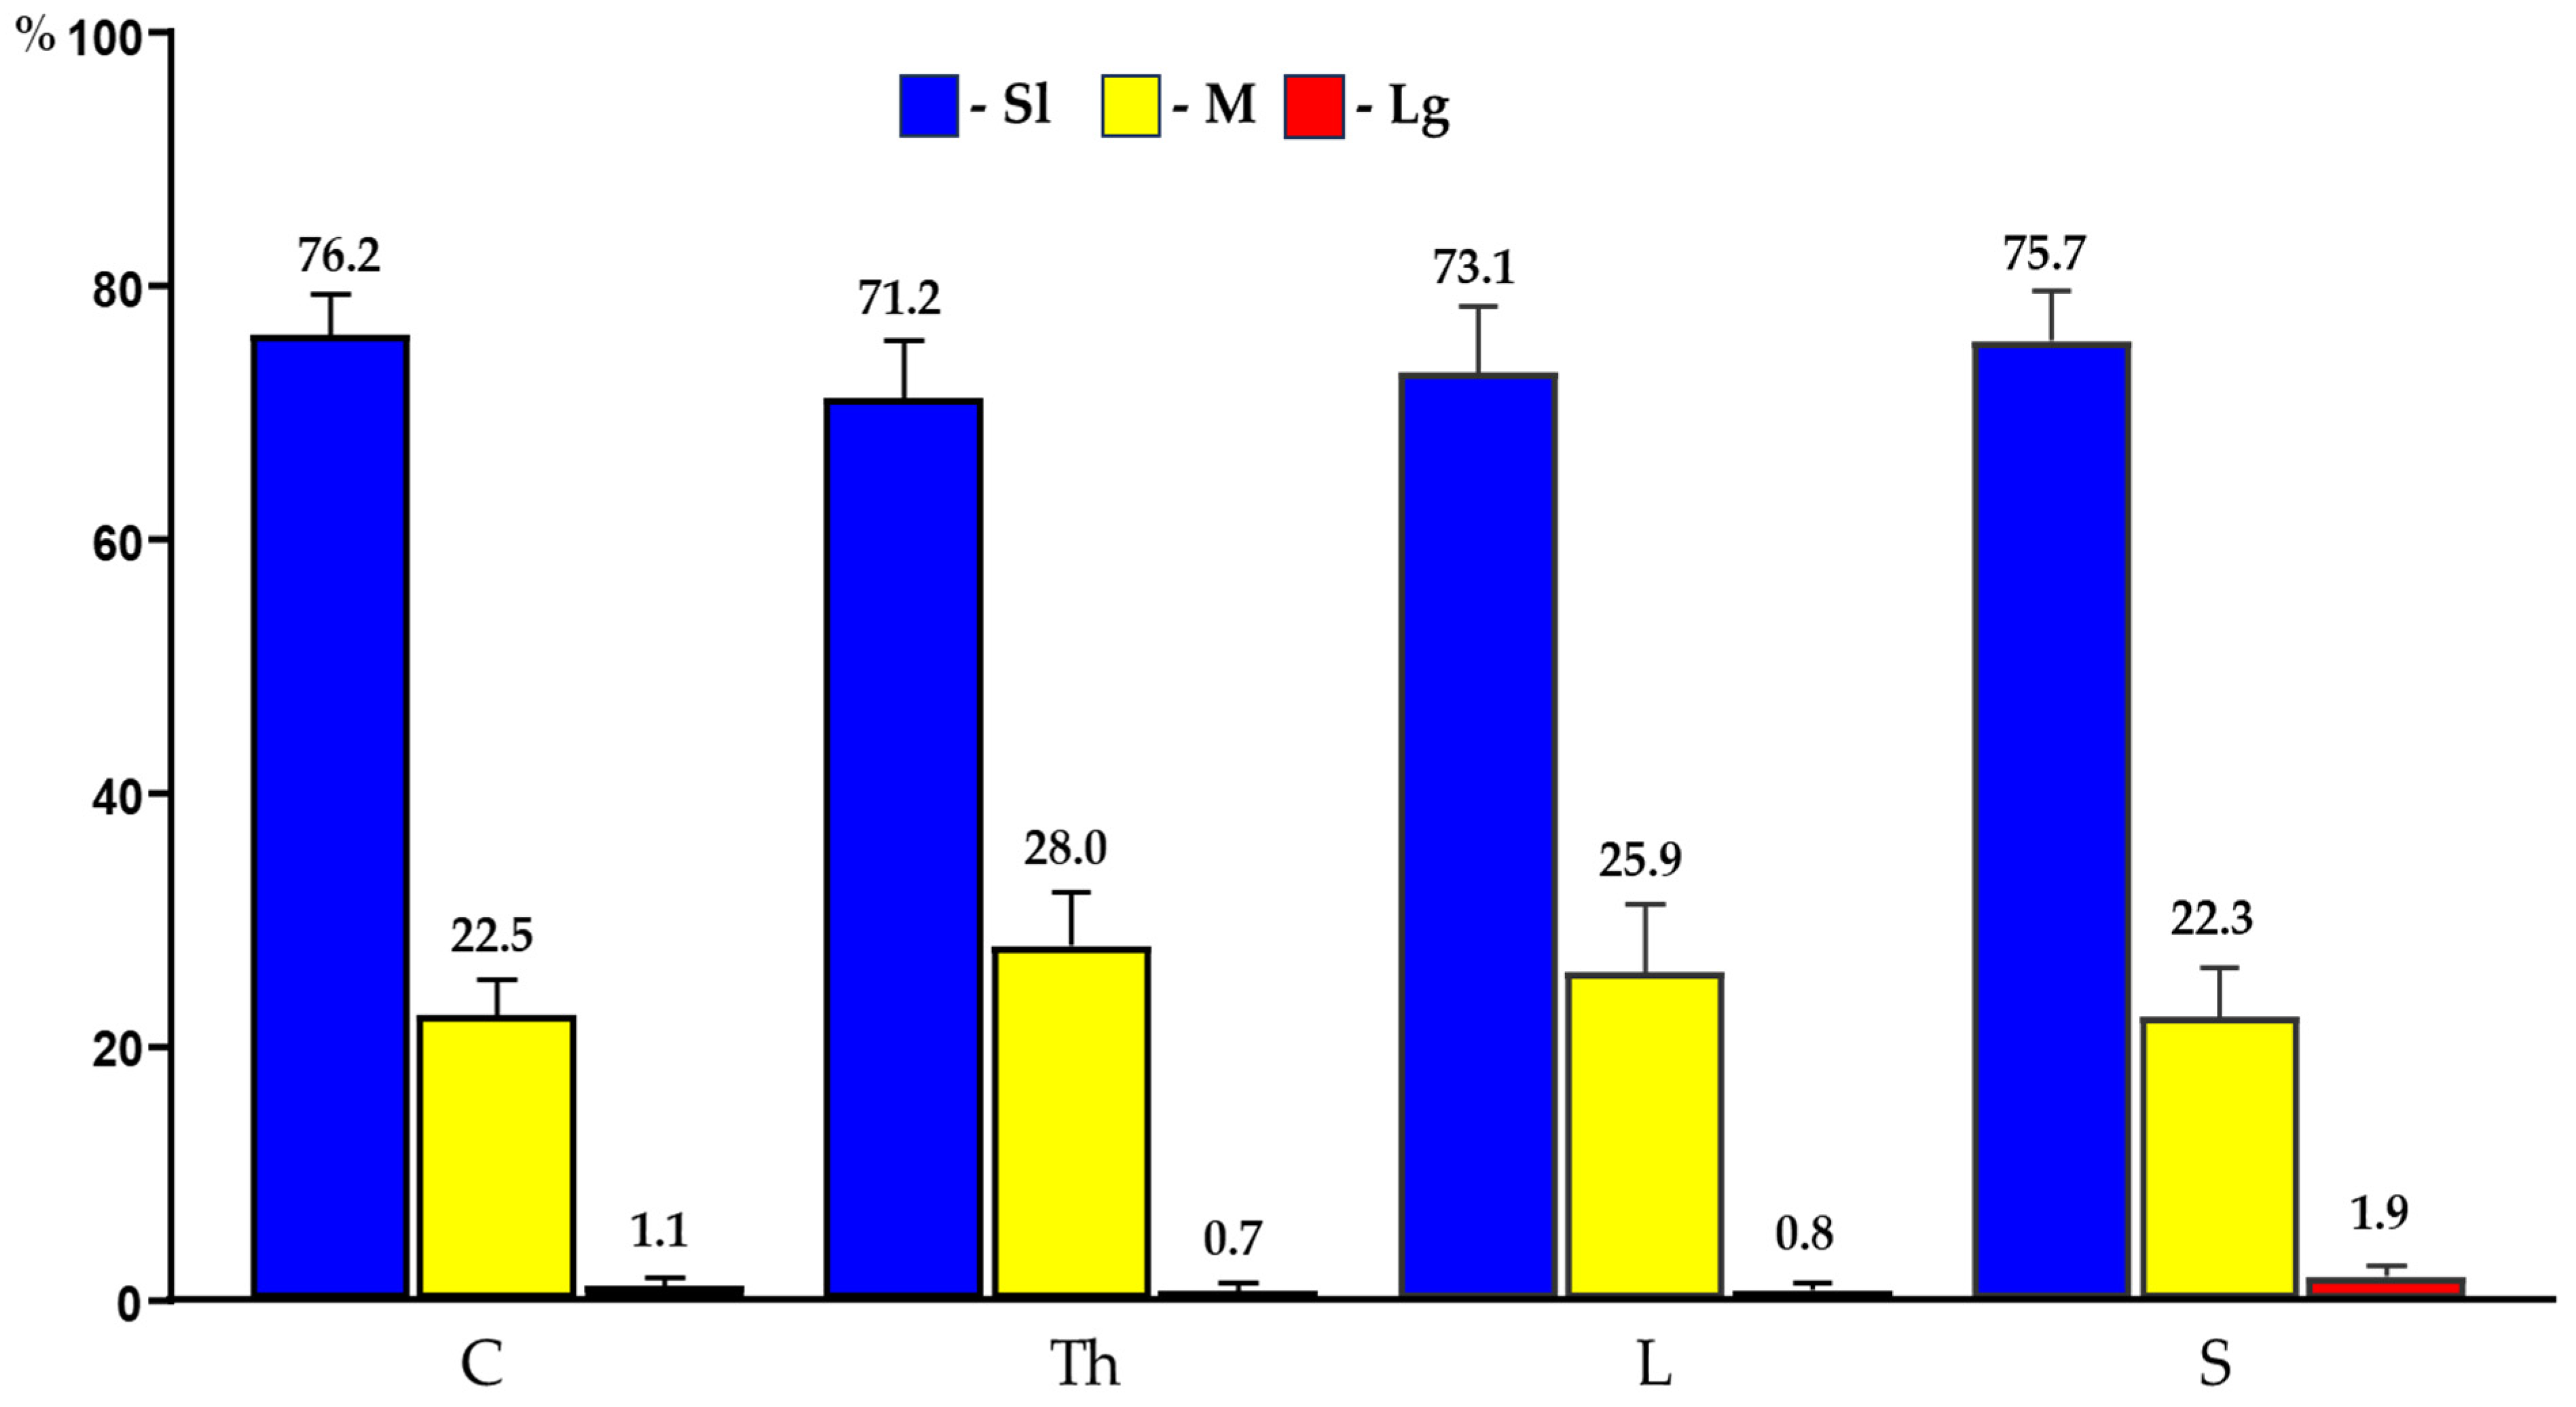
Figure 5.
Representative pictures of the PNX+ nerve cells in the porcine DRG L1 belonging to the different size classes; a) Sl cells (33.21 µm, 38.83 µm), M cell (55.35 µm) b) Sl cell (38.87 µm), M cell (57.88 µm), Lg cell (79.34 µm), c) M cell (49.81 µm), Lg cell (95.94 µm). Bar in all the images—50 μm.
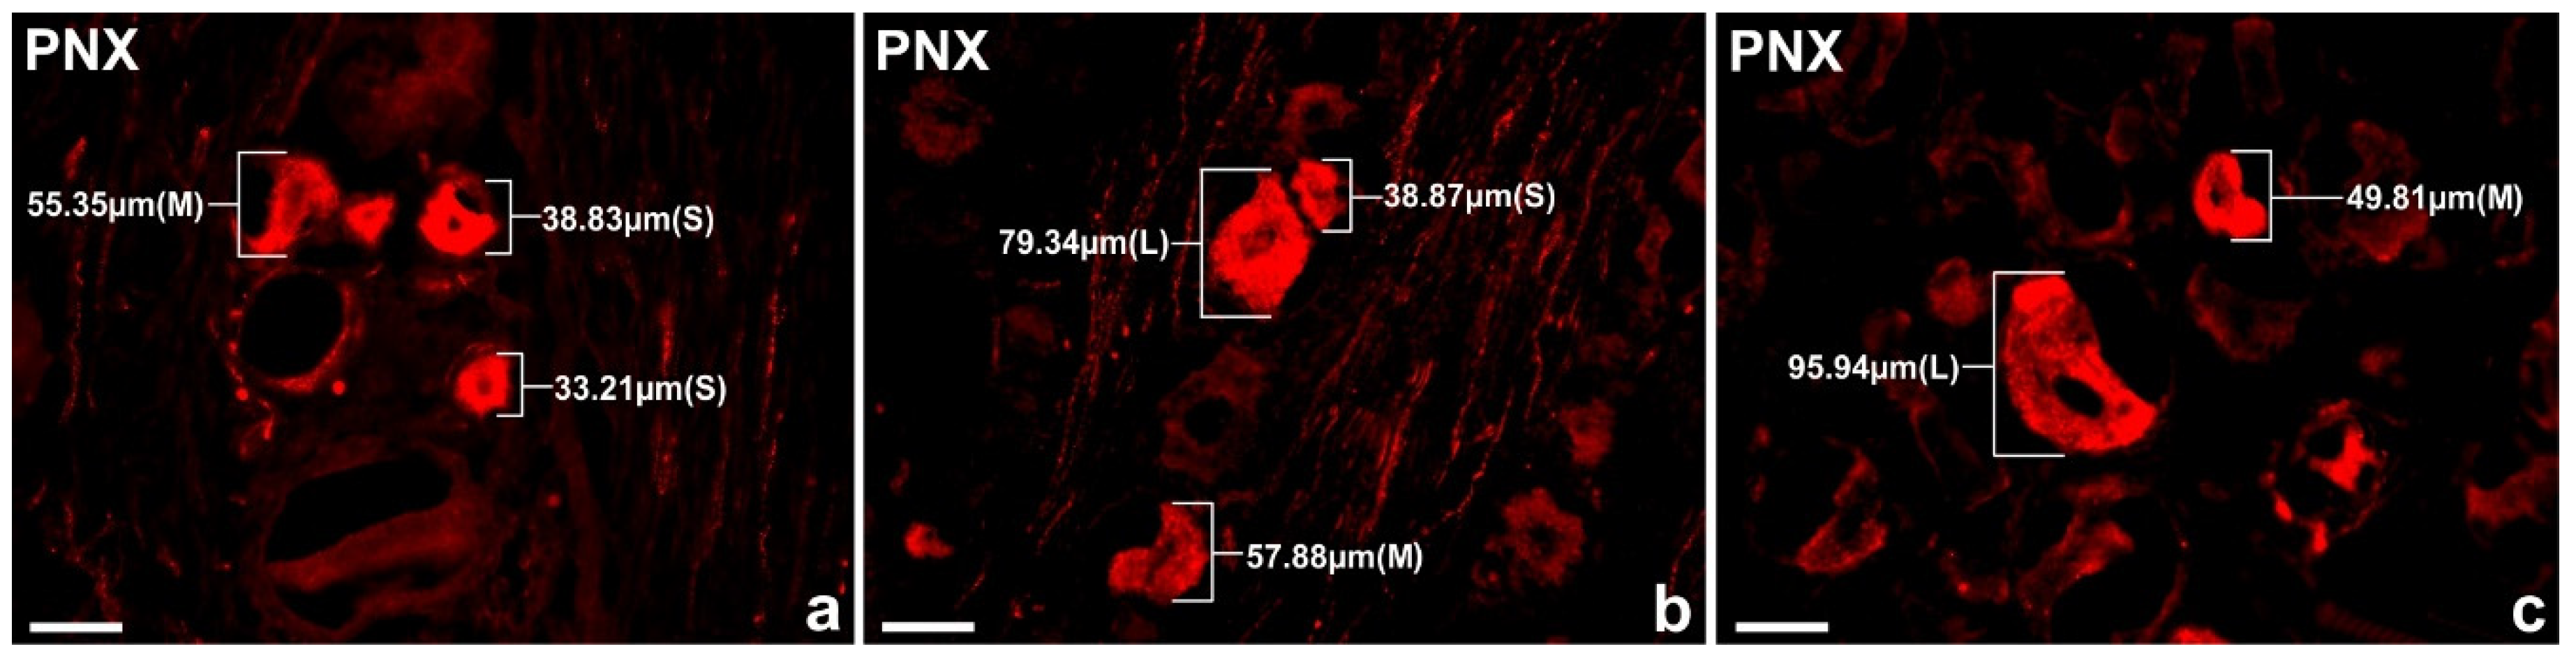
Figure 6.
A schematic diagram of DRG section showing its arbitrary division into topographical domains, in which the occurrence and relative frequency of PNX -containing sensory neurons was studied: P – peripheral domain, Cr – cranial domain, Cd - caudal domain, Cn – central domain of the DRG, Md - middle ganglion area; section from the a) proximal b) middle and c) distal part of the ganglion.
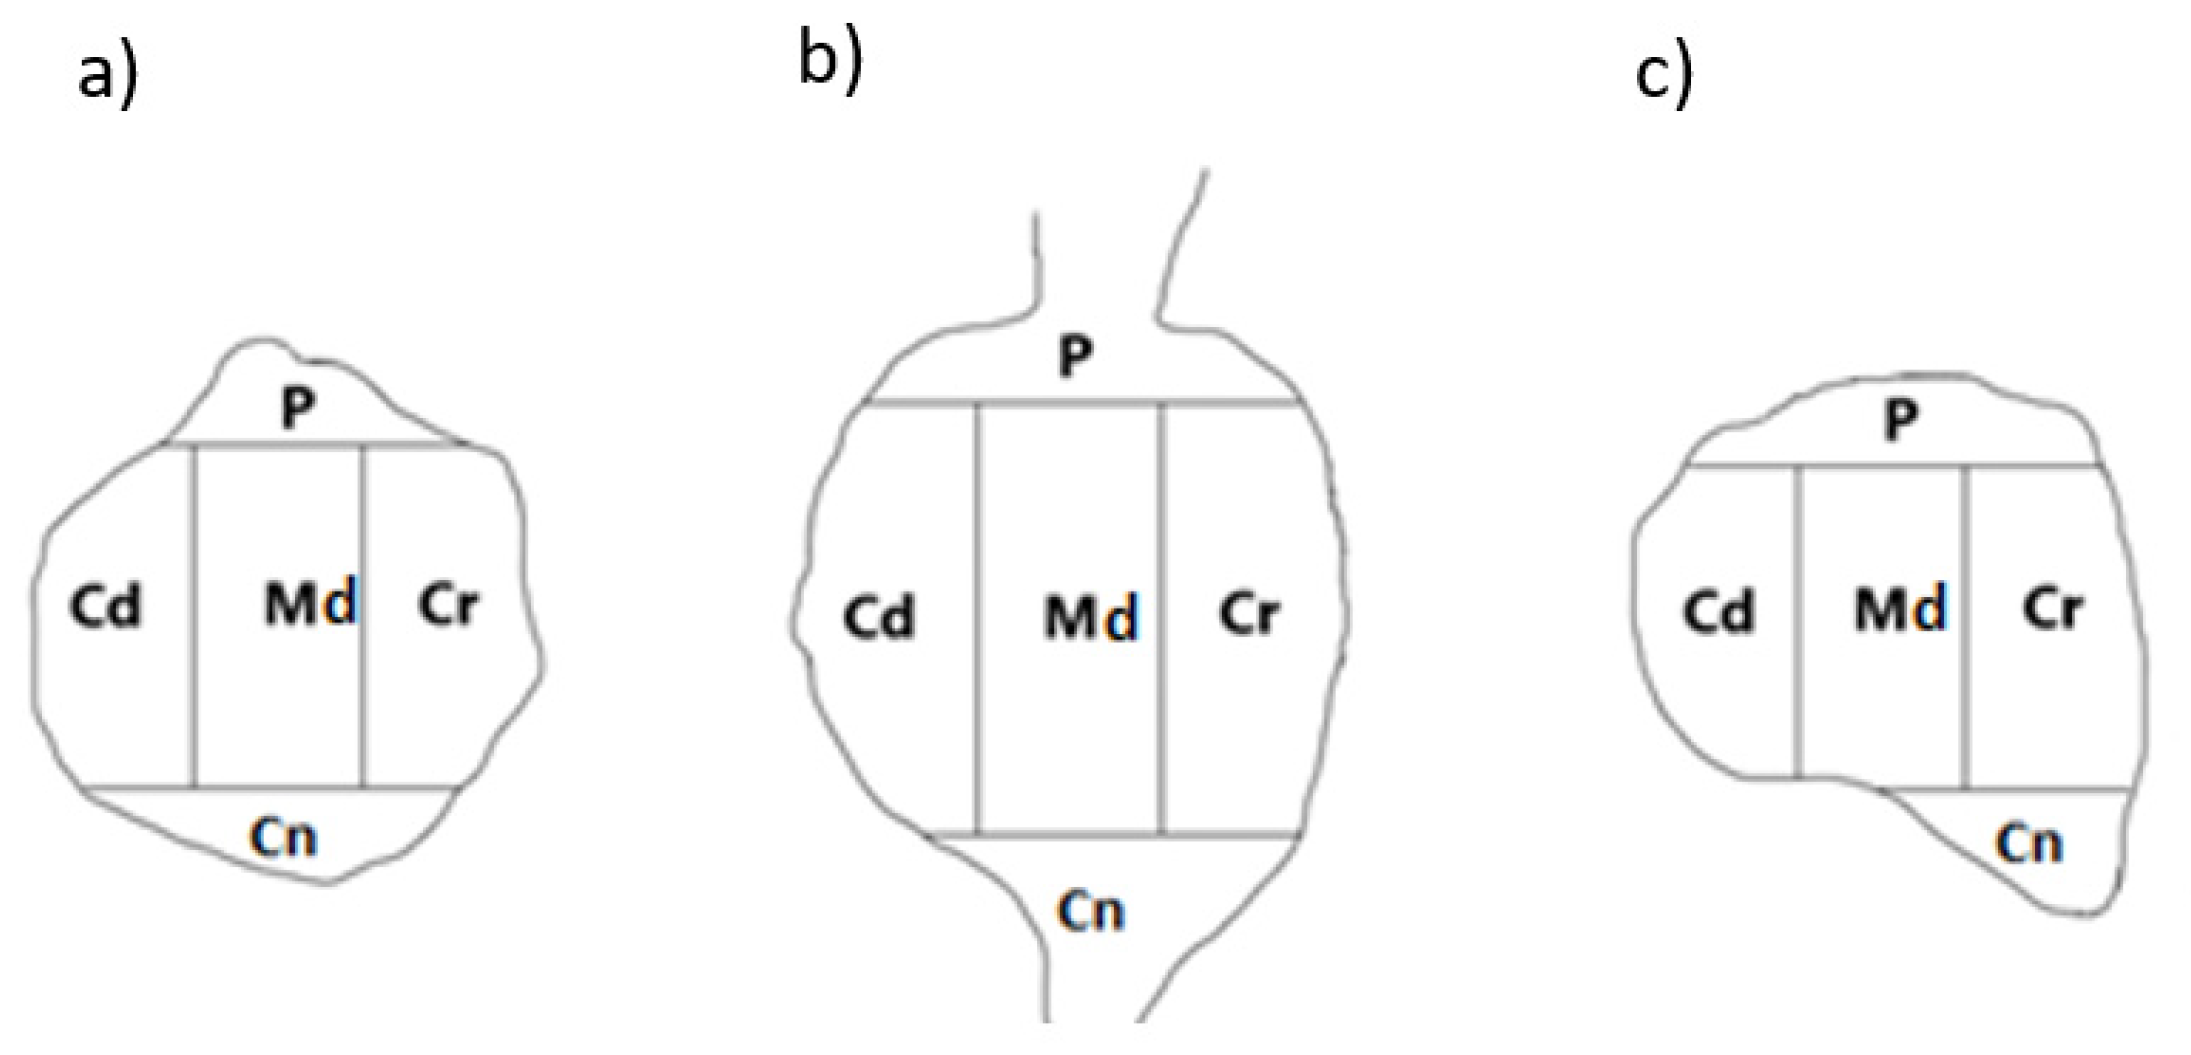
Figure 7.
Representative images of the DRG sensory neurons. All the images were taken separately in green (FITC; a,c,e,g,i,k,m,o) and red (CY3; b,d,f,h,j,l,n,p) fluorescent channels. Long arrows represent PNX+ cells (b,d,f,h,j,l,n,p) that simultaneously contained: a) CGRP, c) SP, e) nNOS, g) GAL, i) CRT, k) PACAP, m) CART, o) SOM; arrowheads represent DRG PNX+ sensory nerve cells (d,f,h,j,l,n,p) which were simultaneously immunonegative to CGRP (a), SP (c), nNOS (e), GAL (g), CRT (i), PACAP (k), CART (m), SOM (o). Bar in all the images—50 μm.
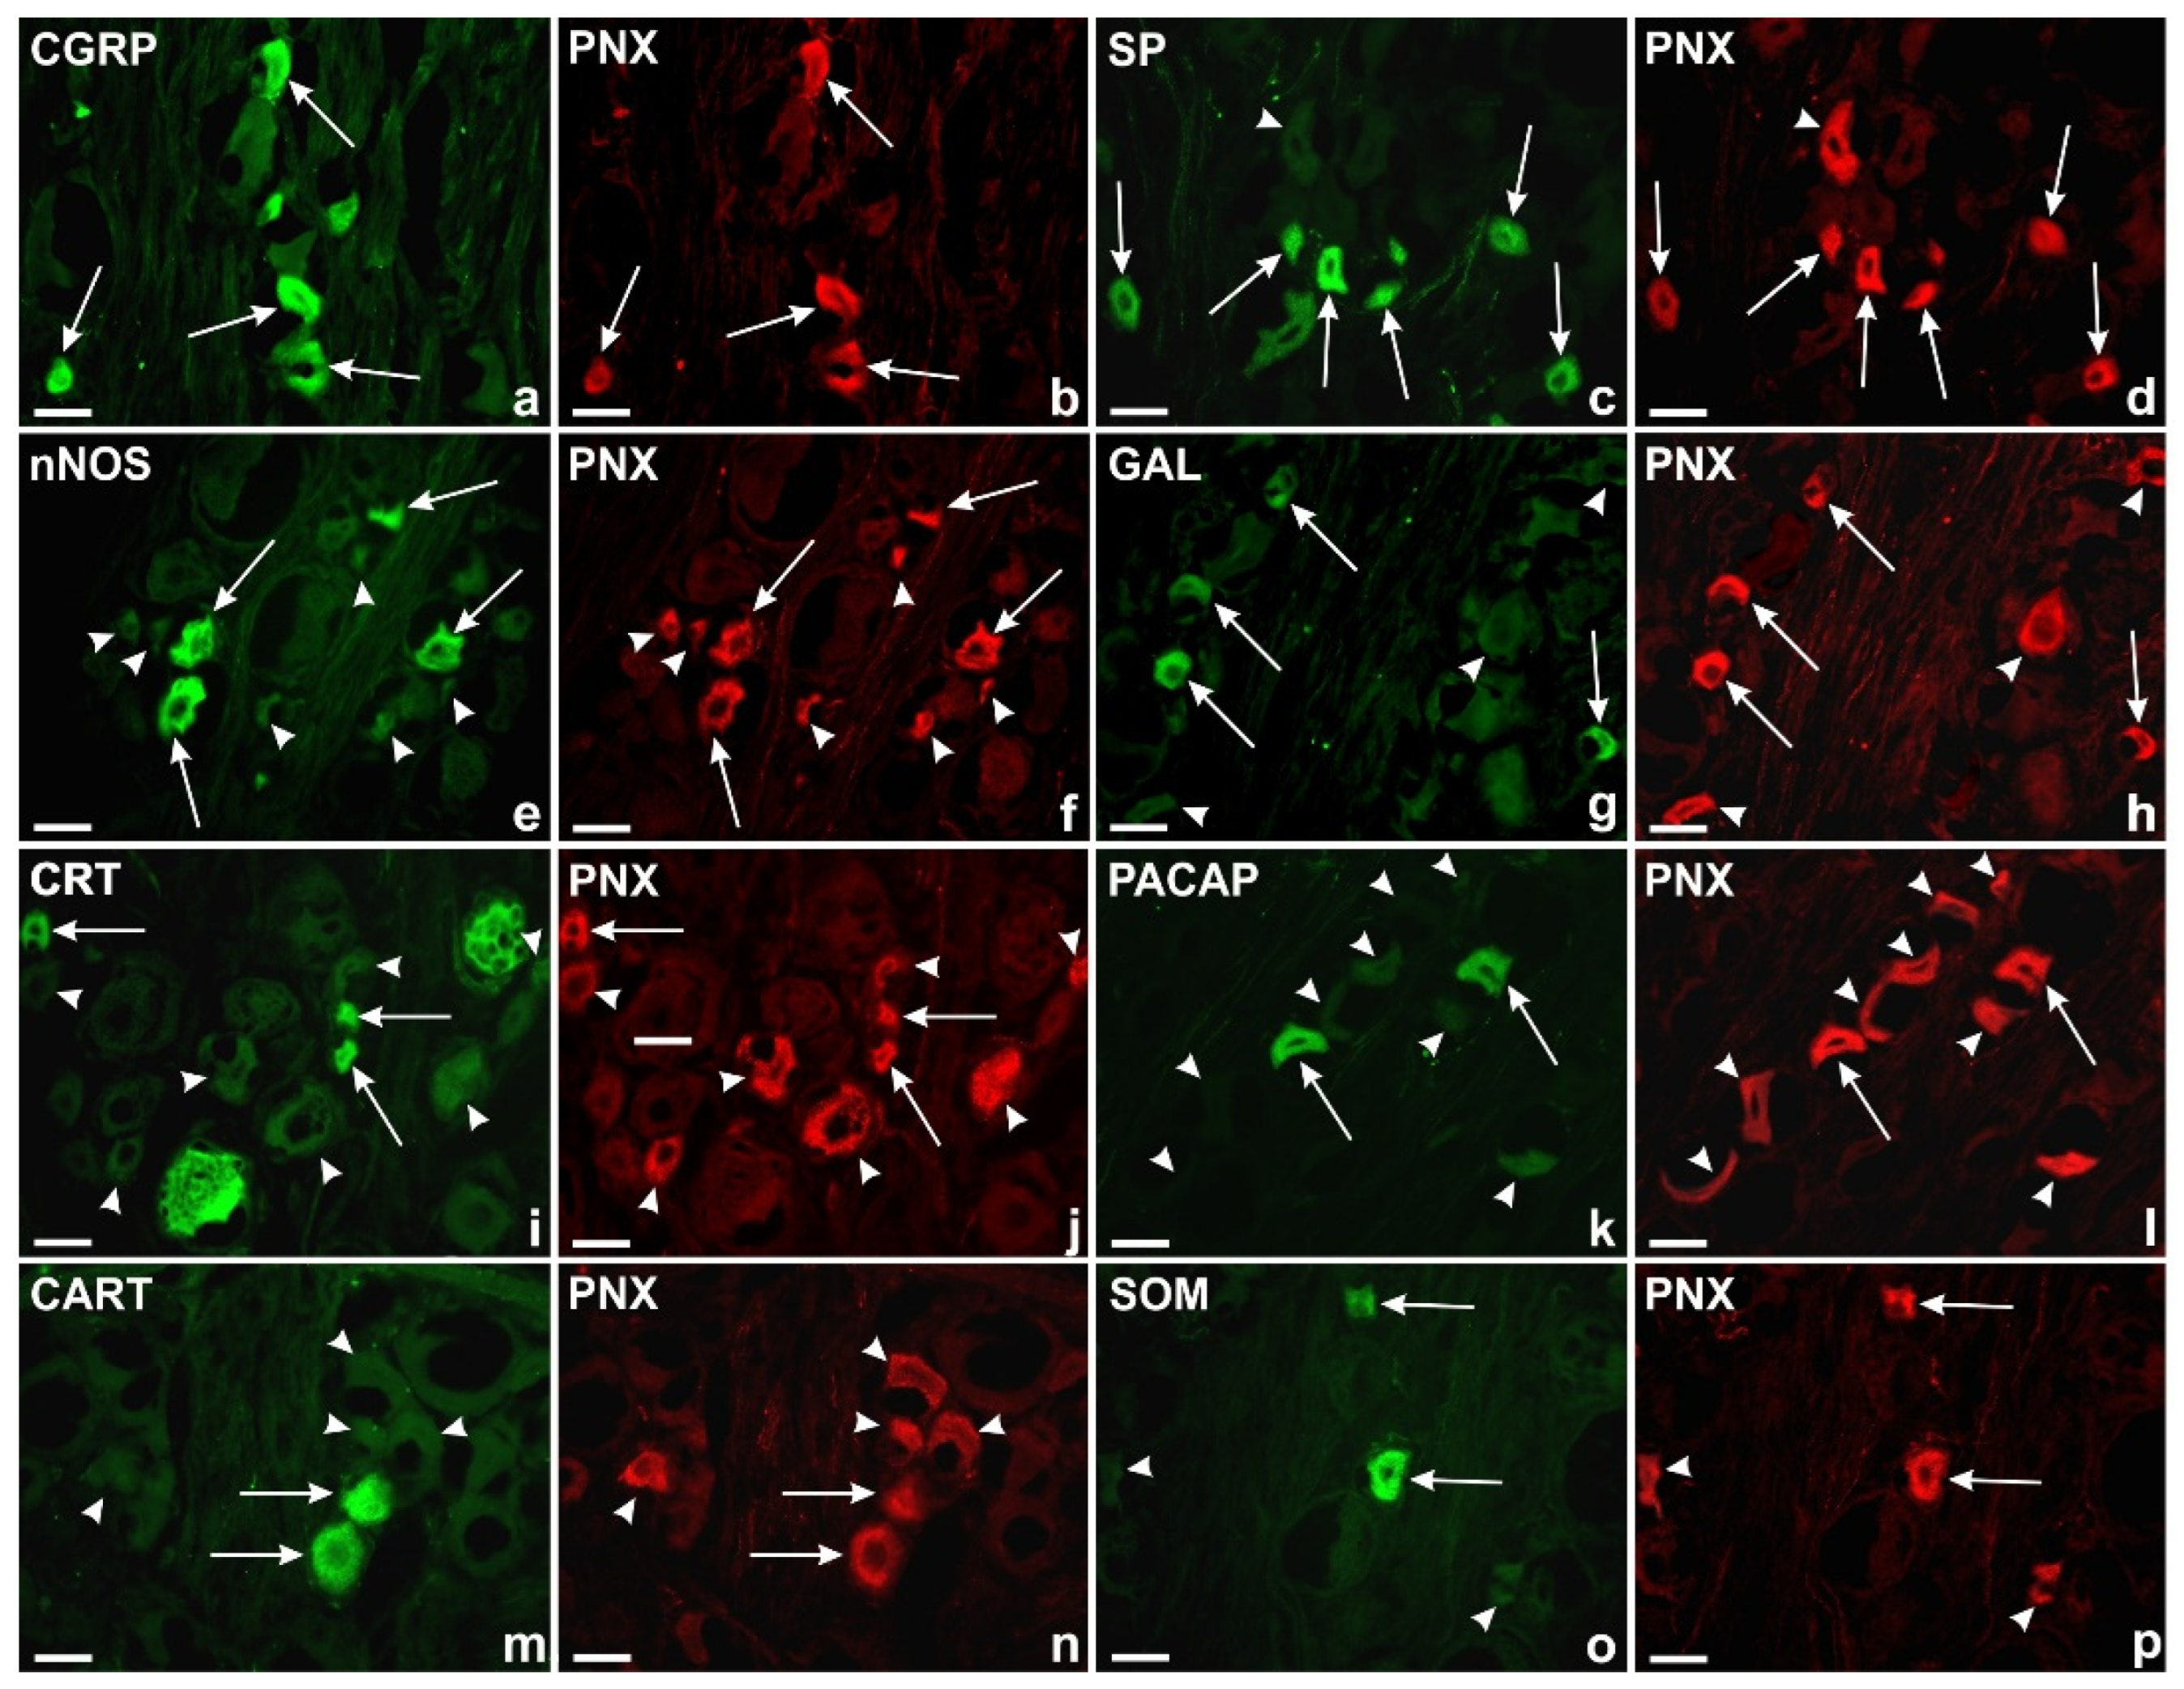
Figure 8.
Percentages of distribution pattern of PNX+ neurons containing the individual neurotransmitters in different domains (P, Cr, Cd, Cn and Md) of the DRG: a) PNX+/CGRP+ sensory neurons, b) PNX+/SP+ sensory neurons, c) PNX+/nNOS+ sensory neurons, d) PNX+/GAL+ sensory neurons, e) PNX+/CRT+ sensory neurons, f) PNX+/PACAP+ sensory neurons, g) PNX+/CART+ sensory neurons, h) PNX+/SOM+ sensory neurons.
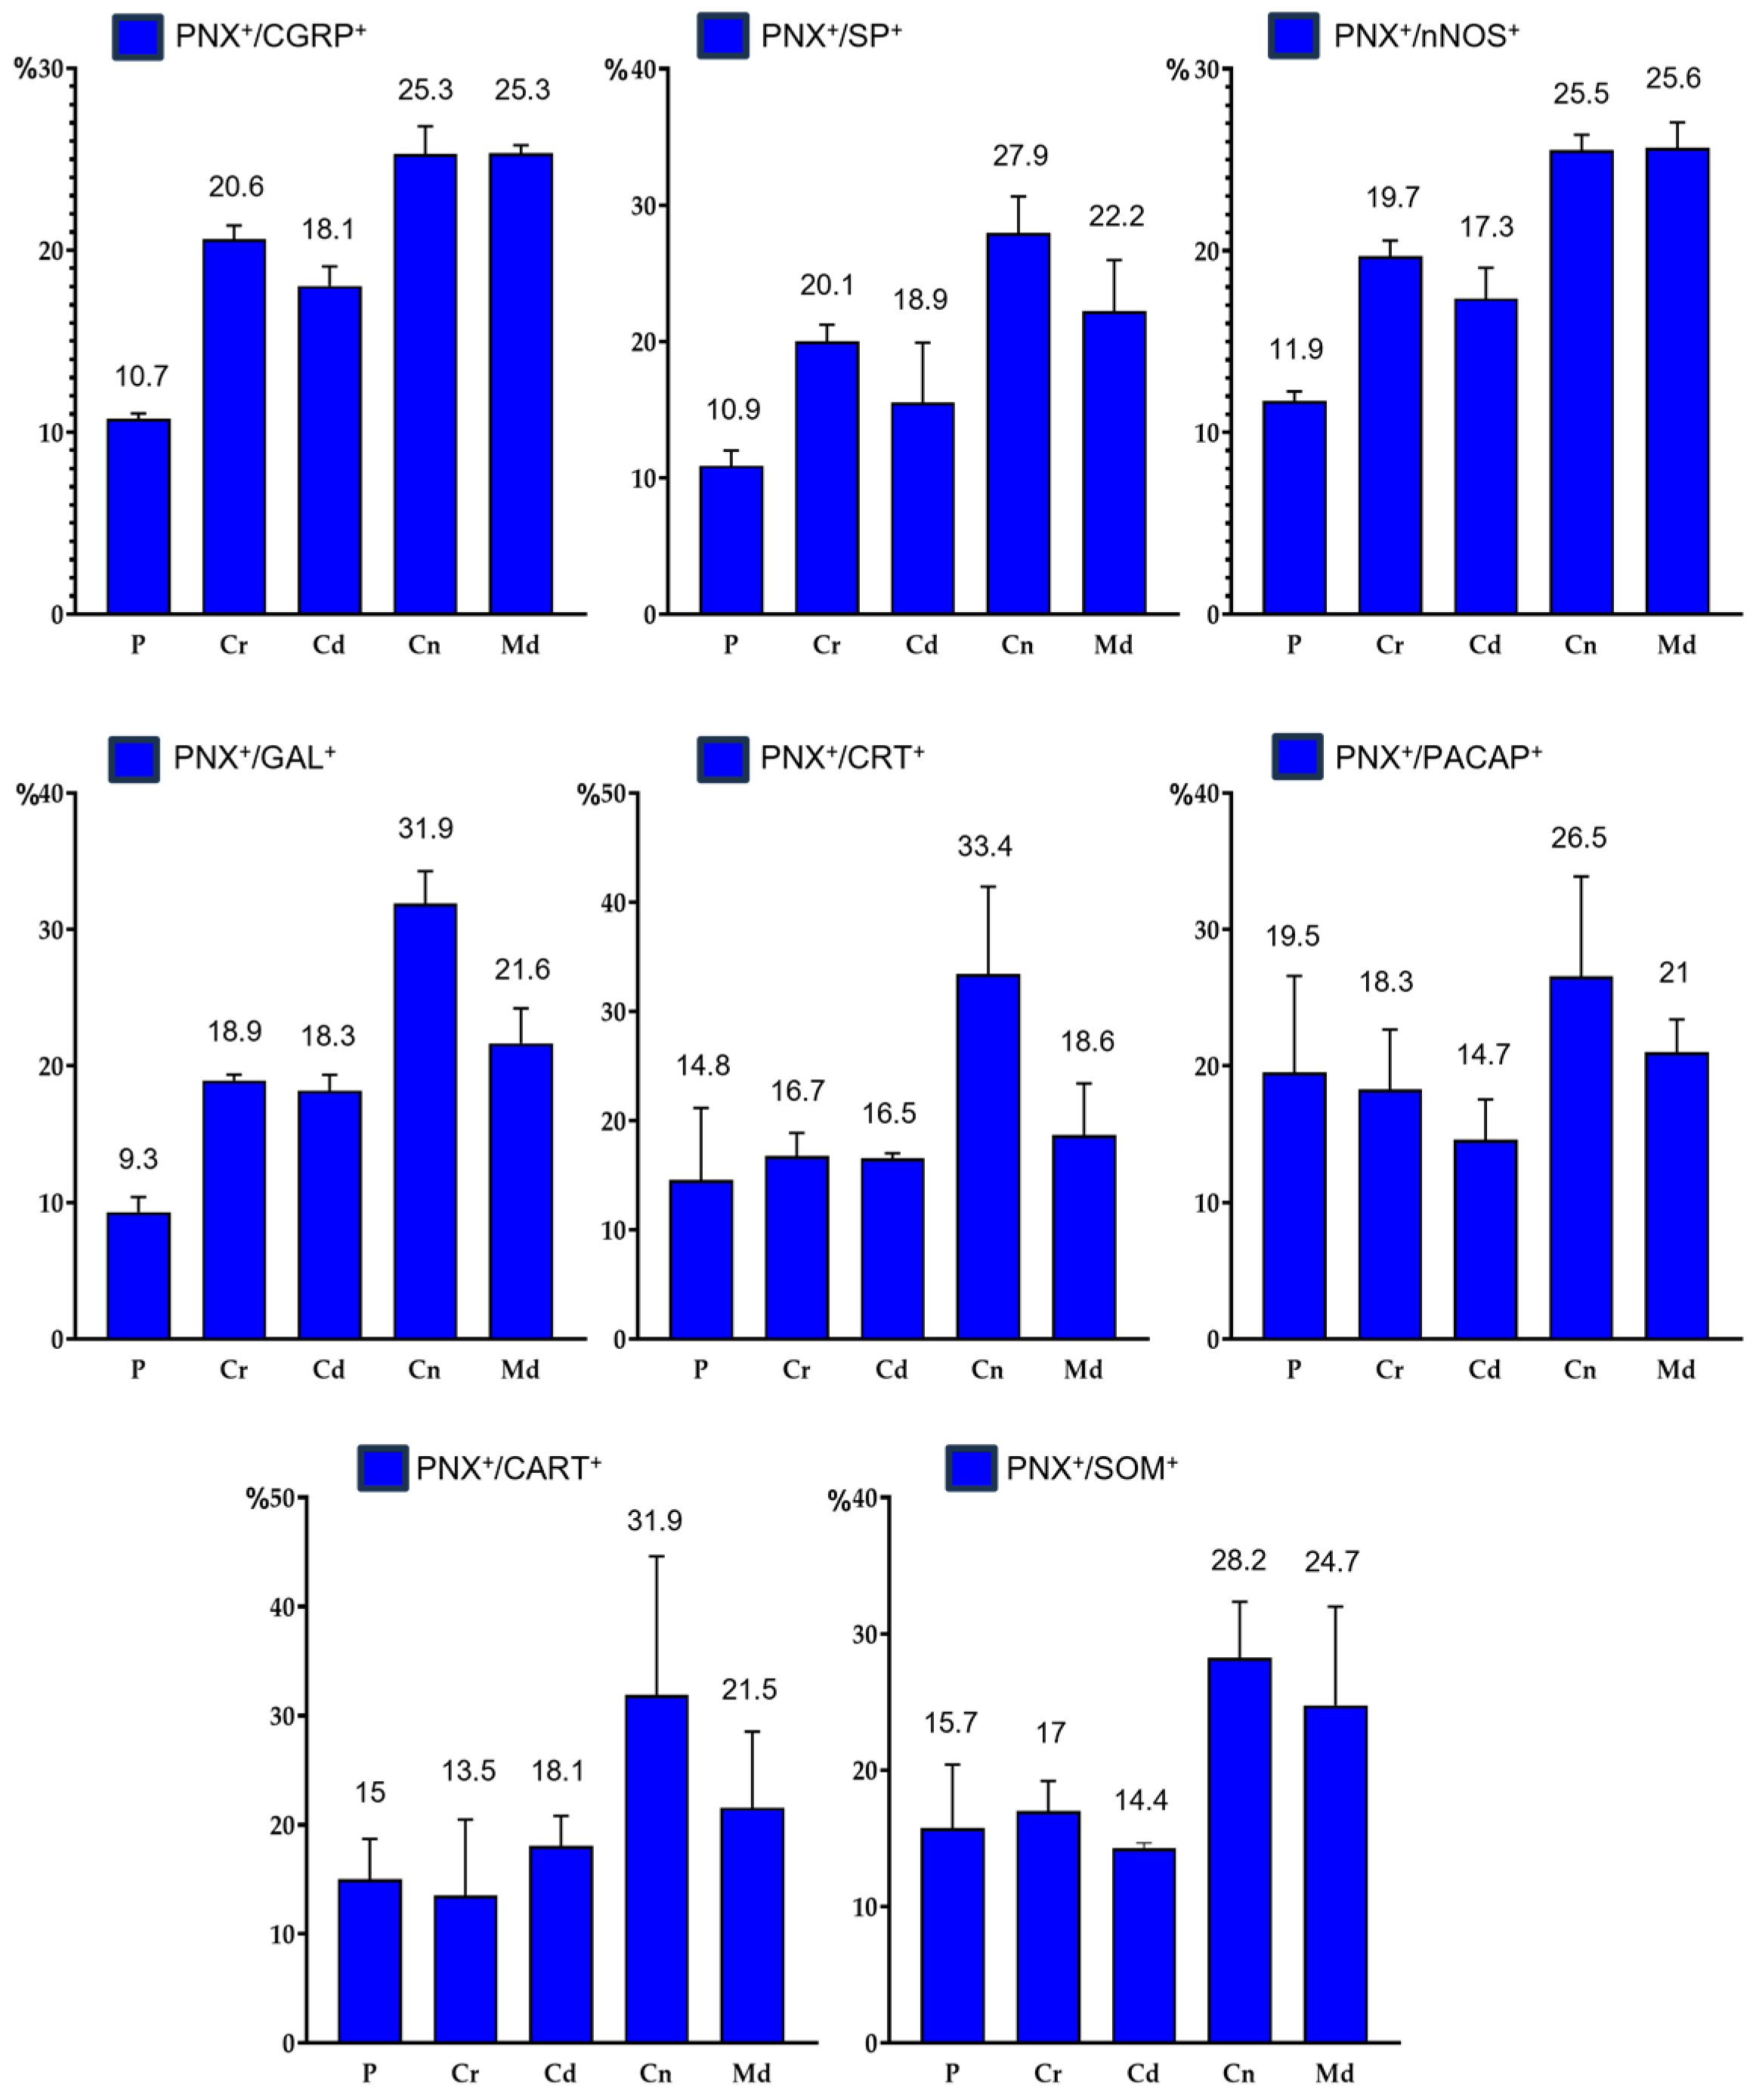
Figure 9.
Relative frequency of differentialy sized PNX+/PACAP+ perikarya found in DRG of the C, Th, L and S spinal cord segments. Data expressed as mean ± SD. Arrow pointed out statistically significant differences: * p < 0.05, ** p = 0.005.
Figure 9.
Relative frequency of differentialy sized PNX+/PACAP+ perikarya found in DRG of the C, Th, L and S spinal cord segments. Data expressed as mean ± SD. Arrow pointed out statistically significant differences: * p < 0.05, ** p = 0.005.
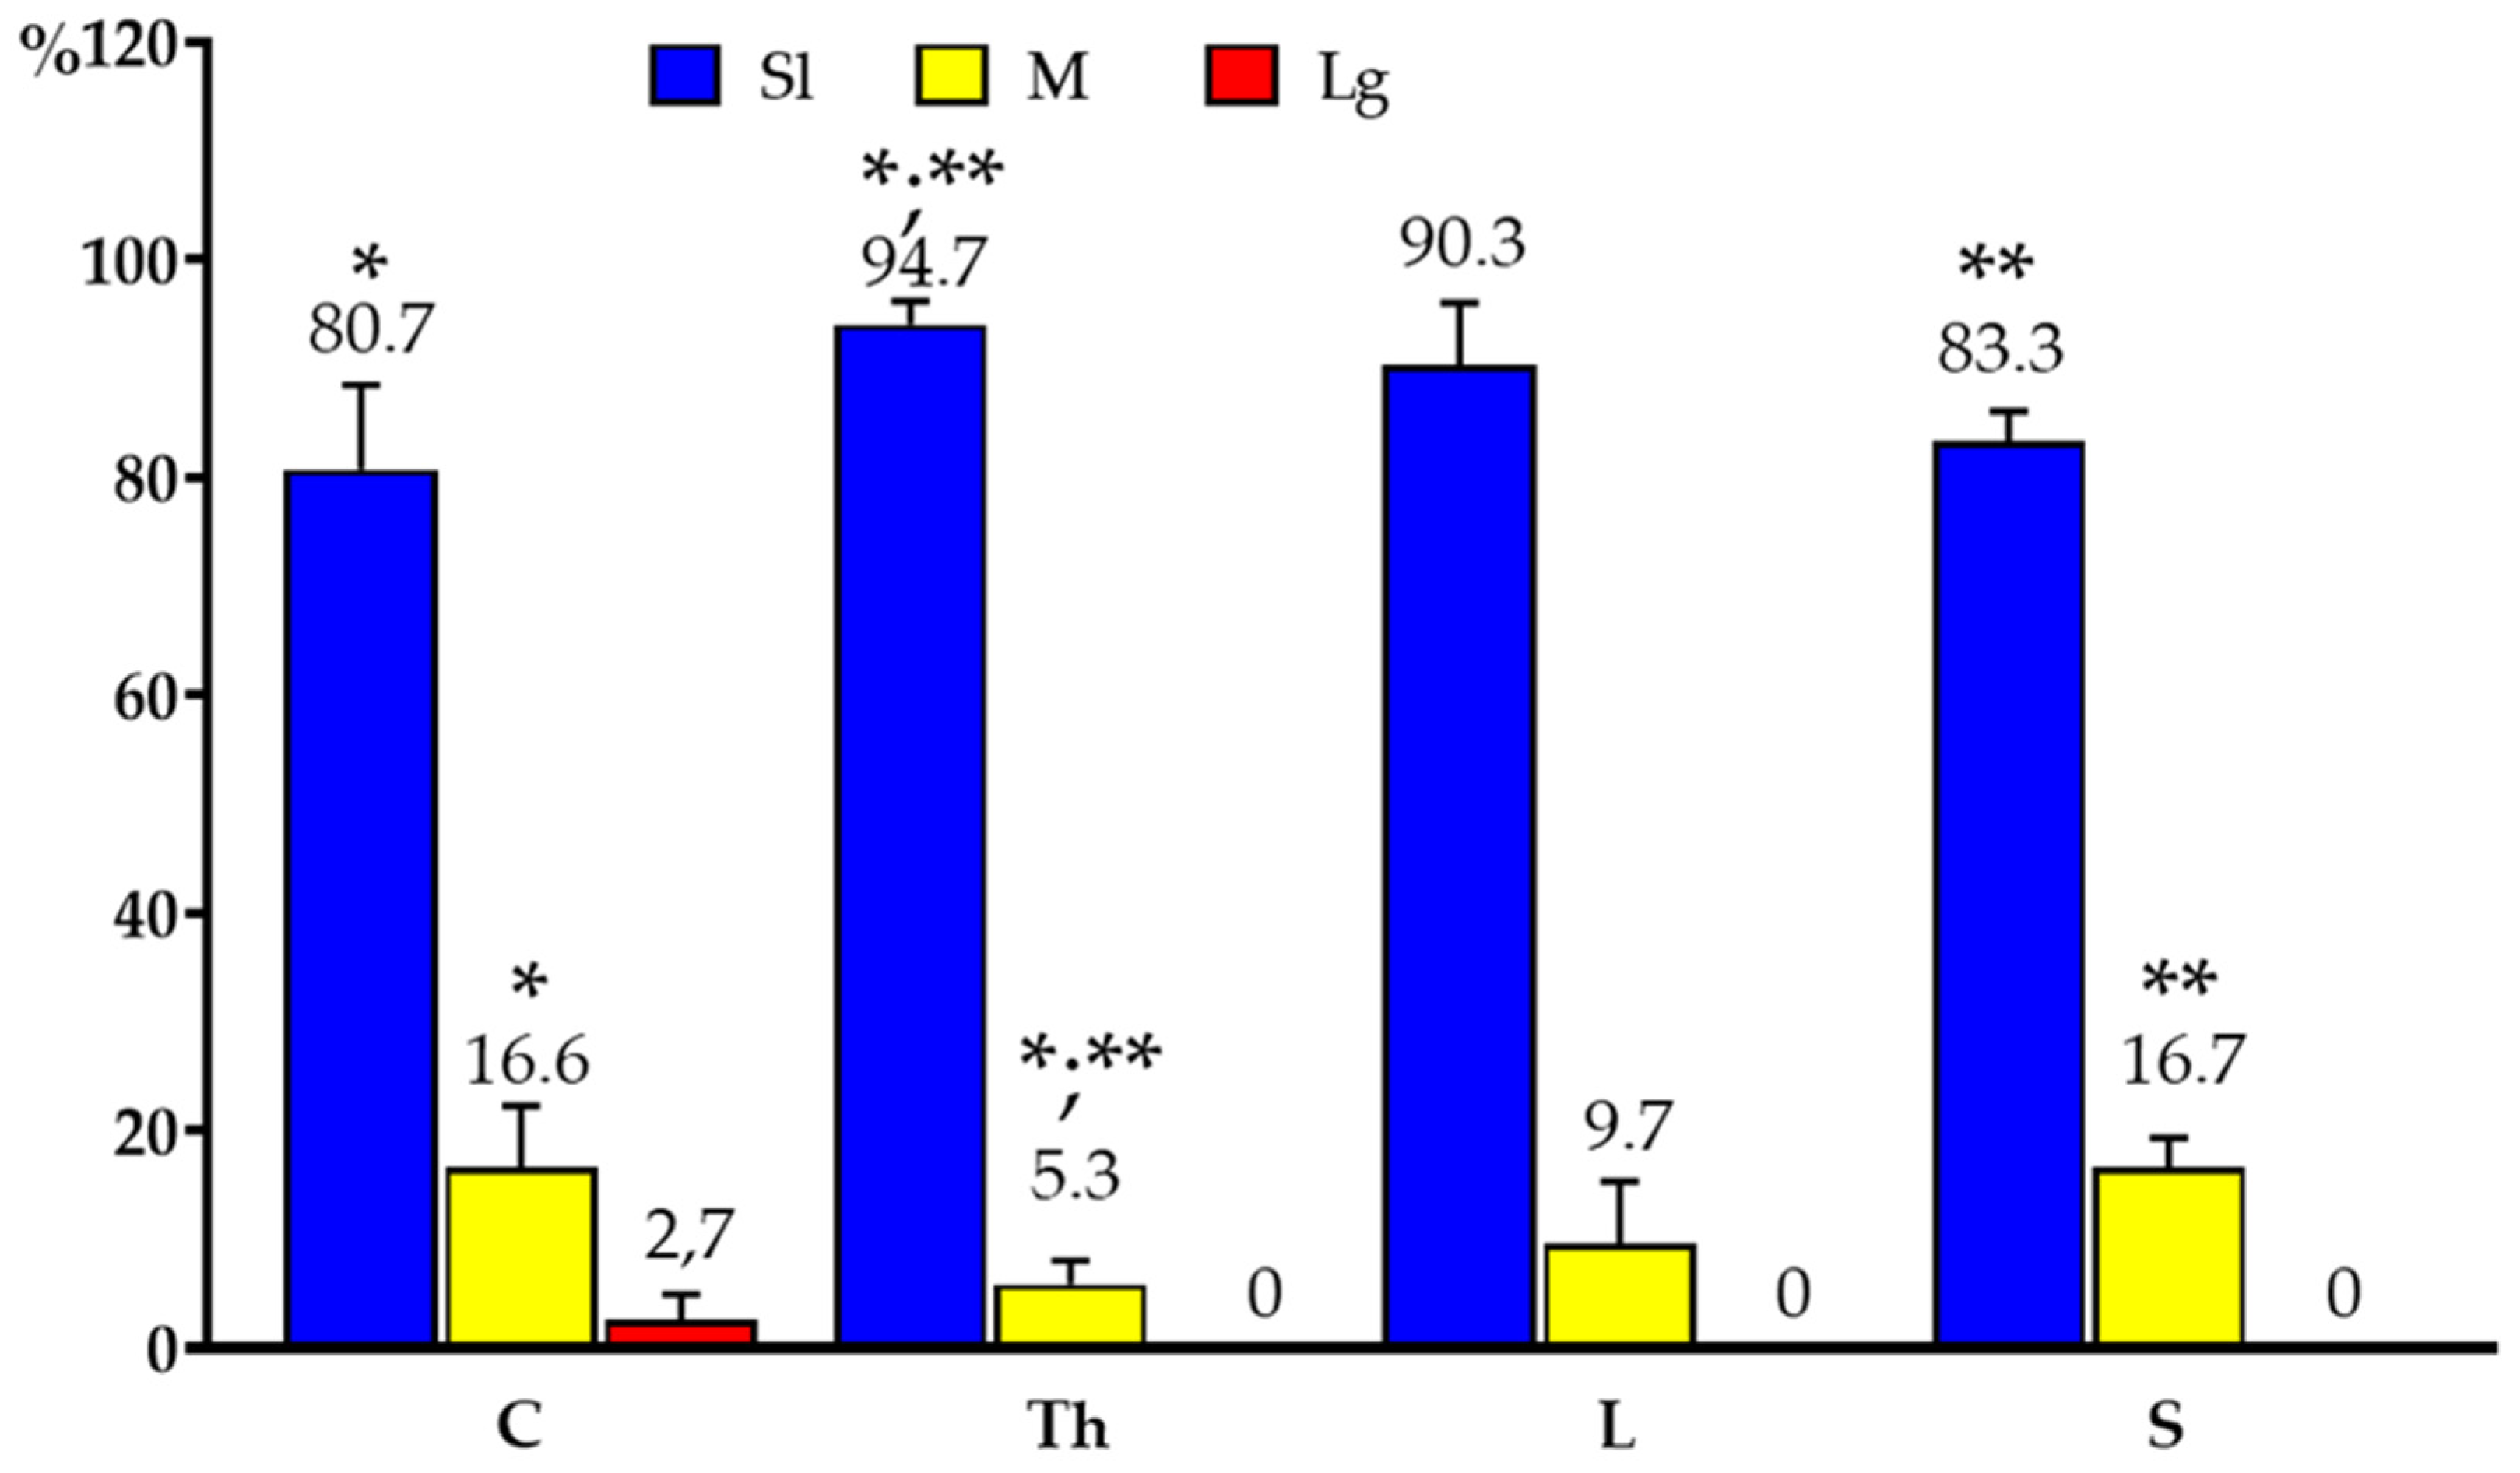

Table 1.
List of primary antisera and secondary reagents used in the study: cocaine and amphetamine regulated transcript (CART), calcitonin gene-related peptide (CGRP), calretynin (CRT), galanin (GAL), neuronal nitric oxide synthase (nNOS), pituitary adenylate cyclase-activating polypeptide (PACAP), protein gene product 9.5 (PGP 9.5), phoenixin-14 (PNX), somatostatin (SOM), substance P (SP), fluorescein isothiocyanate (FITC), streptavidin (CY3).
| Antigen | Code | Dilution | Host | Supplier |
|---|---|---|---|---|
| Primary Antibodies | ||||
| CART | MAB 163 | 1:1000 | Mouse | R&D Systems, Germany |
| CGRP | T-5027 | 1:800 | Guinea pig | Peninsula Laboratories, San Carlos, CA, USA |
| CRT | 6B3 | 1:2000 | Mouse | SWANT, Switzerland |
| GAL | T-5036 | 1:1500 | Guinea pig | Peninsula Laboratories, San Carlos, CA, USA |
| nNOS | N2280 | 1:200 | Mouse | Sigma-Aldrich, St. Louis, MO, USA |
| PACAP | T-5039 | 1:1000 | Guinea pig | Peninsula Laboratories, San Carlos, CA, USA |
| PGP 9.5 | 7863-2004 | 1:5000 | Mouse | Biogenesis, United Kingdom |
| PNX | H-079-01 | 1:7000 | Rabbit | Phoenix Pharmaceuticals Inc, Burlingame, CA, USA, |
| SOM | MAB 354 | 1:50 | Rat | Merck Millipore, Temecula, CA, USA |
| SP | 8450-0004 | 1:200 | Rat | Bio-Rad, Kidlington, UK |
| Secondary reagents | ||||
| CY3-conjugated anti-rabbit | 711-166-152 | 1:700 | Donkey | Jackson I.R.; USA, Baltimore Pike |
| FITC-conjugated anti-mouse IgG | 715-096-151 | 1:800 | Donkey | Jackson I.R.; USA, Baltimore Pike |
| FITC-conjugated anti-guinea pig IgG | 706-095-148 | 1:800 | Donkey | Jackson I.R.; USA, Baltimore Pike |
| FITC-conjugated anti-rat IgG | 712-095-153 | 1:400 | Donkey | Jackson I.R.; USA, Baltimore Pike |
Table 2.
Double staining combinations employed in this study.
| PRIMARY ANTIBODY | PRIMARY ANTYBODY | SECONDARY ANTIBODY |
|---|---|---|
| PNX (rabbit) | CART (mouse) | CY3 (rabbit), FITC (mouse) |
| PNX (rabbit) | CGRP (guinea pig) | CY3 (rabbit), FITC (guinea pig) |
| PNX (rabbit) | CRT (mouse) | CY3 (rabbit), FITC (mouse) |
| PNX (rabbit) | GAL (guinea pig) | CY3 (rabbit), FITC (guinea pig) |
| PNX (rabbit) | nNOS (mouse) | CY3 (rabbit), FITC (mouse) |
| PNX (rabbit) | PACAP (guinea pig) | CY3 (rabbit), FITC (guinea pig) |
| PNX (rabbit) | PGP (mouse) | CY3 (rabbit), FITC (mouse) |
| PNX (rabbit) | SOM (rat) | CY3 (rabbit), FITC (rat) |
| PNX (rabbit) | SP (rat) | CY3 (rabbit), FITC (rat) |
Table 3.
List of antigens used in pre-absorption test.
| Antigen | Code | Dilution | Supplier |
|---|---|---|---|
| CART | MAB0041 | 1:1000 | R&D Systems, Germany |
| CGRP | T-4030 | 1:800 | Peninsula Laboratories, San Carlos, CA, USA |
| CRT | 6-His human calretinin (recombinant) Lot No.: 22 |
1:2000 |
SWANT, Switzerland |
| GAL | T-4862 | 1:1500 | Peninsula Laboratories, San Carlos, CA, USA |
| nNOS | N3033 | 1:200 | Sigma, St. Louis, MO, USA |
| PACAP | A9808 | 1:1000 | Sigma, St. Louis, MO, USA |
| PNX | 079-01 | 1:7000 | Phoenix Pharmaceuticals Inc; Burlingame; Kalifornia; USA |
| SOM | S9129 | 1:50 | Sigma-Aldrich, St. Louis, MO, USA |
| SP | S6883 | 1:200 | Sigma-Aldrich, St. Louis, MO, USA |
Table 4.
Relative frequency of PNX-positive (PNX+) neuronal profiles located in the left and right dorsal root ganglia (DRG) of the cervical (C), thoracic (Th), lumbar (L) and sacral (S) levels of the spinal cord. Data expressed as mean ± standard deviation (SD).
Table 4.
Relative frequency of PNX-positive (PNX+) neuronal profiles located in the left and right dorsal root ganglia (DRG) of the cervical (C), thoracic (Th), lumbar (L) and sacral (S) levels of the spinal cord. Data expressed as mean ± standard deviation (SD).
| Segments of the Spinal Cord (%) | |||||||||||
|---|---|---|---|---|---|---|---|---|---|---|---|
| DRG | C1 | C4 | C7 | Th1 | Th7 | Th15 | L1 | L3 | L6 | S1 | S3 |
| left | 21.5 ± 3.9 |
17.5 ± 3.1 |
21.9 ± 1.7 |
16.2 ± 2.0 |
17.3 ± 0.7 |
15.4 2.3 |
17.8 ± 2.4 |
16.3 ± 0.8 |
23.3 ± 3.6 |
21.6 ± 2.0 |
13.3 ± 4.6 |
| right | 18.5 ± 7.2 |
21.1 ± 6.6 |
20.9 ± 1.0 |
18.1 ± 1.9 |
21.7 ± 0.6 |
19.3 ± 3.7 |
15.7 ± 4.1 |
17.6 ± 2.0 |
25.8 ± 1.2 |
24.6 ± 0.9 |
16.7 ± 7.6 |
Table 5.
Percentages of PNX+ neuronal populations of differently sized (small – Sl; medium - M; large - Lg) located in the left and right DRG of the C, Th, L and S segments of the spinal cord. Data expressed as mean ± SD.
Table 5.
Percentages of PNX+ neuronal populations of differently sized (small – Sl; medium - M; large - Lg) located in the left and right DRG of the C, Th, L and S segments of the spinal cord. Data expressed as mean ± SD.
| Segments of the Spinal Cord (%) | ||||||||||||
|---|---|---|---|---|---|---|---|---|---|---|---|---|
| C | Th | L | S | |||||||||
| DRG | Sl | M | Lg | Sl | M | Lg | Sl | M | Lg | Sl | M | Lg |
| left | 74.7 ± 3.1 |
23.9 ± 2.3 |
1.4 ± 0.9 |
70.6 ± 3.1 |
28.5 ± 2.9 |
0.9 ± 0.3 |
75.4 ± 5.9 |
23.8 ± 5.8 |
0.8 ± 0.6 |
76.3 ± 1.0 |
21.9 ± 0.8 |
1.8 ± 0.2 |
| right | 76.7 ± 3.1 |
22.1 ± 2.9 |
1.2 ± 0.6 |
71.4 ± 4.9 |
27.8 ± 4.7 |
0.8 ± 0.7 |
72.4 ± 5.2 |
26.6 ± 5.2 |
1.0 ± 0.6 |
75.4 ± 4.8 |
22.5 ± 4.8 |
2.1 ± 0.9 |
Table 6.
Percentages of intraganglionic distribution pattern of PNX+ neuronal populations located in the bilateral DRG of the C, Th, L and S segments of the spinal cord. Data expressed as mean ± SD.
Table 6.
Percentages of intraganglionic distribution pattern of PNX+ neuronal populations located in the bilateral DRG of the C, Th, L and S segments of the spinal cord. Data expressed as mean ± SD.
| Segments of Spinal Cord (%) | ||||||||
|---|---|---|---|---|---|---|---|---|
| DRG Subdomains |
C | Th | L | S | ||||
| Left | Right | Left | Right | Left | Right | Left | Right | |
| P | 15.1 ± 2.7 |
19.4 ± 2.1 |
12.1 ± 2.3 |
11.2 ± 1.8 |
10.7 ± 0.7 |
11.3 ± 2.0 |
11.3 ± 2.1 |
10.6 ± 1.3 |
| Cr | 20.9 ± 1.7 |
18.7 ± 1.2 |
20.4 ± 1.7 |
22.1 ± 1.6 |
20.1 ± 1.4 |
18.5 ± 3.8 |
20.4 ± 1.9 |
21.3 ± 4.2 |
| Cd | 17.3 ± 3.2 |
16.6 ± 1.5 |
17.4 ± 1.9 |
19.1 ± 2.4 |
19.2 ± 3.5 |
19.5 ± 1.9 |
18.1 ± 1.4 |
19.4 ± 4.1 |
| Cn | 24.2 ± 5.0 |
25.1 ± 3.9 |
26.1 ± 4.5 |
26.3 ± 1.8 |
27.9 ± 5.7 |
28.8 ± 4.5 |
31.1 ± 6.0 |
26.1 ± 6.7 |
| Md | 22.5 ± 1.5 |
20.2 ± 2.1 |
24.0 ± 1.3 |
21.3 ± 0.9 |
22.1 ± 5.8 |
21.9 ± 2.1 |
19.1 ± 1.9 |
22.6 ± 4.4 |
Table 7.
Relative frequency of differentialy sized (Sl, M, Lg) PNX+/CGRP+ perikarya found in DRG of the C, Th, L and S spinal cord segments. Data expressed as mean ± SD.
Table 7.
Relative frequency of differentialy sized (Sl, M, Lg) PNX+/CGRP+ perikarya found in DRG of the C, Th, L and S spinal cord segments. Data expressed as mean ± SD.
| Segments of the Spinal Cord (%) | ||||
|---|---|---|---|---|
| Size of DRG Cells | C | Th | L | S |
| Sl | 57.1 ± 21.4 | 71.5 ± 4.9 | 73.3 ± 11.4 | 75.1 ± 6.7 |
| M | 42.10 ± 21.7 | 27.0 ± 4.9 | 26.1 ± 11.9 | 21.3 ± 3.2 |
| Lg | 0.8 ± 0.7 | 1.5 ± 0.6 | 0.6 ± 0.6 | 3.6 ± 3.6 |
Table 8.
Relative frequency of differentialy sized PNX+/SP+ perikarya found in DRG of the C, Th, L and S spinal cord segments. Data expressed as mean ± SD.
Table 8.
Relative frequency of differentialy sized PNX+/SP+ perikarya found in DRG of the C, Th, L and S spinal cord segments. Data expressed as mean ± SD.
| Segments of the Spinal Cord (%) | ||||
|---|---|---|---|---|
| Size of DRG Cells | C | Th | L | S |
| Sl | 53.4 ± 25.1 | 59.8 ± 11.2 | 67.3 ± 13.4 | 67.7 ± 11.7 |
| M | 45.9 ± 25.3 | 39.4 ± 11.8 | 31.2 ± 12.7 | 31.0 ± 11.0 |
| Lg | 0.7 ± 0.6 | 0.8 ± 0.6 | 1.5 ± 0.9 | 1.3 ± 0.7 |
Table 9.
Relative frequency of differentialy sized PNX+/nNOS+ perikarya found in DRG of the C, Th, L and S spinal cord segments. Data expressed as mean ± SD.
Table 9.
Relative frequency of differentialy sized PNX+/nNOS+ perikarya found in DRG of the C, Th, L and S spinal cord segments. Data expressed as mean ± SD.
| Segments of the Spinal Cord (%) | ||||
|---|---|---|---|---|
| Size of DRG Cells | C | Th | L | S |
| Sl | 38.9 ± 15.2 | 43.4 ± 9.3 | 51.0 ± 3.4 | 50.9 ± 4.8 |
| M | 58.6 ± 15.1 | 56.1 ± 9.0 | 47.1 ± 4.6 | 47.9 ± 5.0 |
| Lg | 2.5 ± 3.3 | 0.5 ± 0.3 | 1.9 ± 1.2 | 1.2 ± 1.1 |
Table 10.
The relative frequency of differentialy sized PNX+/GAL+ perikarya found in DRG of the C, Th, L and S spinal cord segments. Data expressed as mean ± SD.
Table 10.
The relative frequency of differentialy sized PNX+/GAL+ perikarya found in DRG of the C, Th, L and S spinal cord segments. Data expressed as mean ± SD.
| Segments of the Spinal Cord (%) | ||||
|---|---|---|---|---|
| Size of DRG Cells | C | Th | L | S |
| Sl | 99.3 ± 1.0 | 97.3 ± 3.3 | 99.7 ± 0.5 | 100.0 |
| M | 0.7 ± 1.0 | 2.7 ± 3.3 | 0.3 ± 0.5 | 0.0 |
| Lg | 0.0 | 0.0 | 0.0 | 0.0 |
Table 11.
The relative frequency of differentialy sized PNX+/CRT+ perikarya found in DRG of the C, Th, L and S spinal cord segments. Data expressed as mean ± SD.
Table 11.
The relative frequency of differentialy sized PNX+/CRT+ perikarya found in DRG of the C, Th, L and S spinal cord segments. Data expressed as mean ± SD.
| Segments of the Spinal Cord (%) | ||||
|---|---|---|---|---|
| Size of DRG Cells | C | Th | L | S |
| Sl | 80.3 ± 2.6 | 98.1 ± 3.3 | 98.9 ± 1.9 | 99.5 ± 0.8 |
| M | 17.2 ± 2.5 | 1.8 ± 3.1 | 1.0 ± 1.7 | 0.5 ± 0.8 |
| Lg | 2.5 ± 4.1 | 0.1 ± 0.2 | 0.1 ± 0.1 | 0.0 |
Table 12.
Relative frequency of differentialy sized PNX+/PACAP+ perikarya found in DRG of the C, Th, L and S spinal cord segments. Data expressed as mean ± SD. Asterisks mark statistically significant differences: * p < 0.05, ** p = 0.005.
Table 12.
Relative frequency of differentialy sized PNX+/PACAP+ perikarya found in DRG of the C, Th, L and S spinal cord segments. Data expressed as mean ± SD. Asterisks mark statistically significant differences: * p < 0.05, ** p = 0.005.
| Segments of the Spinal Cord (%) | ||||
|---|---|---|---|---|
| Size of DRG Cells | C | Th | L | S |
| Sl | 80.7 ± 7.7 * |
94.7 ± 2.1 *;** |
90.3 ± 5.6 |
83.3 ± 2.7 ** |
| M | 16.6 ± 5.6 * |
5.3 ± 2.1 *;** |
9.7 ± 5.6 | 16.7 ± 2.7 ** |
| Lg | 2.7 ± 2.3 | 0.0 | 0.0 | 0.0 |
Table 13.
The relative frequency of differentialy sized PNX+/CART+ perikarya found in DRG of the C, Th, L and S spinal cord segments. Data expressed as mean ± SD.
Table 13.
The relative frequency of differentialy sized PNX+/CART+ perikarya found in DRG of the C, Th, L and S spinal cord segments. Data expressed as mean ± SD.
| Segments of the Spinal Cord (%) | ||||
|---|---|---|---|---|
| Size of DRG Cells | C | Th | L | S |
| Sl | 20.4 ± 6.2 | 66.6 ± 2.8 | 41.1 ± 5.5 | 49.2 ± 2.7 |
| M | 79.6 ± 6.2 | 33.4 ± 2.8 | 56.4 ± 1.0 | 50.8 ± 2.7 |
| Lg | 0.0 | 0.0 | 2.5 ± 1.4 | 0.0 |
Table 14.
The relative frequency of differentialy sized PNX+/SOM+ perikarya found in DRG of the C, Th, L and S spinal cord segments. Data expressed as mean ± SD.
Table 14.
The relative frequency of differentialy sized PNX+/SOM+ perikarya found in DRG of the C, Th, L and S spinal cord segments. Data expressed as mean ± SD.
| Segments of the Spinal Cord (%) | ||||
|---|---|---|---|---|
| Size of DRG Cells | C | Th | L | S |
| Sl | 82.5 ± 2.1 | 81.9 ± 2.3 | 86.9 ± 4.5 | 89.6 ± 9.0 |
| M | 17.5 ± 2.1 | 17.7 ± 1.7 | 12.8 ± 2.0 | 10.4 ± 9.0 |
| Lg | 0.0 | 0.4 ± 0.5 | 0.3 ± 1.8 | 0.0 |
Disclaimer/Publisher’s Note: The statements, opinions and data contained in all publications are solely those of the individual author(s) and contributor(s) and not of MDPI and/or the editor(s). MDPI and/or the editor(s) disclaim responsibility for any injury to people or property resulting from any ideas, methods, instructions or products referred to in the content. |
© 2023 by the authors. Licensee MDPI, Basel, Switzerland. This article is an open access article distributed under the terms and conditions of the Creative Commons Attribution (CC BY) license (http://creativecommons.org/licenses/by/4.0/).
Copyright: This open access article is published under a Creative Commons CC BY 4.0 license, which permit the free download, distribution, and reuse, provided that the author and preprint are cited in any reuse.


