
Submitted:
30 June 2023
Posted:
05 July 2023
You are already at the latest version
Abstract
Iapetus, a Saturn moon, shows the most differentiated albedo dichotomy of the Solar System. The dark leading side has a lower albedo than the bright trailing side. Spectral data on the visible light reveal the existence of two types of materials on the surface. The darkening in the leading side is thought to be originated by the presence of organic material and carbonaceous compounds on surface, while the trailing side is covered by water ice due to migration processes from the dark side. On airless bodies like Iapetus, the surface escape speed is greater than the speed of water molecules, resulting in the retention of a H2O atmosphere that allows some species to get diffused through it. Here, there were performed simulations of the evolution of the surface temperature for each of the two hemispheres of Iapetus. The results showed a slow yet steady increment of temperatures for both sides, with a steeper slope for the dark hemisphere. It was also simulated how much energy budget can be accumulated in both sides and its consequences. Finally, we calculated the diffusion coefficients for ammonia, methane, and water ice. The results let us infer how these compounds could evolve over time.
Keywords:
energy budget
; albedo dichotomy
; surface temperature
; organic material
; diffusion
1. Introduction
Iapetus has two different types of terrains on its surface. One is the dark material, concentrated in the leading side, possibly composed by carbonaceous elements and organic material, that are thought to come from Phoebe, Titan, or Hyperion [1,2]. The other one is the bright material that, in the trailing side, shows the spectral signature of water ice, which could have been originated from the migration of water as a result of temperature variations in both hemispheres [3]. The leading hemisphere presents a lower albedo than the trailing side, a fact that might have two possible explanations; the first one, through endogenic processes like flooding of magma, which evidence is proved by the existence of in-filled craters, and the second one due to the accretion of exogenous particles, where previous studies reveal the existence of dark material [1,4,5]. These divergences in the hemispheres make Iapetus the celestial body with the most notorious albedo dichotomy of the solar system. The dark hemisphere called Cassini Regio has a low albedo of 0.04 and the bright one an albedo of 0.39 [6]. The dark side is warmer than the bright side, facilitating the sublimation and volatile migration of compounds that could form and retain a fast exosphere [7].
Spectral data taken by the Visible and Infrared Mapping Spectrometer (VIMS) on board of the Cassini Mission detected a prominent presence of CO2 in the dark side [8]. On the other hand, [2] reported the concentration of some polycyclic aromatic hydrocarbon (PAH) molecules in a region of low albedo and an association of CH2 aliphatic hydrocarbons. There were also found concentrations of water ice placed in the dark regions far away from the apex, which are consistent with the thermal segregation of water ice at the darkest and warmest latitudes [9,10]. This might be a hint of an emplacement of dark material from an exogenous source. In this regard, [1] proposed a thermodynamic internal origin for the organic and carbonaceous material on the surface. Volatile compounds like ammonia have been also detected in the trailing hemisphere [7].
Dynamical dust models, like the one proposed by [11], suggest that deposition regions are either formed from the Phoebe’s dust ring, or this material could have been transported onto the moon from interplanetary dust [12]. Volatile frosts tend to create high albedos and prolong residence times, the sublimation of such volatile compounds and water molecules acts as a powerful coolant in the process of producing transient exospheres located at the impact places, where the pressure decreases symmetrically with the distance to the impact zone. During the formation of the fast exosphere, around 23% of created water molecules escape to space. Moreover, in the bright hemisphere, the sublimation of ice molecules is just possible during diurnal cycles [7].
Exospheres could act as a limit between the surface and the adjacent environment, which composition is based on a combination of gases released from the surface through various processes like thermal release or vaporization [13]. Those molecules emitted from the surface are ejected through trajectories until they make collisions again with the surface, altering the chemistry of the material present on the surface, and modifying the optical surface properties [14,15]. Here we assume that the sublimation of volatiles like ammonia, water ice, and methane contributes to the formation of an H2O exosphere on airless bodies like Iapetus [7,13], and the sublimation of water ice is two orders of magnitude higher on the dark side than in the bright one [16]. We also assume that the bright hemisphere is fully covered by pure water ice due to its migration from the dark side [3].
Studying the evolution of the surface temperature of Iapetus, and the influence of the energy budget, is crucial because it could help us to improve our understanding of the evolution over time of certain organic, and inorganic, compounds when they are present on airless bodies. Here, we consider a time window (1 Gyrs) that is wide enough to observe a variation in the temperature. Then we simulate how much energy budget can be concentrated on each hemisphere, considering different albedos [6], during the same time window. This has the purpose to figure out whether this contribution could be of help with the dispersion of species into the atmosphere on the moon [7,17]. Then, we calculate the diffusion coefficients for ammonia, methane, and water ice, based on the increment of the temperature obtained by the simulation. The aim of this study is to understand how these organic, and inorganic, compounds evolve in extreme environments, like the surface of Iapetus.
2. Materials and Methods
In this study, we use the Navier-Stokes Equations [18,19] to simulate the evolution of the surface temperature in a two-dimensional cartesian geometry for 1 Gyrs of model time. As is known, according to [19], the system of flows between the atmosphere, the soil and the ice is highly interactive, and introduces positive feedback. For example, if the ice on the bright side of Iapetus starts to melt, the ground it leaves bare absorbs solar radiation, so it gets hotter and more ice melts, which warms the atmosphere, which acts on the ice again.
The conservation of the equations for mass, momentum, and energy are solved on a staggered grid for a compressible fluid with an infinitive Prandtl number (a full description of these equations can be found, in e.g., in [20]). We fixed an initial surface temperature of 90 K for the dark side and 130 K for the bright side of Iapetus. Different albedos were also considered for each hemisphere, 0.04 and 0.39 respectively [6,11,21].
For the energy budget, we considered the effect of the eccentricity of the orbit of Iapetus around the Sun, the influence of emissivity and heat capacity of Saturn, the contribution of Saturn radiation and the internal heating from Iapetus. This study also takes into account the diurnal cycles in both hemispheres. For albedos, we selected the values described above [6]. In order to obtain the energy budget, we computed the net radiation, the ground heat flux, the sensible heat flux, and the latent heat flux (see Eq. (1)).
The diffusion coefficient can be estimated from the empirical relation of diffusion of species (H2O vapor, NH3 and CH4) in air proposed by [22], where they simplified the two theoretical equations of the kinetic theory of gases, derived by Stefan and Maxwell [23]. In our calculation, we modified the original empirical relation as:
Where 2·10-12 is a coefficient that we calculated assuming a column of homogeneous dark material overlaying ice of 1 cm [24], the collision diameter of the species in angstroms, the turbulence effect, the average atmospheric temperature at 110 K and the integral collision. We used a data mining process, through the application of modified genetic algorithms [25] to calculate the concentration (g/kg) of each species present in the atmosphere. It is necessary to highlight that data mining techniques uses multidimensional rotation, translation, reflection and transformation along with random tuple (ordered immutable set of elements “atmospheric species“ of the same or different types) shuffling and randomized expansion.
In base, the modified genetic algorithms used [25] consist in a parallel procedure that works as follows. The big data set that needs to be categorized is stored within a central storage unit. When the execution begins, individual sections are handled by separate mapping tasks. Each mapping task initially accesses the training dataset and proceeds to train the classifier. Subsequently, the trained classification model is employed to categorize the extensive dataset. The repeated training process for each mapping task should have minimal impact on computational performance since the training data is relatively small in comparison to the significant dataset, which is responsible for the majority of the processing time.
To calculate the concentration (g/kg) of each species present in the atmosphere, we identified the spectral signatures detected in the bands between 0.35 μm to 1.07 μm from the data taken by the VIMS instrument on board of the Cassini Mission. Then, we calculate the total number of moles per mole of air for each compound and multiply it by their molecular weight. In this way, we obtain the mass in grams for each species. Eq. (2) considers the molar fraction which is calculated by dividing the number of moles by the total number of moles of all species present in the air. In our case, we measured the sum of the moles of water ice, ammonia, carbon dioxide, and methane. For Iapetus, we found a total weight of one mol of air of around 17.48 g/mol. The atmosphere thickness model was assumed to play a dominant role in heat distribution. We also included the concentrations of moles in one mole per air of some compounds detected on the surface of Iapetus such as CO2, CH, and NH [26], in order to obtain the total molecular weight of species in the air. The results of these calculations are displayed in Table 1.
3. Results
We first describe, in section 3.1, the evolution of the surface temperature. In this model, the evolution of the temperature is treated as a transfer energy model. In section 3.2, we describe the outgoing thermal radiation and the incoming stellar radiation of the energy budget for both hemispheres. In this model, we consider both contributions, the one with the fluxes that can be retained on the surface and the ground heat flux that tends to escape into space. Finally, in section 3.3, we describe the diffusion coefficients found for water ice, ammonia, and methane.
3.1. Surface temperature evolution
Figure 1 illustrates the changes in surface temperature for the bright and dark hemispheres of Iapetus, considering that both the atmosphere and surface are in a state of chemical and phase equilibrium. The atmospheric structure is constructed from the bottom to the top, influenced by the interaction between the surface and atmosphere. The simulation shows that, for both sides of the moon, the temperature slightly and steadily increases from the onset up to the end of the model time (1 Gyrs). We initiated the temperature in the dark hemisphere to 90 K. The maximum temperature reached in this hemisphere is 128 K, which is marginally above the seasonal maximum temperature of 130 K conditioned by the apparent surface thermal inertia, as reported by [24], where the effects of the maximum temperature were neglected. Volatile compounds like the segregation of ammonia on the surface, and the fast vaporization of water ice due to the migration to the bright side, could influence the increment of this temperature [27,28]. Moreover, the increase in the temperature in our model is enough to represent a significant change in the surface thermal inertia on the dark side of Iapetus [21,29,30,31]. The dark hemisphere absorbs approximately 58% more solar radiation than the bright one [24,27]. Because of this percent of absorption, it is possible to infer that the thermal segregation of some organic, and inorganic, compounds on this side could play an important role in the surface alteration process [24].
For the bright side, the initial temperature was set at 130 K. Figure 1a shows the growth of this temperature up to 147 K, at the end of the simulation. Here, the temperature increases with a lower slope compared to the dark side one. This could be a consequence of the high albedo of 0.38, which makes its surface reflect more light [29,30,31] or, in other words, absorb less energy from light. The condensed water is highly reflective [32], and it is present on the bright side due to the migration from the dark hemisphere [3]. On the bright side, which is less emissive than the dark one, the diffuse scattering of water ice particles takes place [31]. Analysis of polarization in the bright side performed by [33], shows that this effect is deeper on surface, making it more sensitive to a diversity of scattering parameters like particle size, shape, surface texture, and reflectance of objects, thus making it difficult to interpret their differences. However, it is still possible to infer the diffusion of methane ice and water ice because the surface of Trans Neptunian Objects is dominated by these two compounds [34].
3.2. Energy budget
Figure 2a shows the outgoing thermal radiation and incoming stellar radiation, on the dark hemisphere of Iapetus, that has an albedo of 0.04 [6], over a time window of 1 Gyrs. At the very beginning of the simulation, due to changes in frost on the surface, the outgoing thermal radiation drops from roughly 10 W m-2 to 2 W m-2; then it bounces back to 2.8 W m-2 and, after some fluctuations between 2.7 W m-2 and 3.1 W m-2, it stabilizes to this value. On the other hand, Figure 2b displays the outgoing thermal radiation and incoming stellar radiation for the bright side, with an albedo of 0.39 [6]. Here, there were obtained values between 25 W m-2 and 29 W m-2 for the first million years, then it tends to be stable at 26 W m-2 of model time. For both hemispheres, the incoming stellar radiation is around 0.2 W m-2 (although slightly higher in the dark hemisphere), and it does not change over time. There is a notable difference of outgoing thermal radiation between the two hemispheres. The bright side is covered by water ice that, being reflective, is an obstacle for absorbing energy.
Previous analysis of the energy balance on Iapetus [24] shows that the thermal inertia for the dark terrain ranges between 11 J m-2 K-1 s-1/2 and 14.8 J m-2 K-1 s-1/2, while for the bright terrains it ranges between 15 J m-2 K-1 s-1/2 and 25 J m-2 K-1 s-1/2. These values allow some species, like water ice and carbon dioxide, which are assumed to be present in both sides, to have a slow mass rate, through both intermolecular and pore interactions. Our models show, in fact, that an airless surface with a low temperature cannot retain too much energy on surface; nonetheless, the small accumulation observed in the simulations (between 0.2 W m-2 and 2.8 W m-2) could provoke the volatilization of ammonia and methane, allowing for the diffusion in the atmosphere [7,24].
3.3. Diffusion coefficients of ammonia, methane and water ice
All the diffusion coefficients obtained in this work, for organic and inorganic compounds that grow at atmospheric temperatures ranging from 90 K to 130 K, are displayed in Figure 3. In these simulations, ammonia, methane, and water ice are assumed not to be homogeneously distributed on the surface.
The diffusion coefficients obtained for methane vary between 2.7·10-8 cm2 s-1 at 90 K, and 5.6·10-8 cm2 s-1 at 130 K. Hence, for the temperatures considered, they are always bigger than the coefficients for the other two compounds. This can be explained due to the increment of temperature found in the dark hemisphere, and possibly because of the high concentration of organic material on the surface [1,35]. In this sense, [36] report diffusion coefficients for methane of 2.5·10-13 cm2 s-1 at 50 K, which values differ from the ones obtained in this study since those experiments were performed in a range between 30 K to 50 K. We could expect a high diffusion of methane if the atmosphere of Iapetus were similar to the one of Pluto, where the interaction between methane and cosmic rays produces C2H2. This interaction also warms the atmosphere, bringing the methane to high altitudes and generating a greenhouse effect, starting a virtuous circle [37,38].
We found diffusion coefficients for water ice varying between 9.4·10-10 cm2 s-1 at 90 K and 1.9·10-9 cm2 s-1 at 130 K, values that are lower than the ones for methane. These low diffusion coefficients can be explained by taking into account the transportation of water isotopes through atom diffusion in dry ice in a matrix of interconnected porosity [23]. Experimental studies show that some species can be diffused through water ice backgrounds, like water vapor with coefficients of 0.2·10-5 cm2 s-1 [39], or amorphous ices with coefficients of 4.2·10-4 cm2 s-1 at 130 K [40]. On Iapetus, it could be expected that species like ammonia or methane can be diffused with small coefficients due to the low temperatures on surface [23,41].
The diffusion coefficients found for ammonia ice vary between 1.8·10-9 cm2 s-1 at 90 K and 3.9·10-9 cm2 s-1 at 130 K. Previous experiments on diffusion of ammonia in hemihydrate environments, reveal a diffusion coefficient of 4.3·10-10 cm2 s-1 at 140 K [42]. Other experiments show ammonia adsorption bands in combination with ice particles at 120 K [43]. In this way, [44] also report peaks of ammonia adsorption in ice at 120 K. On Iapetus, the emergence of regions where ammonia can diffuse, after reaching 113 K, could contribute to the sublimation and volatilization of elements along the surface [7,24].
4. Discussion
Our study of the diffusion of organic and inorganic material detected in the bright and dark hemispheres of Iapetus relies on understanding how they could evolve in airless bodies, starting with initial surface temperatures of 90 K and 130 K. On a slow rotator, like Iapetus, maximum temperatures are dependent on Sun-Saturn distance, albedo, and the available solar heat flux [21,24]. The simulations performed for this work show a steady increase from the initial temperatures, reaching at the end the maximum temperatures for the dark and the bright hemisphere of 130 K and 147 K respectively. During the 1 Gyrs of model time, the increment of these temperatures was not enough to provoke significant changes on the surface, but the growth for the dark hemisphere was bigger, due to its composition, low albedo, and high flux absorption [21,35,45]. Organic compounds in the dark hemisphere are spread all along it, across a layer that probably was formed by internal thermochemistry between methane and HCN compounds, that transformed them into organic material [1]. There had been experiments conducted by [46] that show how methane is thought to be transformed into organic material due to ion bombardment on Phoebe; the same process, mutatis mutandis, could happen on Iapetus.
In that study, it is suggested that the constant ion bombardment on Phoebe converts methane into yellow material, then into brown material, and finally into black material, originating the darkening on the surface [47,48]. The time scale required to do this conversion is 107 years [46]. In another vein, [2] proposed that the growth of organic material on Iapetus is a uniform process, with an accretion rate of 9·10-10 g cm-2 year-1, where the time required to do the carbonization is 2·106 years, lower than the carbonization time of 107 years for Phoebe. It could be possible to infer that the diffusion coefficients obtained for methane could provoke a constant evolution of organic material into carbonaceous compounds on Iapetus, with a small accretion rate during 1 Gyrs.
Generally, low temperatures represent a barrier in the diffusion of species through the atmosphere [23]. Water TDS curves have demonstrated that the presence of ammonia molecules changes the water desorption behavior [44]. At an atomic level, the interaction between ammonia molecules and icy surfaces generates reactions of conversion from ice into ammonia [44]. This phenomenon occurs because water molecules directly bonded with the surface are replaced by ammonia molecules during heating processes at 113 K. This could be an explanation of why the ranges of diffusion coefficients obtained for ammonia and water ice are almost similar.
Experimental results of ammonia diffusion in amorphous ice for temperatures ranging between 35 K to 140 K [40], show diffusion coefficients of 1.1·10−11 cm2 s−1 and 1.9·10−11 cm2 s−1 at 120K, which are almost similar to the ones obtained in our simulations. The diffusion timescale in that analysis corresponds to 102 s to 106 s. If on Iapetus we would like to observe how ammonia and water ice could evolve through time, we should expect billions of years for the sublimation of water ice and one billion years for its evaporation at 110 K [49,50].
Since ammonia and methane are the most abundant non-aqueous volatiles in the outer Solar System, it can be expected an increase of them over time (Murchie and Head), possibly throughout the internal geodynamic activity when they, in combination with water ice, reach the melting point and contribute to rising their abundance on the surface. But this analysis is beyond the scope of this study. Another possible way to extend this work is through an investigation of the effects of a possible global warming caused by an increment of methane and the concentration of carbon dioxide [51] on the surface of Iapetus.
5. Conclusions
In this manuscript, we have presented the results of our research on the evolution of the surface temperature of Iapetus, with the goal to understand the link between the surface temperature evolution and the distribution of organic, and inorganic, compounds on the surfaces of airless bodies. We assumed a solid planetary surface that is in a state of chemical and phase equilibrium with the nearby atmospheric layer close to the crust. This equilibrium ensures that the deposition and outgassing rates of all the considered species are in balance. The model employs a step-by-step approach, starting from the bottom layer, to identify the condensates that become thermally stable in each subsequent layer. We then gradually eliminate the elements present in these condensates until chemical and phase equilibrium is once again achieved.
Our model could offer initial understanding regarding the anticipated arrangement of cloud layers in the atmospheres of Iapetus. This arrangement depends on factors such as surface temperature, surface pressure, and crust composition. These cloud condensation sequences in equilibrium serve as a foundation for future exploration in kinetic models that study cloud formation. However, our paper does not encompass models that consider boundary fluxes at the atmospheric boundaries, atmospheric escape rates, or non-equilibrium processes like photochemistry. These aspects extend beyond the scope of our current study.
To correctly simulate the temperature evolution over organic, and Inorganic, compounds on Iapetus, it was decided to analyze the visible spectral signature obtained by the VIMS instrument (see Figure 3a and Figure 3b). In this regard, Iapetus spectra, with absorption bands annotated with identifications derived in [26], were used, along with Digital Elevation Models (DEM) generated from ImageJ of both Iapetus hemispheres, (see Figure 4a and Figure 4b), in order to carry out the simulation.
Finally, it is worth mentioning that this research study is the basis of others focused on Iapetus, in which, from the DEMs of the icy moon, it is possible to infer the surface erosion processes caused by the temporal evolution of temperatures in both hemispheres.
Author Contributions
Conceptualization, KVV, E.R.J., A.M.-L, J.M.M.L and M.C.L.G.; methodology, KVV, E.R.J., A.M.-L, J.M.M.L and M.C.L.G.; formal analysis, KVV, E.R.J., A.M.-L, J.M.M.L and M.C.L.G.; investigation, KVV, E.R.J., A.M.-L, J.M.M.L and M.C.L.G.; resources, KVV, E.R.J., A.M.-L, J.M.M.L and M.C.L.G.; writing—original draft preparation, KVV, E.R.J., A.M.-L, J.M.M.L and M.C.L.G.; writing—review and editing, KVV, E.R.J., A.M.-L, J.M.M.L and M.C.L.G.; supervision, KVV, E.R.J., A.M.-L, J.M.M.L and M.C.L.G. All authors have read and agreed to the published version of the manuscript.
Funding
This research received no external funding.
Data Availability Statement
The data used to support the findings of this study can be made available by the corresponding author upon request. The images in Figure 3 have been used with permission from the publisher, as shown in the following link: https://s100.copyright.com/CustomerAdmin/PrintableOrder.jsp?appSource=cccAdmin&orderID=501824388.
Acknowledgments
Authors are grateful for the disinterested collaboration of the Knowledge-Based Company RSV3 Remote Sensing S.L.
Conflicts of Interest
The authors declare no conflict of interests.
References
- Wilson, P.D.; Sagan, C. Spectrophotometry and Organic Matter on Iapetus. Icarus 1996, 122, 92–106. [Google Scholar] [CrossRef]
- Cruikshank, D.P.; Wegryn, E.; Dalle Ore, C.M.; Brown, R.H.; Bibring, J.-P.; Buratti, B.J.; Clark, R.N.; McCord, T.B.; Nicholson, P.D.; Pendleton, Y.J.; et al. Hydrocarbons on Saturn’s Satellites Iapetus and Phoebe. Icarus 2008, 193, 334–343. [Google Scholar] [CrossRef]
- Tosi, F.; Turrini, D.; Coradini, A.; Filacchione, G. Probing the Origin of the Dark Material on Iapetus. Mon Not R Astron Soc 2010, 403, 1113–1130. [Google Scholar] [CrossRef]
- Smith, B.A.; Soderblom, L.; Beebe, R.; Boyce, J.; Briggs, G.; Bunker, A.; Collins, S.A.; Hansen, C.J.; Johnson, T. V.; Mitchell, J.L.; et al. Encounter with Saturn: Voyager 1 Imaging Science Results. Science (1979) 1981, 212, 163–191. [Google Scholar] [CrossRef]
- Matthews, R.A.J. The Darkening of Iapetus and the Origin of Hyperion. Quarterly Journal of the Royal Astronomical Society 1992, 33, 253–258. [Google Scholar]
- Spencer, J.R.; Denk, T. Formation of Iapetus’ Extreme Albedo Dichotomy by Exogenically Triggered Thermal Ice Migration. Science (1979) 2010, 327, 432–435. [Google Scholar] [CrossRef]
- Steckloff, J.K.; Goldstein, D.; Trafton, L.; Varghese, P.; Prem, P. Exosphere-Mediated Migration of Volatile Species on Airless Bodies across the Solar System. Icarus 2022, 384, 115092. [Google Scholar] [CrossRef]
- Buratti, B.J.; Cruikshank, D.P.; Brown, R.H.; Clark, R.N.; Bauer, J.M.; Jaumann, R.; McCord, T.B.; Simonelli, D.P.; Hibbitts, C.A.; Hansen, G.B.; et al. Cassini Visual and Infrared Mapping Spectrometer Observations of Iapetus: Detection of CO 2. Astrophys J 2005, 622, L149–L152. [Google Scholar] [CrossRef]
- Hendrix, A.R.; Hansen, C.J. Ultraviolet Observations of Phoebe from the Cassini UVIS. Icarus 2008, 193, 323–333. [Google Scholar] [CrossRef]
- Hendrix, A.R.; Hansen, C.J. The Albedo Dichotomy of Iapetus Measured at UV Wavelengths. Icarus 2008, 193, 344–351. [Google Scholar] [CrossRef]
- Tamayo, D.; Burns, J.A.; Hamilton, D.P.; Hedman, M.M. Finding the Trigger to Iapetus’ Odd Global Albedo Pattern: Dynamics of Dust from Saturn’s Irregular Satellites. Icarus 2011, 215, 260–278. [Google Scholar] [CrossRef]
- Mendis, D.A.; Axford, W.I. Revisiting Iapetus Following Recent Cassini Observations. J Geophys Res Space Phys 2008, 113, n. [Google Scholar] [CrossRef]
- Lammer, H.; Scherf, M.; Ito, Y.; Mura, A.; Vorburger, A.; Guenther, E.; Wurz, P.; Erkaev, N. V.; Odert, P. The Exosphere as a Boundary: Origin and Evolution of Airless Bodies in the Inner Solar System and Beyond Including Planets with Silicate Atmospheres. Space Sci Rev 2022, 218, 15. [Google Scholar] [CrossRef]
- Zurbuchen, T.H.; Raines, J.M.; Gloeckler, G.; Krimigis, S.M.; Slavin, J.A.; Koehn, P.L.; Killen, R.M.; Sprague, A.L.; McNutt, R.L.; Solomon, S.C. MESSENGER Observations of the Composition of Mercury’s Ionized Exosphere and Plasma Environment. Science (1979) 2008, 321, 90–92. [Google Scholar] [CrossRef] [PubMed]
- Mansfield, M.; Kite, E.S.; Hu, R.; Koll, D.D.B.; Malik, M.; Bean, J.L.; Kempton, E.M.-R. Identifying Atmospheres on Rocky Exoplanets through Inferred High Albedo. Astrophys J 2019, 886, 141. [Google Scholar] [CrossRef]
- Howett, C.J.A.; Spencer, J.R.; Pearl, J.; Segura, M. Thermal Inertia and Bolometric Bond Albedo Values for Mimas, Enceladus, Tethys, Dione, Rhea and Iapetus as Derived from Cassini/CIRS Measurements. Icarus 2010, 206, 573–593. [Google Scholar] [CrossRef]
- Squyres, S.W.; Reynolds, R.T.; Summers, A.L.; Shung, F. Accretional Heating of the Satellites of Saturn and Uranus. J Geophys Res 1988, 93, 8779. [Google Scholar] [CrossRef]
- Manabe, S.; Möller, F. On the Radiative Equilibrium and Heat Balance of the Atmosphere. Mon Weather Rev 1961, 89, 503–532. [Google Scholar] [CrossRef]
- Acevedo, P.; Amrouche, C.; Conca, C.; Ghosh, A. Stokes and Navier–Stokes Equations with Navier Boundary Condition. C R Math 2019, 357, 115–119. [Google Scholar] [CrossRef]
- Bayat, E.; Egan, R.; Bochkov, D.; Sauret, A.; Gibou, F. A Sharp Numerical Method for the Simulation of Stefan Problems with Convective Effects. J Comput Phys 2022, 471, 111627. [Google Scholar] [CrossRef]
- Castillo-Rogez, J.C.; Matson, D.L.; Sotin, C.; Johnson, T.V.; Lunine, J.I.; Thomas, P.C. Iapetus’ Geophysics: Rotation Rate, Shape, and Equatorial Ridge. Icarus 2007, 190, 179–202. [Google Scholar] [CrossRef]
- Geiger, G.H.; Poirier, D.R. Transport Phenomena in Metallurgy; Addision-Weley Publishing Company: Reading, Massachusetts, USA, 1973. [Google Scholar]
- Jean-Baptiste, P.; Jouzel, J.; Stievenard, M.; Ciais, P. Experimental Determination of the Diffusion Rate of Deuterated Water Vapor in Ice and Application to the Stable Isotopes Smoothing of Ice Cores. Earth Planet Sci Lett 1998, 158, 81–90. [Google Scholar] [CrossRef]
- Rivera-Valentin, E.G.; Blackburn, D.G.; Ulrich, R. Revisiting the Thermal Inertia of Iapetus: Clues to the Thickness of the Dark Material. Icarus 2011, 216, 347–358. [Google Scholar] [CrossRef]
- Ramírez-Juidías, E.; Pozo-Morales, L.; Galán-Ortiz, L. Procedimiento Para La Obtención de Una Imagen Teledetectada a Partir de Fotografía 2015.
- Clark, R.N.; Cruikshank, D.P.; Jaumann, R.; Brown, R.H.; Stephan, K.; Dalle Ore, C.M.; Eric Livo, K.; Pearson, N.; Curchin, J.M.; Hoefen, T.M.; et al. The Surface Composition of Iapetus: Mapping Results from Cassini VIMS. Icarus 2012, 218, 831–860. [Google Scholar] [CrossRef]
- Blackburn, D.G.; Buratti, B.J.; Ulrich, R. A Bolometric Bond Albedo Map of Iapetus: Observations from Cassini VIMS and ISS and Voyager ISS. Icarus 2011, 212, 329–338. [Google Scholar] [CrossRef]
- Jewitt, D.C.; Luu, J. Crystalline Water Ice on the Kuiper Belt Object (50000) Quaoar. Nature 2004, 432, 731–733. [Google Scholar] [CrossRef] [PubMed]
- Bonnefoy, L.E.; Le Gall, A.; Lellouch, E.; Leyrat, C.; Janssen, M.; Sultana, R. Rhea’s Subsurface Probed by the Cassini Radiometer: Insights into Its Thermal, Structural, and Compositional Properties. Icarus 2020, 352, 113947. [Google Scholar] [CrossRef]
- Bonnefoy, L.E.; Le Gall, A.; Azevedo, M.; Lellouch, E.; Leyrat, C.; Janssen, M.A. Dione’s Leading/Trailing Dichotomy at 2.2 Cm. In Proceedings of the Europlanet Science Congress, online, 21 Sep–9 Oct 2020. EPSC2020-329, 2020. [Google Scholar]
- Bonnefoy, L.E.; Lestrade, J.-F.; Lellouch, E.; Le Gall, A.; Leyrat, C.; Ponthieu, N.; Ladjelate, B. Probing the Subsurface of the Two Faces of Iapetus. EPJ Web Conf 2020, 228, 00006. [Google Scholar] [CrossRef]
- Zheng, W.; Jewitt, D.; Kaiser, R.I. On the State of Water Ice on Saturn’s Moon Titan and Implications to Icy Bodies in the Outer Solar System. J Phys Chem A 2009, 113, 11174–11181. [Google Scholar] [CrossRef]
- Ejeta, C.; Boehnhardt, H.; Bagnulo, S.; Tozzi, G.P. Spectro-Polarimetry of the Bright Side of Saturn’s Moon Iapetus. Astron Astrophys 2012, 537, A23. [Google Scholar] [CrossRef]
- Alvarez-Candal, A.; Fornasier, S.; Barucci, M.A.; de Bergh, C.; Merlin, F. Visible Spectroscopy of the New ESO Large Program on Trans-Neptunian Objects and Centaurs. Astron Astrophys 2008, 487, 741–748. [Google Scholar] [CrossRef]
- Hamilton, D.P. Iapetus: 4.5 Billion Years of Contamination by Phoebe Dust. In Proceedings of the AAS/Division for Planetary Sciences Meeting Abstracts# 29; 1997. [Google Scholar]
- Maté, B.; Cazaux, S.; Satorre, M.Á.; Molpeceres, G.; Ortigoso, J.; Millán, C.; Santonja, C. Diffusion of CH 4 in Amorphous Solid Water. Astron Astrophys 2020, 643, A163. [Google Scholar] [CrossRef]
- Gladstone, G.R.; Young, L.A. New Horizons Observations of the Atmosphere of Pluto. Annu Rev Earth Planet Sci 2019, 47, 119–140. [Google Scholar] [CrossRef]
- Elliot, J.L.; Dunham, E.W.; Bosh, A.S.; Slivan, S.M.; Young, L.A.; Wasserman, L.H.; Millis, R.L. Pluto’s Atmosphere. Icarus 1989, 77, 148–170. [Google Scholar] [CrossRef]
- Calonne, N.; Geindreau, C.; Flin, F. Macroscopic Modeling for Heat and Water Vapor Transfer in Dry Snow by Homogenization. J Phys Chem B 2014, 118, 13393–13403. [Google Scholar] [CrossRef] [PubMed]
- Mispelaer, F.; Theulé, P.; Aouididi, H.; Noble, J.; Duvernay, F.; Danger, G.; Roubin, P.; Morata, O.; Hasegawa, T.; Chiavassa, T. Diffusion Measurements of CO, HNCO, H 2 CO, and NH 3 in Amorphous Water Ice. Astron Astrophys 2013, 555, A13. [Google Scholar] [CrossRef]
- McQuaid, S.A.; Johnson, B.K.; Gambaro, D.; Falster, R.; Ashwin, M.J.; Tucker, J.H. The Conversion of Isolated Oxygen Atoms to a Fast Diffusing Species in Czochralski Silicon at Low Temperatures. J Appl Phys 1999, 86, 1878–1887. [Google Scholar] [CrossRef]
- Livingston, F.E.; Smith, J.A.; George, S.M. General Trends for Bulk Diffusion in Ice and Surface Diffusion on Ice. J Phys Chem A 2002, 106, 6309–6318. [Google Scholar] [CrossRef]
- Uras, N.; Buch, V.; Devlin, J.P. Hydrogen Bond Surface Chemistry: Interaction of NH 3 with an Ice Particle. J Phys Chem B 2000, 104, 9203–9209. [Google Scholar] [CrossRef]
- Takaoka, T.; Inamura, M.; Yanagimachi, S.; Kusunoki, I.; Komeda, T. Ammonia Adsorption on and Diffusion into Thin Ice Films Grown on Pt(111). J Chem Phys 2004, 121, 4331–4338. [Google Scholar] [CrossRef]
- Squyres, S.W.; Sagan, C. Albedo Asymmetry of Iapetus. Nature 1983, 303, 782–785. [Google Scholar] [CrossRef]
- Strazzulla, G. Organic Material from Phoebe to Iapetus. Icarus 1986, 66, 397–400. [Google Scholar] [CrossRef]
- Foti, G.; Calcagno, L.; Sheng, K.L.; Strazzulla, G. Micrometre-Sized Polymer Layers Synthesized by MeV Ions Impinging on Frozen Methane. Nature 1984, 310, 126–128. [Google Scholar] [CrossRef]
- Greenberg, J.M. What Are Comets Made of? A Model Based on Interstellar Dust. In Comets; Wilkening, L.L., Ed.; Univ. of Arizona Press: Tucson, 1982; pp. 131–163. [Google Scholar]
- Vasavada, A. Near-Surface Temperatures on Mercury and the Moon and the Stability of Polar Ice Deposits. Icarus 1999, 141, 179–193. [Google Scholar] [CrossRef]
- KILLEN, R.; BENKHOFF, J.; MORGAN, T. Mercury’s Polar Caps and the Generation of an OH Exosphere☆. Icarus 1997, 125, 195–211. [Google Scholar] [CrossRef]
- Palmer, E.E.; Brown, R.H. Production and Detection of Carbon Dioxide on Iapetus. Icarus 2011, 212, 807–818. [Google Scholar] [CrossRef]
Figure 1.
Surface temperature evolution for the dark and bright hemispheres of Iapetus. The initial temperature for the leading side, represented with a blue line, starts at 90 K and evolves until almost 130 K during the model time. The trailing side, depicted with a red line, starts at 130 K and grows to 147 K. There is not a substantial increment of temperature for both sides, but the increment in the leading side is greater, possibly due to the low albedo of 0.04 and its composition.
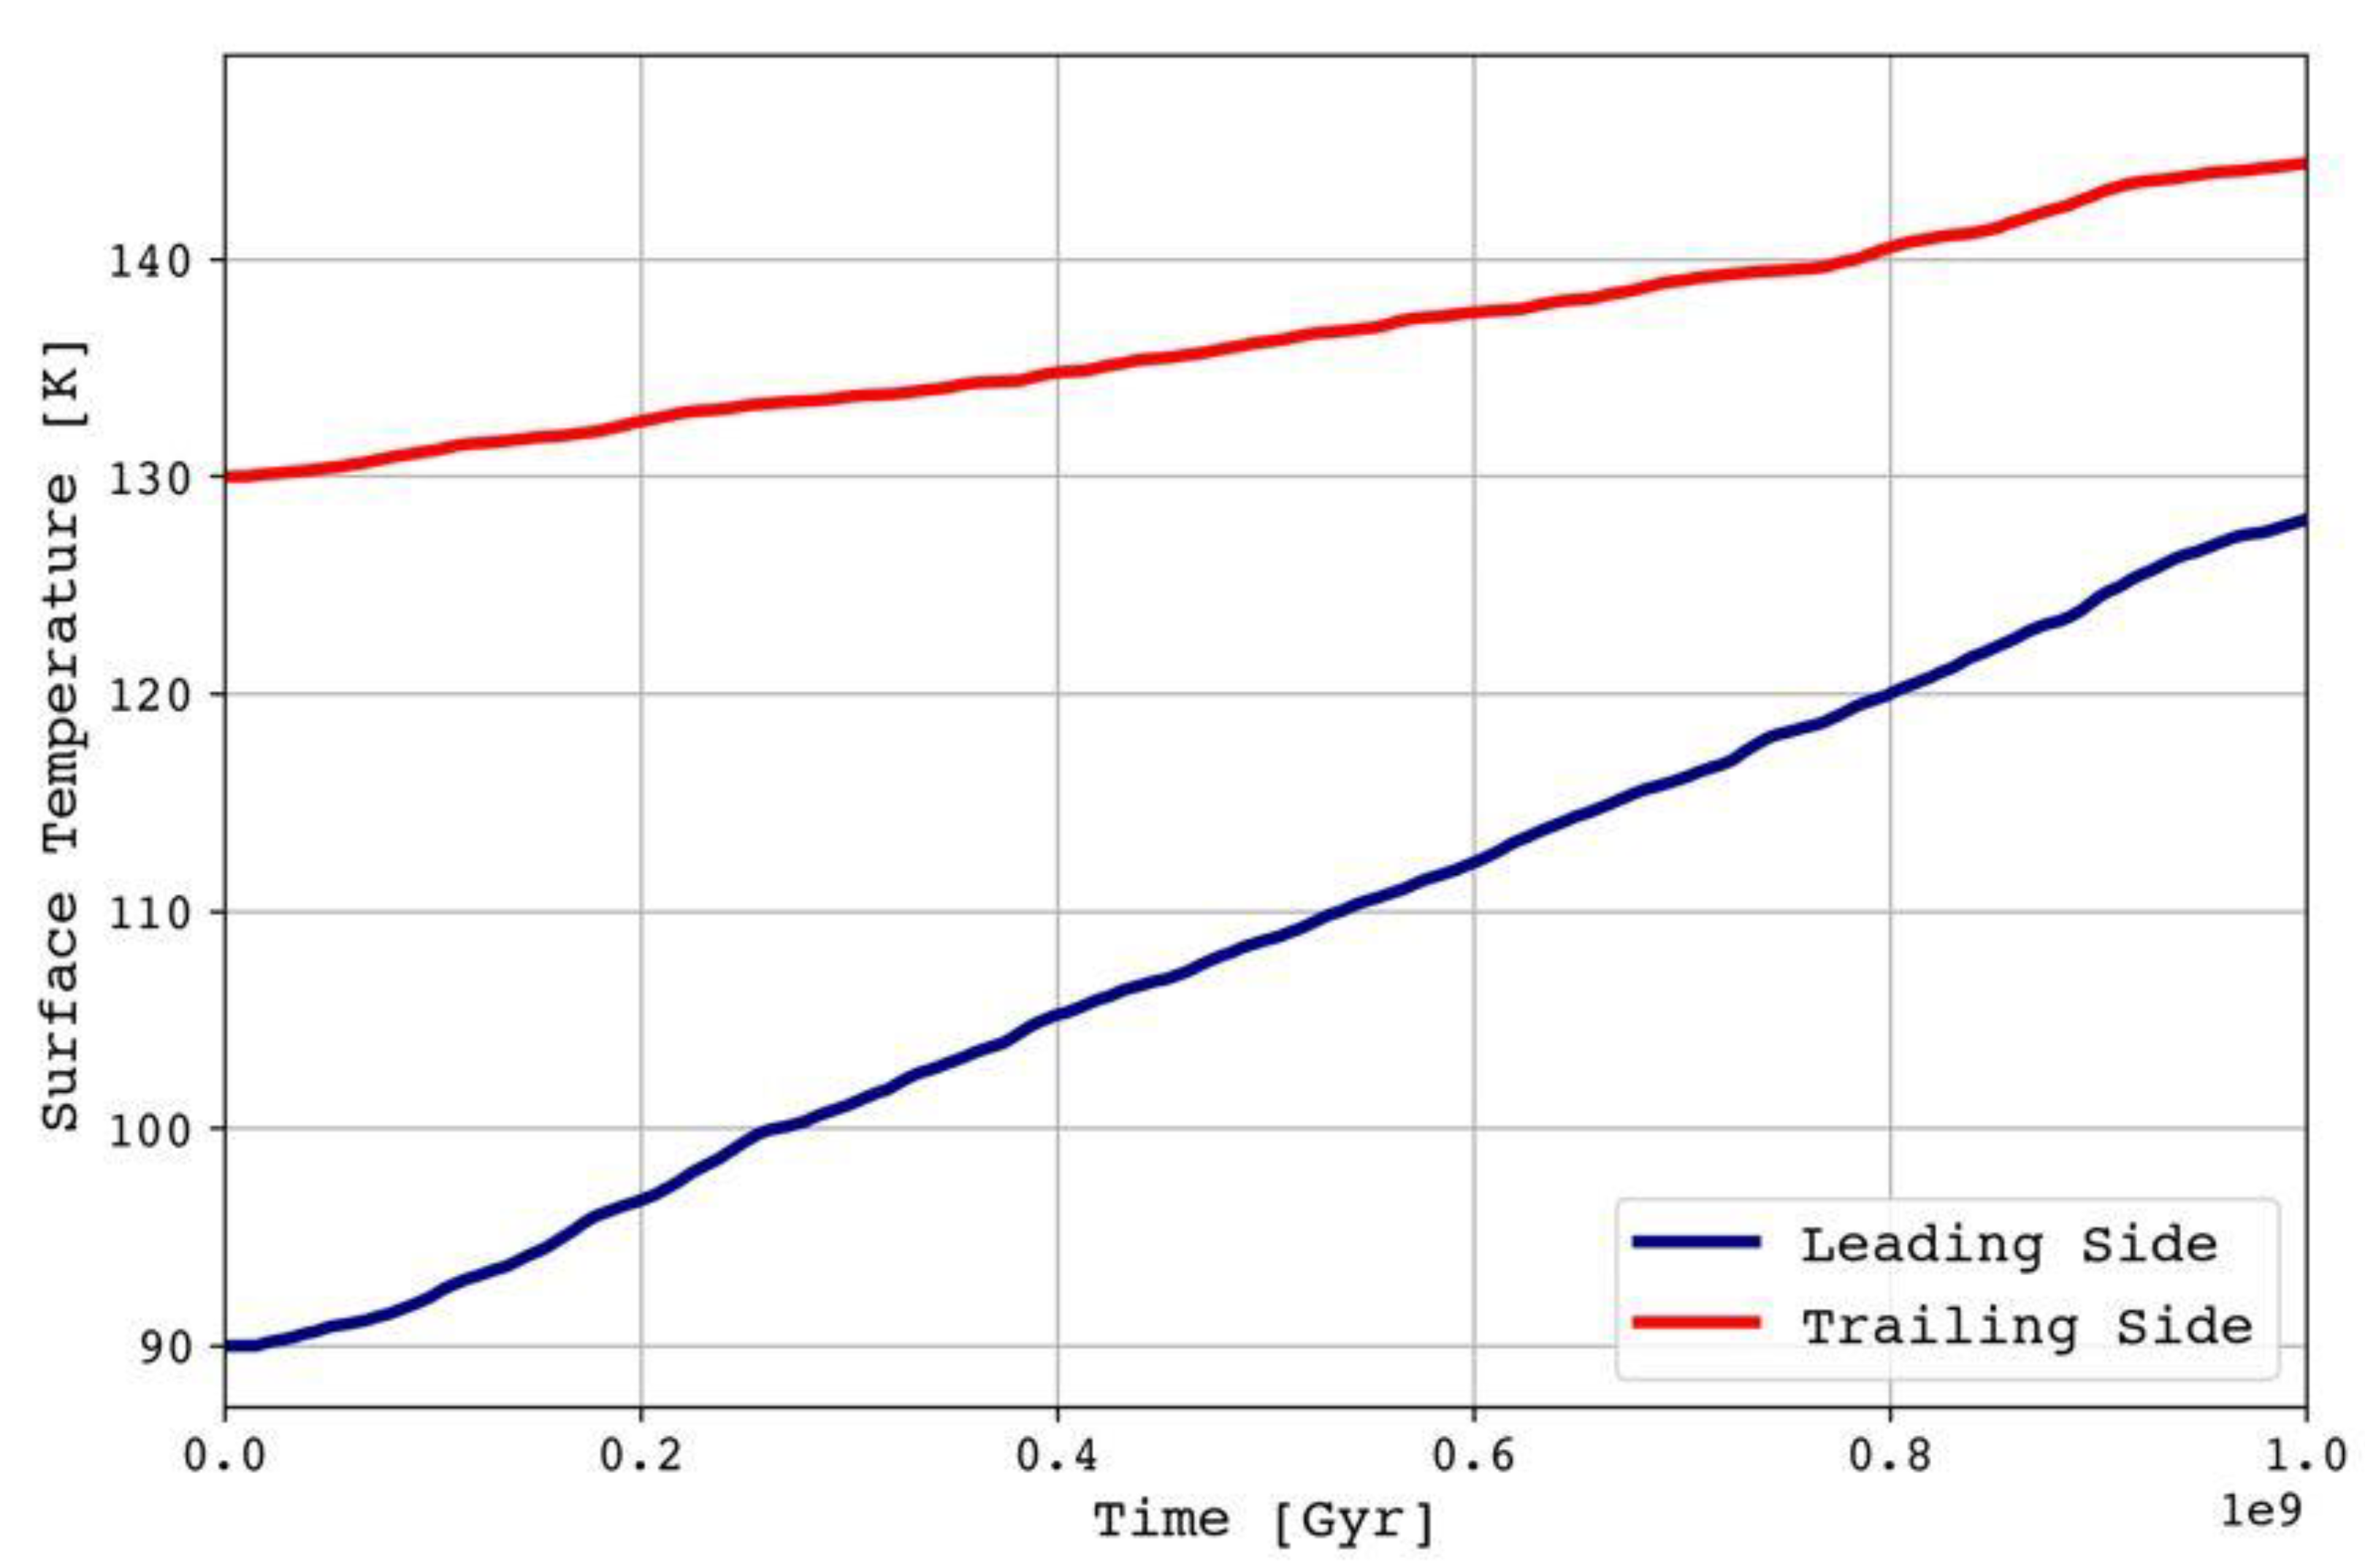
Figure 2.
The outgoing thermal radiation and the incoming stellar radiation are displayed for the dark and bright hemispheres in Figure 2a and 2b respectively. In the leading hemisphere, the outgoing radiation is constant at 2.8 W m-2, while in the trailing side it remains constant at 26 W m-2. This discrepancy could be a consequence of the different values of their albedos. Low temperatures and high albedo in the bright side do not allow for the retaining of flux radiation in the atmosphere, that is why, the outgoing thermal radiation is higher. In both sides, the incoming radiation is weak, with a roughly value of 0.2 W m-2.
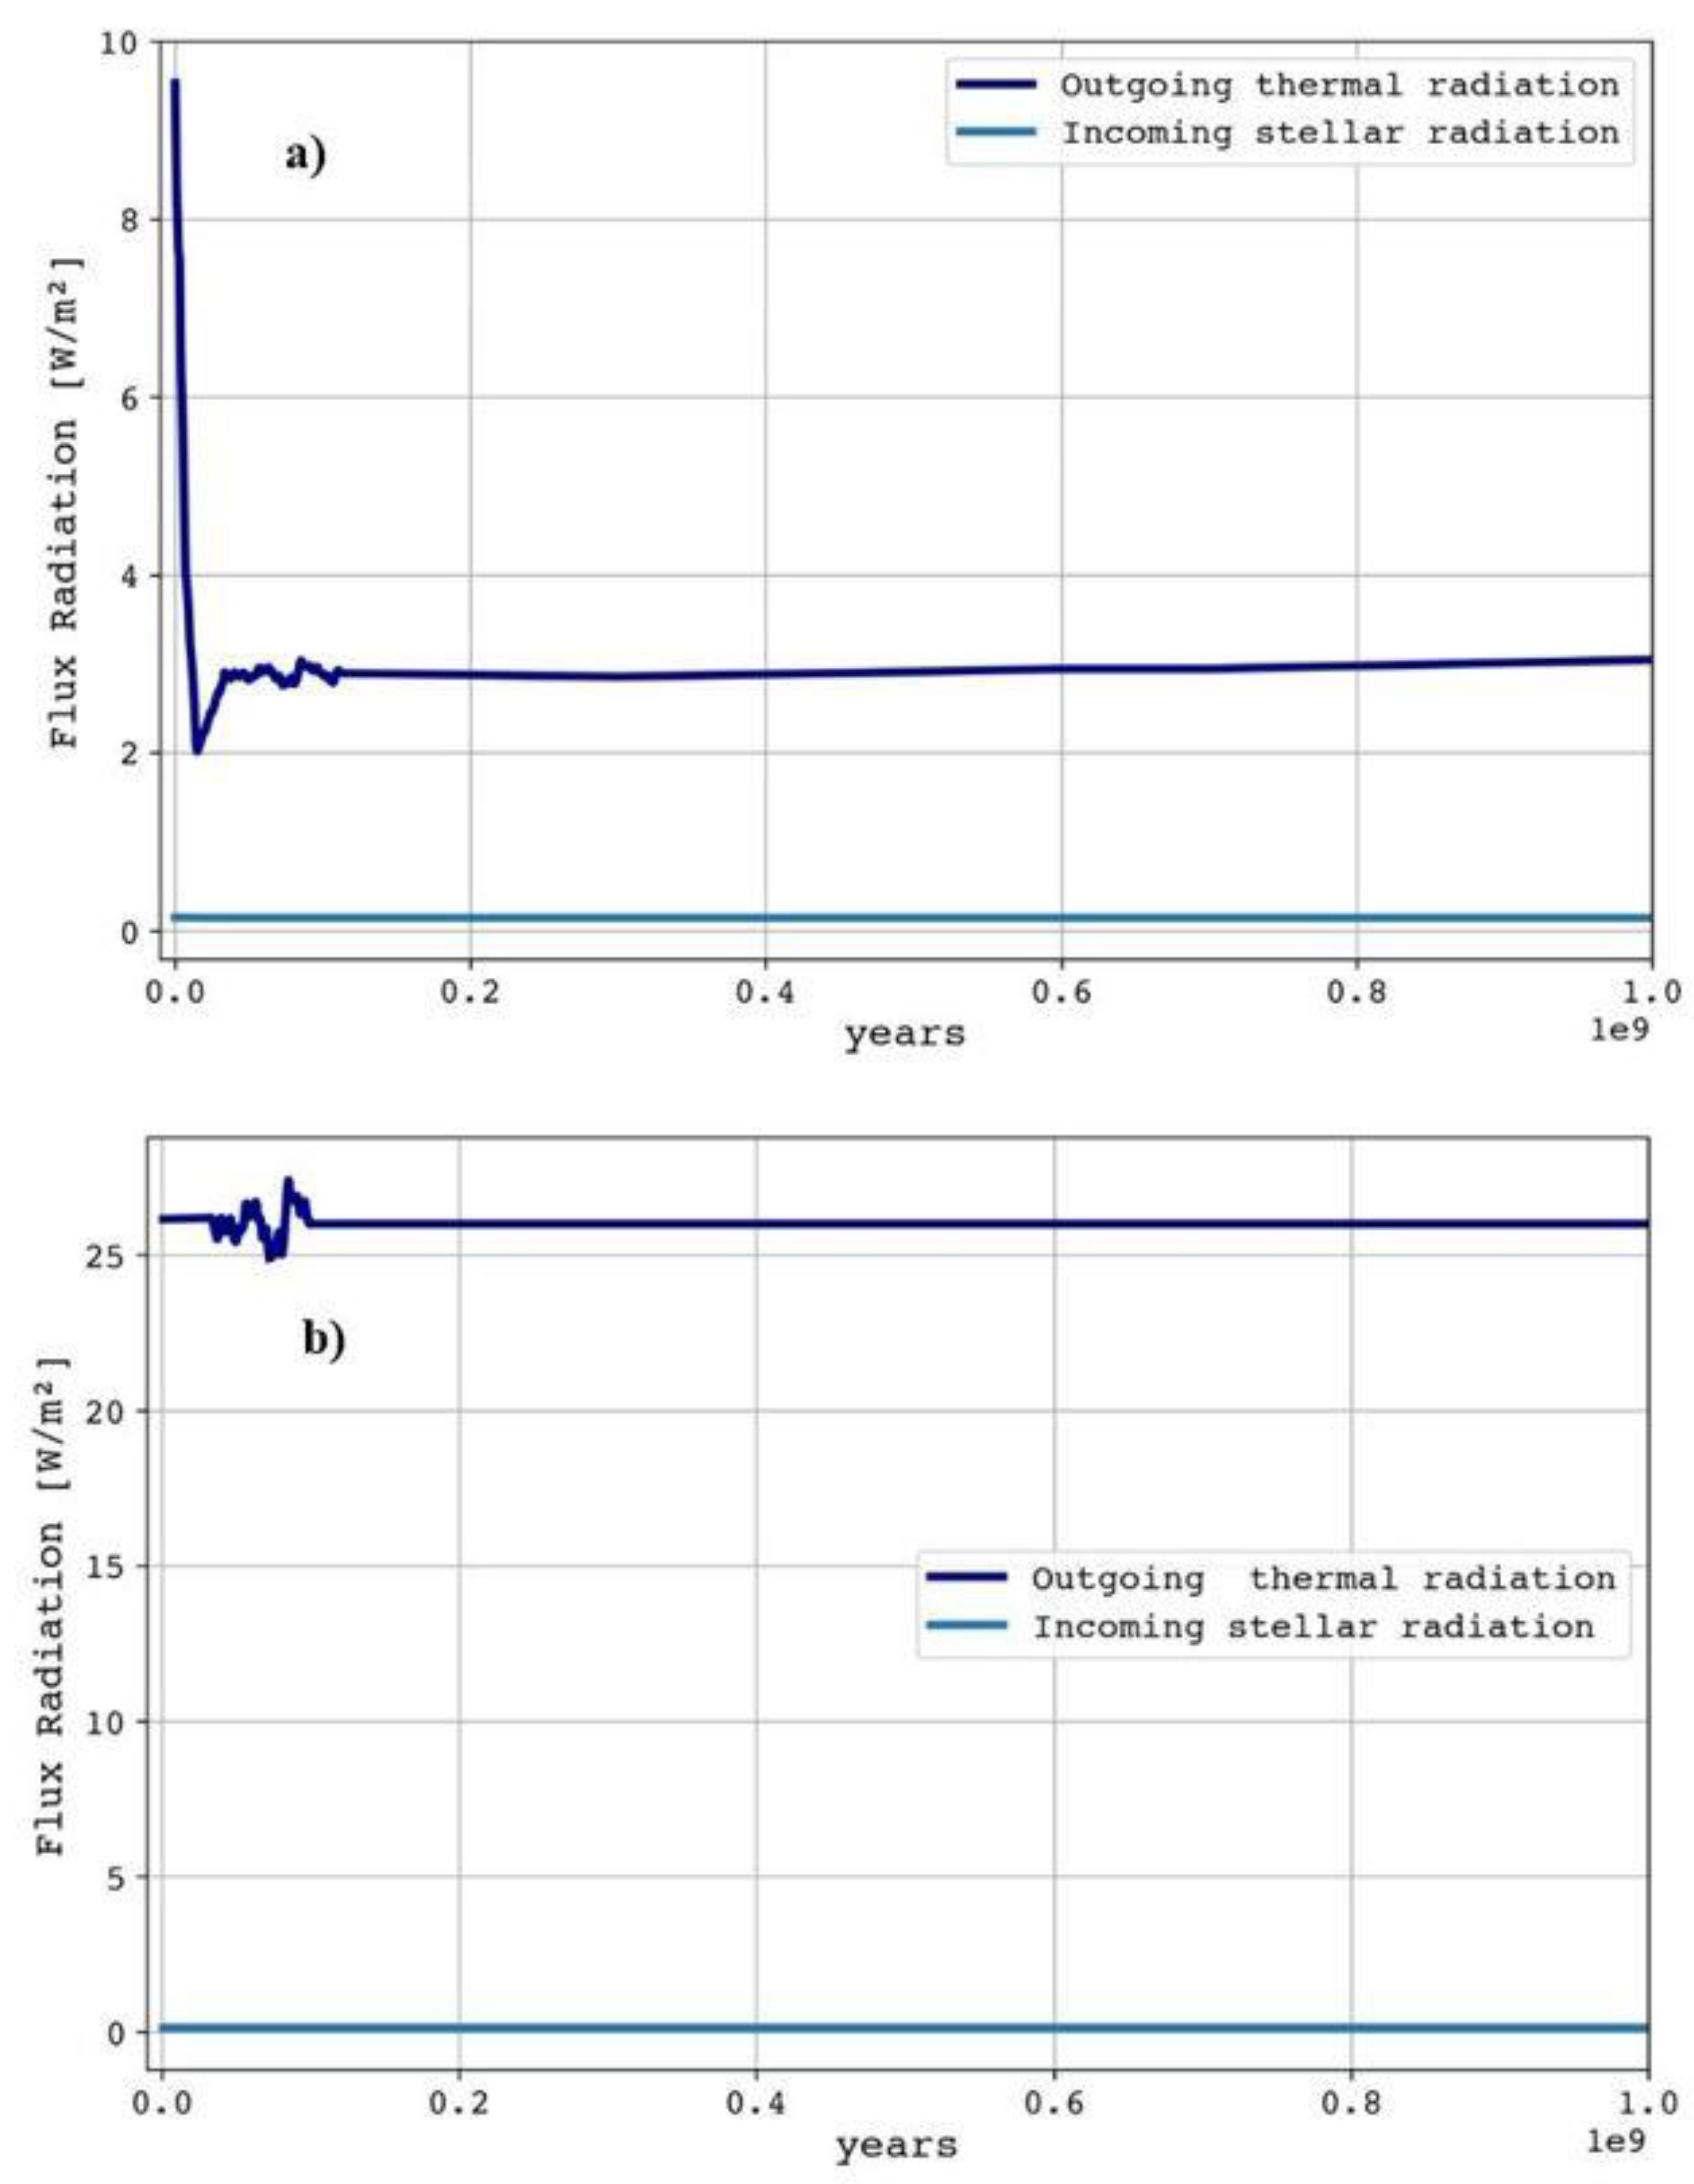
Figure 3.
The first image (a) displays the spectra of Iapetus, indicating absorption bands that have been identified according to [26]. In contrast, the second image (b) presents a range of representative spectral variations observed in the VIMS data during the Rev 49 fly-by. It's worth noting that the position of the blue peak around 0.5 µm varies depending on the reflectance level and the amount of dark material present. Although the phase angle for the ORSHIRES001 sequence changed from approximately 127 at 13:30 to 12.6 at 14:42 and then to 30 at 17:11, the average phase angle for these spectra is around 20, except for the bottom spectrum. The bottom spectrum was obtained earlier and has been scaled by a factor of 2.0x to compensate for the higher solar incidence and phase angle, allowing for comparison with the spectra at a lower phase angle (https://s100.copyright.com/CustomerAdmin/PrintableOrder.jsp?appSource=cccAdmin&orderID=501824388).
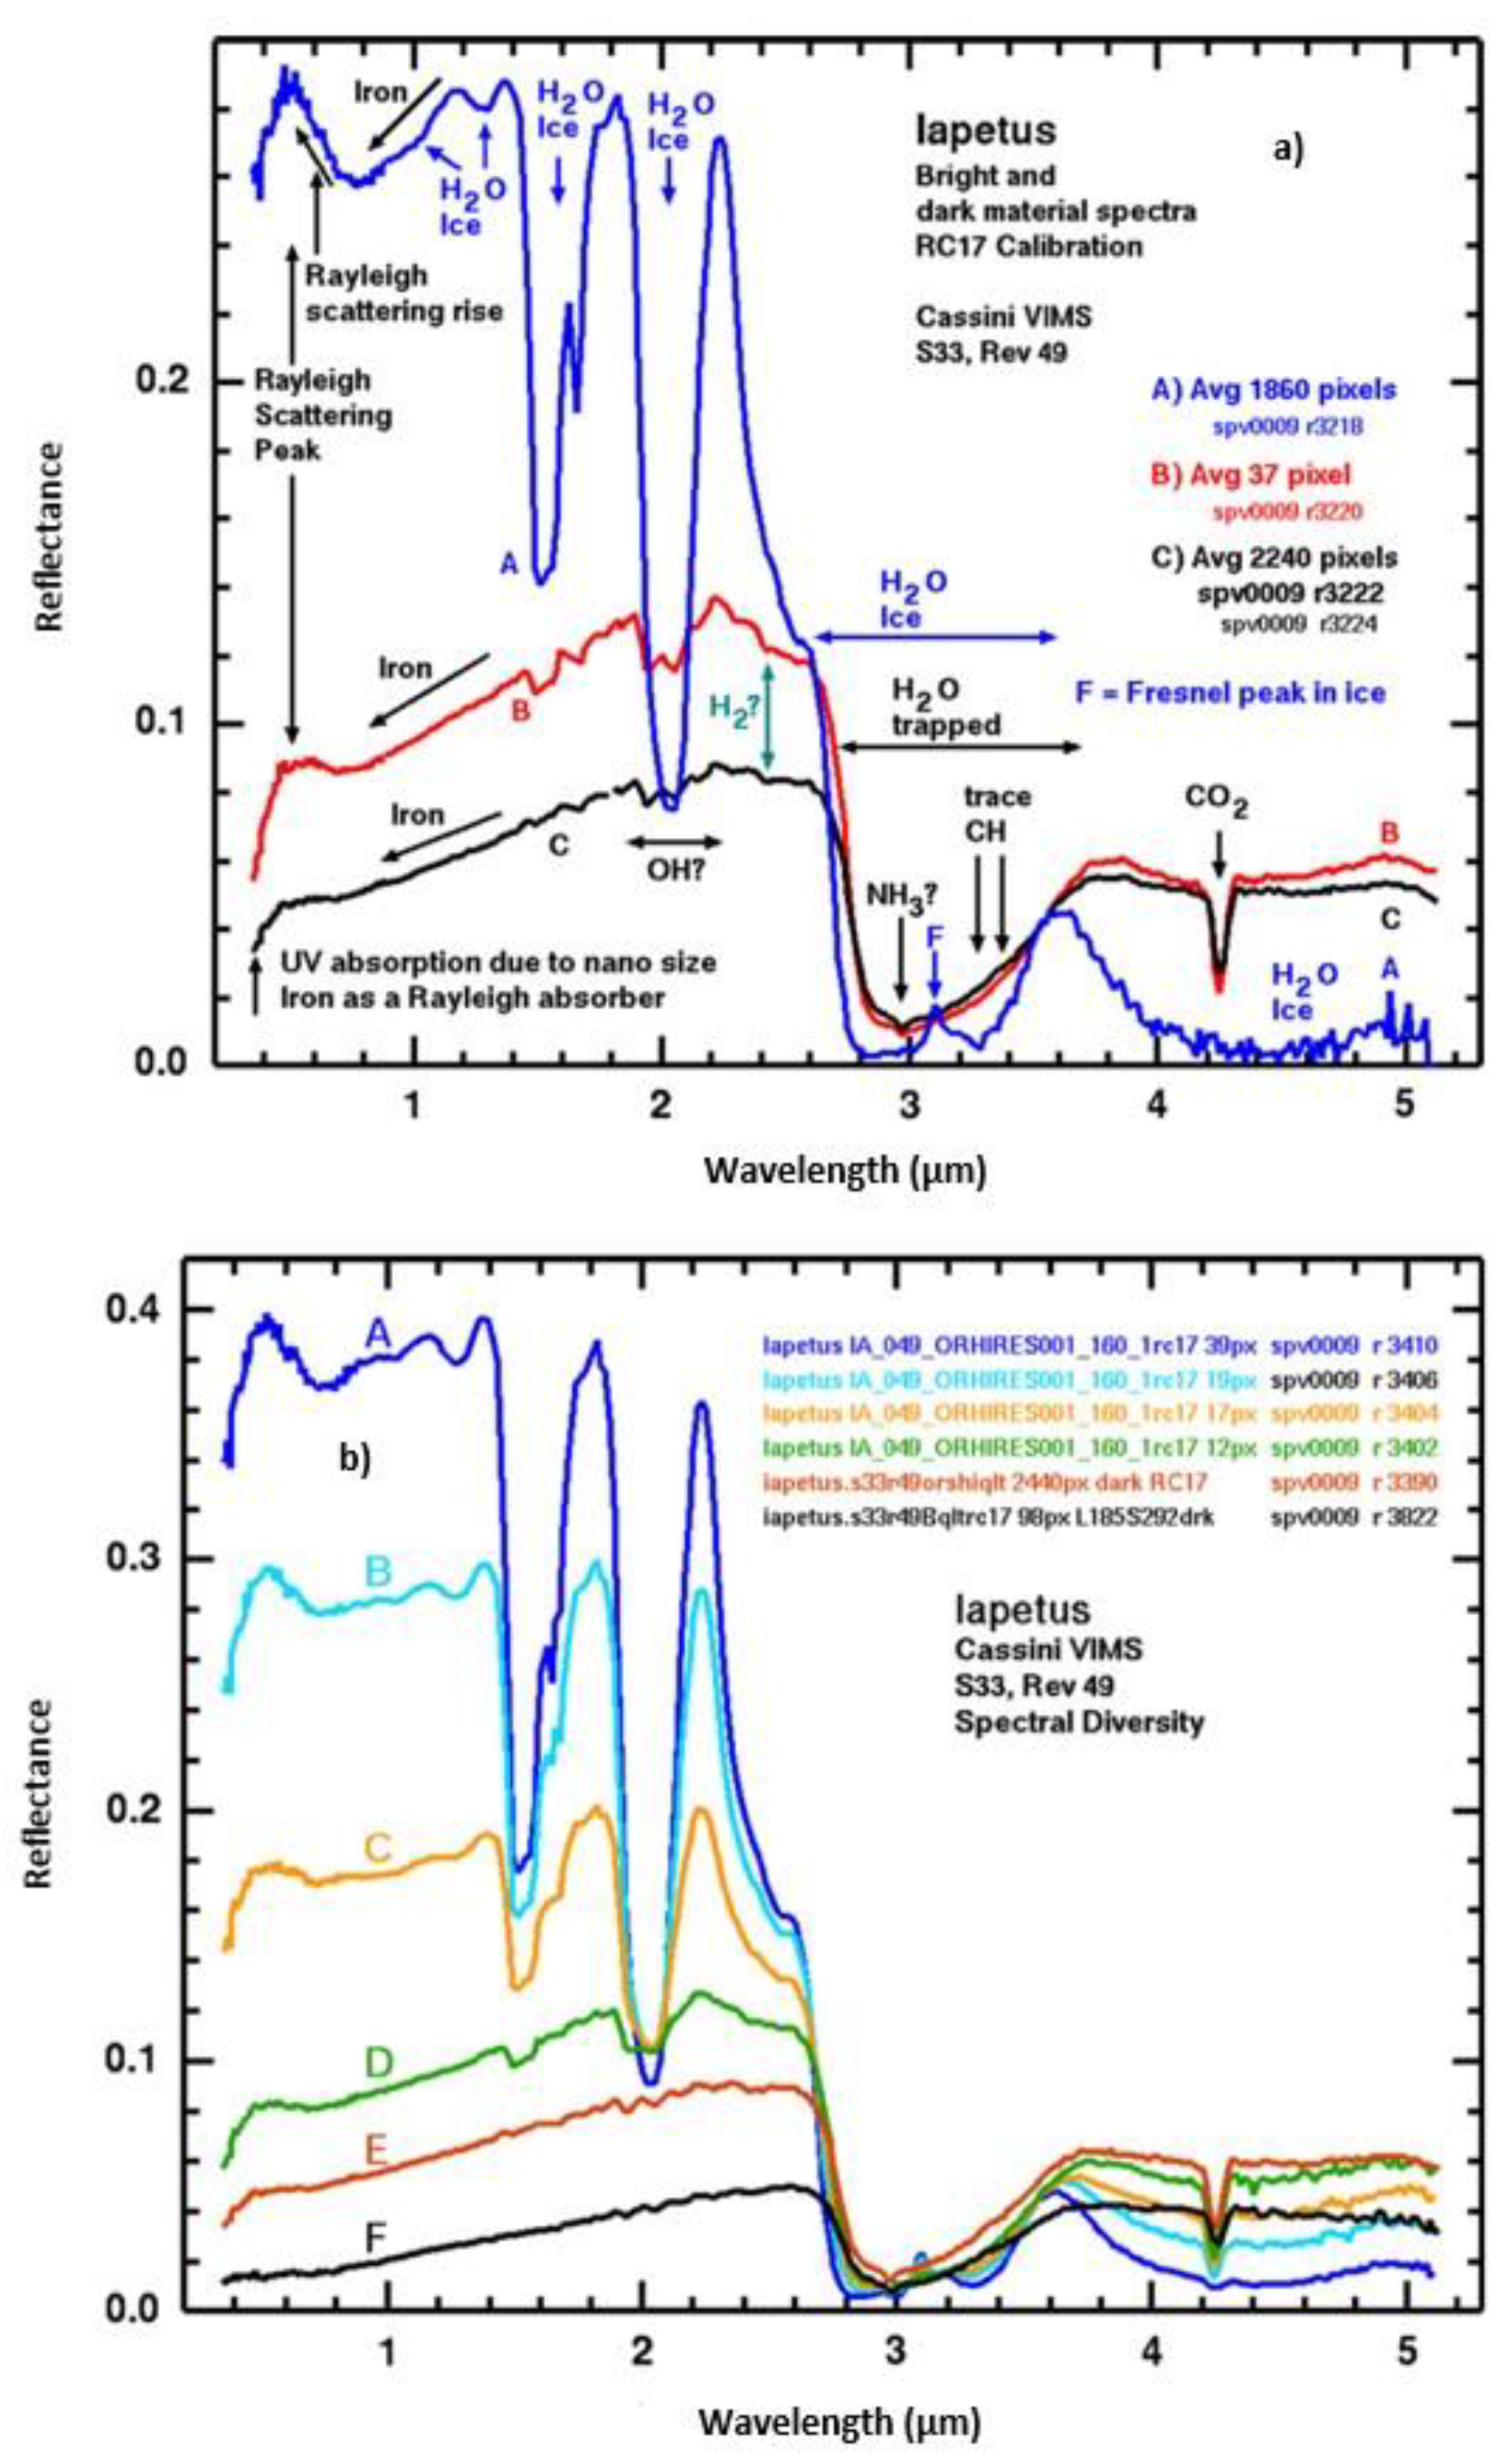
Figure 4.
DEM of both bright and dark side of Iapetus obtained by authors from ImageJ free software.
Figure 4.
DEM of both bright and dark side of Iapetus obtained by authors from ImageJ free software.
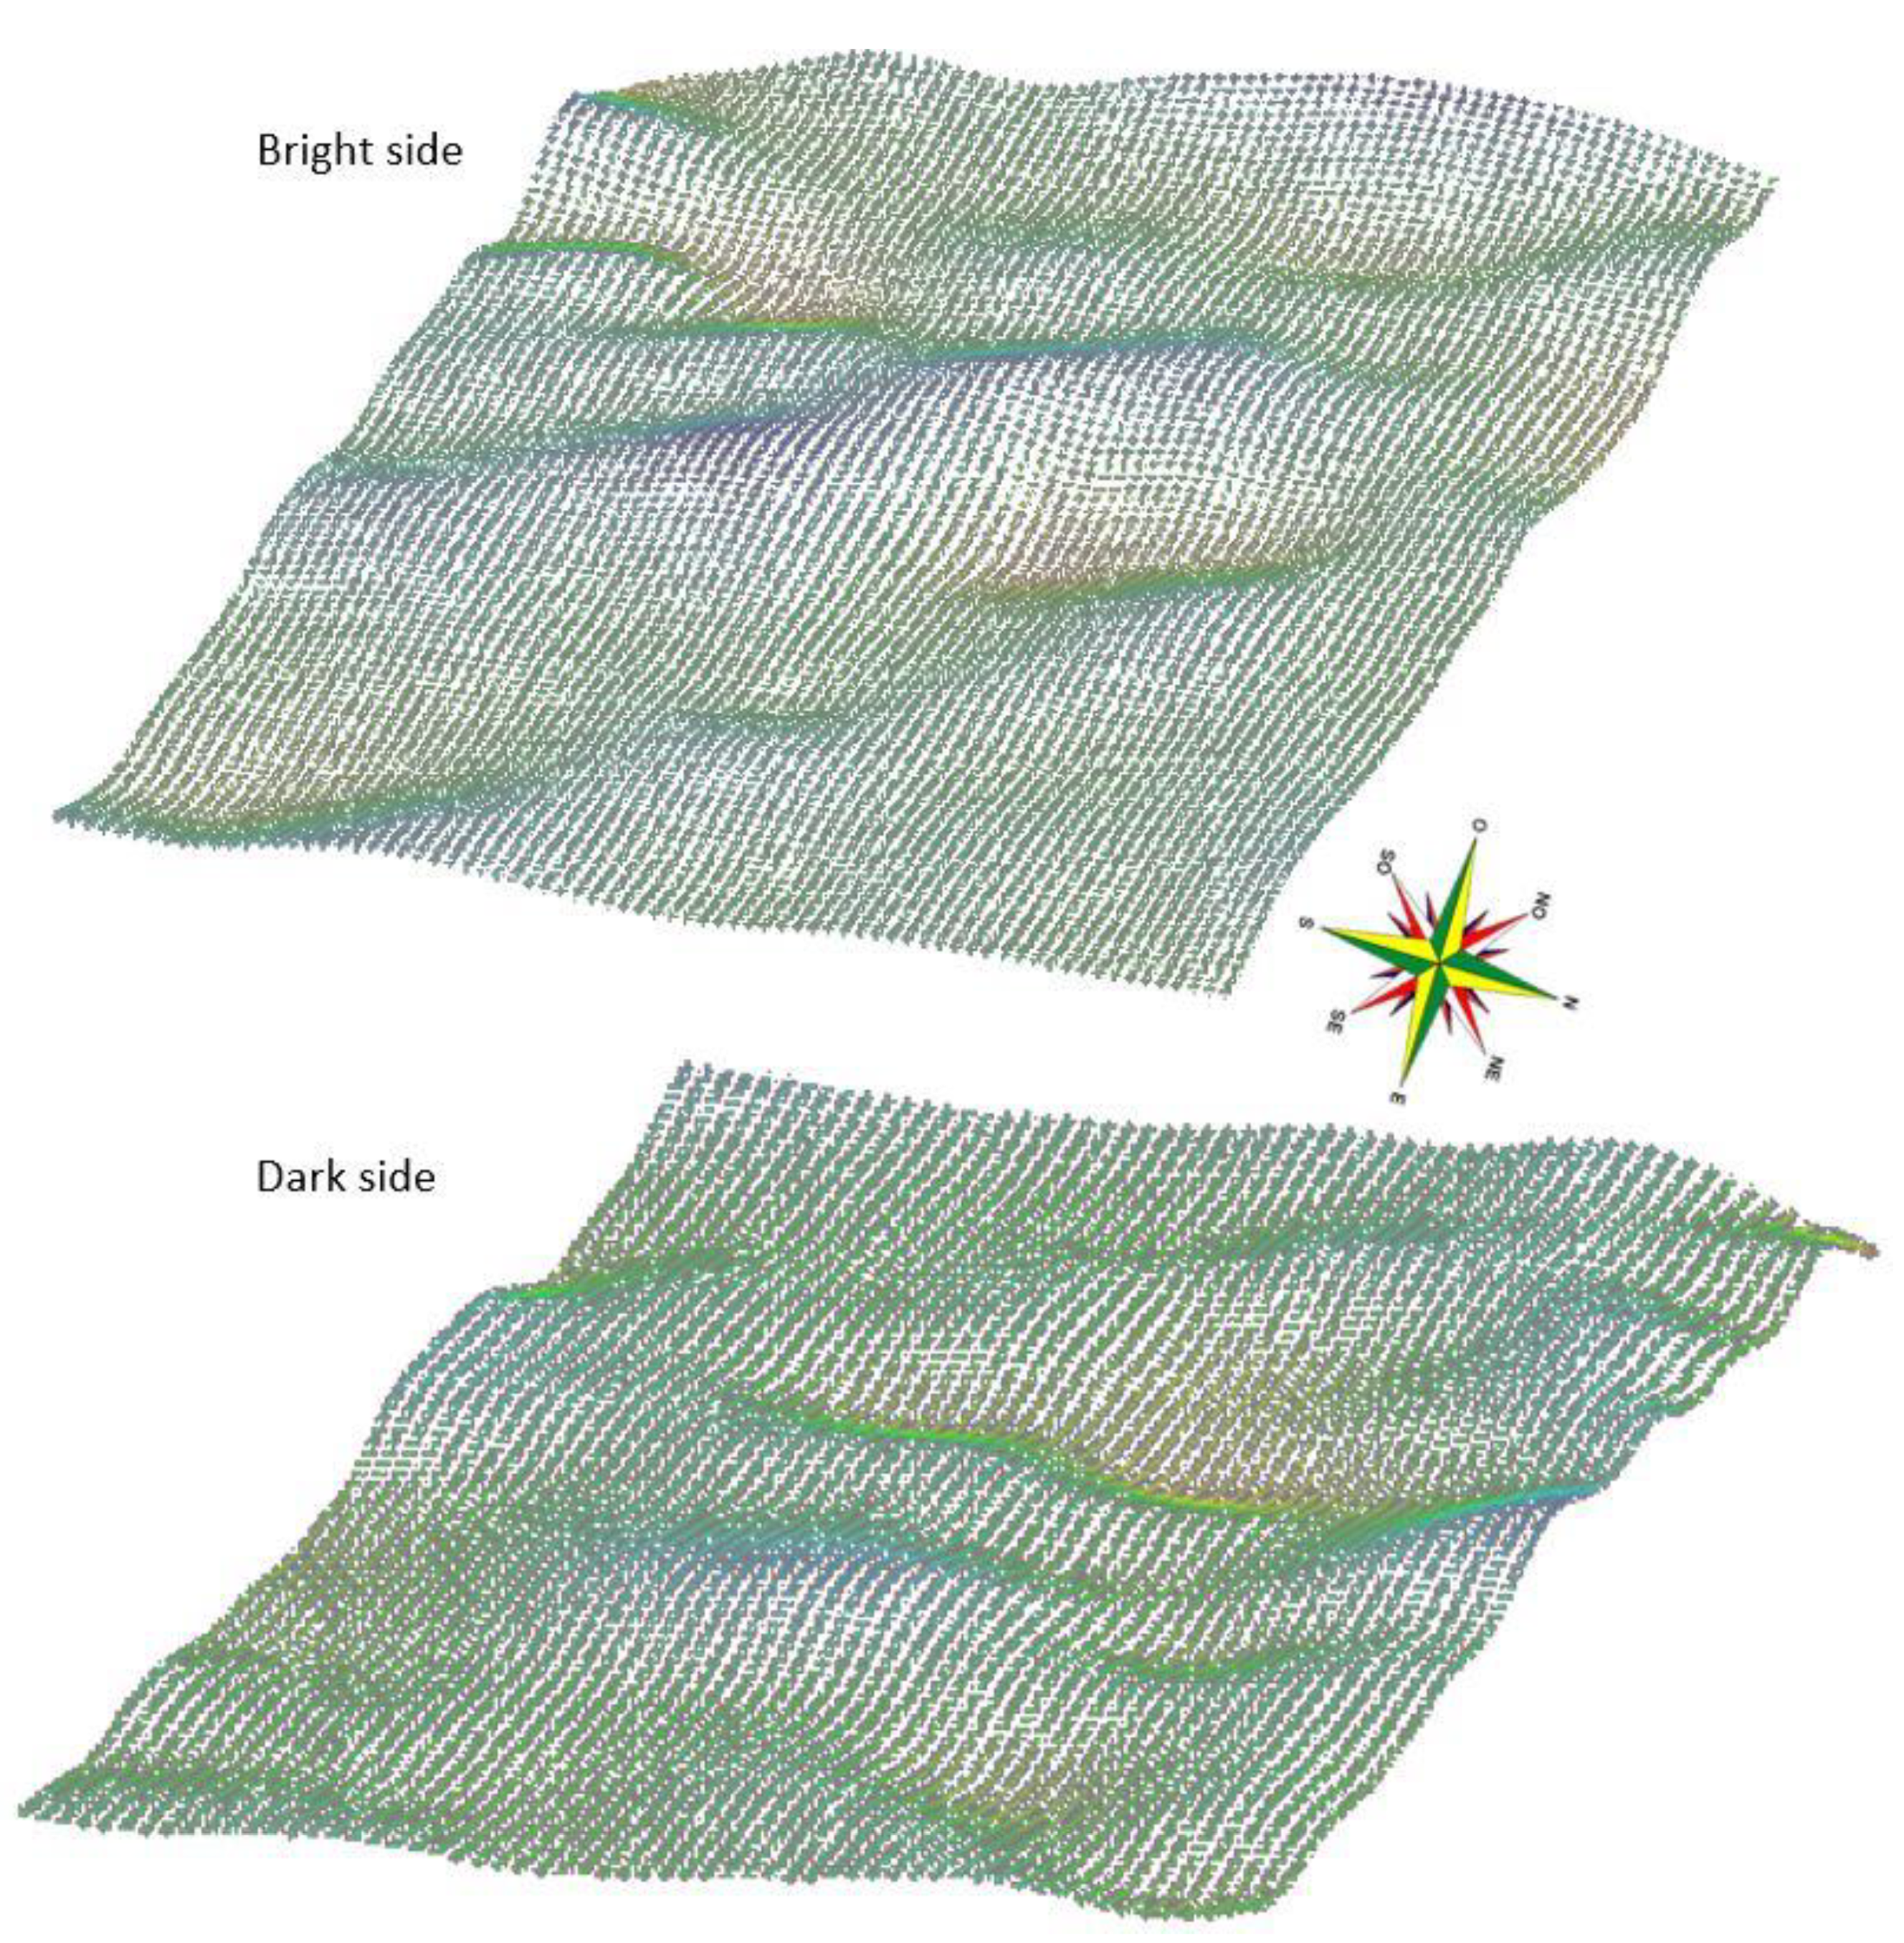

Table 1.
Concentration of species present in the atmosphere of Iapetus. Previous researches assume that the formation of an exosphere on Iapetus is mainly composed of H2O [7]. In this study, there were included other species detected in the bands between 0.35 μm to 1.07 μm by the VIMS instrument on board of the Cassini Mission. The concentration of species was calculated by applying genetic algorithms [25]. Water ice and ammonia are the main compounds present in the atmosphere.
| Atmospheric composition | Concentration (g/kg) | Presence among other species (%) | Presence in the air (%) | Mass (g) | Molar fraction (mol/g) |
|---|---|---|---|---|---|
| Air | 100 | ||||
| H2O | 8.82 | 50.49 | 49 | 8.82 | 0.49 |
| NH3 | 8.33 | 47.68 | 49 | 8.33 | 0.49 |
| CH4 | 0.33 | 1.83 | 2 | 0.32 | 0.02 |
| Total | 17.47 | 100 | 100 | 17.47 | 1 |
Disclaimer/Publisher’s Note: The statements, opinions and data contained in all publications are solely those of the individual author(s) and contributor(s) and not of MDPI and/or the editor(s). MDPI and/or the editor(s) disclaim responsibility for any injury to people or property resulting from any ideas, methods, instructions or products referred to in the content. |
© 2023 by the authors. Licensee MDPI, Basel, Switzerland. This article is an open access article distributed under the terms and conditions of the Creative Commons Attribution (CC BY) license (http://creativecommons.org/licenses/by/4.0/).
Copyright: This open access article is published under a Creative Commons CC BY 4.0 license, which permit the free download, distribution, and reuse, provided that the author and preprint are cited in any reuse.


