
Submitted:
04 July 2023
Posted:
05 July 2023
You are already at the latest version
Abstract
In this study, we developed a model that can predict whether patients with cerebral arteriovenous malformation (AVM) will be cured 36 months after intervention by means of stereotactic radiosurgery (SRS), and identified the most important predictors that explain the probability of being cured. A machine learning (ML) approach was applied using decision tree (DT) and logistic regression (LR) techniques on historical data (sociodemographic, clinical, treatment, angioarchitecture, and radiosurgery procedure) of 202 patients with AVM who underwent SRS at the Instituto de Radiocirugía del Perú (IRP) between 2005 and 2018. The LR model obtained the best results for predicting AVM cure with an accuracy of 92.16%, sensitivity of 92.86%, specificity of 88.89%, precision of 97.50%, and AUC of 97.62%, which shows that ML models are suitable for use for predicting the prognosis of medical conditions such as AVM and can be a support tool for medical decision-making. In addition, several factors were identified that could explain whether patients with AMV would be cured at 36 months with the highest likelihood: the location of the AVM, the occupation of the patient, and the presence of hemorrhage.
Keywords:
brain arteriovenous malformation
; prognosis
; prediction
; machine learning
; artificial intelligence
; decision tree
; logistic regression
1. Introduction
Cerebral arteriovenous malformation (AVM) is a congenital neurological disease that causes cerebral hemorrhage, seizures, or headache. It consists of an abnormal conglomerate of dilated cerebral vessels derived from maldevelopment of the capillary network that allows direct connections between cerebral arteries and veins [1]. One of the treatments known since the 1970s, in addition to microsurgery and endovascular therapy, is stereotactic radiosurgery (SRS), in which the AVM is obliterated by radionecrosis through the administration of multi-beam directed radiation [2], which is obtained from a gamma knife system, a linear accelerator, or proton therapy. From the medical point of view, SRS is a neurosurgical technique that does not require an incision and is used as an alternative or complement to noninvasive treatment.
The healing process of patients with AVM undergoing SRS is not immediate and requires time with clinical and imaging monitoring to know the evolution of the disease, the need for additional or alternative treatments, and the possible results. Successful exclusion of brain AVM with radiosurgery depends on the size of the lesion and the radiation dose. Complete healing is considerably higher for smaller lesions. For example, one study showed that the obliteration rate of patients with brain AVM after SRS was between 54-92% for lesion diameters ≤ 2.5 cm [3]. Several scoring systems, such as the Spetzler Martin Grading Scale (SMGS) and the Virginia Radiosurgery AVM Scale (VRAS), are currently used by physicians to understand the nature of AVM and predict the results of radiosurgery treatment [4,5,6]. However, developing new methods to predict the results of radiosurgery treatment and determining the factors that influence the probability of success are needed.
Machine learning (ML) is a subset of artificial intelligence (AI) that uses algorithms that automatically “learn” to identify patterns in data, which are used to make forecasts based on these patterns [7]. The use of such algorithms as support tools for medical decision-making and their application in the prognosis, diagnosis, and treatment of diseases has been recently developed [8]; however, certain conditions still exist that make it difficult for them to be widely adopted [9,10,11,12,13]. Among the studies referring to the prediction and diagnosis of neurological and brain diseases in which ML techniques were applied is the study of Uspenskaya-Cadoz et al. [14], which proposed a method for diagnosing Alzheimer's disease (AD) by applying logistic regression (LR), decision tree (DT), random forest (RF), and gradient boosted trees (GBT) techniques, and the study of Ghafouri-Fard et al. [15], which proposed using artificial neural networks (ANN) to predict multiple sclerosis (MS) risk based on genotypes.
At present, the application of ML techniques to the diagnosis, prognosis, or treatment of AMV has increased. Interesting studies can be found, such as one by Tao et al. [16], which examined the factors that influence the risk of bleeding from AVM based on LR and RF models, and another by Hong et al. [17], which reported an experiment with three ML models: naive bayes (NB), support vector machines (SVM) and RF, for the detection of hemorrhages in AVMs using digital subtraction angiography (DSA) images. There are also studies on the use of deep learning, a type of ML specialized in image processing; for example, Wang et al. [18] automated the process of segmenting and identifying AVMs in computed tomography (CT) and DSA images. Other studies have focused on the prognosis of patients with AVM after surgery, with the aim of predicting whether they would be cured. For example, Asadi et al. [19] presented a study on identifying the factors that influence the outcome of treatment with endovascular embolization and concluded that AVMs can be successfully treated by endovascular techniques or a combination of surgery and radiosurgery with an acceptable risk profile, and that ML techniques can satisfactorily predict outcomes with high accuracy and can help to individualize the treatment based on key predictors. Finally, Oermann et al. [20] used an ML approach to predict the outcomes of AVM patients undergoing radiosurgery, and achieved 74% accuracy, which is considered to be the best prognostic result as of the date of publication of this paper. However, these studies did not delve into the importance of identifying the predictors of the prognosis outcomes, which is important information for medical decision-making.
Taking into account these studies [16-20], in which it is evident that ML algorithms are powerful tools that can be used in the medical field, and seeking to implement an ML method that allows accurate prediction of AVM outcomes and identification of the most important factors that explain whether patients with AVM will be cured, in the present study, we used a dataset of 202 patients with AVM who underwent radiosurgery along with ML models to develop a suitable model. The aim is to (1) provide an ML approach for predicting whether patients with AVM who undergo SRS will be cured, and (2) identify the main factors influencing whether these patients will be cured 36 months after radiosurgery.
2. Materials and Methods
The construction of an ML system for the prognosis of patients with AVM treated with SRS is proposed using two techniques: DT and LR (Figure 1).
The objective is to predict whether a patient will be cured or not at 36 months (3 years) after undergoing SRS; for this, a supervised ML learning approach was chosen via binary classification. Additionally, the use of LR is proposed to determine the main factors that influence whether an AVM patient will be cured.
2.1. Dataset
For this study, a dataset comprising 45 variables of 202 patients diagnosed with AVM who underwent SRS treatment to cure this disease was used. The data were collected from different medical sources at the Instituto de Radiocirugía del Perú (IRP) between 2005 and 2018 following the process shown in Figure 2.
The variables that were collected from patient data were considered as input data (predictors) and were grouped into 5 categories: sociodemographic (S), clinical (C), treatment (T), angioarchitecture (A), and radiosurgery (R). The variable for patients being cured at 36 months after radiosurgery was considered as output data (response). Table 1 shows the structure of the dataset used in this study.
The dataset is tabular and is made up of 202 records (rows) and 45 variables (columns), in which the rows correspond to the patient data and the columns represent the variables considered in the study. The first 44 variables were considered as input variables to the system (independent variables) and the last column as the output variable (dependent variable), representing patients being cured (cured = 1) or not (cured = 0).
2.2. Data Preprocessing
Before carrying out any data processing and because this was a medical application, it was advisable to analyze the data regarding possible confounding variables that could have an undesired impact on our prediction results [21]; for this, we analyzed the possible confounding variables gender and age.
For the categorical variable gender, the chi-square test of homogeneity was performed to verify whether the difference in the number of men and women in each data group was statistically significant, and no difference was found (p-value = 0.566; Figure 3a). For the age variable, Student's t-test was applied to verify whether there was a statistically significant difference in age between groups (class 0, mean = 31.97; class 1, mean = 26.72), and again no difference was found (p- value = 0.058; Figure 3b).
From this analysis, we concluded that the variables age and gender should not be considered as confounding variables, so we moved forward with the data preprocessing.
Finally, in order to avoid prediction biases and build the ML system effectively, variable selection and data balancing were carried out.
2.2.1. Variable selection
After an analysis by expert judgment, 6 independent variables were identified that were considered not to influence the prognosis of being cured, so they were excluded from the study (residence, education_level, health_insurance, mri_examination, ct_examination, and das_examination).
Additionally, correlation analysis of the 38 remaining independent variables was carried out; Cramer’s test [22] was applied to identify the linear correlation between categorical variables and Pearson's test (Pearson's correlation coefficient) for the numerical variables; in both cases, a threshold value greater than or equal to 0.7 was used to determine correlation, and 6 correlated variables that exceeded the threshold were identified (Table 2). The dython library [23], which is available for the Python programming language, was used to perform the calculations. Finally, 12 independent variables were discarded, leaving a dataset made up of 32 independent variables and 1 dependent variable, which were used in the ML system proposed in this study (Table 3).
* Dependent variable.
The final dataset was made up of 202 records, with 32 independent variables and 1 dependent variable, which was divided into two datasets, 75% (n = 151) for ML model training and validation and 25% (n = 51) for testing. In addition, the 32 independent variables of the training and validation set were normalized using the min-max technique [24].
2.2.2. Data balancing
The original training dataset had a data imbalance with respect to the dependent variable, cured, in that it consisted of 125 records of class 1 and 26 of class 0. The imbalance was corrected by applying the synthetic minority oversampling technique (SMOTE), which creates new synthetic instances of the minority class instead of repeating them [25,26]. We obtained 250 records in total, 125 records for each class, as shown in Figure 4.
Finally, two training datasets were obtained: an imbalanced training dataset made up of 151 records, and a balanced training dataset made up of 250 records. Both datasets were represented by a data matrix of dimension n × 32, in which the observation i can be expressed as oi = [o0, o1, . . ., o32] ∈ Rnx32, where n is the number of observations or records in the dataset.
2.3. Machine Learning Models
For the construction, validation, and evaluation of the ML system, we used the process shown in Figure 5, which consisted of using the two training datasets (balanced and imbalanced) to build and validate the two ML models (DT and LR) in four experimental scenarios; based on the results, the model with the best performance metrics was chosen. Scenario 1 refers to the imbalanced training data with the DT model, scenario 2 refers to the imbalanced training data with the RL model, scenario 3 refers to the balanced training data with the DT model, and scenario 4 refers to the balanced training data with the RL model.
Additionally, the LR method was used to identify the most important factors that determine the probability of patients’ being cured (clinical interpretability).
In the training phase, the grid search technique [27] was used to find the optimal hyperparameters of the ML models in each of the four scenarios. The set of search values defined for the hyperparameters is given in Table 4.
During the training process, the resampling technique was used (Figure 6), in which the training dataset was divided into 8 subsets, with 1 set taken for validation and 7 for training, following 8-fold cross-validation, which is a commonly used method for selecting ML models [28,29].
To build the ML models, the scikit-learn 1.0.2 library [30] of Python version 3.8.16 was used in the Google Colab environment. The algorithms and resources used in this research can be found at: https://github.com/mirkorodriguez/ml-prediction-mav
3. Results
The composition of the study population, the performance of the prediction models, and the explainability of the prediction are presented below.
3.1. Study population
This study included 202 patients with AVM who underwent stereotactic radiosurgery between 2005 and 2018 at the IRP. As shown in Figure 7, 167 patients (82.20%) were cured 36 months after the surgical intervention.
Table 5 shows the sociodemographic characteristics of the population included this study: 52.97% were men and 47.03% were women; 70.49% of patients were in the age range of 18 to 59 years; 80.69% were from Lima or Callao; 18.82% had a preschool or grade school education and 52.97% had only a high school education; and 42.08% had insurance through the Ministry of Health of Peru (SIS).
Table 6 shows the clinical characteristics of the patients. It can be seen that the average time from radiosurgery to AVM cure (obliteration) was 22.07 months, the average radiation dose was 17.86 Gray, the average AVM diameter was 2.14 centimeters, and the average number of isocenters applied was 1.35. On average, radiosurgery was performed in a single session.
Table 7 shows the statistics of the patients’ previous treatments before SRS. Of the 202 patients, 31 had undergone surgical treatment and 49 had prior embolization. As part of the treatment, 22 only underwent surgery, 40 only embolization, and 9 both surgery and embolization. The embolizing agents were Onyx (52%) and Histoacryl (48%). In total, 155 patients had previous cerebral hemorrhage, 76 developed encephalomalacia, 178 had headache, and 112 had seizures; furthermore, 55% presented some type of deficit (motor, sensory, or cognitive). Regarding the angioarchitecture (characteristics) of the AVM, most (100) were located on the left side of the brain and most (96) were categorized as deep; most treated AVMs (95) had moderately intense flow.
Finally, Table 8 shows the anatomical locations of AVMs, which were mainly found in basal ganglia (16.83%), frontal lobe (9.9%), insular cortex (6.93%), parieto-occipital region (6.93%), mesio-temporal region (6.93%), and cerebellum (6.44%).
3.2. Performance of prediction models
The results obtained by the models using the data in the testing set are described below.
Table 9 shows the optimal hyperparameters identified for each scenario that were used in the models for prediction.
Figure 8 shows the confusion matrices obtained as a result of evaluating the best ML model from each of four predefined scenarios with the testing dataset. Figure 9 shows the AUC curve for each scenario.
Table 10 shows the results of the experiments with the four scenarios in terms of their performance metrics. It can be seen that the best model according to the performance metrics is the LR model built with the balanced dataset.
3.3. Explainability of models
In order to have a general idea about the explainability of the results obtained by the models used in this research, the LR model built with balanced data (scenario 4) was used based on its good prediction results and its interpretability through the calculation of the odds ratio (importance) [31]. Table 11 shows the variables (features) and their level of importance in explaining the probability of patients with AVM being cured 36 months after SRS, among which 18 have a negative influence and 14 have a positive influence. The five most important variables that positively influence being cured are: (1) the location of the AVM (side_avm), (2) the occupation of the patient (occupation), (3) the presence of bleeding in the AVM (hemorrhage), (4) previous cranial surgery (prev_cran_surgery), and (5) the type of venous drainage (type_venous_drainage). It is important to highlight that the patient's occupation is an antecedent of the disease, but it is not clinically relevant; however, it is an interesting finding that should be evaluated in greater detail in another study.
4. Discussion
The use of ML techniques in the medical field has increased in recent years, and their application as a support system for medical decision-making when diagnosing and prognosing diseases is increasingly useful [32]. Recent studies suggest that these techniques can be applied for the diagnosis of diseases related to the brain and the central nervous system, such as Alzheimer’s disease (AD) [33], Parkinson’s disease (PD) [34,35], schizophrenia [36], and tumors [37,38]. Inspired by the use of these techniques in medicine, and specifically for the prognosis of patients with AVM [19,20,39], this study proposes a method that makes it possible to predict whether or not a patient with AVM who undergoes SRS will be cured at 36 months after the intervention. We demonstrate that using ML techniques for the prognosis of patients with AVMs would be possible. Our approach involved evaluating four scenarios using two ML models and two datasets (imbalanced and balanced data). After following a traditional process to construct the ML models, in which oversampling, grid search, and cross-validation techniques were also applied, it was found that the best model to predict whether patients with AVM would be cured was the LR model trained with balanced data (accuracy 92.16%, AUC 97.62%).
From the results obtained in this study, it is evident that the LR model is superior to the DT model even when trained with imbalanced data, as shown in Table 10. It is pertinent to highlight that the data preprocessing (selection of variables and balancing) performed in this study led to significantly higher results for the two models (DT and LR) than when the data were not preprocessed, so we can argue that data preprocessing should be included in any approach that uses a ML model. In addition, the results obtained in this study (accuracy 92.16%) were found to be superior to the results obtained in studies using similar procedures, such as those by Oermann et al. [20] and Meng et al. [39], who obtained accuracy of 74% and 83%, respectively.
The importance of the results of this study goes beyond the possibility of using this method for the medical prognosis of patients with AVM; they also allow us to confirm that it is possible to use an ML model, understood as a generalizable framework, in medicine by using historical data to predict the future. In this case, we used historical information over a 14-year time horizon, from which sociodemographic and medical data were collected to build an ML system that achieved very good prediction results and could be used as a tool by medical professionals for decision-making when dealing with new AVM cases.
The proposed approach for the prognosis and explainability of whether patients with AVM will be cured has no limitations; however, the results of these models are limited to the dataset used in this study, so its application in medical practice requires more experiments with larger amounts of data. The possibility of including additional medical variables should also be evaluated.
Finally, it is important to highlight that two ML models considered to be transparent, or “white box”, models [40], whose results are easy to interpret, were used in this study, and the odds ratios for the LR model were used to identify the variables that positively influence whether patients with AVM will be cured. However, it would be important to contrast the interpretability with more sophisticated explainability techniques such as local interpretable model-agnostic explanations (LIME), Shapley additive explanations (SHAP) and others, which are focused on identifying the most important predictors for any type of ML model, including those considered “black box” models.
Author Contributions
Conceptualization, M.J.R.M., M.V., and M.S.; methodology, M.J.R.M., D.M., R.B., and L.Z.; software, M.J.R.M, R.B., and L.Z.; validation, M.J.R.M., M.V., and D.M.; formal analysis, M.J.R.M., M.V., and M.S.; investigation, M.J.R.M., D.M., R.B., L.Z., and M.S.; resources, M.S., R.B., and L.Z.; data curation, M.J.R.M. and M.S.; writing—original draft preparation, M.J.R.M. and M.S.; writing—review and editing, M.J.R.M., M.V., D.M., R.B., and L.Z.; visualization, M.S., R.B., and L.Z.; supervision, M.J.R.M., M.V., and D.M.; project administration, M.S., R.B., and L.Z. All authors have read and agreed to the published version of the manuscript.
Funding
This research received no external funding.
Institutional Review Board Statement
Not applicable.
Informed Consent Statement
Not applicable.
Data Availability Statement
The data presented in this study are available on request from the corresponding author. The data are not publicly available due to institutional (Instituto de Radiocirugía del Perú) regulations and protection of patient privacy.
Conflicts of Interest
The authors declare no conflict of interest.
References
- Solomon, R.A.; Connolly, E.S. Arteriovenous Malformations of the Brain. N. Engl. J. Med. 2017, 376, 1859–1866. [Google Scholar] [CrossRef] [PubMed]
- Friedman, W.A.; Bova, F.J. Radiosurgery for Arteriovenous Malformations. Neurol. Res. 2011, 33, 803–819. [Google Scholar] [CrossRef] [PubMed]
- Plasencia, A.R.; Santillan, A. Embolization and Radiosurgery for Arteriovenous Malformations. Surg. Neurol. Int. 2012, 3, S90–S104. [Google Scholar] [CrossRef] [PubMed]
- Ding, D.; Liu, K.C. Predictive Capability of the Spetzler-Martin versus Supplementary Grading Scale for Microsurgical Outcomes of Cerebellar Arteriovenous Malformations. J. Cerebrovasc. Endovasc. Neurosurg. 2013, 15, 307–310. [Google Scholar] [CrossRef] [PubMed]
- Kim, H.; Abla, A.A.; Nelson, J.; McCulloch, C.E.; Bervini, D.; Morgan, M.K.; Stapleton, C.; Walcott, B.P.; Ogilvy, C.S.; Spetzler, R.F.; et al. Validation of the Supplemented Spetzler-Martin Grading System for Brain Arteriovenous Malformations in a Multicenter Cohort of 1009 Surgical Patients. Neurosurgery 2015, 76, 25–31. [Google Scholar] [CrossRef]
- Starke, R.M.; Yen, C.-P.; Ding, D.; Sheehan, J.P. A Practical Grading Scale for Predicting Outcome after Radiosurgery for Arteriovenous Malformations: Analysis of 1012 Treated Patients. J. Neurosurg. 2013, 119, 981–987. [Google Scholar] [CrossRef]
- Segato, A.; Marzullo, A.; Calimeri, F.; De Momi, E. Artificial Intelligence for Brain Diseases: A Systematic Review. APL Bioeng. 2020, 4, 041503. [Google Scholar] [CrossRef]
- Basu, K.; Sinha, R.; Ong, A.; Basu, T. Artificial Intelligence: How Is It Changing Medical Sciences and Its Future? Indian J. Dermatol. 2020, 65, 365–370. [Google Scholar] [CrossRef]
- Senders, J.T.; Staples, P.C.; Karhade, A.V.; Zaki, M.M.; Gormley, W.B.; Broekman, M.L.D.; Smith, T.R.; Arnaout, O. Machine Learning and Neurosurgical Outcome Prediction: A Systematic Review. World Neurosurg. 2018, 109, 476–486. [Google Scholar] [CrossRef]
- Yang, Y.J.; Bang, C.S. Application of Artificial Intelligence in Gastroenterology. World J. Gastroenterol. 2019, 25, 1666–1683. [Google Scholar] [CrossRef]
- Panesar, S.S.; D’Souza, R.N.; Yeh, F.-C.; Fernandez-Miranda, J.C. Machine Learning Versus Logistic Regression Methods for 2-Year Mortality Prognostication in a Small, Heterogeneous Glioma Database. World Neurosurg. X 2019, 2, 100012. [Google Scholar] [CrossRef] [PubMed]
- Marcus, J.L.; Sewell, W.C.; Balzer, L.B.; Krakower, D.S. Artificial Intelligence and Machine Learning for HIV Prevention: Emerging Approaches to Ending the Epidemic. Curr. HIV/AIDS Rep. 2020, 17, 171–179. [Google Scholar] [CrossRef] [PubMed]
- Vega-Huerta, H.; Villanueva-Alarcón, R.; Mauricio, D.; Moreno, J.G.; Vilca, H.D.C.; Rodriguez, D.; Rodriguez, C. Convolutional Neural Networks on Assembling Classification Models to Detect Melanoma Skin Cancer. Int. J. Online Biomed. Eng. IJOE 2022, 18, 59–76. [Google Scholar] [CrossRef]
- Uspenskaya-Cadoz, O.; Alamuri, C.; Wang, L.; Yang, M.; Khinda, S.; Nigmatullina, Y.; Cao, T.; Kayal, N.; O’Keefe, M.; Rubel, C. Machine Learning Algorithm Helps Identify Non-Diagnosed Prodromal Alzheimer’s Disease Patients in the General Population. J. Prev. Alzheimers Dis. 2019, 6, 185–191. [Google Scholar] [CrossRef] [PubMed]
- Ghafouri-Fard, S.; Taheri, M.; Omrani, M.D.; Daaee, A.; Mohammad-Rahimi, H. Application of Artificial Neural Network for Prediction of Risk of Multiple Sclerosis Based on Single Nucleotide Polymorphism Genotypes. J. Mol. Neurosci. MN 2020, 70, 1081–1087. [Google Scholar] [CrossRef] [PubMed]
- Tao, W.; Yan, L.; Zeng, M.; Chen, F. Factors Affecting the Performance of Brain Arteriovenous Malformation Rupture Prediction Models. BMC Med. Inform. Decis. Mak. 2021, 21, 142. [Google Scholar] [CrossRef]
- Hong, J.-S.; Lin, C.-J.; Lin, Y.-H.; Lee, C.-C.; Yang, H.-C.; Meng, L.-H.; Lin, T.-M.; Hu, Y.-S.; Guo, W.-Y.; Chu, W.-F.; et al. Machine Learning Application With Quantitative Digital Subtraction Angiography for Detection of Hemorrhagic Brain Arteriovenous Malformations. EEE Access 2020, 8, 204573–204584. [Google Scholar] [CrossRef]
- Wang, T.; Lei, Y.; Tian, S.; Jiang, X.; Zhou, J.; Liu, T.; Dresser, S.; Curran, W.J.; Shu, H.-K.; Yang, X. Learning-Based Automatic Segmentation of Arteriovenous Malformations on Contrast CT Images in Brain Stereotactic Radiosurgery. Med. Phys. 2019, 46, 3133–3141. [Google Scholar] [CrossRef]
- Asadi, H.; Kok, H.K.; Looby, S.; Brennan, P.; O’Hare, A.; Thornton, J. Outcomes and Complications After Endovascular Treatment of Brain Arteriovenous Malformations: A Prognostication Attempt Using Artificial Intelligence. World Neurosurg. 2016, 96, 562–569. [Google Scholar] [CrossRef]
- Oermann, E.K.; Rubinsteyn, A.; Ding, D.; Mascitelli, J.; Starke, R.M.; Bederson, J.B.; Kano, H.; Lunsford, L.D.; Sheehan, J.P.; Hammerbacher, J.; et al. Using a Machine Learning Approach to Predict Outcomes after Radiosurgery for Cerebral Arteriovenous Malformations. Sci. Rep. 2016, 6, 21161. [Google Scholar] [CrossRef]
- Rao, A.; Monteiro, J.M.; Mourao-Miranda, J. ; Alzheimer’s Disease Initiative Predictive Modelling Using Neuroimaging Data in the Presence of Confounds. NeuroImage 2017, 150, 23–49. [Google Scholar] [CrossRef] [PubMed]
- Cramer, H. Mathematical Methods of Statistics; Princeton mathematical series; Princeton University Press: Princeton, 1946. [Google Scholar]
- Zychlinski, S. Dython: A Set of Data Tools in Python.
- Ahsan, M.M.; Mahmud, M.A.P.; Saha, P.K.; Gupta, K.D.; Siddique, Z. Effect of Data Scaling Methods on Machine Learning Algorithms and Model Performance. Technologies 2021, 9, 52. [Google Scholar] [CrossRef]
- Chawla, N.V.; Bowyer, K.W.; Hall, L.O.; Kegelmeyer, W.P. SMOTE: Synthetic Minority Over-Sampling Technique. J. Artif. Intell. Res. 2002, 16, 321–357. [Google Scholar] [CrossRef]
- Zhu, T.; Lin, Y.; Liu, Y. Synthetic Minority Oversampling Technique for Multiclass Imbalance Problems. Pattern Recognit. 2017, 72, 327–340. [Google Scholar] [CrossRef]
- Bzdok, D.; Altman, N.; Krzywinski, M. Statistics versus Machine Learning. Nat. Methods 2018, 15, 233–234. [Google Scholar] [CrossRef]
- Zhang, Y.; Yang, Y. Cross-Validation for Selecting a Model Selection Procedure. J. Econom. 2015, 187, 95–112. [Google Scholar] [CrossRef]
- Franklin, J. The Elements of Statistical Learning: Data Mining, Inference and Prediction. Math. Intell. 2005, 27, 83–85. [Google Scholar] [CrossRef]
- Pedregosa, F.; Varoquaux, G.; Gramfort, A.; Michel, V.; Thirion, B.; Grisel, O.; Blondel, M.; Prettenhofer, P.; Weiss, R.; Dubourg, V.; et al. Scikit-Learn: Machine Learning in Python. J. Mach. Learn. Res. 2011, 12, 2825–2830. [Google Scholar]
- Szumilas, M. Explaining Odds Ratios. J. Can. Acad. Child Adolesc. Psychiatry 2010, 19, 227–229. [Google Scholar]
- Brnabic, A.; Hess, L.M. Systematic Literature Review of Machine Learning Methods Used in the Analysis of Real-World Data for Patient-Provider Decision Making. BMC Med. Inform. Decis. Mak. 2021, 21, 54. [Google Scholar] [CrossRef]
- Kavitha, C.; Mani, V.; Srividhya, S.R.; Khalaf, O.I.; Tavera Romero, C.A. Early-Stage Alzheimer’s Disease Prediction Using Machine Learning Models. Front. Public Health 2022, 10, 853294. [Google Scholar] [CrossRef] [PubMed]
- Magesh, P.R.; Myloth, R.D.; Tom, R.J. An Explainable Machine Learning Model for Early Detection of Parkinson’s Disease Using LIME on DaTSCAN Imagery. Comput. Biol. Med. 2020, 126, 104041. [Google Scholar] [CrossRef] [PubMed]
- Chandra, J.; Muthupalaniappan, S.; Shang, Z.; Deng, R.; Lin, R.; Tolkova, I.; Butts, D.; Sul, D.; Marzouk, S.; Bose, S.; et al. Screening of Parkinson’s Disease Using Geometric Features Extracted from Spiral Drawings. Brain Sci. 2021, 11, 1297. [Google Scholar] [CrossRef] [PubMed]
- Hu, M.; Qian, X.; Liu, S.; Koh, A.J.; Sim, K.; Jiang, X.; Guan, C.; Zhou, J.H. Structural and Diffusion MRI Based Schizophrenia Classification Using 2D Pretrained and 3D Naive Convolutional Neural Networks. Schizophr. Res. 2022, 243, 330–341. [Google Scholar] [CrossRef] [PubMed]
- Pintelas, E.; Liaskos, M.; Livieris, I.E.; Kotsiantis, S.; Pintelas, P. Explainable Machine Learning Framework for Image Classification Problems: Case Study on Glioma Cancer Prediction. J. Imaging 2020, 6, 37. [Google Scholar] [CrossRef]
- Maqsood, S.; Damaševičius, R.; Maskeliūnas, R. Multi-Modal Brain Tumor Detection Using Deep Neural Network and Multiclass SVM. Medicina (Mex.) 2022, 58, 1090. [Google Scholar] [CrossRef]
- Meng, X.; Gao, D.; He, H.; Sun, S.; Liu, A.; Jin, H.; Li, Y. A Machine Learning Model Predicts the Outcome of SRS for Residual Arteriovenous Malformations after Partial Embolization: A Real-World Clinical Obstacle. World Neurosurg. 2022, 163, e73–e82. [Google Scholar] [CrossRef]
- Loyola-González, O. Black-Box vs. White-Box: Understanding Their Advantages and Weaknesses From a Practical Point of View. IEEE Access 2019, 7, 154096–154113. [Google Scholar] [CrossRef]
Figure 1.
Proposed ML system.
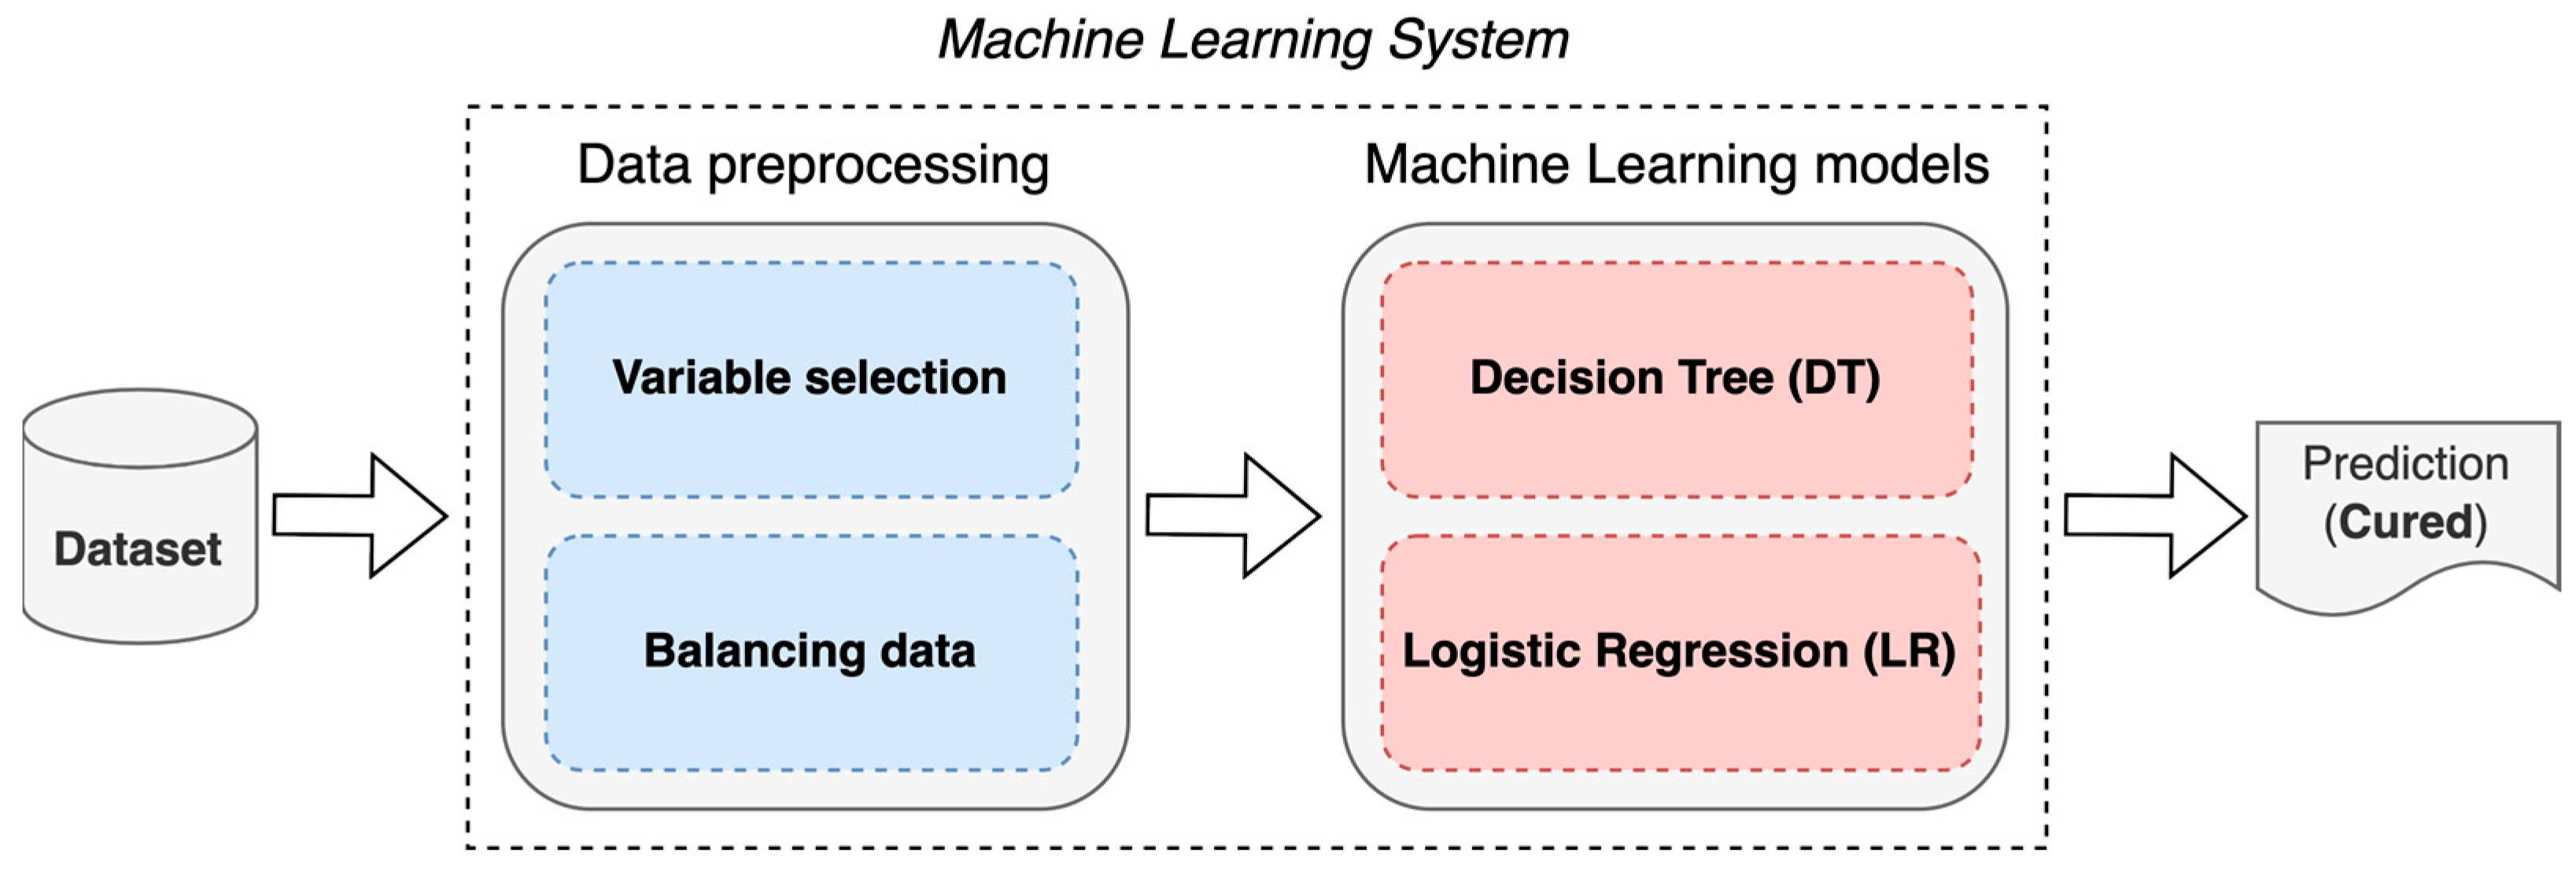
Figure 2.
Data collection process: (A) consent; (B) patient selection; (C) data extraction; (D) data tabulation.
Figure 2.
Data collection process: (A) consent; (B) patient selection; (C) data extraction; (D) data tabulation.
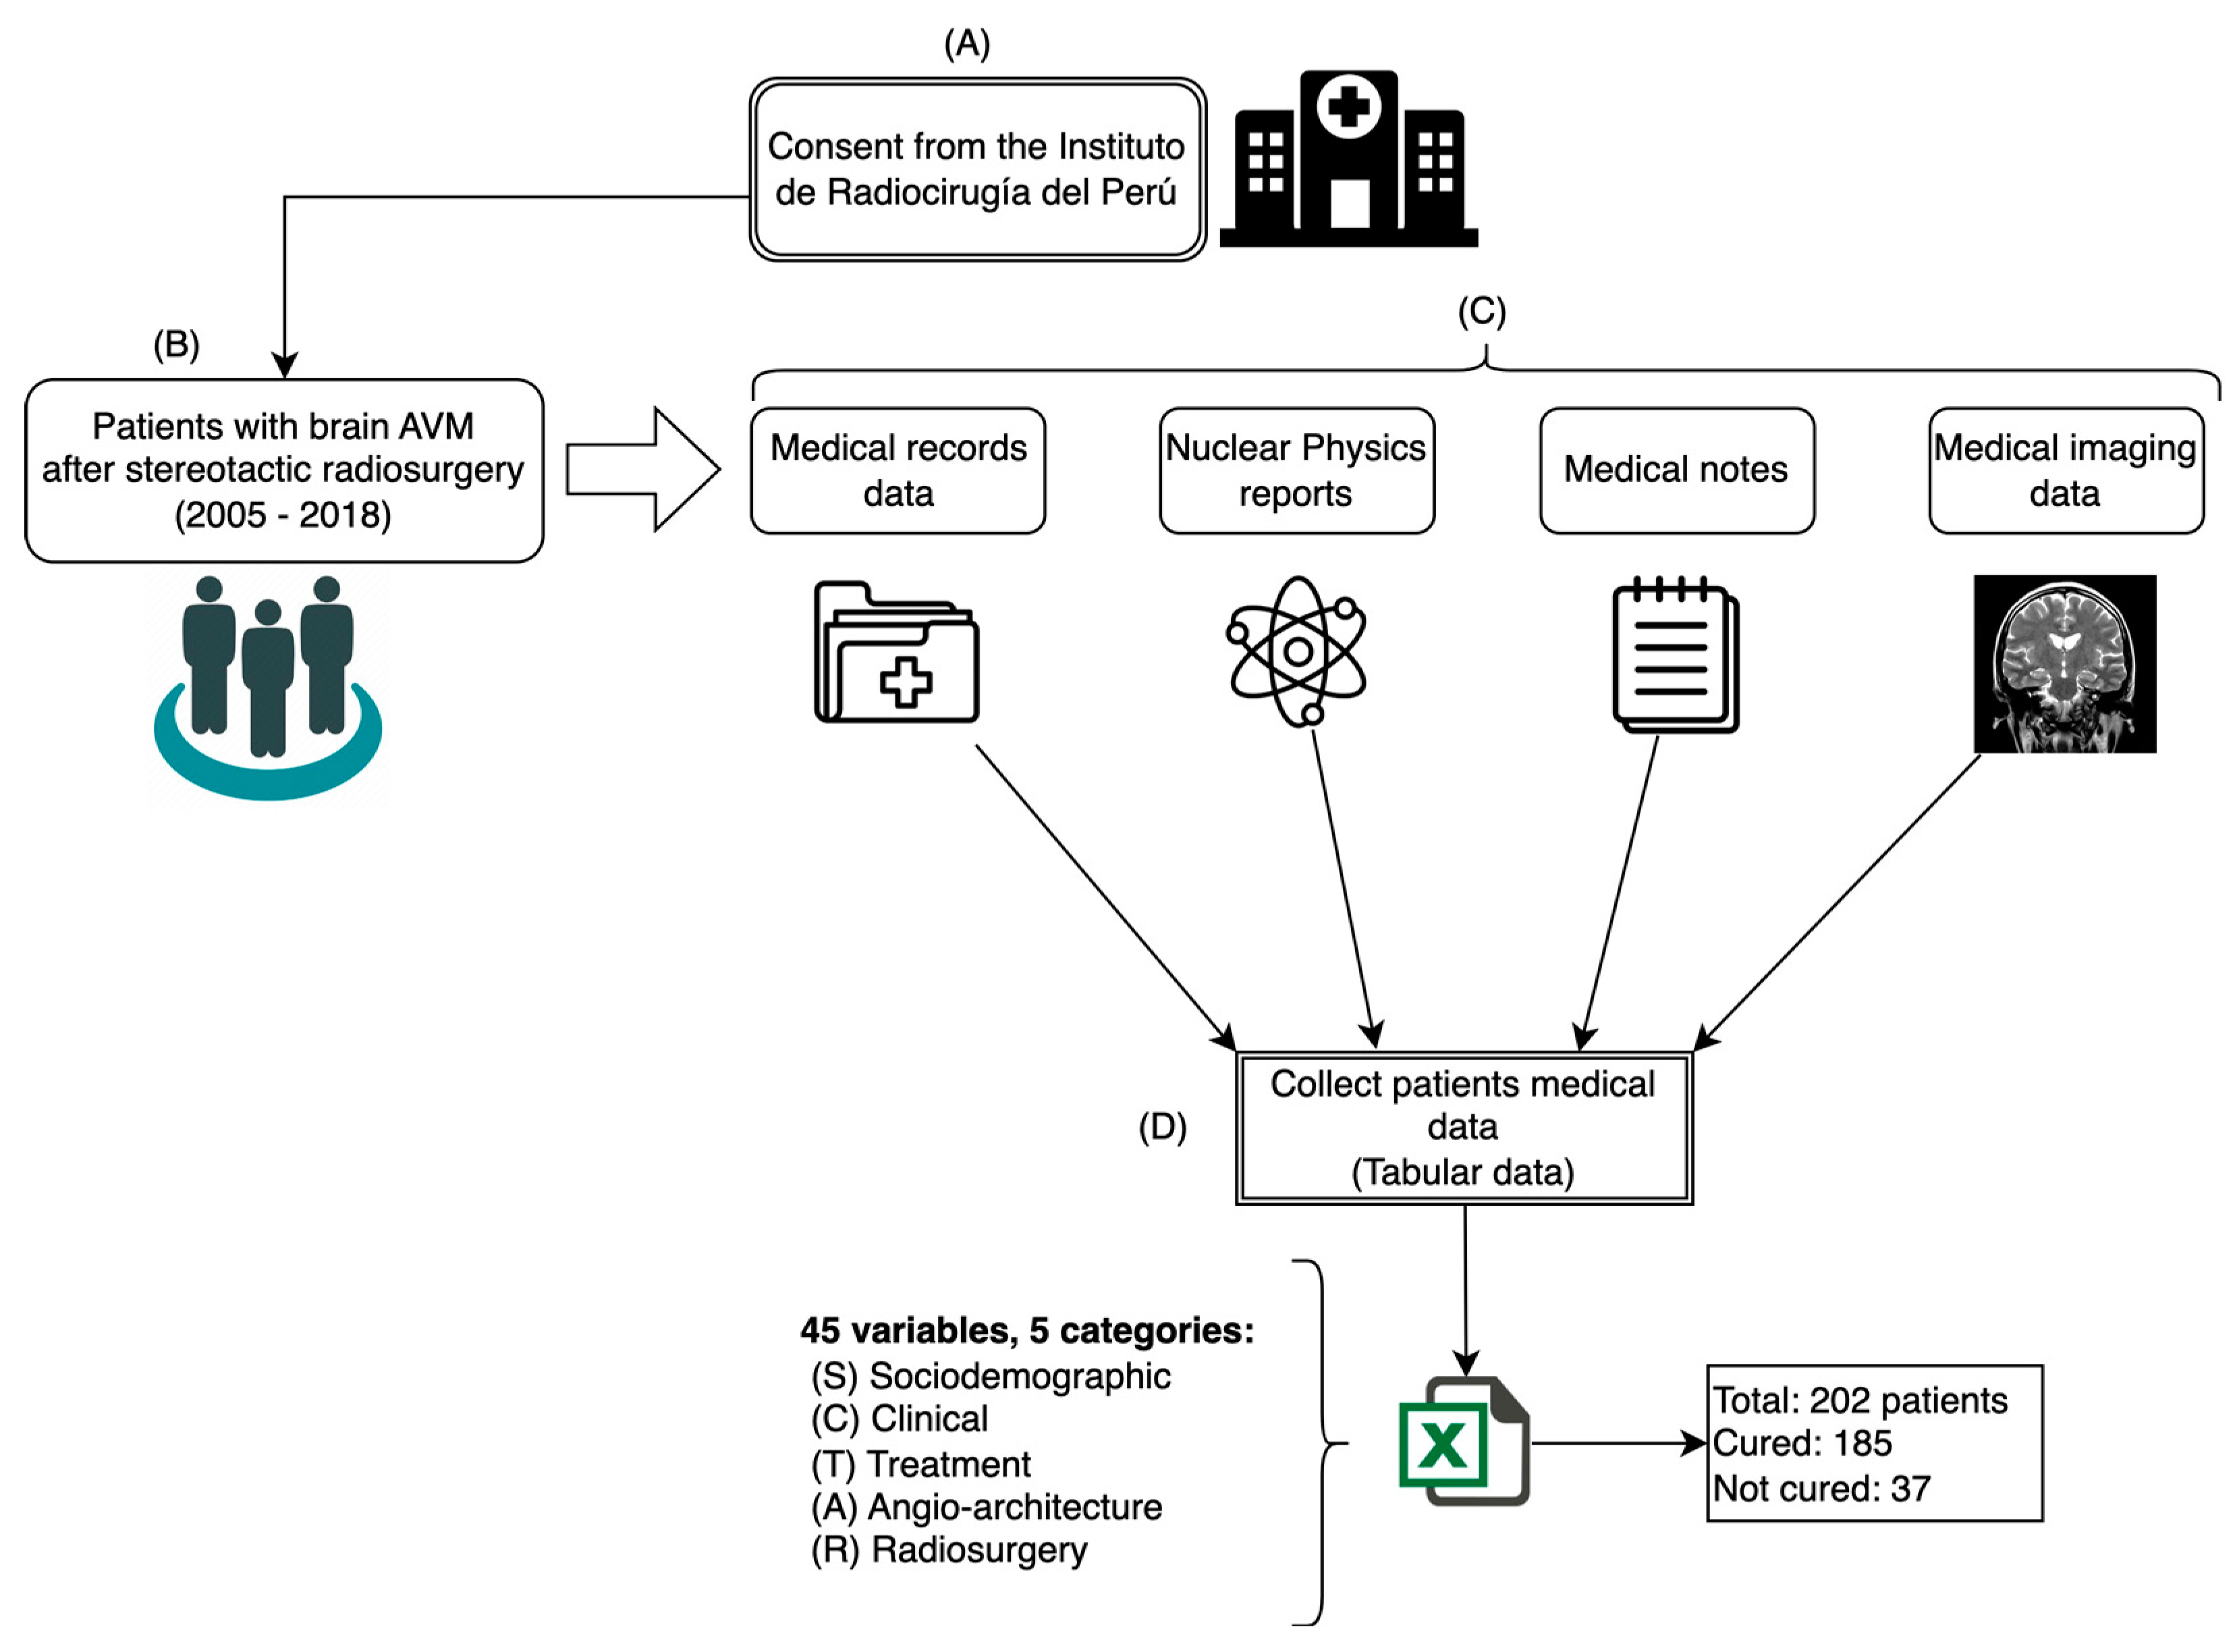
Figure 3.
Analysis of variables in the dataset: (a) gender variable; (b) age variable.
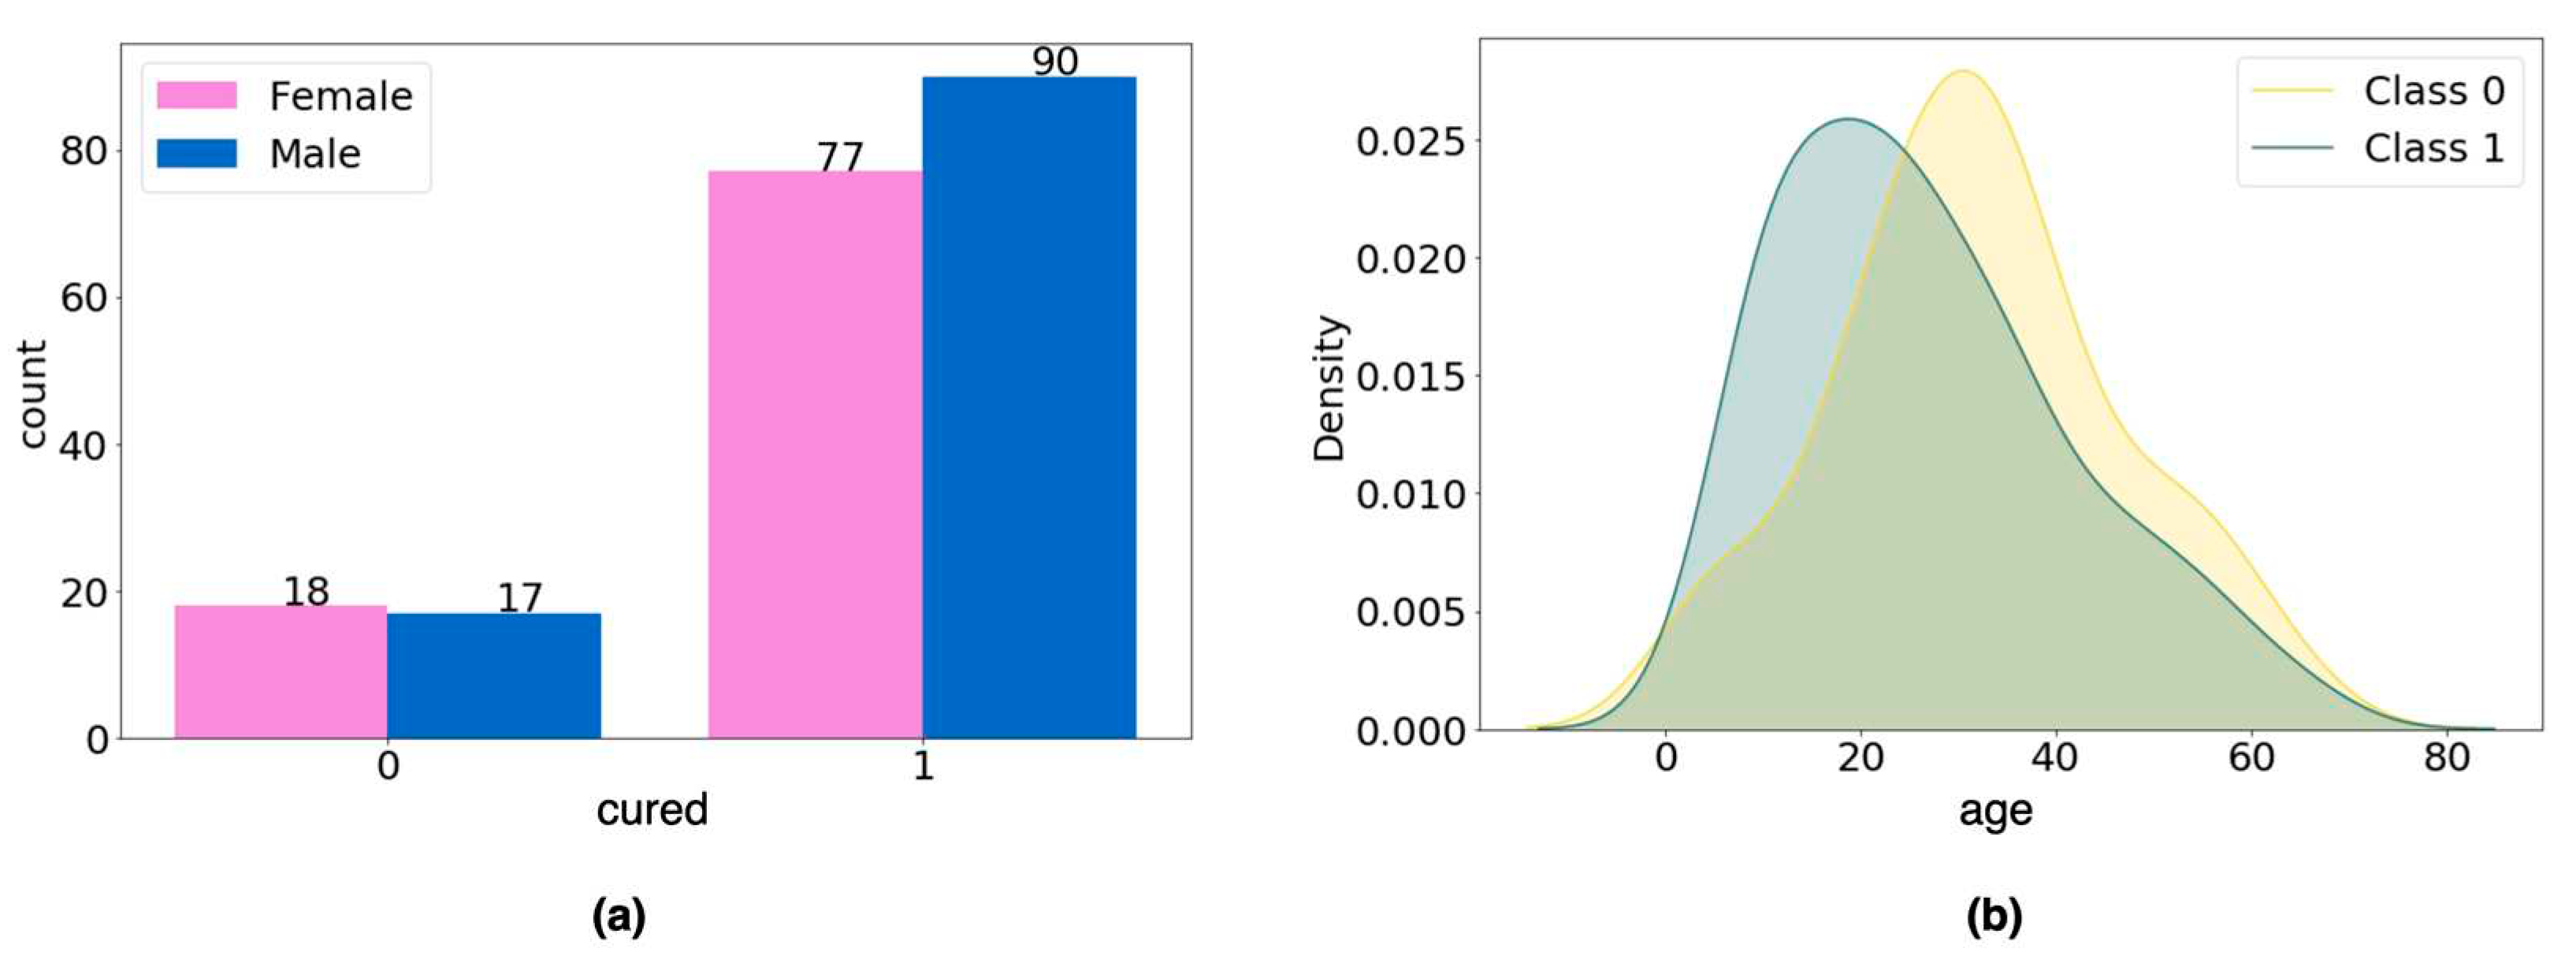
Figure 4.
Number of records for each class: (a) before and (b) after data balancing.
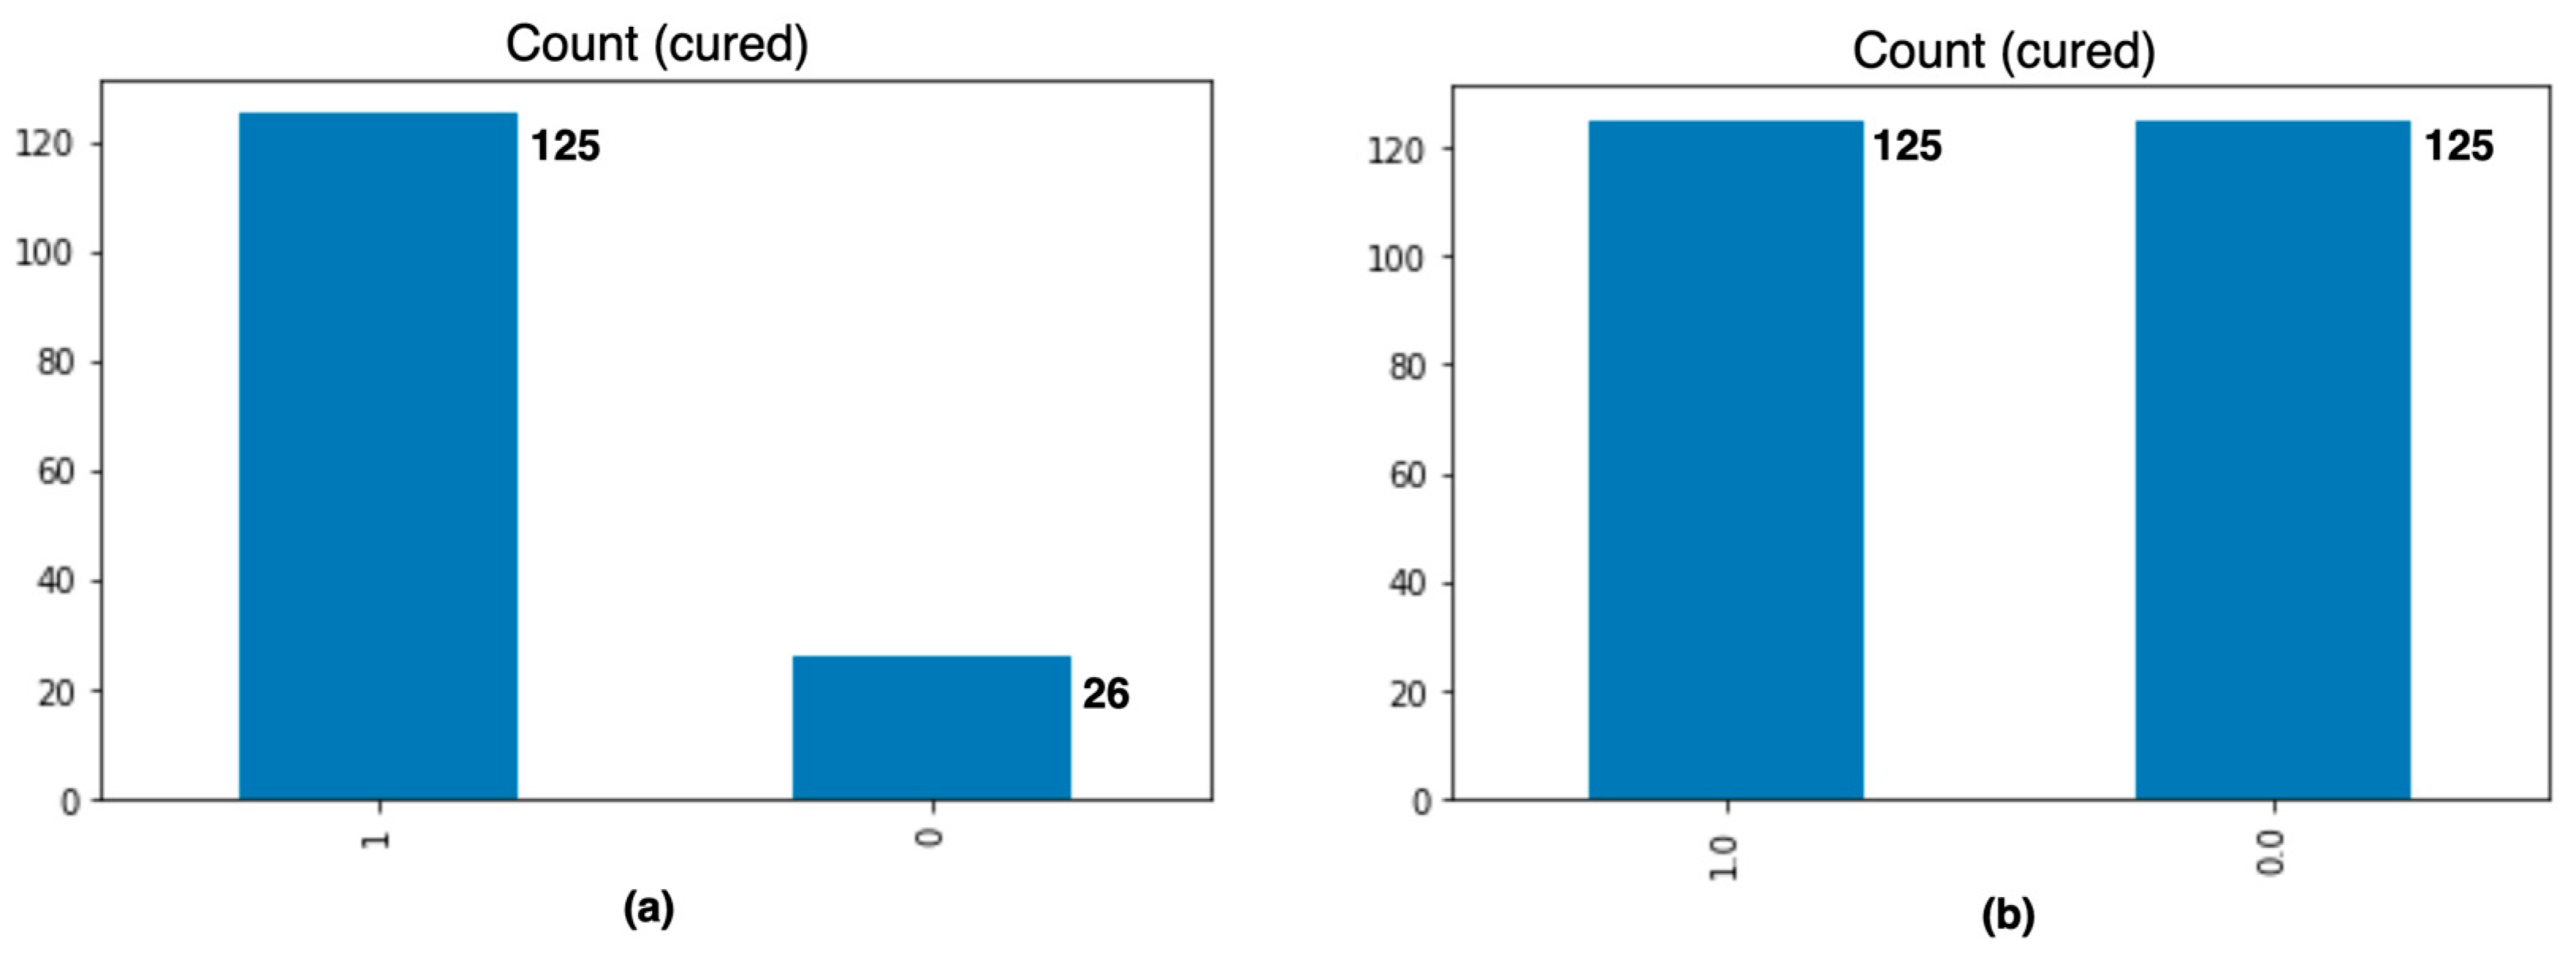
Figure 5.
ML model construction, validation, and evaluation process.
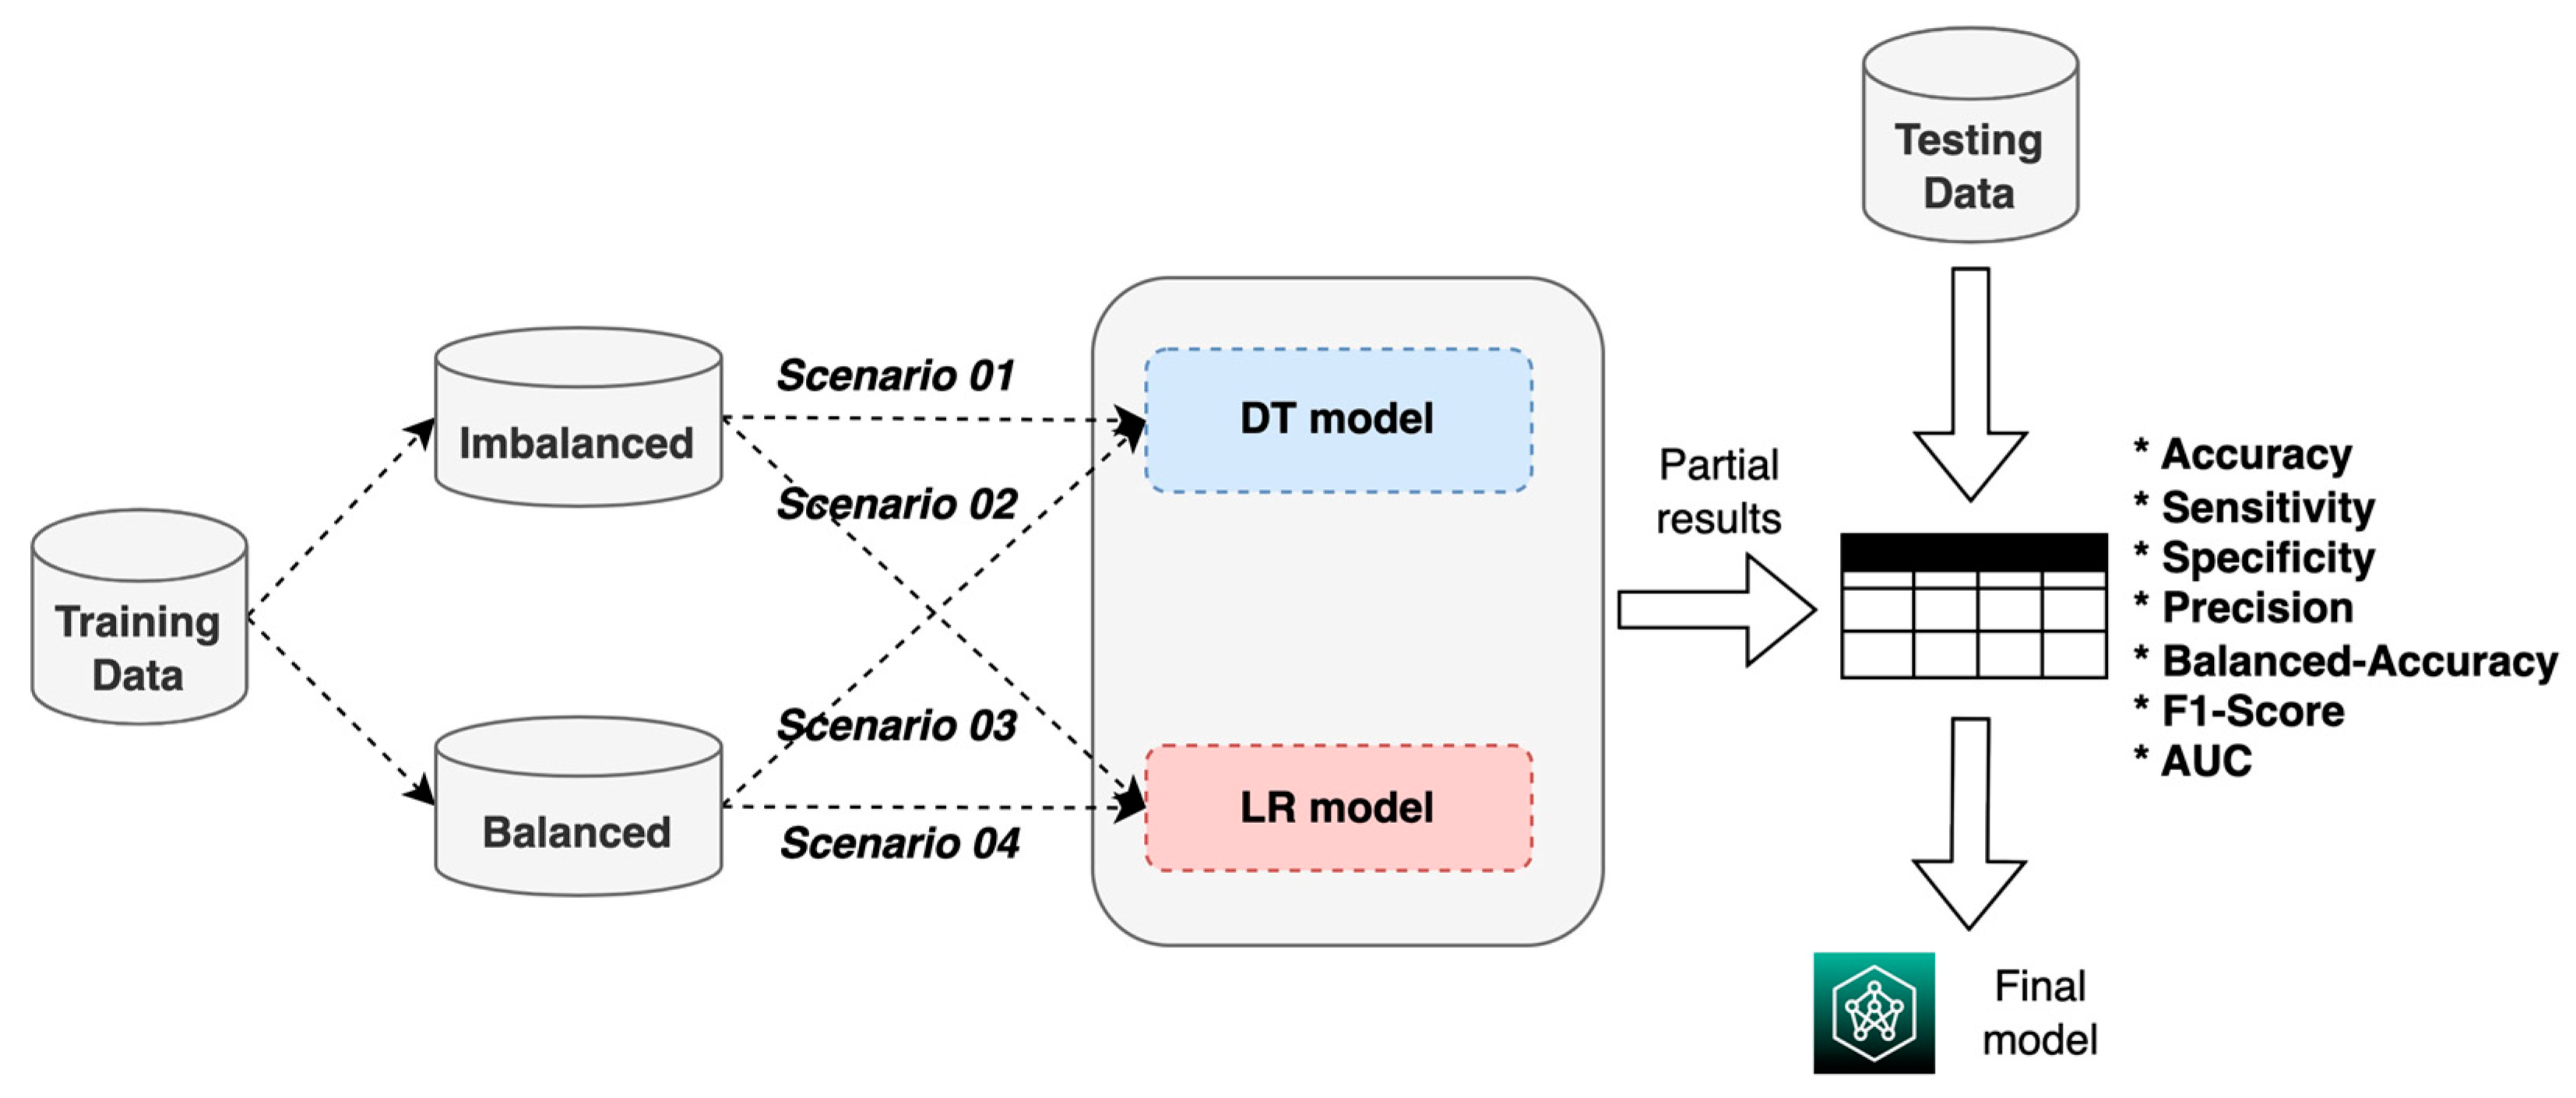
Figure 6.
Process used to train the ML models for each of the four scenarios.
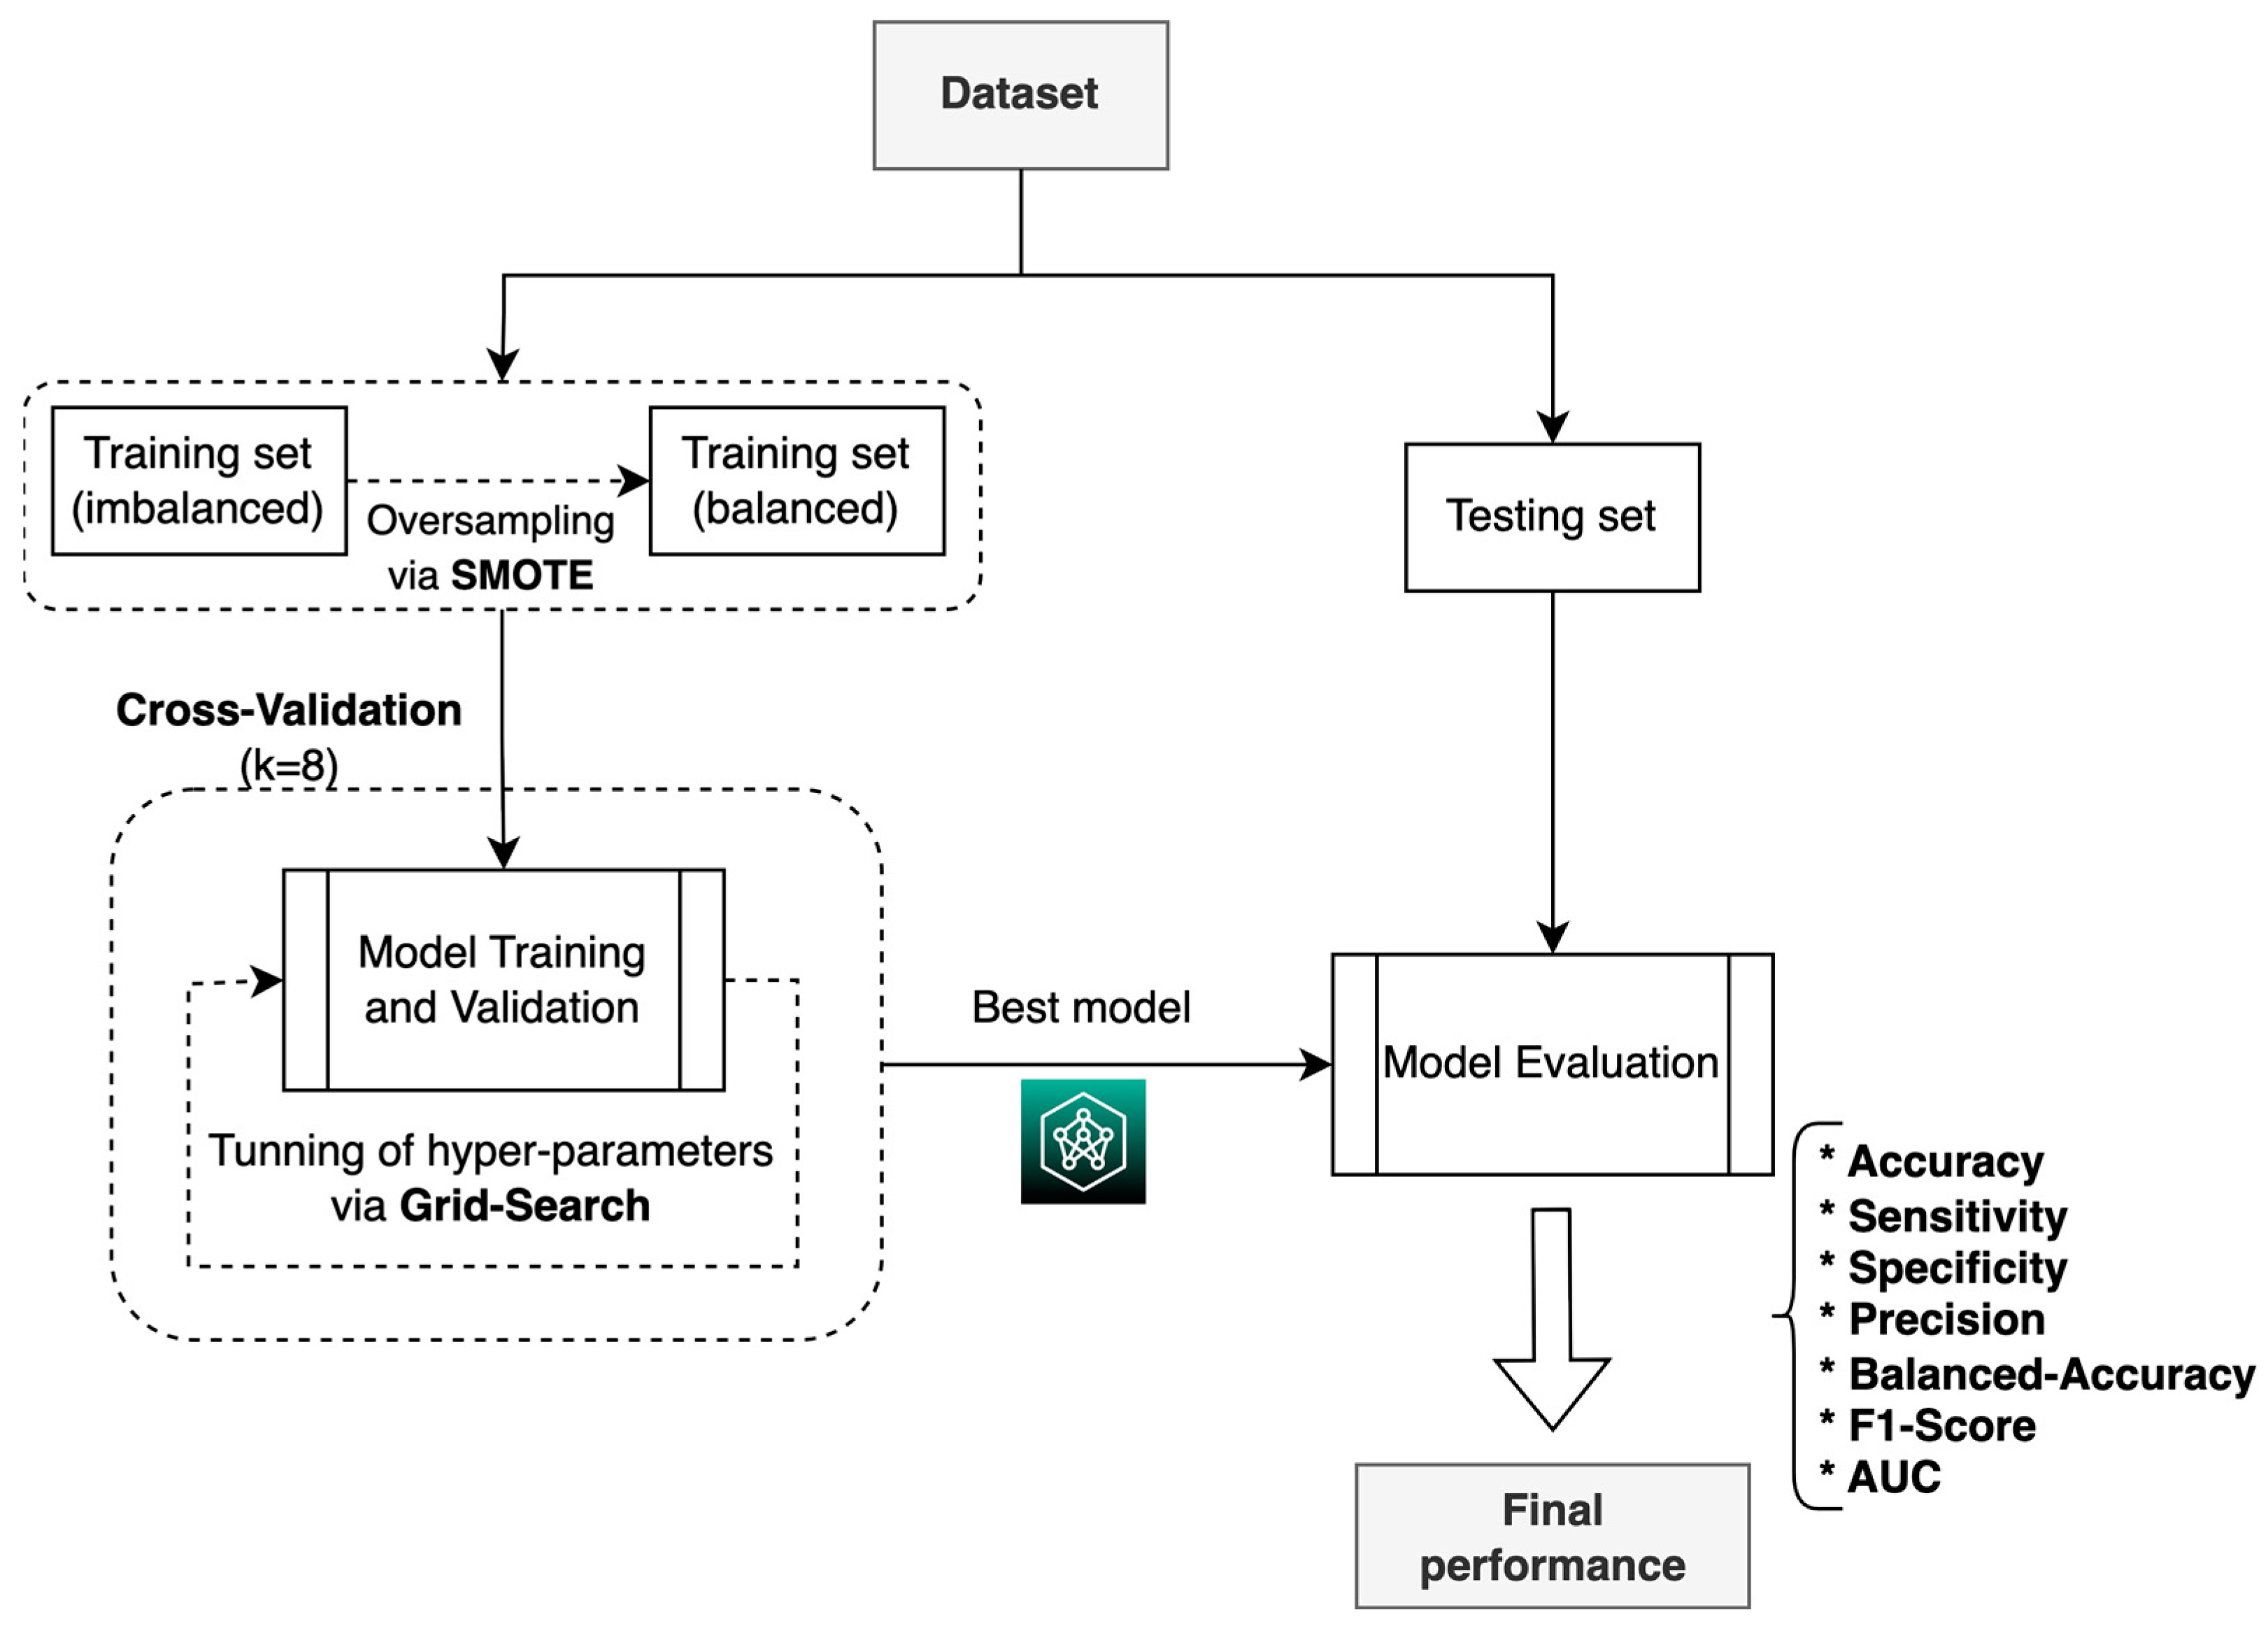
Figure 7.
Distribution of cured variable.
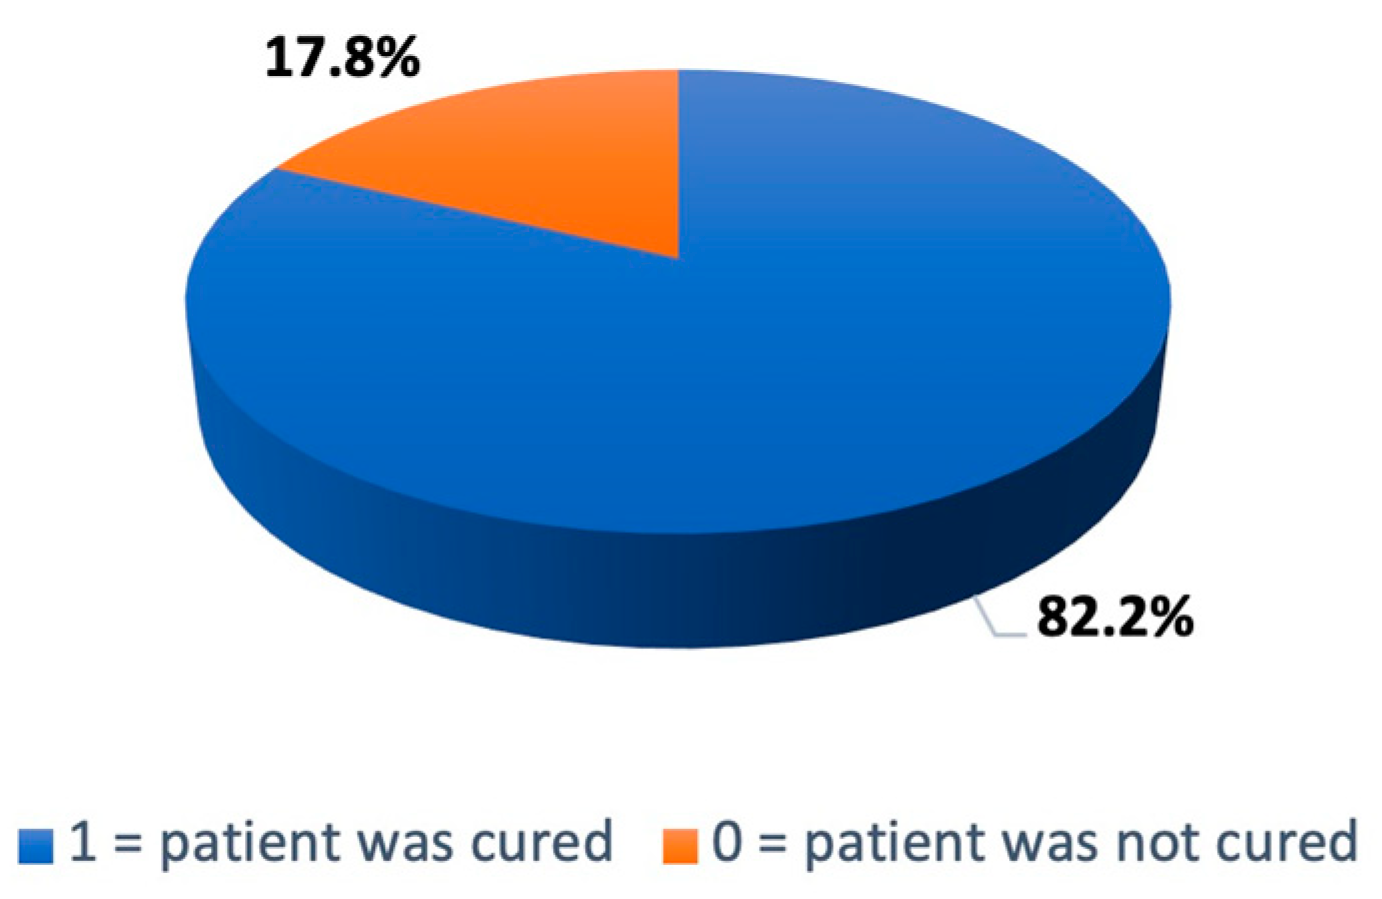
Figure 8.
Confusion matrix of ML models evaluated with testing dataset: (a) DT model built with imbalanced data; (b) DT model built with balanced data; (c) LR model built with imbalanced data; (d) LR model built with balanced data LR model built with balanced data.
Figure 8.
Confusion matrix of ML models evaluated with testing dataset: (a) DT model built with imbalanced data; (b) DT model built with balanced data; (c) LR model built with imbalanced data; (d) LR model built with balanced data LR model built with balanced data.
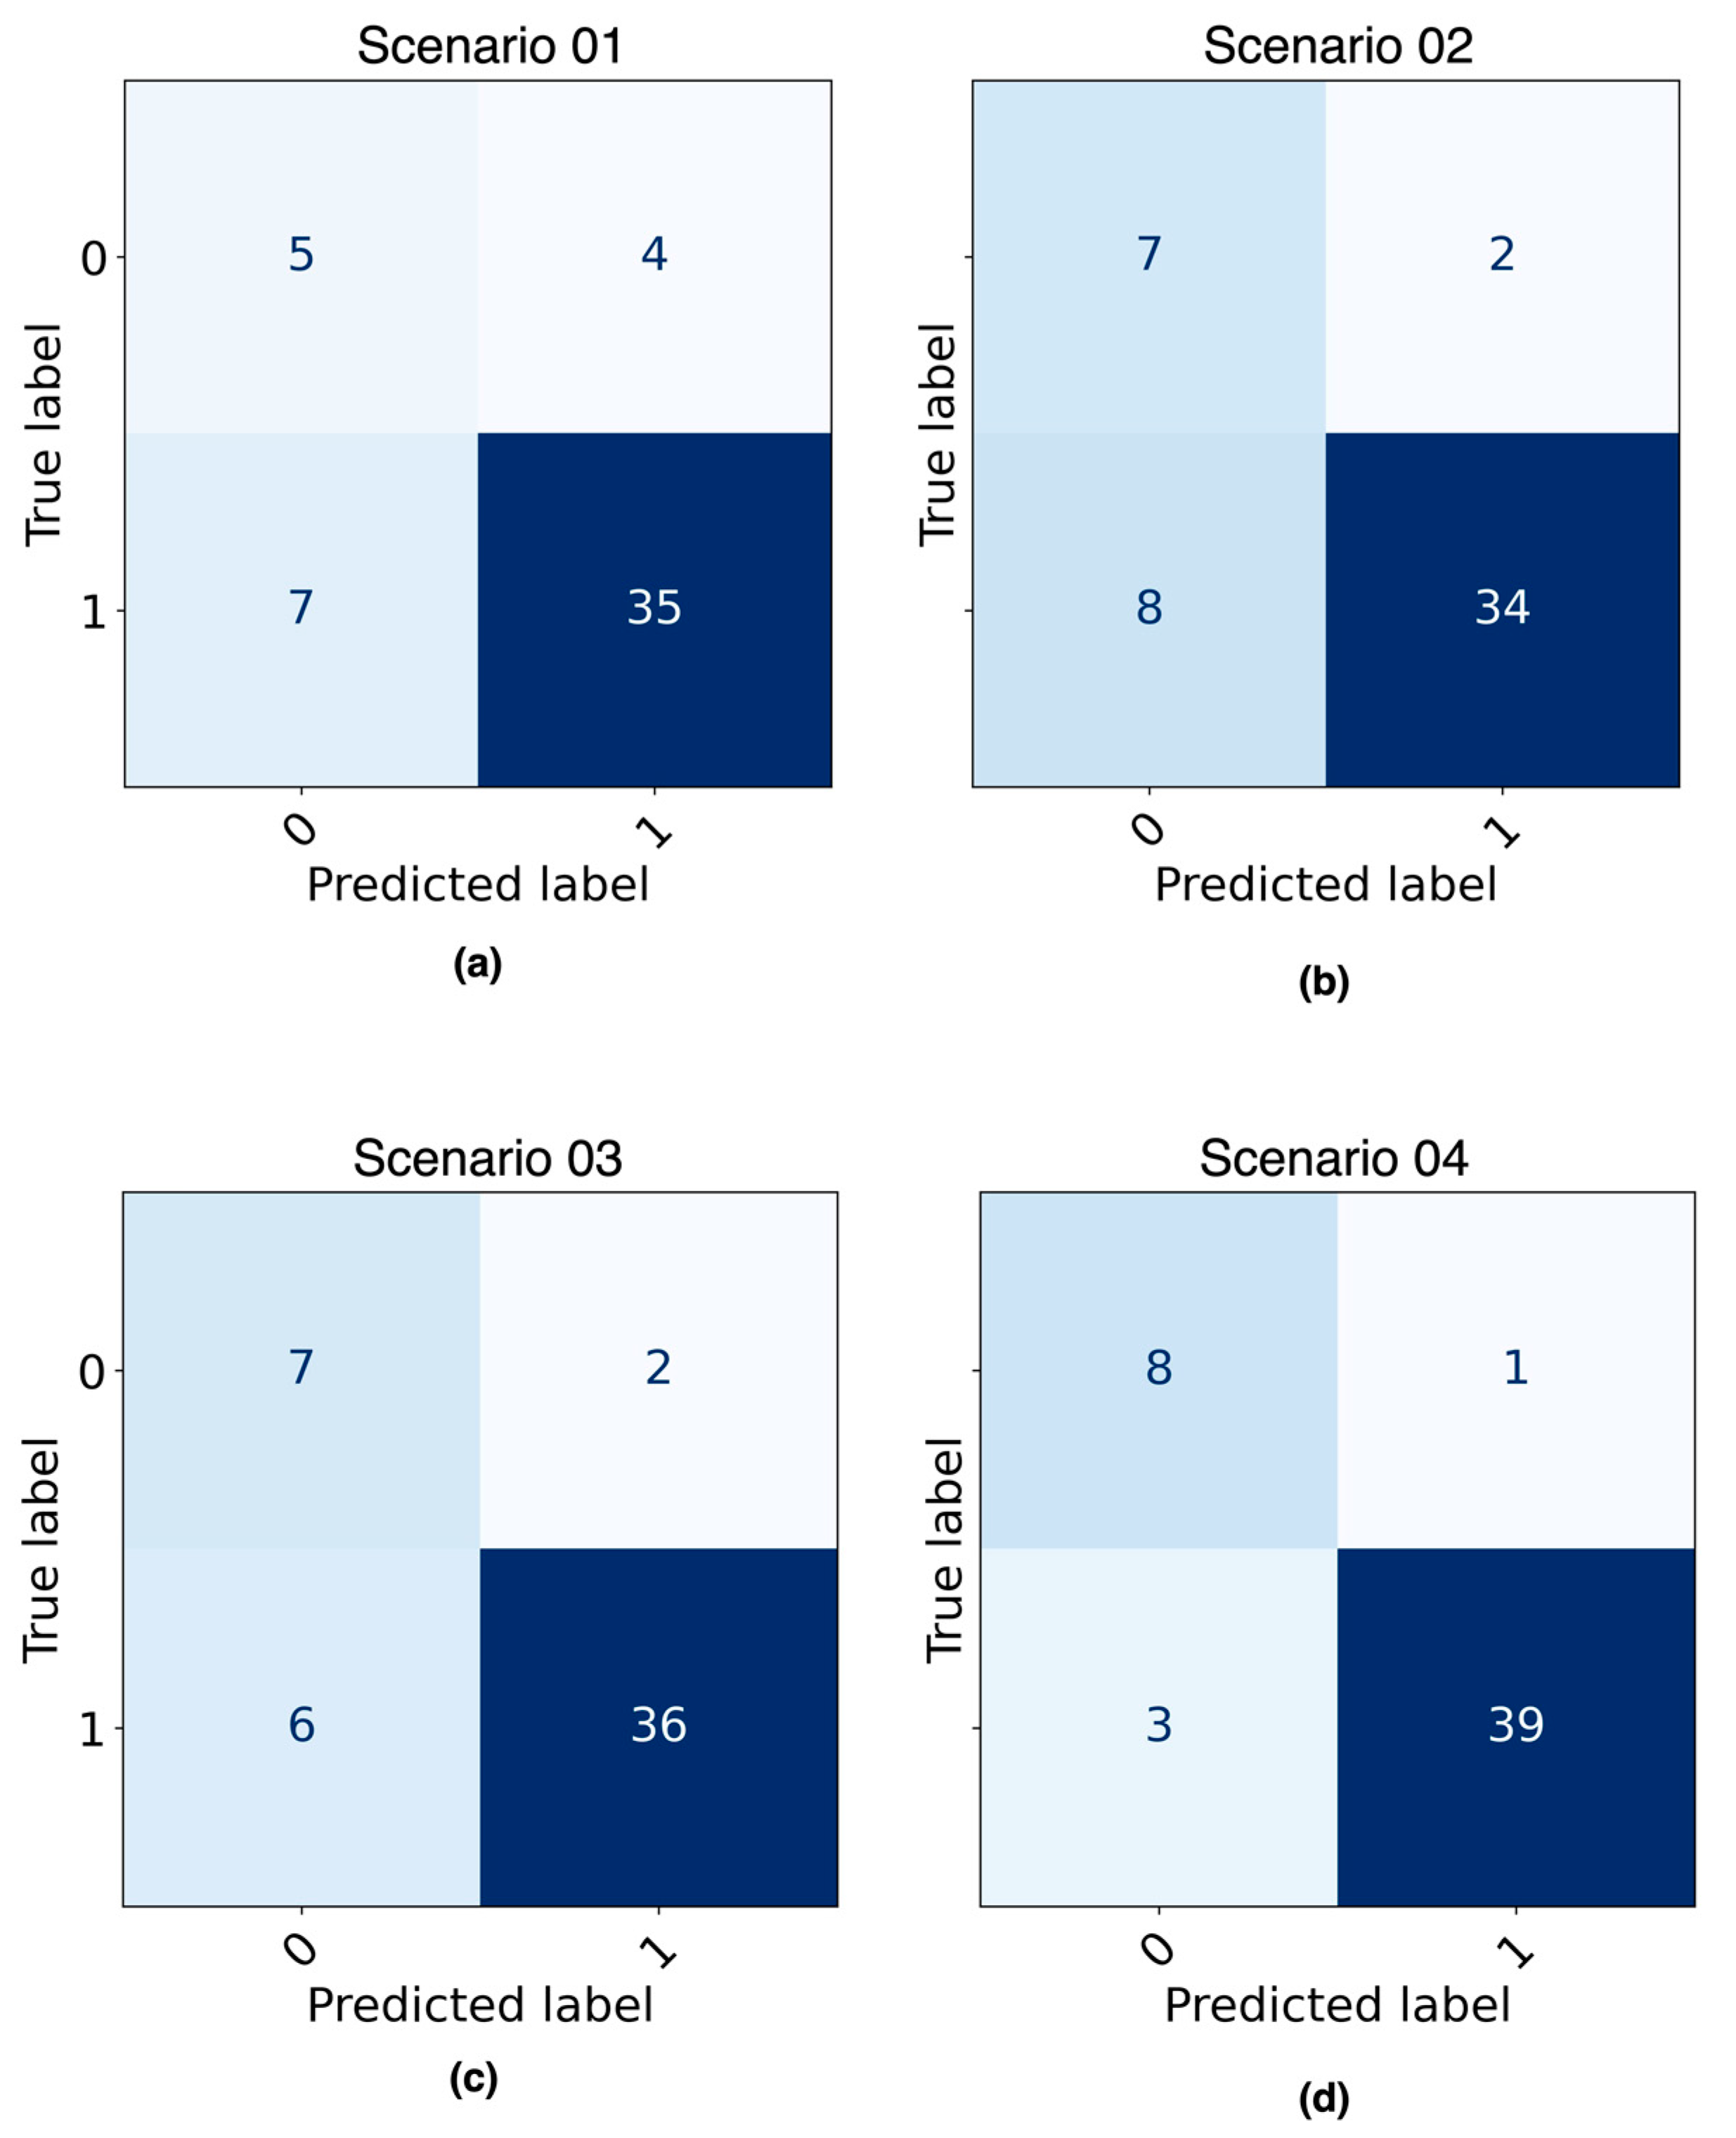
Figure 9.
ROC curves of ML models evaluated with testing dataset: (a) AUC of DT models built with balanced and imbalanced data; (b) AUC of LR models built with balanced and imbalanced data.
Figure 9.
ROC curves of ML models evaluated with testing dataset: (a) AUC of DT models built with balanced and imbalanced data; (b) AUC of LR models built with balanced and imbalanced data.
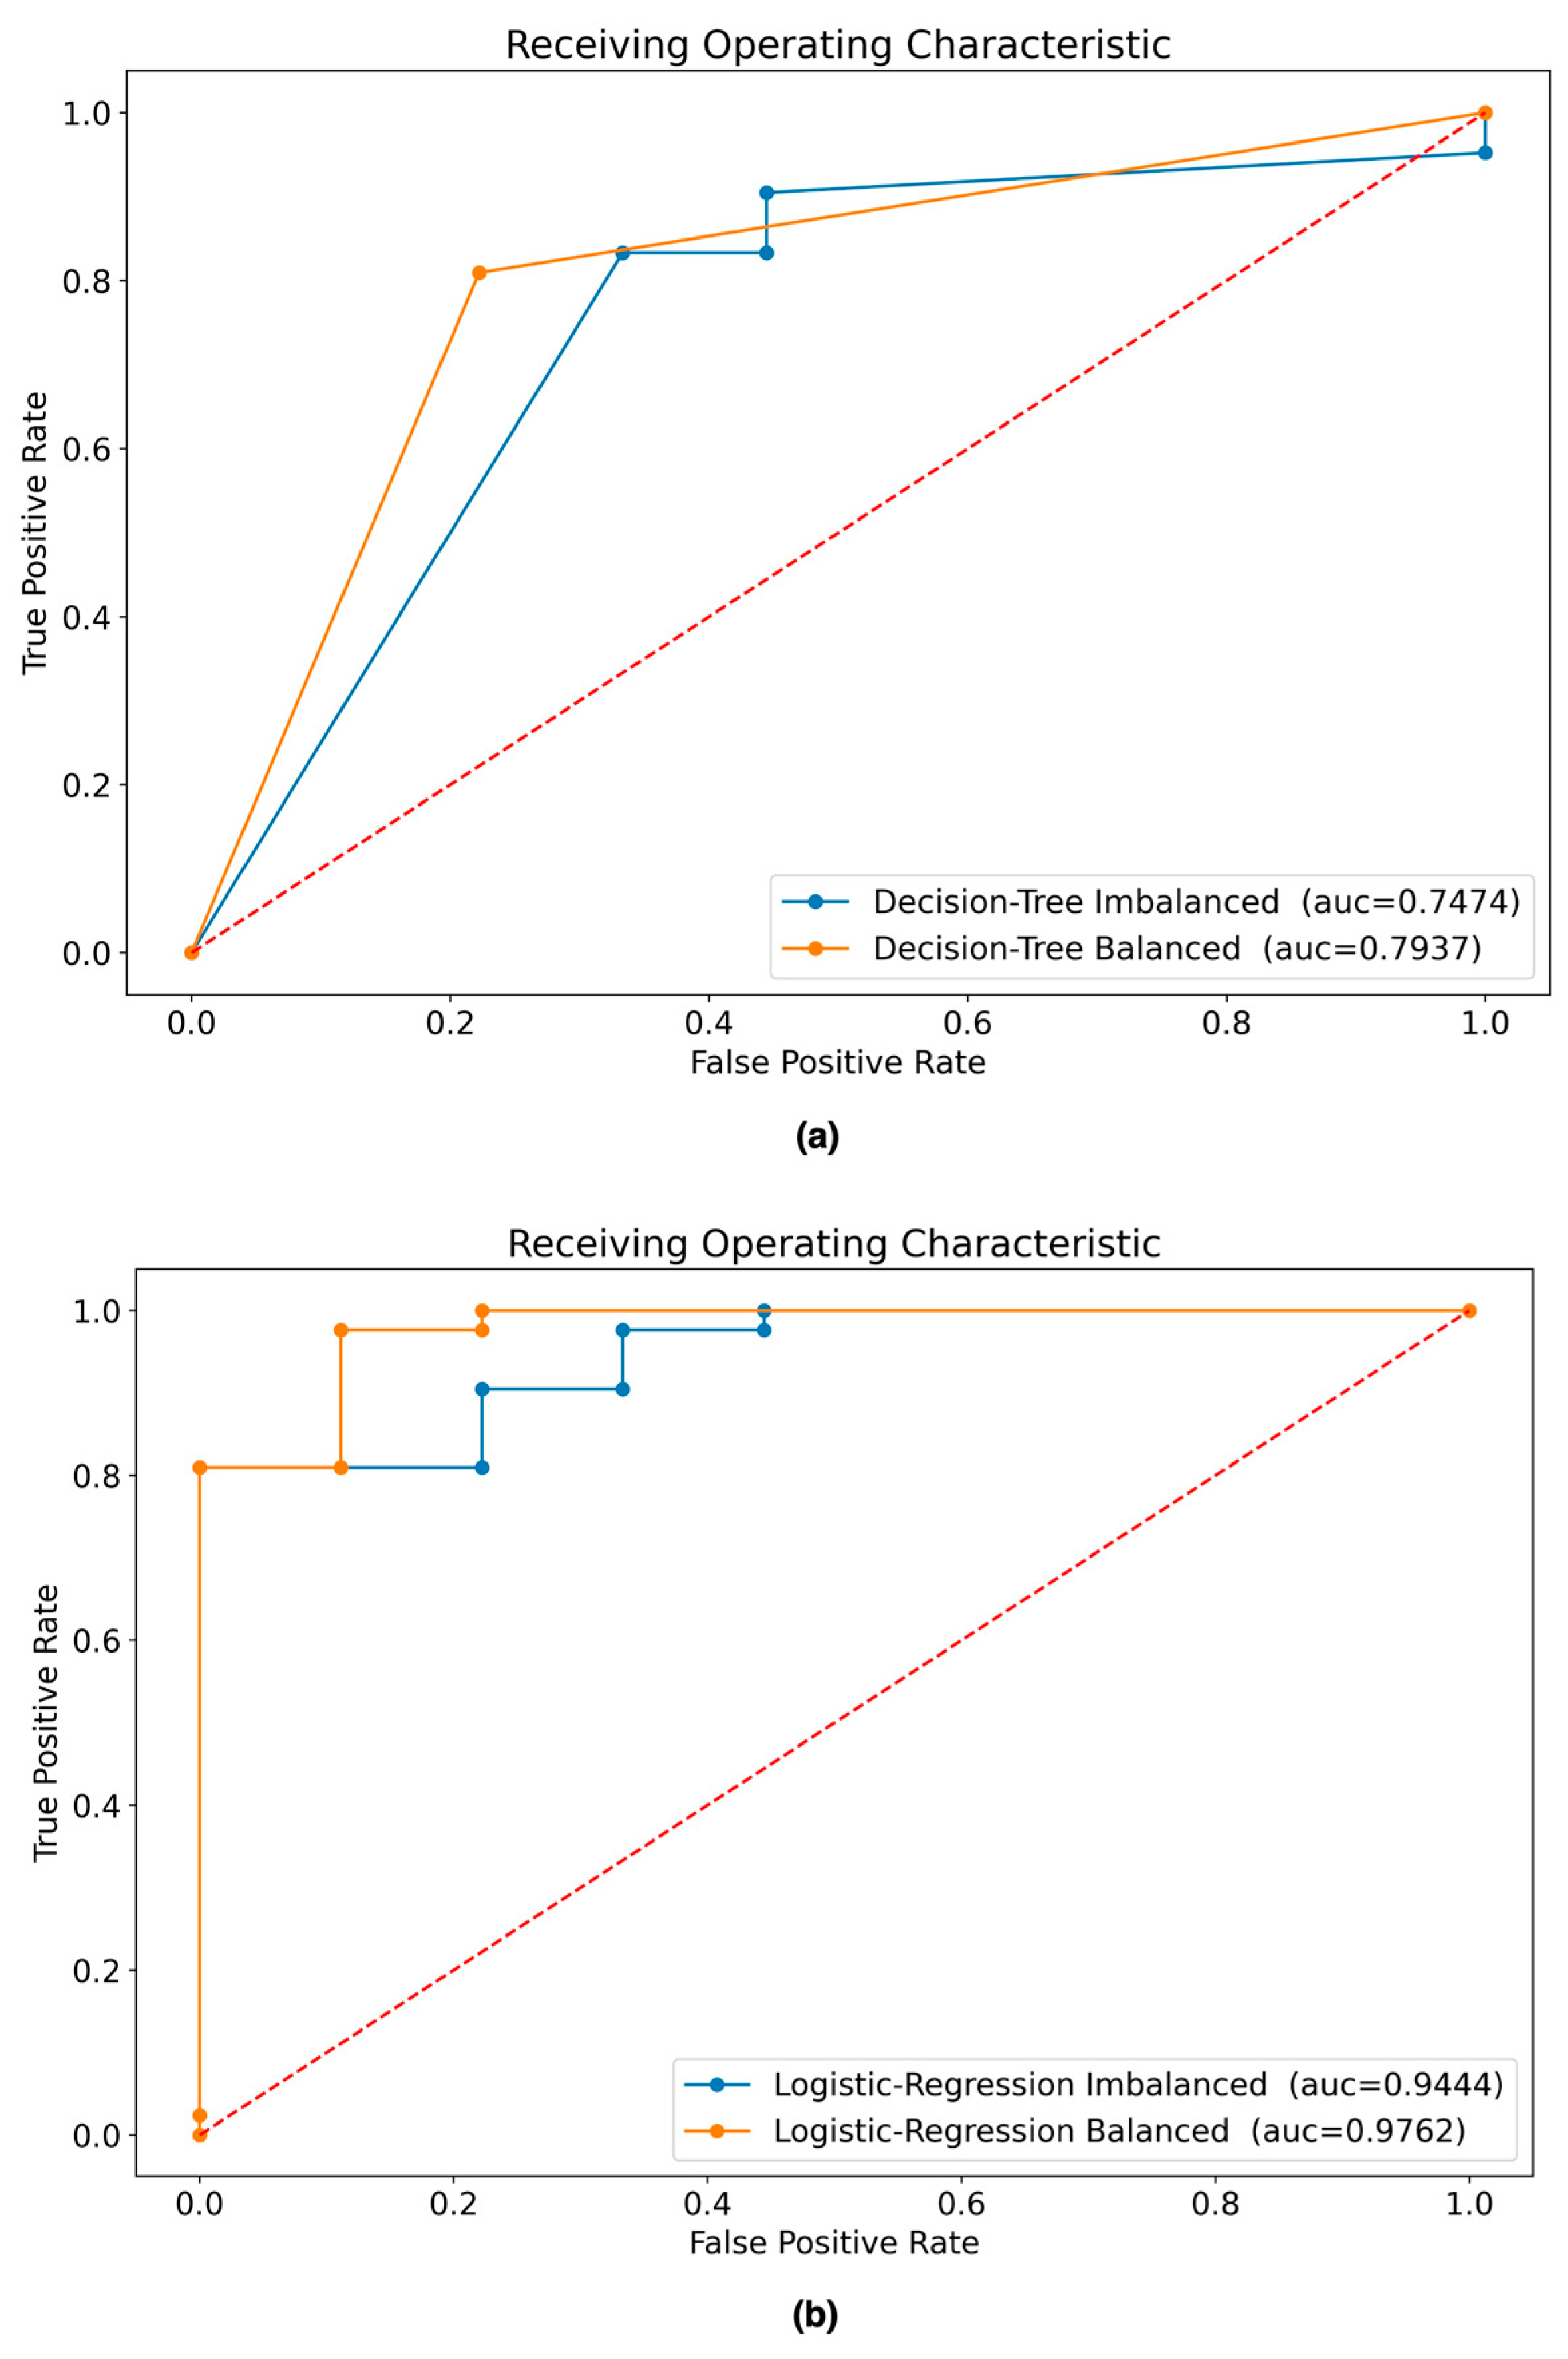

Table 1.
Dataset structure.
| Cat. | Variable name | Description | Values |
|---|---|---|---|
| (S) | gender | Sexual/gender identity | 1 = male; 0 = female |
| (S) | age | Chronological age | 4–75 |
| (S) | residence | Place of residence (city where patient lived during treatment) | 1 = Lima or Callao, Peru; 2 = outside Lima or Callao in Peru; 3 = outside Peru |
| (S) | occupation | Principal work or business | 1 = professional with bachelor’s or technical degree; 2 = general worker; 3 = housewife; 4 = police officer or similar; 5 = undergraduate student; 6 = school student; 7 = unemployed; 8 = self-employed |
| (S) | education_level | Level of education | 1 = preschool; 2 = primary school; 3 = secondary school; 4 = higher education |
| (S) | health_insurance | Type of health insurance | 1 = private; 2 = EsSalud; 3 = SIS; 4 = personal; 5 = military or similar |
| (C) | hemorrhage | Presence of bleeding on a computerized tomography (CT) scan in brain AVM before radiosurgery | 1 = yes; 0 = no |
| (C) | hemorrhage_type | Type of bleeding in brain AVM | 1 = parenchymal; 2 = ventricular; 3 = parenchymal and ventricular; 4 = no hemorrhage present |
| (C) | headache | Persistent headache before radiosurgery | 1 = yes; 0 = no |
| (C) | seizures | Presence of seizures at time of diagnosis | 1 = yes; 0 = no |
| (C) | encephalomalacia | Localized softening of brain substance due to bleeding or inflammation before radiosurgery | 1 = yes; 0 = no |
| (C) | other_diseases | Presence of other systemic or degenerative diseases | 1 = yes; 0 = no |
| (C) | deficit | Type of deficit in patient’s senses before radiosurgery | 1 = motor deficit; 2 = sensory deficit; 3 = cognitive deficit; 4 = no deficit observed |
| (C) | karnofsky_scale | Measurement for classification of functional impairment | 0–100% |
| (C) | glasgow_coma_scale | Assessment of impaired consciousness in response to defined stimuli | 3–15 |
| (C) | spetzler_martin_scale | Estimation of risk of open neurosurgery for patients with brain AVM, by evaluating AVM size, pattern of venous drainage, and eloquence of brain location | 0–5 |
| (C) | buffalo_scale | Grading system for endovascular treatment of brain AVMs | |
| (C) | virginia_scale | Scale to predict favorable outcomes for brain AVM patients treated with gamma knife radiosurgery | 0–4 |
| (T) | prev_cran_surgery | Previous open cranial surgery | 1 = yes; 0 = no |
| (T) | embolization | Embolization procedure to occlude brain AVM before radiosurgery | 1 = yes; 0 = no |
| (T) | embolization_agent | Type of material used for embolization procedure | 1 = Onyx; 2 = Histoacryl; 3 = none |
| (T) | prev_surgery_or_embolization | Surgery or embolization before radiosurgery procedure | 1 = surgery; 2 = embolization; 3 = surgery and embolization; 4 = none |
| (A) | localization_avm | Anatomical location of brain AVM | 1 = frontal lobe; 2 = temporal lobe; 3 = parietal lobe; 4 = occipital lobe; 5 = cerebral corpus callosum; 6 = insular cortex; 7 = basal ganglia; 8 = cerebellum; 9 = ventricular; 10 = vermis; 11 = frontomesial; 12 = frontoparietal; 13 = frontotemporal; 14 = mesencephalon; 15 = mesio-occipital; 16 = mesio-parietal; 17 = parieto-occipital; 18 = protuberance; 19 = mesio-temporal; 20 = temporo-occipital; 21 = temporo-parietal; 22 = brainstem |
| (A) | venous_aneurysm | Presence of venous aneurysm along with brain AVM | 1 = yes; 0 = no |
| (A) | arterial_aneurysm | Presence of arterial aneurysm along with brain AVM | 1 = yes; 0 = no |
| (A) | dolichoectasia | Elongation, dilatation, and distension of brain AVM drainage veins | 1 = yes; 0 = no |
| (A) | num_afferent_vessels | Number of arteries feeding brain AVM | Number |
| (A) | depth_avm | Depth of brain AVM inside cranial structure | 1 = cortical; 2 = subcortical; 3 = cortico-subcortical; 4 = deep; 5 = ventricular |
| (A) | diameter_avm | Largest diameter of brain AVM in centimeters | 0.5–8.0 cm |
| (A) | side_avm | Brain side where AVM is located | 1 = right; 2 = left; 3 = middle |
| (A) | expansion_shape_avm | Shape of AVM expansion in cerebral area | 1 = compact; 2 = fuzzy; 3 = scattered mixed |
| (A) | type_venous_drainage | Drainage type of venous blood in brain AVM | 1 = superficial; 2 = deep; 3 = mixed |
| (A) | eloquence | Brain AVM is in a zone that compromises vital functions | 1 = yes; 0 = no |
| (A) | type_circulation_drainage | Type of circulation of drainage in brain AVM | 1 = superficial venous; 2 = deep venous |
| (A) | blood_flow_velocity | Blood flow velocity in brain AVM | 1 = slow; 2 = moderate; 3 = fast |
| (A) | venous_stenosis | Narrowing of venous vessel lumen at outlet of drainage of brain AVM | 1 = yes; 0 = no |
| (A) | volume_avm | Volume of brain AVM mass in cubic centimeters | 0.05–75 cc |
| (A) | num_radiosurgeries | Number of radiosurgeries needed to stabilize brain AVM | Number |
| (A) | mri_examination | Brain AVM was examined by magnetic resonance imaging (MRI) | 1 = yes; 0 = no |
| (A) | ct_examination | Brain AVM was examined by CT | 1 = yes; 0 = no |
| (A) | das_examination | Brain AVM was examined by digital angiography system (DAS) | 1 = yes; 0 = no |
| (R) | num_isocenters | Number of iso-centers to cover and treat brain AVM | Number |
| (R) | radiation_doses | Dose of radiation applied to brain AVM during radiosurgery in Gray units | 1–50 Gy |
| (R) | isodosis | Percentage of isodosis applied during radiosurgery of brain AVM | 40–80% |
| (R) | cured | Brain AVM is cured within 3 years of radiosurgery, as indicated by cerebral angiography | 1 = patient was cured; 0 = patient was not cured |
S, sociodemographic; C, clinical; T, treatment; A, angioarchitecture; R, radiosurgery.
Table 2.
Variables discarded from the study.
| Discarded variables | Method | Threshold |
|---|---|---|
| residence, education_level, health_insurance, mri_examination, ct_examination, das_examination | Expert judgment | - |
| hemorrhage_type, embolization_agent, prev_surgery_or_embolization, spetzler_martin_scale, type_circulation_drainage | Cramer’s V test | 0.7 |
| diameter_avm | Pearson test | 0.7 |
Table 3.
Variables selected for the study.
| Id | Variable name | Id | Variable name | Id | Variable name |
|---|---|---|---|---|---|
| 1 | gender | 12 | buffalo_scale | 23 | expansion_shape_avm |
| 2 | age | 13 | virginia_scale | 24 | type_venous_drainage |
| 3 | occupation | 14 | prev_cran_surgery | 25 | eloquence |
| 4 | hemorrhage | 15 | embolization | 26 | blood_flow_velocity |
| 5 | headache | 16 | localization_avm | 27 | venous_stenosis |
| 6 | seizures | 17 | venous_aneurysm | 28 | volume_avm |
| 7 | encephalomalacia | 18 | arterial_aneurysm | 29 | num_radiosurgeries |
| 8 | other_diseases | 19 | dolichoectasia | 30 | num_isocenters |
| 9 | deficit | 20 | num_afferent_vessels | 31 | radiation_doses |
| 10 | karnofsky_scale | 21 | depth_avm | 32 | isodosis |
| 11 | glasgow_coma_scale | 22 | side_avm | 33 | cured * |
Table 4.
Search space for tuning hyperparameter values.
| Model | Parameters | Grid search space |
|---|---|---|
| Decision tree (DT) | max_depth | 2–9 |
| criterion | gini, entropy | |
| Logistic regression (LR) | penalty | l1, l2 |
| solver | liblinear | |
| C | 0.001, 0.01, 0.1, 1, 10, 100, 100 | |
| max_iter | 1000, 5000 |
Table 5.
Sociodemographic characteristics of study population.
| Variable | Value | Number | % |
|---|---|---|---|
| Gender | Male | 107 | 52.97 |
| Female | 95 | 47.03 | |
| Age | Child (1–11) | 30 | 14.85 |
| Teenager (12–17) | 24 | 11.88 | |
| Young boy (18–29) | 66 | 32.37 | |
| Adult (30–59) | 77 | 38.12 | |
| Older adult (60+) | 5 | 2.48 | |
| Residence | Lima or Callao in Perú | 163 | 80.69 |
| Outside Lima or Callao in Perú | 37 | 18.32 | |
| Outside Perú | 2 | 0.99 | |
| Occupation | Professional with bachelor’s or technical degree | 35 | 17.33 |
| General worker | 24 | 11.88 | |
| Housewife | 34 | 16.83 | |
| Police officer or similar | 9 | 4.46 | |
| Undergraduate student | 20 | 9.90 | |
| School student | 56 | 27.72 | |
| Unemployed | 10 | 4.95 | |
| Self-employed | 14 | 6.93 | |
| Education level | Preschool | 5 | 2.48 |
| Primary school | 33 | 16.34 | |
| Secondary school | 107 | 52.97 | |
| Higher education | 57 | 28.22 | |
| Health insurance | Private | 20 | 9.90 |
| EsSalud | 29 | 14.36 | |
| SIS | 85 | 42.08 | |
| Personal | 49 | 24.26 | |
| Military or similar | 19 | 9.41 | |
| Total | 202 | 100.0 |
Table 6.
Clinical and radiosurgery characteristics of study population. .
| Variable | Mean | Std Dev | Min | Median | Max |
|---|---|---|---|---|---|
| Age | 27.63 | 14.90 | 4 | 25 | 68 |
| karnofsky_scale | 82.78 | 9.37 | 40 | 80 | 100 |
| glasgow_coma_scale | 14.80 | 0.46 | 12 | 15 | 15 |
| spetzler_martin_scale | 2.55 | 0.89 | 1 | 3 | 5 |
| buffalo_scale | 2.43 | 0.98 | 0 | 2 | 5 |
| virginia_scale | 2.08 | 0.82 | 0 | 2 | 4 |
| diameter_avm | 2.14 | 0.89 | 0.5 | 2.1 | 6 |
| volume_avm | 6.30 | 8.33 | 0.063 | 4 | 75 |
| num_afferent_vessels | 2.51 | 0.92 | 1 | 2 | 6 |
| num_radiosurgeries | 1.36 | 1.56 | 1 | 1 | 10 |
| num_isocenters | 1.35 | 0.56 | 1 | 1 | 4 |
| radiation_doses | 17.86 | 4.44 | 10 | 17 | 40 |
| isodosis | 69.31 | 14.37 | 50 | 80 | 90 |
| cured | 22.07 | 6.47 | 6 | 24 | 36 |
Table 7.
Angioarchitecture and treatment characteristics of study population.
| Variable | Frequency by category | Values |
|---|---|---|
| prev_cran_surgery | 1: 31; 2: 171 | 1 = yes; 0 = no |
| embolization | 1: 49; 2: 153 | 1 = yes; 0 = no |
| embolization_agent | 1: 26; 2: 24; 3: 152 | 1 = Onyx; 2 = Histoacryl; 3 = none |
| prev_surgery_or_embolization | 1: 22; 2: 40; 3: 9; 4: 131 | 1 = surgery; 2 = embolization; 3 = surgery and embolization; 4 = none |
| hemorrhage | 1: 155; 2: 47 | 1 = yes; 2 = no |
| hemorrhage_type | 1: 91; 2: 13; 3: 29; 4: 69 | 1 = parenchymal; 2 = ventricular; 3 = parenchymal and ventricular; 4 = none |
| headache | 1: 178; 2: 24 | 1 = yes; 0 = no |
| seizures | 1: 112; 2: 90 | 1 = yes; 0 = no |
| encephalomalacia | 1: 76; 2: 126 | 1 = yes; 0 = no |
| deficit | 1: 53; 2: 26; 3: 32; 4: 91 | 1 = motor deficit; 2 = sensory deficit; 3 = cognitive deficit; 4 = no deficit observed |
| venous_aneurysm | 1: 58; 2: 144 | 1 = yes; 0 = no |
| arterial_aneurysm | 1: 3; 2: 199 | 1 = yes; 0 = no |
| dolichoectasia | 1: 140; 2: 62 | 1 = yes; 0 = no |
| depth_avm | 1: 9; 2: 48; 3: 47; 4: 96; 5: 2 | 1 = cortical; 2 = subcortical; 3 = cortico-subcortical; 4 = deep; 5 = ventricular |
| side_avm | 1: 85; 2: 100; 3: 17 | 1 = right; 2 = left; 3 = middle |
| expansion_shape_avm | 1: 145; 2: 39; 3: 18 | 1 = compact; 2 = fuzzy; 3 = scattered mixed |
| type_venous_drainage | 1: 75; 2: 114; 3: 13 | 1 = superficial; 2 = deep; 3 = mixed |
| eloquence | 1: 63; 2: 139 | 1 = yes; 0 = no |
| blood_flow_velocity | 1: 80; 2: 95; 3: 27 | 1 = slow; 2 = moderate; 3 = fast |
| venous_stenosis | 1: 52; 2: 150 | 1 = yes; 0 = no |
Table 8.
Locations of AVM in study population.
| AVM location | Number | % |
|---|---|---|
| Frontal lobe | 20 | 9.90 |
| Temporal lobe | 11 | 5.45 |
| Parietal lobe | 11 | 5.45 |
| Occipital lobe | 7 | 3.47 |
| Cerebral corpus callosum | 12 | 5.94 |
| Insular cortex | 14 | 6.93 |
| Basal ganglia | 34 | 16.83 |
| Cerebellum | 13 | 6.44 |
| Ventricular | 10 | 4.95 |
| Vermis | 3 | 1.49 |
| Frontomesial | 6 | 2.97 |
| Frontoparietal | 9 | 4.46 |
| Frontotemporal | 3 | 1.49 |
| Mesencephalon | 7 | 3.47 |
| Mesio-occipital | 3 | 1.49 |
| Mesio-parietal | 2 | 0.99 |
| Parieto-occipital | 14 | 6.93 |
| Protuberance | 3 | 1.49 |
| Mesio-temporal | 14 | 6.93 |
| Temporo-occipital | 3 | 1.49 |
| Temporo-parietal | 1 | 0.49 |
| Brainstem | 2 | 0.99 |
| Total | 202 | 100.0 |
Table 9.
Calibrated hyperparameters for each model found during the training process.
| Scenario | Dataset + Model | Parameters | Value |
|---|---|---|---|
| 01 | Imbalanced + DT | max_depth | 4 |
| criterion | gini | ||
| 02 | Balanced + DT | max_depth | 9 |
| criterion | entropy | ||
| 03 | Imbalanced + DT | penalty | l1 |
| solver | liblinear | ||
| C | 10 | ||
| max_iter | 1000 | ||
| 04 | Balanced + DT | penalty | l1 |
| solver | liblinear | ||
| C | 10 | ||
| max_iter | 1000 |
Table 10.
Summary of models’ performance.
| Model name | Accuracy | Sensitivity | Specificity | Precision | Balanced Accuracy | F1-Score | AUC |
|---|---|---|---|---|---|---|---|
| DT* | 0.7647 | 0.8571 | 0.3333 | 0.8571 | 0.5952 | 0.8571 | 0.6191 |
| DT (imbalanced) | 0.7843 | 0.8333 | 0.5556 | 0.8974 | 0.6944 | 0.8642 | 0.7474 |
| DT (balanced) | 0.8039 | 0.8095 | 0.7778 | 0.9444 | 0.7937 | 0.8718 | 0.7937 |
| LR* | 0.8039 | 0.8095 | 0.7778 | 0.9444 | 0.7937 | 0.8718 | 0.9259 |
| LR (imbalanced) | 0.8431 | 0.8571 | 0.7778 | 0.9474 | 0.8175 | 0.9000 | 0.9444 |
| LR (balanced) | 0.9216 | 0.9286 | 0.8889 | 0.9750 | 0.9087 | 0.9512 | 0.9762 |
* Models built without any data preprocessing used as a baseline for comparison.
Table 11.
Importance of variables in LR model calculated via odds ratio.
| Feature | Coef. | Importance |
|---|---|---|
| side_avm | 3.685394 | 3.986084e+01 |
| occupation | 3.684293 | 3.981696e+01 |
| hemorrhage | 3.612294 | 3.705096e+01 |
| prev_cran_surgery | 2.809908 | 1.660839e+01 |
| type_venous_drainage | 2.122742 | 8.354012e+00 |
| deficit | 1.009382 | 2.743904e+00 |
| eloquence | 0.977819 | 2.658651e+00 |
| gender | 0.477996 | 1.612839e+00 |
| seizures | 0.427576 | 1.533536e+00 |
| karnofsky_scale | 0.000000 | 1.000000e+00 |
| virginia_scale | 0.000000 | 1.000000e+00 |
| num_isocenters | 0.000000 | 1.000000e+00 |
| num_radiosurgeries | 0.000000 | 1.000000e+00 |
| arterial_aneurysm | 0.000000 | 1.000000e+00 |
| headache | -0.010291 | 9.897622e-01 |
| glasgow_coma_scale | -0.063201 | 9.387549e-01 |
| buffalo_scale | -0.593961 | 5.521360e-01 |
| venous_stenosis | -1.082555 | 3.387290e-01 |
| radiation_doses | -1.114669 | 3.280240e-01 |
| num_afferent_vessels | -1.227075 | 2.931488e-01 |
| other_diseases | -1.294874 | 2.739323e-01 |
| venous_aneurysm | -1.341657 | 2.614121e-01 |
| age | -2.233286 | 1.071757e-01 |
| encephalomalacia | -3.069712 | 4.643451e-02 |
| localization_avm | -3.108126 | 4.468462e-02 |
| depth_avm | -3.231191 | 3.951041e-02 |
| expansion_shape_avm | -4.010097 | 1.813164e-02 |
| isodosis | -4.730437 | 8.822614e-03 |
| embolization | -4.738869 | 8.748537e-03 |
| dolichoectasia | -5.665930 | 3.461928e-03 |
| blood_flow_velocity | -7.407565 | 6.066463e-04 |
| volume_avm | -21.466891 | 4.753876e-10 |
Disclaimer/Publisher’s Note: The statements, opinions and data contained in all publications are solely those of the individual author(s) and contributor(s) and not of MDPI and/or the editor(s). MDPI and/or the editor(s) disclaim responsibility for any injury to people or property resulting from any ideas, methods, instructions or products referred to in the content. |
© 2023 by the authors. Licensee MDPI, Basel, Switzerland. This article is an open access article distributed under the terms and conditions of the Creative Commons Attribution (CC BY) license (http://creativecommons.org/licenses/by/4.0/).
Copyright: This open access article is published under a Creative Commons CC BY 4.0 license, which permit the free download, distribution, and reuse, provided that the author and preprint are cited in any reuse.


