
Submitted:
03 July 2023
Posted:
04 July 2023
You are already at the latest version
Abstract
Synchrotron radiation computed tomography (SRCT) allows more accurate calcified plaque and coronary stenosis assessment as a result of its superior spatial resolution, however, typical micro-computed tomography (micro-CT) systems have even higher resolution. The purpose of this study was to compare performance of high-resolution micro-CT with SRCT in the assessment of calcified plaques and a previously published dataset of coronary stenosis assessment. This experimental study involved micro-CT scanning of three-dimensional printed coronary artery models with calcification in situ used in our previously published SRCT study on coronary stenosis assessment. Measurements of coronary stenosis utilizing both modalities were compared using a paired sample t-test. The degrees of stenosis measured on all but one micro-CT dataset were statistically significantly lower than the corresponding SRCT measurements reported in our previous paper (p<0.0005-0.05). This indicates that the superior spatial resolution of micro-CT was able to further reduce over-estimation of stenosis caused by extensive calcification of coronary arteries and hence false positive results. This study shows that high-resolution micro-CT outperforms SRCT in both calcified plaque and coronary stenosis assessment. This finding will become clinically important for cardiovascular event prediction and enable reclassification of individuals with low and intermediate risk into appropriate risk categories when the technical challenges of micro-CT in clinical practice such as the small field of view and demanding on image processing power are addressed.
Keywords:
3D printing
; accuracy
; calcification
; cardiovascular disease
; computed tomography
; coronary artery disease
; coronary stenosis
; micro-computed tomography
; plaque
; synchrotron radiation
1. Introduction
Coronary computed tomography angiography (CCTA) is commonly used for coronary artery disease (CAD) diagnosis because it is a less-invasive imaging modality and performs well in coronary stenosis assessment and cardiac event prediction [1,2,3]. For low to intermediate coronary stenosis, CCTA has very high negative predictive value as a result of its ability to exclude significant stenosis [4]. Nonetheless, CCTA has high false positive results in patients with extensive calcified plaques in the coronary arteries by causing blooming artifact which exaggerates plaque size and hence affects diagnostic value. Previous studies have shown that its specificity and positive predictive value (PPV) in calcification is only 18%-53% [5,6].
Various approaches have been investigated for improving CCTA performance in calcification such as the use of image post-processing and iterative reconstruction (IR) to reduce blooming artifact [6,7,8,9], inclusion of the left coronary bifurcation angle in analysis [10,11,12], and through use of thinner slices (230 μm high-resolution computed tomography (CT)) [13]. However, spatial resolution of synchrotron radiation CT (SRCT, 19×19×19 μm3) is much higher than that of conventional CT [14] as demonstrated in our previous study [15].
Nonetheless, typical micro-CT systems have spatial resolutions as low as 0.5×0.5×0.5 μm3 which are far better than that of SRCT and hence should improve diagnostic performance of calcified plaque evaluation [15,16]. To the best of our knowledge, no study has been conducted to compare the performance of these two imaging modalities in the assessment of coronary arterial lumen loss and calcification. The purpose of this study was to compare the performance of high-resolution micro-CT with the SRCT in the calcified plaques and coronary stenosis assessment. We hypothesized that the superior resolution of micro-CT allowed for an improvement in assessment of coronary stenosis in the presence of calcified plaques.
2. Materials and Methods
We used previously developed three-dimensional (3D) printed coronary models with simulation of calcified plaques to explore the hypothesis given the long scanning time of micro-CT and the limited field of view [15,17]. 3D printed heart and vascular models derived from CT or magnetic resonance images can replicate anatomical structures and pathologies with a high degree of accuracy, thus serving as a useful tool for understanding complex cardiac anatomy and simulating surgical or interventional procedures [18,19,20,21,22,23,24,25]. Our models were created based on CCTA datasets of three patients with different degrees of coronary artery stenosis caused by calcified plaques. A Stratasys Objet500 Connex3 multi-material (Polyjet) 3D printer (Objective 3D, Melbourne, Victoria, Australia) was used to print coronary artery walls and calcifications with TangoPlus (83 Hounsfield unit (HU)) and VeroWhite (136 HU) materials, respectively [26]. These printing materials were chosen because their attenuation properties matched those of the corresponding structures which are around 89 HU (artery wall) and at least 130 HU (calcified plaque) [27,28,29]. A summary of the anatomical characteristics of these three models is shown below. Further details of the CCTA datasets, patients and 3D printing involved in this experimental study were given in our previous publication [15]. Ethics approval was not required in this study as only 3D-printed coronary artery models were used (Figure 1).
- Model 1: >90% and <50% stenosis in left main stem (LM) and left anterior descending (LAD) coronary artery respectively.
- Model 2: >90% and 70% stenosis in LAD and left circumflex (LCx) respectively.
- Model 3: >90% and 70% stenosis in proximal LCx and middle LCx respectively.
Skyscan 1176 micro-CT system (Bruker Corporation, Billerica, MA, USA) available at Australian National Imaging Facility in Centre for Microscopy, Characterisation and Analysis (CMCA) at Harry Perkins Institute of Medical Research was used to scan the three models at its highest spatial resolution (8.7×8.7×8.7 μm3) and lowest tube voltage (40 kV) settings. The selection of the lowest tube voltage was based on our previous SRCT findings that a lower beam energy (30 keV) provided better visualization of coronary artery walls and calcified plaques as a result of the materials used; TangoPlus and VeroWhite which have low x-ray attenuation properties [15,30,31,32,33]. Figure 2 shows the micro-CT scan setup.
Axial micro-CT images of the three models in tagged image file format (TIFF) were
converted to Analyze 7.5 file format by the open-source image processing program, ImageJ (v1.52a, National Institutes of Health, Bethesda, MD, USA) for importing into the Analyze 12 software package (AnalyzeDirect, Inc., Lexana, KS, USA) with multi-dimensional image display, processing, and measurement capabilities on an image processing workstation (Hewlett-Packard Z4 G4 [Palo Alto, CA, USA] with Intel Xeon W-2255 3.7 GHz central processing unit [Santa Clara, CA, USA], 512 GB random access memory and Nvidia RTX A6000 48 GB graphics processing unit [Santa Clara, CA, USA]). The degree of coronary lumen stenosis was measured on 2-dimensional (2D) axial images of the three models by one observer with more than 20 years of CCTA image interpretation experience. Three measurements were performed for each stenotic area with their average value used as the final value, to minimize intra-observer variation. Intra-observer agreement was determined by randomly selecting images of each model and repeating the measurements by the same observer after two weeks. Good intra-observer reliability between these measurements was found (r=0.835, p<0.01). Details of the measurement approach were given in our previous reports [31,32,34,35,36].
SPSS Statistics 28 (International Business Machines Corporation, Armonk, NY, USA) was used for statistical analysis. Mean and standard deviation were calculated for continuous variables. The measurements of coronary lumen stenosis on the micro-CT images of the three models were compared with the corresponding measurements performed on SRCT acquired with a beam energy of 30 keV reported previously using a paired sample t-test to determine the modality able to provide better coronary stenosis assessment [15]. A p-value less than 0.05 represented statistical significance.
3. Results
Table 1 and Table 2 show the micro-CT stenosis assessment performances for all six plaques in the three 3D printed coronary artery models. The degrees of stenosis measured on the micro-CT images of the models (except the one caused by plaque 2 in model 3) were statistically significantly lower than the corresponding SRCT measurements reported in our previous paper (p<0.0005-0.05) [15]. This indicates that the superior spatial resolution of micro-CT was able to further suppress the blooming artifact caused by the extensive calcification. Nonetheless, the degrees of stenosis measured on the micro-CT images of plaques 1 and 2 of models 1 and 2 were lower than the ground truths (degrees of stenosis calculated based on the true sizes of simulated plaques and models).
Figure 3, Figure 4, Figure 5, Figure 6, Figure 7 and Figure 8 show the micro-CT and SRCT images of plaques 1 and 2 in models 1-3 that were used for the stenosis assessments. For the micro-CT (0.009 mm slice thickness) images, only the stenotic areas were illustrated due to the processing power limit of the workstation for handling data with a very large matrix (7872×7872). The micro-CT (0.009 mm slice thickness) images were able to clearly demonstrate patent areas between the calcification and the left coronary arterial walls, especially in severe stenosis compared with SRCT (0.095-0.491 mm slice thickness) images (Figure 3, Figure 4 and Figure 5 with >90% stenosis).
4. Discussion
To the best of our knowledge, this is the first study to compare the performance of high-resolution micro-CT with SRCT in calcified plaque and coronary stenosis assessment. Our findings show that the superior resolution of micro-CT allows for statistically significant improvements (p<0.0005-0.05) in the assessment of stenosis in the presence of calcified plaques (except plaque 2 within model 3) with regard to blooming artifact suppression, hence minimizing over-estimation when compared with the corresponding results of our previous SRCT study [15]. This potentially reduces the false positive rate and improves specificity and PPV if the micro-CT is applied to clinical practice for addressing the well-known weakness of the CCTA in the assessment of coronary stenosis with extensive calcification [5,6,37,38].
Although micro-CT seems to outperform SRCT for blooming artifact suppression, Table 1 and Table 2 reveal that the degree of stenosis measured on the micro-CT images of plaques 1 and 2 of models 1 and 2 were obviously lower than the ground truths, representing under-estimation of the stenoses. Similar findings were also noted in the results of our previous study where higher SRCT beam energies such as 50 keV, were able to further reduce blooming artifact but affected visualization of coronary artery walls and calcified plaques [15]. Use of a higher beam energy (tube potential) is one of the well-known strategies to suppress blooming artifact because the calcified plaque is a high-density material which can easily attenuate radiation with lower energies [33]. However, a higher tube potential is deemed unsuitable for soft tissue visualization such as coronary arteries because its density is lower than that of the calcification. Unfortunately, the lowest tube potential available on the Skyscan 1176 micro-CT scanner is 40 kV.
Another issue of micro-CT is its small field of view (FOV). As shown in Figure 1, the scan table is just large enough to accommodate the 3D printed coronary artery models and therefore not applicable for clinical use. However, micro-CT scanners with greater FOVs such as 43.2×43.2 cm2 have become available more recently [39]. This may make it possible to manufacture a clinical CT scanner with superior spatial resolution matching micro-CT performance in the future. Nevertheless, it is still a challenge for current image processing workstations to handle high-resolution CT images with large matrix size. For example, each model dataset in this study had around 10000 images with 7872×7872 pixels and bit depth of 16 (2 bytes), and hence every dataset size was about 1 TB (7872×7872 pixels × 2 bytes x 10000 images). Also, the long scanning time of micro-CT needs to be addressed so it may take some years for micro-CT technology to be applied in clinical practice. This would be similar to the previous CT system development that took decades for implementing iterative reconstruction into clinical practice since its emergence in 1970s due to the previous processing power limit of computers which also affected its scanning time and spatial resolution improvements [40,41,42].
When the aforementioned issues of micro-CT are addressed, it will be useful for cardiovascular event prediction by reclassifying individuals with low and intermediate risk categories to the appropriate risk categories and therefore safer clinical management along a spectrum where high-risk individuals often undergo interventional treatment whereas low risk are usually followed up without any need for treatment [43,44]. If the use of micro-CT is combined with other blooming artifact suppression approaches such as the latest deep learning image reconstruction strategy, this may enable CT to become the imaging modality with a diagnostic performance matching the current gold standard of invasive coronary angiography. This has significant implications for interventional risks, radiation and healthcare costs [8,9].
Although it is currently impossible to use micro-CT in patient imaging, findings of this study highlight the importance of using high-resolution imaging for the improvement of assessing calcified coronary plaques and a reduction in false positive rates. Compared to the current medical CT scanners with 0.5x0.5x0.5 mm spatial resolution, photon-counting CT represents the latest technological advancement with ultra-high resolution of 0.2 mm, excellent image quality and further reduction in blooming artifact caused by the severe calcification or coronary stents [45,46,47,48,49]. Recent studies based on phantom experiments showed that photon-counting CT has improved quantification of coronary stenosis with reduced blooming artifact, independent of heart rates when compared to the standard CCTA (0.2 mm vs 0.4 mm slice thickness) [45,46]. This is also confirmed by patient studies using the photon-counting CT. Si-Mohamed et al. reported their initial experience with photon-counting CT in patients with 100% improvement in overall image quality in calcification [47]. Hagar et al. analyzed imaging of 68 patients showing that photon-counting CT had 96% sensitivity, 84% specificity and 88% accuracy in the assessment of significant CAD. Even in patients with severe calcification (Agatston score of at least 1000), photon-counting CT still had a high performance with 93% sensitivity, 70% specificity and 83% accuracy [48]. Soschynski et al. in their multi-center study consisting of 92 patients further validated these findings with a high diagnostic performance: 92% sensitivity, 96% specificity and 95% accuracy (Figure 9) [49]. Photon-counting CT is likely to make significant contributions to the improvement of diagnostic assessment of calcified coronary plaques in future.
This study has several limitations. Only one tube potential and one slice thickness were used for the micro-CT image acquisition. Comparison of high-resolution micro-CT with use of different resolutions such as 0.1-0.4 mm deserves to be investigated as this is close to the CT resolution available in clinical practice. There were no thoracic structures surrounding the coronary models, and contrast medium was not used. However, these should not affect the assessment of calcified plaques and coronary stenosis as evident in Figure 3, Figure 4, Figure 5, Figure 6, Figure 7 and Figure 8 that the margins of vessel walls and plaques demonstrated on the micro-CT images as sharp as those on the SRCT images or even better [15]. Although plaques of differing degree and location were simulated, only six were present in this study and clinical variation of arterial diameter, degree of disease, location and number of plaques is wider. Most importantly, plaques can still be heterogeneous even when calcified, and this has implications on interpretation of detailed images [17].
5. Conclusions
This study shows that the high-resolution micro-CT outperforms SRCT in calcified plaques and coronary stenosis assessment with regard to blooming artifact reduction. This finding will become clinically important for cardiovascular risk prediction and allow reclassification of individuals with low and intermediate risk into the appropriate risk categories when the technical challenges of using micro-CT in clinical practice such as small FOV and highly demanding image processing power are addressed. Potentially, this will lead to optimal clinical management according to accurate risk prediction in a disease process where intervention carries risks and minimization of unnecessary coronary angiography and treatment must be paramount.
Author Contributions
Conceptualization, C.K.C.N., Z.S. and S.J.; methodology, C.K.C.N., Z.S. and S.J.; software, Z.S.; validation, C.K.C.N., Z.S. and S.J.; formal analysis, C.K.C.N. and Z.S.; investigation, C.K.C.N. and Z.S.; resources, C.K.C.N. and Z.S.; data curation, C.K.C.N. and Z.S.; writing—original draft preparation, C.K.C.N., Z.S. and S.J.; writing—review and editing, C.K.C.N., Z.S. and S.J.; visualization, Z.S.; project administration, C.K.C.N. and Z.S.; funding acquisition, C.K.C.N., Z.S. and S.J. All authors have read and agreed to the published version of the manuscript.
Funding
This research was funded by Curtin Medical School Seed Grants 2022, Curtin University, Australia.
Institutional Review Board Statement
Not applicable.
Informed Consent Statement
Not applicable.
Data Availability Statement
Data is available upon request.
Conflicts of Interest
The funder had no role in the design of the study; in the collection, analyses, or interpretation of data; in the writing of the manuscript; or in the decision to publish the results.
References
- Sun, Z.; Lin, C. Diagnostic value of 320-slice coronary CT angiography in coronary artery disease: A systematic review and meta-analysis. Curr. Med. Imaging. 2014, 10, 272–280. [Google Scholar] [CrossRef]
- Xu, L.; Sun, Z.; Fan, Z. Non-invasive physiologic assessment of coronary stenoses using cardiac CT. Biomed. Res. Int. 2014, 2014, 435737. [Google Scholar] [CrossRef]
- Sun, Z.; Choo, G.H.; Ng, K.H. Coronary CT angiography: Current status and continuing challenges. Br. J. Radiol. 2012, 85, 495–510. [Google Scholar] [CrossRef] [PubMed]
- Lee, S.P.; Jang, E.J.; Kim, Y.J.; Cha, M.J.; Park, S.Y.; Song, H.J.; Choi, J.E.; Shim, J.I.; Ahn, J.; Lee, H.J. Cost-effectiveness of coronary CT angiography in patients with chest pain: Comparison with myocardial single photon emission tomography. J. Cardiovasc. Comput. Tomogr. 2015, 9, 428–437. [Google Scholar] [CrossRef]
- Park, M.J.; Jung, J.I.; Choi, Y.S.; Ann, S.H.; Youn, H.J.; Jeoon, G.N.; Choi, H.C. Coronary CT angiography in patients with high calcium score: Evaluation of plaque characteristics and diagnostic accuracy. Int. J. Cardiovasc. Imaging. 2011, 27, 43–51. [Google Scholar] [CrossRef]
- Sun, Z.; Ng, C.K.C. High calcium scores in coronary CT angiography: Effects of image post-processing on visualization and measurement of coronary lumen diameter. J. Med. Imaging Health Inf. 2015, 5, 110–116. [Google Scholar] [CrossRef]
- Sun, Z.; Ng, C.K.C.; Xu, L.; Fan, Z.; Lei, J. Coronary CT angiography in heavily calcified coronary arteries: Improvement of coronary lumen visualization and coronary stenosis assessment with image postprocessing methods. Medicine. 2015, 94, e2148. [Google Scholar] [CrossRef]
- Sun, Z.; Ng, C.K.C. Artificial intelligence (enhanced super-resolution generative adversarial network) for calcium deblooming in coronary computed tomography angiography: A feasibility study. Diagnostics. 2022, 12, 991. [Google Scholar] [CrossRef]
- Sun, Z.; Ng, C.K.C. Finetuned super-resolution generative adversarial network (artificial intelligence) model for calcium deblooming in coronary computed tomography angiography. J. Pers. Med. 2022, 12, 1354. [Google Scholar] [CrossRef]
- Sun, Z.; Xu, L.; Fan, Z. Coronary CT angiography in calcified coronary plaques: Comparison of diagnostic accuracy between bifurcation angle measurement and coronary lumen assessment for diagnosing significant coronary stenosis. Int. J. Cardiol. 2016, 203, 78–86. [Google Scholar] [CrossRef]
- Sun, Z. Coronary CT angiography in coronary artery disease: correlation between virtual intravascular endoscopic appearances and left bifurcation angulation and coronary plaques. Biomed. Res. Int. 2013, 2013, 732059. [Google Scholar] [CrossRef] [PubMed]
- Xu, L.; Sun, Z. Coronary CT angiography evaluation of calcified coronary plaques by measurement of left coronary bifurcation angle. Int. J. Cardiol. 2015, 182, 229–231. [Google Scholar] [CrossRef] [PubMed]
- Andreini, D.; Pontone, G.; Mushtaq, S.; Conte, E.; Perchinunno, M.; Guglielmo, M.; Volpato, V.; Annoni, A.; Baggiano, A.; Formenti, A.; Mancini, M.E.; Beltrama, V.; Ditali, V.; Campari, A.; Fiorentini, C.; Bartorelli, A.L.; Pepi, M. Atrial fibrillation: Diagnostic accuracy of coronary CT angiography performed with a whole-heart 230-μm spatial resolution CT scanner. Radiology. 2017, 284, 676–684. [Google Scholar] [CrossRef]
- Sun, Z. The promise of synchrotron radiation in medical science. Australasian Med. J. 2009, 1, 1–5. [Google Scholar] [CrossRef]
- Sun, Z.; Ng, C.K.C.; Squelch, A. Synchrotron radiation computed tomography assessment of calcified plaques and coronary stenosis with different slice thicknesses and beam energies on 3D printed coronary models. Quant. Imaging Med. Surg. 2019, 9, 6–22. [Google Scholar] [CrossRef]
- du Plessis, A.; Broeckhoven, C.; Guelpa, A.; le Roux, S.G. Laboratory x-ray micro-computed tomography: A user guideline for biological samples. Gigascience. 2017, 6, 1–11. [Google Scholar] [CrossRef]
- Sun, Z.; Ng, C.K.C.; Wong, Y.H.; Yeong, C.H. 3D-printed coronary plaques to simulate high calcification in the coronary arteries for investigation of blooming artifacts. Biomolecules. 2021, 11, 1307. [Google Scholar] [CrossRef]
- Giannopoulos, A.A.; Steigner, M.L.; George, E.; Barile, M.; Hunsaker, A.R.; Rybicki, F.J.; Mitsouras, D. Cardiothoracic applications of 3-dimensional printing. J. Thorac. Imaging. 2016, 31, 253–272. [Google Scholar] [CrossRef]
- Lau, I.; Sun, Z. Dimensional accuracy and clinical value of 3D printed models in congenital heart disease: A systematic review and meta-analysis. J. Clin. Med. 2019, 8, 1483. [Google Scholar] [CrossRef]
- Lee, S.; Squelch, A.; Sun, Z. Quantitative assessment of 3D printed model accuracy in delineating congenital heart disease. Biomolecules. 2021, 11, 270. [Google Scholar] [CrossRef]
- Valverde, I.; Gomez-Ciriza, G.; Hussain, T.; Suarez-Mejias, C.; Velasco-Forte, M.N.; Byrne, N.; Ordonex, A.; Gonzalez-Calle, A.; Anderson, D.; Hazekamp, M.G.; Roest, A.A.W.; Rivas-Gonzalez, J.; Uribe, S.; El-Rassi, I.; Simpson, J.; Miller, O.; Ruiz, E.; Zabala, I.; Mendez, A.; Manso, B.; Gallego, P.; Prada, F.; Cantinotti, M.; Ait-Ali, L.; Merino, C.; Parry, A.; Poirier, N.; Greil, G.; Razavi, R.; Gomez-Cia, T.; Hosseinpour, A.R. Three-dimensional printed models for surgical planning of complex congenital heart defects: An international multicenter study. Eur. J. Cardiothorac. Surg. 2017, 52, 1139–1148. [Google Scholar] [CrossRef]
- Lau, I.W.W.; Liu, D.; Xu, L.; Fan, Z.; Sun, Z. Clinical value of patient-specific three-dimensional printing of congenital heart disease: Quantitative and qualitative assessments. PLoS ONE. 2018, 13, e0194333. [Google Scholar] [CrossRef] [PubMed]
- Sun, Z.; Wee, C. 3D printed models in cardiovascular disease: An exciting future to deliver personalized medicine. Micromachines. 2022, 13, 1575. [Google Scholar] [CrossRef]
- Sun, Z. Clinical applications of patient-specific 3D printed models in cardiovascular disease: Current status and future directions. Biomolecules. 2020, 10, 1577. [Google Scholar] [CrossRef] [PubMed]
- Sun, Z.; Wong, Y.H.; Yeong, C.H. Patient-specific 3D-printed low-cost models in medical education and clinical practice. Micromachines. 2023, 14, 464. [Google Scholar] [CrossRef]
- Mayer, R.; Liacouras, P.; Thomas, A.; Kang, M.; Lin, L.; Simonet, C.B. 2nd. 3D printer generated thorax phantom with mobile tumor for radiation dosimetry. Rev. Sci. Instrum. 2015, 86, 074301. [Google Scholar] [CrossRef] [PubMed]
- Hou, K.Y.; Tsujioka, K.; Yang, C.C. Optimization of HU threshold for coronary artery calcium scans reconstructed at 0.5-mm slice thickness using iterative reconstruction. J. Appl. Clin. Med. Phys. 2020, 21, 111–120. [Google Scholar] [CrossRef]
- Yang, Q.; Liu, J.; Barnes, S.R.; Wu, Z.; Li, K.; Neelavalli, J.; Hu, J.; Haacke, E.M. Imaging the vessel wall in major peripheral arteries using susceptibility-weighted imaging. J. Magn. Reason. Imaging. 2009, 30, 357–365. [Google Scholar] [CrossRef]
- Suzuki, S.; Machida, H.; Tanaka, I.; Ueno, E. Vascular diameter measurement in CT angiography: Comparison of model-based iterative reconstruction and standard filtered back projection algorithms in vitro. AJR Am. J. Roentgenol. 2013, 200, 652–657. [Google Scholar] [CrossRef]
- Sun, Z.; Ng, C.K.C. Synchrotron radiation imaging of aortic stent grafting: An in vitro phantom study. J. Med. Imaging Health Inform. 2017, 7, 890–896. [Google Scholar] [CrossRef]
- Sun, Z.; Ng, C.K.C. Use of synchrotron radiation to accurately assess cross-sectional area reduction of the aortic branch ostia caused by suprarenal stent wires. J. Endovasc. Ther. 2017, 24, 870–879. [Google Scholar] [CrossRef] [PubMed]
- Sun, Z.; Ng, C.K.C.; Sa Dos Reis, C. Synchrotron radiation computed tomography versus conventional computed tomography for assessment of four types of stent grafts used for endovascular treatment of thoracic and abdominal aortic aneurysms. Quant. Imaging Med. Surg. 2018, 8, 609–620. [Google Scholar] [CrossRef] [PubMed]
- Kalisz, K; Buethe, J. ; Saboo, S.S.; Abbara, S.; Halliburton, S.; Rajiah, P. Artifacts at cardiac CT: Physics and solutions. Radiographics. 2016, 36, 2064–2083. [Google Scholar] [CrossRef] [PubMed]
- Xu, L.; Sun, Z. Virtual intravascular endoscopy visualization of calcified coronary plaques: a novel approach of identifying plaque features for more accurate assessment of coronary lumen stenosis. Medicine. 2015, 94, e805. [Google Scholar] [CrossRef] [PubMed]
- Sun, Z.; Dosari, S.A.; Ng, C.; al-Muntashari, A.; Almaliky, S. Multislice CT virtual intravascular endoscopy for assessing pulmonary embolisms: A pictorial review. Korean J. Radiol. 2010, 11, 222–230. [Google Scholar] [CrossRef]
- Sun, Z.; Dimpudus, F.J.; Nugroho, J.; Adipranoto, J.D. CT virtual intravascular endoscopy assessment of coronary artery plaques: A preliminary study. Eur. J. Radiol. 2010, 75, e112–e119. [Google Scholar] [CrossRef]
- Li, P.; Xu, L.; Yang, L.; Wang, R.; Hsieh, J.; Sun, Z.; Fan, Z.; Leipsic, J.A. Blooming artifact reduction in coronary artery calcification by a new de-blooming algorithm: Initial study. Sci. Rep. 2018, 8, 6945. [Google Scholar] [CrossRef]
- Weir-McCall, J.R.; Wang, R.; Halankar, J.; Hsieh, J.; Hague, C.J.; Rosenblatt, S.; Fan, Z.; Sellers, S.L.; Murphy, D.T.; Blanke, P.; Xu, L.; Leipsic, J.A. Effect of a calcium deblooming algorithm on accuracy of coronary computed tomography angiography. J. Cardiovasc. Comput. Tomogr. 2020, 14, 131–136. [Google Scholar] [CrossRef]
- Nikon Corporation. XT H 225 ST 2x. Available online: https://industry.nikon.com/en-aom//wp-content/uploads/sites/20/2022/12/xth-225-st-2x-en.pdf (accessed on 19 June 2023).
- Leipsic, J.; Heilbron, B.G.; Hague, C. Iterative reconstruction for coronary CT angiography: Finding its way. Int. J. Cardiovasc. Imaging. 2012, 28, 613–620. [Google Scholar] [CrossRef]
- Wang, J.; Fleischmann, D. Improving spatial resolution at CT: Development, benefits, and pitfalls. Radiology. 2018, 289, 261–262. [Google Scholar] [CrossRef]
- Wu, S. The potential value of 320-row computed tomography angiography in digital subtraction angiography-Negative spontaneous subarachnoid hemorrhage patients. J. Comput. Assist. Tomogr. 2022, 46, 244–250. [Google Scholar] [CrossRef] [PubMed]
- Trost, J.; Ferraro, R.; Sharma, G. , Hays, A.G.; Boden, W.E.; Blumenthal, R.S.; Arbab-Zadeh, A. CCTA should be the new diagnostic gateway for evaluating intermediate-risk stable angina patients. JACC Adv. 2022, 1, 100116. [Google Scholar] [CrossRef]
- Kim, C.; Hong, S.J.; Ahn, C.M.; Kim, J.S.; Kim, B.K.; Ko, Y.G.; Choi, B.W.; Choi, D.; Jang, Y.; Hong, M.K. Clinical implications of moderate coronary stenosis on coronary computed tomography angiography in patients with stable angina. Yonsei Med. J. 2018, 59, 937–944. [Google Scholar] [CrossRef]
- Koons, E.; VanMeter, P.; Rajendran, K.; Yu, L.; McCollough, C.; Leng, S. Improved quantification of coronary artery luminal stenosis in the presence of heavy calcifications using photon-counting detector CT. Proc. SPIE Int. Soc. Opt. Eng. 2022, 12031, 120311A. [Google Scholar] [CrossRef] [PubMed]
- Zsarnoczay, E.; Fink, N.; Schoepf, U.J.; O’Doherty, J.; Allmendinger, T.; Hagenauer, J.; Wolf, E.V.; Griffith, J.P. 3rd; Maurovich-Horvat, P.; Varga-Szemes, A.; Emrich, T. Ultra-high resolution photon-counting coronary CT angiography improves coronary stenosis quantification over a wide range of heart rates-A dynamic phantom study. Eur. J. Radiol. 2023, 161, 110746. [Google Scholar] [CrossRef] [PubMed]
- Si-Mohamed, S.A.; Boccalini, S.; Lacombe, H.; Diaw, A.; Varasteh, M.; Rodesch, P.A.; Dessouky, R.; Villien, M.; Tatard-Leitman, V.; Bochaton, T.; Coulon, P.; Yagil, Y.; Lahoud, E.; Erbard, K.; Riche, B.; Bonnefoy, E.; Rioufol, G.; Finet, G.; Bergerot, C.; Boussel, L.; Greffier, J.; Douek, P.C. Coronary CT angiography with photon-counting CT: First-in-human results. Radiology. 2022, 303, 303–313. [Google Scholar] [CrossRef]
- Hagar, M.T.; Soschynski, M.; Saffar, R.; Ran, A.; Taron, J.; Weiss, J.; Stein, T.; Faby, S.; von zur Mueblen, C.; Ruile, P.; Schlett, C.L.; Bamburg, F.; Krauss, T. Accuracy of ultrahigh-resolution photon-counting CT for detecting coronary artery disease in a high-risk population. Radiology, 2023, 307, e223305. [Google Scholar] [CrossRef]
- Soschynski, M.; Hagen, F.; Baumann, S.; Hagar, M.T.; Weiss, J.; Krauss, T.; Schlett, C.L.; von zur Muhlen, C.; Nikolaou, K.; Greulich, S.; Froelich, M.F.; Riffel, P.; Overhoff, D.; Papavassiliu, T.; Schoenberg, S.O.; Faby, S.; Ulzheimer, S.; Ayx, I.; Krumm, P. High temporal resolution dual-source photon-counting CT for coronary artery disease: Initial multicenter clinical experience. J. Clin. Med. 2022, 11, 6003. [Google Scholar] [CrossRef]
Figure 1.
Three-dimensional printed coronary models with simulation of calcified plaques (arrows) in the left coronary arteries. Reprint from Sun et al. [15] with permission.
Figure 1.
Three-dimensional printed coronary models with simulation of calcified plaques (arrows) in the left coronary arteries. Reprint from Sun et al. [15] with permission.
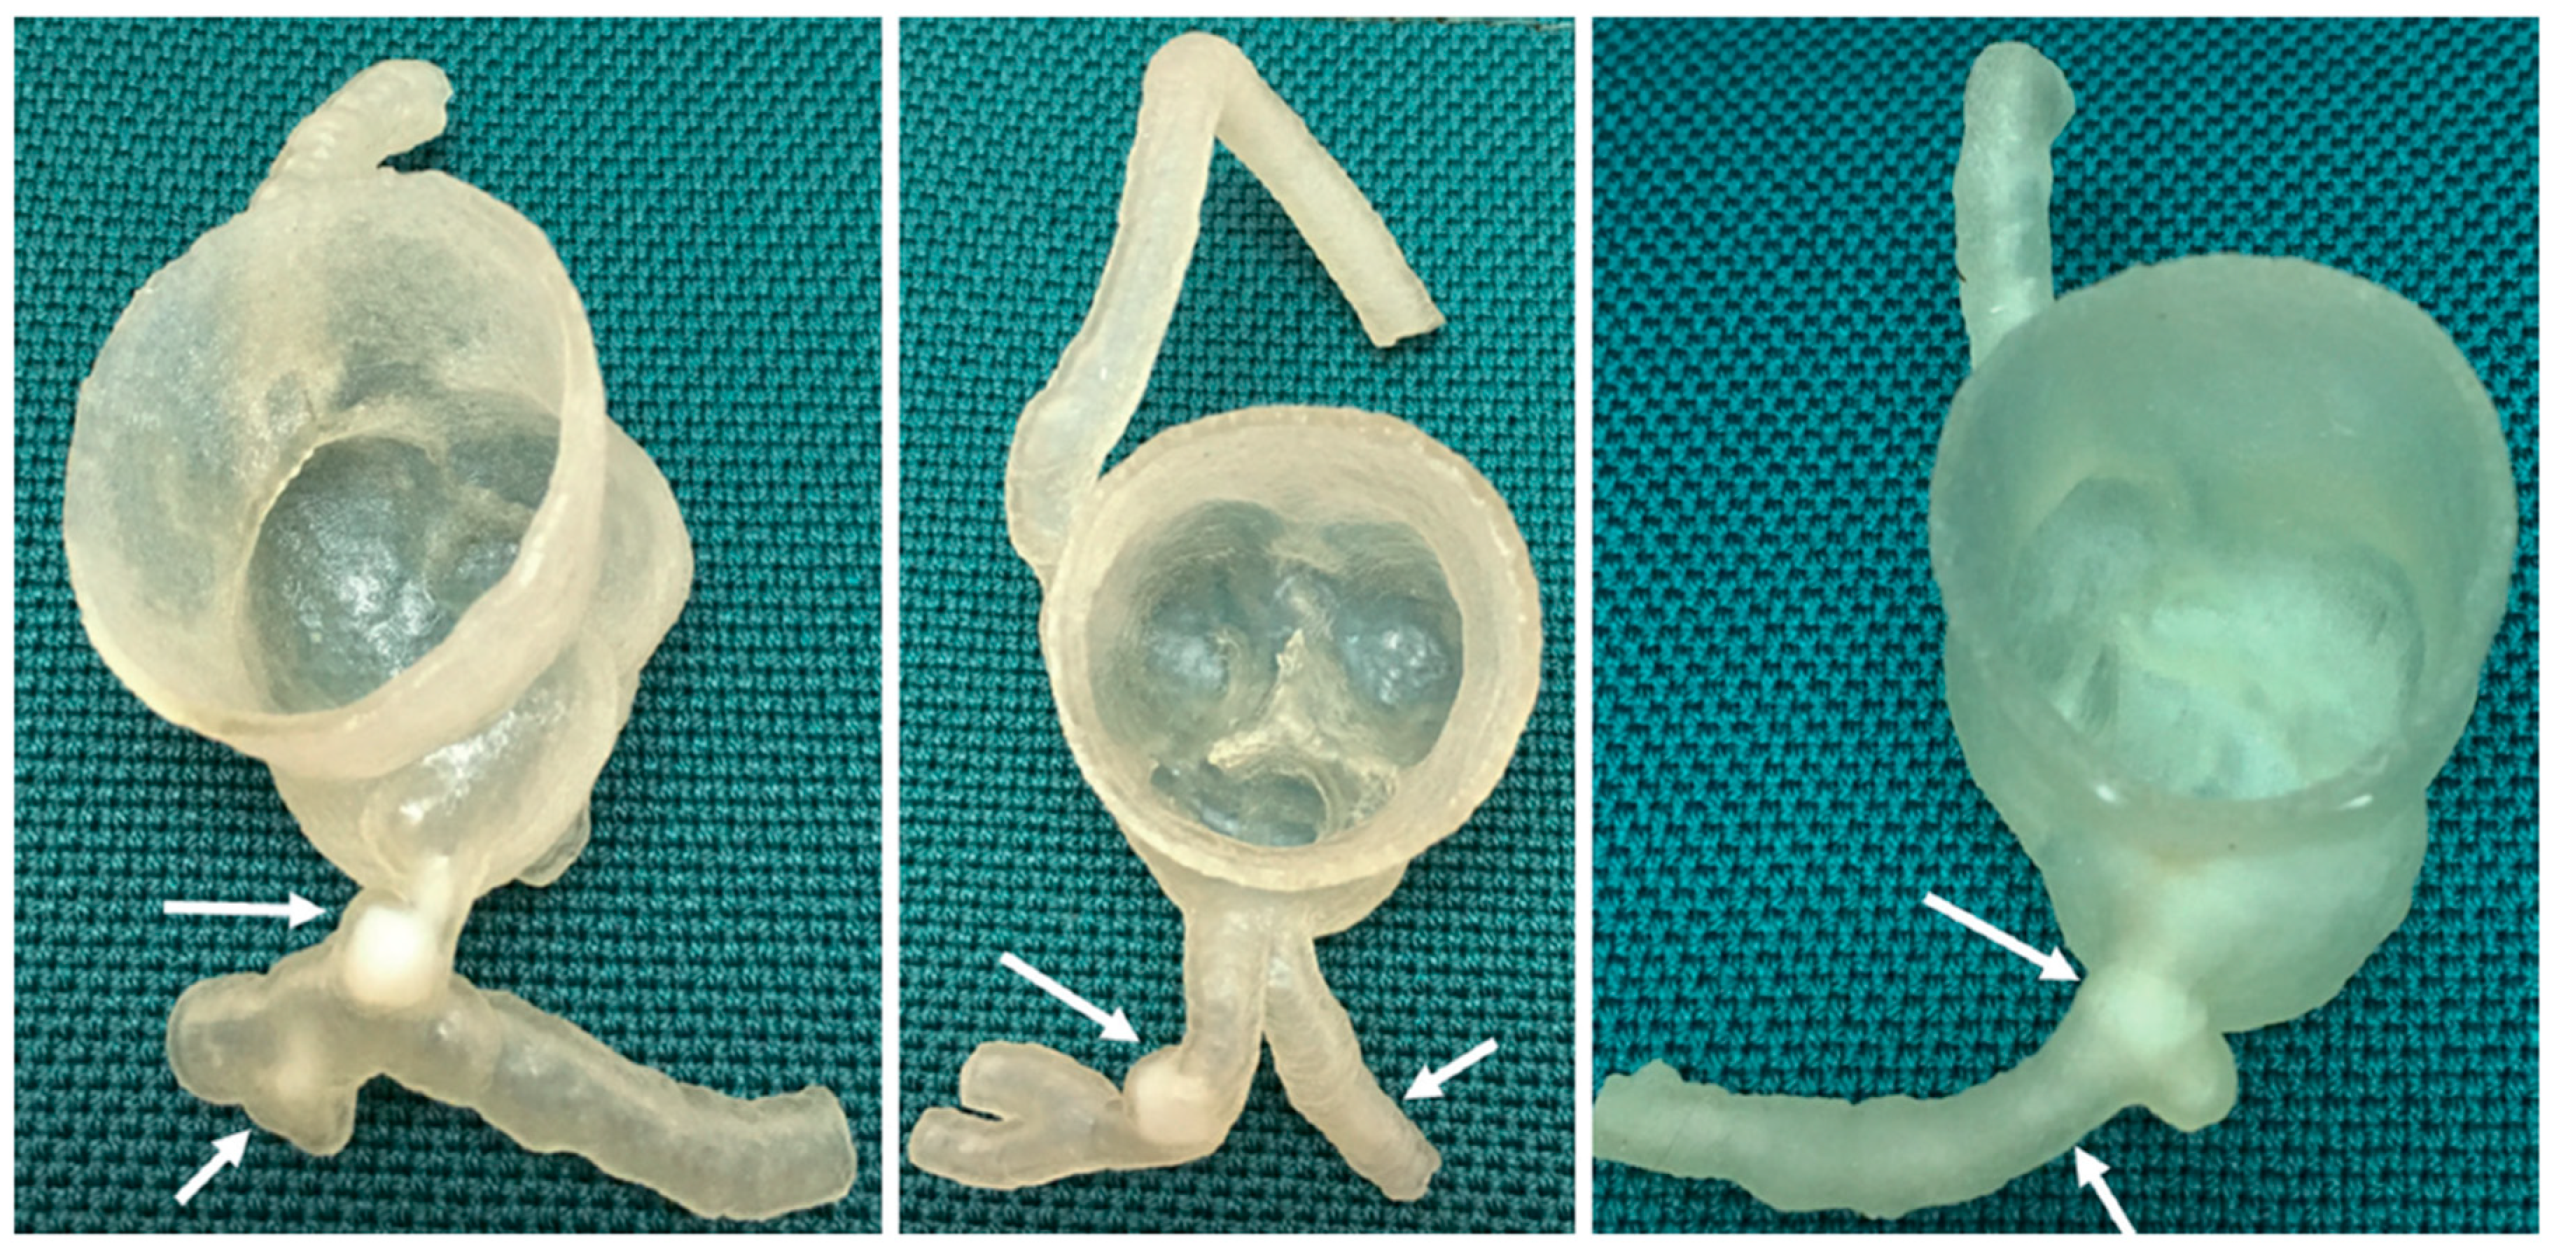
Figure 2.
Micro-computed tomography scan with model 2 placed on the scan table.

Figure 3.
Two-dimensional micro-computed tomography (micro-CT) (0.009 mm slice thickness) and synchrotron radiation CT (0.095-0.491 mm slice thickness) images of plaque 1 in model 1 causing >90% stenosis (reprint of synchrotron radiation CT images with permission [15]).
Figure 3.
Two-dimensional micro-computed tomography (micro-CT) (0.009 mm slice thickness) and synchrotron radiation CT (0.095-0.491 mm slice thickness) images of plaque 1 in model 1 causing >90% stenosis (reprint of synchrotron radiation CT images with permission [15]).
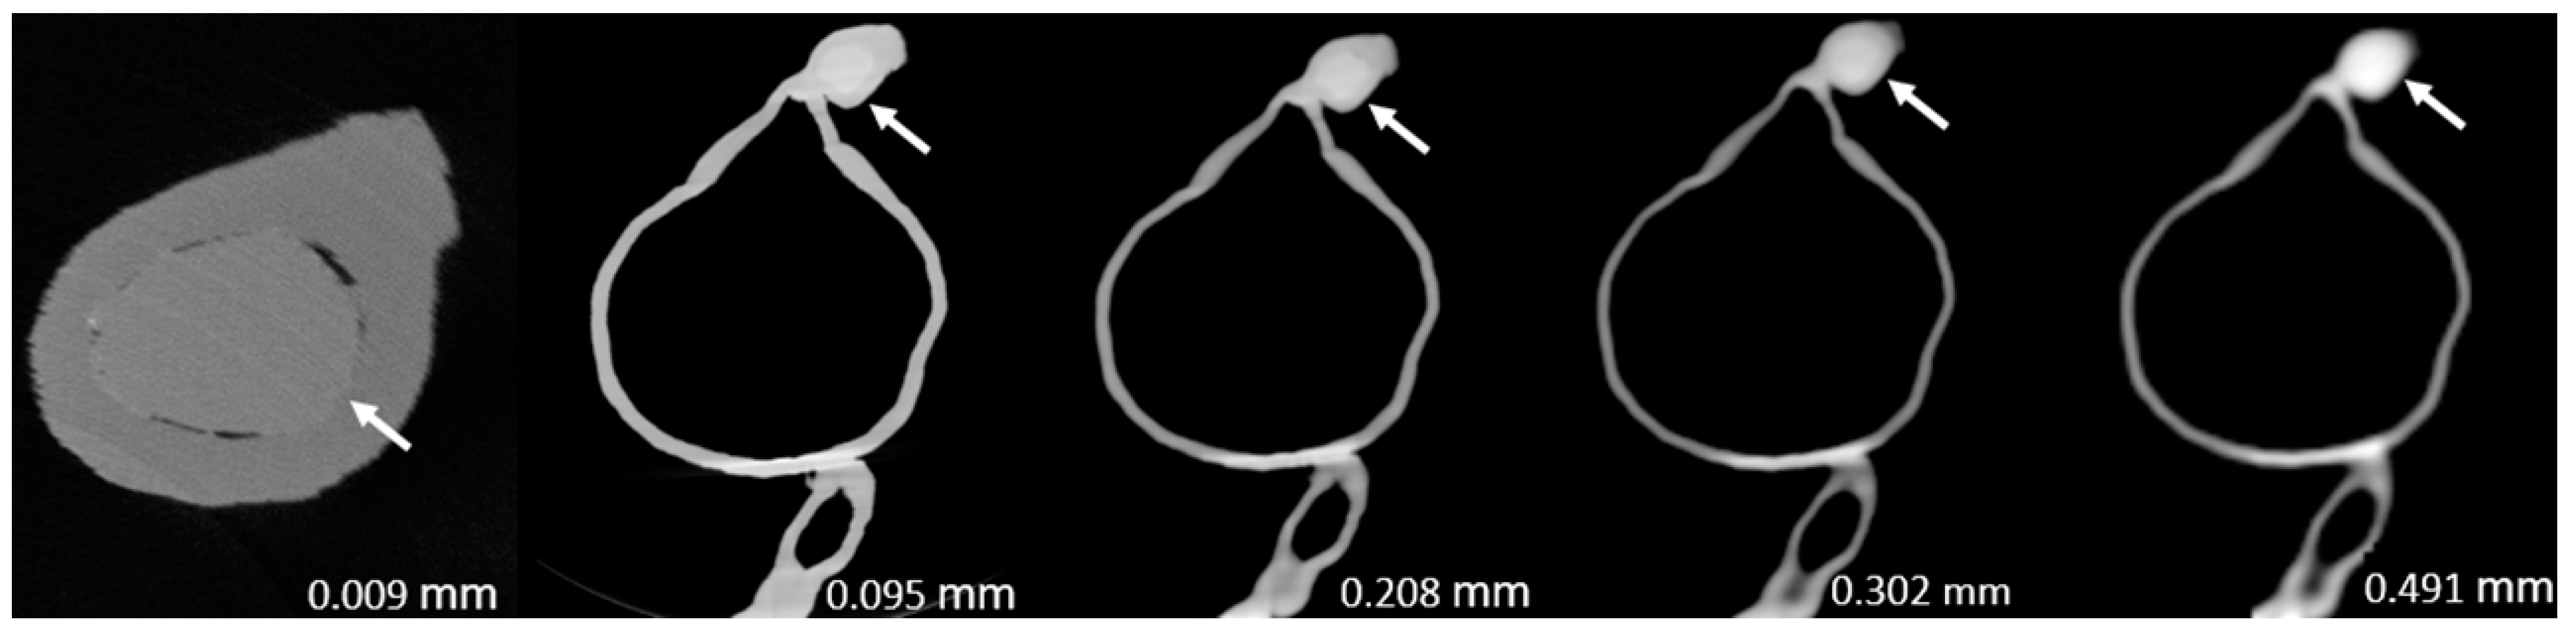
Figure 4.
Two-dimensional micro-computed tomography (micro-CT) (0.009 mm slice thickness) and synchrotron radiation CT (0.095-0.491 mm slice thickness) images of plaque 1 in model 2 causing >90% stenosis (reprint of synchrotron radiation CT images with permission [15]).
Figure 4.
Two-dimensional micro-computed tomography (micro-CT) (0.009 mm slice thickness) and synchrotron radiation CT (0.095-0.491 mm slice thickness) images of plaque 1 in model 2 causing >90% stenosis (reprint of synchrotron radiation CT images with permission [15]).
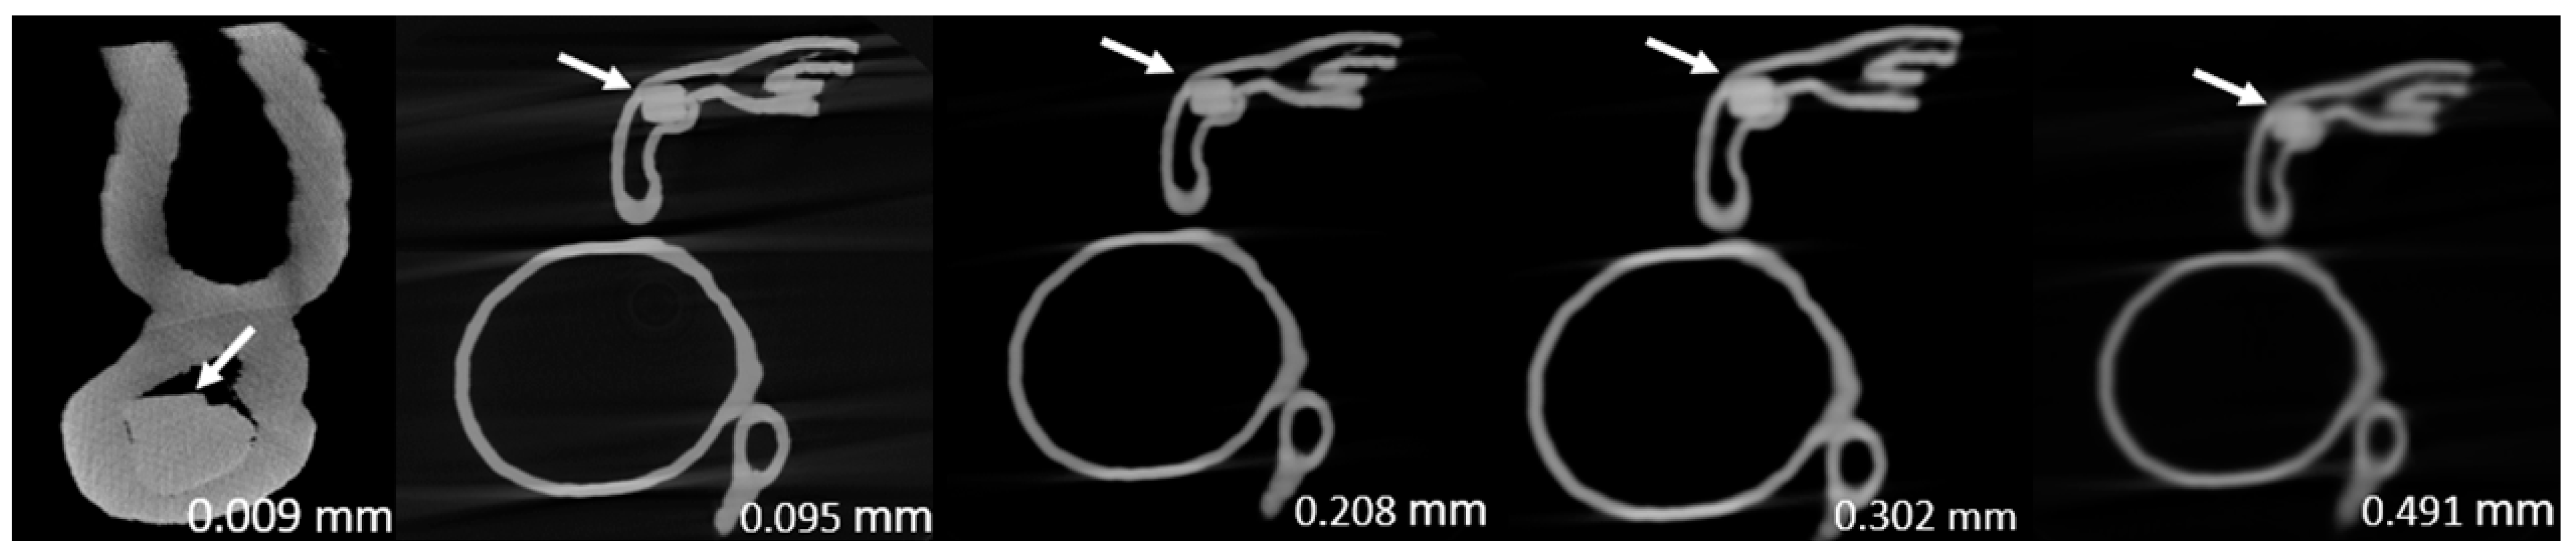
Figure 5.
Two-dimensional micro-computed tomography (micro-CT) (0.009 mm slice thickness) and synchrotron radiation CT (0.095-0.491 mm slice thickness) images of plaque 1 in model 3 causing >90% stenosis (reprint of synchrotron radiation CT images with permission [15]).
Figure 5.
Two-dimensional micro-computed tomography (micro-CT) (0.009 mm slice thickness) and synchrotron radiation CT (0.095-0.491 mm slice thickness) images of plaque 1 in model 3 causing >90% stenosis (reprint of synchrotron radiation CT images with permission [15]).
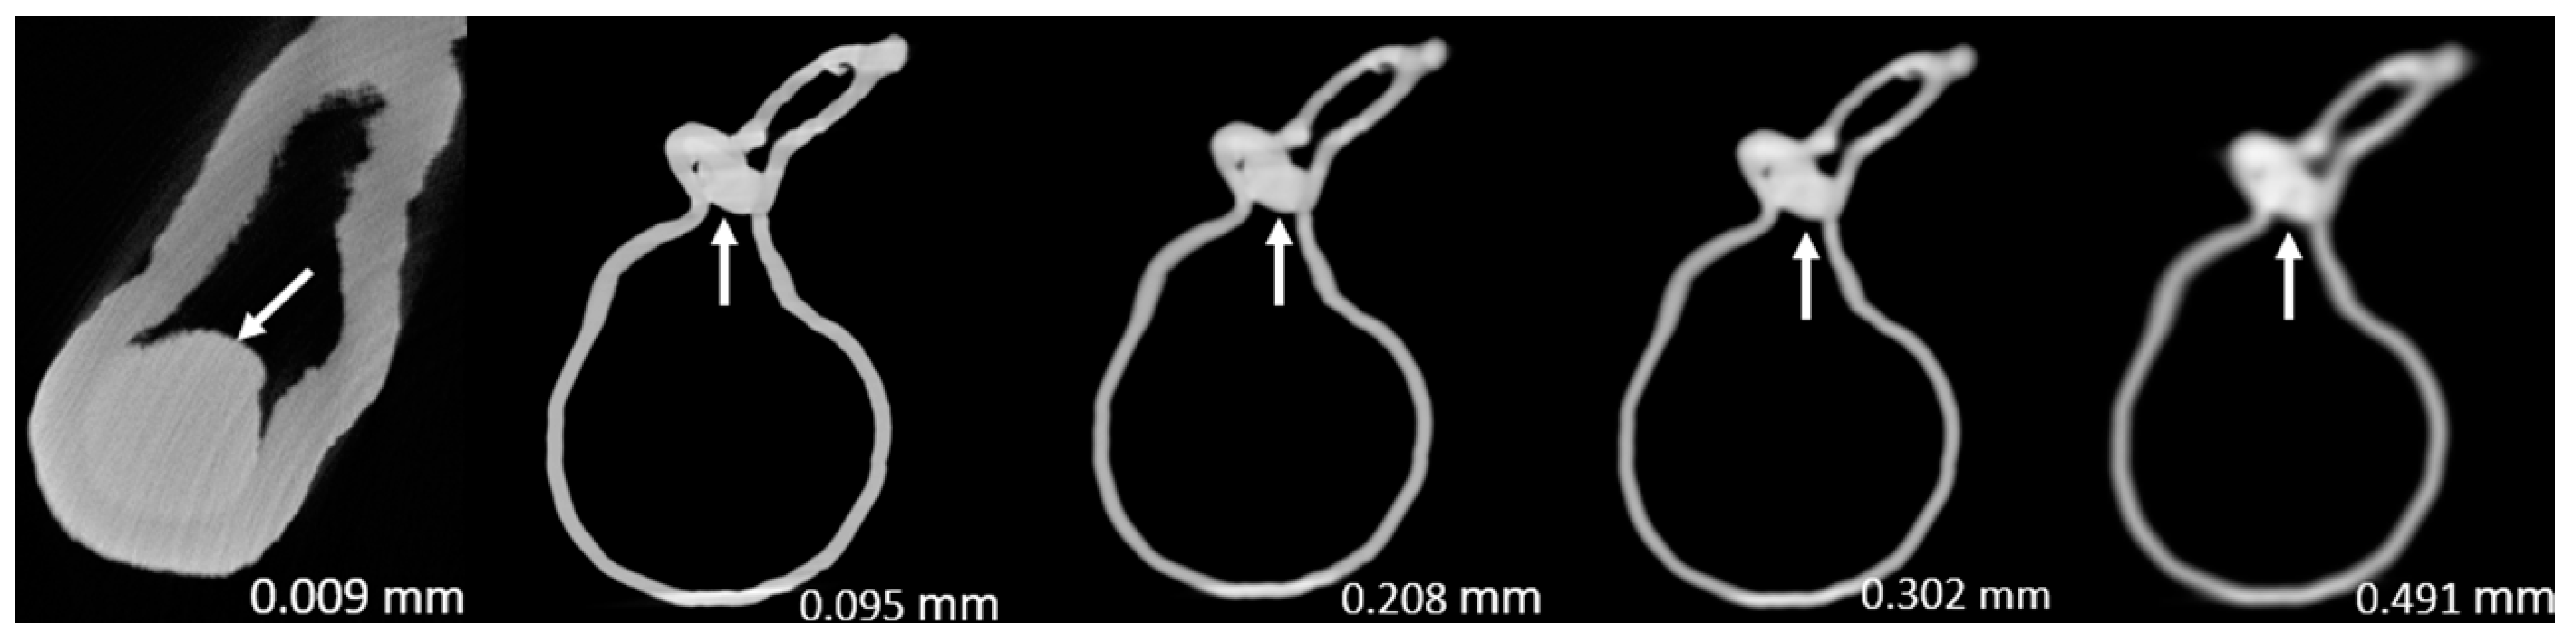
Figure 6.
Two-dimensional micro-computed tomography (micro-CT) (0.009 mm slice thickness) and synchrotron radiation CT (0.095-0.491 mm slice thickness) images of plaque 2 in model 1 causing <50% stenosis (reprint of synchrotron radiation CT images with permission [15]).
Figure 6.
Two-dimensional micro-computed tomography (micro-CT) (0.009 mm slice thickness) and synchrotron radiation CT (0.095-0.491 mm slice thickness) images of plaque 2 in model 1 causing <50% stenosis (reprint of synchrotron radiation CT images with permission [15]).
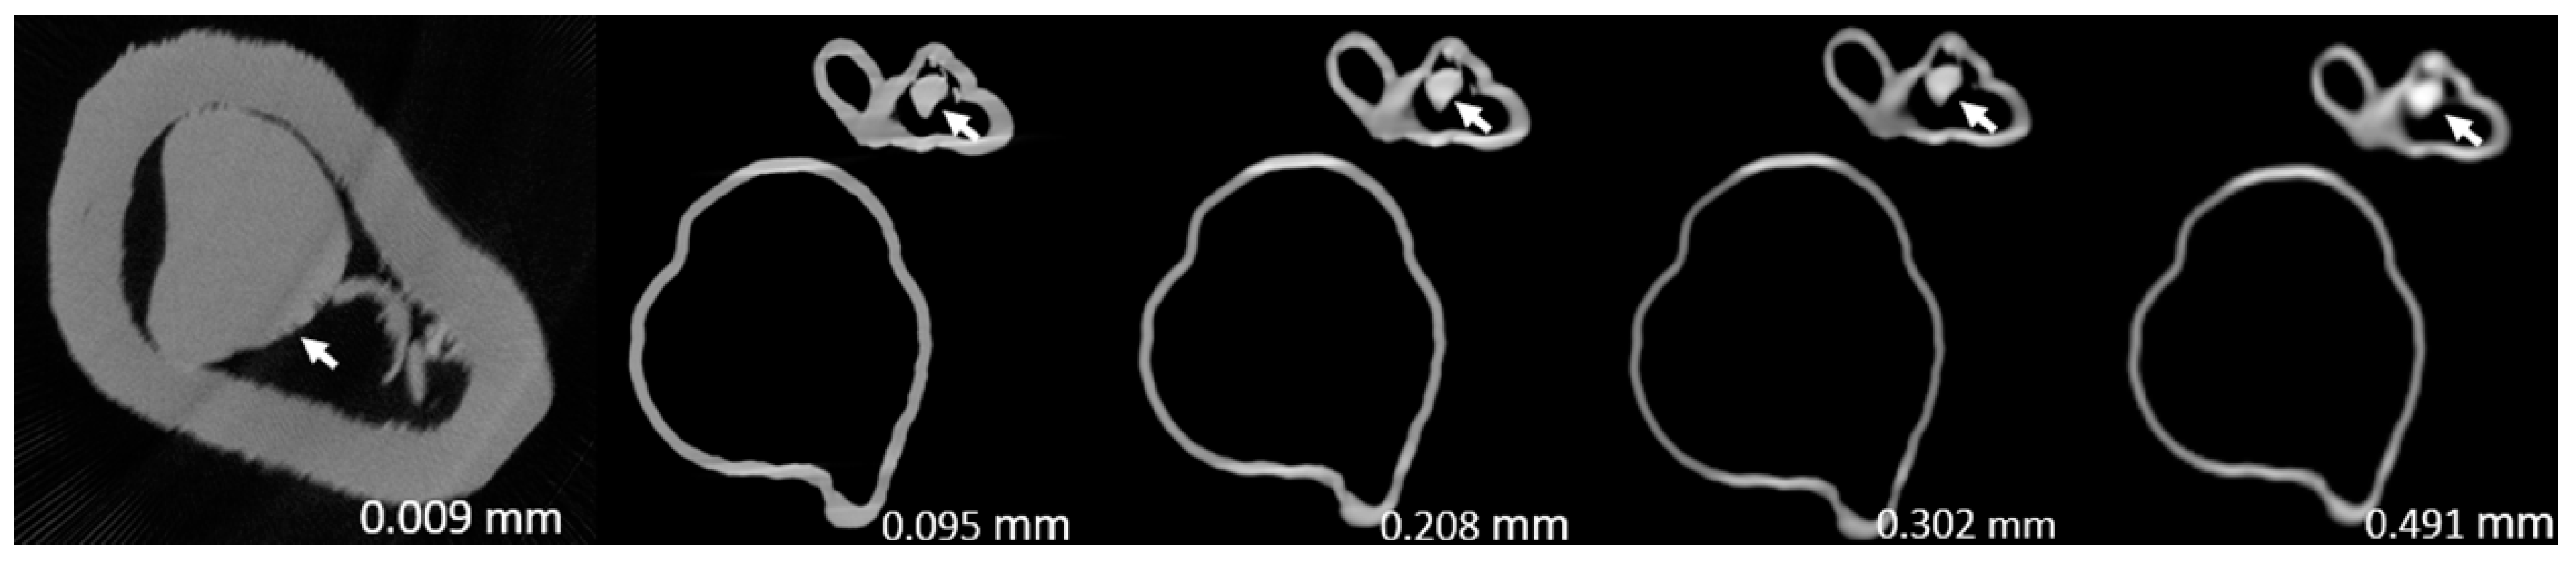
Figure 7.
Two-dimensional micro-computed tomography (micro-CT) (0.009 mm slice thickness) and synchrotron radiation CT (0.095-0.491 mm slice thickness) images of plaque 2 in model 2 causing 70% stenosis (reprint of synchrotron radiation CT images with permission [15]).
Figure 7.
Two-dimensional micro-computed tomography (micro-CT) (0.009 mm slice thickness) and synchrotron radiation CT (0.095-0.491 mm slice thickness) images of plaque 2 in model 2 causing 70% stenosis (reprint of synchrotron radiation CT images with permission [15]).
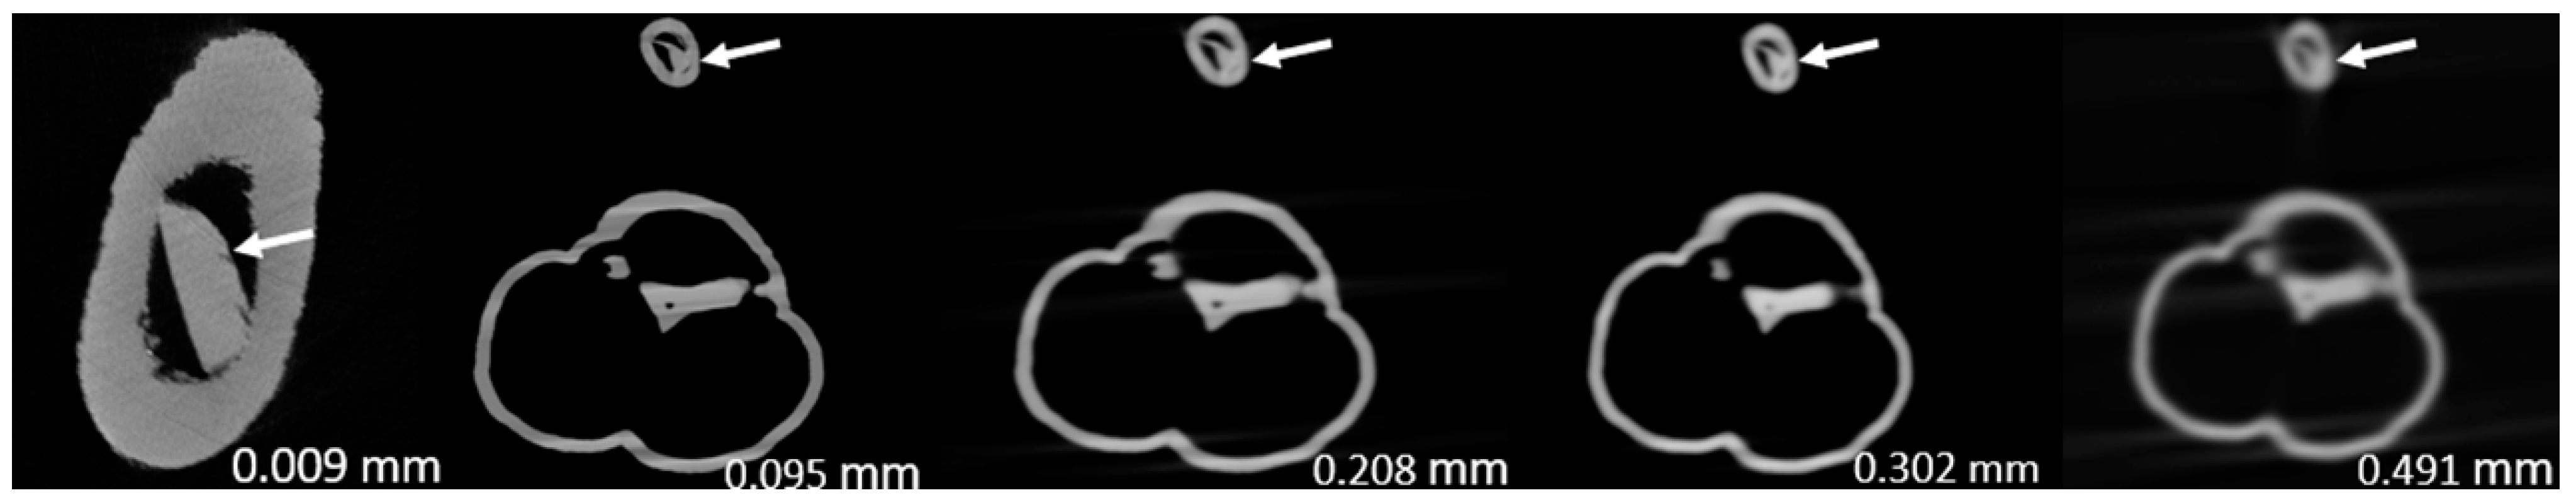
Figure 8.
Two-dimensional micro-computed tomography (micro-CT) (0.009 mm slice thickness) and synchrotron radiation CT (0.095-0.491 mm slice thickness) images of plaque 2 in model 3 causing 70% stenosis (reprint of synchrotron radiation CT images with permission [15]).
Figure 8.
Two-dimensional micro-computed tomography (micro-CT) (0.009 mm slice thickness) and synchrotron radiation CT (0.095-0.491 mm slice thickness) images of plaque 2 in model 3 causing 70% stenosis (reprint of synchrotron radiation CT images with permission [15]).
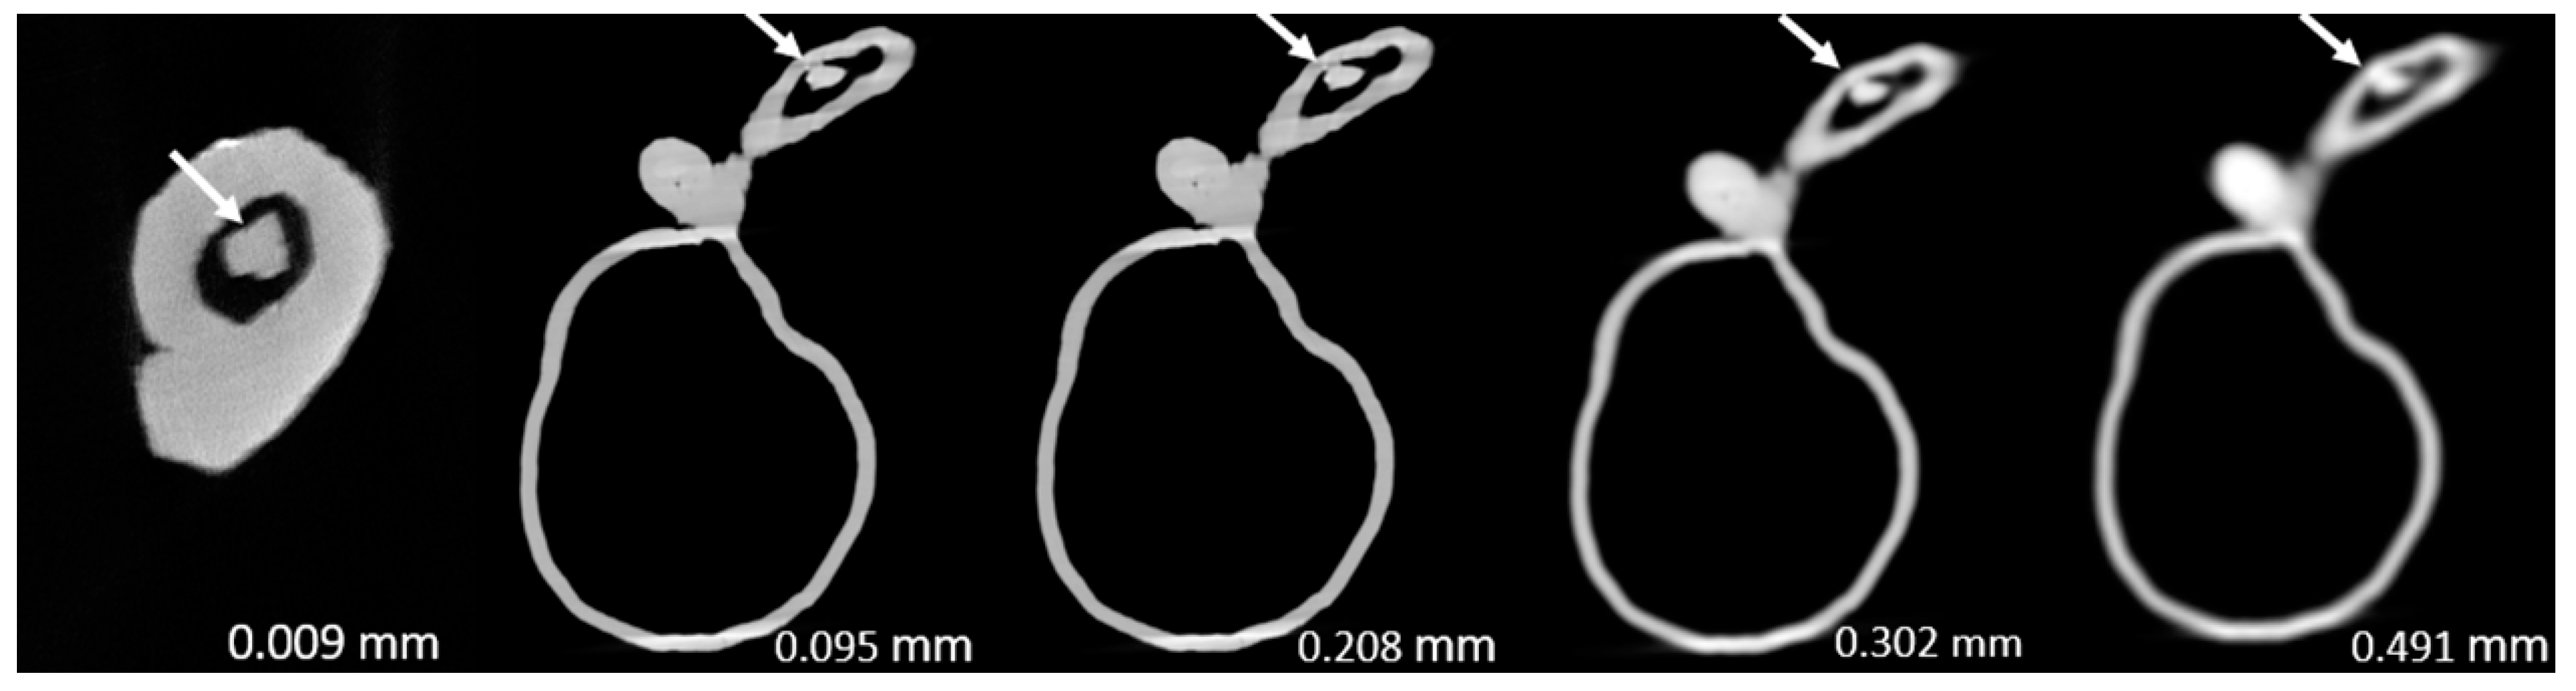
Figure 9.
Coronary computed tomography angiography images of a 75-year-old male patient with atypical angina pectoris. Total Agatston score was 589. All coronary segments were diagnostic. Despite a high plaque burden, all calcified plaques were assessable with <50% stenosis and hence significant coronary stenosis could be excluded with high certainty. Reprint from Soschynski et al. with permission under open access Creative Commons CC BY 4.0 license [49].
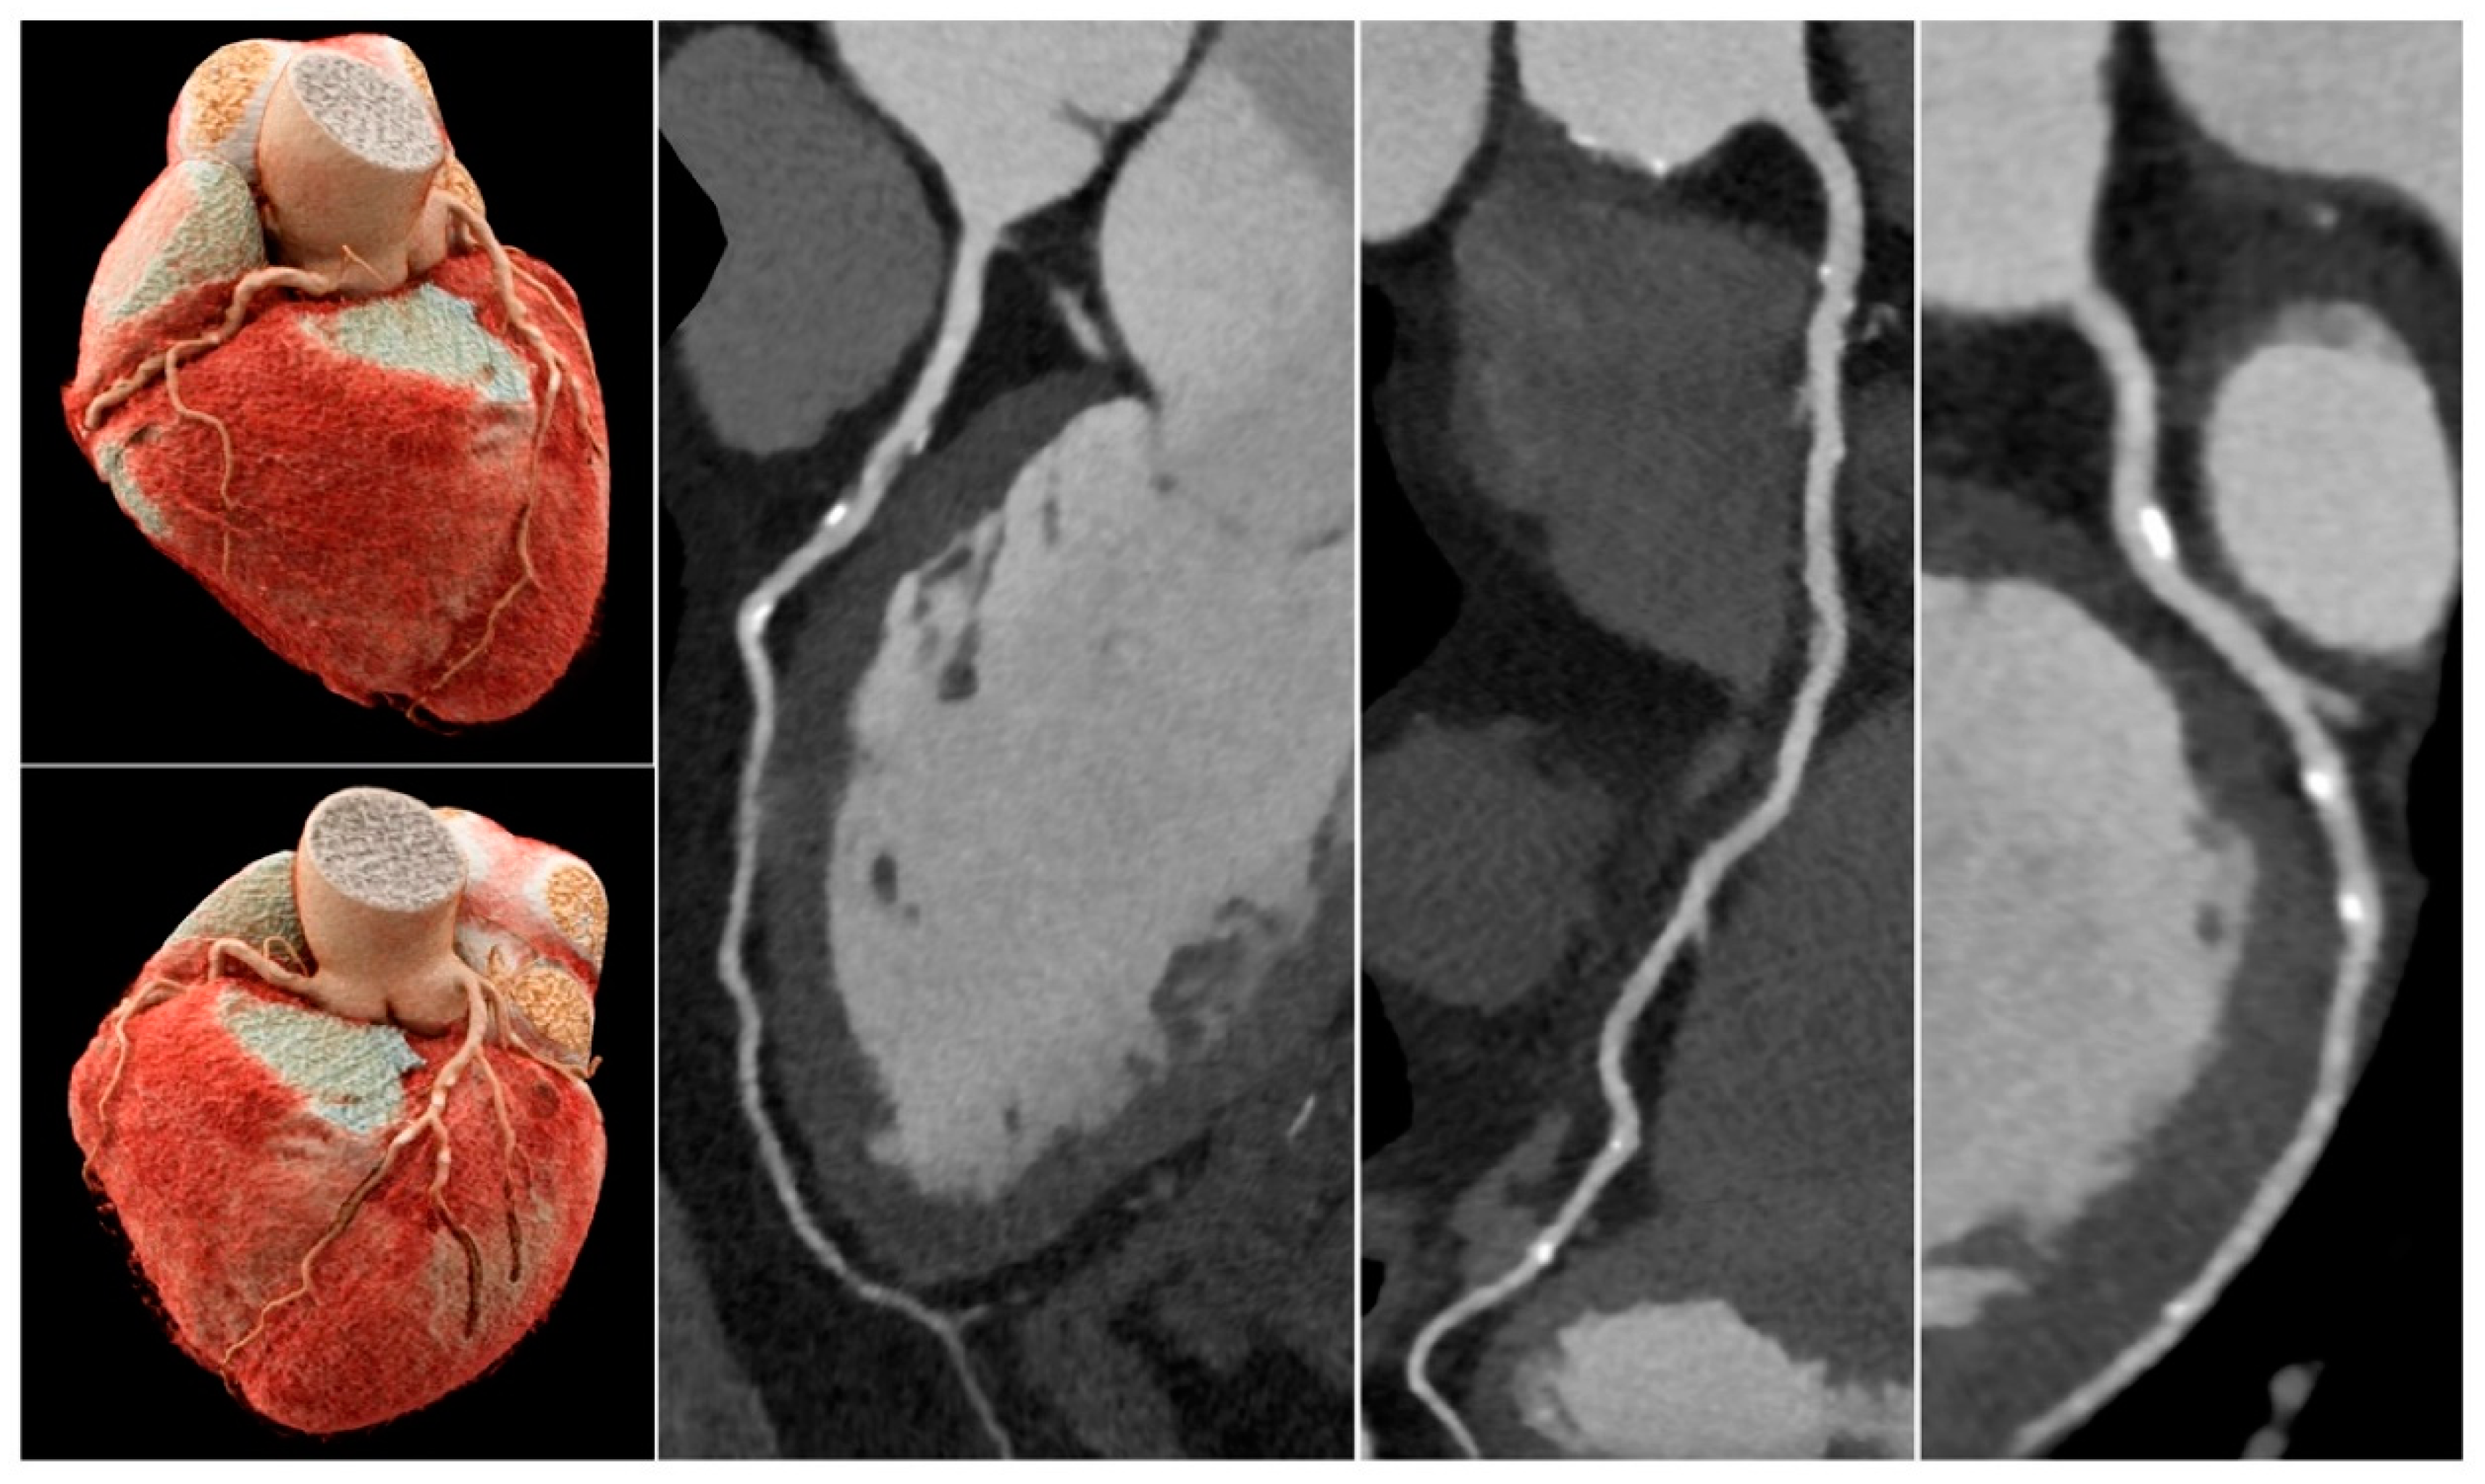

Table 1.
Comparison of micro-computed tomography (micro-CT) and synchrotron radiation CT (SRCT) performance in measuring left coronary stenosis in plaque 1 >90% stenosis [15].
Table 1.
Comparison of micro-computed tomography (micro-CT) and synchrotron radiation CT (SRCT) performance in measuring left coronary stenosis in plaque 1 >90% stenosis [15].
| Model | Degree of Lumen Stenosis (%) | p-value | ||||
|---|---|---|---|---|---|---|
| Micro CT | SRCT | |||||
| 0.009 mm ST |
0.095 mm ST |
0.208 mm ST |
0.302 mm ST |
0.491 mm ST |
||
| 1 | 86.2±0.033 | 99.1±0.004 | 98.8±0.003 | 99.1±0.004 | 100±0.000 | <0.005 |
| 2 | 80.0±0.044 | 97.2±0.025 | 97.8±0.022 | 96.4±0.012 | 96.4±0.010 | <0.0005 |
| 3 | 94.4±0.000 | 99.2±0.005 | 97.2±0.009 | 97.8±0.005 | 100±0.000 | <0.0005 |
CT, computed tomography; ST, slice thickness.
Table 2.
Comparison of micro-computed tomography (micro-CT) and synchrotron radiation CT (SRCT) performance in measuring left coronary stenosis in plaque 2: <50% stenosis (model 1), and 70% stenosis (models 2 and 3) [15].
Table 2.
Comparison of micro-computed tomography (micro-CT) and synchrotron radiation CT (SRCT) performance in measuring left coronary stenosis in plaque 2: <50% stenosis (model 1), and 70% stenosis (models 2 and 3) [15].
| Model | Degree of Lumen Stenosis (%) | p-value | ||||
|---|---|---|---|---|---|---|
| Micro CT | SRCT | |||||
| 0.009 mm ST |
0.095 mm ST |
0.208 mm ST |
0.302 mm ST |
0.491 mm ST |
||
| 1 | 46.4±0.035 | 47.4±0.007 | 47.3±0.001 | 48.6±0.022 | 55.1±0.036 | <0.05 |
| 2 | 60.0±0.031 | 70.0±0.003 | 71.7±0.022 | 77.8±0.011 | 84.8±0.008 | <0.0005 |
| 3 | 75.0±0.000 | 71.5±0.011 | 75.2±0.017 | 74.7±0.021 | 85.1±0.078 | 0.091 |
CT, computed tomography; ST, slice thickness.
Disclaimer/Publisher’s Note: The statements, opinions and data contained in all publications are solely those of the individual author(s) and contributor(s) and not of MDPI and/or the editor(s). MDPI and/or the editor(s) disclaim responsibility for any injury to people or property resulting from any ideas, methods, instructions or products referred to in the content. |
© 2023 by the authors. Licensee MDPI, Basel, Switzerland. This article is an open access article distributed under the terms and conditions of the Creative Commons Attribution (CC BY) license (https://creativecommons.org/licenses/by/4.0/).
Copyright: This open access article is published under a Creative Commons CC BY 4.0 license, which permit the free download, distribution, and reuse, provided that the author and preprint are cited in any reuse.


