Submitted:
29 June 2023
Posted:
03 July 2023
You are already at the latest version
Abstract
Keywords: Red meat; Processed meat; poultry; dairy; mortality
Keywords:
Red meat
; Processed meat
; poultry
; dairy
; mortality
1. Introduction
On an average population level, national statistics of food availability have documented strong correlations in average per capita availability and consumption levels of food types in relation to economic development of different countries [1,2]. Related to these correlations in food consumption patterns, major shifts can also be observed in the average macronutrient composition of diet [1,3]. One of these is a shift towards a higher percent of energy intake in the form of animal protein and fat, combined with reductions in energy intake from vegetable protein as well as from (complex) carbohydrates [1,4]. Furthermore, international comparisons show strong, positive correlations between average per capita availability of animal protein sources and age-standardized incidence rates of chronic diseases such as diabetes, heart disease and stroke, and many forms of cancer (e.g., colon, lung, breast, and prostate) that are predominant in high-income countries [5]. These various observations led to the hypothesis that sub-optimal dietary composition of macronutrients – with high intake of animal protein as one of its key characteristics – may be a contributing cause of chronic disease development and mortality. Paradoxically, however, economic development and sub-optimal dietary composition of macronutrient also show an association with reduced overall (all-cause) or cardiovascular mortality rates and better average life expectancy [6,7,8], but increase in cancer mortality rates [9,10,11,12].
To examine whether the associations seen between animal protein and mortality risks at the ecological level are also observed on the level of single individuals, we [13] and several other research groups [14,15,16,17] have recently published findings from iso-caloric modeling analyses in the context of prospective cohort studies. These studies quite consistently indicated increased risks of all-cause and cardiovascular mortality, but not of cancer-related mortality, in association with higher proportions of dietary energy derived from animal protein [13,14,15,16,17], which seems to contradict observations from international correlation studies [5,6]. Further, potential contradictions also appear when examining mortality risk in association with consumption levels for individual food sources for animal protein: Here, studies have generally reported increased risks of all-cause, cardiovascular, and cancer-related mortality in relation to higher intakes of red and processed meat [18,19,20,21,22], whereas mostly inverse risk relationships have been found for consumption of poultry [20,23,24] or dairy products [25,26], with some degree of heterogeneity across different studies particularly for the association of dairy intake with all-cause, cardiovascular, and cancer mortality [27,28,29]. These heterogeneous findings across main food groups contributing to animal protein intake raise the question whether animal protein itself, as a nutrient, is a genuine cause contributing to higher mortality risk. Furthermore, these findings raise the question whether some of the observed associations of mortality risks with animal protein or its various food sources could have been mostly the result of confounding by other lifestyle-related risk factors, in particular, smoking, obesity, alcohol intake or physical inactivity. To address this question in greater depth, and as a follow-up of our recent modeling of mortality endpoints in association with macro-nutrient intakes [13], we here present further findings from the EPIC-Heidelberg cohort, examining the global association patterns of diverse animal protein-rich foods with overall and cause-specific mortality outcomes, before and after adjustment for other major risk factors (smoking, adiposity, alcohol intake, education level, physical activity), to critically assess potential confounding patterns by the direction and magnitude.
2. Methods
2.1. Study Population: The EPIC-Heidelberg Cohort
EPIC-Heidelberg recruited participants and collected data between 1994 and 1998 as part of the larger European EPIC study [30,31]. The EPIC-Heidelberg cohort included 25,540 study participants aged 35–65 years recruited from the general population living in the southern German city of Heidelberg and its surrounding municipality [32]. Baseline examinations included a detailed medical interview and comprehensive questionnaire assessments of environmental and behavioral factors and habitual diet. Anthropometric measurements were taken by trained personnel and blood samples were obtained from 95% of the participants. All participants provided informed consent.
2.2. Assessment of Habitual Diet
Information about habitual diet was collected using a self-administered food frequency questionnaire (FFQ), which had been extensively validated in prior studies [33,34,35]. Briefly, a total of 158 single foods or mixed dishes were included. For each food item the participant provided information about the consumption of the food in the last year, frequency of consumption (1–6 times) and the time period (day, week, month or year). A semi-quantitative questionnaire was used, requesting information not only about the frequency of consumption but, for a number of food items, also about habitual portion sizes. To increase the accuracy of portion size estimation, photographs of food portions of various sizes were included. A food composition database [36] was used to convert food consumption data into estimated intakes of nutrients and total energy. The estimation of total energy and macro nutrient intake based on the FFQ was also validated [33]. The definition of food groups for this analysis – namely red meat, processed meat, poultry, cheese, and milk – is based on all suitable items from the FFQ. The list of items included within each food group is provided in Supplemental Table 1.
2.3. Prospective Ascertainment of Mortality Endpoints
The mortality outcomes were ascertained first through regular record linkages with municipal registries for vital status, and then for all cases of death, by collecting further information on causes of death (death certificates) from regional health offices. Causes of death, as derived from death certificates, were then coded according to ICD-10 by trained medical study personnel. When the relative risk reported in literature of the association of smoking or alcohol intake with mortality outcome was greater than 2.5, it was regarded as strongly smoking-related mortality or strongly alcohol-related mortality [37,38,39,40]. The detailed ICD-10 codes used to create aggregated cancer outcomes are provided in supplemental table 2. The present analyses are based on complete case ascertainments from June 1994 to May 2019.
2.4. Statistical Analyses
After the exclusion of participants lost to follow-up after baseline ascertainment (n=1,171), those with prevalent cancer or myocardial infraction or diabetes diagnosis (n = 1,159) at recruitment, those in extreme top and bottom 1 percentile of ‘energy intake/energy requirement’ ratio (n = 442) calculated based on age, sex, weight, height, and physical activity level, and missing information on level of education (n=20), 22,748 remained for the analysis. The data for those with unknown information about smoking history (n = 341) were imputed using a fully conditional specification multiple imputation method [41].
Relative mortality hazards (hazard ratios [HR]) and 95% confidence intervals (CI) were estimated using Cox proportional hazard models and cause-specific Cox models, with age as the underlying time scale, to determine the association of lifestyle factors (including smoking status, waist circumference, BMI, level of education, physical activity, and alcohol consumption) and animal protein-rich foods with incident chronic disease and cause-specific mortality. For each disease endpoint of interest, age at exit was defined as age at diagnosis, age at last attendance to follow-up, death or end of follow-up (May 2019), whichever came first. Food group scores were modelled as tertiles with the lowest tertiles serving as reference categories. We computed risk estimates and 95% confidence intervals for a crude model adjusted only for age, sex, and total energy intake (as continuous variable). To test for further potential confounding, model variations were generated that stepwise included additional covariates for smoking status (never, former [quit > 10 years], former [quit ≤ 10 years], current [≤ 15 cig. per day], current [> 15 cig. per day], pipe/cigar/occasional), physical activity level (inactive, moderately inactive, moderately active, active), body mass index (kg/m2), waist circumference (cm), baseline alcohol intake (gram alcohol/ day) and the level of formal education (university degree, secondary school, technical school, and primary school or none). We tested for linear trends of the associations by modelling the tertile categories as integer scores. To assess the magnitude of confounding by lifestyle variables, we calculated the percent change in the relative risk for disease or mortality endpoints – in the models that were stepwise adjusted for lifestyle covariates compared to minimally adjusted model –in relation to food intake. To examine the association between animal protein-rich food groups and the selected lifestyle covariates, we examined the percent change in context of mean difference in intake of each food group – estimated from generalized linear models, particularly MANOVA (multivariate analysis of variance) minimally adjusted for age, sex, and total dietary energy intake – by lifestyle variables. Statistical significance was defined as p < 0.05 or 95% confidence intervals excluding the null, and all analyses were performed using SAS Version 9.4 (SAS Institute, Inc., Cary, NC, USA).
3. Results
3.1. Cohort Characteristics
Among the 22748 participants retained for the present analyses, a total of 3486 cases of deaths were registered until the end of the follow-up (May 2019), of whom 932 (26.7 %) died of cardiovascular events, 1572 (45.0 %) of cancer and the remaining 982 (28.1 %) of other miscellaneous conditions (Table 1). Among cancer deaths, 365 (23.2%) died of strongly smoking-related cancers and 73 (4.6%) died of strongly alcohol-related and smoking-related cancer. The median age of the participants at recruitment was 51.1 (Inter-Quartile Range [IQR] = 43.5 – 57.5) years and 53% were female. Almost 43% of the participants never smoked and 44% of the participants had a BMI <25.
3.2. Association of non-dietary Lifestyle Factors with Mortality
The results in Table 2 showed that smoking – when comparing current heavy smokers to never smokers – increased risk of overall mortality (HR=3.62 [95% CI=3.29-3.98]) as well as cause-specific mortality; the risk was particularly high for strongly smoking-related cancer mortality (HR=20.77 [14.76-29.22]). Next to smoking, alcohol intake was also associated with mortality due to alcohol-related (upper aero-digestive tract) cancers (currently moderately high versus currently low, HR=16.73 [6.05-46.25]), as well as mortality due to the broader category of smoking-related tumors (HR=4.13 [2.67-6.39]). Further to smoking and alcohol intake, measures of excess body weight (waist circumference and BMI) showed strongest associations with cardiovascular mortality (waist circumference, HR=2.29 [1.95-2.69]; BMI, HR=2.44 [2.04-2.91]). Higher level of physical activity and formal education both consistently predicted lower risk of overall and cause-specific mortality.
3.3. Association of Lifestyle Factors with Animal Protein-rich Food-groups
Table 3 provides an overview of intake of animal protein-rich food-groups across lifestyle risk factors, adjusted for age, sex and total energy intake. Up to 64% higher intake of red meat and up to 49% higher intake of processed meat was observed among those in highest adiposity category compared to the lowest. Higher intake of red or processed meat (from 22% up to 66%) was also seen among current heavy smokers, among participants with only primary school or lower education level, or among heavy alcohol drinkers compared to never smokers, participants with university degree, or never alcohol drinkers, respectively. In contrast, intake of cheese or milk was much lower for heavy alcohol drinkers (-30.2 %), and for low formal education (-22.1 % to -24%) and higher adiposity categories (-3.5% to -11.2%) compared to never drinkers, those with a university degree, and lower adiposity categories, respectively. Poultry intake was higher among those in higher adiposity categories (from 22% to 31%) and heavy alcohol drinkers (up to 23%) compared to least obese and never alcohol drinkers, respectively.
3.4. Association of Animal protein-rich Foods with Mortality
In basic risk models adjusting only for age, sex and total energy intake (Table 4, Model 1), higher intake of red or processed meat was associated with an increase in risk of all-cause mortality, overall cancer mortality, strongly alcohol and smoking-related cancer mortality, other cancer-related mortality (except smoking or alcohol-related cancer mortality) and cardiovascular mortality (HR ranging from 1.25 [1.15-1.36] to 1.76 [1.46-2.12]). In contrast, higher intake of poultry, milk, or cheese was associated with lower risk of all-cause mortality, overall cancer mortality, strongly smoking-related cancer mortality, other cancer-related mortality and cardiovascular mortality (HR ranging from 0.55 [0.43-0.72] to 0.88 [0.81-0.95]). After stepwise adjustment for smoking, alcohol consumption, physical activity, BMI, waist circumference and formal education most associations became statistically insignificant (Table 4, Model 2). The only associations that stayed significant after maximal adjustment were the higher risk of cardiovascular mortality in relation to processed meat intake (3rd compared to 1st tertile, HR=1.36 [1.13-1.64]) and the lower risk for total cancer mortality in relation to consumption of cheese (2nd compared to 1st tertile, HR=0.86 [0.76-0.98]) or milk (3rd compared to 1st tertile, HR = 0.83 [0.73-0.93]), although these associations were also substantially attenuated (by 15%) after confounder adjustments, compared to models minimally adjusted for age, sex, and total energy intake (Table 5).
4. Discussion
Prior iso-caloric substitution studies in prospective study cohorts, including the EPIC-Heidelberg cohort, have consistently shown associations between higher intake of animal protein and increased overall and cardiovascular mortality, but not cancer mortality [13,14,16,42]. However, our present findings on the level of food groups do not unequivocally support the hypothesis that animal protein could be a major common risk factor for overall, cardiovascular or cancer-specific mortality. In models minimally adjusted for age, sex and total energy intake contrasting associations were observed for overall and cause-specific mortality risks with intake levels of different food groups contributing to animal protein – red and processed meats, poultry and dairy products. Specifically, red or processed meat increased the risk of overall as well as cardiovascular and cancer-specific mortality, whereas poultry or dairy products reduced the risks. These contrasting findings shed doubt on the idea that animal protein is in itself a major driving cause of increased risk of overall, cardiovascular or cancer-related mortality. Furthermore, and importantly, most of the associations were attenuated to the point of no longer being statistically significant when models were adjusted further for smoking history, adiposity, alcohol consumption and physical activity.
It is worth noting, that the associations of food intake levels with overall and cause-specific mortality found in the EPIC-Heidelberg cohort, contrasting as they were for different main sources of animal protein, are mostly in line with findings from other prospective studies. Although differences in time period, study population, type of dietary assessment tools used, or covariate adjustments may have led to heterogeneity across prospective studies worldwide, meta-analyses showed mostly higher risks of overall, cardiovascular and cancer-related mortality in relation to red meat or processed meat intake and lower risks in relation to consumption levels of poultry, cheese or milk [19,20,21,23,24,25,26,43,44,45], even though findings for dairy products have been more diverse across different studies [27,28,29]. We found that most of the associations disappeared after considering mortality endpoints grouped by their known relationships with smoking, alcohol intake and adiposity, and when careful adjustments were made for the latter risk factors. The only two associations remaining after these adjustments were an increased risk in cardiovascular mortality in relation to processed meat, and lower risk for overall cancer-related morality in association with intake of dairy products, although these remaining associations were attenuated after the adjustments. It is also worth noting that in past meta-analysis of prospective studies, similar to our findings, processed meat intake consistently showed strong association with all-cause mortality, particularly cardiovascular mortality [21,45], while the association with unprocessed red meat was not systematically observed [46].
With regard to overall confounding patterns for specific food groups, we found substantially higher intakes of red meat, processed meat and poultry among current heavy smokers, and among those with higher level of obesity or alcohol intake, which are all major risk factors for cardiovascular disease or cancer. By contrast, intake levels of milk were considerably lower among regular alcohol consumers. Additionally, we also observed that higher consumption levels of red and processed meats, and lower consumption of cheese and milk, were characteristic of individuals with lower levels of formal education. Overall, we speculate that in part the above association patterns could be explained by differences in income as a further characteristic of social stratification; unfortunately, however, we have no data on household income in the EPIC-Heidelberg cohort, and therefore could not analyze this aspect further.
One limitation of this study is that our primary exposure, i.e. intakes of foods rich in animal protein, was assessed at only one point in time, at the baseline recruitment. Therefore, there is a chance for the participants to have changed their dietary habits or lifestyle, which could result in attenuated associations. In terms of strength, this was a large prospective cohort study with detailed information collected about lifestyle habits like smoking, alcohol consumption and BMI, which are strong confounders for the association of food intake with disease and mortality. Thus, we were able to adjust for all important known confounders of the association. That said, we do not exclude the possibility that some residual confounding by these factors remained, due to inaccuracies in their measurements.
In summary, we found no convincing evidence that any of the principal food sources for animal protein are meaningful determinants for overall, cardiovascular or cancer-related mortality risk, independently of smoking, alcohol consumption and excess body weight. Crucially, adjusting for the latter risk factors in the statistical models completely eliminated most associations of food consumption levels with mortality risk, and leaving only two weak associations, of which one suggesting a small increase in cardiovascular mortality (association with processed meat intake), and one suggesting a weak reduction of cancer mortality (association with cheese consumption). Our present findings call into question whether the cumulative intake of animal protein, from various food sources combined, is a plausible risk determinant, in contrast to suggestive findings obtained by iso-caloric substitution modeling [14,15,16,17,42].
Supplementary Materials
The following supporting information can be downloaded at: website of this paper posted on Preprints.org, Table S1: Food items included in each food group; Table S2: Types of cancer categories
Author Contributions
Conceptualization, R.B., R.K. and V.K. methodology, R.B., V.K. and R.K.; software, R.B.; validation, R.B., V.K., and R.K.; formal analysis, R.B.; investigation, V.K.; resources, R.K. and V.K.; data curation R.B.; writing—original draft preparation, R.B., V.K., and R.K.; writing—review and editing, R.B., V.K. and R.K.; visualization, R.K. and R.B.; supervision, V.K. and R.K..; project administration, R.K.; funding acquisition, R.K. All authors have read and agreed to the published version of the manuscript.
Funding
Recruitment and follow-up of the EPIC-Heidelberg were supported by the ‘Europe against Cancer’ program of the European Community (grant No. SOC 95 201408 05F02), the German Cancer Aid (grant No. 70–2488-Ha I), and the German Federal Ministry of Education and Research (BMBF) (Grant number 01ER0809). The funders had no role in the design or conduct of the study; collection, management, analysis, or interpretation of the data; or preparation, review, or approval of the present manuscript.
Institutional Review Board Statement
The study was conducted according to the guidelines of the Declaration of Helsinki, and approved by the Ethics Committee of International Agency for Research on Cancer (IARC) and EPIC-Heidelberg.
Informed Consent Statement
Informed consent was obtained from all participants at baseline (1994-1998).
Data Availability Statement
Access to the data used for the analysis will be made available at request. Please contact the corresponding author.
Acknowledgments
We thank the participants of the EPIC study for providing data and all our colleagues involved in collecting and managing the study. We would also extend our thanks to our secretary staff Heike Weis and Petra Rössler for formatting guidance.
Conflicts of Interest
The authors declare no conflict of interest.
References
- Popkin, B.M. The nutrition transition and its health implications in lower-income countries. Public Heal. Nutr. 1998, 1, 5–21. [Google Scholar] [CrossRef]
- Ritchie, H.; Rosado, P.; Roser, M. Diet compositions. Available online: https://ourworldindata.org/diet-compositions (accessed on 20 April 2023).
- Schmidhuber, J.; Sur, P.; Fay, K.; Huntley, B.; Salama, J.; Lee, A.; Cornaby, L.; Horino, M.; Murray, C.; Afshin, A. The global nutrient database: Availability of macronutrients and micronutrients in 195 countries from 1980 to 2013. Lancet Planet Health 2018, 2, e353–e368. [Google Scholar] [CrossRef]
- Dehghan, M.; Mente, A.; Zhang, X.; Swaminathan, S.; Li, W.; Mohan, V.; Iqbal, R.; Kumar, R.; Wentzel-Viljoen, E.; Rosengren, A.; et al. Associations of fats and carbohydrate intake with cardiovascular disease and mortality in 18 countries from five continents (PURE): a prospective cohort study. Lancet 2017, 390, 2050–2062. [Google Scholar] [CrossRef]
- Penuelas, J.; Krisztin, T.; Obersteiner, M.; Huber, F.; Winner, H.; Janssens, I.A.; Ciais, P.; Sardans, J. Country-level relationships of the human intake of n and p, animal and vegetable food, and alcoholic beverages with cancer and life expectancy. Int J Environ Res Public Health 2020, 17, 7240. [Google Scholar] [CrossRef] [PubMed]
- Grasgruber, P.; Cacek, J.; Hrazdíra, E.; Hřebíčková, S.; Sebera, M. Global correlates of cardiovascular risk: A comparison of 158 countries. Nutrients 2018, 10, 411. [Google Scholar] [CrossRef]
- WHO. Probability of dying between the exact ages 30 and 70 years from cardiovascular diseases, cancer, diabetes, or chronic respiratory diseases (sdg 3.4.1). Available online: https://www.who.int/data/gho/data/indicators/indicator-details/GHO/probability-of-dying-between-exact-ages-30-and-70-from-any-of-cardiovascular-disease-cancer-diabetes-or-chronic-respiratory-(-) (accessed on 20 April 2023).
- Wang, H.; Abajobir, A.A.; Abate, K.H.; Abbafati, C.; Abbas, K.M.; Abd-Allah, F.; Abera, S.F.; Abraha, H.N.; GBD 2016 Mortality Collaborators; Murray, C. J.L. Global, regional, and national under-5 mortality, adult mortality, age-specific mortality, and life expectancy, 1970-2016: A systematic analysis for the global burden of disease study 2016. Lancet 2017, 390, 1084–1150. [Google Scholar] [CrossRef]
- Correa, P. Epidemiological correlations between diet and cancer frequency. Cancer Res. 1981, 41. [Google Scholar]
- Ghadirian, P.; Thouez, J.P.; PetitClerc, C. International comparisons of nutrition and mortality from pancreatic cancer. Cancer Detect Prev 1991, 15, 357–362. [Google Scholar]
- Hebert, J.R.; Rosen, A. Nutritional, socioeconomic, and reproductive factors in relation to female breast cancer mortality: Findings from a cross-national study. Cancer Detect Prev 1996, 20, 234–244. [Google Scholar] [PubMed]
- Hebert, J.R.; Landon, J.; Miller, D.R. Consumption of meat and fruit in relation to oral and esophageal cancer: A cross-national study. Nutr Cancer 1993, 19, 169–179. [Google Scholar] [CrossRef]
- Bajracharya, R.; Katzke, V.; Mukama, T.; Kaaks, R. Effect of Iso-Caloric Substitution of Animal Protein for Other Macro Nutrients on Risk of Overall, Cardiovascular and Cancer Mortality: Prospective Evaluation in EPIC-Heidelberg Cohort and Systematic Review. Nutrients 2023, 15, 794. [Google Scholar] [CrossRef]
- Chen, Z.; Glisic, M.; Song, M.; Aliahmad, H.A.; Zhang, X.; Moumdjian, A.C.; Gonzalez-Jaramillo, V.; Van Der Schaft, N.; Bramer, W.M.; Ikram, M.A.; et al. Dietary protein intake and all-cause and cause-specific mortality: results from the Rotterdam Study and a meta-analysis of prospective cohort studies. Eur. J. Epidemiol. 2020, 35, 411–429. [Google Scholar] [CrossRef] [PubMed]
- Virtanen, H.E.; Voutilainen, S.; Koskinen, T.T.; Mursu, J.; Kokko, P.; Ylilauri, M.P.; Tuomainen, T.-P.; Salonen, J.T.; Virtanen, J.K. Dietary proteins and protein sources and risk of death: the Kuopio Ischaemic Heart Disease Risk Factor Study. Am. J. Clin. Nutr. 2019, 109, 1462–1471. [Google Scholar] [CrossRef]
- Budhathoki, S.; Sawada, N.; Iwasaki, M.; Yamaji, T.; Goto, A.; Kotemori, A.; Ishihara, J.; Takachi, R.; Charvat, H.; Mizoue, T.; et al. Association of Animal and Plant Protein Intake With All-Cause and Cause-Specific Mortality in a Japanese Cohort. JAMA Intern. Med. 2019, 179, 1509–1518. [Google Scholar] [CrossRef] [PubMed]
- Song, M.; Fung, T.T.; Hu, F.B.; Willett, W.C.; Longo, V.D.; Chan, A.T.; Giovannucci, E.L. Association of Animal and Plant Protein Intake With All-Cause and Cause-Specific Mortality. JAMA Intern. Med. 2016, 176, 1453–1463. [Google Scholar] [CrossRef] [PubMed]
- Wang, M.; Ma, H.; Song, Q.; Zhou, T.; Hu, Y.; Heianza, Y.; Manson, J.E.; Qi, L. Red meat consumption and all-cause and cardiovascular mortality: Results from the uk biobank study. Eur J Nutr 2022, 61, 2543–2553. [Google Scholar] [CrossRef]
- Grau, N.; Mohammadifard, N.; Hassannejhad, R.; Haghighatdoost, F.; Sadegh, M.; Talaei, M.; Sajjadi, F.; Mavrommatis, Y.; Sarrafzadegan, N. Red and processed meat consumption and risk of incident cardiovascular disease and mortality: Isfahan cohort study. Int J Food Sci Nutr 2022, 73, 503–512. [Google Scholar] [CrossRef]
- Sinha, R.; Cross, A.J.; Graubard, B.I.; Leitzmann, M.F.; Schatzkin, A. Meat intake and mortality: A prospective study of over half a million people. Arch Intern Med 2009, 169, 562–571. [Google Scholar] [CrossRef]
- Rohrmann, S.; Linseisen, J. Processed meat: The real villain? Proc Nutr Soc 2016, 75, 233–241. [Google Scholar] [CrossRef]
- Wang, X.; Lin, X.; Ouyang, Y.Y.; Liu, J.; Zhao, G.; Pan, A.; Hu, F.B. Red and processed meat consumption and mortality: Dose-response meta-analysis of prospective cohort studies. Public Health Nutr 2016, 19, 893–905. [Google Scholar] [CrossRef]
- Zhuang, P.; Jiao, J.; Wu, F.; Mao, L.; Zhang, Y. Associations of meat consumption and changes with all-cause mortality in hypertensive patients during 11.4-year follow-up: Findings from a population-based nationwide cohort. Clin. Nutr. 2020, 40, 1077–1084. [Google Scholar] [CrossRef]
- Wang, Y.; Jacobs, E.J.; Shah, R.A.; Stevens, V.L.; Gansler, T.; McCullough, M.L. Red and Processed Meat, Poultry, Fish, and Egg Intakes and Cause-Specific and All-Cause Mortality among Men with Nonmetastatic Prostate Cancer in a U.S. Cohort. Cancer Epidemiology Biomarkers Prev. 2020, 29, 1029–1038. [Google Scholar] [CrossRef]
- Dehghan, M.; Mente, A.; Rangarajan, S.; Sheridan, P.; Mohan, V.; Iqbal, R.; Gupta, R.; Lear, S.; Wentzel-Viljoen, E.; Avezum, A.; et al. Prospective Urban Rural Epidemiology (PURE). Association of dairy intake with cardiovascular disease and mortality in 21 countries from five continents (pure): A prospective cohort study. Lancet 2018, 392, 2288–2297. [Google Scholar] [CrossRef]
- Stasinopoulos, L.C.; Zhou, A.; Hyppönen, E. Association of supplemental calcium and dairy milk intake with all-cause and cause-specific mortality in the uk biobank: A prospective cohort study. Br J Nutr 2020, 123, 574–582. [Google Scholar] [CrossRef] [PubMed]
- O'Sullivan, T.A.; Hafekost, K.; Mitrou, F.; Lawrence, D. Food sources of saturated fat and the association with mortality: A meta-analysis. Am J Public Health 2013, 103, e31–e42. [Google Scholar] [CrossRef]
- Soedamah-Muthu, S.S.; Ding, E.L.; Al-Delaimy, W.K.; Hu, F.B.; Engberink, M.F.; Willett, W.C.; Geleijnse, J.M. Milk and dairy consumption and incidence of cardiovascular diseases and all-cause mortality: Dose-response meta-analysis of prospective cohort studies. The American journal of clinical nutrition 2011, 93, 158–171. [Google Scholar] [CrossRef]
- Larsson, S.C.; Crippa, A.; Orsini, N.; Wolk, A.; Michaëlsson, K. Milk consumption and mortality from all causes, cardiovascular disease, and cancer: A systematic review and meta-analysis. Nutrients 2015, 7, 7749–7763. [Google Scholar] [CrossRef]
- Riboli, E.; Hunt, K.; Slimani, N.; Ferrari, P.; Norat, T.; Fahey, M.; Charrondière, U.; Hémon, B.; Casagrande, C.; Vignat, J.; et al. European Prospective Investigation into Cancer and Nutrition (EPIC): study populations and data collection. Public Health Nutr. 2002, 5, 1113–1124. [Google Scholar] [CrossRef] [PubMed]
- Boeing, H.; Korfmann, A.; Bergmann, M.M. Recruitment procedures of epic-germany. European investigation into cancer and nutrition. Ann Nutr Metab 1999, 43, 205–215. [Google Scholar] [CrossRef]
- Boeing, H.; Wahrendorf, J.; Becker, N. EPIC-Germany – A Source for Studies into Diet and Risk of Chronic Diseases. Ann. Nutr. Metab. 1999, 43, 195–204. [Google Scholar] [CrossRef] [PubMed]
- Bohlscheid-Thomas, S.; Hoting, I.; Boeing, H.; Wahrendorf, J. Reproducibility and relative validity of energy and macronutrient intake of a food frequency questionnaire developed for the German part of the EPIC project. European Prospective Investigation into Cancer and Nutrition. Leuk. Res. 1997, 26, 71S–81. [Google Scholar] [CrossRef] [PubMed]
- Kaaks, R.; Slimani, N.; Riboli, E. Pilot phase studies on the accuracy of dietary intake measurements in the EPIC project: overall evaluation of results. European Prospective Investigation into Cancer and Nutrition. Leuk. Res. 1997, 26, 26S–36. [Google Scholar] [CrossRef] [PubMed]
- Bohlscheid-Thomas, S.; Hoting, I.; Boeing, H.; Wahrendorf, J. Reproducibility and relative validity of food group intake in a food frequency questionnaire developed for the German part of the EPIC project. European Prospective Investigation into Cancer and Nutrition. Leuk. Res. 1997, 26, 59S–70. [Google Scholar] [CrossRef] [PubMed]
- Deharveng, G.; Charrondière, U.; Slimani, N.; Southgate, D.; Riboli, E. Comparison of nutrients in the food composition tables available in the nine European countries participating in EPIC. Eur. J. Clin. Nutr. 1999, 53, 60–79. [Google Scholar] [CrossRef]
- Pesch, B.; Kendzia, B.; Gustavsson, P.; Jöckel, K.H.; Johnen, G.; Pohlabeln, H.; Olsson, A.; Ahrens, W.; Gross, I.M.; Brüske, I.; et al. Cigarette smoking and lung cancer--relative risk estimates for the major histological types from a pooled analysis of case-control studies. Int J Cancer 2012, 131, 1210–1219. [Google Scholar] [CrossRef]
- Choi, S.Y.; Kahyo, H. Effect of Cigarette Smoking and Alcohol Consumption in the Aetiology of Cancer of the Oral Cavity, Pharynx and Larynx. Leuk. Res. 1991, 20, 878–885. [Google Scholar] [CrossRef]
- Liu, X.; Peveri, G.; Bosetti, C.; Bagnardi, V.; Specchia, C.; Gallus, S.; Lugo, A. Dose-response relationships between cigarette smoking and kidney cancer: A systematic review and meta-analysis. Crit. Rev. Oncol. 2019, 142, 86–93. [Google Scholar] [CrossRef]
- Islami, F.; Fedirko, V.; Tramacere, I.; Bagnardi, V.; Jenab, M.; Scotti, L.; Rota, M.; Corrao, G.; Garavello, W.; Schüz, J.; et al. Alcohol drinking and esophageal squamous cell carcinoma with focus on light-drinkers and never-smokers: A systematic review and meta-analysis. Int. J. Cancer 2010, 129, 2473–2484. [Google Scholar] [CrossRef]
- Liu, Y.; De, A. Multiple Imputation by Fully Conditional Specification for Dealing with Missing Data in a Large Epidemiologic Study. Int. J. Stat. Med Res. 2015, 4, 287–295. [Google Scholar] [CrossRef]
- Huang, J.; Liao, L.M.; Weinstein, S.J.; Sinha, R.; Graubard, B.I.; Albanes, D. Association Between Plant and Animal Protein Intake and Overall and Cause-Specific Mortality. JAMA Intern. Med. 2020, 180, 1173. [Google Scholar] [CrossRef]
- Brandt, P.A.v.d. Red meat, processed meat, and other dietary protein sources and risk of overall and cause-specific mortality in the netherlands cohort study. European journal of epidemiology 2019, 34, 351–369. [Google Scholar] [CrossRef] [PubMed]
- Lu, Y.; Sugawara, Y.; Matsuyama, S.; Fukao, A.; Tsuji, I. Association of dairy intake with all-cause, cancer, and cardiovascular disease mortality in japanese adults: A 25-year population-based cohort. Eur J Nutr 2022, 61, 1285–1297. [Google Scholar] [CrossRef] [PubMed]
- Battaglia Richi, E.; Baumer, B.; Conrad, B.; Darioli, R.; Schmid, A.; Keller, U. Health risks associated with meat consumption: A review of epidemiological studies. Int J Vitam Nutr Res 2015, 85, 70–78. [Google Scholar] [CrossRef] [PubMed]
- Larsson, S.C.; Orsini, N. Red meat and processed meat consumption and all-cause mortality: A meta-analysis. Am J Epidemiol 2014, 179, 282–289. [Google Scholar] [CrossRef]

Table 1.
Baseline characteristics of sampled EPIC-Heidelberg participants (n=22,748).
| Characteristics | Total N (%) |
Men N (%) |
Women N (%) |
|---|---|---|---|
| n | 22,748 | 10,600 (46.6) | 12,148 (53.4) |
| Age at recruitment (years, inter-quartile range) | 51.1 (43.5-57.5) | 52.8 (46.4-58.1) | 48.7 (41.7-56.7) |
| Smoking intensity | |||
| Never | 9,722 (42.7) | 3,545 (33.4) | 6,177 (50.8) |
| Former (quit > 10 years) | 5,208 (22.8) | 3,005 (28.3) | 2,203 (18.1) |
| Former (quit ≤ 10 years) | 2,509 (11.0) | 1,329 (12.5) | 1,180 (9.7) |
| Current (≤ 15 cig. Per day) | 2,550 (11.2) | 921 (8.6) | 1,629 (13.4) |
| Current (> 15 cig. Per day) | 2,339 (10.2) | 1,402 (13.2) | 937 (7.7) |
| Pipe/cigar/occasional | 420 (1.8) | 398 (3.7) | 22 (0.1) |
| Waist circumference level * | |||
| Low waist circumference | 11,016 (48.4) | 4,673 (44.0) | 6,343 (52.2) |
| Moderate waist circumference | 5,922 (26.0) | 3,204 (30.2) | 2,718 (22.3) |
| High waist circumference | 5,810 (25.5) | 2,723 (25.6) | 3,087 (25.4) |
| Body mass index | |||
| <25 | 10,040 (44.1) | 3,297 (31.1) | 6,743 (55.5) |
| ≥25-<30 | 9,120 (40.0) | 5,491 (51.8) | 3,629 (29.8) |
| ≥30 | 3,588 (15.7) | 1,812 (17.0) | 1,776 (14.6) |
| Level of formal education | |||
| University degree | 6,962 (30.6) | 3,952 (37.2) | 3,010 (24.7) |
| Secondary school | 1,639 (7.2) | 594 (5.6) | 1,045 (8.6) |
| Technical school | 7,709 (33.8) | 2,826 (26.6) | 4,883 (40.2) |
| Primary school or none | 6,438 (28.3) | 3,228 (30.4) | 3,210 (26.4) |
| Physical activity level | |||
| Inactive | 2,590 (11.3) | 1,129 (10.6) | 1,461 (12.0) |
| Moderately inactive | 7,951 (34.9) | 3,575 (33.7) | 4,376 (36.0) |
| Moderately active | 6,563 (28.8) | 3,076 (29.0) | 3,487 (28.7) |
| Active | 5,644 (24.8) | 2,820 (26.6) | 2,824 (23.2) |
| Alcohol consumption | |||
| Never | 342 (1.5) | 74 (0.7) | 268 (2.2) |
| Former | 851 (3.7) | 436 (4.1) | 415 (3.4) |
| >0-6 (M)/>0-3 (W) | 5,384 (23.6) | 1,282 (12.0) | 4,102 (33.7) |
| >6-12 (M)/>3-12 (W) | 6,769 (29.7) | 1,614 (15.2) | 5,155 (42.4) |
| >12-24 | 4,680 (20.5) | 3,042 (28.7) | 1,638 (13.4) |
| >24 | 4,722 (20.7) | 4,152 (39.1) | 570 (4.6) |
| Total energy intake (kcal), mean, SD | 1971.3 (632.0) | 2223.5 (666.1) | 1751.3 (506.9) |
| Red meat (g/d), mean, SD | 31.7 (29.7) | 41.6 (35.0) | 23.0 (20.6) |
| Processed meat (g/d), mean, SD | 51.8 (40.6) | 64.4 (45.8) | 40.9 (31.6) |
| Poultry (g/d), mean, SD | 12.5 (14.1) | 13.9 (15.4) | 11.3 (12.7) |
| Cheese (g/d), mean, SD | 29.8 (21.6) | 29.4 (22.6) | 30.1 (20.6) |
| Milk (g/d), mean, SD | 82.4 (138.8) | 81.9 (154.1) | 82.9 (124.0) |
| Overall death | 3486 (15.3) | 2259 (21.3) | 1227 (10.1) |
| Cardiovascular death | 932 (4.1) | 649 (6.1) | 283 (2.3) |
| Cancer death | 1572 (6.9) | 972 (9.1) | 600 (4.9) |
| Strongly smoking-related cancer deaths | 365 (1.6) | 263 (2.4) | 102 (0.8) |
| Strongly alcohol-related cancer deaths | 73 (0.3) | 58 (0.5) | 15 (0.1) |
| Other deaths | 982 (4.3) | 638 (6.0) | 344 (2.8) |
*Low waist circumference = <80 cm in women and <94 cm in men; moderate waist circumference = 80 cm - <88 cm in women and 94 cm-<102 cm in men; high waist circumference = ≥88 cm in women and ≥102 cm in men.
Table 2.
HRs (95% CI) for the relationships of co-variables with risks of mortalities (n= 22,748).
| Overall mortality nCASES=3,486 |
Cardiovascular mortality nCASES=932 |
Cancer mortality | Other mortality nCASES=982 |
|||||
| Overall cancer mortality nCASES=1,572 |
Strongly smoking-related cancer deaths nCASES=365 |
Strongly smoking and alcohol-related cancer deaths nCASES=73 |
Other cancer-related mortality a ncases=1,207 |
|||||
|
Smoking intensity |
Never | Ref | Ref | Ref | Ref | Ref | Ref | Ref |
| Model 1 | Former (quit > 10 years) | 1.07(0.98-1.17) | 1.03(0.86-1.23) | 1.11(0.97-1.28) | 1.97(1.32-2.93) * | 1.68(0.79-3.56) | 1.04(0.89-1.21) | 1.01(0.85-1.21) |
| Former (quit ≤ 10 years) | 1.46(1.30-1.64) * | 1.41(1.11-1.78) * | 1.42(1.19-1.70) * | 3.75(2.41-5.82) * | 2.41(0.99-5.87) | 1.21(0.99-1.49) | 1.39(1.10-1.75) * | |
| Current (≤ 15 cig. Per day) | 2.07(1.85-2.30) * | 2.12(1.70-2.64) * | 1.86(1.57-2.21) * | 6.46(4.32-9.65) * | 2.35(0.89-6.23) | 1.47(1.21-1.79) * | 2.18(1.77-2.69) * | |
| Current (> 15 cig. Per day) | 3.62(3.29-3.98) * | 3.65(3.02-4.42) * | 3.52(3.04-4.07) * | 20.77(14.76-29.22) * | 10.41(5.26-20.59) * | 1.97(1.63-2.37) * | 3.76(3.12-4.53) * | |
| Waist circumference level b | <80/<94 | Ref | Ref | Ref | Ref | Ref | Ref | Ref |
| Model 1 | 80-<88/94<102 | 1.16(1.07-1.26) * | 1.42(1.19-1.70) * | 1.11(0.98-1.26) | 0.87(0.67-1.12) * | 0.57(0.31-1.08) | 1.23(1.06-1.42) * | 1.01(0.85-1.20) |
| ≥88/≥102 | 1.73(1.61-1.87) * | 2.29(1.95-2.69) * | 1.42(1.26-1.60) * | 1.13(0.88-1.44) | 1.08(0.63-1.85) | 1.55(1.35-1.78) * | 1.82(1.57-2.11) * | |
| Body mass index level | <25 | Ref | Ref | Ref | Ref | Ref | Ref | Ref |
| Model 1 | ≥25-<30 | 1.13(1.05-1.23) * | 1.34(1.14-1.59) * | 1.12(0.99-1.25) | 0.82(0.65-1.03) | 0.63(0.38-1.06) | 1.27(1.11-1.46) * | 1.02(0.87-1.19) |
| ≥30 | 1.76(1.62-1.93) * | 2.44(2.04-2.91) * | 1.45(1.26-1.67) * | 0.80(0.59-1.10) | 0.78(0.40-1.54) | 1.75(1.49-2.05) * | 1.75(1.48-2.07) * | |
| Level of formal education | University degree | Ref | Ref | Ref | Ref | Ref | Ref | Ref |
| Model 1 | Secondary school | 1.48(1.26-1.73) * | 1.55(1.11-2.17) * | 1.41(1.11-1.78) * | 1.42(0.79-2.56) | 1.91(0.62-5.89) | 1.38(1.07-1.79) * | 1.48(1.08-2.02) * |
| Technical school | 1.41(1.29-1.55) * | 1.43(1.18-1.74) * | 1.36(1.18-1.56) * | 2.26(1.66-3.09) * | 2.03(1.02-4.07) * | 1.21(1.04-1.41) * | 1.51(1.26-1.80) * | |
| Primary school or none | 1.81(1.66-1.97) * | 2.18(1.83-2.61) * | 1.60(1.40-1.83) * | 3.03(2.25-4.09) * | 3.15(1.65-6.01) * | 1.39(1.20-1.62) * | 1.76(1.48-2.09) * | |
| Model 2 | Secondary school | 1.32(1.13-1.54) * | 1.37(0.98-1.92) | 1.27(1.01-1.61) * | 1.10(0.61-1.98) | 1.59(0.51-4.92) | 1.29(1.00-1.67) * | 1.32(0.97-1.81) |
| Technical school | 1.22(1.12-1.34) * | 1.19(0.98-1.45) | 1.21(1.05-1.39) * | 1.85(1.35-2.53) * | 1.88(0.93-3.78) | 1.10(0.94-1.29) | 1.30(1.08-1.55) * | |
| Primary school or none | 1.50(1.37-1.64) * | 1.72(1.43-2.06) * | 1.39(1.21-1.59) * | 2.46(1.81-3.35) * | 2.92(1.50-5.69) * | 1.22(1.05-1.43) * | 1.44(1.21-1.72) * | |
| Physical activity level | Inactive | Ref | Ref | Ref | Ref | Ref | Ref | Ref |
| Model 1 | Moderately inactive | 0.68(0.62-0.74) * | 0.75(0.62-0.90) * | 0.78(0.67-0.92) * | 0.66(0.48-0.90) * | 0.70(0.33-1.49) | 0.82(0.69-0.98) * | 0.53(0.44-0.63) * |
| Moderately active | 0.65(0.58-0.71) * | 0.62(0.51-0.76) * | 0.82(0.70-0.96) * | 0.71(0.51-0.98) * | 0.85(0.40-1.82) | 0.86(0.72-1.03) | 0.50(0.41-0.60) * | |
| Active | 0.68(0.61-0.75) * | 0.65(0.52-0.79) * | 0.77(0.65-0.91) * | 0.65(0.46-0.91) * | 0.84(0.39-1.83) | 0.82(0.68-0.99) * | 0.61 (0.51-0.74) * | |
| Alcohol consumption c | Currently low | Ref | Ref | Ref | Ref | Ref | Ref | Ref |
| Model 1 | Currently moderately low | 1.46(1.14-1.87) * | 1.49(0.90-2.45) | 1.01(0.64-1.59) | 1.01(0.31-3.26) | - | 1.09(0.67-1.79) | 1.83(1.18-2.86) * |
| Currently moderately high | 2.29(1.99-2.64) * | 2.00(1.49-2.69) * | 2.02(1.61-2.54) * | 4.13(2.67-6.39) * | 16.73(6.05-46.25) * | 1.64(1.25-2.16) * | 2.89(2.24-3.74) * | |
| Currently high | 0.86(0.77-0.95) * | 0.80(0.65-0.99) * | 0.90(0.77-1.05) | 1.04(0.72-1.50) | 1.67(0.58-4.83) | 0.86(0.72-1.02) | 0.85(0.69-1.04) | |
| Former | 0.90(0.81-1.01) | 0.87(0.69-1.08) | 0.96(0.81-1.14) | 0.98(0.66-1.45) | 1.53(0.51-4.52) | 0.96(0.80-1.16) | 0.89(0.72-1.11) | |
| Never | 1.40(1.26-1.56) * | 1.39(1.13-1.72) * | 1.42(1.21-1.67) * | 2.16(1.51-3.07) * | 3.61(1.34-9.76) * | 1.24(1.03-1.50) * | 1.42(1.16-1.74) * | |
Note: *p value < 0.05; Model 1 was adjusted for age at recruitment (in continuous years) and sex; Model 2 was, in addition to model 1, adjusted for smoking status, waist circumference, body mass index, physical activity, and alcohol intake; a Other cancer-related mortality refer to all cancer-related deaths except smoking or alcohol-related cancer mortality; b Low waist circumference = <80 cm in women and <94 cm in men; moderate waist circumference = 80 cm - <88 cm in women and 94 cm-<102 cm in men; high waist circumference = ≥88 cm in women and ≥102 cm in men. c Alcohol consumption in g alcohol/ day (currently low= >0-3 in women and >0-6 in men; currently moderately low= >3-12 in women and >6-12 in men; currently moderately high= >12-24; currently high= >24).
Table 3.
Change of mean energy-adjusted intakes of foods by categories of co-variablesa..
| Red meat | Processed meat | Poultry | Cheese | Milk | |||||||
|---|---|---|---|---|---|---|---|---|---|---|---|
|
Smoking status |
Never | 29.4 | 48.6 | 12.3 | 29.6 | 80.8 | |||||
| Former (quit > 10 years) | +2.4 | +8.1% | +3.3 | +6.8% | +0.2 | +1.6% | +1.1 | +3.7% | -3.4 | -4.2% | |
| Former (quit ≤ 10 years) | +2.3 | +7.8% | +5.1 | +10.5% | +1 | +8.1% | +1.3 | +4.3% | +1.9 | +2.3% | |
| Current (≤ 15 cig. Per day) | +0.7 | +2.3% | +3.2 | +6.6% | -0.2 | -1.6 | +0.6 | +2.0% | +4.9 | +6.0% | |
| Current (> 15 cig. Per day) | +13 | +44.2% | +14.7 | +30.3% | +0.7 | +5.6% | -3.1 | -10.4% | +15.6 | +19.3% | |
| Waist circumference b | <80/<94 | 27.2 | 45.6 | 11.5 | 31 | 86.2 | |||||
| 80-<88/94-<102 | +6.6 | +24.4% | +9.1 | +19.9% | +1.3 | +11.3% | -2.3 | -7.4% | -9.7 | -11.2% | |
| ≥88/≥102 | +11.7 | +43.3% | +15.3 | +33.5% | +2.6 | +22.6% | -2.4 | -7.7% | -5.0 | -5.8% | |
| Body mass index | <25 | 25.3 | 43.2 | 11.1 | 31.6 | 85.4 | |||||
| 25-<30 | +9.9 | +39.2% | +12.9 | +29.7% | +2.1 | +18.9% | -3.2 | -10.1% | -6.3 | -7.3% | |
| ≥30 | +16.2 | +64.2% | +21.5 | +49.6% | +3.5 | +31.5% | -3.4 | -10.7% | -3.0 | -3.5% | |
| Educational level | University degree | 29.9 | 46.8 | 12.4 | 34 | 94.6 | |||||
| Secondary school | -2.7 | -9.0% | -0.5 | -1.0% | +0.5 | +4.0% | -0.5 | -1.4% | +2.5 | +2.6% | |
| Technical school | +0.3 | +1.0% | +4.3 | +9.1% | 0 | 0% | -5.8 | -17.0% | -17.6 | -18.6% | |
| Primary school or no formal education | +6.7 | +22.7% | +12.9 | +27.5% | +0.6 | +4.8% | -8.2 | -24.0% | -21.6 | -22.1% | |
| Physical activity | Active | 30.4 | 51.8 | 12.2 | 30.4 | 91.6 | |||||
| Moderately active | +1 | +3.2% | -0.4 | -0.7% | +0.4 | +3.2% | -0.2 | -0.6% | -12.6 | -13.7% | |
| Moderately inactive | +1.7 | +5.5% | +0.4 | +0.7% | +0.4 | +3.2% | -0.9 | -2.9% | -13 | -14.1% | |
| inactive | +3.6 | +11.8% | +0.2 | +0.3% | +0.4 | +3.2% | -1.9 | -6.2% | -8.9 | -9.7% | |
| Alcohol intakec | Never | 26.6 | 44.6 | 11.1 | 26.8 | 107.2 | |||||
| Former | +4.8 | +17.9% | +9.5 | +20.8% | +1.3 | +11.2% | +2.2 | +8.2% | -6.2 | -5.9% | |
| >0-6 (M)/>0-3 (W) | -1.2 | -4.4% | -1.7 | -3.7% | -0.3 | -2.5% | +2.0 | +7.4% | -15.6 | -14.8% | |
| >6-12 (M)/>3-12 (W) | -0.4 | -1.4% | -0.8 | -1.7% | +0.3 | +2.5% | +3.6 | +13.4% | -22.1 | -21.0% | |
| >12-24 | +7.6 | +28.4% | +9.8 | +21.5% | +1.2 | +10.3% | +3.5 | +13.0% | -25.9 | -24.7% | |
| >24 | +17.7 | +66.2% | +22.3 | +49.0% | +2.7 | +23.2% | +3.0 | +11.1% | -31.7 | -30.2% | |
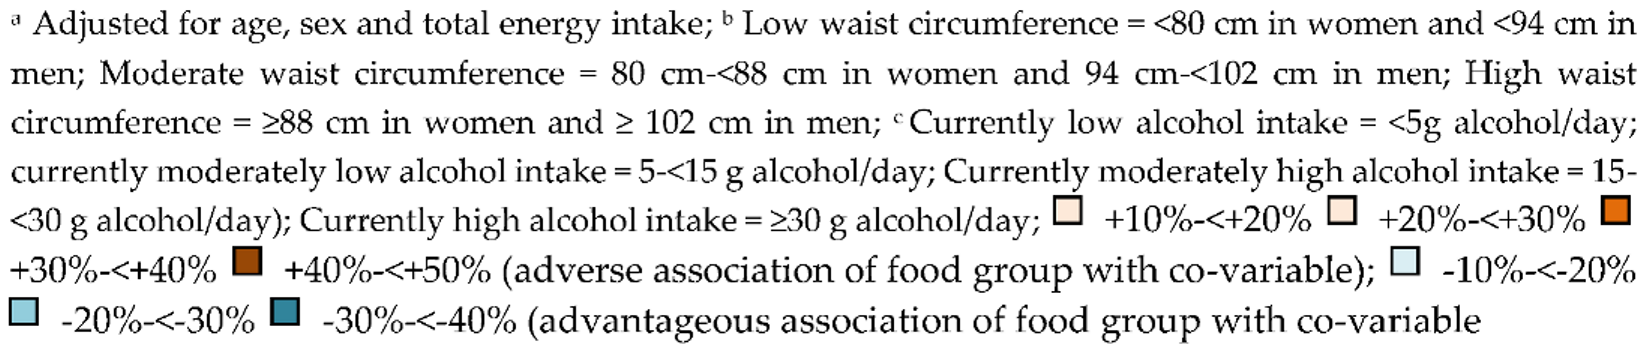
Table 4.
HRs (95% CI) as well as p trend values for associations between food groups and mortalities (n=22,748).
Table 4.
HRs (95% CI) as well as p trend values for associations between food groups and mortalities (n=22,748).
| Overall mortality nCASES=3768 |
Cardiovascular mortality nCASES=932 |
Cancer mortality | Other mortality nCASES=982 |
|||||
| Overall cancer mortality nCASES=1572 |
Strongly smoking-related cancer deaths nCASES=365 |
Strongly smoking and alcohol-related cancer deaths nCASES=73 |
Other cancer-related mortality a ncases=1,207 |
|||||
| Red meat | ||||||||
| Model 1 b | 1st tertile | Ref | Ref | Ref | Ref | Ref | Ref | Ref |
| 2nd tertile | 1.02(0.94-1.11) | 1.18(0.98-1.41) | 1.00(0.88-1.14) | 0.94(0.71-1.26) | 0.86(0.45-1.66) | 1.03(0.88-1.19) | 0.92(0.78-1.09) | |
| 3rd tertile | 1.25(1.15-1.36) * | 1.40(1.17-1.67) * | 1.20(1.05-1.37) | 1.20(0.91-1.58) | 1.04(0.56-1.93) | 1.21(1.04-1.40) * | 1.20(1.01-1.41) * | |
| P trend | <.001 | <.001 | 0.004 | 0.13 | 0.80 | 0.01 | 0.01 | |
| Model 2 c | 2nd tertile | 0.92(0.85-1.01) | 1.02(0.85-1.22) | 0.93(0.82-1.07) | 0.86(0.64-1.15) | 0.82(0.42-1.59) | 0.96(0.82-1.11) | 0.86(0.72-1.02) |
| 3rd tertile | 1.00(0.92-1.09) | 1.04(0.86-1.24) | 1.00(0.88-1.15) | 0.90(0.68-1.20) | 0.88(0.46-1.66) | 1.03(0.88-1.21) | 0.98(0.83-1.17) | |
| P trend | 0.72 | 0.66 | 0.81 | 0.58 | 0.75 | 0.59 | 0.90 | |
| Processed meat | ||||||||
| Model 1 | 1st tertile | Ref | Ref | Ref | Ref | Ref | Ref | Ref |
| 2nd tertile | 1.09(1.00-1.19) * | 1.31(1.09-1.57) * | 1.12(0.98-1.27) | 1.23(0.92-1.63) | 1.41(0.67-2.96) | 1.09(0.94-1.26) | 0.99(0.84-1.16) | |
| 3rd tertile | 1.27(1.17-1.39) * | 1.76(1.46-2.12) * | 1.20(1.05-1.38) * | 1.29(0.96-1.73) | 2.14(1.05-4.37) * | 1.20(1.03-1.40) * | 1.11(0.94-1.32) | |
| P trend | <.001 | <.001 | 0.007 | 0.09 | 0.025 | 0.01 | 0.19 | |
| Model 2 | 2nd tertile | 0.98(0.90-1.07) | 1.13(0.94-1.36) | 1.04(0.91-1.19) | 1.09(0.81-1.45) | 1.30(0.61-2.77) | 1.02(0.88-1.18) | 0.89(0.75-1.05) |
| 3rd tertile | 1.06(0.97-1.16) | 1.36(1.13-1.64) * | 1.06(0.92-1.22) | 1.09(0.81-1.48) | 1.04(0.98-4.26) | 1.06(0.90-1.24) | 0.92(0.77-1.09) | |
| P trend | 0.16 | <.001 | 0.41 | 0.57 | 0.037 | 0.46 | 0.39 | |
| Poultry | ||||||||
| Model 1 | 1st tertile | Ref | Ref | Ref | Ref | Ref | Ref | Ref |
| 2nd tertile | 0.97(0.90-1.05) | 1.01(0.86-1.18) | 0.97(0.86-1.09) | 0.71(0.55-0.92) * | 1.03(0.60-1.77) | 1.07(0.93-1.22) | 0.93(0.80-1.08) | |
| 3rd tertile | 0.93(0.86-1.00) | 0.89(0.76-1.05) | 0.93(0.83-1.06) | 0.84(0.66-1.08) | 0.63(0.34-1.15) | 0.97(0.84-1.12) | 0.88(0.75-1.03) | |
| P trend | 0.07 | 0.20 | 0.31 | 0.18 | 0.13 | 0.73 | 0.11 | |
| Model 2 | 2nd tertile | 0.99(0.91-1.07) | 1.02(0.87-1.19) | 0.99(0.87-1.11) | 0.80(0.62-1.04) | 1.15(0.66-1.98) | 1.07(0.93-1.22) | 0.95(0.81-1.10) |
| 3rd tertile | 0.92(0.85-1.00) | 0.87(0.74-1.02) | 0.95(0.84-1.07) | 0.98(0.76-1.26) | 0.75(0.41-1.37) | 0.95(0.82-1.09) | 0.88(0.75-1.03) | |
| P trend | 0.06 | 0.09 | 0.43 | 0.88 | 0.36 | 0.48 | 0.11 | |
| Cheese | ||||||||
| Model 1 | 1st tertile | Ref | Ref | Ref | Ref | Ref | Ref | Ref |
| 2nd tertile | 0.85(0.79-0.92) * | 0.80(0.68-0.93) * | 0.79(0.70-0.89) * | 0.64(0.50-0.82) * | 0.73(0.41-1.29) | 0.85(0.74-0.98) * | 1.06(0.91-1.23) | |
| 3rd tertile | 0.80(0.74-0.87) * | 0.80(0.68-0.94) * | 0.79(0.70-0.89) * | 0.55(0.43-0.72) * | 0.69(0.40-1.22) | 0.87(0.76-1.00) | 0.81(0.69-0.96) * | |
| P trend | <.001 | .005 | <.001 | <.001 | 0.20 | 0.05 | 0.01 | |
| Model 2 | 2nd tertile | 0.94(0.87-1.02) | 0.90(0.76-1.05) | 0.86(0.76-0.98) * | 0.80(0.62-1.03) | 0.90(0.50-1.59) | 0.91(0.79-1.04) | 1.16(1.00-1.35) |
| 3rd tertile | 0.94(0.87-1.02) | 0.96(0.82-1.13) | 0.91(0.80-1.03) | 0.78(0.60-1.02) | 0.98(0.55-1.74) | 0.95(0.83-1.10) | 0.96(0.82-1.14) | |
| P trend | 0.14 | 0.61 | 0.13 | 0.06 | 0.93 | 0.51 | 0.79 | |
| Milk | ||||||||
| Model 1 | 1st tertile | Ref | Ref | Ref | Ref | Ref | Ref | Ref |
| 2nd tertile | 0.87(0.81-0.94) * | 0.84(0.71-0.98) * | 0.89(0.79-1.00) | 0.82(0.63-1.05) | 0.86(0.50-1.46) | 0.90(0.78-1.03) | 0.88(0.75-1.02) | |
| 3rd tertile | 0.88(0.81-0.95) * | 0.91(0.78-1.07) | 0.83(0.73-0.93) * | 0.81(0.63-1.04) | 0.57(0.32-1.03) | 0.82(0.71-0.94) | 0.86(0.74-1.00) | |
| P trend | 0.001 | 0.23 | 0.002 | 0.09 | 0.068 | 0.006 | 0.06 | |
| Model 2 | 2nd tertile | 0.92(0.85-0.99) | 0.87(0.75-1.03) | 0.94(0.83-1.06) | 0.91(0.71-1.17) | 0.94(0.55-1.62) | 0.93(0.81-1.06) | 0.93(0.80-1.08) |
| 3rd tertile | 0.95(0.88-1.03) | 0.99(0.85-1.16) | 0.89(0.79-1.01) | 0.93(0.72-1.19) | 0.67(0.37-1.21) | 0.87(0.75-1.00) | 0.93(0.80-1.09) | |
| P trend | 0.23 | 0.86 | 0.08 | 0.55 | 0.19 | 0.05 | 0.40 | |
Note: The exposure variables were divided into cohort-wide tertiles, with the first tertile serving as the reference category. *p value < 0.05; P trend < 0.05; a Other cancer-related mortality refer to all cancer-related deaths except smoking or alcohol-related cancer mortality; b Model 1 adjusted for age, sex, and total energy intake; c Model 2 stratified by age, sex, total energy intake, smoking, physical activity, alcohol intake, BMI, waist circumference, and formal education.
Table 5.
Magnitude of confounding.
| Overall mortality nCASES=3768 |
Cardiovascular mortality nCASES=932 |
Cancer mortality | Other mortality nCASES=982 |
|||||
| Cancer mortality nCASES=1,572 |
Strongly smoking-related cancer deaths nCASES=365 |
Strongly smoking and alcohol-related cancer deaths nCASES=73 |
Other cancer-related mortality a ncases=1,207 |
|||||
| Red meat | BMI and waist circumference | 10.4 % | 16.4 % | 5.8 % | 5.8 % | 15.3 % | 9.0 % | 11.6 % |
| Smoking | 8 % | 8.5 % | 8.3 % | 22.5 % | 18.2 % | 4.1 % | 8.3 % | |
| Smoking, BMI, waist circumference, and education | 19.2 % | 25.7 % | 15.8 % | 24.1 % | 15.3 % | 14.0 % | 20 % | |
| Fully adjusted | 20 % | 25.7 % | 16.6 % | 25 % | 15.3 % | 14.8 % | 18.3 % | |
| Processed meat | BMI and waist circumference | 10.2 % | 15.9 % | 5.8 % | 6.2 % | 14.0 % | 9.1 % | 11.7 % |
| Smoking | 3.9 % | 3.9 % | 4.1 % | 12.4 % | 9.3 % | 1.6 % | 4.5 % | |
| Smoking, BMI, waist circumference, and education | 17.3 % | 22.7 % | 12.5 % | 18.6 % | 10.7 % | 12.5 % | 18.9 % | |
| Fully adjusted | 16.5 % | 22.7 % | 11.6 % | 15.5 % | 51.4 % | 11.6 % | 17.1 % | |
| Poultry | BMI and waist circumference | 5.3% | 6.7 % | 2.1 % | 3.5 % | 6.3 % | 4.1 % | 4.5 % |
| Smoking | 3.2% | 4.4 % | 4.3 % | 10.7 % | 9.5 % | 2.0 % | 3.4 % | |
| Smoking, BMI, waist circumference, and education | 2.1 % | 3.3 % | 1.0 % | 15.4 % | 15.8 % | 3.0 % | 1.1 % | |
| Fully adjusted | 1.0 % | 2.2 % | 2.1 % | 16.6 % | 19.0 % | 2.0 % | 0 % | |
| Cheese | BMI and waist circumference | 2.5 % | 3.7 % | 1.2 % | 1.81 % | 4.3 % | 2.2 % | 3.7 % |
| Smoking | 7.5 % | 8.7 % | 7.5 % | 25.4 % | 20.2 % | 3.4 % | 8.6 % | |
| Smoking, BMI, waist circumference, and education | 16.2 % | 20 % | 13.9 % | 40 % | 36.2 % | 8.0 % | 17.2 % | |
| Fully adjusted | 17.5 % | 20 % | 15.1 % | 78.1 % | 42.0 % | 9.1 % | 18.5 % | |
| Milk | BMI and waist circumference | 2.2 % | 3.2 % | 1.2 % | 1.23 % | 1.7 % | 1.2 % | 2.3 % |
| Smoking | 1.1 % | 2.1 % | 1.2 % | 4.9 % | 5.2 % | 1.2 % | 2.3 % | |
| Smoking, BMI, waist circumference, and education | 5.6 % | 7.6 % | 4.8 % | 9.8 % | 10.5 % | 3.6 % | 5.8 % | |
| Fully adjusted | 7.9 % | 8.7 % | 7.2 % | 14.8 % | 17.5 % | 6.0 % | 8.1 % | |
Percentage change in relative risk for third tertile vs. the first tertile after adjustment compared to minimally adjusted (for age, sex, and total energy intake) model. a Other cancer-related mortality refer to all cancer-related deaths except smoking or alcohol-related cancer mortality 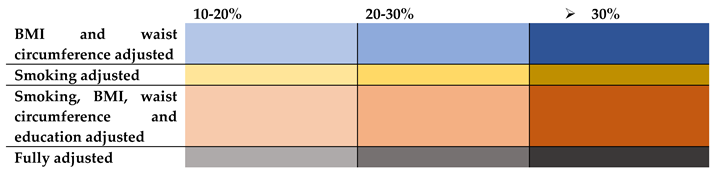
Disclaimer/Publisher’s Note: The statements, opinions and data contained in all publications are solely those of the individual author(s) and contributor(s) and not of MDPI and/or the editor(s). MDPI and/or the editor(s) disclaim responsibility for any injury to people or property resulting from any ideas, methods, instructions or products referred to in the content. |
© 2023 by the authors. Licensee MDPI, Basel, Switzerland. This article is an open access article distributed under the terms and conditions of the Creative Commons Attribution (CC BY) license (http://creativecommons.org/licenses/by/4.0/).
Copyright: This open access article is published under a Creative Commons CC BY 4.0 license, which permit the free download, distribution, and reuse, provided that the author and preprint are cited in any reuse.


