
Submitted:
29 June 2023
Posted:
30 June 2023
You are already at the latest version
Abstract
Advances towards smart ecosystems showcases Internet of Things (IoT) as a transversal strategy to improve energy efficiency in buildings, to enhance their comfort and environmental conditions, and to grow knowledge about building behavior, its relationships with the users and the interconnections among themselves and with the environmental and ecological context. EU estimates that 75% of the building stock is inefficient and aged with +40 years old. Although many buildings have some kind of system for regulating their indoor temperature, only a small subset provides integrated Heating, Ventilation, and Air Conditioning (HVAC) systems; within that subset, only a low percentage includes smart sensors, and only a minimum of that percentage integrates those sensors into IoT ecosystems. This work proposes several contributions. On the one hand, to understand the built environment as a set of interconnected systems that constitute a complex framework where IoT ecosystems are key enabling technologies to improve energy efficiency and Indoor Air Quality (IAQ) by filling the gap between theoretical simulations and real measurements. On the other hand, to understand IoT ecosystems as cost-effective solutions where: acquire data through connected sensors, analyze information in real-time, and build knowledge to make data-driven decisions. Furthermore, data set is public for third-party use to contribute scientific community to their research studies. Thus, this paper also contributes with a detailed functional scheme of IoT ecosystem deployed in 3 buildings of University of Zaragoza (Spain) with +200 geolocated wireless sensors with +100 representative spaces. The obtained results, through real installations with IoT as learning factory, show several learned lessons (about building complexity; energy consumption, costs and savings; and IAQ and health improvement) and contribute, as a proof-of-concept, with a proposal of prediction of building performance based on both correlations (between CO2 and occupancy) and neural networks (applied to CO2 and temperature). In summary, in a real context of economic restrictions, complexity, higher energy costs, social vulnerability and climate change, IoT-based strategies, as proposed in this work, highlight as an open, modular and interoperable approach to move towards smart communities (buildings, cities, regions, etc.) by improving energy efficiency and environmental quality (indoor and outdoor) with low cost, quick implementation, and low impact on users within great challenges for growth, interconnection, climate change and sustainability.
Keywords:
Internet of Things (IoT)
; Indoor Air Quality (IAQ)
; Energy efficiency
; Smart buildings
; Learning factory
1. Introduction
According to a special report by the European Court of Auditors [1], buildings are responsible for 40% of energy consumption and 36% of greenhouse gas emissions in Europe. According to Eurostat [2], households have had a steady contribution of approximately 25-28% to the final energy consumption in Europe since 1995. Energy consumption in households is the main reason for the observed greenhouse gas emissions of the sector [3]. Buildings and households, given their savings potential, have priority consideration in the European Union (EU) 2030 agenda to meet the Sustainable Development Goals (SDGs) with the commitment to reduce energy consumption by more than 30% by 2030 [4]. According to the United States (US) Environmental Protection Agency (EPA) [5] and UE [6] , people spend 80–90% of their time indoors where air quality is 2 to 5 times worse than outdoors, thus ensuring high quality of indoor air is of utmost importance.
Although all these figures stand out as key challenges, they are still not mandatory but policy recommendations. In this context, the main European norm is Energy Performance Buildings Directive (EPBD) 2018/844/EU [7]. EPBD promotes energy efficiency in buildings through several initiatives related to Internet of Things (IoT) technologies and Heating, Ventilation and Air Conditioning (HVAC) systems, among other key topics. According to EPBD, the energy performance of buildings should be calculated on the basis of a methodology, which may be differentiated at national and regional level. In addition to thermal characteristics, it includes other relevant factors such as: heating and air-conditioning installations, ventilation strategies, application of energy from renewable sources, building automation and control systems, smart solutions, passive heating and cooling elements, adequate natural light and air quality, design of the building, among others. The methodology should be based on hourly or sub-hourly time-steps, ensure the representation of actual operating conditions, and enable the use of metered energy to verify correctness and for comparability.
From these premises, the proposed solutions cannot be isolated; they have to be transversal strategies by understanding several key aspects:
- Only a minority of buildings provide an entire HVAC system: the majority can include only air-conditioning installations, or only heating system, or heating and air-conditioning distributions, or combined applications to provide ventilation, heating and cooling.
- Only a minority of buildings include IoT: it is becoming common to incorporate sensors that are used by Supervisory Control And Data Acquisition (SCADA) systems to control HVAC systems but integrate them into IoT ecosystem, as it is contributed with this paper, remains a challenge.
- The building stock is obsolete, so an intervention on energy efficiency must also ensure air quality conditions as key requirement by maintaining a healthy context and indoor comfortability with minimal energy and impact on the environment.
- Built environment is huge so transversal strategies need to be low cost and economically sustainable.
All these considerations make us consider which strategies are the most effective to improve buildings performance, specially energy efficiency and Indoor Air Quality (IAQ). This question is beginning to be answered in the scientific-technical field with studies on the context of the design and construction of new buildings which, by including the IoT layer, are called smart buildings. However, as previously mentioned, the current reality of the built environment is that only a minority of buildings include IoT, so it is necessary to propose cost-effective and sustainable strategies to incorporate IoT. Incorporating IoT-based technologies enables to collect continuous data to know how buildings behave, and to make data-driven decisions to improves IAQ, energy consumption and carbon footprint [8]. IoT allows the collection of vast amounts of data that, properly transmitted and processed (through cloud or in-house premises), will be converted into meaningful information [9]. This information, conveniently visualized and analyzed, generates knowledge, induces feedback in the acquisition and processing of data, and most importantly, allows for intelligent decisions based on valuable data [10]. Furthermore, IoT monitoring offers configurable solutions in a customized way for every specific case and context: a key feature to be integrated in buildings from a cost-effective perspective and complementing the pre-existing infrastructures to improve their performance. IoT is one of the technological paradigms destined to exponentially increase with a high impact on the daily behavior of potential users [11]. However, since this research area is an emerging field, the available literature is still limited. In [12], assuming this scope is a relatively new development, a comprehensive review was detailed by analyzing the potential of connecting Building Information Modelling (BIM) and smart buildings with IoT-based data sources. In [13], several examples of IoT implementation (within the last five years) in residential and commercial buildings were reviewed. And in [14], a system was developed in an IoT lab system to monitor the overall activities of the lab. The differential value of the scientific contributions of this paper is to highlight IoT ecosystems as key elements to turn a building into a learning factory. And university buildings are especially suitable as experimental testbed for current and future generations because their heterogeneity, use variety (classrooms, offices, laboratories, study rooms, canteens, etc.), seasonality, high variability in occupancy and people density, high energy demands, diversity of management systems, and other multiple factors. In this complex context, learning implies a performance: learning by doing. Thus, the methodology proposed (from a real intervention in built environment through a designed, implemented and deployed IoT ecosystem) constitutes a learning factory in a continuous cycle for direct application in academic works, researching projects and institutional initiatives, extendable to professional environments, tertiary buildings and smart cities, focused on energy efficiency, IAQ and (building and human) behavior patterns.
Regarding energy efficiency, in the current context where climate change and environmental degradation are a serious global challenge [15] [16], energy efficiency is essential to contribute to decarbonization and to limit, as set in the Paris Agreement in 2015, to 1.5°C the increase of global temperature [17]. Some articles in the literature study continuous monitoring systems aimed at improving energy efficiency in buildings [18,19,20]. Batista et al. [21] used an equipment control system to investigate the performance of the air-conditioning system of a small auditorium in Brazil, obtaining a 20% of energy consumption reduction and improving thermal comfort. More recently, [22] monitors the occupancy in an office building with the objective of developing occupancy models and determining their impact on the energy performance of building. Regarding thermal comfort, Li et al. [23] performed correlation analyses based on continuous thermal comfort measurements from four office buildings in Australia, supporting the use of continuous monitoring technologies for long-term thermal comfort evaluation. Furthermore, several key actions to improve buildings operation management have been identified to reduce its energy demand, such as rating tools and disclosure [24], energy audits [25], energy management systems [18], smart controls, and building passports [19].
Regarding IAQ, the World Health Organization (WHO) estimates that more than 100 diseases are associated with the effects of unhealthy environments. In this context, the United Nations (UN) has established different Sustainable Development Goals (SDGs) for 2030 [20], paying special attention to air quality [26]. According to the US EPA, IAQ refers to the air quality within and around buildings and structures, especially as it relates to the health and comfort of building occupants [5]. A good IAQ provides well-being, comfort, health and productivity in people. Some recommendations to improve IAQ are [27]: to choose building materials and furnishings with low pollutant emission rates (new buildings or renovations), to reduce the sources of pollutant emissions (stoves, cleaning products), purify the air (by particle filtration, removal of pollutant gases and microbiological control), and ventilate the interior of buildings (which allows diluting any type of pollutant, through the supply of outside air). Although IAQ is not exclusively related to CO2 concentration [28], some articles relate occupancy to CO2 concentration and propose the required air ventilation rates in order to keep the concentration below a set level [29,30,31,32,33,34,35]. The European Commission has analyzed the existing regulations on IAQ in the different countries and the existing varieties of ventilation systems, concluding that there is still a significant progress to be made in IAQ measurement and quantitative analysis [36]. All these studies remark the need of continuous monitoring systems to improve IAQ in buildings.
Thus, given the heterogeneity and complexity of the buildings [37, 38], to continue advancing in their knowledge (especially focused on energy efficiency and IAQ) and their relations with the people behavior, it is necessary to complement the simulation studies with quantitative real measurements. In the last 20–30 years, notable advances have been made in building energy simulation, but much less progress has been made in terms of measuring, analyzing and learning about the real operation and performance of the buildings. Numerous studies [39,40,41] show that there is a large difference between the theoretical values and the real data, what has been called Building Performance Gap (BPG), especially in heterogeneous university buildings with high complexity and variable occupation. These differences are due to the numerous simplifying assumptions required to model and simulate the real behavior of buildings. Algorithms have been designed to reduce the BPG [42]. All this reveals that it is not only necessary to simulate buildings, but also to perform continuous monitoring and data analysis to understand how they behave and know their real behavior in real operating conditions.
Furthermore, in this technological context where buildings can be understood as complex dynamic processes, advances in Model Predictive Control (MPC) are very interesting to analyze how variables such as occupancy, weather, climate, orientation, infiltration (air permeability), thermal inertia, and HVAC systems interact to improve energy efficiency and IAQ [43]. And, to continue developing MPC it is key to have quality and structured data and therefore IoT ecosystems. Furthermore, in recent years, Recurrent Neural Network (RNN) used to predict CO2 and temperature is an area of research that has experienced significant growth. In [44] it is shown that a linear regression model is not able to predict indoor environment indicators with high accuracy, concluding that complex models based on neural networks are needed. In [45], the RNN was used to predict CO2 levels using 10 weeks of measurements: 75% of this data was used to train the network and the remaining 25% as a test. In [46], a modelling and optimization approach is proposed to minimize energy consumption by ensuring correct IAQ and developing real-time predictive models to predict indoor environmental parameters (humidity, temperature, CO2) and energy consumption, using neural networks, and achieving very high reliability.
With all these premises, this paper aims several contributions. A contribution is intended to understand the built environment as a complex system where IoT ecosystems are key enabling technologies to move towards transversal strategies to improve energy efficiency and IAQ. Thus, this work proposes IoT as learning factory (from Latin, factorium, “place of doers, makers”). Other contribution is to understand IoT ecosystems as cost-effective solutions with continuous improvement cycle where: acquire data (from real measurements through connected sensors), analyze real-time information (to improve operations: maintenance, scheduling, etc.), and build knowledge (to make data-driven decisions). Furthermore, data set is open and public for third-party use to contribute scientific community to their research studies. With these aims, the following Building and IoT: reality and challenges section contributes with a transversal analysis of the main factors involved in the building reality to consider IoT as key enabling technologies towards the challenge of smart environments. The Material and Methods section contributes with a detailed functional scheme of IoT ecosystem applied to built environment (as complex systems) focused on energy efficiency and IAQ. The Results and Discussion section shows several results of experiments at building scale, focused on CO2 and energy consumption monitoring through real installations, to promote IoT as key to understand the building complexity and to contribute, as a proof-of-concept, with a proposal of prediction of CO2 and temperature based on neural networks. Finally, the Conclusions section details the scientific contributions of the work from a critical point-of-view and proposes further research studies.
2. Building and IoT: reality and challenges
The EU says in its “Renovation wave for Europe” strategy that a trend of renewal for Europe allows “greening our buildings, creating jobs, and improving our lives”. Its goal is to double the annual energy renewal rates in the next ten years. In 2014–2020, the EU allocated approximately €14 billion to improving the energy efficiency of buildings [47]. In addition, member states budgeted €5.4 billion in national co-financing for the improvement of all types of buildings. These renovations will improve the quality of life for the people who live in or/and use buildings, reduce greenhouse gas emissions and create up to 160,000 additional green jobs in the construction sector. But challenges towards the new paradigm of smart environments face reality of current built environment, marked by the following analyzed main factors: age, infrastructures, electrification, climatic and urban context, energy demand, diversity of stakeholders and complexity.
Age. The EU estimates that 75% of the building stock is inefficient and +40 years old in average [48]. Buildings around the world (mostly in Europe), when they are appropriately designed, constructed, renovated and maintained, are long-lasting structures capable of provide their occupants the most suitable indoor conditions from the impacts of very high or cold temperatures and with low energy cost. As detailed in Table 1 (from Eurostat [49]) the average age of the buildings in Europe is (in years old): +75 (22.3%), 45–75 (44.1%), 25–45 (22.1%) and -25 (9.8%). Only in a country like Spain there are about 10 million of buildings (9,730,999 dwellings and 83,786 for other uses) with an average age of 37 years [49]. In addition, the percentage of new construction (34,000 new buildings) is minimal compared to the total number (0,34%): more than 300 years would be necessary for its entire renovation.
Infrastructures. Although many buildings have some kind of system for regulating their indoor temperature, only a small subset provides an entire HVAC system; within that subset, only a low percentage includes smart sensors, and only a minimum of that percentage integrates those sensors into IoT ecosystems. And these facts especially impact non-residential buildings (e.g. public institutions, government, services, etc.), mostly located in old monumental buildings that lack HVAC systems. From the HVAC systems engineering point of view, historic buildings that have not been affected by recent maintenance work, whether ordinary, extraordinary or preventive, are generally equipped with obsolete equipment. In many buildings, thermal envelope is inefficient. Current heating and air-conditioning systems could be replaced, but can be evidence of the past and as such have a historical interest; therefore, they should be carefully recovered, valued and, if possible, made useable.
IoT technologies. From all the technical characteristics of IoT technologies, in this context it is important to highlight three key features. The cost is minimum compared to the economic costs handled in any action at building scale. IoT wireless technologies allows very high capabilities with very low number of sensors, with lifetimes of years (even photovoltaic batteries), without the need for wiring (neither for power nor for communications), and without impact in the infrastructures (by putting sensors on walls, windows or ceilings). IoT ecosystems require highly qualified technical staff, continuous management (calibration, monitoring), managers with digitalization training and analysts with data-driven vision to obtain operational conclusions. On the other hand, IoT technologies are already mature: once deployed requires very little maintenance and returns real-time data, very representative of the building performance.
Electrification. The climate emergency and dependence on fossil fuels have promoted policies to replace boilers in buildings with heat pumps. Following EPBD, the European Commission proposes that all newly buildings do not produce emissions from 2028 as well as the elimination of fossil fuels from 2035, being replaced by heat pumps systems based on electricity or hydrogen (blending, with natural gas or waste), although some reports rule out that this is feasible on a large scale [50,51]. Thus, continuous monitoring provided by IoT ecosystem is revealed as the best option for HVAC systems (based on electrical energy) adjust their regulation to environment, consumption, behavior and renewable energies. In addition, building systems whose operation is electrical are much easier to regulate (than systems based on combustion) and allow adjustments with respect to energy demand both at the building scale and at the city scale.
Climatic and urban context. The current climatic and energy context involve a sequenced boundary conditions: (1) extreme temperatures will involve extreme climate events, (2) will increase the demand for air conditioning and heating equipment, (3) that will produce an increase in energy demand, (4) in an aged built environment that majority is energy inefficient, (5) without a monitoring or management system. Furthermore, the urban trends point out that, in 2030, 50.9% will live in cities, 26.9% in towns and semi-dense areas and only a 20.6% in rural areas [52]. This combination between ageing population and highly urbanized ecosystems mean that the population is becoming more vulnerable to heat and that demand for cooling in buildings is quickly rising. All this requires intervention in buildings to examine key elements of sustainable cooling policy and its potential impacts on vulnerable groups by reducing health risks, inequalities and summer energy poverty. In the EU in 2022, compared with 1979, the need for heating a given building was approximately two-tenths lower; and the need to cool a given building is almost four times higher [53]. In summer of 2022, with successive long heatwaves and high energy prices, the heat stress created an urgency sense to acquire air conditioning devices. But there is a gap between knowledge on overheating in buildings and the percentage of EU citizens unable to keep their homes comfortably cool during the summer. And this growth for thermal comfort and healthy environments with IAQ means a growth of energy demand, despite the current situation of economic restrictions, the higher energy costs, the emissions consequences or the climate, social and environmental impact [54]. Thus, IoT ecosystems, as proposed in this paper, provide transversal strategies to plan this complex context and to choose customized solutions for each specific situation.
Energy demand and IAQ. The growth in the need for thermal comfort and better IAQ implies increases in energy demand. These environmental implications can estimate as +212% of the energy use for cooling residential building from 2010 to 2019 [55]. As mentioned before, the majority of buildings lack air conditioning and ventilation systems, and only recently buildings are designed with energy criteria [48]. Therefore, various actions are necessary, such as: renovation of building envelopes, installation of photovoltaic panels, improvement of HVAC systems, promotion of passive strategies, efficient air conditioning systems, installation of ventilation systems, urban revegetation policies (to avoid the heat islands effects and extreme temperatures), access to renewable energy, living in greener environments with less traffic density, among others. However, all these strategies carry high economic costs, are difficult to access to vulnerable groups and imply social inequities and energy poverty. Thus, IoT-based strategies, as proposed in this paper, means a cost-effective contribution, technically feasible and socially accessible; especially recommendable for public buildings and urban areas occupied by vulnerable groups.
Diversity of stakeholders. Buildings are interconnected at various scales and levels (see Table 2): space (local), building (community), neighborhood (intra-local), city (local), region (intra-national), country (national) and zone (inter-national). Thus, the widespread implementation of IoT transversal strategies at all scales is key to understand the building behavior in relation to human behavior by obtaining accurate information to make data-driven decisions at different levels:
- For users, IoT enhances HVAC systems with low cost, time and impact.
- For architects, IoT improves knowledge for an architecture evidence-based design about real behavior of buildings and users (overcoming the gap between theoretical values and real data).
- For engineers, IoT eases to study the most suitable energy system for each building according to its ubication, orientation, design, typology of spaces, uses, etc.
- For urbanists, extrapolated to urban scale and combining con Geographical Information System (GIS), IoT provides general strategies by zones.
- For geographers, overcoming the urban scale, IoT learns social behaviors, patterns and trends, etc.
- For epidemiologists and doctors, IoT makes it possible to correlate the spread of certain diseases with IAQ and environmental parameters and trends.
- For local, national and international institutions, IoT shares data on behavior patterns to implement strategies of rehabilitation, energy, management, etc. for energy, electricity, CO2, etc.
Complexity. The increase in information, technological advances, global interconnectivity, population growth, and environmental, biological, and socio-economic challenges generate more interdependent systems that are difficult to understand is its entirety. The acquisition and measurement of data provide empirical and quantitative information to understand and characterize key aspects of the reality under study. Monitoring and analyzing data allows to identify patterns, relationships, dynamics, and new emergent features that reveal the most significant interdependencies, diversity, and structure within a system. Thus, IoT-driven solutions allow to evaluate the system adaptability and to understand how different variables interact with each other and impact the overall system behavior, among other key factors.
3. Materials and Methods
Following the theory of knowledge by which “everything flows, is in permanent evolution … nothing is static, everything is dynamic: every entity or object is a complex process”, a building can be defined as a set of dynamic interconnected processes to provide a human habitat. Furthermore, the large number of systems, services, functionalities, parameters, metrics, etc. that perform in a building lead a complexity to understand it in its whole and foresee how it will behave and evolve. From these two approaches, a building can be defined as a complex system (see central element in Figure 1).
Anyway, buildings are not isolated. As aforementioned, buildings are interconnected at various scales and levels (neighborhood, city, region, etc.) forming communities. And, in these interconnected levels, the information flows and the knowledge is shared. Therefore IoT-based initiatives are mandatory to develop transversal strategies as emphasized in EPBD [7]: “… promotion of smart technologies and infrastructure for sustainable mobility in buildings”, “… integration of smart charging services enable the energy system integration of buildings”. In this context, it is essential to understand the relationships between the buildings and their communities (urban and rural, cities and villages, etc.) conforming the built environment (see Figure 1) that also constitutes complex systems understood as interconnection of buildings used by many people, also interconnected themselves and with the environmental context. As remarked EPBD [7]: “In order to digitalize the building sector, the Union’s connectivity targets and ambitions for the deployment of high-capacity communication networks are important for smart homes and well-connected communities”.
These concepts of the performance building and their behavior patterns (see Figure 1) lead to understand IoT as enabling technologies to quantitatively parameterize the Key Performance Indicators (KPIs) of the built environment. As EPBD reinforces as of 2026 (article 13) with the Smart Readiness Indicator (SRI) [56] as an essential parameter to make building owners and occupants aware of the value hidden in building automation and digital supervision of building technical systems, providing energy savings thanks to the new smart features as IoT [57]. In summary, to move towards the paradigm of digital twins means to integrate IoT ecosystems in smart communities (buildings, cities, etc.) to acquire data (through real measurements), compare them and turn them into information in order to generate knowledge for making data-driven decisions.
Thus, the functional scheme of an IoT ecosystem consists of 5 modules grouped in 3 layers (see upper area of Figure 1): perception (including sensors and networks), technology (cloud) and application (analytics and user). Each one of these 5 modules are following detailed:
- Sensors. There is a huge variety of sensors to measure parameters of interest in buildings such as (see left area of Figure 1): ambient sensors (CO2, temperature, humidity), mobility, occupancy, energy consumption, wearable devices, mobile information, contactless information (as Radio Frequency Identification (RFID) tags), etc. This work, as it is focused in energy efficiency and IAQ, includes sensors to measure energy consumption (kWh), CO2 level (ppm), temperature (°C), humidity (%) and occupancy (pax). The monitoring spaces have been representatively selected and labelled according their key characteristics, such as: location (floor, building, campus), orientation (north, south, east, west), use (classroom, study room, office, laboratory, library, canteen, etc.), size (big, medium, small), occupancy (high, medium, low), etc. In the specific case of IAQ, although there is a wide range of compounds, factors and situations that affect the IAQ of a building, it is possible to control mechanical ventilation in a building through the use of carbon dioxide (CO2) sensors. These sensors are easy to install and cost-effective, facilitating the straightforward monitoring and detection of CO2 concentration to regulate air exchange and necessary airflow. Additionally, the concentration of CO2 is considered an indirect indicator of air quality as well as the presence of occupants in an enclosed space. When individuals exhale, the levels of CO2 in the environment increase in a manner similar to temperature and Volatile Organic Compounds (VOCs) increase. In other words, continuous monitoring of CO2 levels in a space enables the automatic adjustment of airflow based on the detected levels. Furthermore, monitoring indoor CO2 enables effective energy management by adjusting the supply of HVAC systems according to the actual occupancy of the space.
- Networks. Sensors collect data. These collected data are sent to the following communication levels by various interconnected devices through their associated connectivity technologies. There are two main strategies: rely on classical cabled infrastructure centralized in SCADA systems or to use wireless protocols routed to the cloud using specific gateways, such as Wireless Fidelity (WiFi), 4G and Low Power Wide Area Network (LPWAN) technological family such as SigFox, Narrow Band IoT (NB-IoT) and Low Range Wide Area Network (LoRaWAN). Figure 2 shows a performance comparative to determine the most appropriate technology in order to propose homogeneous infrastructures. This comparison shows, among other issues, the importance of battery life and ease of battery replacement. As consequence of minimum maintenance cost and highest energy optimization and coverage range, LoRaWAN technology was selected for this work from the rest of LPWAN technological family. LoRaWAN specification [58] is a networking protocol, designed to wirelessly connect battery operated sensors with bi-directional communication and localization services, that targets other key IoT requirements such as end-to-end security, high interoperability and low monthly costs due to provider network fees.
- Cloud. Cloud computing services use a network layer (to connect remote devices or industrial TCP-IP protocols such as MODBUS-TCP or OPCUA through SCADA systems) with centralized resources (data centers). Currently, there are different types of clouds (public, private, hybrid) and new service models called X as a Service (XaaS), where X can be Software (SaaS), Platform (PaaS), Infrastructure (IaaS), among others. With the popularization of cloud services, the number of devices has exponentially increased. Given that critical and large-scale processes require increasingly fast and effective computational power, a new concept emerges: edge computing. Thus, edge computing refers to how computational processes are performed on or near the peripheral devices (edge). Finally, a third concept arises: fog computing, to refer a decentralized structure in which resources, including data and applications, are located in a logical place between the cloud and the data source. Due to the wide variety of sensors and scenarios in smart buildings, this research has utilized both edge services (for energy measurements considered as big data) and cloud services (for IAQ measurements considered as small data). The IoT ecosystem developed in this work integrates three main functionalities (see middle area in Figure 1): a management platform (to homogenize and control acquired data), an information repository (following the design principles of scalability, flexibility and big data processing), and real-time monitoring (with geopositioned information). Furthermore, these functionalities interconnect with two key services (above detailed): analytics technics (artificial intelligence, machine learning, deep learning and neuronal networks) and applications and services for user experience to offer variability for visualization and interaction through mobile apps, web interfaces, data dashboard with KPIs and other added-value services.
- Analytics. From the information processed and stored in the cloud, many analytics technologies exist for extraction of key factors, real time data exchange, remote monitoring, etc. This is crucial as it provides ubiquitous access, either through platforms or online applications, to real-time levels of CO2, temperature, occupancy, and energy consumption in a specific place, thereby facilitating the monitoring and control of KPIs as well as the subsequent analysis of both user behavior and building performance. In addition, the connection of sensors to the IoT infrastructure of a building enables integration with other systems, such as: (see lower area in Figure 1): HVAC, lighting, security (alarm, fire, etc.), mobility, energy management, etc. This provides facilities for coordination and global optimization of building systems and improves their structure by enhancing their efficiency, safety, wellness and comfort.
- User. From all the data collected by the sensors and the information computed by the analytics, IoT systems visualize knowledge. Report generation or dashboard visualization helps to better understanding of environment behavior and supports the informed decision-making about the aforementioned building systems (HVAC, lighting, security, mobility, energy management, etc.). In this work, the combined analysis (from CO2, temperature, humidity, occupancy and energy consumption) enable the development of management models of energy efficiency and IAQ. With them, smart automation and control systems, both for ventilation and air conditioning systems, can be regulated based on occupancy levels, usage planning, and external environmental conditions. It even allows the development of models that incorporate parameters such as the economic cost of energy, on-site renewable energy production, human behavior, or the environmental impact of the building. Moreover, IoT systems can send real-time alerts or notifications when KPIs reach predefined threshold, and take actions to correct situations, ensure a healthy environment, etc.
All this implies that buildings behave as complex systems (see middle area in Figure 1), because of the feedback provided by contextual knowledge about energy efficiency, indoor comfort and IAQ within environmental impact, facility management and location-based services, among others. As this work is focused in energy efficiency and IAQ, their implications in this context are following detailed. On the one hand, the energy demand in a building can be estimated through the energy regulations when it was built. However, several key factors (design, orientation, ubication, use) can produce large consumption variations studies [39]. Even in newly buildings, there are significant differences between calculated energy and measured consumption, reinforcing the idea of filling the gap between theoretical values and real data studies [40,41,42]. Thus, data provide by IoT ecosystems are essential to make knowledge-driven decisions.
On the other hand, the IAQ in a building is directly related to the presence of efficient ventilation systems capable of introducing fresh and filtered outdoor air while extracting stale indoor air. These two parameters can be regulated by natural ventilation (windows, doors, airflows, etc.), mechanical ventilation (filters, diffusers, heat recovery devices, etc.), hybrid approaches, even efficient air renewal through entire HVAC systems. Thus, measurements provide by IoT ecosystems are key to learn HVAC behavior, such as: make knowledge-driven decisions. Therefore, a continuous and real-time monitoring of building performance (as energy consumption, HVAC and SCADA services, ambient sensors, etc.), comparing with external data (as historical weather data and forecast), and integrating with other key variables (as renewable energy levels of the photovoltaic panels) lead IoT ecosystems as a great learning factory to understand how a building really works under their operating conditions.
In this work, as is following detailed in Results and Discussion section, an entire university campus (with 3 buildings of 14,000 m2 –for 1,000 students and 250 staff–, 21,000 m2 –for 1,500 students and 350 staff–, and with 27,000 m2 –for 2,000 students and 450 staff) has been used as IoT learning factory. To do correctly this learning, as shown in Figure 3, is essential to understand the current status of built environment that includes three general typologies of buildings regarding ventilation and energy efficiency:
- Buildings without mechanical ventilation, with deficiencies in their insulation both in thermal transmittance of the building envelope and the air permeability.
- Buildings with hybrid systems, which incorporate ventilation and air conditioning systems, either mechanical or hybrid, without CO2 sensors, but with temperature controls in several indoor spaces and with large uncontrolled airflows (either through open windows, open doors, inefficient materials, etc.).
- Efficient energy buildings: a minority of buildings that integrates HVAC systems including high thermal insulation, high-performance windows, heat recovery ventilation equipment and very low-permeability materials.
However, in many cases, none of these typologies had previously deployed IoT ecosystems. Thus, from these three mentioned types of buildings, the improvement of the key factors in the building performance involves transversal efficiency and IAQ strategies:
- Replacement of the building envelope to reduce both energy transfer and air permeability.
- Replacement of the current HVAC systems with more efficient solution by designing a ventilation network, with dual flow and sectorization, to incorporate heat recovery systems.
- Integration of a smart management and control system through IoT ecosystems.
The first two strategies are well-known but involve rehabilitation and renovation processes with very high economic costs and significant impacts on users and buildings; thus, as they are unlikely to be borne by individual users, they require significant public investments. The third strategy, compatible with the first two strategies, is based on the implementation of continuous monitoring through IoT ecosystems (as it is proposed in this work), could be the appropriate solution in terms of cost-effectiveness, technically feasibility and socially accessibility; especially for public buildings and urban areas occupied by vulnerable groups. As shown in Figure 3, the added-value of IoT-based strategies is:
- In buildings without mechanical ventilation, IoT helps to improve IAQ by detecting potentially dangerous concentrations of CO2 (through alarms or visual indicators) and adjusting when and how to use natural ventilation, in combination with available HVAC systems, according to both indoor and outdoor conditions. It allows for manual minimization of energy losses while minimizing health risks.
- In buildings with hybrid systems, IoT enables smart control of the systems, whether centralized or specific to each space. Thus, IoT provides users knowledge about how to modulate mechanical ventilation and HVAC systems in combination with natural ventilation, according to both indoor and outdoor conditions, and regarding with the environmental context.
- In efficient energy buildings, IoT enables precise and smart adjustment of HVAC systems, moving towards the paradigm of active building. IoT informs users when to select natural ventilation, essential to connect people with the environment.
In all cases, the integration of IoT ecosystems into built environment leads to learn, model, and visualize when the building systems (management, operating, production, distribution, etc.) are most efficient, according to its KPIs such as (see right upper area in Figure 3): (1) building performance, (2) occupancy, (3) behavior patterns, (4) weather forecast, (5) renewable energy, (6) energy costs, (7) indoor and outdoor air quality, and (8) environmental impact.
All these concepts show that IoT ecosystems are key to understand the building behavior in relation to human behavior. In addition to better adjust HVAC or SCADA systems, IoT compares the overall building performance and also connects it with the natural environment. And it is essential because there are not two habitats alike in the world. Two identical buildings can have different behaviors depending on how users interact with them; and vice versa: identical uses in different buildings can yield different results. In this complexity of interconnections and interrelations, IoT arise as the transversal discipline that should better meet the challenge to understand buildings as complex systems by using their behavior and knowledge as learning factory to make data-driven decisions.
Thus, as shown in lower area of Figure 3 and is worked in following Results and Discussion section, IoT as learning factory leads to improve the overall knowledge about architectural data-driven design, energy rehabilitation actions and occupancy planning strategies.
4. Results and Discussion
Following all the premises detailed in previous sections, an IoT ecosystem (named sensoriZAR) has been designed, developed and implemented in Campus Río Ebro in University of Zaragoza (Spain) [59]. sensoriZAR has been designed to store a large volume of heterogeneous data (acquired at high speed), homogenize it into information, and provide added-value knowledge. Its functional architecture follows the principles detailed in Figure 1 by integrating 5 modules in 3 layers: data acquisition (from sensors) and network interconnection (perception layer); information storage & processing (technologies layer), knowledge analytics and visualization (application layer). Thus, sensoriZAR harmonizes different mechanisms to import, export, download, monitor and integrate data, through Application Programming Interfaces (APIs), for third-party use (including researching studies) and make data-driven decisions. Furthermore, it is built as a homogeneous IoT ecosystem of ultra-low consumption with free-hardware and free-software to provide a cost-effective and sustainable IoT-based strategy to improve energy efficiency and IAQ in buildings. sensoriZAR has deployed +200 geolocated wireless ambient sensors (with real-time measurements of CO2, temperature, humidity and occupancy in +100 representative spaces of the 3 buildings of Campus Río Ebro (Building I, II and III). Furthermore, the IoT ecosystem has integrated the energy and electricity consumption from the SCADA systems. As it was detailed in Materials and Methods section, the monitoring spaces have been representatively selected and labelled according their key characteristics, such as: location (floor, building, campus), orientation (north, south, east, west), use (classroom, study room, office, laboratory, library, canteen, etc.), size (big, medium, small), occupancy (high, medium, low), etc. As a representative example, Figure 4 shows all the ambient sensors deployed in Building I of Campus Río Ebro. As this work is focused in energy efficiency and IAQ, the obtained measurements show several results of experiments through real installations where IoT allows understanding the building complexity and contributing, as a proof-of-concept, with a proposal of prediction of CO2 and temperature based on neural networks.
First, focused on energy efficiency analysis, Figure 5 and Figure 6 show several learned lessons about energy consumption, costs and savings. As a representative example, Figure 5 shows average temperature evolution each day of the week in a building of Campus Río Ebro (Building I). The measurements (graphic in orange color) are the result of average the daily temperature measurements of every monitoring space in Building I during the fall semester (Figure 6 details December 2022 and January 2023). As in Spain, following Order PCM/466/2022 [60] for buildings of the General State Administration and institutional public sector entities, public buildings with associated HVAC energy consumption must keep indoor temperature (when heating) between 17 and 21°C, these thresholds have been marked in Figure 5 with a pink line (for 17°C) and a yellow line (for 21°C). Every week is delimited between vertical blue lines and every day can be identified by its maximum (peak) temperature value: a zoom is detailed (framed in green color) where every peak is underlined as Monday, Tuesday, etc., including the weekend (shaded in yellow color). Thus, Figure 5 highlights two interesting features:
- Every week there is an increase in the average daily temperature (as a sawtooth) which helps to explain the thermal inertia of the building behavior. It is very interesting to know this behavior because, by measuring the daily maximums and minimums according to each day of the week and comparing the graph with the 21°C threshold, it is possible to estimate the savings potential. According to the measurements obtained, the implementation of an IoT-managed HVAC system should imply savings between 10 and 15% of total energy consumption.
- During weekends, festive days and holydays as Christmas (areas shaded in yellow color), average temperatures drop below the 17°C threshold. Thus, the start of each week on Monday implies a significant energy consumption to increase temperatures to thermal comfort zone (between 19 and 21°C according to [60]). It is very interesting to quantify this energy consumption in order to analyze diverse strategies that would avoid an excessive decrease of building temperature and thus it would not be necessary to overcome a very high slope at the beginning of each week.
To deeply analyze some of these trends, Figure 6 shows (as a zoom) the detail of the daily temperatures of various monitored spaces in this building; for this study, 6 classrooms in second floor with the same characteristics: capacity for 70 people (medium size) with medium occupancy and north orientation. The measurements (graphics in different colors regarding every classroom from A to F) are the instant temperature during three days in a weekend (Saturday, Sunday and a festive Monday). Figure 6 shows that several classrooms (D, C and F) follow anomalous trends since their temperatures reach very high values when heating system should be disconnected. Thanks to IoT ecosystem reported this building performance, the Energy Management System was asked and it was found that the thermostats in those classrooms (C in orange color and D in purple color) were not correctly working; thus, the HVAC system had been active all weekend. In addition, F classroom (in blue color) was not marked in the Energy Management System as holiday, so the HVAC system started on Monday as if it were a conventional week.
All these quantitative results demonstrate the interest of using IoT ecosystems to real-time monitor building KPIs in order to detect anomalies, correct malfunctions, even anticipate potential breakdowns through predictive techniques, as it is studied in the third contribution of this section.
Second, focused on IAQ analysis, Figure 7 and Figure 8 show several learned lessons about improvement of healthy environments. Figure 7 shows the average CO2 levels (in percentage, see left axis) of every building in Campus Río Ebro (Buildings I, II and III). These average CO2 levels are the result of average the daily CO2 measurements of every monitoring space in each building during the fall semester (since September 2022 to January 2023). The average values show in all cases how CO2 levels meet the recommended levels (CO2 < 1000 ppm (in light green color) in usual conditions, and CO2 < 800 ppm (in dark green color) to minimize the COVID-19 risk) around 90% of time: 88,22% in Building I; 92,26% in Building II; and 93,36% in Building III.
Figure 8 shows, as a zoom, the detail of a representative space of each of these buildings to analyze similarities and differences according to each type of space: (a) in Building I, a classroom with capacity for 120 people (big size) with high occupancy and north orientation; (b) in Building II, a computer room with capacity for 44 people (small size) with high occupancy and west orientation; and (c) in Building III, a canteen with capacity for 260 people (very big size) with medium occupancy and east orientation.
In a controlled masterclass environment where most of the time only the teacher is speaking, Figure 8(a) shows how CO2 < 1000 ppm in +95% of time. In a more variable environment and a space with smaller capacity, in which people interact with computers, talk to each other, the teacher interacts with each practice group, etc., Figure 8(b) shows how CO2 increases (CO2 > 1000 ppm around 20%) and also the maximum CO2 measurements increase (red dots in right axis are higher than 2000 ppm). In an environment such as a canteen, with high roaming (the flow of people is constantly changing), open spaces and high ceilings that imply air and CO2 renewal, Figure 8(c) shows CO2 < 1000 ppm almost 100%.
All these results show interesting trends to understand the CO2 behavior in buildings depending on the typologies of spaces, their size, orientation, location and use, among other features. Furthermore, this contribution of IoT ecosystems as learning factory allows these trends to be extrapolated to all types of buildings: administration, institutional, education, services, etc.
Third, to learn about prediction applied to behavior of buildings (CO2) and users (occupancy) a transversal experiment was deployed by correlating the CO2 levels with occupancy. Although it has been observed that CO2 levels remain within a healthy range for the majority of the time when the building spaces are in use, there are certain periods when this is not the case. Furthermore, the results show significant variability among them due to the numerous influencing variables. It involves the study room, which is a large space located on the ground floor, facing south, and equipped with large glass windows. It has a surface area of 761 m2, an air volume of 2666 m3 and a maximum capacity of 464 people. The occupation is high and variable. The actual occupation was measured with a specific sensor that obtains the exact number of people at any given moment. All these measured data (more than 1500 measurement records of each type) were analyzed in opening hours in March 2022.
Figure 9 shows the maximum recorded CO2 values (vertical axis) versus the actual room occupancy (horizontal axis). The first objective is to determine the appropriate capacity without exceeding a certain recommended level of CO2. This is an indicator of air quality, as it indicates the percentage of previously breathed air present in the environment. To ensure people's health and prevent the risk of respiratory diseases, or even minimize the risk of COVID-19, limiting occupancy is a key measure as it allows for maintaining recommended levels of carbon dioxide. Alongside the graph, the linear regression line is represented. In order not to exceed 1000 ppm of CO2 (horizontal thick blue arrow), the occupation should be between 115 and 125 people (vertical thick blue stripe) and, in pandemic time, if the recommended CO2 level is reduced till 800 ppm (horizontal thin blue arrow), the occupation would be reduced between 60 and 80 people (vertical thin blue stripe).
The second objective is to estimate the CO2 concentration that will occur from a given proposed occupation; for example, as it was proposed by the Risk Prevention Unit during the pandemic time following the regulations for all public spaces is Spain. In the highest pandemic incidence stage, the occupation was set at 87 people, so the estimated maximum CO2 level increased to around 880 ppm (dotted red line); in the lowest incidence stage, the occupation was set at 145 people, so the maximum CO2 level would be around 1070 ppm (dotted green line). Although these results are slightly over the recommended CO2 thresholds, both values could be adequate. Based on these results, an analysis procedure of 3 steps is following proposed:
- To collect quantitative CO2 concentration and occupation for a representative period of time.
- To obtain a correlation between the maximum values of CO2 and occupancy.
- To establish the maximum acceptable for CO2 concentration and therefore the adequate air ventilation rate in order to establish the capacity for each room/classroom.
Implementing a bylaw for occupancy limitations is a decision that does not accurately align with the actual maximum CO2 levels, as they vary among different spaces. The selected values largely represent fractions (e.g., half, one-third, etc.) of the maximum capacity, but they lack scientific precision. Each space should be studied separately, and its occupancy should be limited to the most precise value. The graph also shows a significant dispersion of values, mainly because variables such as the duration of people's stay in the room are not being considered. Additionally, the correlation coefficient R2 is below 0.76, indicating uncertainties that go beyond people counting or sensor accuracy. Furthermore, variables such as temperature, humidity, HVAC system operation, indoor activity, windows opening, wind incidence, and other external climatic characteristics should be included. CO2 level does not only depend on the occupancy. An IoT system allows for tailoring the occupancy limit in each space, adapting it to its specific characteristics.
Thus, as fourth contribution to learn more accurately the estimation of CO2 levels and to enhance the numerical model, a prediction model based on Back Propagation Neural Network (BPNN) has been researched. Indeed, the Back Propagation Neural Network (BPNN) enables quick and accurate identification of nonlinear relationships between various input variables and output objectives, thus enhancing the prediction of complex systems. The obtention of the prediction model for the study room serves a double purpose. On the one hand, it could be able to inform the user about the trend in the value of CO2 and temperature. On the other hand, it could be implemented in a smart control system of the HVAC system, which, for example, in case of a predicted temperature increase (due to human load, solar, etc.), switches off the heating supply before reaching the setpoint temperature, with consequent energy savings, or it renews the air with consequent air quality improvement.
For this research, the same data collected throughout March 2022 have been used and the BPNN has been trained for a prediction horizon of one hour. The neural network application used has been Neural Net Fitting (Matlab r2022a), choosing the Bayesian Regularization algorithm and a number of hidden neurons (layer size) of 10, as indicated by default in [61]. 70% of the input data was used for training the network, and of the remaining 30%: 15% was used for validation (validating the network and stopping training before overfitting occurs) and 15 % for testing the network independently.
The data collected by the sensors, such as CO2 (ppm), temperature (˚C), humidity (%), occupancy (pax), and accumulated occupancy (pax), have been used as inputs to predict the CO2 values and indoor temperature. Table 3 shows the input data (columns 2-6), where accumulated occupancy is the addition of the occupancy of the last 55 minutes (with measurements every 11 minutes per period). Columns 7-8 show the predictions for CO2 and temperature, 5 time periods after. As an example, 8 training records are shown in Table 3. Predictions (shaded in rows 1-3, columns 7-8) are adjusted accurately to measurements made one hour later (shaded in rows 13-15, columns 2-3).
Figure 10 shows the results obtained by applying the neural network proposal to the data measured during the month of March, obtaining a regression value R = 0.996 with a Mean Squared Error (MSE) of 535. This correlation level is high enough to see the use of BPNN is a promising strategy to make this kind of prediction if the sampling is sufficiently large. The precision lays below the CO2 sensor ones, which is ±40 ppm. It can be observed that the prediction curve (in blue) fits remarkably well with the curve of actual measurements (in black). To extend this accurate fitting throughout the entire year, additional experimental data should be obtained. BPNN demonstrate their usefulness in addressing the given problem for the studied period, and as a result, new data collections are currently being acquired to develop more comprehensive and precise models. The input data and predictions should correspond to a period with similar characteristics to obtain year-round predictions under extremely varying conditions.
(a) CO2
(a) Temperature
5. Conclusions
The obtained results show several learned lessons through real installations where IoT ecosystems can behave as cost-effective solutions to understand the built environment as a complex system. Moreover, deployment of IoT-driven solutions contributes as transversal strategies to improve energy efficiency and IAQ, and to predict the building performance. The implementation of IoT ecosystems allows a customized analytical study of each specific situation.
As mentioned in the Introduction section, differences between simulated and real building behavior are due to several reasons: variety of uses, characteristics of construction, orientation, location, climatic conditions and environmental context, among other factors. Thus, IoT ecosystems are key for transversal strategies to reduce energy consumption, to increase energy efficiency, to improve IAQ, to enhance healthy environments and to predict performance situations because …
- IoT helps to understand user behavior patterns to adjust energy production to real demand; and vice versa, to understand how building processes energy, enabling changes in the behavior patterns of their managers and users.
- By combining real data from energy, CO2, temperature and occupancy, IoT helps to understand buildings as complex systems in a specific climatic location to perform models, simulations and predictions towards the paradigm of digital twins. Thus, IoT monitoring provides the knowledge to characterize the built environment (since information to create a digital model is not always available) avoiding difficult-to-access data, such as: construction materials, architectonic decisions, thermal bridges, uncontrolled infiltrations, windows efficiency, HVAC performance, among others.
- IoT provides detailed analysis for each specific case, use and space to define the best energy retrofit strategy. For each building, IoT quantifies which energy improvement strategy should better impact on reducing energy consumption and greenhouse gas emissions.
- IoT easily detects anomalies, energy leaks, airflow, unused spaces, open windows, etc. as well as inefficiencies in HVAC systems or maintenance failures, among other potential malfunctions.
- IoT enables a smart management when it interoperates with the building systems: HVAC, SCADA, lighting, security, mobility, climate regulation, home automation, access control, etc.
- IoT ecosystems, when interconnected on a larger scale (city, region, country, etc.), provide sociodemographic studies and analysis of how buildings are used, enabling knowledge-driven decisions for global rehabilitation strategies. Mobility and communities are closely interconnected, providing insights into how users invest time and energy.
In summary, in a real context of economic restrictions, complexity, higher energy costs, social vulnerability and climate change, IoT-based strategies, as proposed in this work, highlight as an open, modular, interoperable and cost-effective approach to move towards smart communities by improving energy efficiency and environmental quality (indoor and outdoor) with low cost, quick implementation, and low impact on users within great challenges for growth, interconnection, climate change and overall sustainability. IoT ecosystems (through real-time monitoring of building performance) can be seen as a way to democratize information while save energy and costs (especially necessary for public buildings and urban areas with vulnerable groups) while keeping comfort, well-being levels and the quality of life of the people who daily live the buildings.
Funding
The work was supported by Zaragoza Vivienda UZ Chair (CAT-C019/2020_3-UZ) and UZ Scientific
Policy Vice-rectorate (SGI-171481 EQUZ2022-TEC-11) and it has been awarded for Multidisciplinary Innovation
- SAMCA UZ Chair (2000/0074).
Acknowledgements
The authors thanks for several obtained data and their contributions to this work to Ángel Pueyo (UZ vice-rector for Planning, Sustainability and Infrastructure); Head management team of UZ Engineering and Architecture School (EINA); José Miguel Jover and Salvador Nevot (UZ smart campus initiative, smartcampus.unizar.es); David Cambra (UZ Green Office, oficinaverde.unizar.es); Alberto Mur, Jorge Vizárraga, Álvaro Marco and Teresa Blanco (HOWLab, howlab.unizar.es); Enrique Torres (GaZ, gaz.i3a.es), Raquel Trillo (DisCo, webdiis.unizar.es/DISCO); Sergio Ilarri (COSMOS, cos2mos.unizar.es); Silvia Guillén-Lambea (GITSE, i3a.unizar.es/gitse); and Belinda López-Mesa, José María Castejón, Ángel Bayod, Antonio Montañés, and Miguel García Monge; all this people as members of Engineering Research Institute of Aragón (I3A) Smart Cities Lab (smartcities.unizar.es).
References
- European Court of Auditors, Energy efficiency in buildings: greater focus on cost-effectiveness still needed, Luxembourg, 2020. https://op.europa.eu/webpub/eca/special-reports/energy-efficiency-11-2020/en/index.html. (accessed on 28 May 2023).
- Eurostat. Statistics Explained, Final energy consumption by sector, EU, 2021, Eurostat. (2023). https://ec.europa.eu/eurostat/statistics-explained/index.php?title=File:Final_energy_consumption_by_sector,_EU,_2021,_(%25_of_total,_based_on_terajoules).PNG. (accessed on 14 June 2023).
- COMMISSION STAFF WORKING DOCUMENT, Climate Mainstreaming Architecture in the 2021-2027 Multiannual Financial Framework, Brussels, 2022. https://commission.europa.eu/system/files/2022-06/swd_2022_225_climate_mainstreaming_architecture_2021-2027.pdf. (accessed on 14 June 2023).
- General Secretariat of the Council, Building a sustainable Europe by 2030 – Progress thus far and next steps - Council conclusions (10 December 2019), Brussels, 2019. https://www.consilium.europa.eu/media/41693/se-st14835-en19.pdf. (accessed on 14 June 2023).
- United States Environment Protection Agency (EPA), Why Indoor Air Quality is Important to Schools, (2022). https://www.epa.gov/iaq-schools/why-indoor-air-quality-important-schools. (accessed on 14 June 2023).
- Joint Research Centre, Indoor air pollution: new EU research reveals higher risks than previously thought, Brussels, 2003. https://ec.europa.eu/commission/presscorner/detail/en/IP_03_1278. (accessed on 14 June 2023).
- THE EUROPEAN PARLIAMENT AND OF THE COUNCIL, Consolidated text: Directive 2010/31/EU of the European Parliament and of the Council of 19 May 2010 on the energy performance of buildings (recast), 2021.
- D. Evans, The Internet of Things. How the Next Evolution of the Internet is Changing Everything, 2011. chrome-extension://efaidnbmnnnibpcajpcglclefindmkaj/https://www.cisco.com/c/dam/en_us/about/ac79/docs/innov/IoT_IBSG_0411FINAL.pdf. (accessed on 14 June 2023).
- R. van der Meulen, Gartner Says 6.4 Billion Connected “Things” Will Be in Use in 2016, Up 30 Percent From 2015, Gartner. (2015). https://www.gartner.com/en/newsroom/press-releases/2015-11-10-gartner-says-6-billion-connected-things-will-be-in-use-in-2016-up-30-percent-from-2015. (accessed on 14 June 2023).
- Q. Ashraf, M. Q. Ashraf, M. Yusoff, A. Azman, N. Nor, N. Fuzi, M. Saharedan, N. Omar, Energy monitoring prototype for Internet of Things: Preliminary results, 2015. [CrossRef]
- L. Atzori, A. Iera, G. Morabito, The Internet of Things: A survey, Computer Networks. 54 (2010) 2787–2805. [CrossRef]
- S. Tang, D.R. S. Tang, D.R. Shelden, C.M. Eastman, P. Pishdad-Bozorgi, X. Gao, A review of building information modeling (BIM) and the internet of things (IoT) devices integration: Present status and future trends, Autom Constr. 101 (2019) 127–139. [CrossRef]
- K. Lawal, H.N. K. Lawal, H.N. Rafsanjani, Trends, benefits, risks, and challenges of IoT implementation in residential and commercial buildings, Energy and Built Environment. 3 (2022) 251–266. [CrossRef]
- M. Poongothai, P.M. M. Poongothai, P.M. Subramanian, A. Rajeswari, Design and implementation of IoT based smart laboratory, in: 2018 5th International Conference on Industrial Engineering and Applications (ICIEA), IEEE, 2018: pp. 169–173. [CrossRef]
- T.I.P. on C.C. IPCC, Mitigation of Climate Change Climate Change 2022 Working Group III contribution to the Sixth Assessment Report of the Intergovernmental Panel on Climate Change, 2022. https://www.ipcc.ch/site/assets/uploads/2018/05/uncertainty-guidance-note.pdf. (accessed on 17 July 2022).
- United Nations, Climate Change, United Nations. Global Issues. (n.d.). https://www.un.org/en/global-issues/climate-change (accessed on , 2023). 14 June.
- European Commission, Paris Agreement, European Commission. Climate Action. (2016). https://climate.ec.europa.eu/eu-action/international-action-climate-change/climate-negotiations/paris-agreement_en. (accessed on 14 June 2023).
- A.H. Oti, E. A.H. Oti, E. Kurul, F. Cheung, J.H.M. Tah, A framework for the utilization of Building Management System data in building information models for building design and operation, Autom Constr. 72 (2016) 195–210. [CrossRef]
- M.M. Sesana, G. M.M. Sesana, G. Salvalai, A review on Building Renovation Passport: Potentialities and barriers on current initiatives, Energy Build. 173 (2018) 195–205. [CrossRef]
- United Nations, United Nations Sustainable Development Goals, (n.d.). https://www.un.org/sustainabledevelopment/. (accessed on 14 June 2023).
- A.P. Batista, M.E.A. A.P. Batista, M.E.A. Freitas, F.G. Jota, Evaluation and improvement of the energy performance of a building’s equipment and subsystems through continuous monitoring, Energy Build. 75 (2014) 368–381. [CrossRef]
- C. Piselli, A.L. C. Piselli, A.L. Pisello, Occupant behavior long-term continuous monitoring integrated to prediction models: Impact on office building energy performance, Energy. 176 (2019) 667–681. [CrossRef]
- P. Li, T. P. Li, T. Parkinson, S. Schiavon, T.M. Froese, R. de Dear, A. Rysanek, S. Staub-French, Improved long-term thermal comfort indices for continuous monitoring, Energy Build. 224 (2020) 110270. [CrossRef]
- P.A. Fokaides, C. P.A. Fokaides, C. Panteli, A. Panayidou, How Are the Smart Readiness Indicators Expected to Affect the Energy Performance of Buildings: First Evidence and Perspectives, Sustainability. 12 (2020) 9496. [CrossRef]
- C.A. Balaras, K.G. C.A. Balaras, K.G. Droutsa, E.G. Dascalaki, S. Kontoyiannidis, A. Moro, E. Bazzan, Urban Sustainability Audits and Ratings of the Built Environment, Energies (Basel). 12 (2019) 4243. [CrossRef]
- General Secretariat of the Council, Building a sustainable Europe by 2030 – Progress thus far and next steps - Council conclusions, Brussels, 2019. https://www.consilium.europa.eu/media/41693/se-st14835-en19.pdf. (accessed on 28 May 2023).
- ASHRAE, ASHRAE Position Document on Indoor Carbon Dioxide, Georgia, 2022. https://www.ashrae.org/file%20library/about/position%20documents/pd_indoorcarbondioxide_2022.pdf. (accessed on 14 June 2023).
- Persily, A. Development and application of an indoor carbon dioxide metric, Indoor Air. 32 ( 2022. [CrossRef]
- Batterman, S. Review and Extension of CO2-Based Methods to Determine Ventilation Rates with Application to School Classrooms, Int J Environ Res Public Health. 14 (2017) 145. [CrossRef]
- Franco, A.; Leccese, F. Measurement of CO2 concentration for occupancy estimation in educational buildings with energy efficiency purposes, Journal of Building Engineering. 32 (2020) 101714. [CrossRef]
- Franco, A.; Schito, E. Definition of Optimal Ventilation Rates for Balancing Comfort and Energy Use in Indoor Spaces Using CO2 Concentration Data, Buildings. 10 (2020) 135. [CrossRef]
- Kabirikopaei, A.; Lau, J. Uncertainty analysis of various CO2-Based tracer-gas methods for estimating seasonal ventilation rates in classrooms with different mechanical systems, Build Environ. 179 (2020) 107003. [CrossRef]
- Kabirikopaei, A.; Lau, J. Uncertainty analysis of various CO2-Based tracer-gas methods for estimating seasonal ventilation rates in classrooms with different mechanical systems, Build Environ. 179 (2020) 107003. [CrossRef]
- Alonso, M.J.; Wolf, S.; Jørgensen, R.B.; Madsen, H.; Mathisen, H.M. A methodology for the selection of pollutants for ensuring good indoor air quality using the de-trended cross-correlation function, Build Environ. 209 (2022) 108668. [CrossRef]
- Morawska, L.; Allen, J.; Bahnfleth, W.; Bluyssen, P.M.; Boerstra, A.; Buonanno, G.; Cao, J.; Dancer, S.J.; Floto, A.; Franchimon, F.; et al. A paradigm shift to combat indoor respiratory infection, Science (1979). 372 (2021) 689–691. [CrossRef]
- Européenne, C.; de l’énergie, D.G.; Durier, F.; De Strycker, M.; Guyot, G.; Sherman, M.; Leprince, V.; Urbani, M.; De Blaere, B.; Mélois, A.; Selle-Marquis, P.; Janssens, A.; Decorte, Y.; Wouters, P. Technical study on the possible introduction of inspection of stand-alone ventilation systems in buildings : final report, Publications Office, 2020. [CrossRef]
- Sun, Y.; Wu, T.-Y.; Zhao, G.; Guizani, M. Efficient Rule Engine for Smart Building Systems, IEEE Transactions on Computers. 64 (2015) 1658–1669. [CrossRef]
- Çıdık, M.S.; Phillips, S. Buildings as complex systems: the impact of organisational culture on building safety, Construction Management and Economics. 39 (2021) 972–987. [CrossRef]
- Uriarte, I.; Erkoreka, A.; Legorburu, A.; Martin-Escudero, K.; Giraldo-Soto, C.; Odriozola-Maritorena, M. Decoupling the heat loss coefficient of an in-use office building into its transmission and infiltration heat loss coefficients, Journal of Building Engineering. 43 (2021) 102591. [CrossRef]
- Herrando, M.; Cambra, D.; Navarro, M.; de la Cruz, L.; Millán, G.; Zabalza, I. Energy Performance Certification of Faculty Buildings in Spain: The gap between estimated and real energy consumption, Energy Convers Manag. 125 (2016) 141–153. [CrossRef]
- P.X.W. Zou, X. P.X.W. Zou, X. Xu, J. Sanjayan, J. Wang, Review of 10 years research on building energy performance gap: Life-cycle and stakeholder perspectives, Energy Build. 178 (2018) 165–181. [CrossRef]
- Figueiredo, A.; Kämpf, J.; Vicente, R.; Oliveira, R.; Silva, T. Comparison between monitored and simulated data using evolutionary algorithms: Reducing the performance gap in dynamic building simulation, Journal of Building Engineering. 17 (2018) 96–106. [CrossRef]
- Taheri, S.; Hosseini, P.; Razban, A. Model predictive control of heating, ventilation, and air conditioning (HVAC) systems: A state-of-the-art review, Journal of Building Engineering. 60 (2022) 105067. [CrossRef]
- Tian, X.; Cheng, Y.; Lin, Z. Modelling indoor environment indicators using artificial neural network in the stratified environments, Build Environ. 208 (2022) 108581. [CrossRef]
- Tagliabue, L.C.; Cecconi, F.R.; Rinaldi, S.; Ciribini, A.L.C. Data driven indoor air quality prediction in educational facilities based on IoT network, Energy Build. 236 (2021) 110782. [CrossRef]
- Afroz, Z.; Shafiullah, G.M.; Urmee, T.; Shoeb, M.A.; Higgins, G. Predictive modelling and optimization of HVAC systems using neural network and particle swarm optimization algorithm, Build Environ. 209 (2022) 108681. [CrossRef]
- European Commission, Renovation wave. Renovating the EU building stock will improve energy efficiency while driving the clean energy transition, European Commission. (2020). https://energy.ec.europa.eu/topics/energy-efficiency/energy-efficient-buildings/renovation-wave_en (accessed on , 2023). 14 June.
- Eurpean Commission, In focus: Energy efficiency in buildings, Eurpean Commission. (2020). https://commission.europa.eu/news/focus-energy-efficiency-buildings-2020-02-17_en. (accessed on 14 June 2023).
- Eurotstat Statistics Explained, Dwellings by period of construction, national averages and capital regions, 2011, Eurotstat. (2011). https://ec.europa.eu/eurostat/statistics-explained/index.php?title=File:Dwellings_by_period_of_construction,_national_averages_and_capital_regions,_2011_(%25_share_of_all_dwellings)_PITEU17.png. (accessed on 14 June 2023).
- Korberg, A.D.; Thellufsen, J.Z.; Skov, I.R.; Chang, M.; Paardekooper, S.; Lund, H.; Mathiesen, B.V. On the feasibility of direct hydrogen utilisation in a fossil-free Europe, Int J Hydrogen Energy. 48 (2023) 2877–2891. [CrossRef]
- Rosenow, J. Is heating homes with hydrogen all but a pipe dream? 6 (2022) 2225–2228. [CrossRef]
- Commission, E.; Centre, J.R. Atlas of the human planet 2020 : open geoinformation for research, policy, and action, Publications Office, 2021. [CrossRef]
- Eurostat Statistic Explained, Heating and cooling degree days - statistics, Eurostat. (2023). https://ec.europa.eu/eurostat/statistics-explained/index.php?title=Heating_and_cooling_degree_days_-_statistics. (accessed on 14 June 2023).
- Quefelec, S. Cooling buildings sustainably in Europe: exploring the links between climate change mitigation and adaptation, and their social impacts, European Environment Agency. (2022). https://www.eea.europa.eu/publications/cooling-buildings-sustainably-in-europe. (accessed on 2 June 2023).
- International Energy Agency, The Future of Cooling Opportunities for energyefficient air conditioning, 2018.
- European Commission, Smart Readiness Indicator (SRI) for Buildings, (2018). https://smartreadinessindicator.eu/. (accessed on 28 June 2023).
- European Commission, Outcomes of the first technical study about SRI, (2018). https://smartreadinessindicator.eu/1st-technical-study-outcome. (accessed on 28 June 2023).
- LoRa Alliance, What is LoRaWAN Specification, LoRa Alliance. (2023). https://lora-alliance.org/about-lorawan/. (accessed on 28 June 2023).
- Martínez, I.; Zalba, B.; Trillo-Lado, R.; Blanco, T.; Cambra, D.; Casas, R. Internet of Things (IoT) as Sustainable Development Goals (SDG) Enabling Technology towards Smart Readiness Indicators (SRI) for University Buildings, Sustainability. 13 (2021) 7647. [CrossRef]
- Ministerio de la Presidencia, Real Decreto 1826/2009, de 27 de noviembre, por el que se modifica el Reglamento de instalaciones térmicas en los edificios, aprobado por Real Decreto 1027/2007, de 20 de julio, Documento BOE-A-2009-19915, Spain, 2009.
- MATLAB & Simulink - MathWorks, Fit Data with a Shallow Neural Network, (2023). https://es.mathworks.com/help/deeplearning/gs/fit-data-with-a-neural-network.html. (accessed on 28 June 2023).
Figure 1.
IoT ecosystems in buildings as complex systems.
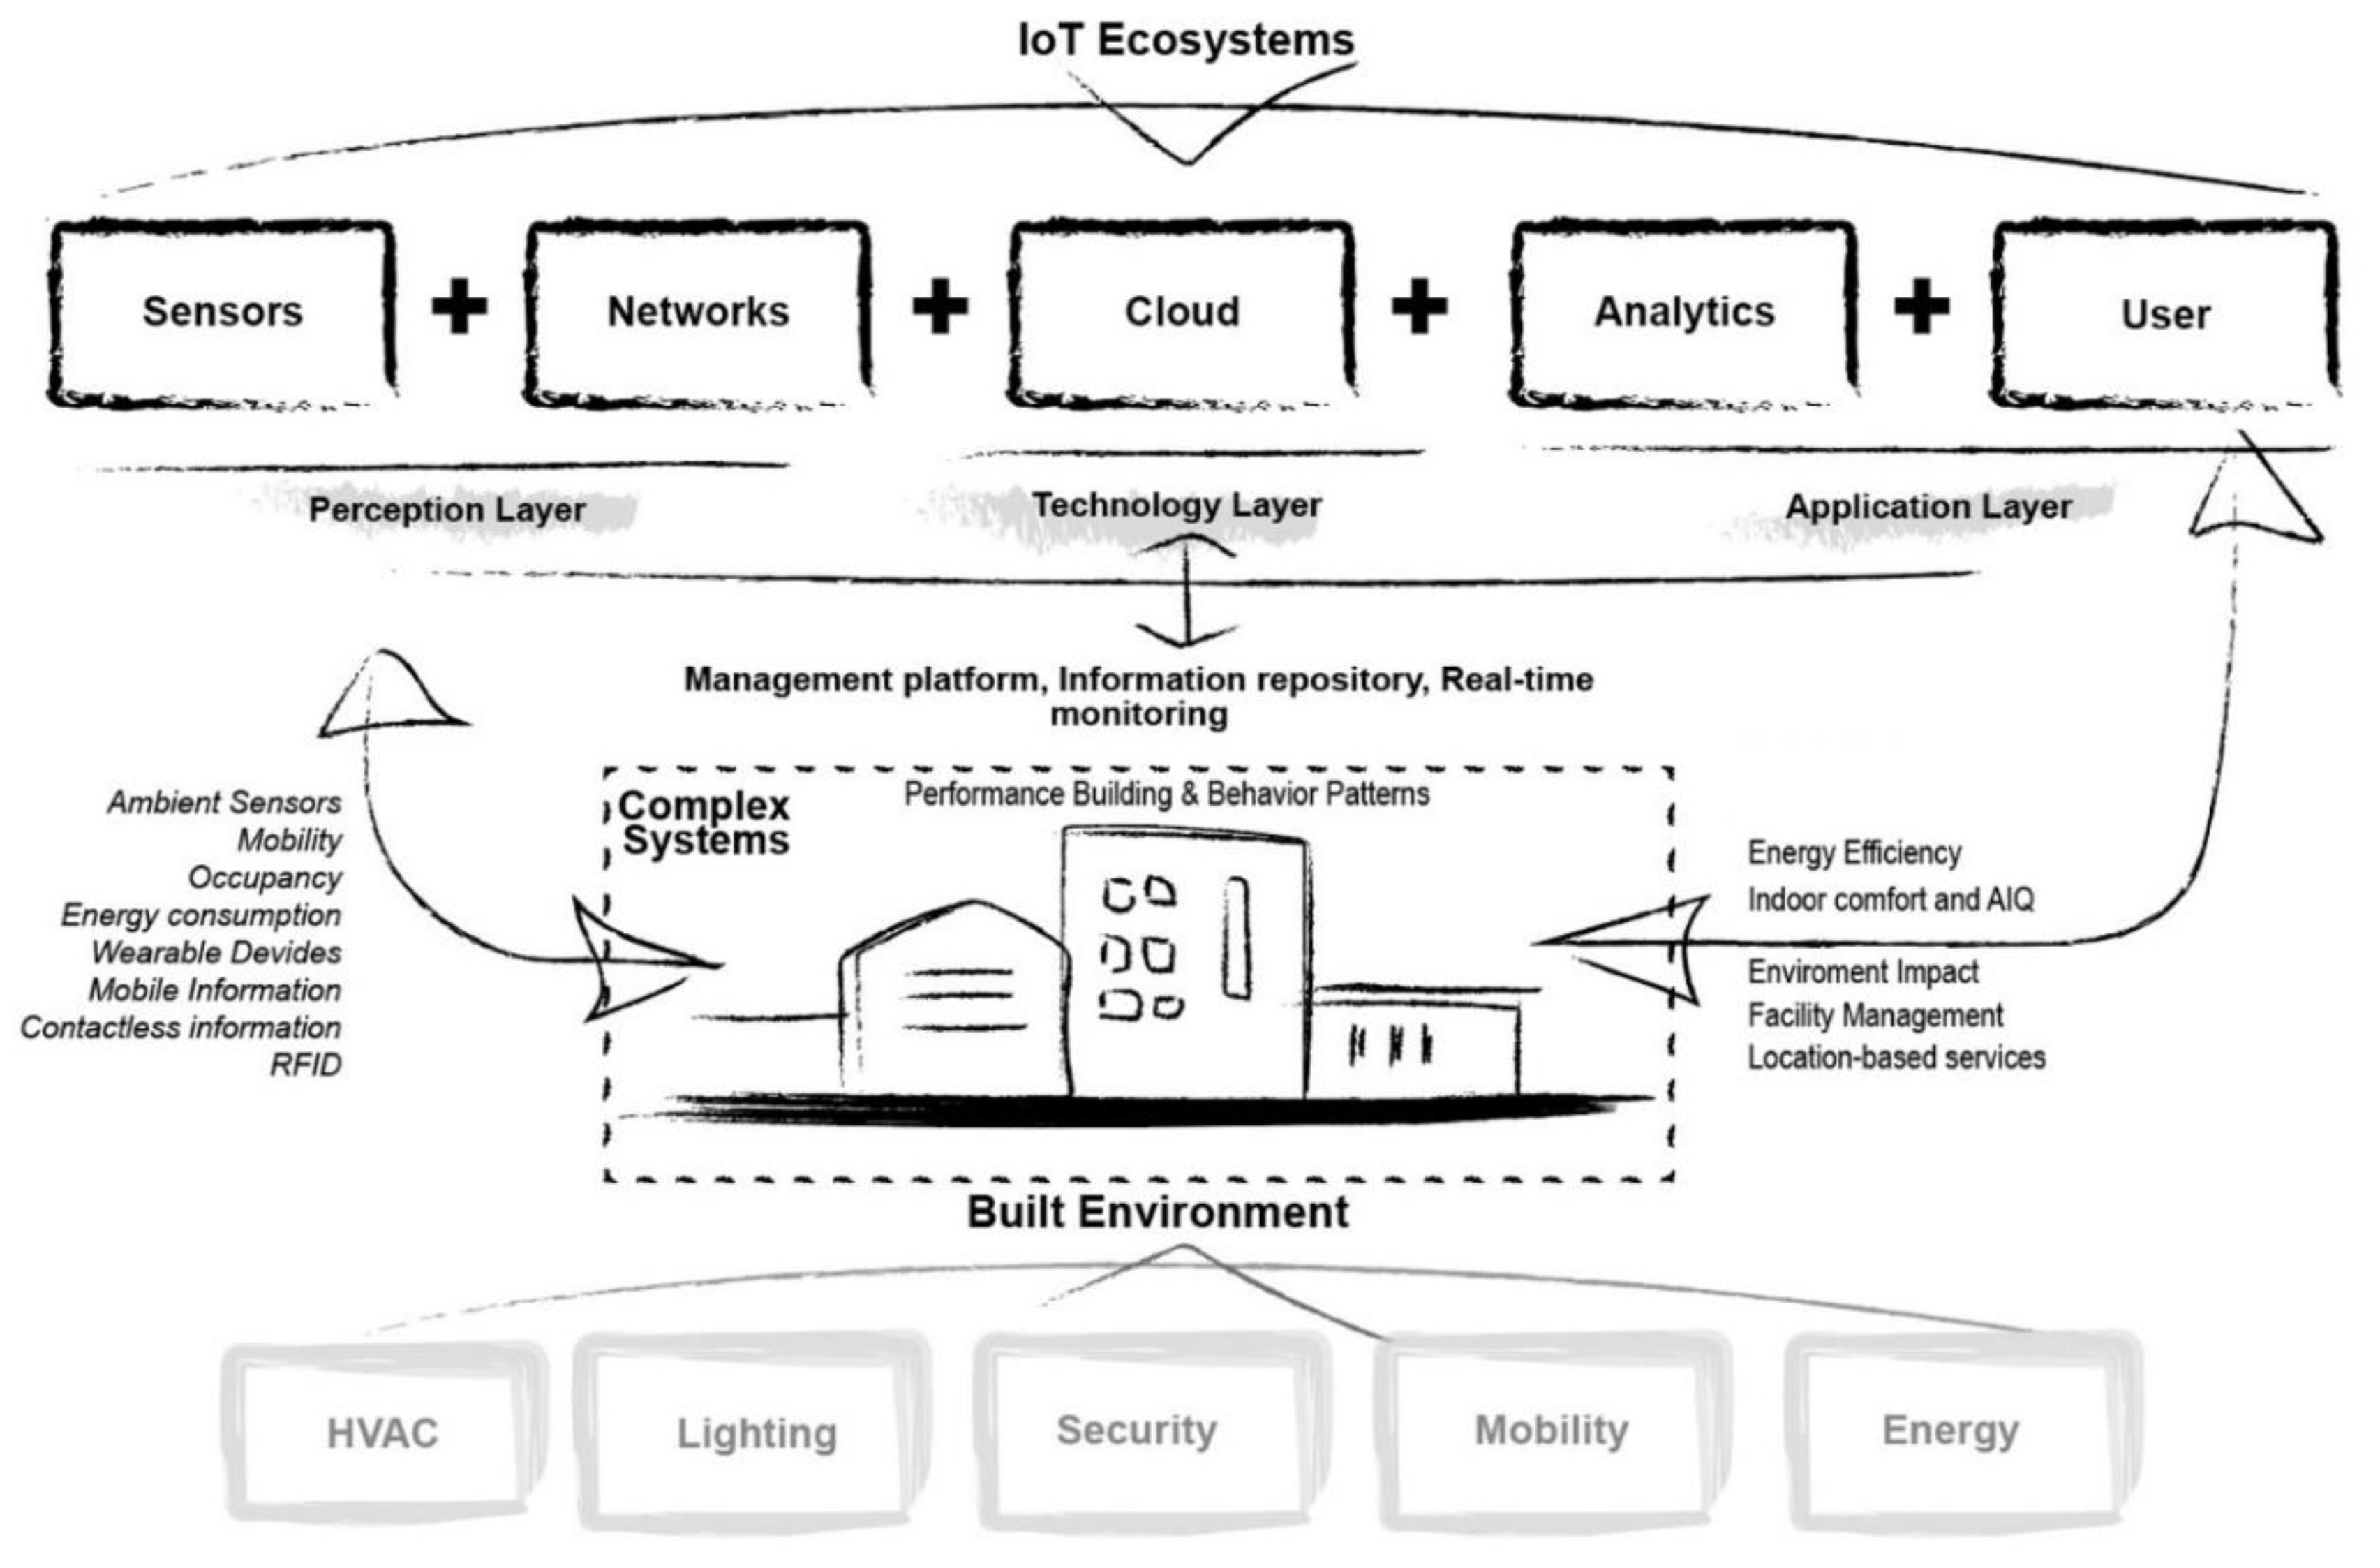
Figure 2.
Comparison between LoRaWAN and LPWAN technological family.
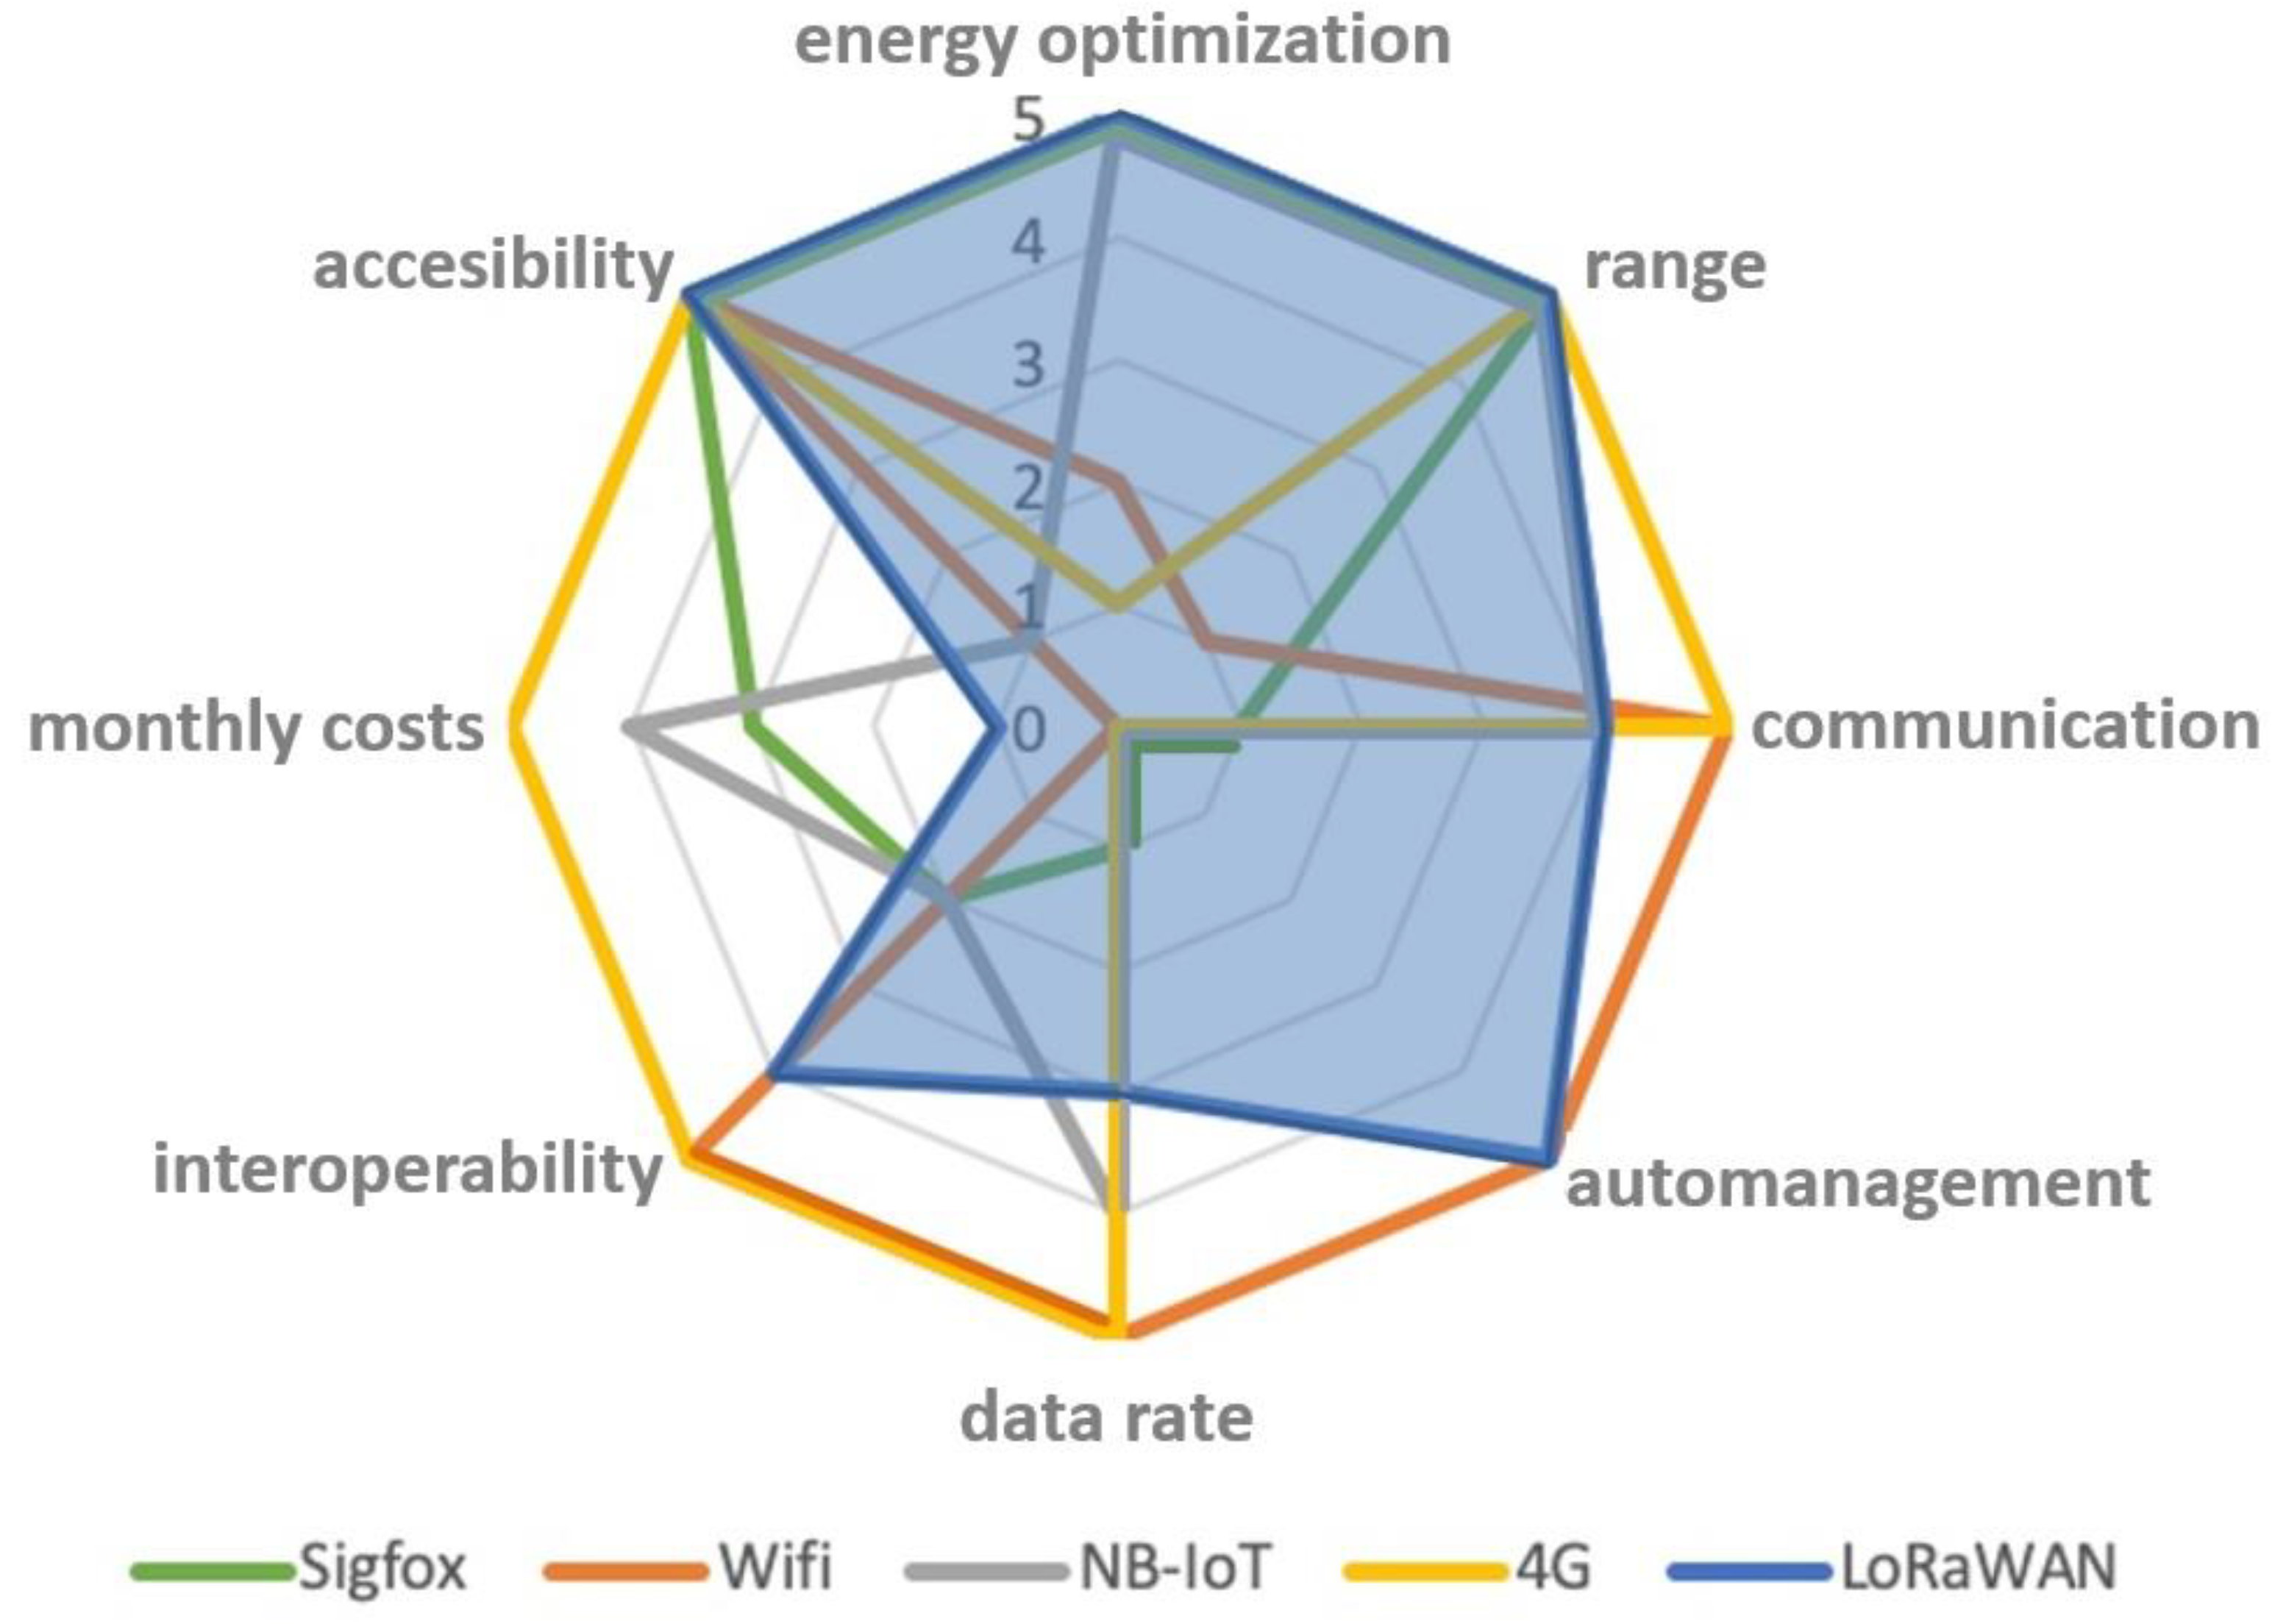
Figure 3.
IoT as key enabling ecosystem to understand the building complexity.
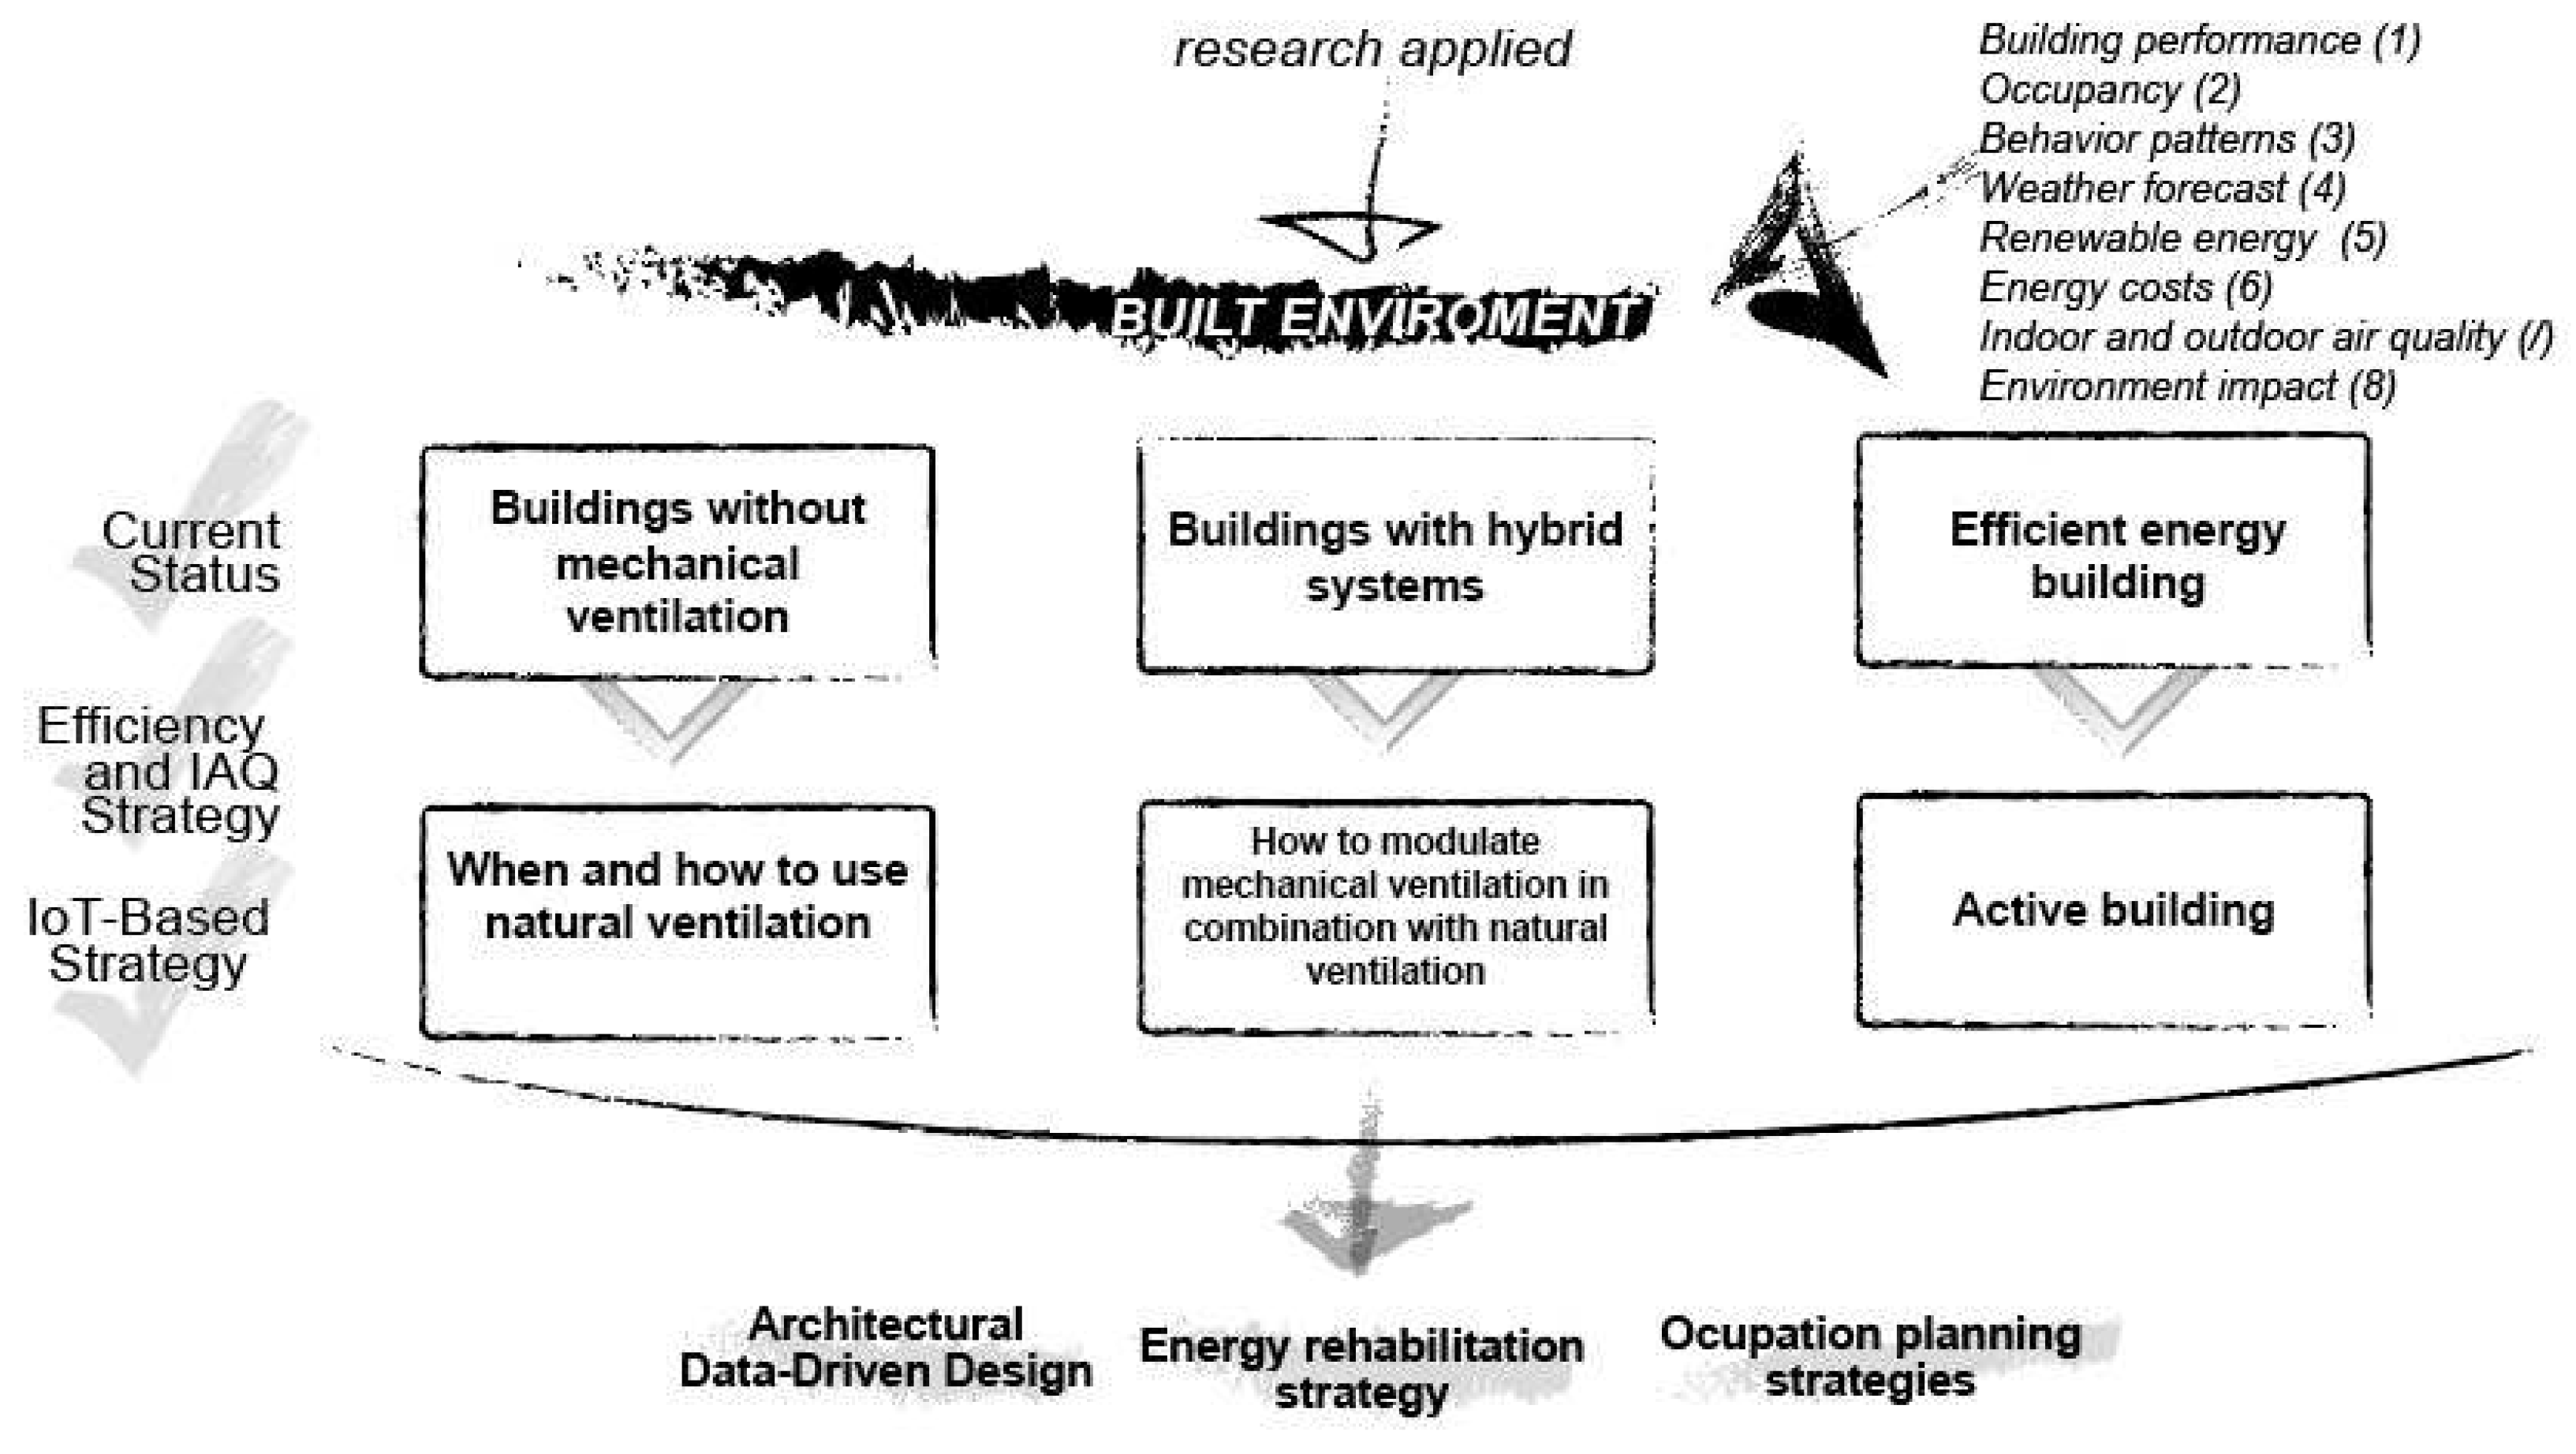
Figure 4.
Ambient sensors deployed by sensoriZAR in Building I of Campus Río Ebro.
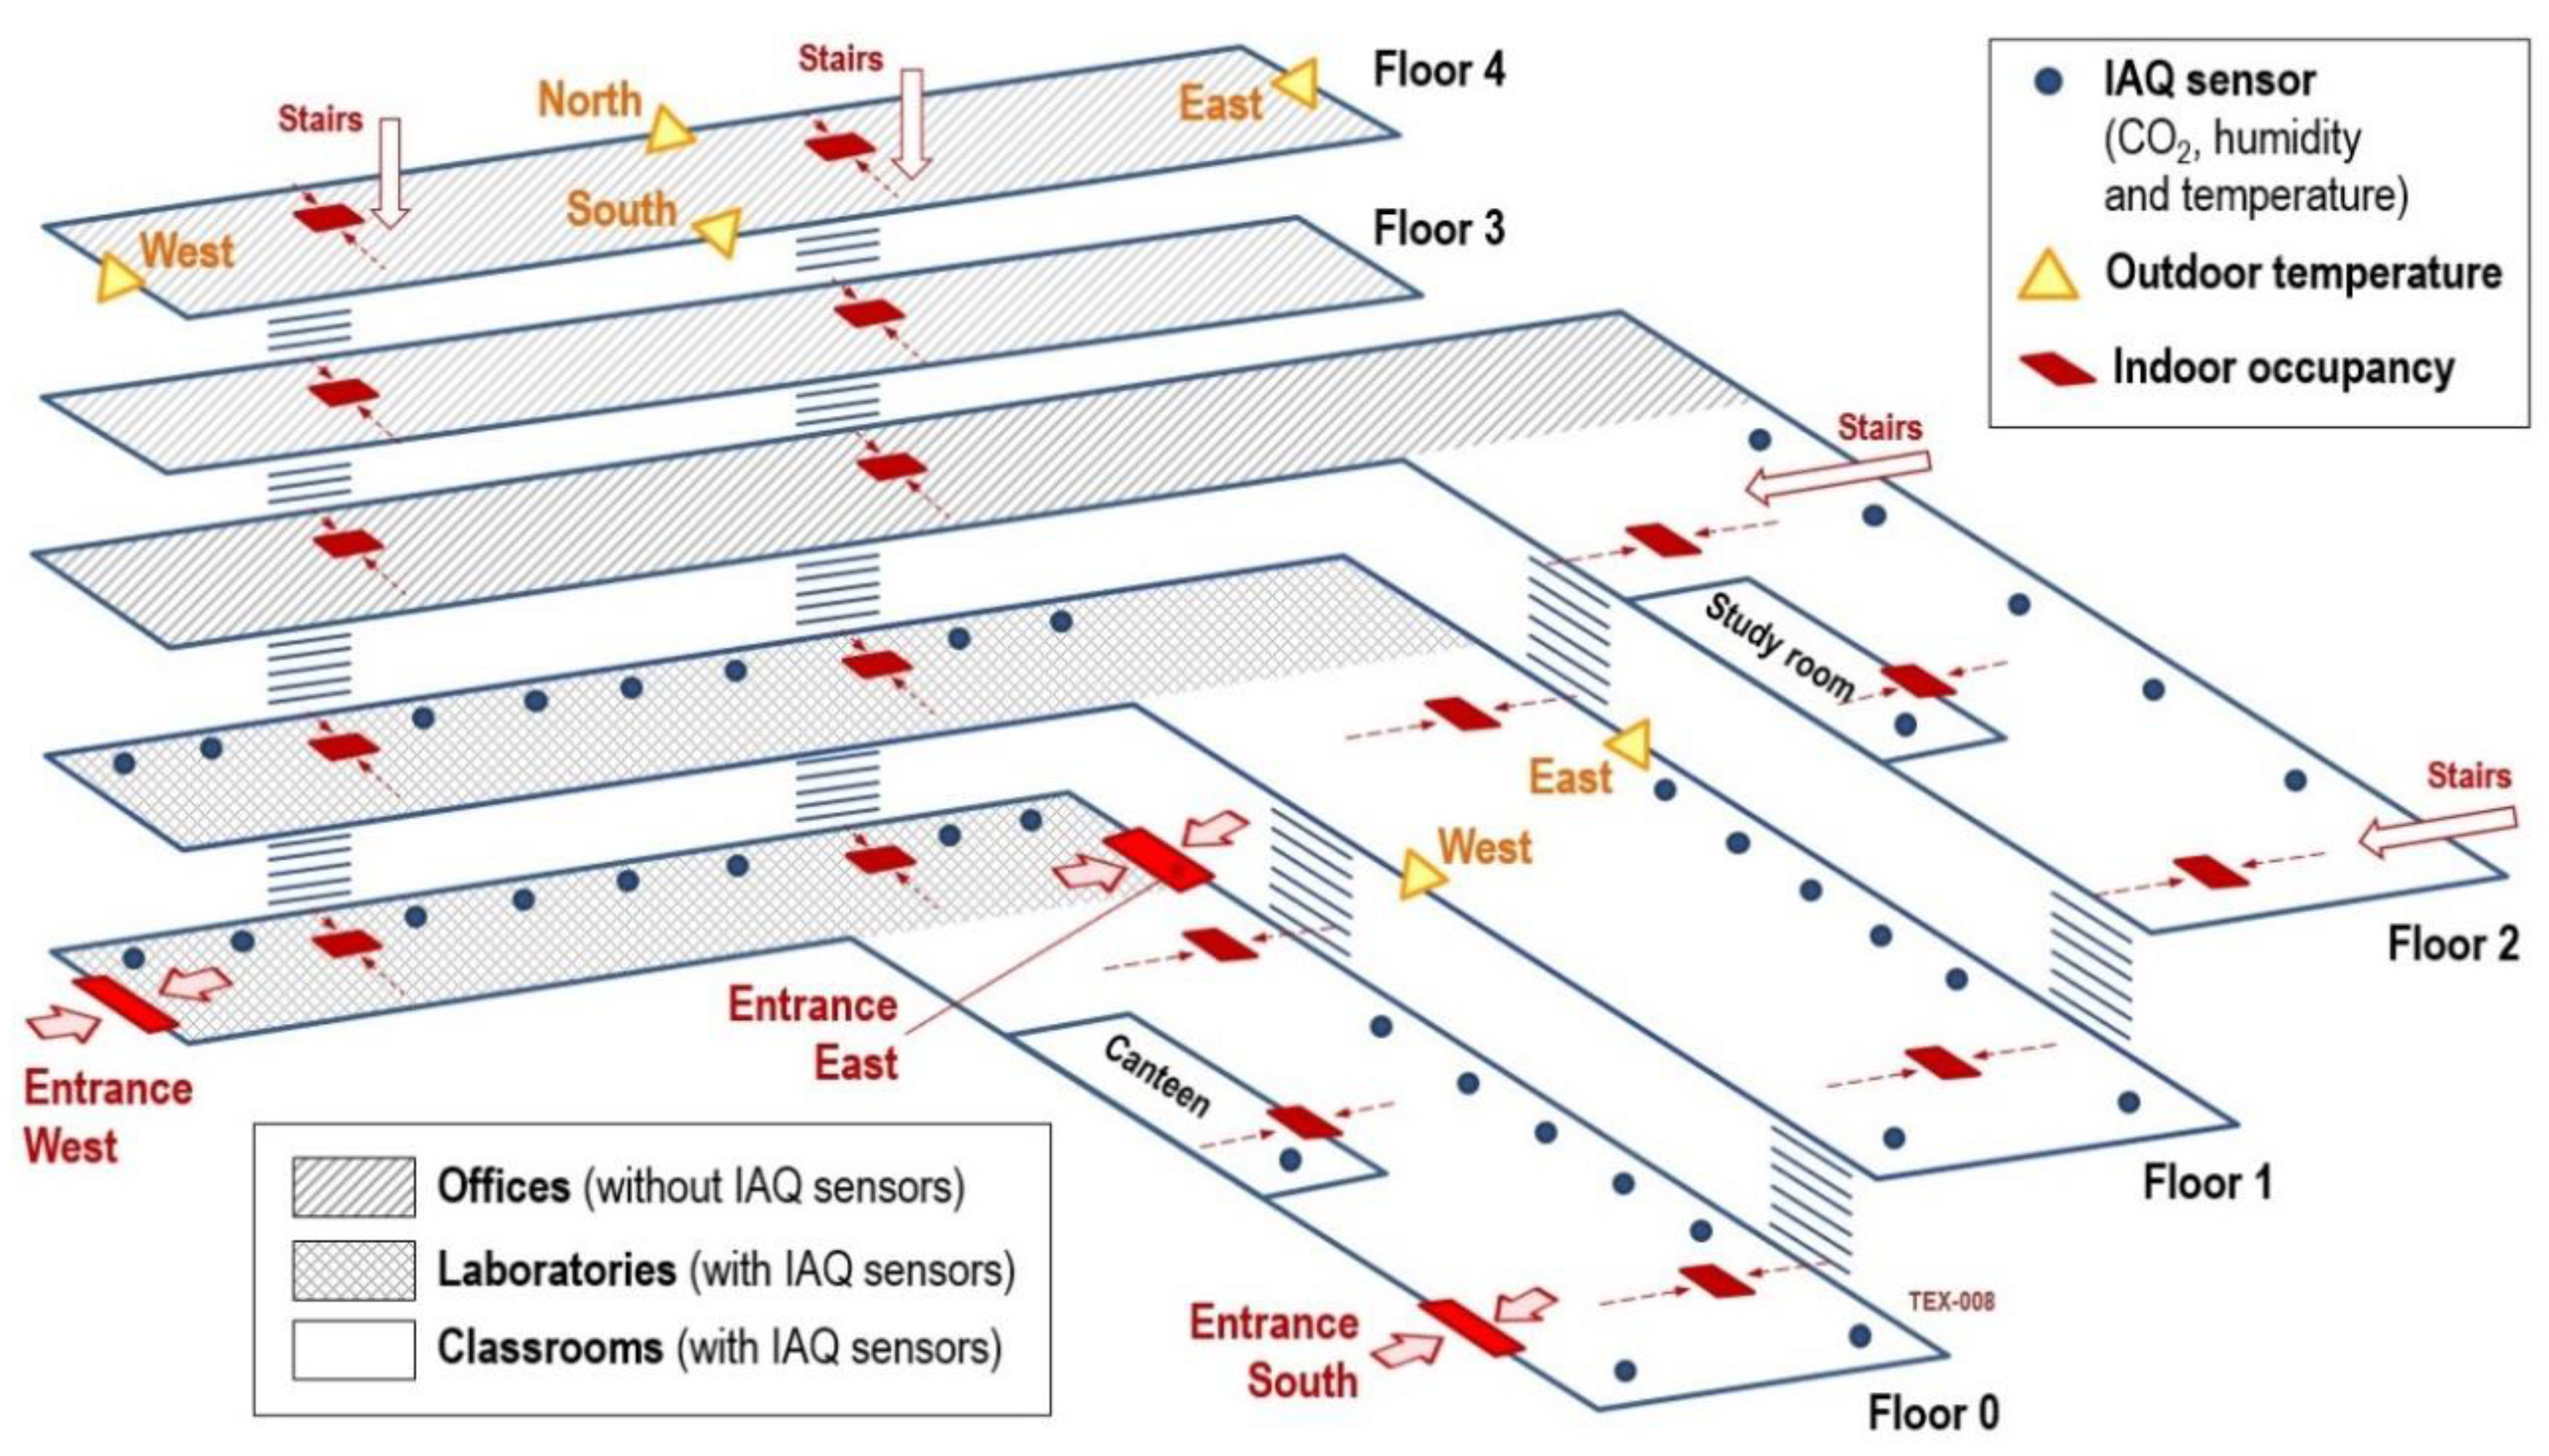
Figure 5.
Average temperature evolution each day of the week.
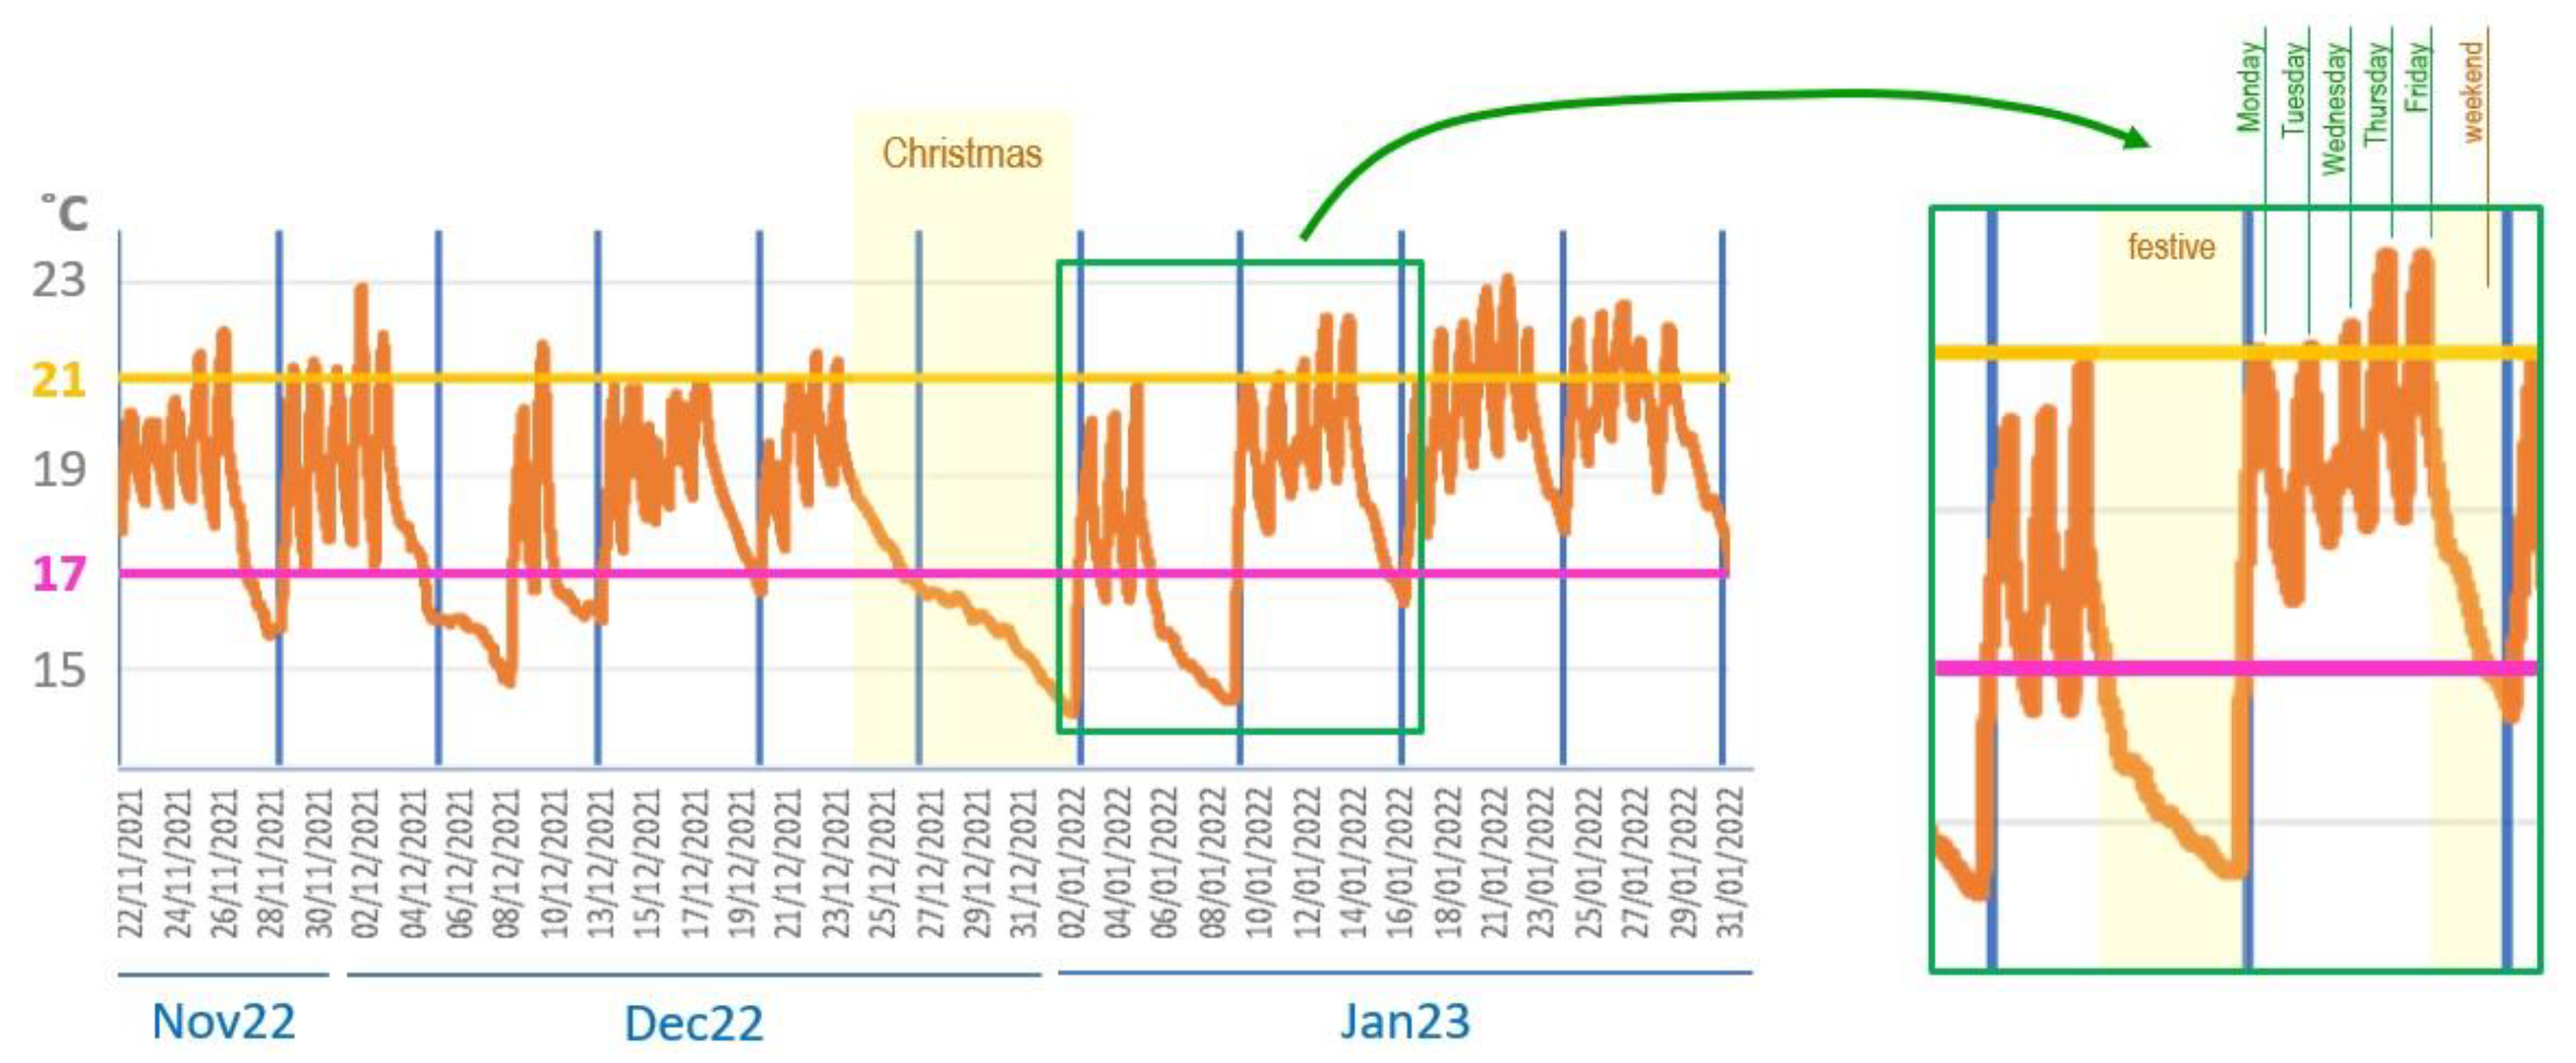
Figure 6.
Detail of instant temperatures in several representative classrooms during a weekend.
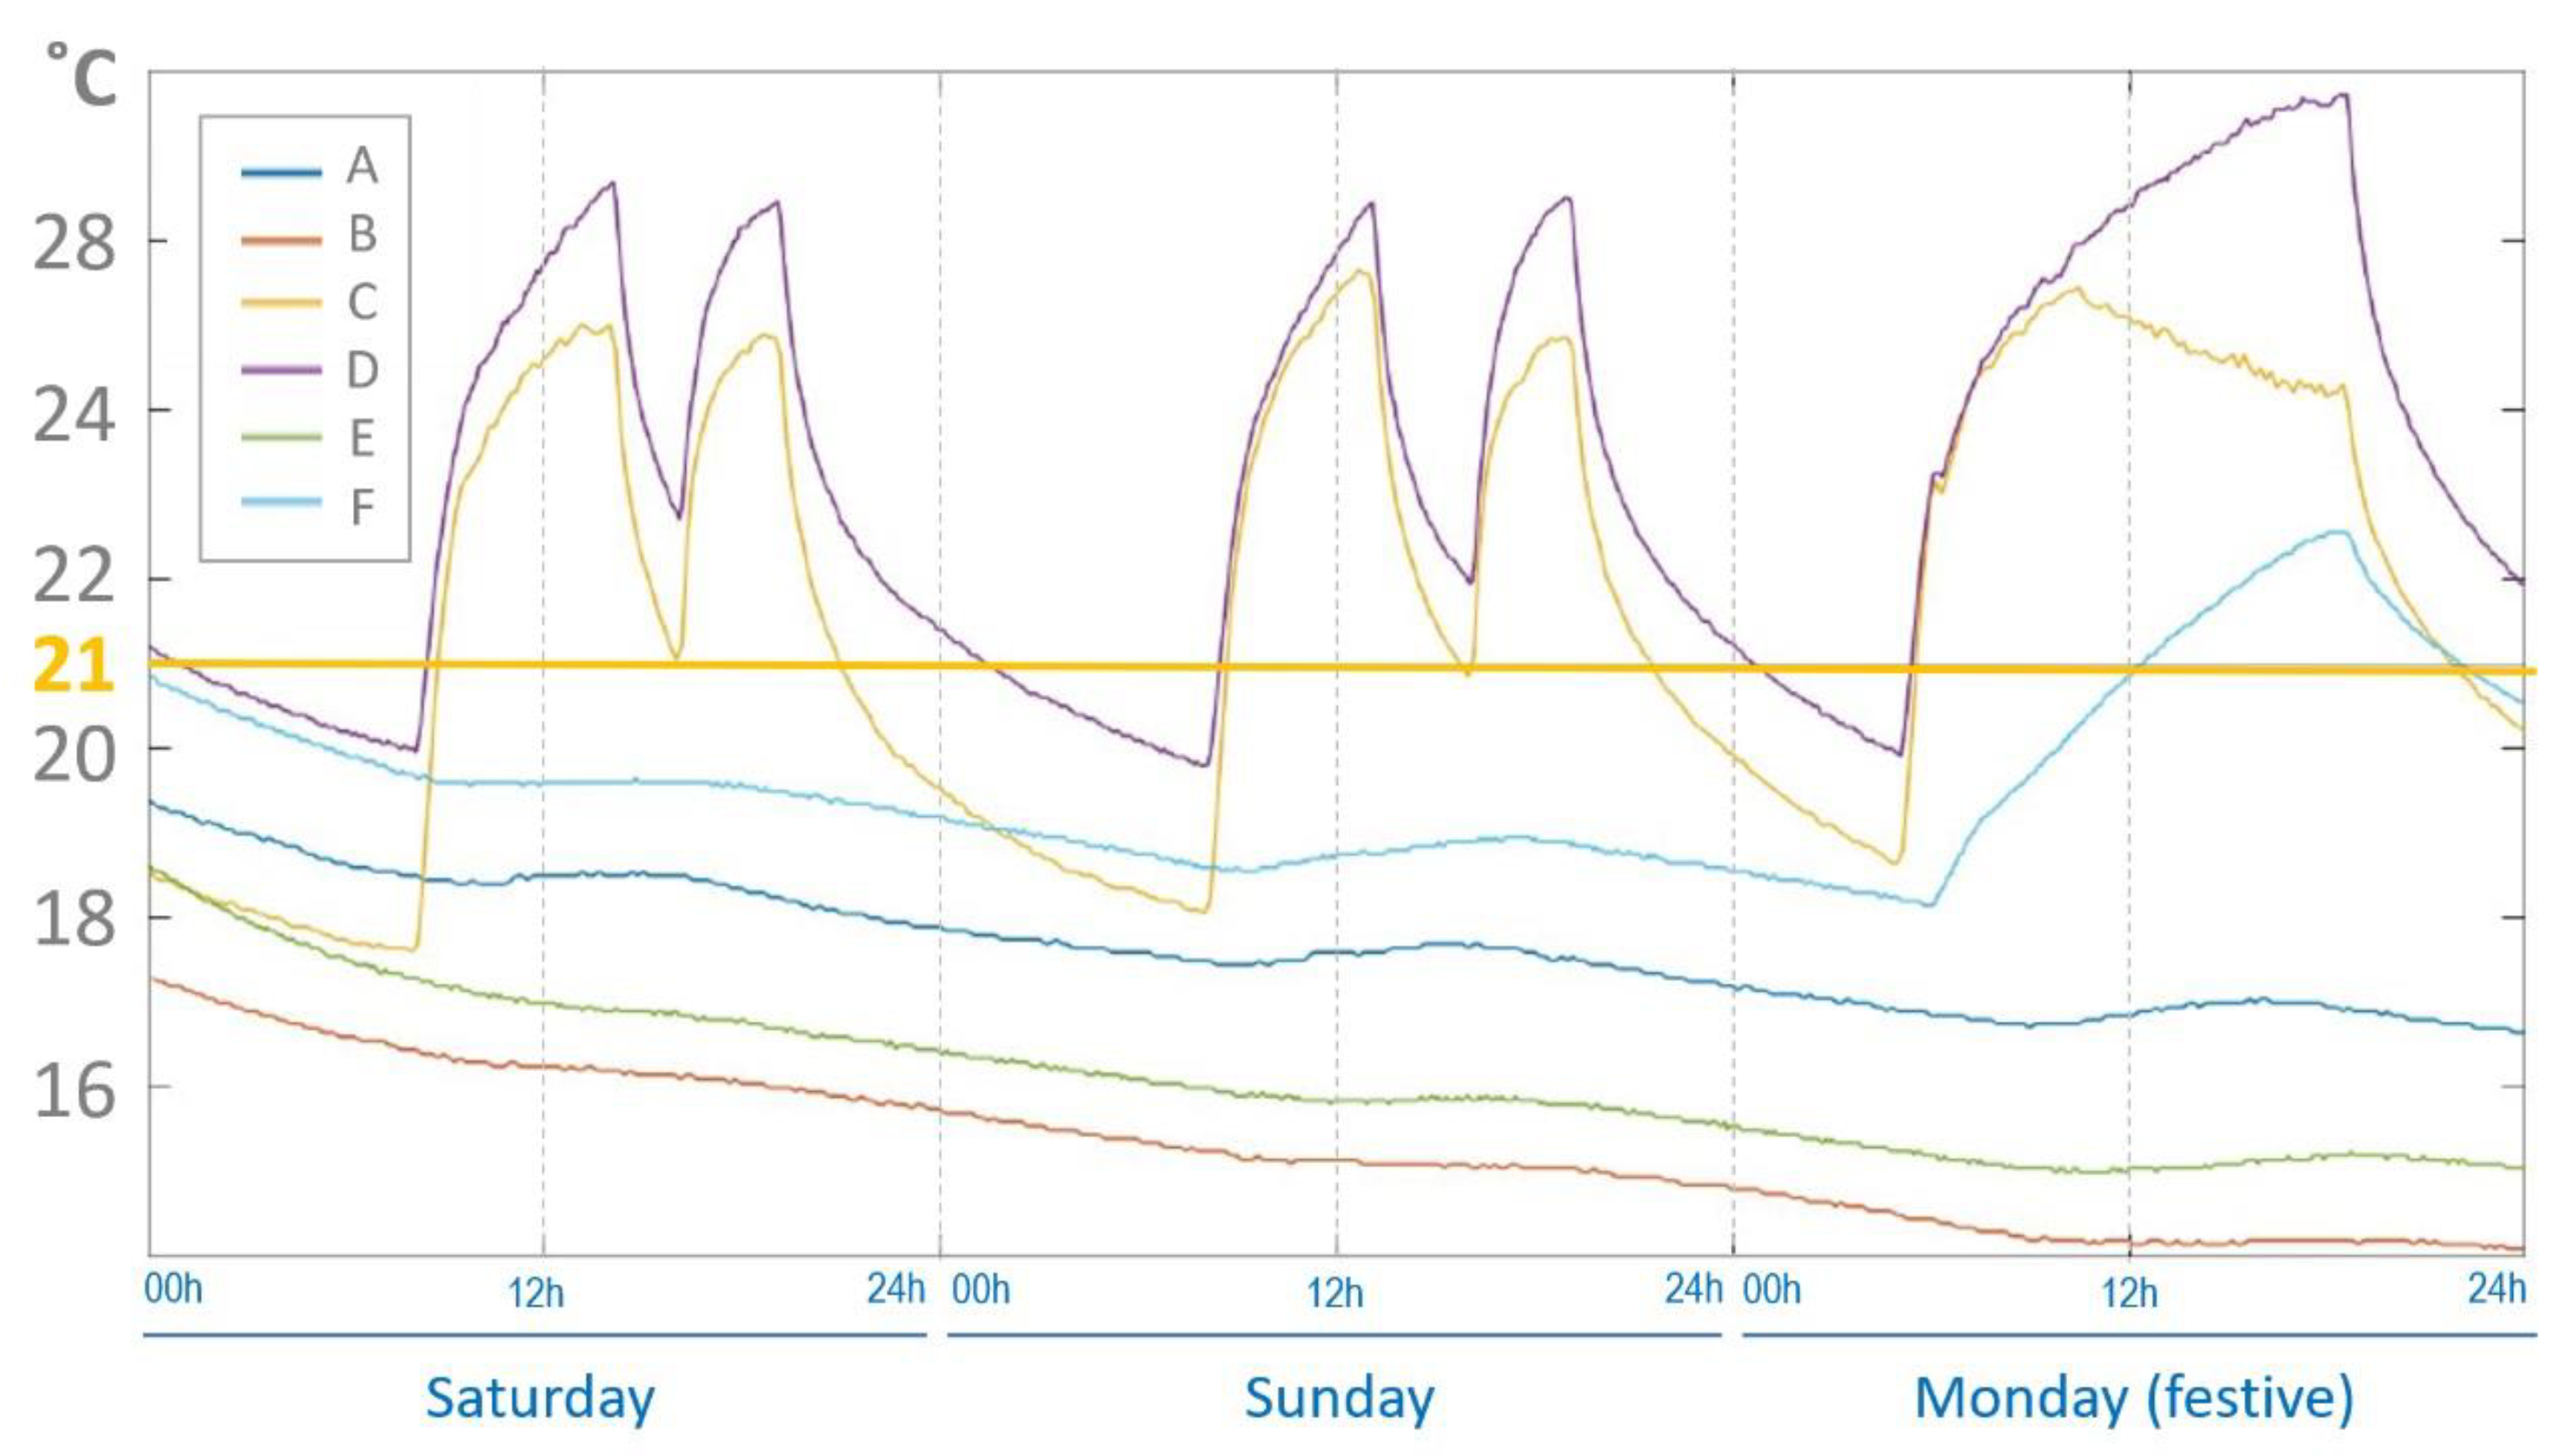
Figure 7.
Average CO2 levels in the university campus in fall semester.
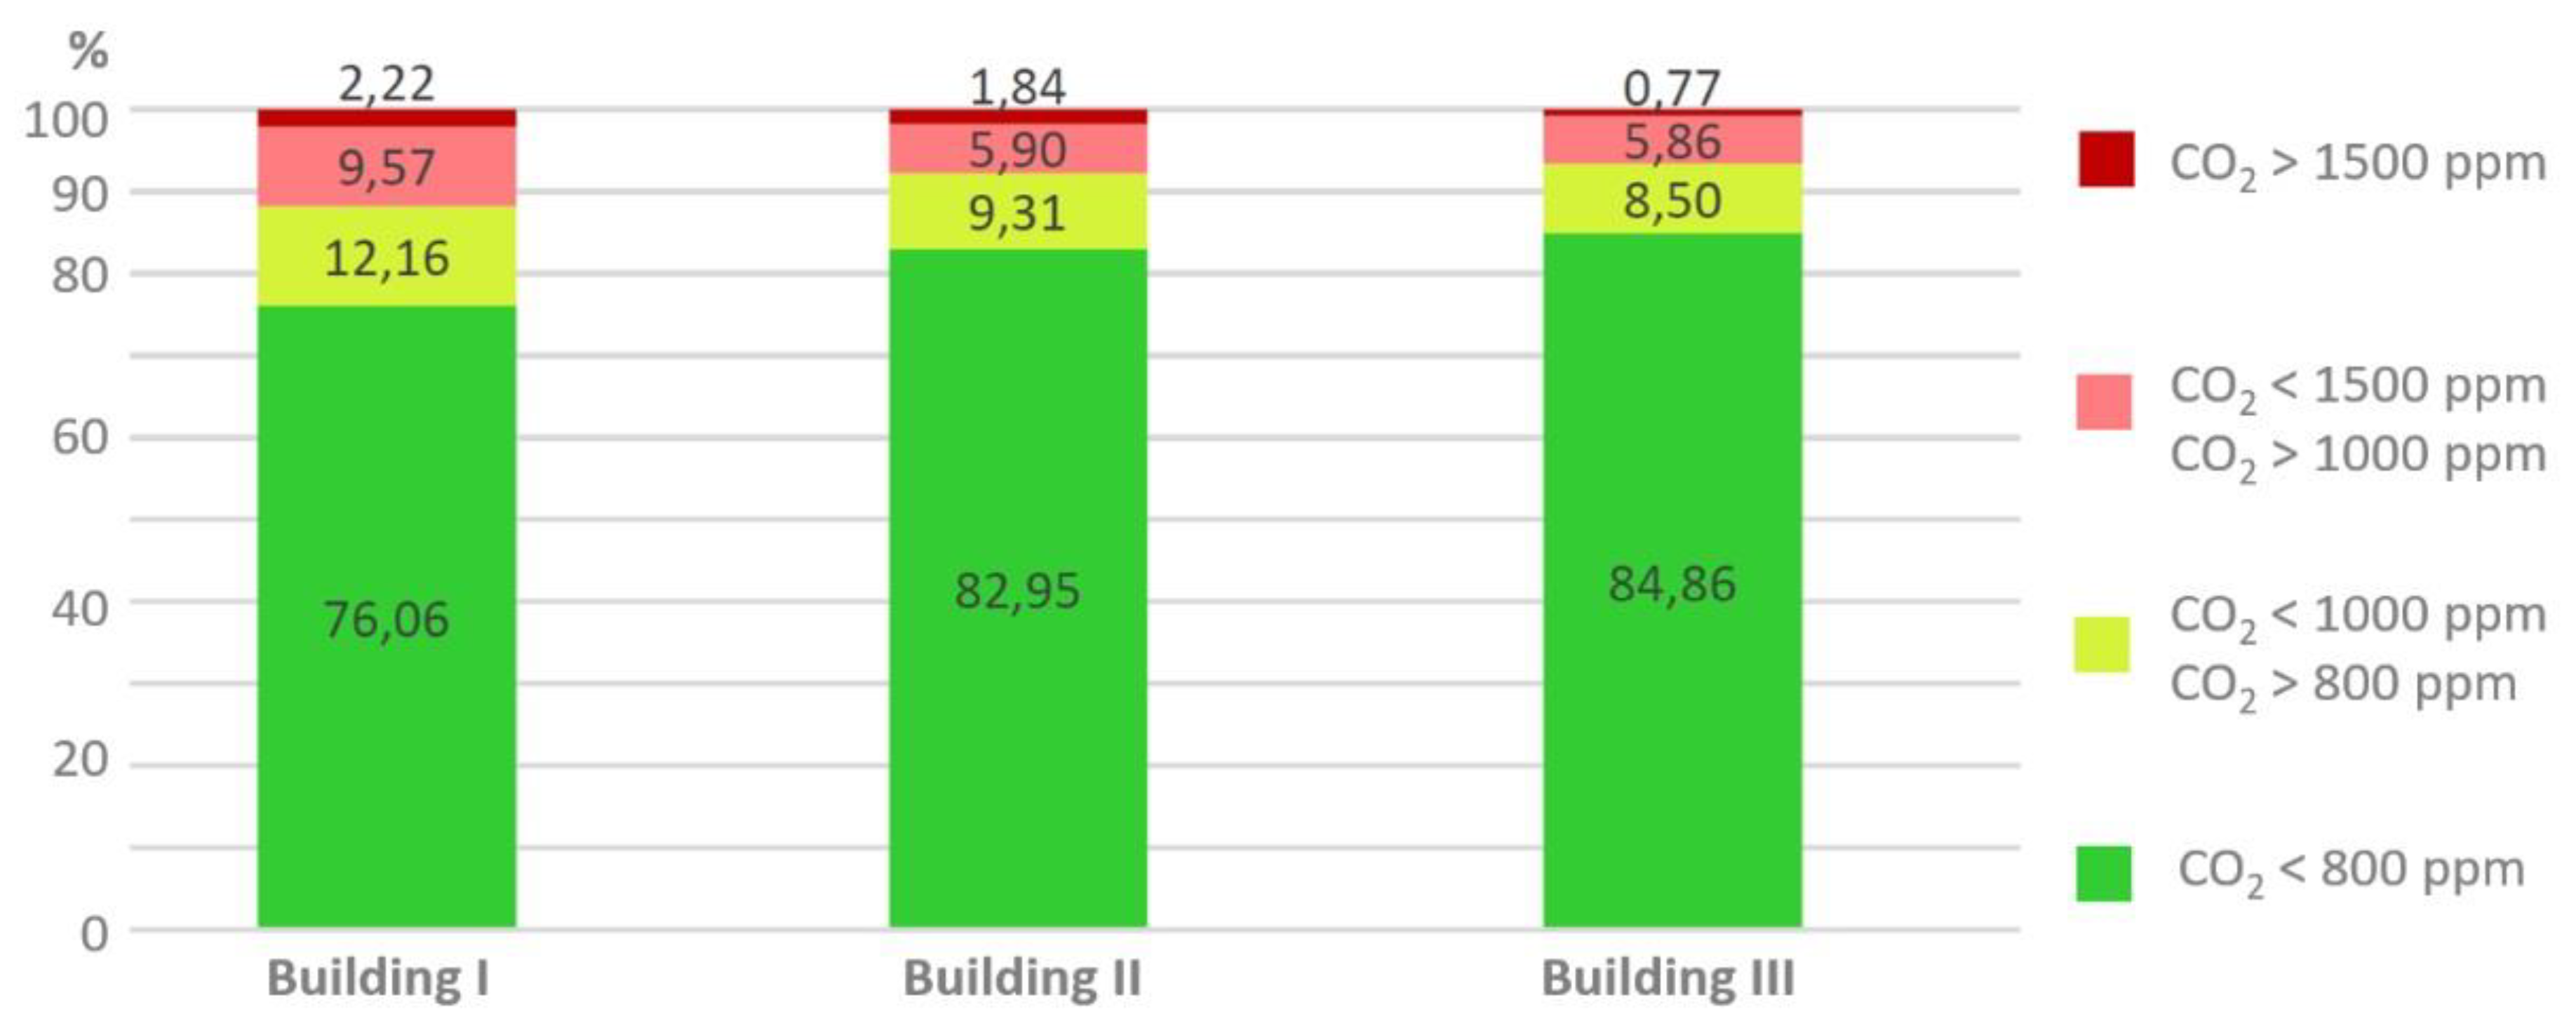
Figure 8.
Average CO2 (left) and maximum CO2 (rights) in representative spaces.
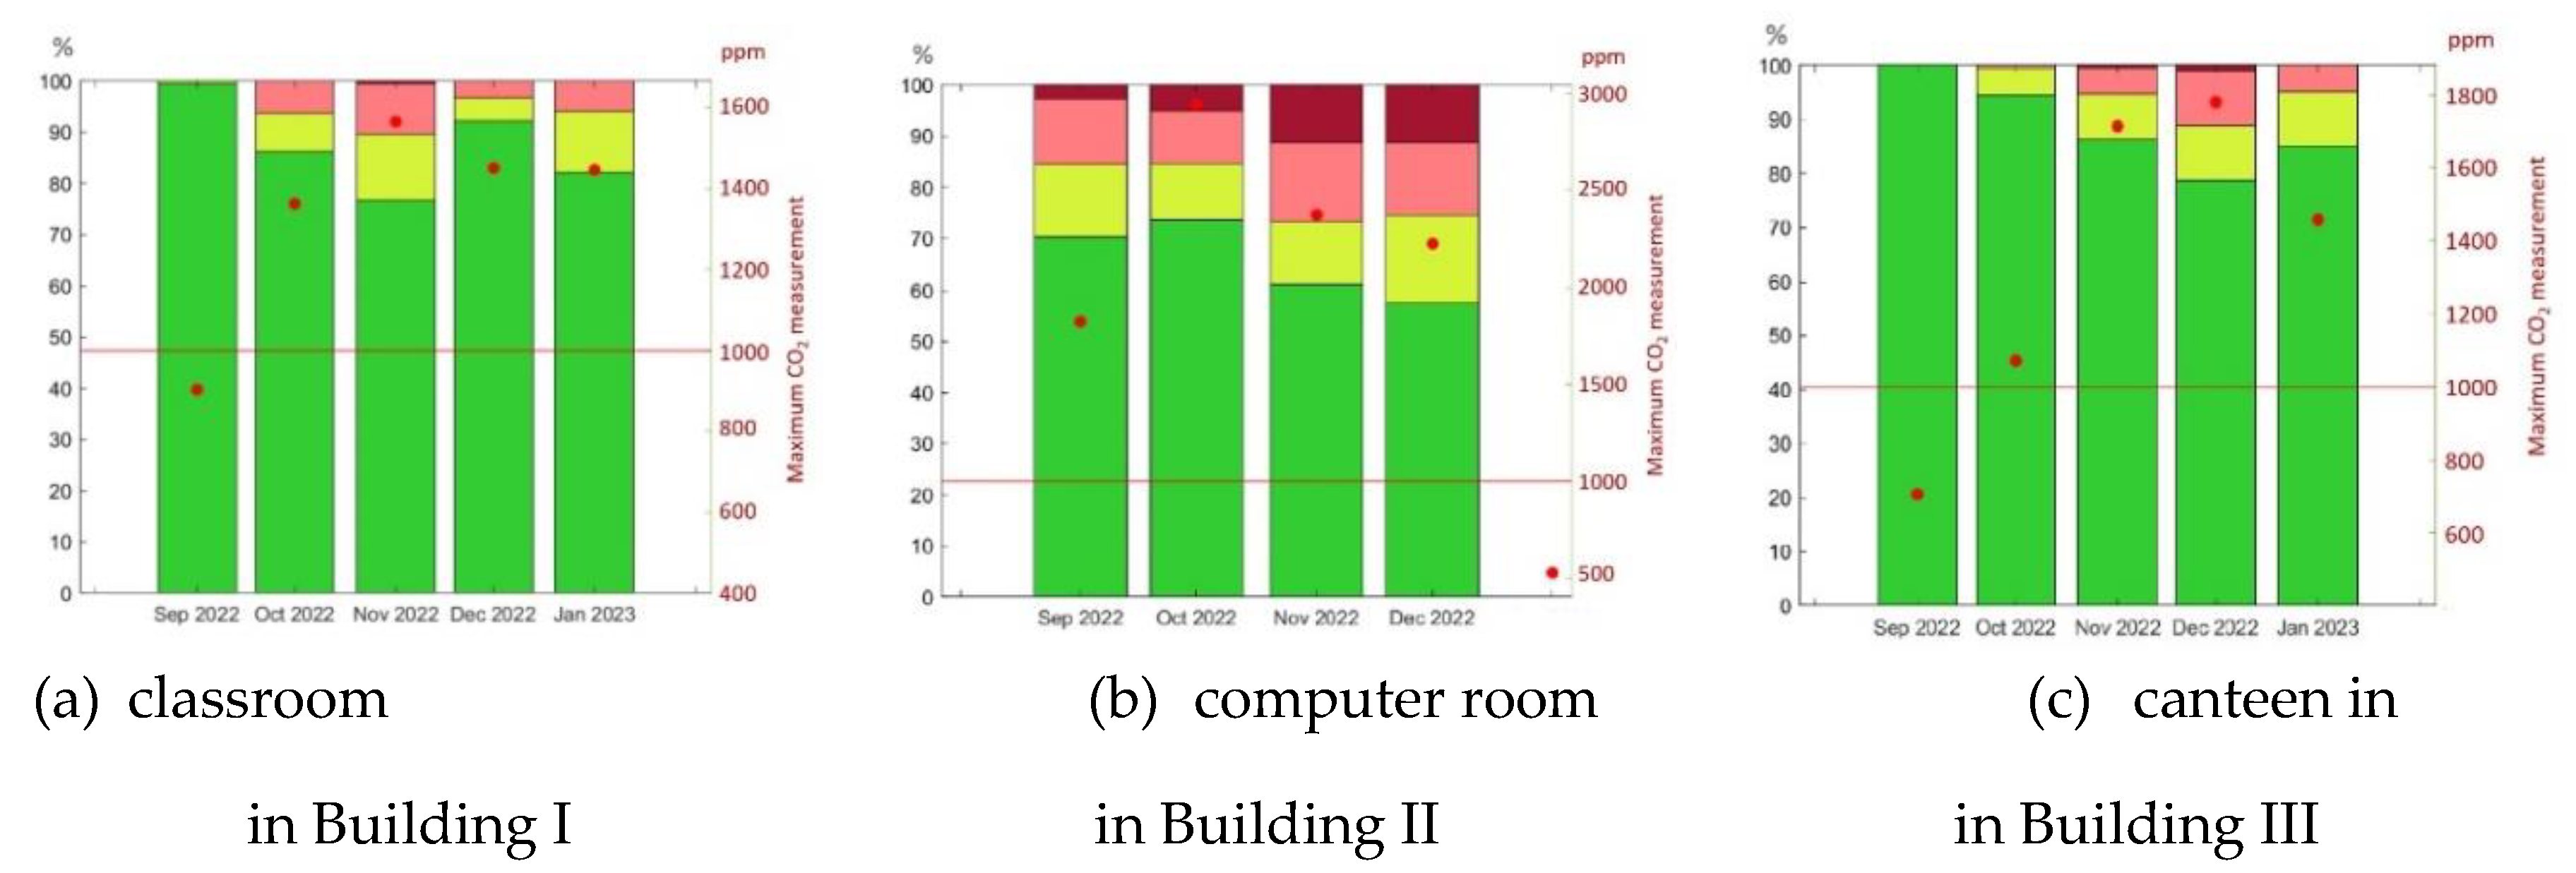
Figure 9.
Methodologies for characterizing spaces regarding CO2 and occupancy.
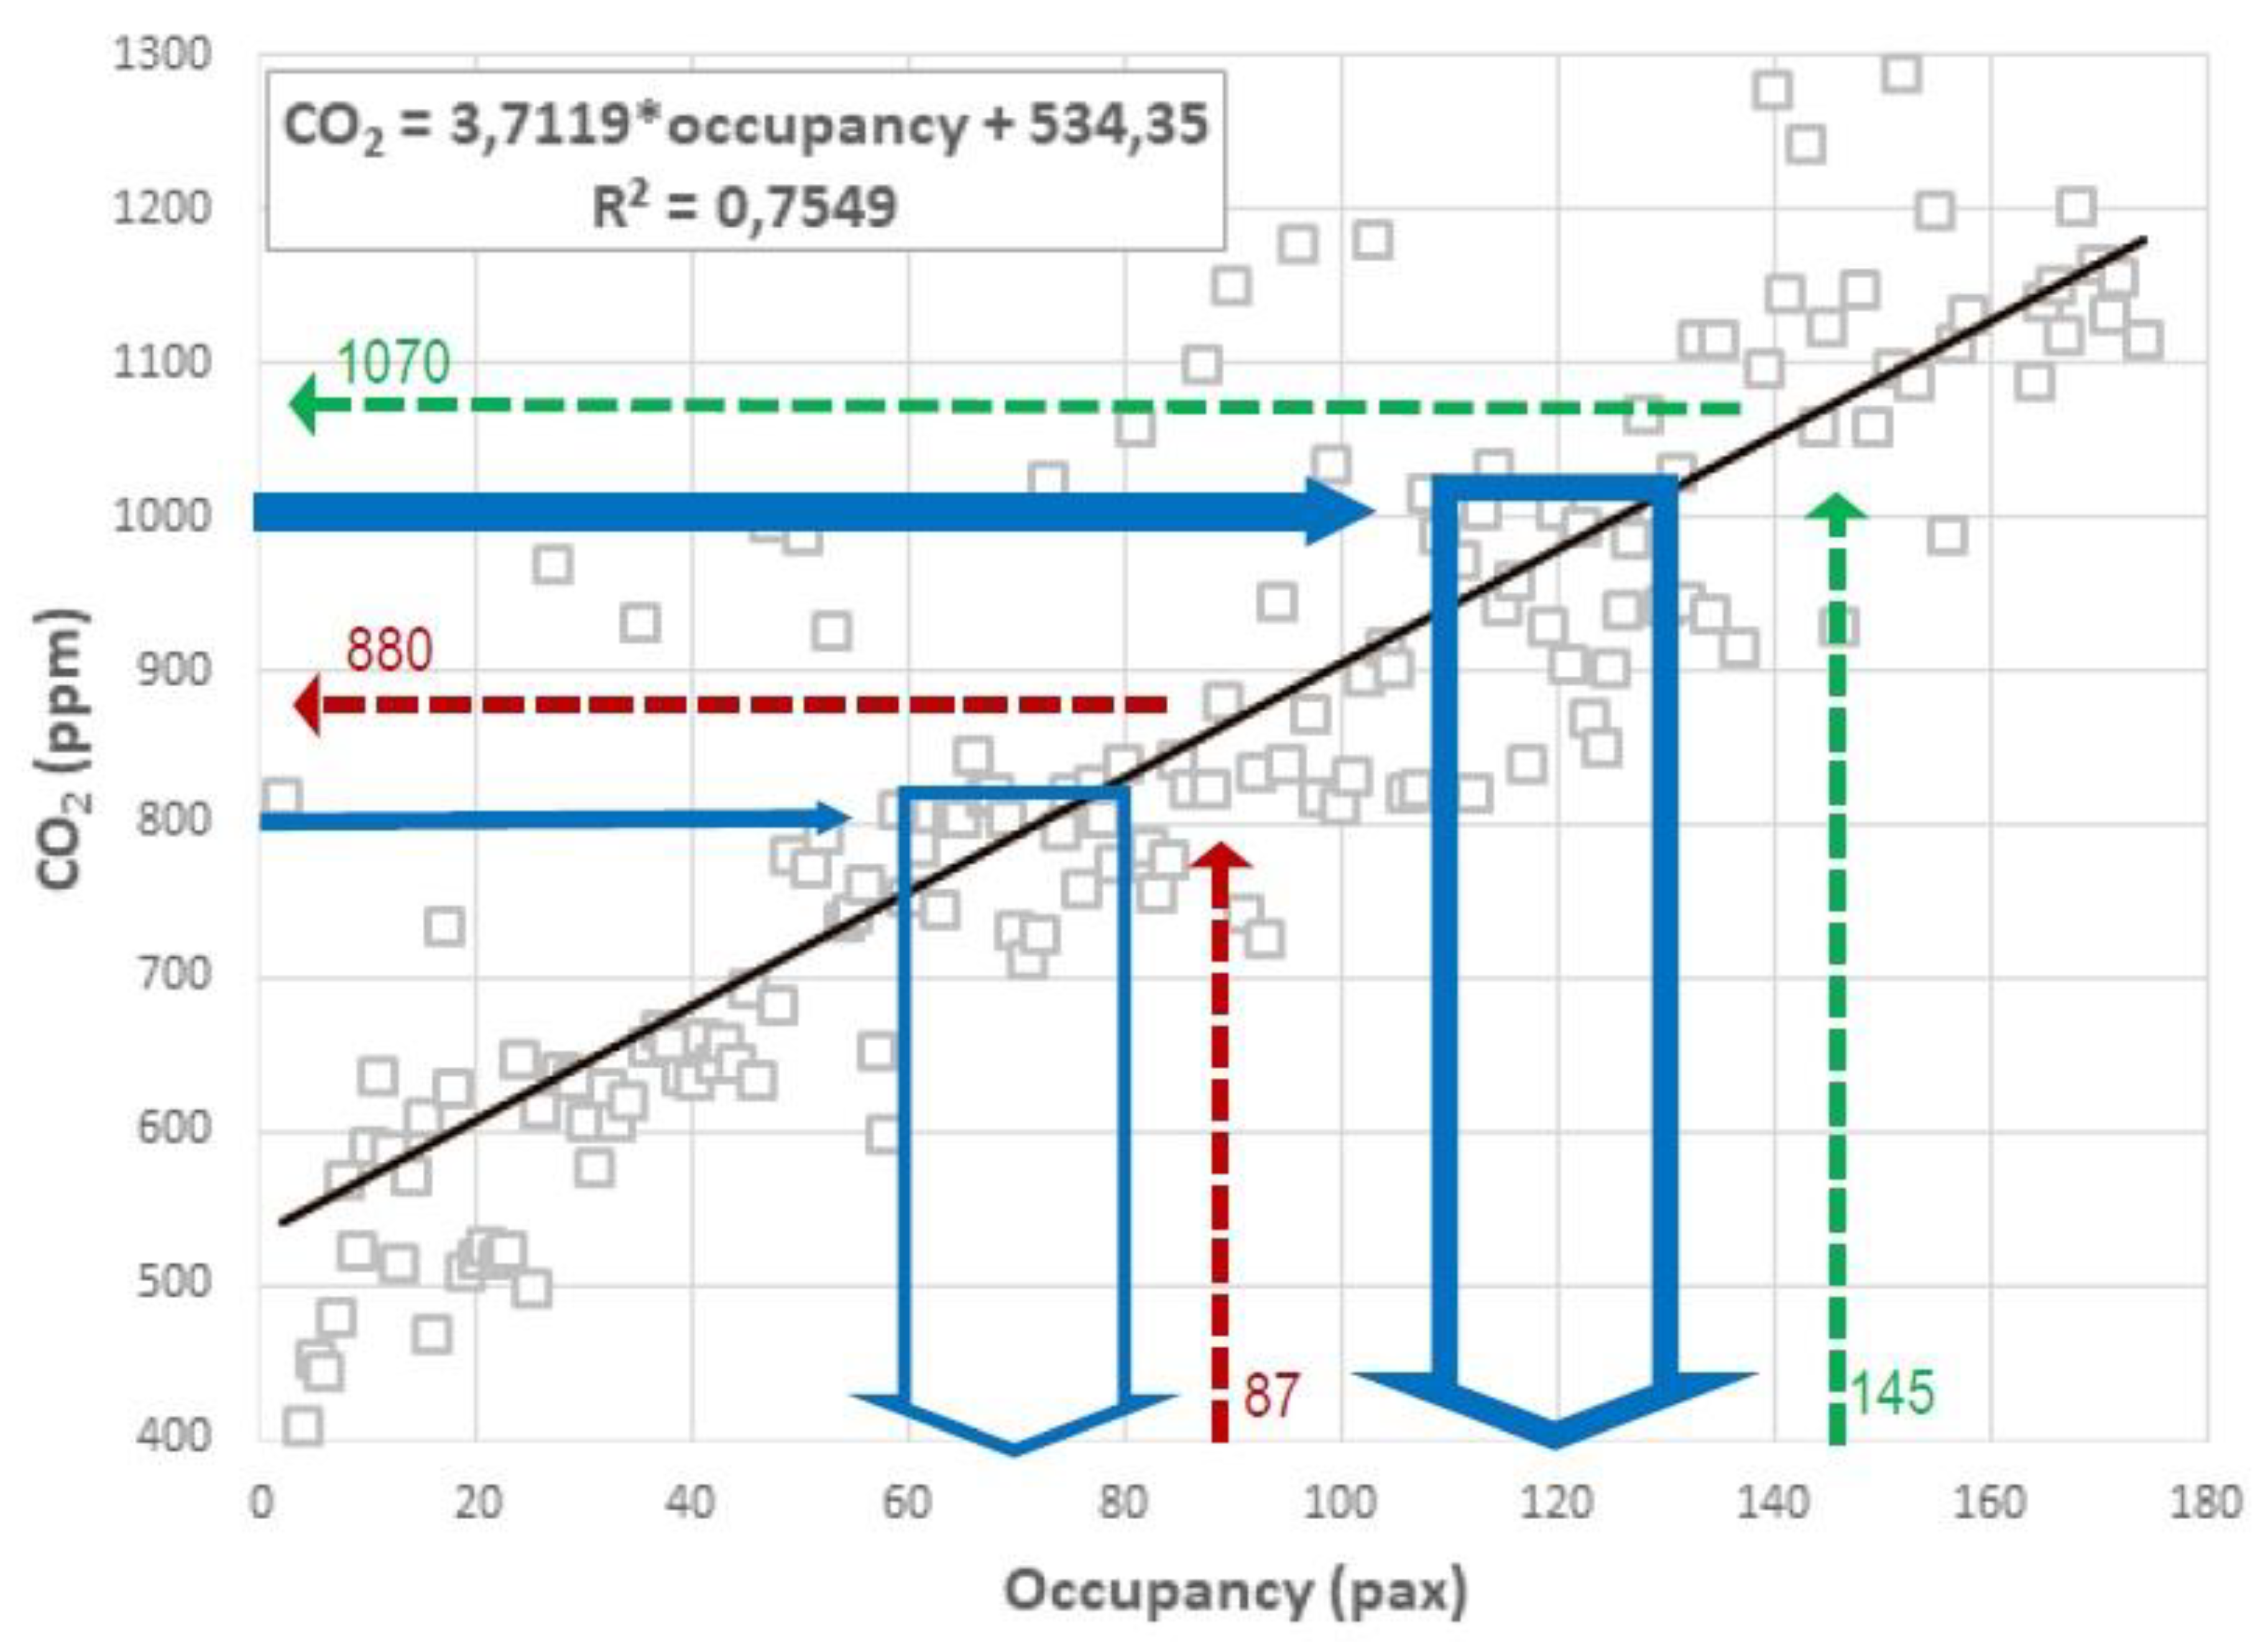
Figure 10.
Neural network results for CO2 and temperature predictions.
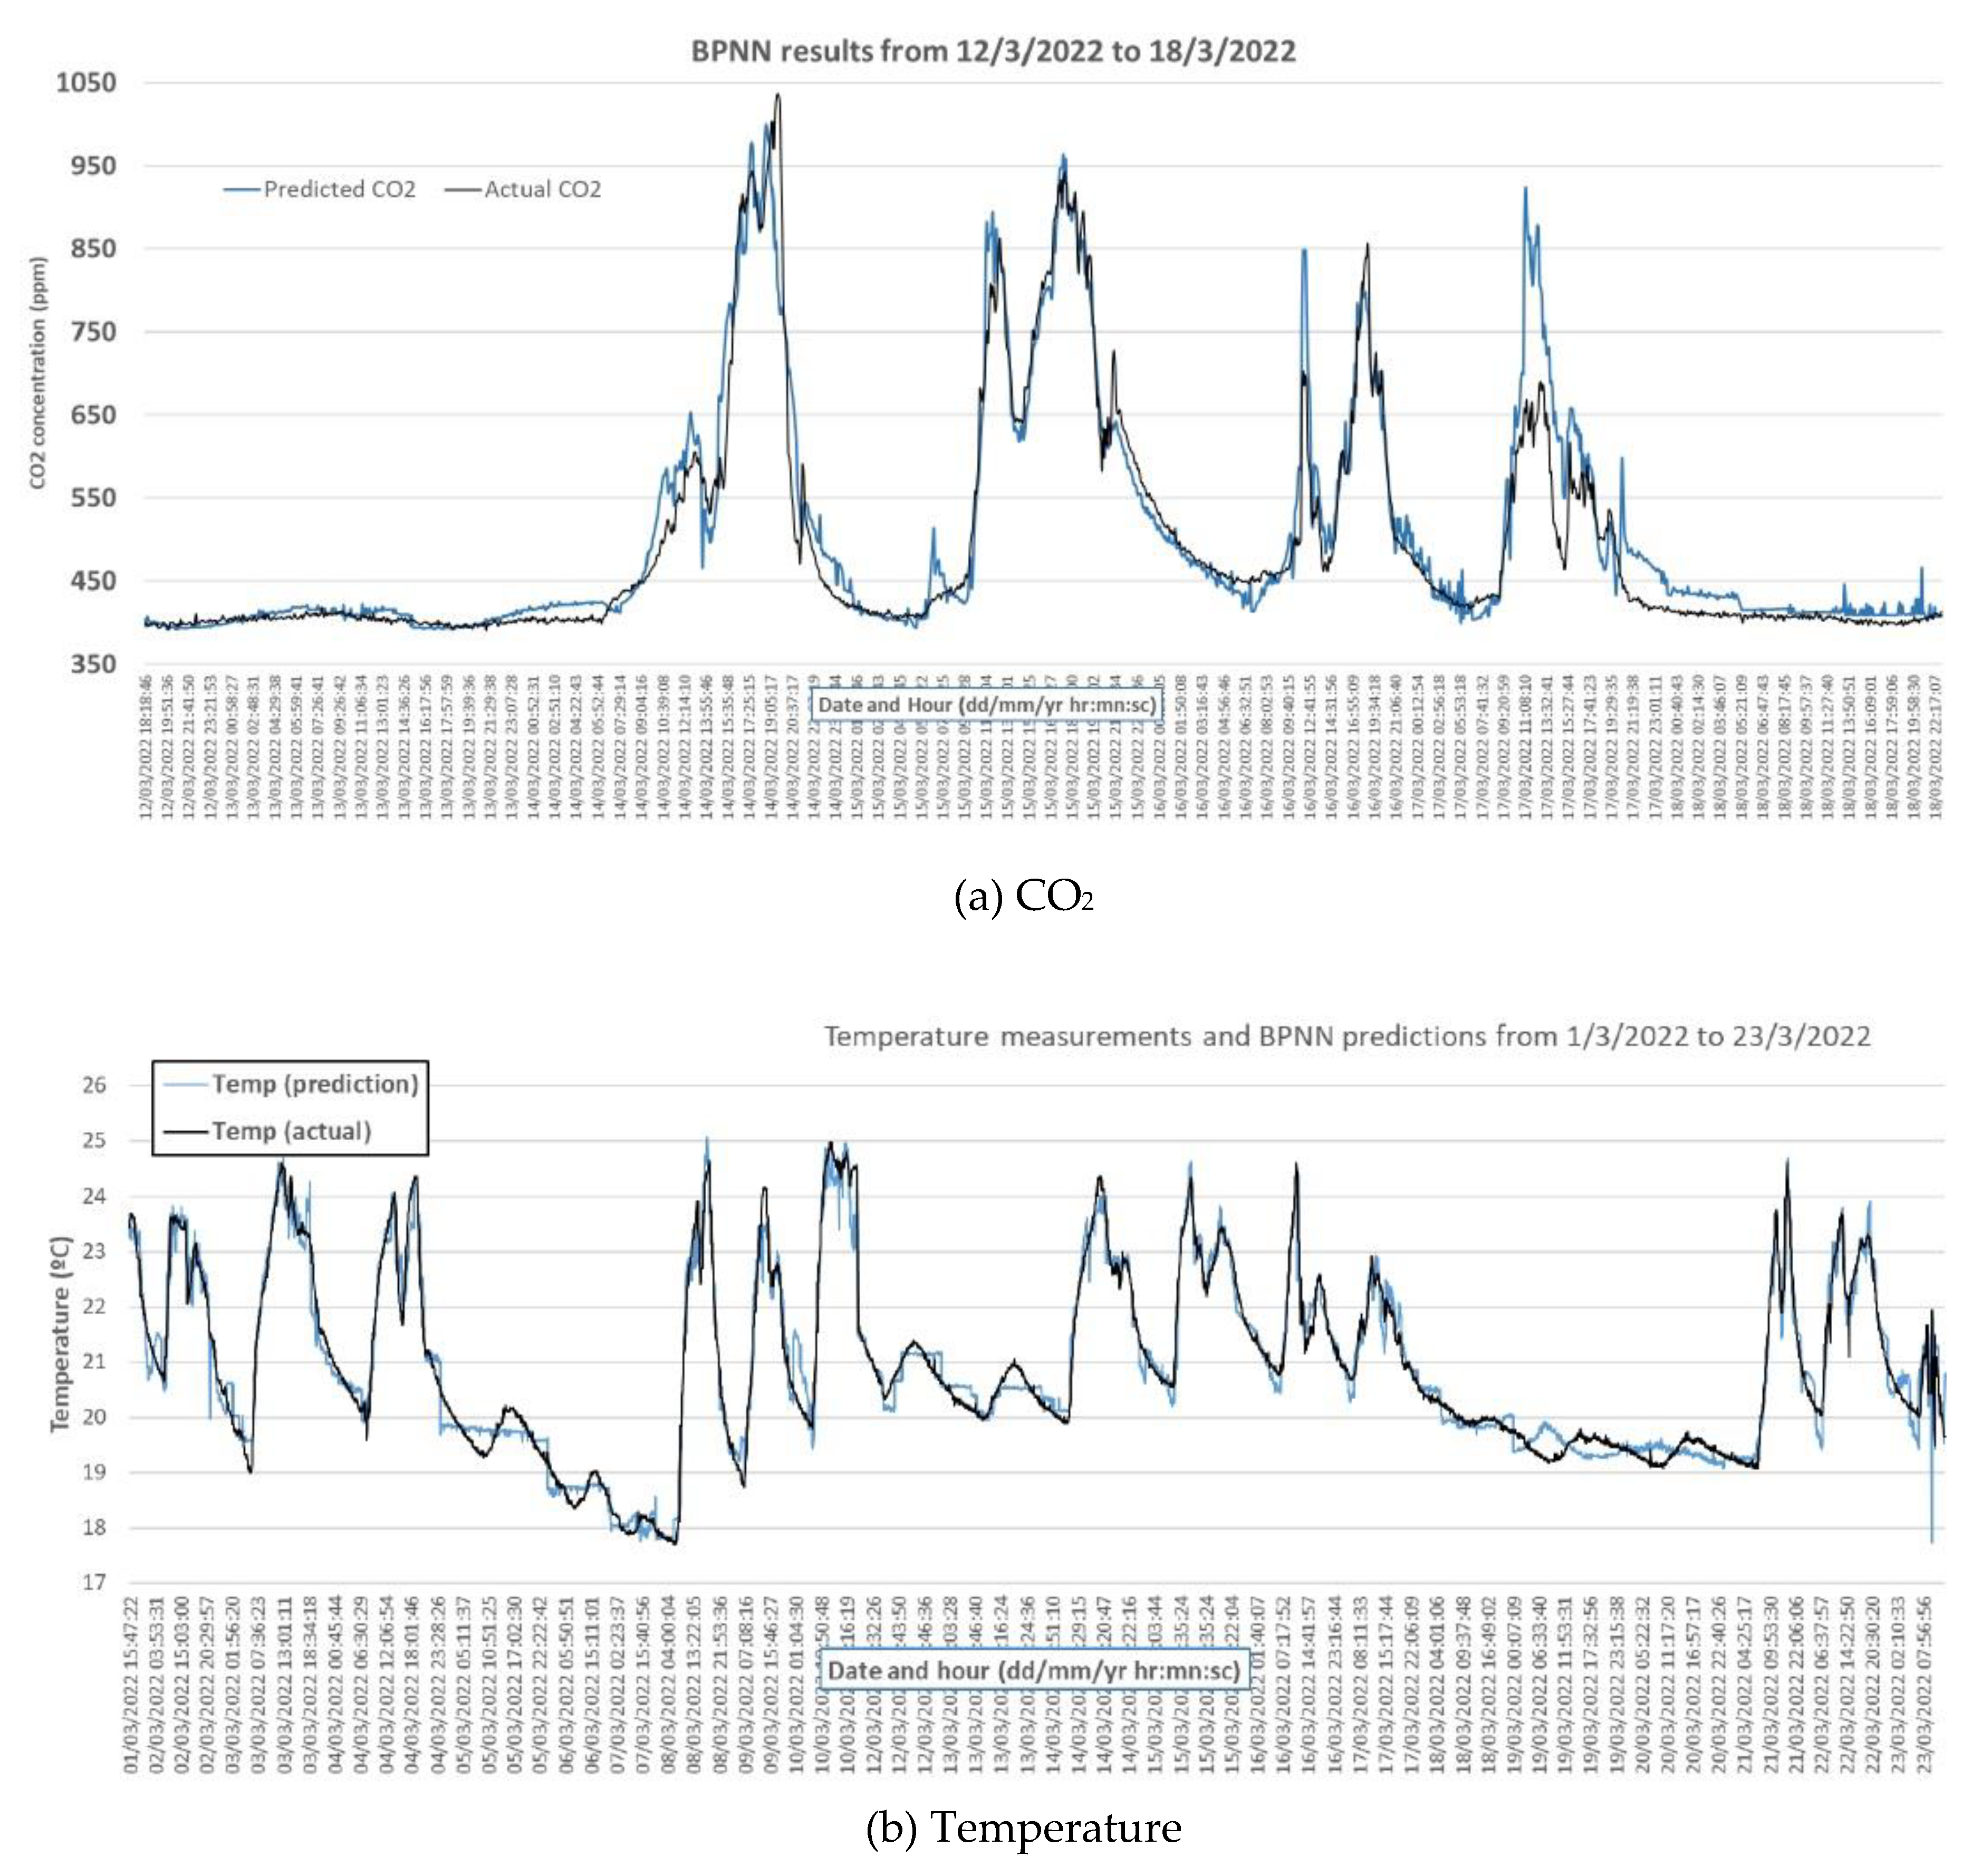

Table 1.
Distribution of dwellings (% of all dwellings) by period of construction, (national averages and capital city regions). Source: Eurostat [49].
Table 1.
Distribution of dwellings (% of all dwellings) by period of construction, (national averages and capital city regions). Source: Eurostat [49].
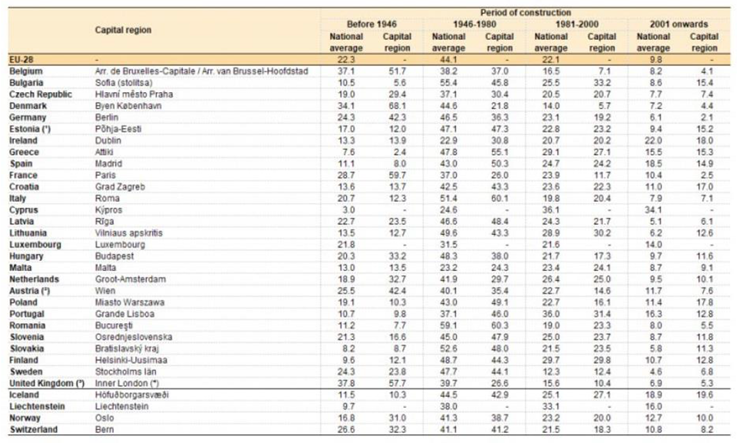
Table 2.
Scaling the built environment and its types of users to understand IoT as learning factory
| Scale (Level) | Stakeholders | Services for Users | IoT Functionalities |
|---|---|---|---|
| Space (personal) |
User | Knowledge of the environmental parameters (IAQ, temperature, humidity, occupancy) of specific spaces based on their activities, habits and preferences. | Automation based on user behavior patterns. Adjustment of HVAC systems to certain environmental parameters, energy prices, renewable energy production, etc. |
| Building (community) |
Architect | Design based on buildings behavior patterns according to each specific feature. | Smart design based on real data obtained from IoT monitoring, integrating passive and active building systems. |
| Engineer | Design of the most appropriate energy solution based on the behavior parameters of building and users and available energy sources. Choice of the best combination between on-site renewable energy generation systems, air condition needs, and type of HVAC solution. |
Real-time adaptation to the multiple and diverse situations that can occur within a building. |
|
| Neighborhood (intra-local) |
Urbanist | Appropriate solutions, for each specific situation, to propose the best energy strategy and/or energy rehabilitation of new/existing neighborhoods. | Continuous monitoring of neighborhoods to obtain data and behavior patterns with which to characterize local policies and automatic systems customized to the neighborhood scale. |
| City (local) |
Local institutions |
Urban policies and plans to implement adequate and customized solutions for each city. | Smart infrastructures. Smart environments. Smart governance. Smart cities. |
| Region (intra-national) |
Epidemiologist Doctor | Correlation of IAQ and environmental parameters with the spread of certain diseases. | Simulation and evaluation of different data-driven public health policies. |
| Country (national) |
National institutions |
Data from behavior patterns to develop global strategies of energy rehabilitation, electric production and CO2 management. | Simulation of scenarios and evaluation of the national strategies about the built environment with social implications. |
| Zone (inter-national) |
International institutions |
Data to implement global strategies for energy consumption based on the energy availability, social equality and climate change. | Simulation of scenarios and evaluation of the international strategies about the built environment with social implications. |
Table 3.
Network input, target and predicted data.
| Time (gmt+2) | CO2 (ppm) |
Temperature (˚C) |
Humidity (%) |
Occupancy (pax) |
Accumulated occupancy (pax) |
CO2 prediction (ppm) |
Temperature prediction (˚C) |
|---|---|---|---|---|---|---|---|
| 18:25:02 | 776 | 23,00 | 45 | 104 | 614 | 819 | 22,73 |
| 18:30:03 | 735 | 22,86 | 44 | 101 | 620 | 800 | 23,01 |
| 18:35:04 | 719 | 22,78 | 44 | 99 | 620 | 785 | 23,00 |
| 18:40:03 | 711 | 22,76 | 44 | 101 | 621 | 786 | 22,95 |
| 18:45:03 | 718 | 22,78 | 44 | 98 | 614 | 781 | 22,98 |
| 18:50:02 | 738 | 22,78 | 44 | 94 | 597 | 771 | 23,01 |
| 18:55:04 | 756 | 22,81 | 44 | 83 | 576 | 759 | 23,17 |
| 19:00:03 | 757 | 22,74 | 44 | 76 | 551 | 739 | 23,16 |
| 19:05:03 | 752 | 22,72 | 44 | 80 | 532 | 738 | 22,93 |
| 19:10:03 | 756 | 22,72 | 44 | 80 | 511 | 739 | 22,80 |
| 19:15:03 | 783 | 22,64 | 44 | 74 | 487 | 714 | 22,86 |
| 19:20:03 | 797 | 22,64 | 44 | 74 | 467 | 713 | 22,77 |
| 19:25:03 | 784 | 22,58 | 45 | 82 | 466 | 709 | 22,29 |
| 19:30:04 | 775 | 22,56 | 45 | 85 | 475 | 714 | 22,25 |
Disclaimer/Publisher’s Note: The statements, opinions and data contained in all publications are solely those of the individual author(s) and contributor(s) and not of MDPI and/or the editor(s). MDPI and/or the editor(s) disclaim responsibility for any injury to people or property resulting from any ideas, methods, instructions or products referred to in the content. |
© 2023 by the authors. Licensee MDPI, Basel, Switzerland. This article is an open access article distributed under the terms and conditions of the Creative Commons Attribution (CC BY) license (http://creativecommons.org/licenses/by/4.0/).
Copyright: This open access article is published under a Creative Commons CC BY 4.0 license, which permit the free download, distribution, and reuse, provided that the author and preprint are cited in any reuse.


