
Submitted:
28 June 2023
Posted:
30 June 2023
You are already at the latest version
Abstract
The astroclimatic conditions characterize the quality of astronomical site. The Terscol Observatory (coordinates 430 16 ‘29’’N, 420 30’ 03’’E) was founded over 42 years ago in 1980. The paper presents the results of analysis of long-term variations (1980-2022) of astroclimatic parameters as total cloud cover, precipitable water vapor, and wind speed at 200mbar level above the Terscol Observatory using ECMWF-ERA5 atmospheric reanalysis data. Long-term trends of the astroclimatic parameters are study statistical significantly trend analysis method using Mann–Kendall and Sen’s slope to estimate the magnitude of the changes. In result the site show not significant decreases of 200-hPa wind speed and increases of precipitable water vapor, but significant (99 per cent confidence level) long-term changes of total cover cloud above the Terscol Observatory.
Keywords:
astroclimate
; reanalyze
; telescope
; water-vapor content
1. Introduction
Atmosphere of Earth is a major challenge for the quality of observations in ground-based astronomy. The study of the atmosphere above observing sites are important for observation planning, instrument optimization, adaptive optics development. Astroclimate is a set of atmospheric parameters that can affect astronomical observations [1]. These include such atmospheric parameters as, wind speed and turbulence distribution relevant to adaptive optics performance. Besides one of the main atmospheric characteristics is the amount of clear sky, which determines the scientific output capacity of the telescope. The both cloud coverage and water vapour content is the key characteristics determinate the fraction of photometric and spectroscopic nights. These critical parameters affected the scheduling and availability of astronomical instruments at large observatories.
The site characterization is an essential task not only for the installation of new observatories, but also for the operations of already working telescopes. One of the aspects dealing with astronomical site characterization is the establishment of the long period behavior of atmospheric conditions [2]. The climate change became a challenge for the scientific throughput of ground-based astronomical observatory, for example Paranal in Chili [3]. The long-term change of astroclimatic parameters directly impacted on astronomical observations. A best astronomical observatory 40 years ago may not prove best observation in today’s climate. Since global climate change is an indisputable fact, it became necessary to study the influence of this change on each parameter of the astroclimate of the area. If such a factor is found, it will be necessary to quantify how much contributed to the alteration in the astroclimate. However this kind of atmospheric data is not often available at astronomical observatories. As an alternative, reanalysis products are used for performing atmospheric conditions analyses. Reanalysis combines the numerical model with observations through data assimilation. Meteorological reanalysis is useful for the characterization of existing astronomical observatories without atmospheric monitoring instrumentation. Long-time sets ERA-5 reanalysis with higher temporal and spatial resolution are now available from European Center for Medium-Range Weather Forecast [4]. Many astronomical observatories in the world have been detailed studies of atmospheric parameters using Reanalysis data [2,5,6,7]. The main advantage in the use of the reanalysis is the long term, uniform databases now available.
In the paper, we consider long-term trends of astroclimatic parameters: wind speed at 200-mbar level (V200) as parameter suitability for adaptive optics, precipitable water vapour (PWV), and total cloud cover (TCC) at the Terscol Observatory. The observatory was founded in 1980. Using data from the European Center for Medium-Range Weather forecast Reanalysis (ERA-5), we estimated the averaged the parameters from 1980 to 2022. Long-term trends of the parameters are study statistical significantly trend analysis method using Mann–Kendall and Sen’s slope to estimate the magnitude of the changes.
2. Materials and Methods
The Terscol Observatory (coordinates 430 16 ‘29′’N, 420 30′ 03′’E) located at near Mt. Terscol in the Northern Caucasus Mountains at the altitude of 3150 m above sea level. The 2- meter Zeiss astronomical telescope is main instrument of the observatory (Figure 1). Photometric, spectral and positional methods are used in the visible and IR ranges.
To estimate characteristics above the Terscol Observatory, we used data from Reanalysis ERA-5 by the European Center for Medium-range Weather Forecast (ECMWF) [4]. ERA-5 is the latest generation dataset. The dataset combines the numerical weather model with observational data from satellites, aircraft measurements and ground-based monitoring. ERA-5 data are available with high spatial and time resolution. ERA5 is produced by the Copernicus Climate Change Service (C3S) at ECMWF. The ERA5 was generated utilizing 4D-Var data assimilation and model forecasts in CY41R2 of the ECMWF Integrated Forecast System (IFS) [4].
The trend TCC, PWV and climate variables V200 were analysed using the non-parametric Mann-Kendall test and Sen’s slope estimator. The Mann–Kendall (MK) trend analysis method is a non-parametric test method recommended by the World Meteorological Organization for time series analysis, and is widely used to identify trends in series of temperature, precipitation and other atmospheric variables. Its advantage is that it is not assume the data to be normally distributed [8].
The null hypothesis H0 for this test is that there is no trend, and the alternative hypothesis is that there Ha an upward trend or downward trend in the one-sided test. For the time series x1, .., xn, the MK Test uses the following test statistic:
Where n is the number of data points, xk and xj are the data values in the time series i and j ( j>k ), respectively, and sgn(xj – xk) is the sign function,
= 1 if xj-xk >0
Sgn (xj-xk) = 0 if xj-xk =0
= -1 if xj-xk <0
The variance of S is computed as
where n is the number of data points, g is the number of tied groups in the data set, the summation sign (Σ) indicates the summation over all tied groups, and tp is the number of data points in the pth group. A tied group is a set of sample data that have the same value. In cases where the sample size n >30, the standard normal test statistic Z is computed using
Z = 0 if S=0
Positive values of Z indicate increasing trends, while negative Z values show decreasing trends. Testing trends is performed at the specific α significance level. When |Z| >|Z1-α/2|, the null hypothesis is rejected, indicating that a significant trend exists in the time series. In this study, α= 0.05 , α= 0.01 and α= 0.005 was used.
The non-parametric Sen’s slope estimator test is used to calculate the magnitude of trends in the long-term temporal data. The following equation is used to estimate the slopes of all data value pairs (Qi):
for (1 ≤ i < j ≤ n), x- denotes the variable, n is the number of data, and i, j are indices, xj and xk are data values at time j and k (j > k), respectively. The positive Qi indicates an increasing trend, while the negative Qi values tell us that there is a negative trend in the temporal data. In the study the unit of Sen’s slope (Qi) is the slope magnitude per year.
Qi= (xj−xk)/j-k
3. Results
3.1. Wind speed at level 200-hPa
The winds speed at the pressure level of 200 hPa (V200) have been suggested that the parameter as suitability of an astronomical site for adaptive optics [9]. Adaptive optics system need for correction of the atmospheric turbulence in near real time for provide an angular resolution close to the theoretical diffraction limit of the telescope. Deformable mirror is used for correction in adaptive optical systems of telescope. In results adaptive optics operation is perform best observation of astronomical objects at the site. The correlation between V200 and seeing is found for astronomical observatories using reanalysis data [2,5,6,7].
Besides the wind at the pressure level of 200 hPa is causing a so-called ‘wind-driven halo’ - where atmospheric turbulence conditions vary so quickly, the telescope’s control system can’t correct for them [10]. In results this limits the contrast capabilities of the telescope. The time lag between the analysis of the atmospheric turbulence and its correction by a deformable mirror creates a wind-driven halo. This phenomenon appears when atmospheric turbulence conditions vary faster than the telescope’s control system can correct them. The effect leads to a tenfold reduction in contrast. This limits the contrast capabilities of the instrument and could potentially limit exoplanet studies.
We therefore looked at the evolution of the meteorological variable- wind speed at 200 mbar above the Terscol observatory (Figure 2). On the yearly average we see longer trends.
Results indicated yearly fluctuations trending to decrease wind speed at level 200hPa from 1980 to 2022 above the Terscol Observatory. Besides with wind speeds higher than 25 m s–1 and is primarily responsible for the wind-driven halo as indicated in [10]. We note that the value wind speed V200 is less that 25m/s above the Terscol Observatory. Additionally there is significant interannual variability in V200.
3.2 Precipitable Water Vapor
Water vapour in the atmosphere is the main source of the atmospheric opacity and its value plays a critical role in observations done with instruments working at from the radio wavelengths to infrared regimes on ground-based telescopes. The quantitative classification based on precipitable water vapor (PWV) for characterized by astronomical observatory suitable for IR observation as following: good or excellent, PWV <3mm; fail or mediocre 3mm< PWV<6mm; poor 6mm< PWV<10mm; extremely poor PWV>10mm. Note, that the requirements to adaptive optics are reduced in IR range. PWV decreases with height in atmosphere. Therefore high-mutants observatory prefer for IR-observations. Note, that PWV and its changes have relate to radiation balance, cloud formation and precipitation mechanism. Additionally PWV is an important indicator of global and regional climate changes.
The applicability of the reanalysis ERA5 for estimating the PWV above the Terscol Observatory based on comparison with GNNS measurements was evaluated previously [11]. Seasonal variations of PWV at the site are study also in [11]. The seasonal variation is typical for mid-latitude with higher value in summer period and lower in summer.
The long-time trend of PWV for all period 42 years at the Terscol Observatory is presented on Figure 3.
Figure 3 shows weak increasing trend in the PWV above the Terscol Observatory. The average annual value of PWV is 7.4 mm in 1980 and 7.5 mm in 2022. The increase in atmospheric water content leads to a reduction of the astronomical signal especially in IR-range.
3.3 Total Cloud Cover
The clear sky time fraction is one of the most important parameters of astronomical site to analyze because it has a fundamental impact on a variety of observational requirements in a wide range of wavelengths. The astronomical observation in IR and visible range is available when the sky is clear or little cloudiness. The duration of astronomical observations of celestial bodies directly depends on the quantity of cloudless time, making it one of the most crucial factors for an astronomical observatory’s operation. Besides cloud cover variability play an important role in climate via the Earth’s radiative energy balance.
The Figure 4 presents the long-time trend for all available period 42 years .
Results indicate yearly fluctuations trending to smaller mean cloud cover from 1980 to 2022. The TCC has been decreasing by about 10 percent since time of foundation the observatory. It is means increasing available time for astronomical observation at the Terscol site.
3.4. Mann-Kendall Test and Sen Estimator
The MK and Sen’s slope trend tests were individually applied at annual data for the period from 1980 to 2022 at 90, 95, and 99% confidence levels. The Table 1 provides the results of MK test and Sen estimator for long-term V200, PWV, TCC at the Terscol observatory.
Significantly trends of long-term PWV and V200 are not found at the Terscol site. However, negative statistical significant trend of TCC are detected at the Terscol observatory. The slope of the TCC change is 0.133% in year. Therefore, we consider the seasonal change of TCC at Terscol observatory. On the monthly average (Figure 5), we can directly see the seasonal changes.
In results, it is clear the decreasing trend of TCC for all seasons above the Terscol Observatory. The strong decrease is especially for summer from 60% to 45% (Figure 5d). Winter is characterized strong variability for year to year in range 65-80 % (Figure 5a). The decrease of TCC is detected in the last 5 years in spring (Figure 5b). Whole the change of TCC is very positive for astronomical observation at Terscol.
4. Conclusions
The reanalysis data allowed to analyse long-term trends of astroclimatical parameters over a period of more than thirty years to determine the impact on astronomical observations. In this paper, we discuss features of the long-term trends of astroclimatic conditions by processing and analysing the data of modern Era-5 reanalysis at the sites of Terscol Observatory (coordinates 430 16 ‘29′’N, 420 30′ 03′’E) from 1980 to 2022. We have examined this data set for long-term trends using Mann-Kendel test and Sen’s slope.
Below, we summarize key points about the parameters.
- (i)
- The long-term trend of wind speed V200, as parameter determining adaptive optics operations, has not significant in during period from 1980 to 2022. The V200 has small negative change with Sen’s slope 0.008 m/s in year. This tendency of V200 is positive for adaptive optics operation on telescopes of the Terscol observatory.
- (ii)
- The long-term trend of PWV has not significant in during period from 1980 to 2022. The PWV has small positive change with Sen’s slope 0.004 mm in year. The tendency of PWV can negative influence on IR astronomical observations at Terscol observatory.
- (iii)
- The long-term trend of TCC have significant negative trend in during period from 1980 to 2022 with slope 0.13% in year. Additionally, loss of TCC is detected all seasons, especially in summer from 60% to 45 %. In results the change of TCC significant increased available time of astronomical observation, as key parameter for characterizing quality characteristic of astronomical site.
The long-term trends of astroclimatic parameters above the Terscol Observatory probability reflect impacts of climate change. However the climate changes have not only negative affect on the operation of ground-based astronomical observatories, but can have a positive effect on the quality of astronomical observations as show for the Terscol Observatory.
These results will use to optimize observation strategies and instrumental upgrades at the telescopes of Terscol Observatory.
Author Contributions
Conceptualization, L.B. and E.K.; methodology, L.B.; validation, L.B., E.K. formal analysis, E.K.; investigation, L.B.; writing—original draft preparation, L.B.; writing—review and editing, E.K.; visualization, L.B. All authors have read and agreed to the published version of the manuscript.
Funding
This research was funded by the Ministry of Science and Higher Education of the Russian Federation (Institute of Astronomy of the Russian Academy of Sciences and V.E. Zuev Institute of Atmospheric Optics of Siberian Branch of the Russian Academy of Sciences).
Data Availability Statement
Data used are available on request from the corresponding author.
Acknowledgments
In this section, you can acknowledge any support given which is not covered by the author contribution or funding sections. This may include administrative and technical support, or donations in kind (e.g., materials used for experiments).
Conflicts of Interest
The authors declare no conflict of interest.
References
- Shikhovtsev, A.Yu.; Kovadlo, P.G.; Kiselev, A.V. Astroclimatic statistics at the Sayan Solar Observatory. Solar-Ter. Phys. 2020, 6, 102–107. [Google Scholar] [CrossRef]
- Hellemeier, J.A.; Yang, R.; Sarazin, M.; Hickson, P. Weather at selected astronomical sites – an overview of five atmospheric parameters. Mon. Not. R. Astron. Soc 2019, 482, 4941–4950. [Google Scholar] [CrossRef]
- Cantalloube, F.; Milli J., Böhm, C.; et al. The impact of climate change on astronomical observations. Nature Astronomy 2020, 4, 826. [Google Scholar] [CrossRef]
- Hersbach, H.; Bell, B.; Berrisford, P.; Hirahara, S.; Horányi, A.; Muñoz-Sabater, J.; Nicolas, J.; Peubey, C.; Radu, R.; Schepers, D.; et al. The ERA5 global reanalysis. Q. J. R. Meteorol. Soc. 2020, 146, 1999–2049. [Google Scholar] [CrossRef]
- Bolbasova, L.A.; Shikhovtsev, A.Y.; Kopylov, E.A.; Selin, A.A.; Lukin, V.P.; Kovadlo, P.G. Daytime optical turbulence and wind speed distributions at the Baikal Astrophysical Observatory. Mon. Not. R. Astron. Soc. 2018, 482, 2619–2626. [Google Scholar] [CrossRef]
- Han, Y.; Yang, Q.; Nana, L.; Zhang, K.; Qing, C.; Li, X.; Wu, X.; Luo, T. Analysis of wind-speed profiles and optical turbulence above Gaomeigu and the Tibetan Plateau using ERA5 data. Mon. Not. R. Astron. Soc. 2021, 501, 4692–4702. [Google Scholar] [CrossRef]
- Zhu, L., Zhang H., Sun G. and others, Astronomical seeing and wind speed distributions with ERA5 data at Lenghu site on the Tibetan Plateau. Mon. Not. R. Astron. Soc. 2023, 522, 1419–1427. [CrossRef]
- Hirsch, R.M.; Slack, R.; Smith, R.A. Techniques of trend analysis for monthly water quality data. Water Resources Research 1982, 18, 107–121. [Google Scholar] [CrossRef]
- Sarazin M., Tokovinin A. The statistics of isoplanatic angle and adaptive optics time constant derived from DIMM data, in: Beyond conventional adaptive optics. Proc. ESO Workshop Beyond conventional Adaptive Optics. 2002, 321–328.
- Cantalloube F., Farley O. J. D., Milli J., Bharmal N., Brandner W., Correia C., Dohlen K., Henning Th., Osborn J., Por E. Wind-driven halo in high-contrast images - I. Analysis of the focal-plane images of SPHERE. A&A 2020, 638, A98. [CrossRef]
- Shikhovtsev, A.Yu.; Khaikin, V.B.; Mironov, A.P.; Kovadlo, P.G. Statistical Analysis of the Water Vapor Content in North Caucasus and Crimea. Atmospheric and Oceanic Optics 2022, 35, 168–175. [Google Scholar] [CrossRef]
Figure 1.
The 2-m astronomical telescope of the Terscol observatory.
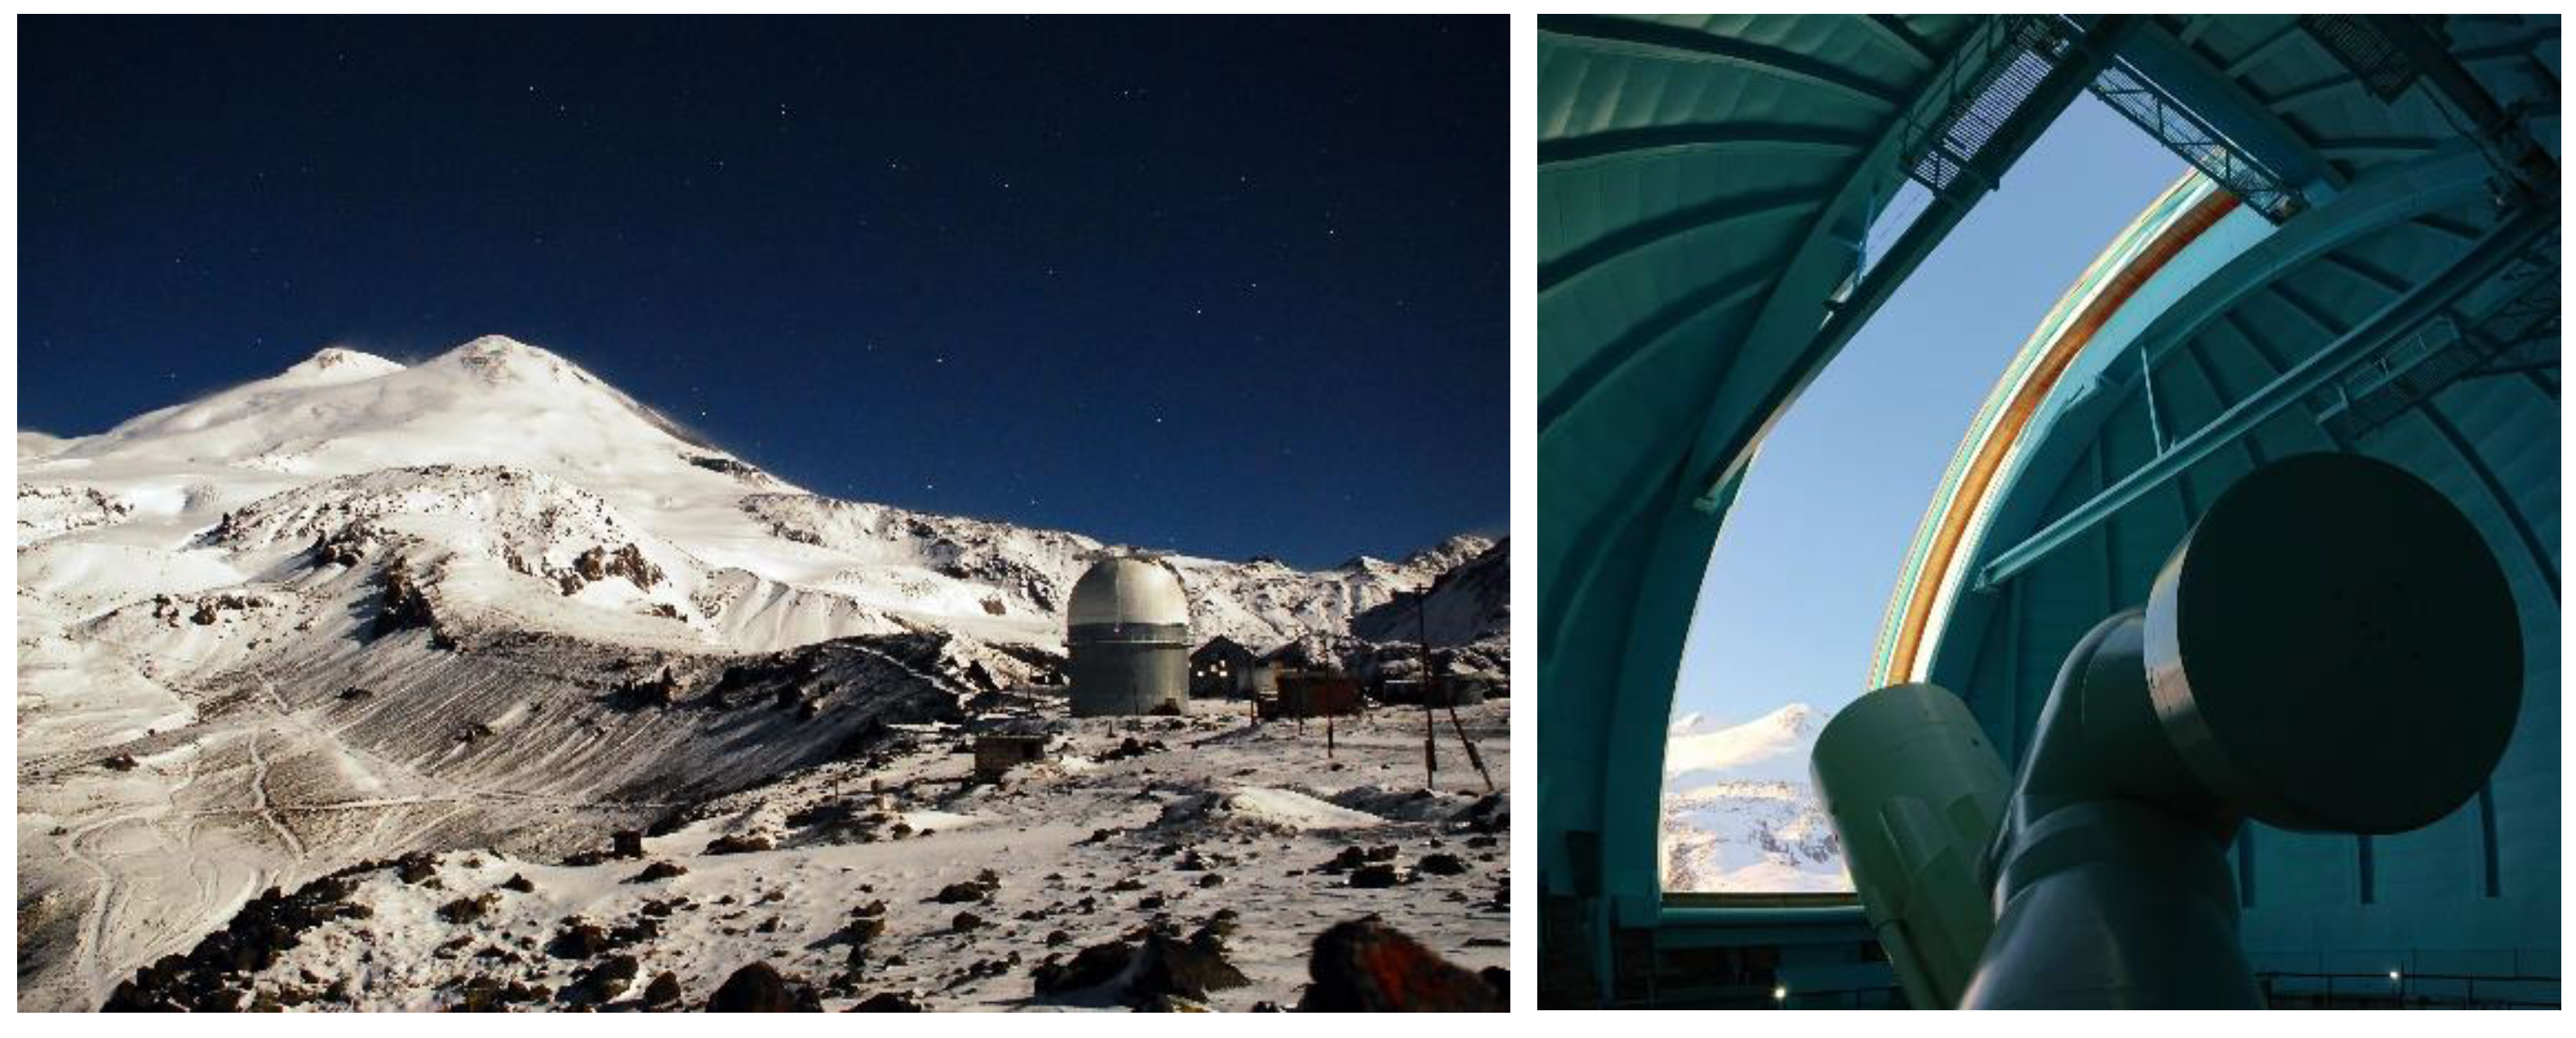
Figure 2.
The long-time trend of V200 for period 1980 - 2022 is obtained from ERA5 reanalysis at the Terscol observatory.
Figure 2.
The long-time trend of V200 for period 1980 - 2022 is obtained from ERA5 reanalysis at the Terscol observatory.
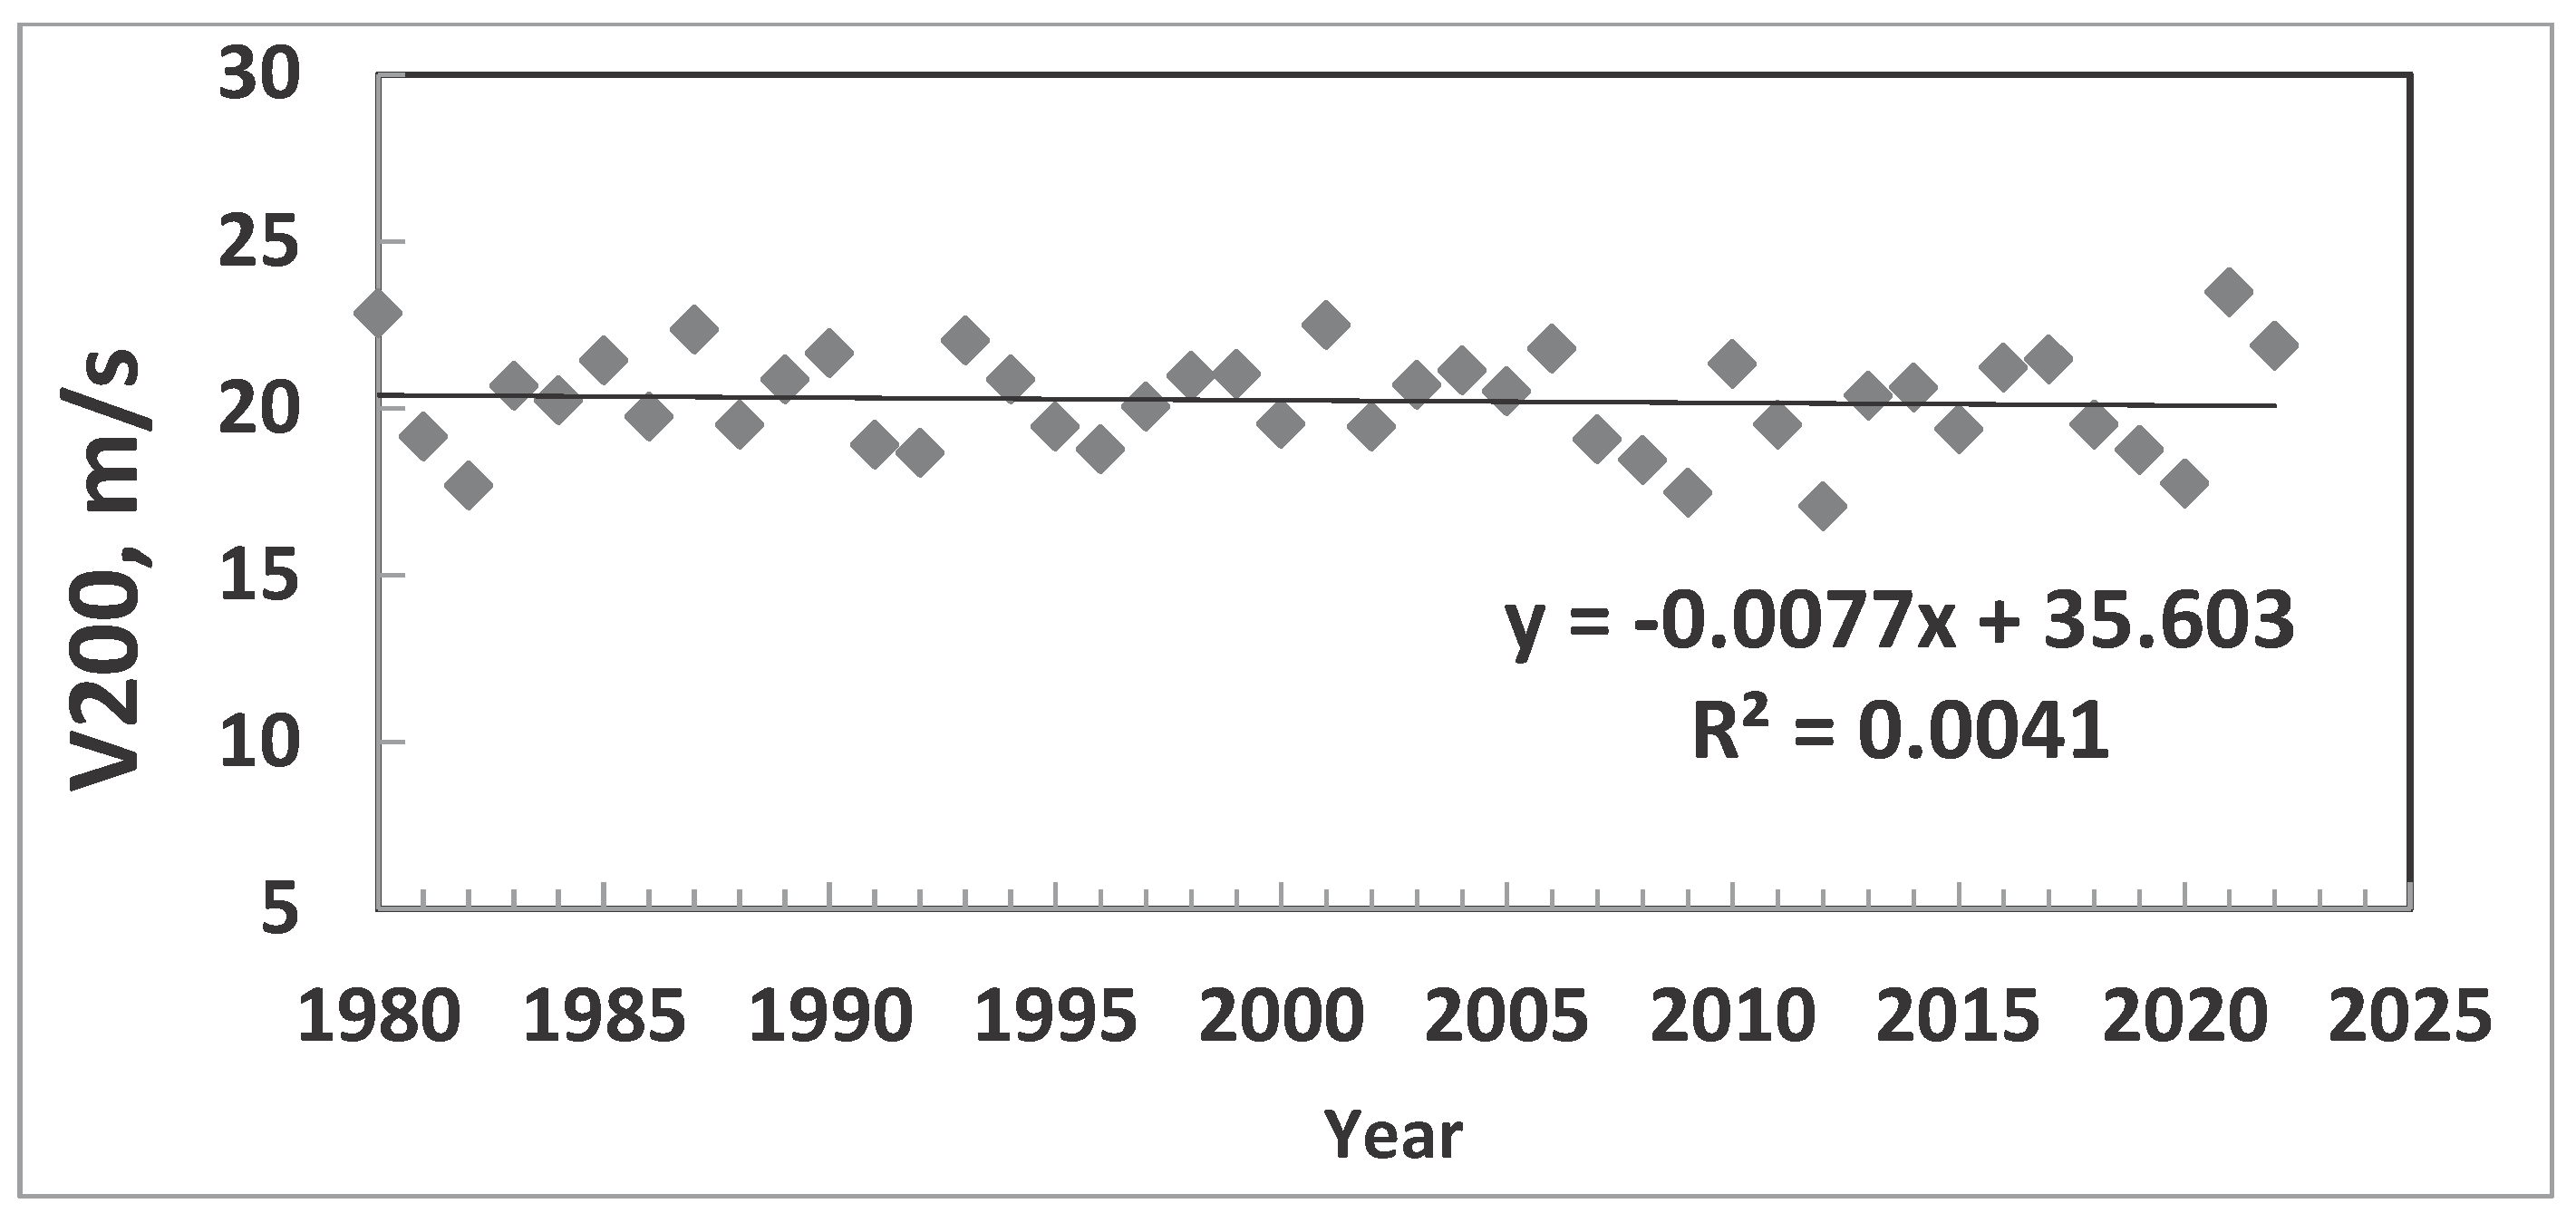
Figure 3.
The long-time trend of PWV for period 1980 - 2022 is obtained from ERA5 reanalysis at Terscol observatory.
Figure 3.
The long-time trend of PWV for period 1980 - 2022 is obtained from ERA5 reanalysis at Terscol observatory.
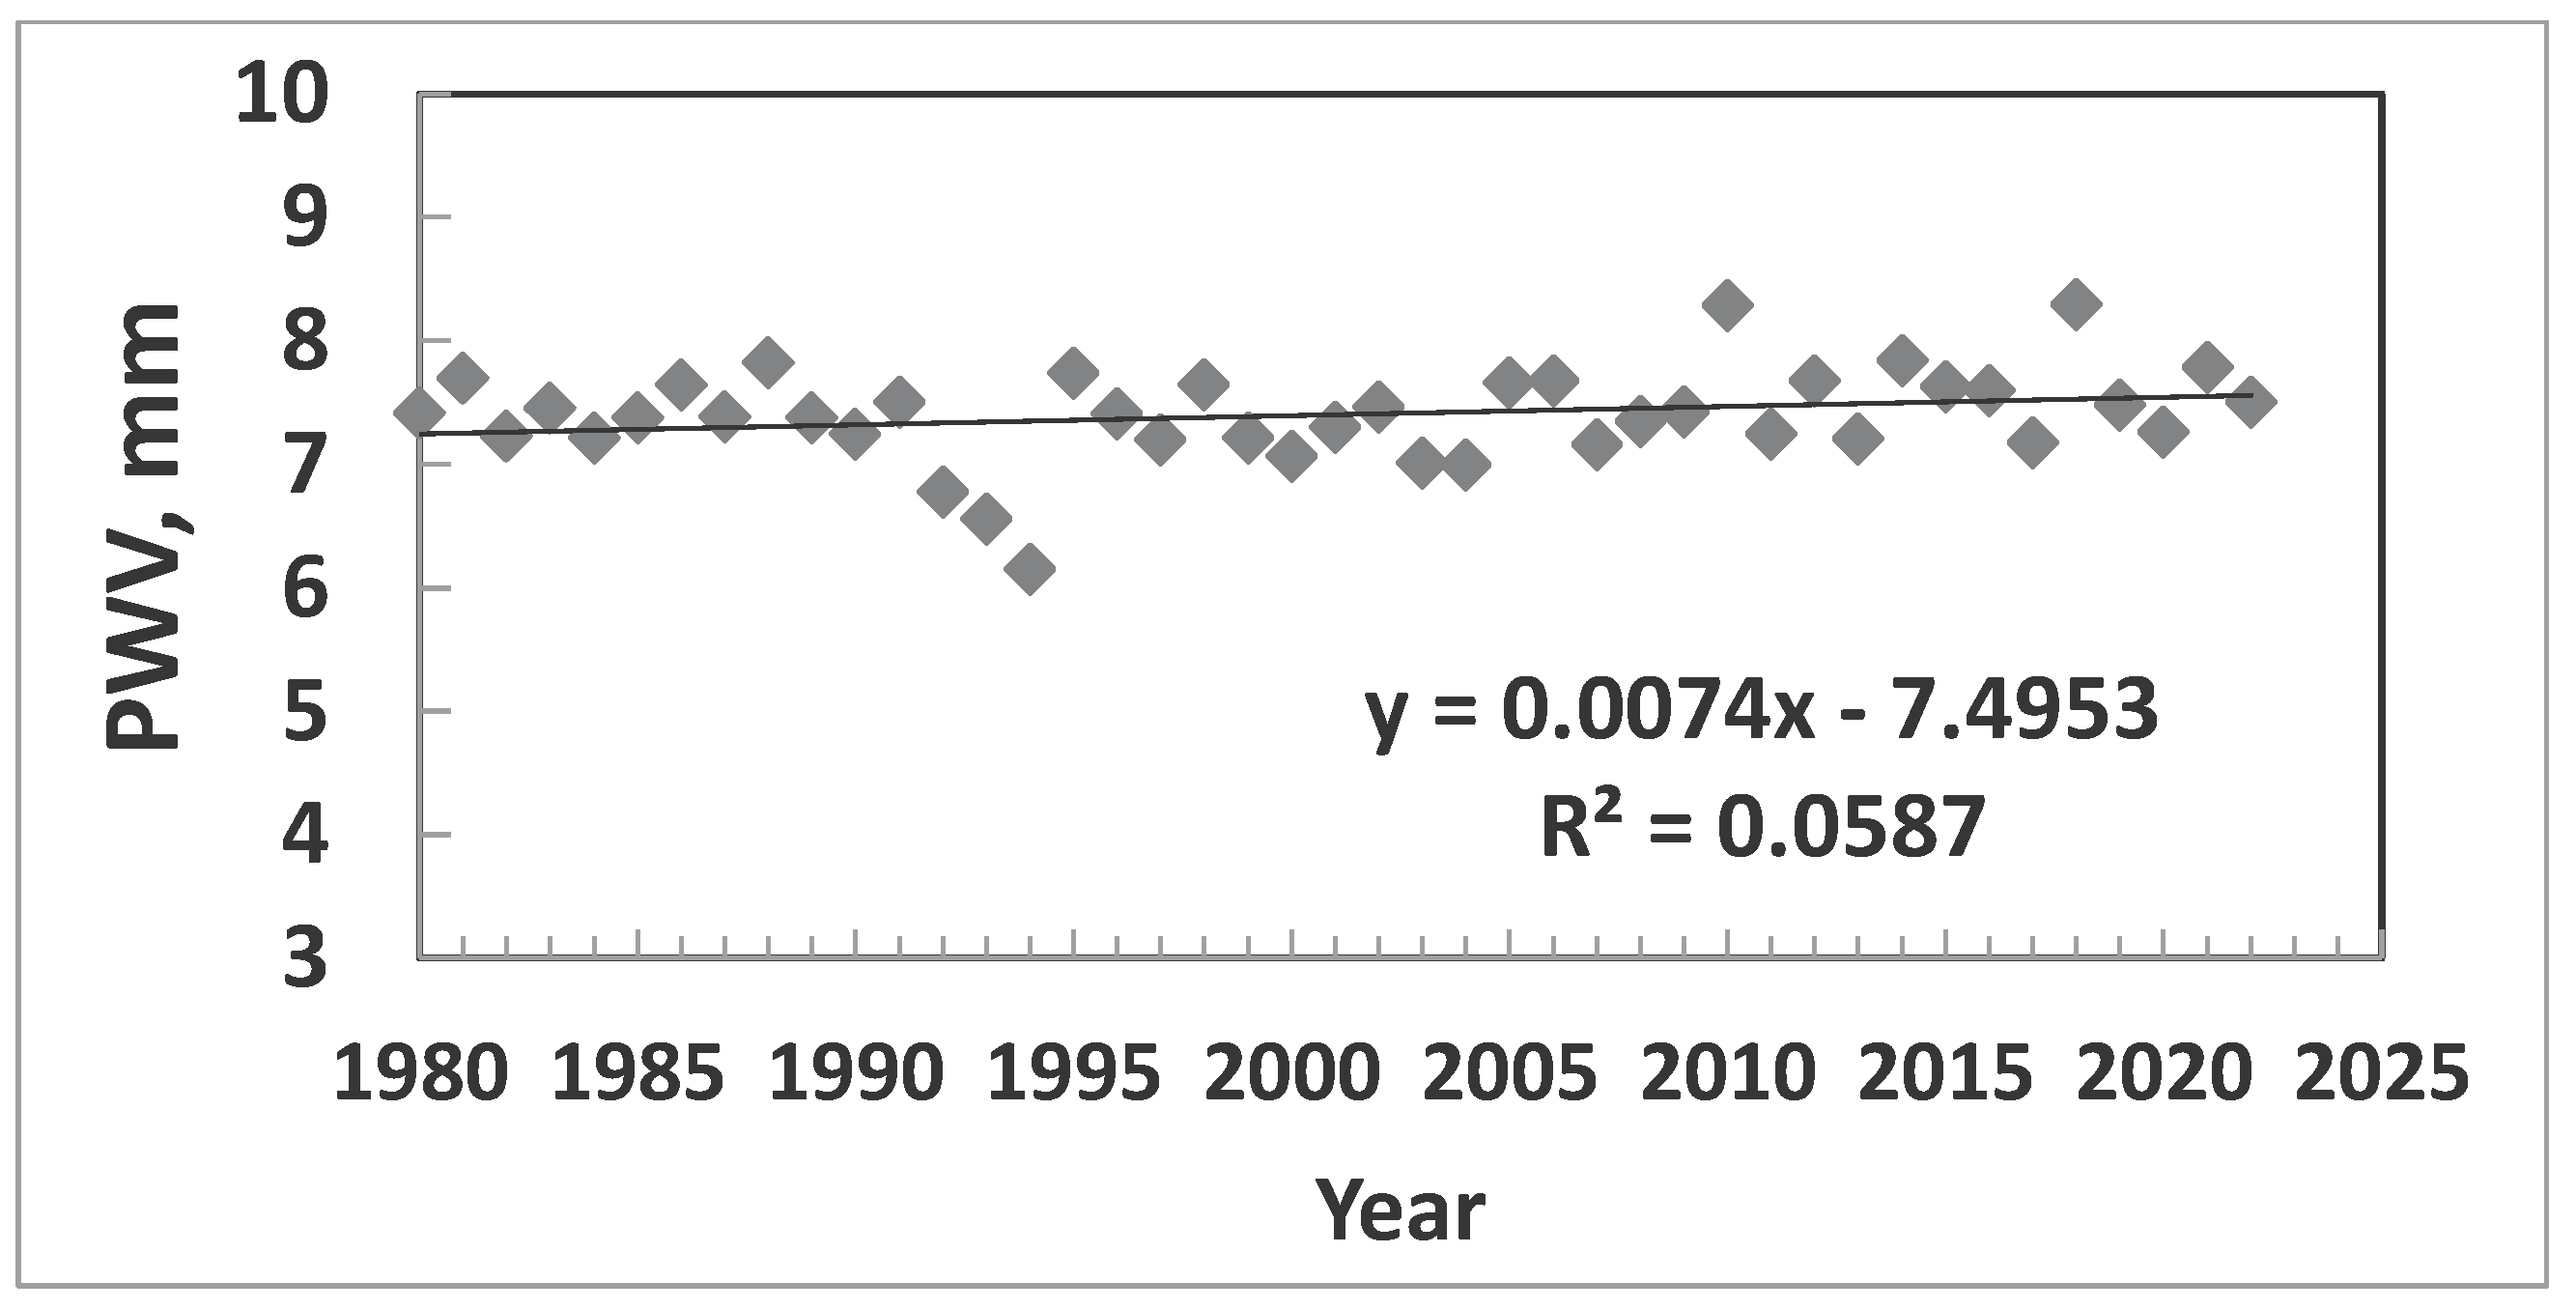
Figure 4.
The long-time trend of TCC for period 1980 - 2022 is obtained from ERA5 reanalysis at Terscol observatory.
Figure 4.
The long-time trend of TCC for period 1980 - 2022 is obtained from ERA5 reanalysis at Terscol observatory.
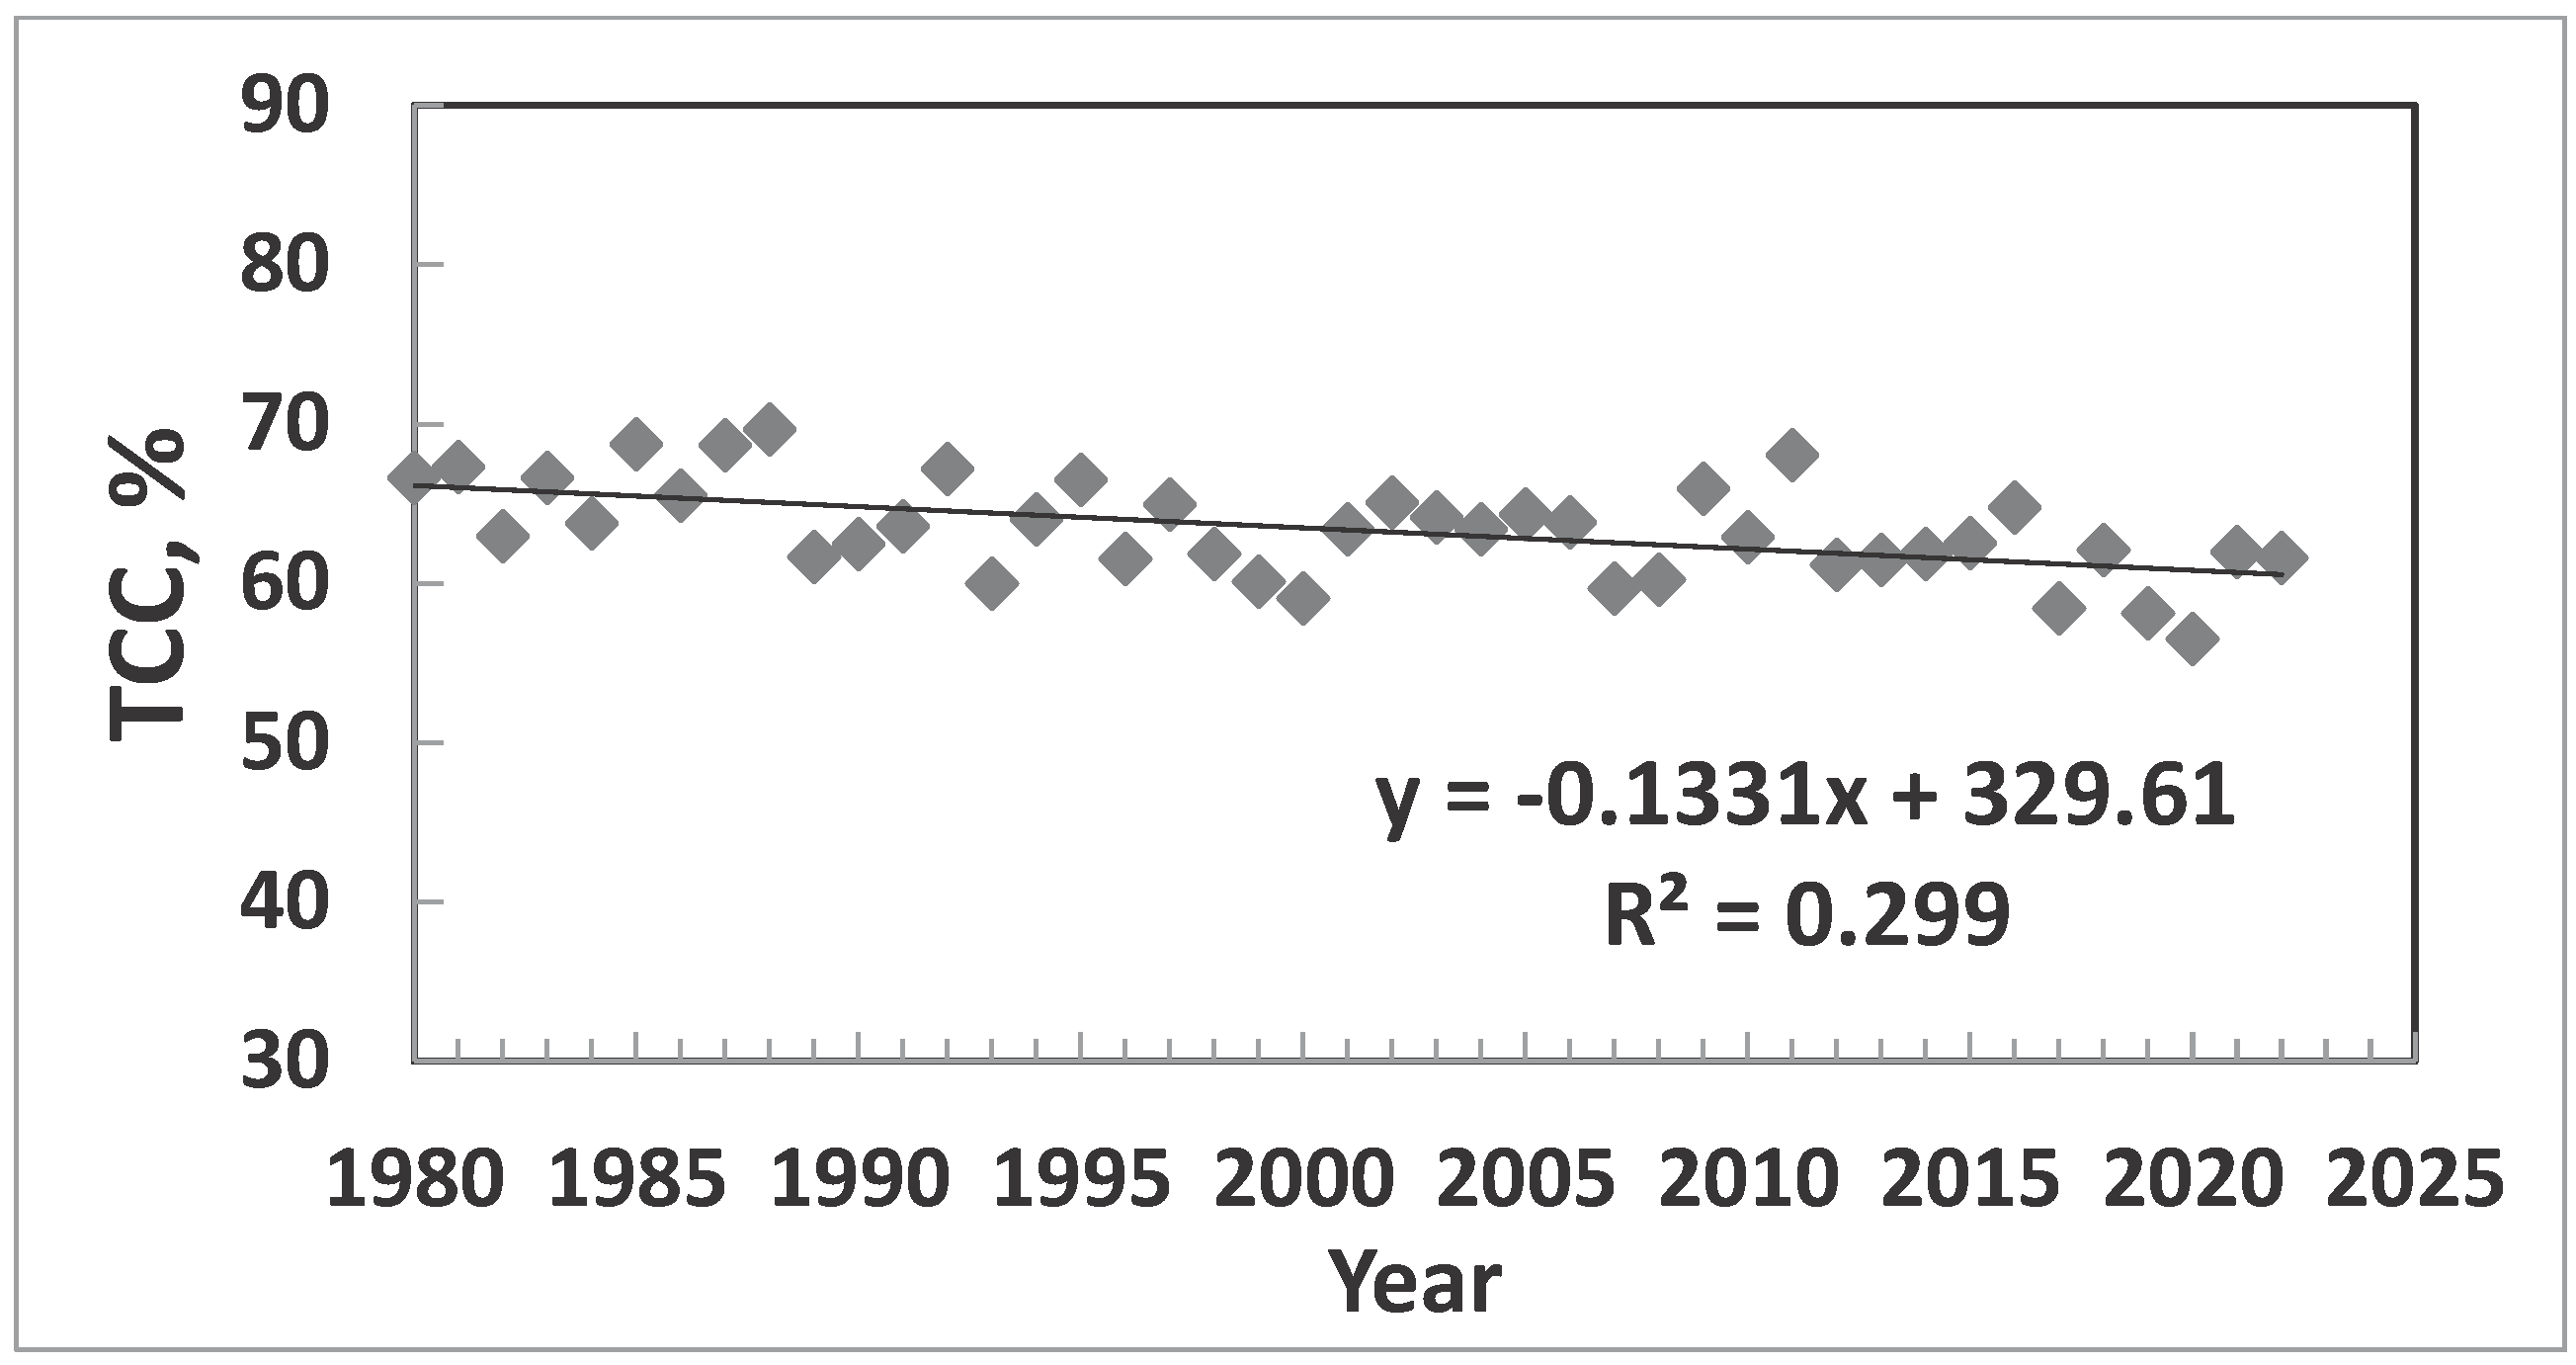
Figure 5.
The seasonal long-term trend of TCC from 1980 to 2022 at the Terscol Observatory. (a) Winter (DJF); (b) Spring (MAM); (c) Autumn (SON); (d) Summer (JJA).
Figure 5.
The seasonal long-term trend of TCC from 1980 to 2022 at the Terscol Observatory. (a) Winter (DJF); (b) Spring (MAM); (c) Autumn (SON); (d) Summer (JJA).
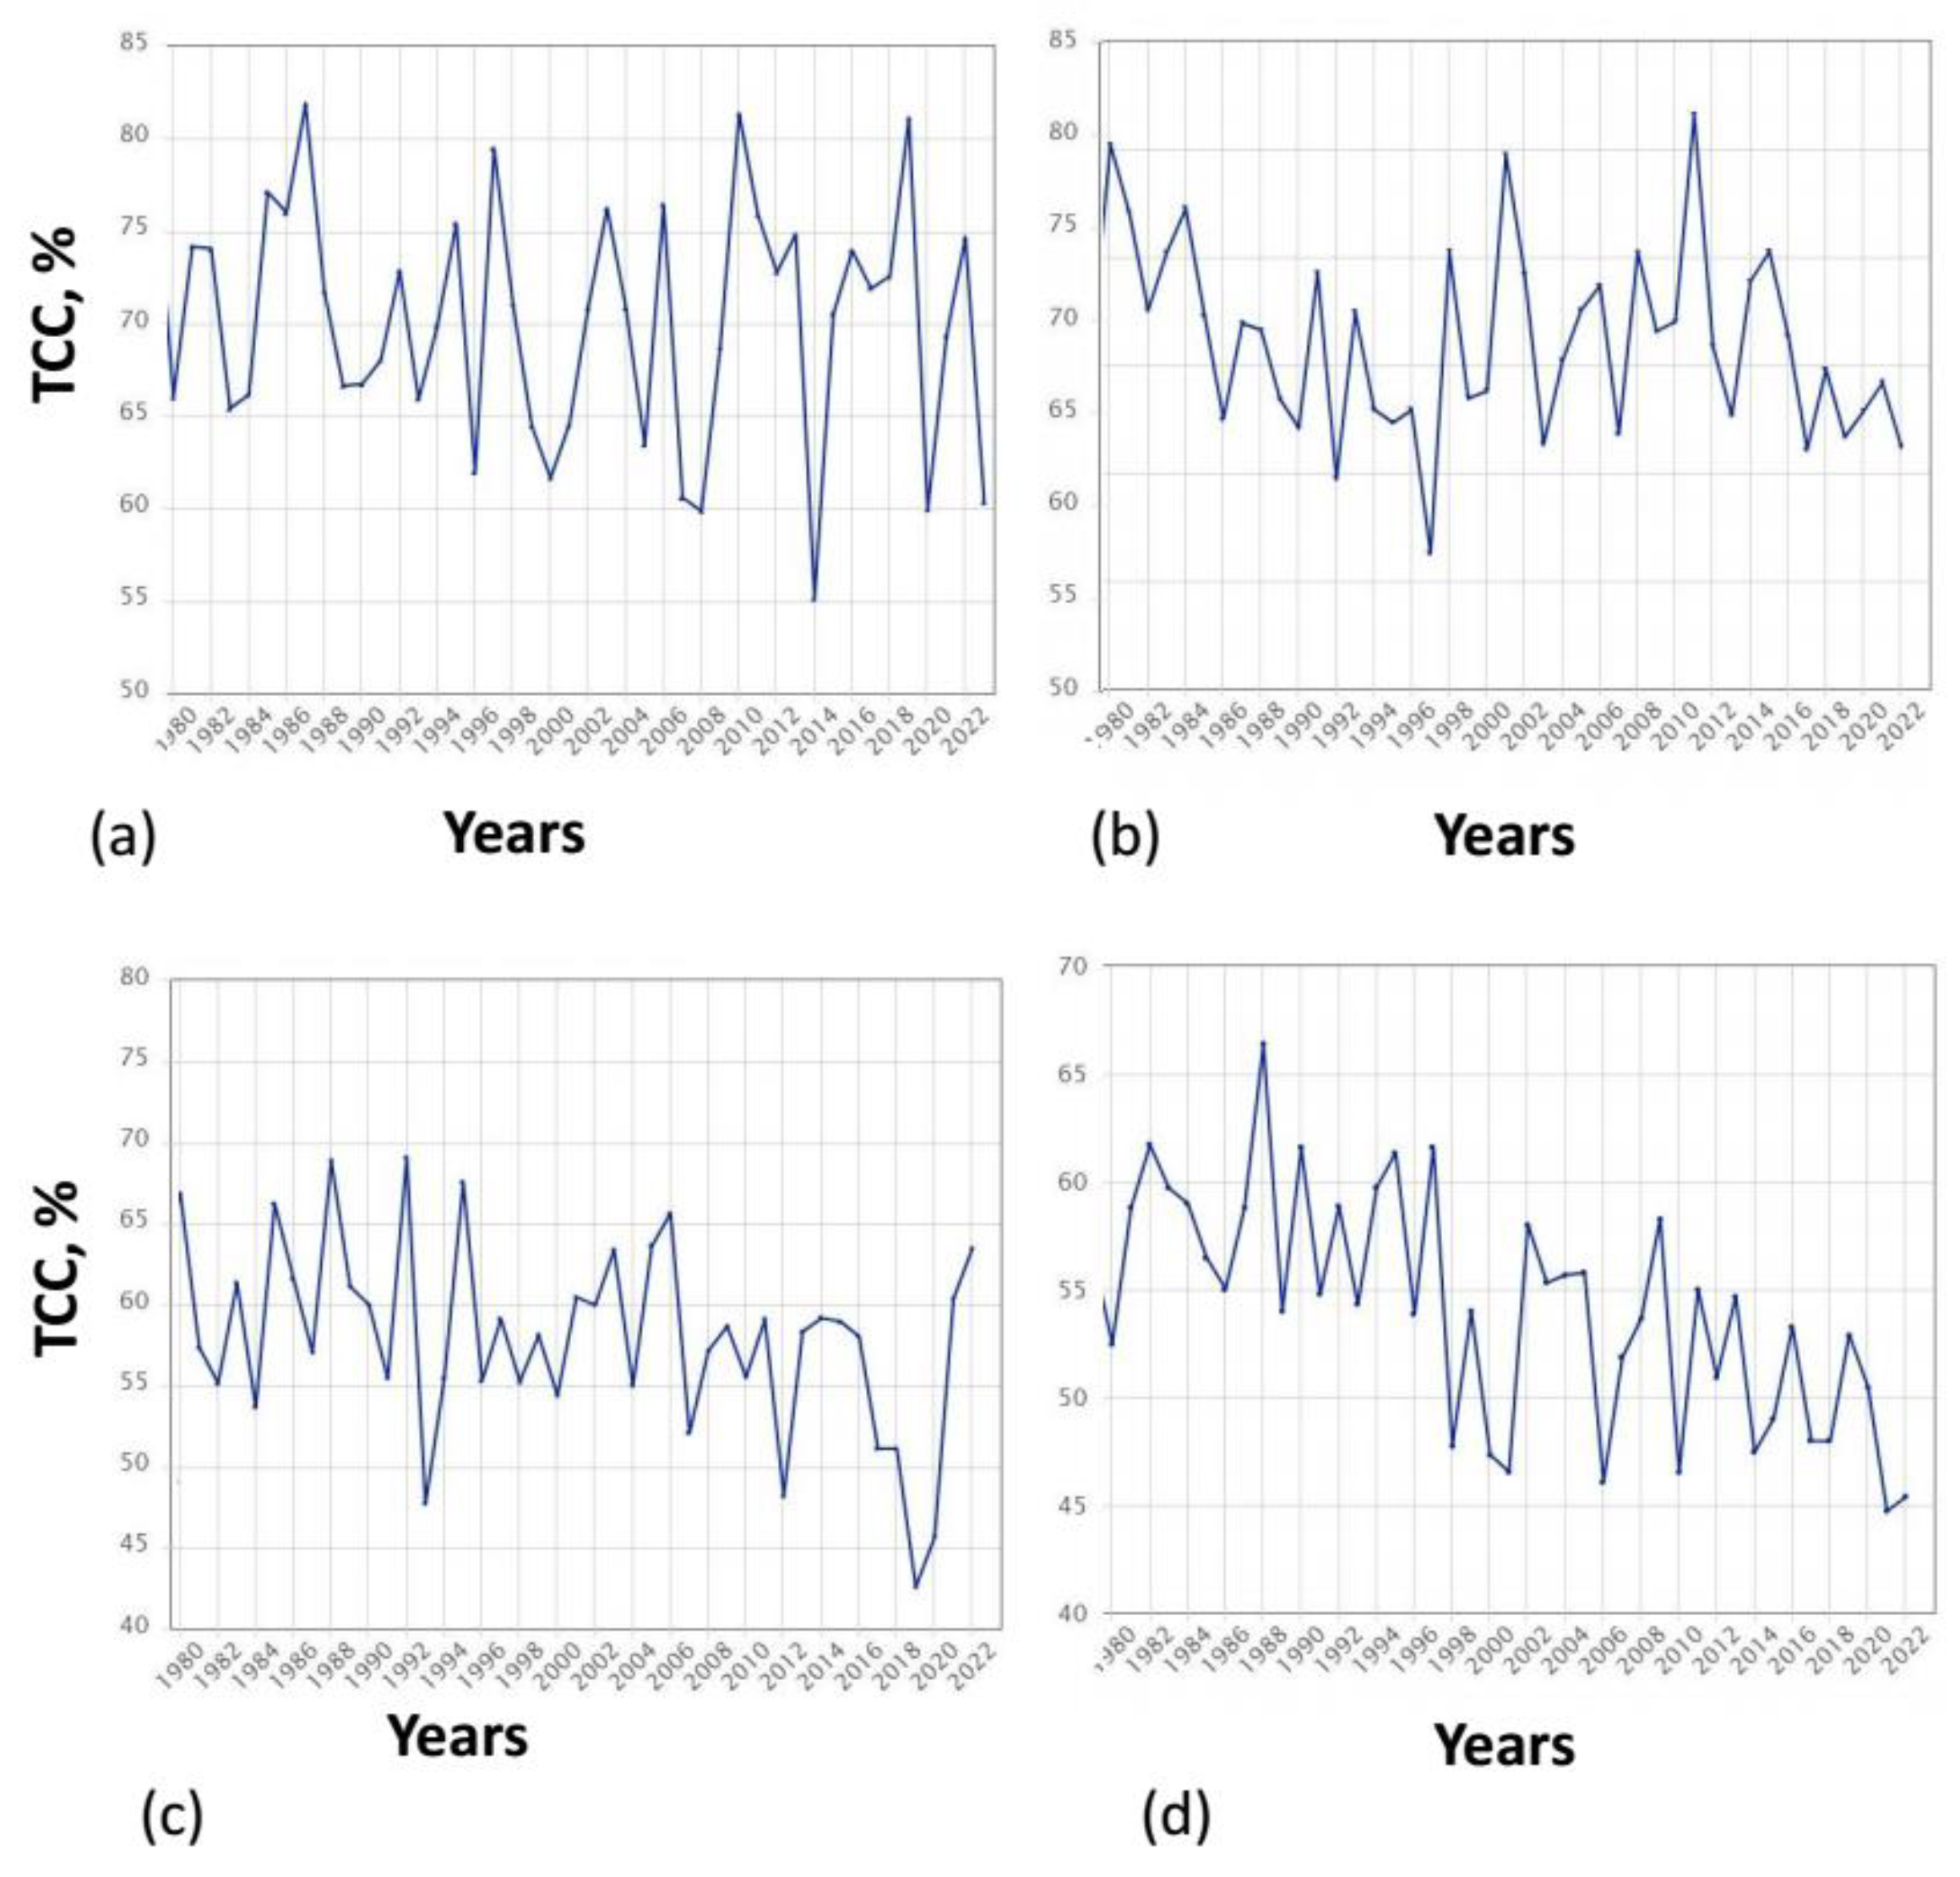

Table 1.
This is a table. Tables should be placed in the main text near to the first time they are cited.
Table 1.
This is a table. Tables should be placed in the main text near to the first time they are cited.
| Variable | Sen estimator Q (in year) | MK Test Significance |
|---|---|---|
| Long term of TCC | -0,133% | significantly***1 |
| Long term of PVV | +0,004 mm | Not significantly |
| Long term of V200 | -0,008m/s | Not significantly |
1 Trend at α =0.05 of the level of significance or 95% confidence level.
Disclaimer/Publisher’s Note: The statements, opinions and data contained in all publications are solely those of the individual author(s) and contributor(s) and not of MDPI and/or the editor(s). MDPI and/or the editor(s) disclaim responsibility for any injury to people or property resulting from any ideas, methods, instructions or products referred to in the content. |
© 2023 by the authors. Licensee MDPI, Basel, Switzerland. This article is an open access article distributed under the terms and conditions of the Creative Commons Attribution (CC BY) license (http://creativecommons.org/licenses/by/4.0/).
Copyright: This open access article is published under a Creative Commons CC BY 4.0 license, which permit the free download, distribution, and reuse, provided that the author and preprint are cited in any reuse.


