
Submitted:
28 June 2023
Posted:
03 July 2023
You are already at the latest version
Abstract
Improvement of agronomic traits in crops through gene editing (GE) relies on efficient trans-formation protocols for delivering the CRISPR/Cas9-coded transgenes. Recently, a few embryo-genesis-related genes have been described, the co-delivery of which significantly increases the transformation efficiency with reduced genotype dependency. Here we characterized the trans-genic and GE events in wheat (cv. Fielder) when transformed with the GROWTH-REGULATING FACTOR 4 (GRF4) and its cofactor GRF-INTERACTING FACTOR 1 (GIF1) chimeric gene. Trans-formation efficiency in our experiments ranged from 22% to 68%, and the editing events were faithfully propagated into the following generation. Both low and high copy number integration events were recovered in the T0 population with the various level of integrity of the left and right T-DNA borders. We also generated a population of wheat plants with ten different gRNAs targeting 30 loci in the genome. Comparison of the epigenetic profiles at the target sites and editing efficiency revealed a significant positive correlation between chromatin accessibility and muta-genesis rate. Overall, preliminary screening of the transgene quality and GE events in the T0 population of plants regenerated through the co-delivery of GRF-GIF can allow for the propagation of the best candidates for further phenotypic analysis.
Keywords:
Wheat
; Agrobacterium-mediated transformation
; Gene editing
; CRISPR/Cas9
; Epigenetics
1. Introduction
Bread wheat (Triticum aestivum L.) is one of the staple crops providing more than 20% of calories to the population worldwide [1]. The Green Revolution in the 1960s saw a boost in grain productivity in wheat owing to the introduction of the semi-dwarf alleles Rht1 (Rht-B1b) and Rht2 (Rht-D1b) [2]. The phenotype of both alleles is caused by the gain of function (GoF) mutation of the DELLA-coding genes (Rht1 and Rht2 are homeologous genes on chromosomes 4B and 4D, respectively), leading to overaccumulation of the protein that restrains plant height. DELLA GoF mutation also causes several negative pleiotropic effects, including shorter coleoptile length, reduced seedling vigor, grain weight, lower nitrogen use efficiency, and tolerance to drought compared to tall varieties [3]. Therefore, a further increase in wheat yield should be focused on eliminating the negative pleiotropic effects caused by the semi-dwarf genes and creating a new genetic variation with beneficial agronomic traits. The polyploid (allohexaploid, AABBDD) and complex nature of the wheat genome (16 Gb, 85% of repetitive elements) [1] make it challenging to rapidly achieve improvement in the agronomic traits using natural or induced random genetic variation. GE, through the CRISPR/Cas technology, offers an alternative approach for generating the induced variation at the target sites in the genome's regulatory or coding regions. Additionally, targeted generation of the double-strand breaks (DSBs) allows, for example, induced recombination at the predefined positions [4], introgression of specific loci from the close relatives or other cultivars, and elimination of linkage drag [5]. Until recently, the stable wheat transformation was relatively challenging with high variability, genotype-dependent, resulting in low transformation efficiency (1-2%). Delivery of growth-regulating and regeneration-related genes such as TaWox5 [6], maize Zm-Baby Boom (ZmBbm) and Zm-Wuschel2 (ZmWus2) [7] and GROWTH-REGULATING FACTOR 4 (GRF4) and its cofactor GRF-INTERACTING FACTOR 1 (GIF1) GRF-GIF [8] results in a significant boost in transformation efficiency ranging from 58% to 75%. Although higher transformation efficiency allows for reproducible generation of transgenic plants carrying the CRISPR/Cas9 constructs in different experiments, editing efficiency at different loci still varies significantly. Numerous methods have been created to forecast the effectiveness and mutation results by relying exclusively on CRISPR target sequences [9,10,11]. Nevertheless, the reliability of these tools, which are primarily based on human cell data, frequently differs and exhibits limited applicability when extended to plants [12]. This finding implies that factors other than the sequence itself might impact CRISPR/Cas9 mutagenesis. Indeed, the recent report provided direct evidence that DNA methylation and chromatin characteristics can result in substantial fluctuations in mutagenesis efficiency, with differences of up to 250 times observed [13]. The editing rate at distinct loci in the Arabidopsis thaliana genome carrying the same gRNA binding sequences did not depend on the sequence itself, with lower efficiencies of mutagenesis predominantly linked to repressive heterochromatic features. The repressive impact could be mitigated by significantly reducing DNA methylation levels at the targeted CRISPR sites. Additionally, specific chromatin attributes, such as H3K4me1, H3.3, and H3.1, were found to be associated with notable variations in the patterns of CRISPR/Cas9 mutations facilitated by the non-homologous end joining (NHEJ) repair pathway.
The complex wheat genome exhibits a multi-tiered spatial organization encompassing three levels [14]. Firstly, the genome is structured into distinct territories, where specific regions occupy defined spatial locations within the nucleus. Secondly, a clear demarcation between facultative (modifiable) and constitutive (invariant) heterochromatin forms a distinct separation. Lastly, the organization of RNA polymerase II around transcription factories contributes to the overall spatial arrangement of the genome, indicating a functional relationship between transcriptional activity and genomic organization. Such complexity undoubtedly introduces differences in GE rates among different gRNAs, simply by restricting the access of the Cas9/gRNA complex to the target regions. In this study, we took advantage of the extensive collection of high-resolution epigenomic data already available for wheat to investigate the influence of chromatin characteristics on CRISPR/Cas9 mutagenesis. We employed stable transgenic wheat plants as our experimental model generated by Agrobacterium-mediated transformation and GRF-GIF chimera. Here we report on the quality of transgenic events obtained through this method as well as demonstrate the correlation between the chromatin accessibility (as measured through Assay for Transposase Accessible Chromatin sequencing, ATAC-seq) and GE efficiency for ten gRNA tested in our study.
2. Materials and Methods
2.1. Plants cultivation
Donor and transgenic plants (cv. Fielder) were grown in Sunshine® Mix #4 Aggregate Plus potting mix with Osmocote 14-14-14 slow-release fertilizer in growth cabinets at 20°C day 15°C night temperatures, 16/8 h day/night regime, and 600 µmol/m2s light intensity provided by fluorescent tubes. Humidity was maintained at 70%. Extra care was taken to keep donor plants healthy and reduce the risk of spreading pathogens. Powdery mildew was controlled through weekly foliar application of the plant health promoter Foliar Supreme S720 (2 ml/l, OMEX Agriculture Inc., Canada) until the heading stage. The thrips population was controlled through the weekly application of the diatomaceous earth to the heads and leaves of the donor plants.
2.2. Agrobacterium-mediated wheat transformation
The wheat transformation was done as described in [15]. Briefly, following seed sterilization, immature embryos were collected at the early milk stage (~10-13 days post-anthesis, 1-2 mm in diameter) into 1.7-ml microcentrifuge tubes containing 1 ml of wheat inoculation medium (WIM - 0.44 g/l Murashige and Skoog, 10 g/l glucose, and 0.5 g/l 2-(N-morpholino) ethanesulfonic acid (MES)) with 0.05% Silwet L-77 (~100 embryos/tube). The WIM media was replaced with the fresh one, and embryos were centrifuged for 10 min at 14,000 rpm at 4°C. The transformation was done with the hyper virulent A. tumefaciens strain AGL1 carrying the pSoup helper plasmid and JD633 plasmid with the cloned gRNA seeding sequences. In some cases, the Agrobacterium cultures with two different gRNAs were mixed in equal volumes immediately before embryo inoculation for co-transformation experiments. WIM was removed, and 1 ml of Agrobacterium solution (WIM supplemented with 100 μM acetosyringone, OD600 = 0.5) was added; tubes were inverted repeatedly for 30 s and incubated for at least 20 min. The suspension was removed with the pipet, and 25-30 embryos were transferred to fresh 90-mm-dimeter plates, scutellum side up, with wheat co-cultivation medium (WIM supplemented with 100 μM acetosyringone, 5 μM AgNO3, 1.25 mg/l CuSO4·5H2O, and 8 g/l agarose). Petri plates were sealed and incubated in the dark at 24°C for three days, followed by excision of the embryogenic axes. The embryos, scutellum side up, were transferred to fresh wheat callus induction medium plates (WCI - 4.3 g/l MS, 30 g/l maltose, 1.0 g/l casein hydrolysate, 10 ml 100× vitamin stock, 2 mg/l picloram, 0.5 mg/l 2,4-D, 1.25 mg/l CuSO4·5H2O, 160 mg/l timentin, and 5 g/l agarose) and incubated at 24°C in the dark for five days. Following the resting period, the embryos were transferred to fresh WCI plates supplemented with 15 mg/l hygromycin and kept at 24°C in the dark for two weeks. Eventually, the calli were split into clumps of ~4 mm2 and transferred to fresh selection plates (WCI plates) but with 30 mg/l hygromycin. The plates were moved back to 24°C in the dark for two weeks, then transferred to a lit culture chamber (100 μmol/m2/s) at the same temperature with a 16-hr photoperiod and covered with a single-layer paper towel for a week. The transformed calli started to green and produce small shoots during this period. The calli were transferred a final time to wheat regeneration medium (WRM - 4.3 g/l MS, 30 g/l maltose, 1.0 g/l casein hydrolysate, 10 ml vitamin stock, 1.0 mg/l zeatin, 1.25 mg/l CuSO4·5H2O, 3.5 g/l phytagel, 160 mg/l timentin, 20 mg/l hygromycin) and kept under fluorescent lights (100 μmol/m2/s) at 24°C with a 16-hr photoperiod. The regenerated shoots with prominent roots were transferred to magenta jars containing the WCI medium without growth regulators and supplemented with 15 mg/l hygromycin. The well-developed shoots with strong root systems were eventually transferred to soil and covered with a plastic dome for acclimatization.
2.3. Cloning of gRNAs and PCR-confirmation of transgenic plants
The wheat transformation was done with the JD633 plasmid containing the TaCas9 expression cassette together with TaU6:gRNA and the GRF4-GIF1 embryogenesis chimeric gene [8]. The plasmid was a gift from Jorge Dubcovsky (Addgene plasmid # 160393; http://n2t.net/addgene:160393; RRID: Addgene_160393). Complementary oligos (Supplementary Table S6) were annealed (2 µM each in 50 µl of water), and 1 µl of the annealed product was mixed with 100 ng of the AarI-digested vector, 1xT4 DNA ligase buffer, and 400 U of T4 DNA ligase. The ligation mix was incubated for 1 hour at room temperature and transformed into E.coli commercial chemical competent cells. Cloned seeding sequences were verified by Sanger sequencing, and the plasmids were transformed into A. tumefaciens strain AGL1 (pSoup) using a chemical transformation protocol [16]. gDNA was isolated from leaves of the soil-acclimated putative transgenic plants, and the presence of the transgene was confirmed using PCR with HYG-specific primers (HYG-F and HYG-R, Supplementary Table S6). Segregation analysis for the T1 plants was done using the same HYG-specific primers and with up to 10 plants per T0 transgenic line.
2.4. Evaluation of GE at the target site using cleaved amplified polymorphic sequences and qPCR assays
The editing efficiency at the target sites was assessed using either cleaved amplified polymorphic sequences (CAPS) assay, as described before [17] or the qPCR method. In the CAPS assay, the gRNA#10 target regions were amplified using sub-genome-specific or universal primers (Supplementary Table S6) and digested with SmaI. The digested products were separated on 1% agarose gel, and the editing efficiency was calculated as a percentage of undigested band intensity measured using Image Lab software (Bio-Rad, USA).
Multiplexed probe-based qPCR method was used to assess the editing efficiency for gRNAs tested in this study. The primers were designed to amplify the editing region with the 5′ FAM (6-fluorescein)-labelled probe annealing to the cleavage sites of the gRNAs for three sub-genomes (A, B and D, Supplementary Table S6). The PINb gene (PUROINDOLINE-b, two copies per hexaploid genome) was used as a reference [18]. The reference gene probe was 5ʹ HEX (hexachloro-fluorescein) labelled, and both gRNA and PINb gene probes contained ZEN and Iowa Black Hole Quencher 1 (Integrated DNA Technologies, Coralville, IA, USA). The 1xLuna® Universal Probe qPCR Master Mix (cat. # M3004S; New England Biolabs, USA), 500 nM of each primer pair (for the endogenous reference gene and the transgene), and 250 nM each of gRNA and reference probes were mixed in the total volume of 20 µl. qPCR was run on CFX96 Real-Time PCR Detection System (Bio-Rad) with 50 ng/sample of gDNA. PCR conditions consisted of one cycle of initial denaturation at 95°C (60 sec), followed by 45 cycles of denaturation at 95°C (15 sec) and extension at 60°C (30 sec). Reactions were run in triplicates, and average ΔΔCt was calculated for transgenic and wild-type control (WT, cv. Fielder) samples for corresponding gRNAs using CFX manager, v. 3.1, Bio-Rad. The GE rates were calculated through the normalization of ΔΔCt values of transgenic plants to WT control (ΔΔCtnorm), and the 1/ ΔΔCtnorm ratios were used for analysis.
2.5. Estimation of the transgene copy number
The T-DNA copy number in T0 plants and their progeny were measured using digital droplet PCR (ddPCR) as described in [18] with some modifications. gDNA was isolated from young leaves using the method that was developed by Warner et al. [19]. Concentration was quantified using a Qubit fluorometer and the dsDNA quantification kit (cat. # Q32851) as described by the manufacturer (Thermo Fisher Scientific, Waltham, MA, USA). For every sample, 1 µg of gDNA was digested either for 1 or 12 hours at 37°C using EcoRI-HF (cat. # R3101S) in 1x rCutSmart Buffer followed by heat inactivation at 65°C for 20 min. The digested gDNA was purified using the DNA Clean-Up and Concentration Micro-Elute Kit (cat. # 67200, Norgen Biotech Corp., ON, Canada) and quantified again with a Qubit fluorometer. Two different amounts of digested gDNA/reaction were tested and compared for the efficiency of transgene copy number estimation – 350 ng [18] and 10 ng [20]. The transgene-specific primers/probe mix was explicitly designed for TaCas9 (Supplementary Table S6), and normalization was done against the PINb gene. The transgene and reference gene probes were labelled with 5′ FAM (6-fluorescein) and 5ʹ HEX (hexachloro-fluorescein). All probes were double-quenched with ZEN and Iowa Black Hole Quencher 1 (Integrated DNA Technologies, Coralville, IA, USA). The ddPCR master mix for amplification contained 1xddPCR Supermix for Probes (no dUTP; cat. # 186-3024; Bio-Rad Laboratories), 500 nM of each primer pair (for the endogenous reference gene and the transgene), and 250 nM of each probe. The total volume was adjusted to 20 µl with the ultrapure water. The droplets were produced following the manufacturer’s instructions using a droplet generator (Bio-Rad) and Bio-Rad Droplet Generation Oil (cat. # 186-3005). Droplets (40 µl) were transferred to a 96-well skirted Eppendorf PCR plate (cat. # 951020362), sealed with pierceable foil (cat. # 181-4040; Bio-Rad) and placed into the Bio-Rad thermocycler. Initial denaturation was done for 10 min at 95°C followed by 40 cycles of 94°C (30 s) and 60°C (1 min) with a final step at 98°C for 10 min. A temperature ramp rate was set to 2°C/sec according to the manufacturer’s instructions. The samples were then transferred to a QX200 droplet reader (Bio-Rad). Data analysis was done using the Bio-Rad QuantaSoft Analysis Pro software (v1.0.596) with manual settings for threshold determination to distinguish positive and negative droplets.
2.6. Evaluation of the left and right T-DNA borders integrity and transgenes co-integration events
We used end-point PCR to estimate the intactness of the left and right borders (LB and RB, respectively) integration events in the T0 plants. For RB, forward primer (RB-F, Supplementary Table S6) was used in combination with either RB-R1 or RB-R2 primers, one of which anneals at RB (RB-R2, L = 355 bp), whereas another one is 122 bp 5´ upstream from RB (RB-R1, L = 233 bp). The PCR reaction was run on 1% agarose gel, and the presence of the larger band was indicative of the intactness of RB. For LB, common reverse primer (LB-R) was mixed with either of the three forward primers annealing either at LB (LB-F1, L = 500 bp), 75 bp 3´ downstream (LB-F2, L = 425 bp), or 317 bp downstream (LB-3, L = 183 bp). The presence of the 500 bp PCR fragment indicated the integrity of LB.
In experiments where two Agrobacterium cultures carrying different gRNAs were mixed, co-integration of T-DNAs was assessed using PCR with the common primer for the JD633 vector backbone (JD633-F) and reverse primer specific to the gRNA seeding sequence (Supplementary Table S6). The PCR reactions were analyzed separately on 1% agarose gel for every T0 transgenic plant.
2.7. Gene expression analysis using ddPCR
Total RNA was isolated from leaves of transgenic T1 seedlings using a Nucleospin RNA Plant Kit (cat. # 740949.50, Macherey-Nagel, Germany) according to the manufacturer’s instructions. cDNA was synthesized using SuperScript IV First-Strand Synthesis System (cat. # 18091050, ThermoFisher Scientific, USA) following the manufacturer’s protocol. For every ddPCR reaction, 20 ng of cDNA/sample was used and combined with 1x ddPCR Supermix for Probes (no dUTP; cat. # 186-3024; Bio-Rad Laboratories), 500 nM of each primer pair (for the endogenous reference gene and the transgene), and 250 nM of each probe. Expression from the transgene cassette was measured using ddPCR (Bio-Rad, USA) with TaCas9 primers/probe (Supplementary Table S6). TaGA3PD (TraesCS7A02G313100, TraesCS7B02G213300, and TraesCS7D02G309500) was used as an endogenous reference [21] (TaGA3PD, 5´ HEX-labeled, double-quenched with ZEN and Iowa Black Hole Quencher 1, Supplementary Table S6). DdPCR gene expression data were normalized as previously described [22].
2.8. Characterization of chromatin features
The chromatin marks for the wheat (cv. Chinese Spring) were extracted from the following datasets – SRP126222 (H3K27me3, H3K36me3, H3K4me3, and H3K9ac), SRP133674 (DNA methylation) [14], GSE133885 (ATAC-seq), and GSM3929161 (RNA polymerase II ChIP-seq) [23]. The gRNA regions, including the three nucleotide protospacer adjacent motif (PAM), were BLAST searched using WheatOmics 1.0 browser (http://wheatomics.sdau.edu.cn/) and nucleotide-resolution data extracted for corresponding chromatin marks. The average value across the respective gRNA target sequence plus PAM was calculated for three sub-genomes. The data set for every chromatin mark was normalized for comparison on a scale of 0–1, with 1 indicating the highest level of that feature and used to construct the heatmap.
2.9. Statistical treatment of the data
Statistical significance between groups for correlation analysis was calculated using Pearson's correlation test with p < 0.05 considered significant.
3. Results
3.1. Agrobacterium-mediated co-delivery of the GRF-GIF chimeric gene results in the efficient regeneration of transgenic wheat plants
The Agrobacterium-mediated wheat transformation was done following a recently published protocol [15] with the wheat transcription factor GRF4 co-delivery and its cofactor GIF1 [8]. The reported transformation efficiency with the improved protocol and the GRF4-GIF1 construct co-delivery was 77.5% in cv. Fielder (number of transgenic plants per cultured embryos). Similarly, our transformation rate with the JD633 plasmid carrying the GRF4-GIF1 and Cas9/gRNA expression cassette ranged from 22 to 68% with an average of 44.1% (Table 1, total transformation rate, including both clonal and non-clonal events). Many calli following transfer to the WCI media and later to the WRM media generated multiple green shoots (Figure 1) that we treated as single transgenic events. However, we do not exclude the possibility of some of them being clones if they originate from a single callus (not tested in this study). Healthy donor plants and good embryo quality were critical for the efficient regeneration of transgenic plants. It is important to note that following the co-culturing of embryos on WIM, the embryos are transferred to WCI with the timentin to control the Agrobacterium overgrowth. The WCI media must be prepared fresh, and the culture plates can be stored in the fridge for up to two weeks to prevent timentin from losing its activity.
3.2. Low- and high-copy number T-DNA integration events can be recovered in the transgenic population
The transgene copy number was measured using ddPCR assay as described before with some modifications [18]. Based on the wheat genome size (17.33 pg for 1C plant DNA), the original protocol calls for 350 ng of EcoRI-digested wheat gDNA/sample to quantify the transgene copy number [18]. It was also suggested to perform the digestion of gDNA for 12 hours. At the same time, another study on optimization of the α-gliadin gene copy number estimation identified the optimal amount to be 10 ng of digested gDNA per 20 µl of ddPCR reaction [20]. Therefore, we compared the T-DNA copy number values between the two different gDNA amounts for 11 T0 plants and observed no significant difference in the copy number values between corresponding samples (Supplementary Table S1, Pearson’s correlation R = 0.99, p = 1.24e-08). Additionally, a prolonged digestion period (more than one hour) of the total gDNA before the ddPCR analysis was not required for reproducible estimation of the transgene copy number (Supplementary Table S2, Pearson’s correlation R = 0.97 p = 6.98e-08). To our surprise, many T0 plants selected for the study (10 out of 17) contained multiple T-DNA copies ranging from 3 to as high as 17 (Figure 2A). These data were further confirmed by estimating the transgene copy number in the T1 population and segregation analysis in the T2 progeny (Figure 2B,C). Consistent with the recent report [26], we did not observe a correlation between the Cas9/gRNA cassette copy number and GE rate in the T0 plants and their progeny (Supplementary Table S3, Pearson’s correlation, R = 0.31, p = 0.33 and R = 0.24, p = 0.27 for T0 and T1 plants, respectively). At the same time, we observed a moderate but significant positive correlation between the transgene copy number and gene expression in respective samples (Supplementary Figure S1, Pearson’s correlation, R = 0.55, p = 0.0049).
3.3. Frequency of co-integration events and the integrity of the T-DNA borders
The GE efficiency for the high-through functional genomics studies could be increased by co-delivering multiple gRNAs targeting the same gene [26]. gRNAs could be coded on the single expression plasmid (e.g., tRNA or ribozyme expression cassettes) or the separate plasmids [27]. We cloned ten different seeding sequences into the JD633 plasmid, transformed them separately into Agrobacterium and performed five individual co-transformation experiments by mixing two Agrobacterium isolates before the embryo’s inoculation. We screened 10 T0 plants, each regenerated from 5 independent co-transformation events, with around half of them (48 ± 17.8%) being PCR-positive for both gRNAs co-delivered (Supplementary Figure S2).
During the Agrobacterium-initiated T-DNA delivery, the right border is protected from the exonuclease cleavage by covalently linked VirD2 protein, whereas the left edge is prone to truncations [28]. For this reason, plant selection cassettes are usually placed closer to the left border to select for transgenic events with intact left and right border regions. We tested the integrity of the left and right T-DNA borders in ten randomly selected T0 transgenic plants transformed with the JD633::gRNA#10 plasmid using primers placed at different distances from the borders. Three separate forward primers (LB-F1, F2 and F3) and one standard reverse primer (LB-R) were used for the left border. For the right border, we used one common forward primer (RB-F) and two reverse (RB-R1 and R2) primers (Figure 3A). Seven out of ten plants tested had an intact left border, whereas only three plants had a complete right border (Figure 3B). At the same time, all but one plant (T0 plant #22) had an entire gRNA cassette at the right border, as seen from the presence of the RB-1 PCR fragment. Overall, we observed truncations at both borders. Nevertheless, these deletions were at a distance from the essential components of the cassettes.
3.4. Agrobacterium-mediated wheat transformation results in the efficient generation of gene-edited plants
Previously, others and we have demonstrated that biolistic-mediated transformation can effectively generate edited wheat plants [17,29]. Here we tested the efficiency of GE with the single guide RNA (gRNA#10) targeting six copies of the wheat GRAIN WIDTH and WEIGHT2 gene (TaGW2) [30]. The gene encodes a RING-type E3 ubiquitin ligase, found initially to regulate rice grain weight by increasing the cell number of spikelet hulls [31]. We analyzed 46 T0 lines for the presence of edits at the target sites using the cleaved amplified polymorphic sequence assay (CAPS), with 27 of the lines (59%) demonstrating various levels of edits at three sub-genomes (Supplementary Figure S3). All but one edited line were heterozygous/chimeric for the presence of edits. We randomly selected 12 lines and propagated them into the T1 generation to test for the transgenerational inheritance of the edits. The 24 lines (two T1s per parental line) were screened for the presence of the transgene cassette and the edits. Fifty percent of the screened progeny contained different levels of edits at the target site, with one plant (T1 plant# 9-2, Supplementary Figure S4) having disrupted all six copies of the gene.
Although CAPS assay remains a highly robust method for detecting the GE events in polyploid crops, it relies on a restriction site at the gRNA cut site, which is not always the case. We decided to compare the GE rate detection between the CAPS assay and the probe-based qPCR method for the T0 transgenics generated with JD633::gRNA#10. The qPCR assay is less labour-intensive and allows higher throughput analysis than the CAPS assay. The GE events were quantified for three sub-genomes in 13 plants for the CAPS assay, and an average GE rate per T0 transgenic plant was calculated (Figure 4A). The same 13 plants were analyzed using the qPCR-based method with the universal primers designed to span the target regions for all three sub-genomes with the probe annealing to the gRNA cut site. Eventually, the GE rates for the qPCR assay were calculated through the normalization of ΔΔCt values of transgenic plants to WT control (ΔΔCtnorm, cv. Fielder), and the 1/ΔΔCtnorm ratios were used for plotting. We observed a significant positive correlation between the two quantification assays (Pearson’s correlation, R = 0.81, p = 0.0008, Figure 4B). Therefore, we decided to use the qPCR-based assay to quantify GE rates.
We generated ten constructs with gRNA seeding sequences cloned into the JD633 plasmid, targeting seven genes (Table 2). Every gRNA was designed to mutagenize three gene homeologs per haploid genome with 30 regions (Figure 6A). We generated 65 T0 plants with at least three independent plants per gRNA.

Table 2.
gRNAs cloned into JD633 plasmid and used for Agrobacterium-mediated wheat transformation.
| gRNA | Target gene | Homeolog IDs | Activity score, WheatCrispr [32] |
|---|---|---|---|
| gRNA#1 |
TRYPTOPHAN SYNTHASE, ALPHA CHAIN (TaTRP_SYNTHASE_SUA) |
TraesCS1A02G428400, TraesCS1B02G463100, TraesCS1D02G437700 | 0.35 |
| gRNA#2 | INOSITOL TETRA-/PENTAPHOSPHATE 2-KINASE (TaIPK1) | TraesCS2A02G497700, TraesCS2B02G525900 TraesCS2D02G612600LC | 0.45 |
| gRNA#3 | INOSITOL TETRA-/PENTAPHOSPHATE 2-KINASE (TaIPK1) | TraesCS2A02G497700, TraesCS2B02G525900 TraesCS2D02G612600LC | 0.39 |
| gRNA#4 | MANGANESE-SUPEROXIDE DISMUTASE (TaMnSOD) | TraesCS2A02G537100, TraesCS2B02G567600, TraesCS2D02G538300 | 0.42 |
| gRNA#5 | WHEAT PROLAMIN-BOX BINDING FACTOR (TaWPBF) | TraesCS5A02G155900, TraesCS5B02G154100, TraesCS5D02G161000 | 0.44 |
| gRNA#6 | DEMETER (TaDME) | TraesCS5A02G169000, TraesCS5B02G165800, TraesCS5D02G173300 | 0.46 |
| gRNA#7 | DEMETER (TaDME) | TraesCS5A02G169000, TraesCS5B02G165800, TraesCS5D02G173300 | 0.46 |
| gRNA#8 | QUANTITATIVE TRAIT LOCUS ON SEED DORMANCY 1 (TaQSD1) | TraesCS5A02G216200, TraesCS5B02G214700, TraesCS5D02G224200 | 0.47 |
| gRNA#9 | QUANTITATIVE TRAIT LOCUS ON SEED DORMANCY 1 (TaQSD1) | TraesCS5A02G216200, TraesCS5B02G214700, TraesCS5D02G224200 | 0.46 |
| gRNA#10 | GRAIN WIDTH and WEIGHT2 (TaGW2) | TraesCS6A02G189300, TraesCS6B02G215300, TraesCS6D02G176900 | 0.45 |
Mean normalized GE rates for T0 plants were quantified using the probe-based qPCR method varied from 1.29 to 35.15, with gRNA#9 showing the highest activity (Figure 5, Supplementary Table S4). Overall, we observed no correlation between activity scores (Table 2, using models devised by [33]) and the activity of gRNAs tested in our study (Pearson’s R = -0.22, p = 0.55).
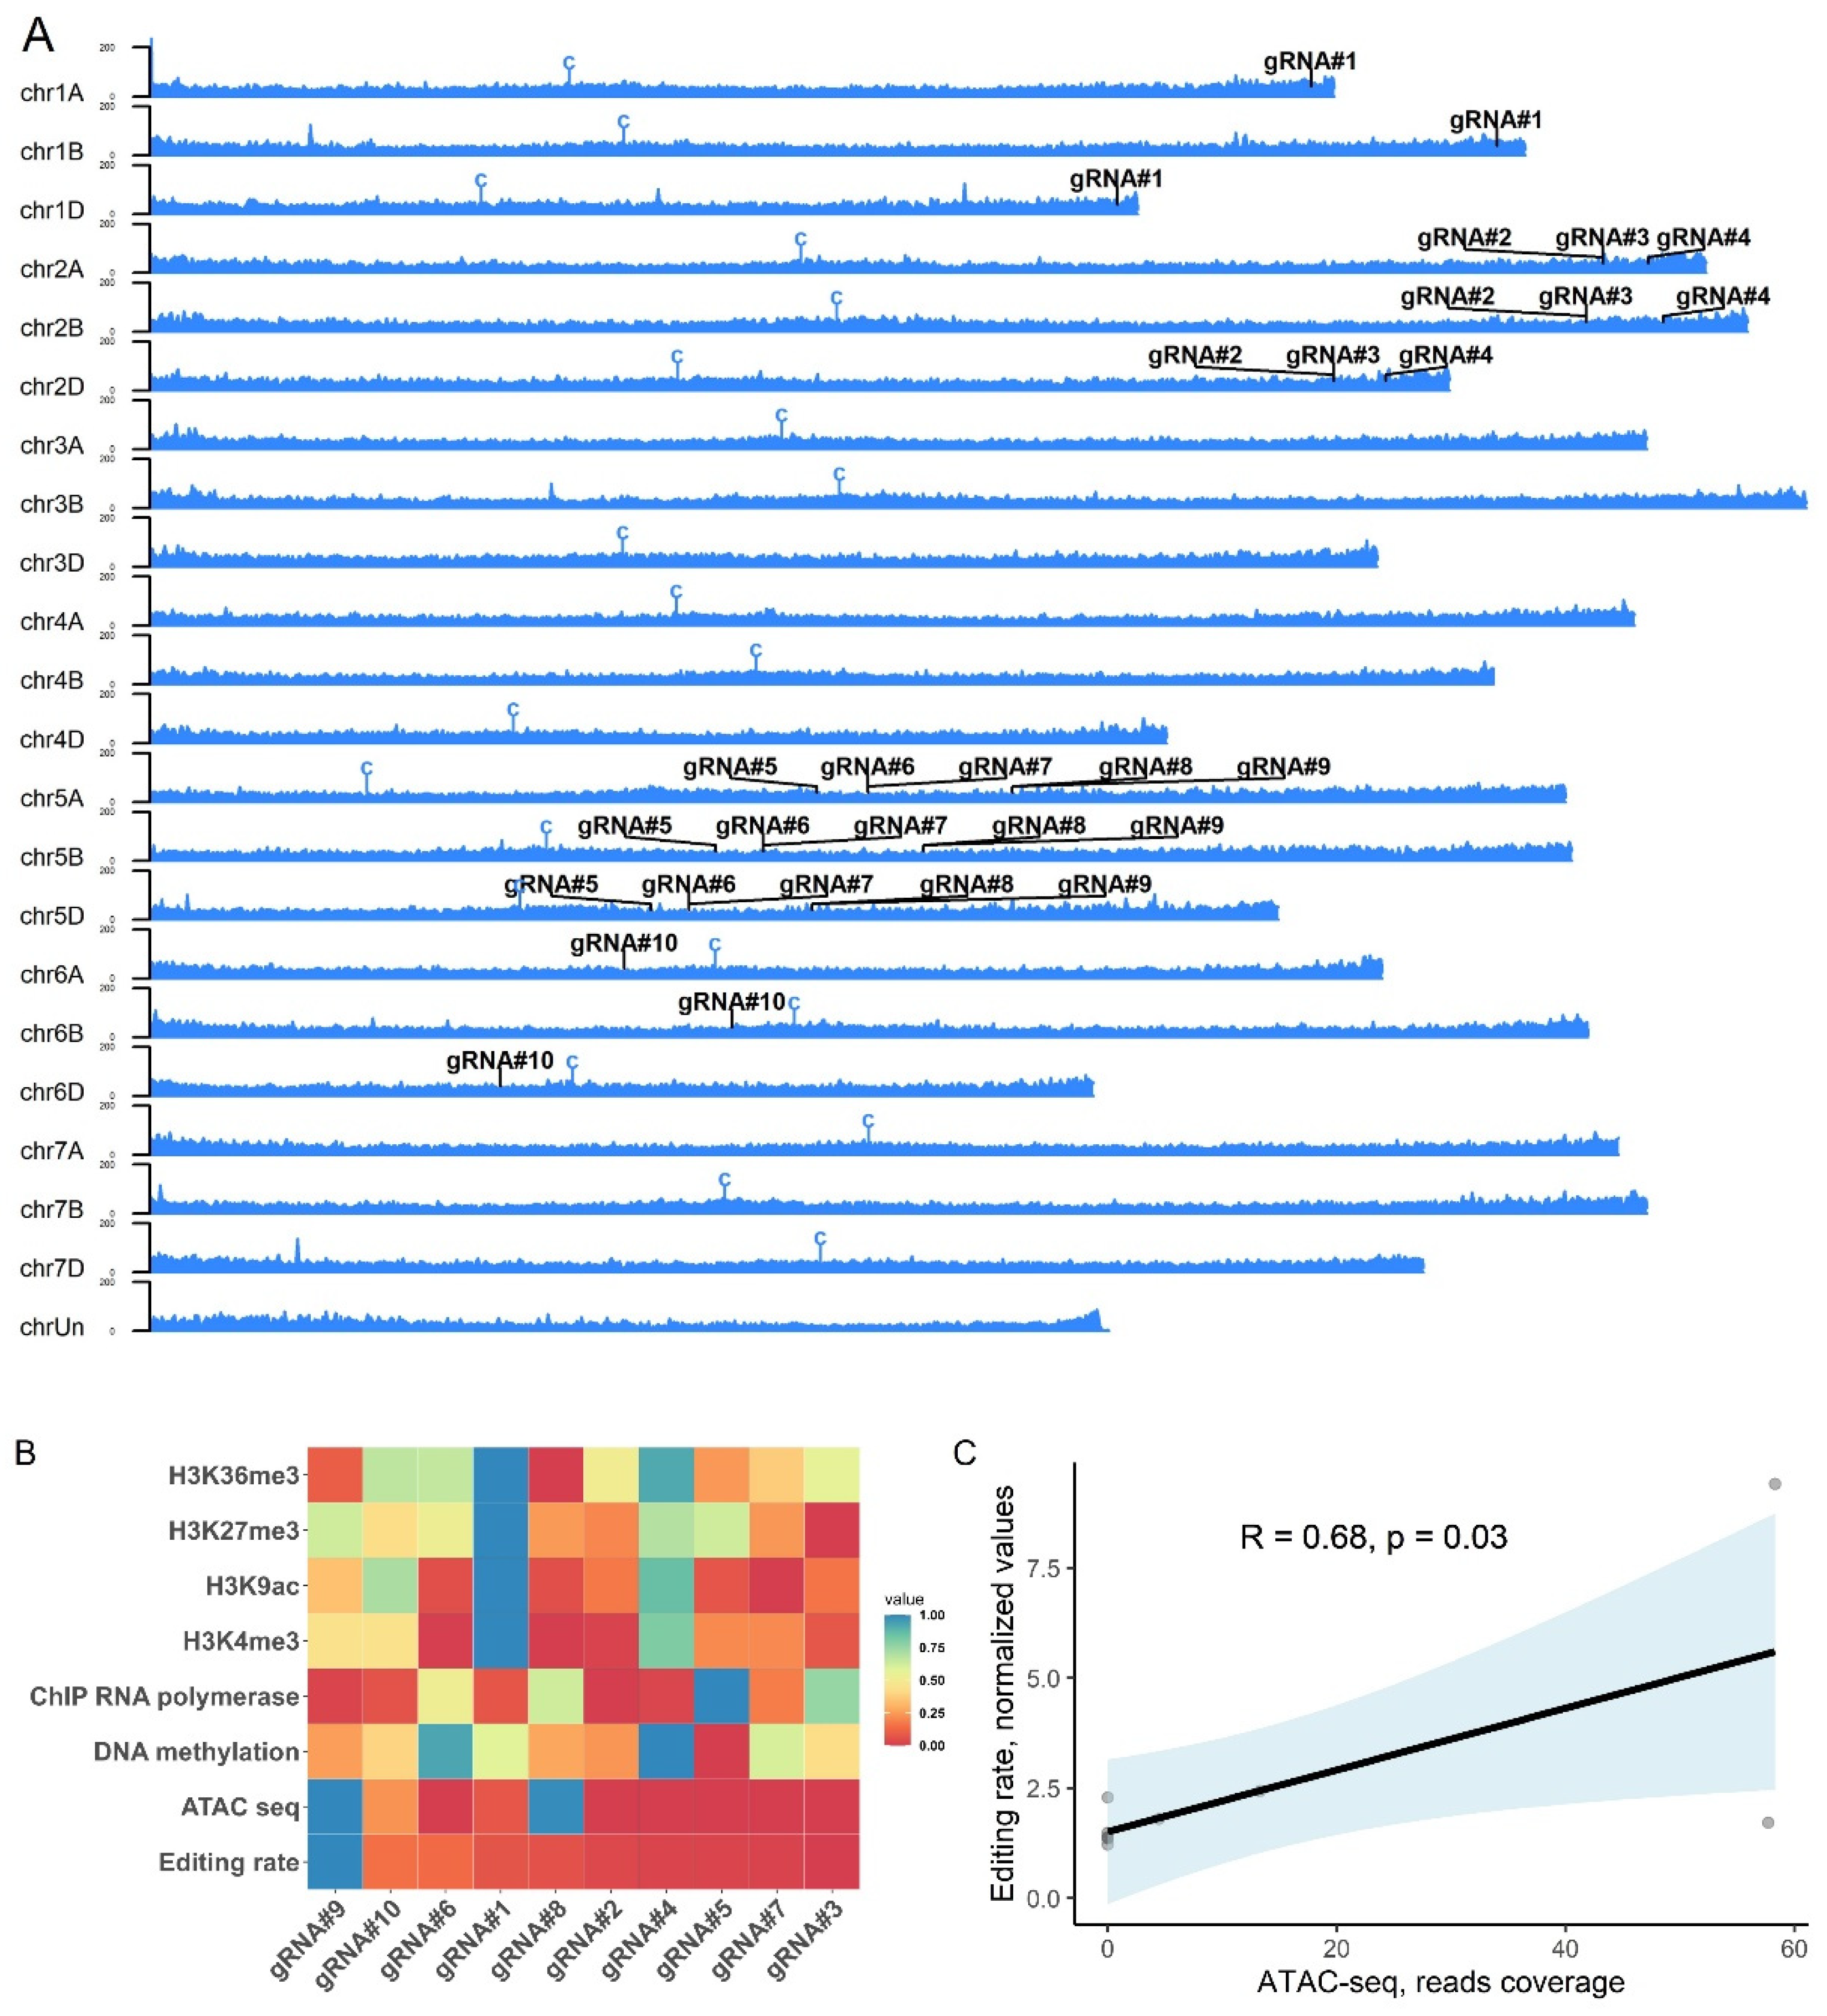
Editing efficiency in plants can vary depending on gRNA used, with both sequence-dependency and epigenetic profile suggested as the reasons for inconsistent GE rates among different loci [12,13]. Therefore, we decided to test whether the epigenetic profile at the target loci can affect the mutagenesis rates observed in our study. The nucleotide resolution data for six epigenetic profiles (DNA methylation, H3K4me3, H3K9ac, H3K27me3, H3K36me3, ATAC-seq) and RNA polymerase II-ChIP [14,23] for corresponding gRNAs were extracted from available datasets for wheat (cv. Chinese Spring) seedlings and correlated with the mean GE rates observed in Figure 5. We observed a significant positive correlation between the average mutagenesis rates for ten gRNA and ATAC-seq data (Pearson’s correlation, R = 0.68, p = 0.03, Figure 6B,C). At the same time, no correlation was observed for the rest of the epigenetic marks analyzed (Supplementary Table S5).
Figure 6.
Effect of epigenetic profile at the target loci on the editing efficiency of selected gRNAs in wheat. (A) Ideogram of the ATAC sequencing reads distribution along the wheat chromosomes (cv. Chinese Spring, PRJNA552871, [34]) with the positions of ten gRNAs tested in this study. Centromeres are denoted with a “C” symbol. The Y-axis scale shows an intensity of mapped reads to the chromosome position. (B) Heatmap of GE rate for individual gRNAs (x-axis) for distinct epigenetic marks (y-axis). The heatmap represents non-clustered scaled values (from 0 to 1) for editing rate and nucleotide-resolution epigenetic marks at the gRNA target site plus three nucleotides of the PAM sequence (20 + 3 nt, except the gRNA#10 – 19 + 3 nt). (C) Correlation analysis of the ATAC-seq data and GE rates for ten gRNAs estimated using qPCR. The trendline was plotted with light blue indicating the standard error. The R- and p-values were calculated using Pearson's correlation coefficient.
4. Discussion
Here we characterized transgenic and GE events in wheat generated with the co-delivery of the GRF4-GIF1 using Agrobacterium-mediated transformation [15]. The method is based on a high-efficiency proprietary transformation protocol (PureWheat® technology) developed by Japan Tobacco Inc. (Shizuoka, Japan) for the wheat cv. Fielder [35,36]. The protocol has been successfully applied to transform Chinese and Australian commercial varieties [35,37] with up to 50% transformation efficiencies. In our hands, the expression of a GRF4-GIF1 chimera [8] was required to achieve high transformation efficiency from 22% to 68% of the cv. Fielder. This is a significant increase from the biolistic-mediated transformation (0.1-1%) previously used in our study [17]. Similarly to the recently developed “QuickWheat” transformation method with overexpression of maize WUS and BBM genes [7], we observed a low 5% escape rate on hygromycin selection, as confirmed by PCR. The quality of transgenic events was evaluated by estimating the transgene copy number and integrity of the T-DNA borders. Most T0 plants tested had multicopy transgene integrations and sequence truncations at the right and left borders. At the same time, low copy (2, 3 copies) transgenic events could still be generated and were faithfully propagated into the following generation. Similarly, the border truncations were limited only to the borders of the T-DNA region and did not affect the essential components of the transgene. High-copy number transgene integration events can lead to transgenerational transgene silencing [38] and complicate screening for transgene-free plants with the presence of edits. It needs to be further explored if the quality of transgene events can be controlled by manipulating the transformation conditions or using alternative embryogenesis genes. Additionally, it will be essential to test for the presence of the sequences outside of the T-DNA region (plasmid backbone) in transgenic plants to calculate the rate of the ‘quality event (QE),’ as has been shown in other crops [39].
Overcoming the bottleneck of stable wheat transformation opens the possibility for population-scale genetic engineering using the CRISPR/Cas9 technology. Targeted mutagenesis at the population scale allows for rapid hypothesis-driven screening of the candidate genes with CRISPR/Cas9-generated multiple alleles for the presence of desirable phenotype. Such an approach has been successfully implemented in rice, where high transformation rates allow for efficient generation of transgenics population with diverse gRNAs. For example, generating a large-scale mutant library was possible by targeting 12 802 genes highly expressed in rice shoot base tissue with more than 25 000 corresponding sgRNAs [40].
We decided to test the efficiency of the co-delivery of two different gRNAs cloned into the JD633 plasmid. Two Agrobacterium cultures carrying unique gRNAs were mixed before immature embryo inoculation, and T0 plants were screened for both transgenes (Supplementary Table S4). On average, we observed 48 ± 17.8% co-integration events in 5 independent co-transformation experiments. It remains to be shown whether co-transformation with the higher number of gRNAs could lead to the transgenic population with fewer co-integration events/plant. The ability to generate a high proportion of plants with the single gRNA integrations from the embryos infected with the Agrobacterium mixture allows for the high-throughput targeted mutagenesis of the coding sequences or regulatory regions of the genes with the following phenotyping of the regenerated edited population. On the other hand, if the mutations act synergistically, a combination of a few gRNAs targeting different genes in a single plant could be beneficial for the fast recovery of the mutants with a desired phenotype. We successfully recovered T0 plants with GE events at three sub-genomes as determined using CAPS and probe-based qPCR assays (Figure 4 and S3) for the previously tested gRNA#10 [17]. The mutagenized loci were faithfully propagated into the following generation (Supplementary Figure S4). We further evaluated the GE rate for nine more gRNAs targeting six genes or 27 regions across the wheat genome (sub-genomes A, B and D, Figure 6A). We observed a drastic difference in the mutagenesis efficiency among tested gRNA (over 27-fold difference between the least and the most active gRNAs, Figure 5) with no correlation between GE rate and activity scores using models devised by [33] (Pearson’s R = -0.22, p = 0.55).
Recent research has shown that the chromatin contexts play a crucial role in the effectiveness of CRISPR/Cas9-mediated genome editing, as highlighted in several studies [41,42,43,44]. These investigations have consistently revealed that the presence of heterochromatic features within the CRISPR target regions can hinder the efficiency of CRISPR/Cas9 mutagenesis in various systems, including yeast, Arabidopsis, rice, mouse, and human cell lines [13,41,42,43,44]. Curiously, drastic variance in the epigenetic profile can result in a 250-fold difference in CRISPR activity between the identical target sequences [13]. Similarly, in our study, the gRNA activity had a significant positive correlation with the ATAC-seq data for leaves in 14-day-old seedlings [14] ((Pearson’s correlation, R = 0.68, p = 0.03, Figure 6C). At the same time, there was no relation between other epigenetic signatures (DNA methylation, H3K4me3, H3K9ac, H3K27me3, H3K36me3, and RNA polymerase II-ChIP) and mutagenesis rate for ten gRNAs in our experiments (Figure 6A and Supplementary Table S5). The JD633 plasmid used in our study contains constitutive maize Ubi promoter that drives the Cas9 expression, and the gRNA expression is driven by the TaU6 promoter. If Cas9 and gRNA are actively expressed in calli, targeted mutations could accumulate early in plant regeneration. In the future, it will be essential to examine the epigenetic profile at the early stages of callogenesis in calli produced using GRF-GIF co-delivery and correlate it to GE rates at different loci to conclude the contribution of these factors to the CRISPR/Cas9 mutagenesis. In the current study, we used ChIP-seq, DNA methylation and ATAC-seq data generated from the leaves of wheat seedlings which may differ from the epigenetic profile in developing calli due to somaclonal variation [45,46]. Moreover, GRF-GIF-induced embryogenesis may lead to more accessible chromatin necessary for the highly-active transcription in dividing cells. Overall, careful epigenetic profiling of the developing calli induced with GRF-GIF expression may provide additional information on the role of chromatin marks in CRISPR/Cas9 mutagenesis.
5. Conclusion
The co-delivery of the GRF-GIF cassette using Agrobacterium-mediated transformation results in the efficient and robust generation of transgenic and edited plants in cv. Fielder. At the same time, since gene-edited crops are not regulated in several countries when the transgene is segregated away [47], care needs to be taken when selecting transgenic edited T0 lines for propagation due to the multiple copy integration events observed in our study. Furthermore, the efficiency of GE in wheat could be increased by selecting gRNA target sites located in the open chromatin with permissive epigenetic marks.
Supplementary Materials
The following supporting information can be downloaded at the website of this paper posted on Preprints.org. Supplementary Figure S1. Correlation analysis for the copy number variation (CNV) of the transgene and Cas9 gene expression for T1 transgenic plants generated using Agrobacterium-mediated transformation and JD633::gRNA#10 plasmid. The error bars represent the Poisson CNV Max and Min values for CNV and the standard error of the mean for Cas9 expression. The trendline was plotted with light blue, indicating the standard error. The R- and p-values were calculated using Pearson's correlation coefficient. Supplementary Figure S2. Representative gel image of the PCR screening of the T0 wheat transgenics for the co-integration events for gRNAs#8 and #9. (A) and (B) are gRNAs#8 and #9, respectively. + - positive control. Supplementary Figure S3. Screening of T0 transgenic wheat lines (cv. Fielder) for the presence of gene editing events at the target loci using cleaved amplified polymorphic sequences (CAPS) assay. The plants were generated using Agrobacterium-mediated transformation and co-delivery of the GRF-GIF chimeric construct. gRNA seeding sequence targeting three sub-genomic copies of TaGW2 was cloned into JD633 plasmid carrying GRF-GIF and Cas9/gRNA expression cassettes. CAPS assay for three sub-genomes targeted by gRNA-TaGW2 was performed as described before [17]. PC-D – positive control, digested (cv. Fielder), PC-UD - Positive control, undigested (cv. Fielder), L - ladder. Supplementary Figure S4. Propagation of the GE events in the T1 lines transformed with JD633::gRNA#10. (A) gRNA#10 (gRNA-TaGW2) described before [30] was cloned into JD633 plasmid and transformed into cv. Fielder. Universal primers, TaGW2-F and TaGW2-R, were used to amplify the target region from sub-genomes A, B and D. Upon successful editing event, the internal SmaI restriction site is disrupted and can be visualized as an undigested product on the agarose gel. (B) CAPS assay was analyzed on 1% agarose gel for the T1 transgenic progeny. D – digested control (cv. Fielder), UD – undigested control (cv. Fielder), L - ladder. Supplementary Table S1. Optimization of the transgene copy number quantification in wheat T0 transgenics using ddPCR. Comparison between 10 ng and 350 ng gDNA amounts. Supplementary Table S2. Optimization of the transgene copy number quantification in wheat T0 transgenics using ddPCR. Comparison between 1 hour versus 12 hours of gDNA digestion. Supplementary Table S3. Estimating the gene editing rate in T0 and T1 plants versus transgene copy number. Supplementary Table S4. Probe-based qPCR analysis of GE events for ten gRNAs in T0 wheat transgenics generated using Agrobacterium-mediated transformation method and the JD633 plasmid. Supplementary Table S5. Epigenetic profile at the gRNA target regions. Supplementary Table S6. Primers used in the study.
Author Contributions
Conceptualization, A.B., N.B.; methodology, A.B., S.B., and K.W.; formal analysis, A.B.; writing—original draft preparation, A.B., N.B.; writing—review and editing, L.L. and A.B.; visualization, A.B.; supervision, A.B., N.B.; project administration, A.B., S.B., and K.W.; funding acquisition, A.B., N.B. All authors have read and agreed to the published version of the manuscript.
Funding
This research was funded by Manitoba Crop Alliance (grant# 20210601), Agriculture Development Fund (grant# 20210601), Alberta Wheat Commission (grant# 22AWC134A), Saskatchewan Wheat Development Commission (grant# 216-211124), Western Grains Research Foundation (grant# AGR2218) and Agriculture and Agri-Food Canada (grant# J-002616).
Acknowledgments
We want to acknowledge Agriculture and Agri-Food Canada, Manitoba Crop Alliance, Saskatchewan Wheat Development Commission, Alberta Wheat Commission, Western Grains Research Foundation, and Agriculture Development Fund for financial support. We would like to thank Fizza Fatima for the help with constructing an ideogram.
Conflicts of Interest
The authors declare no conflict of interest. The funders had no role in the design of the study; in the collection, analyses, or interpretation of data; in the writing of the manuscript; or in the decision to publish the results.
References
- Walkowiak, S., et al., Multiple wheat genomes reveal global variation in modern breeding. Nature, 2020. 588(7837): p. 277-283. [CrossRef]
- Davière, J.M. and P. Achard, A Pivotal Role of DELLAs in Regulating Multiple Hormone Signals. Mol Plant, 2016. 9(1): p. 10-20. [CrossRef]
- Rebetzke, G.J., et al., Genotypic increases in coleoptile length improves stand establishment, vigour and grain yield of deep-sown wheat. Field Crops Research, 2007. 100(1): p. 10-23. [CrossRef]
- Chen, H., M. Neubauer, and J.P. Wang, Enhancing HR Frequency for Precise Genome Editing in Plants. Frontiers in Plant Science, 2022. 13. [CrossRef]
- Lazar, S., et al., RECAS9: Recombining wild species introgression via mitotic gene editing in barley. bioRxiv, 2020: p. 2020.01.07.897280.
- Wang, K., et al., The gene TaWOX5 overcomes genotype dependency in wheat genetic transformation. Nat Plants, 2022. 8(2): p. 110-117. [CrossRef]
- Johnson, K., et al., Rapid and highly efficient morphogenic gene-mediated hexaploid wheat transformation. Frontiers in Plant Science, 2023. 14. [CrossRef]
- Debernardi, J.M., et al., A GRF-GIF chimeric protein improves the regeneration efficiency of transgenic plants. Nat Biotechnol, 2020. 38(11): p. 1274-1279. [CrossRef]
- Allen, F., et al., Predicting the mutations generated by repair of Cas9-induced double-strand breaks. Nat Biotechnol, 2018. [CrossRef]
- Concordet, J.P. and M. Haeussler, CRISPOR: intuitive guide selection for CRISPR/Cas9 genome editing experiments and screens. Nucleic Acids Res, 2018. 46(W1): p. W242-W245. [CrossRef]
- Xiang, X., et al., Enhancing CRISPR-Cas9 gRNA efficiency prediction by data integration and deep learning. Nat Commun, 2021. 12(1): p. 3238. [CrossRef]
- Naim, F., et al., Are the current gRNA ranking prediction algorithms useful for genome editing in plants? PLoS One, 2020. 15(1): p. e0227994.
- Weiss, T., et al., Epigenetic features drastically impact CRISPR–Cas9 efficacy in plants. Plant Physiology, 2022. 190(2): p. 1153-1164. [CrossRef]
- Concia, L., et al., Wheat chromatin architecture is organized in genome territories and transcription factories. Genome Biol, 2020. 21(1): p. 104. [CrossRef]
- Hayta, S., et al., An Efficient Agrobacterium-Mediated Transformation Protocol for Hexaploid and Tetraploid Wheat. Curr Protoc, 2021. 1(3): p. e58. [CrossRef]
- An, G., et al., Binary vectors. pp. 1988, A3/1-19, In: Gelvin, SB and. Schilperoort, RA (eds.), Plant molecular ….
- Xu, W., et al., Evaluation of Factors Affecting In Planta Gene Editing Efficiency in Wheat (Triticum aestivum L.). ACS Agricultural Science & Technology, 2022. 2(2): p. 222-231. [CrossRef]
- Collier, R., et al., Accurate measurement of transgene copy number in crop plants using droplet digital PCR. 2017. 90(5): p. 1014-1025. [CrossRef]
- Warner, P., et al., An investigation of a rapid DNA extraction method for routine MAS in the S.A. Barley Improvement Program. 2002.
- Jouanin, A., et al., Optimisation of droplet digital PCR for determining copy number variation of α-gliadin genes in mutant and gene-edited polyploid bread wheat. Journal of Cereal Science, 2020. 92: p. 102903. [CrossRef]
- Garrido, J., M. Aguilar, and P. Prieto, Identification and validation of reference genes for RT-qPCR normalization in wheat meiosis. Sci Rep, 2020. 10(1): p. 2726.
- Coulter, S.J., Mitigation of the effect of variability in digital PCR assays through use of duplexed reference assays for normalization. BioTechniques, 2018. 65(2): p. 86-91. [CrossRef]
- Jia, J., et al., Homology-mediated inter-chromosomal interactions in hexaploid wheat lead to specific subgenome territories following polyploidization and introgression. Genome Biology, 2021. 22(1): p. 26. [CrossRef]
- International Wheat Genome Sequencing, C., Shifting the limits in wheat research and breeding using a fully annotated reference genome. Science, 2018. 361(6403).
- Gel, B. and E. Serra, karyoploteR: an R/Bioconductor package to plot customizable genomes displaying arbitrary data. Bioinformatics, 2017. 33(19): p. 3088-3090. [CrossRef]
- Luo, J., et al., Pyramiding favorable alleles in an elite wheat variety in one generation by CRISPR-Cas9-mediated multiplex gene editing. Molecular Plant, 2021. 14(6): p. 847-850. [CrossRef]
- Abdelrahman, M., et al., Multiplex Genome-Editing Technologies for Revolutionizing Plant Biology and Crop Improvement. Frontiers in Plant Science, 2021. 12. [CrossRef]
- Gelvin, S.B., Integration of Agrobacterium T-DNA into the Plant Genome. Annual Review of Genetics, 2017. 51(1): p. 195-217. [CrossRef]
- Li, J., et al., Efficient multiplex genome editing by CRISPR/Cas9 in common wheat. Plant Biotechnol J, 2021. 19(3): p. 427-429. [CrossRef]
- Wang, W., et al., Transgenerational CRISPR-Cas9 Activity Facilitates Multiplex Gene Editing in Allopolyploid Wheat. Crispr j, 2018. 1(1): p. 65-74. [CrossRef]
- Song, X.J., et al., A QTL for rice grain width and weight encodes a previously unknown RING-type E3 ubiquitin ligase. Nat Genet, 2007. 39(5): p. 623-30. [CrossRef]
- Cram, D., et al., WheatCRISPR: a web-based guide RNA design tool for CRISPR/Cas9-mediated genome editing in wheat. BMC Plant Biology, 2019. 19(1): p. 474. [CrossRef]
- Doench, J.G., et al., Optimized sgRNA design to maximize activity and minimize off-target effects of CRISPR-Cas9. Nat Biotechnol, 2016. 34(2): p. 184-191. [CrossRef]
- Concia, L., et al., Wheat chromatin architecture is organized in genome territories and transcription factories. Genome Biology, 2020. 21(1): p. 104. [CrossRef]
- Richardson, T., et al., Efficient Agrobacterium transformation of elite wheat germplasm without selection. Plant Cell, Tissue and Organ Culture (PCTOC), 2014. 119(3): p. 647-659. [CrossRef]
- Ishida, Y., et al., Wheat (Triticum aestivum L.) Transformation Using Immature Embryos, in Agrobacterium Protocols: Volume 1, K. Wang, Editor. 2015, Springer New York: New York, NY. p. 189-198.
- Wang, K., et al., Generation of marker-free transgenic hexaploid wheat via an Agrobacterium-mediated co-transformation strategy in commercial Chinese wheat varieties. Plant Biotechnol J, 2017. 15(5): p. 614-623. [CrossRef]
- Gelvin, S.B., Agrobacterium-mediated plant transformation: the biology behind the "gene-jockeying" tool. Microbiol Mol Biol Rev, 2003. 67(1): p. 16-37, table of contents.
- Che, P., et al., Wuschel2 enables highly efficient CRISPR/Cas-targeted genome editing during rapid de novo shoot regeneration in sorghum. Communications Biology, 2022. 5(1): p. 344. [CrossRef]
- Meng, X., et al., Construction of a Genome-Wide Mutant Library in Rice Using CRISPR/Cas9. Molecular Plant, 2017. 10(9): p. 1238-1241. [CrossRef]
- Wu, X., et al., Genome-wide binding of the CRISPR endonuclease Cas9 in mammalian cells. Nat Biotechnol, 2014. 32(7): p. 670-6. [CrossRef]
- Daer, R.M., et al., The Impact of Chromatin Dynamics on Cas9-Mediated Genome Editing in Human Cells. ACS Synth Biol, 2017. 6(3): p. 428-438. [CrossRef]
- Yarrington, R.M., et al., Nucleosomes inhibit target cleavage by CRISPR-Cas9 in vivo. Proc Natl Acad Sci U S A, 2018. 115(38): p. 9351-9358. [CrossRef]
- Liu, G., et al., Modulating chromatin accessibility by transactivation and targeting proximal dsgRNAs enhances Cas9 editing efficiency in vivo. Genome Biol, 2019. 20(1): p. 145. [CrossRef]
- Miguel, C. and L. Marum, An epigenetic view of plant cells cultured in vitro: somaclonal variation and beyond. Journal of Experimental Botany, 2011. 62(11): p. 3713-3725. [CrossRef]
- Lee, K. and P.J. Seo, Dynamic Epigenetic Changes during Plant Regeneration. Trends in Plant Science, 2018. 23(3): p. 235-247. [CrossRef]
- Buchholzer, M. and W.B. Frommer, An increasing number of countries regulate genome editing in crops. New Phytol, 2023. 237(1): p. 12-15. [CrossRef]
Figure 1.
Representative images of the wheat (cv. Fielder) transformation with the GRF-GIF chimera using A. tumefaciens (AGL1/pSoup). Some calli produce multiple green shoots (shown with white arrowheads), eventually regenerating into individual transgenic seedlings.
Figure 1.
Representative images of the wheat (cv. Fielder) transformation with the GRF-GIF chimera using A. tumefaciens (AGL1/pSoup). Some calli produce multiple green shoots (shown with white arrowheads), eventually regenerating into individual transgenic seedlings.
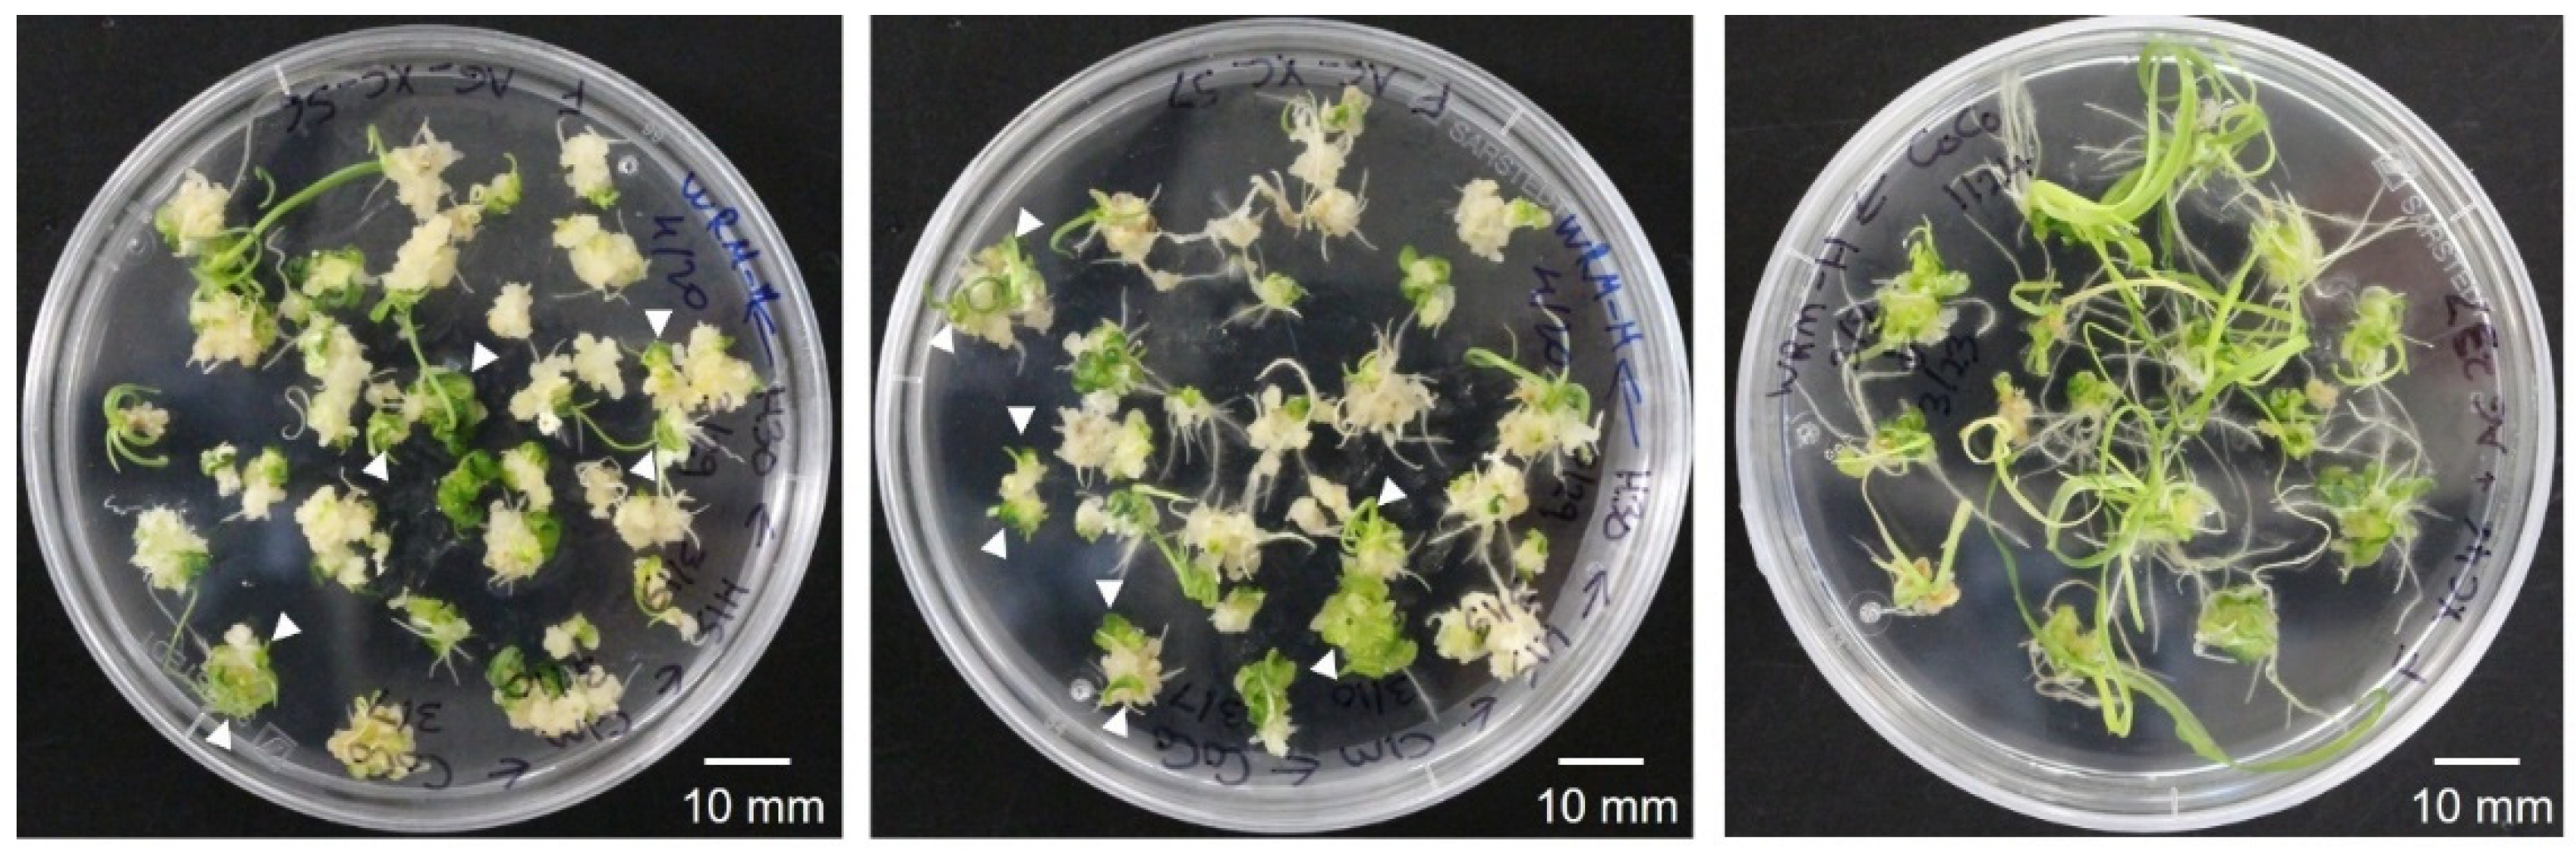
Figure 2.
Analysis of the transgene copy number in wheat T0 transgenic lines generated using Agrobacterium-mediated transformation and their progeny. (A) Copy number variation (CNV) of the transgene in the T0 plants transformed with JD633::gRNA#10 and estimated using ddPCR. Error bars represent Poisson CNV Max and Min values. (B) Estimation of the CNV values in selected T1 progeny. (C) Segregation analysis of the T2 population for selected lines (T2-2-1-1, T2-6-1-1, and T2-6-2-1) using hygromycin-specific primers (HYG-F and HYG-R). L – ladder, PC – plasmid positive control, NC- no template control.
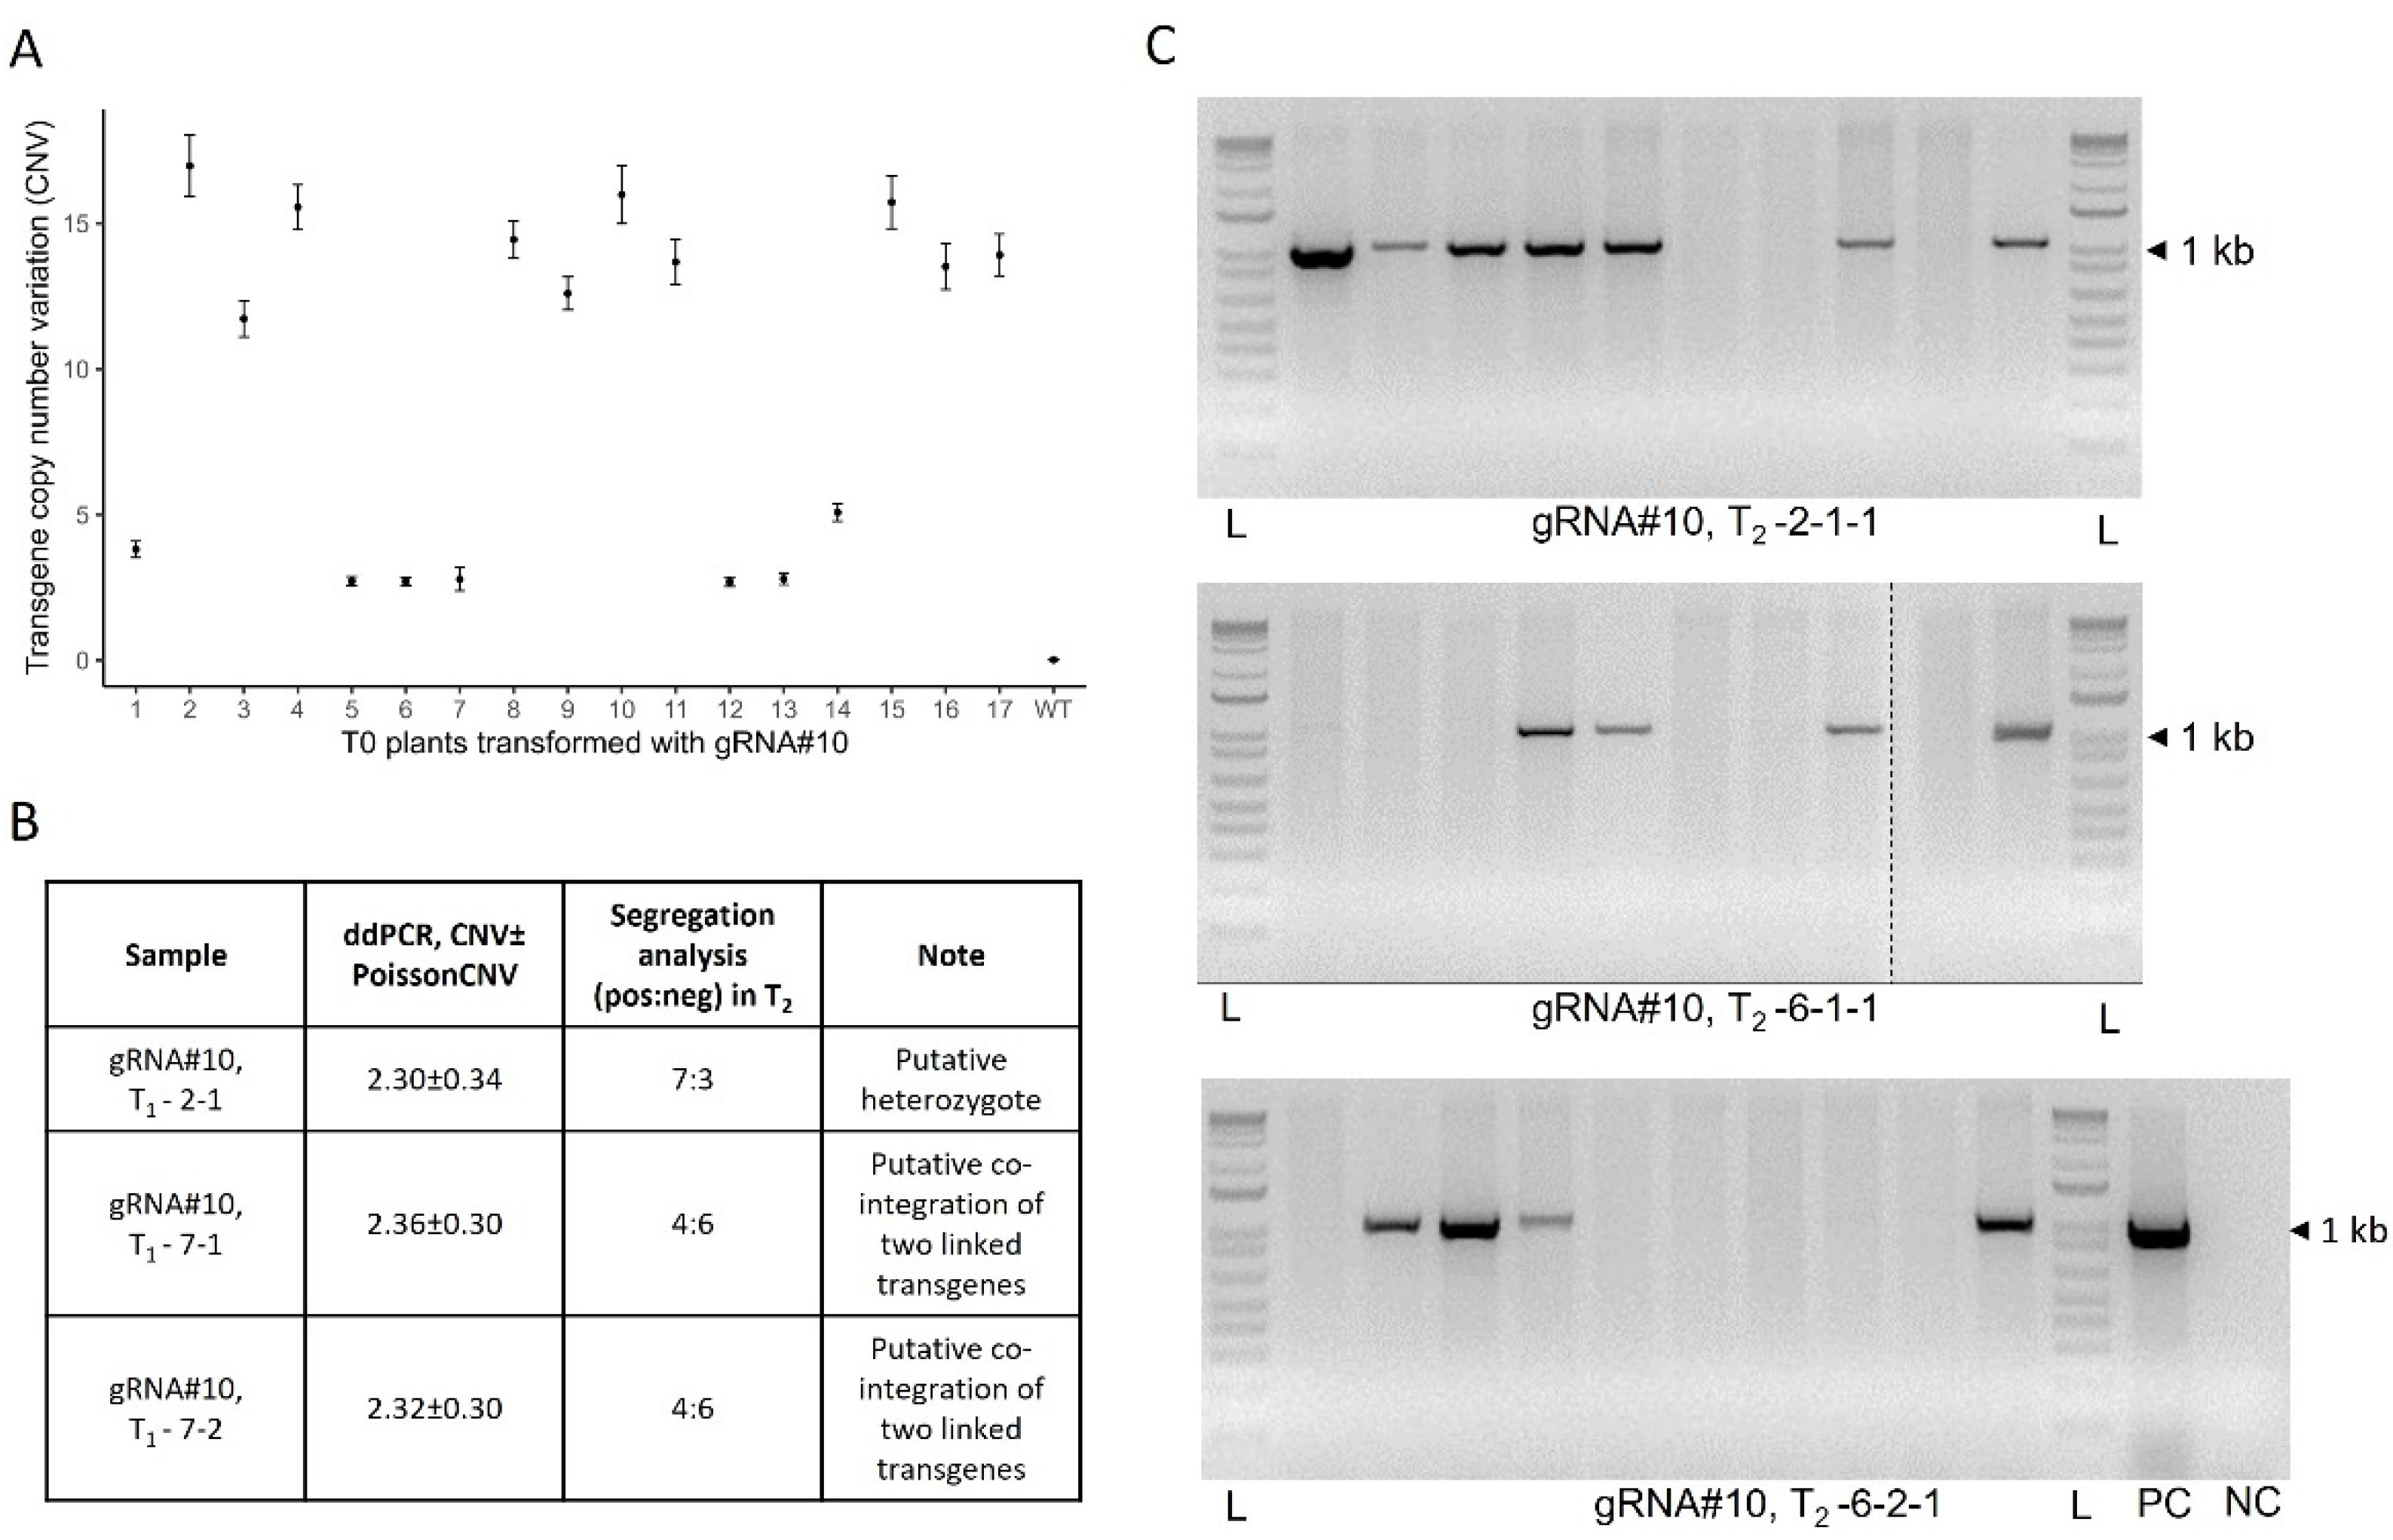
Figure 3.
Evaluation of the T-DNA borders integrity in T0 transgenics generated using Agrobacterium-mediated transformation with JD633::gRNA#10 plasmid. (A) Scheme of the JD633::gRNA#10 plasmid with the marked primer binding sites and PCR fragments generated for the analysis. Primers were designed to anneal either at the left or right borders (LB-F1 or RB-R2) or at different distances from the borders for the PCR-based screening of the T-DNAs integrity in transgenic plants. (B) Analysis of the PCR fragments on the 1% agarose gel. PC – plasmid positive control, NC – no-template control (cv. Fielder), L – ladder, LB – left border, RB – right border, * - unspecific amplification.
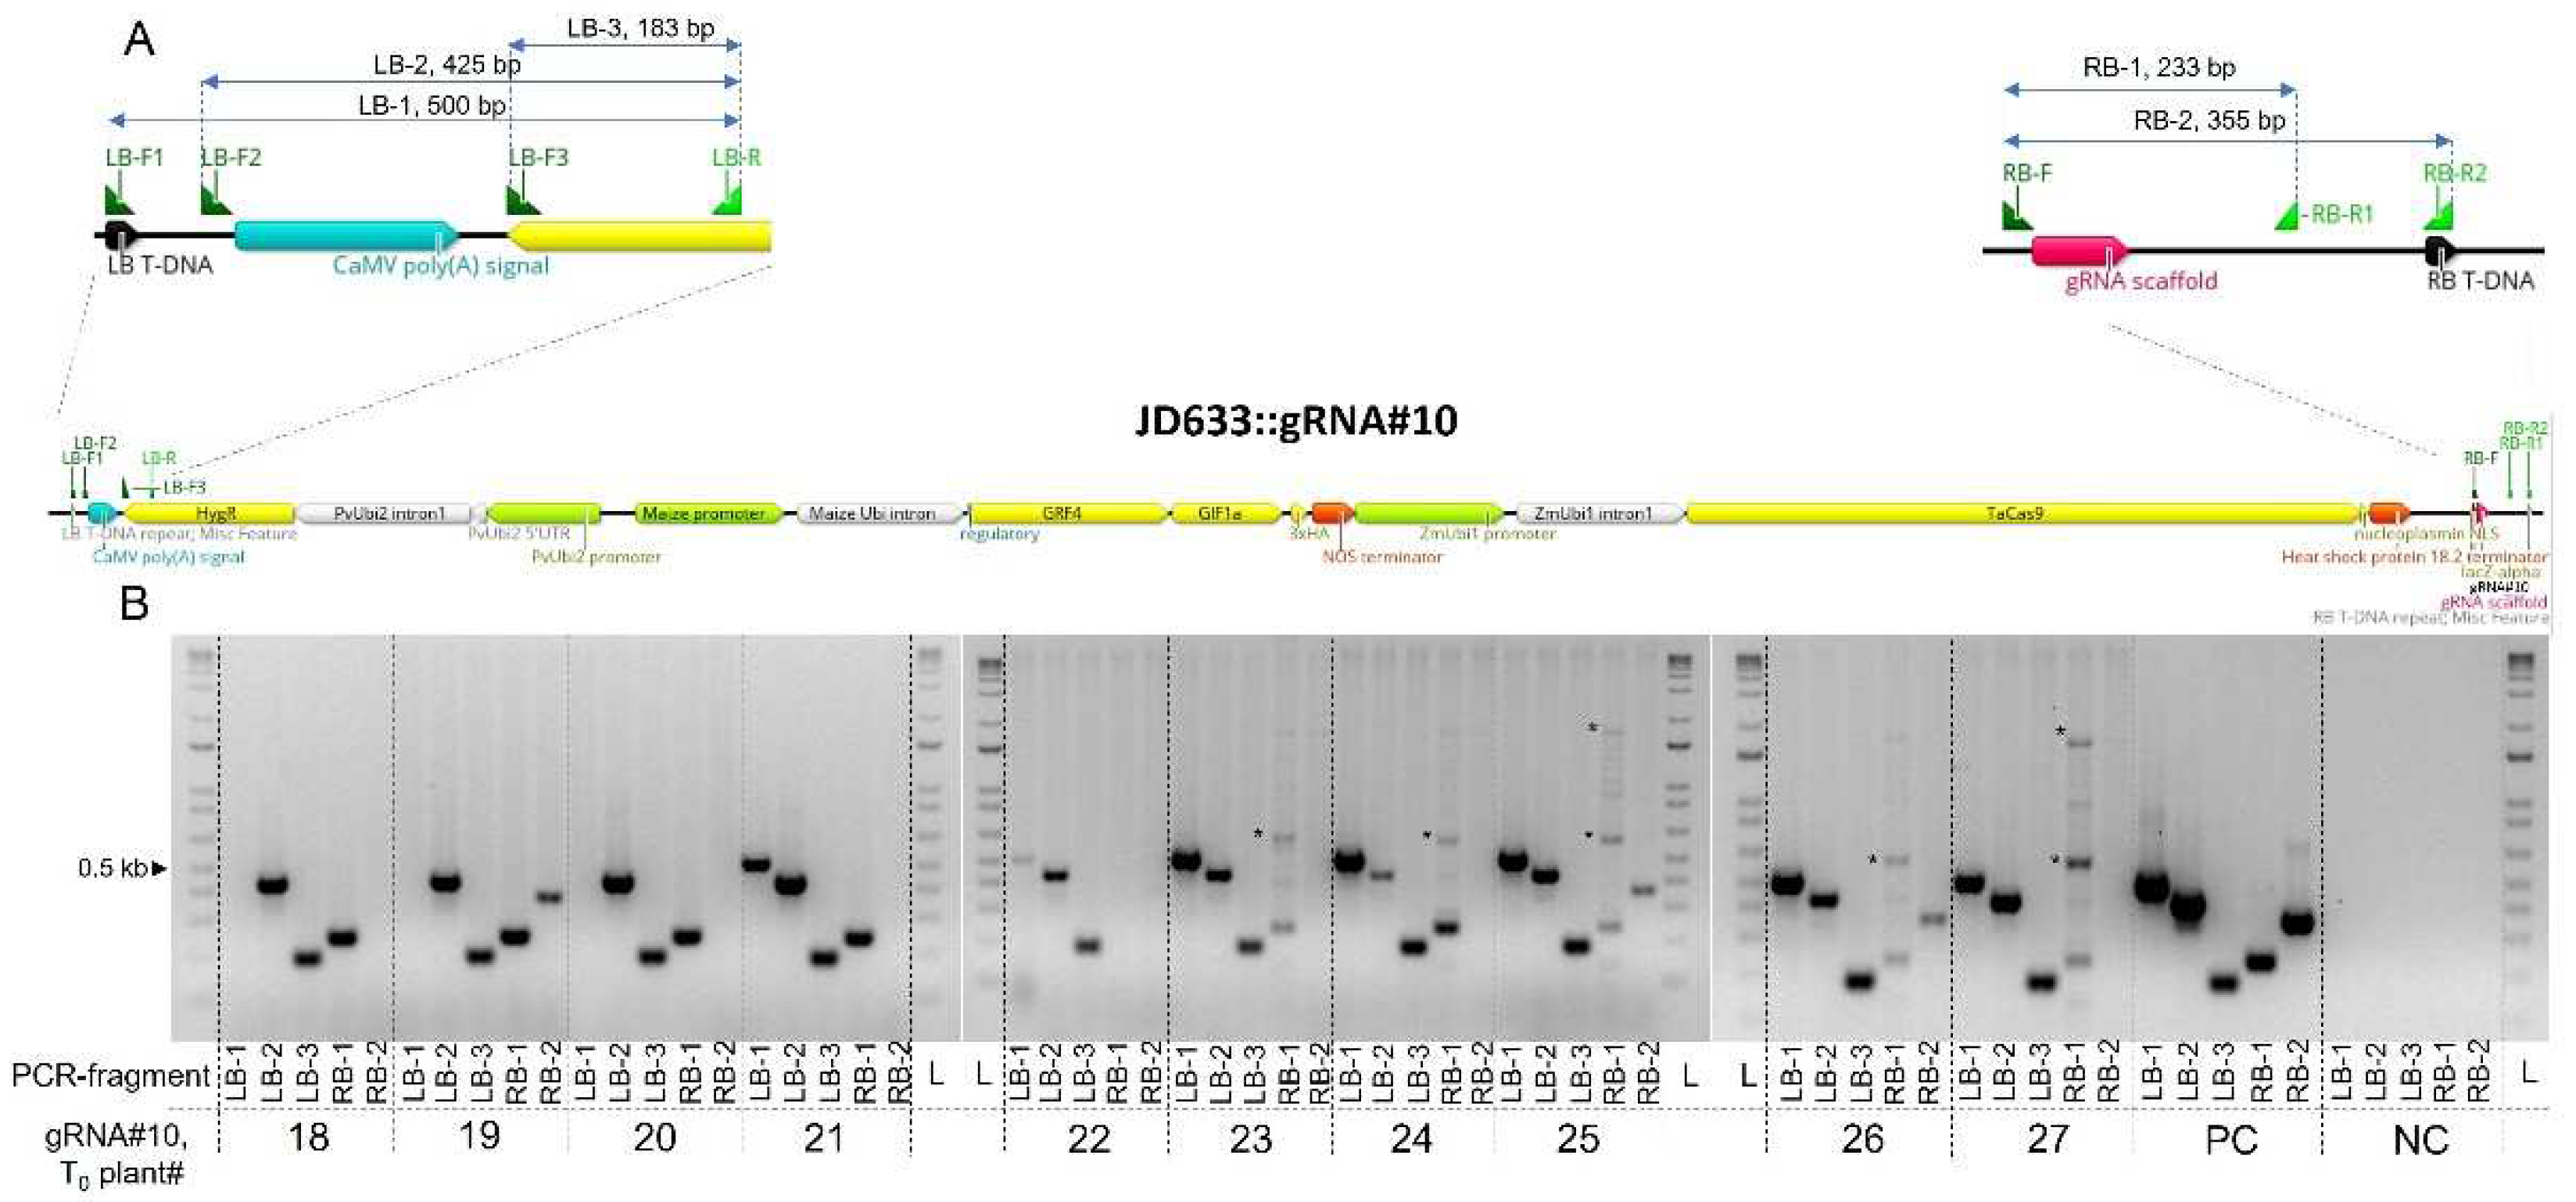
Figure 4.
Correlation analysis for GE rates estimation using qPCR or CAPS assay in T0 transgenic plants. (A) Screening of T0 transgenic wheat lines (cv. Fielder) for the presence of GE events at the target loci for three sub-genomes using cleaved amplified polymorphic sequences (CAPS) assay. The plants were generated using Agrobacterium-mediated transformation and co-delivery of the GRF-GIF chimeric construct. gRNA#10 seeding sequence targeting three sub-genomic copies of TaGW2 was cloned into JD633 plasmid carrying GRF-GIF and Cas9/gRNA expression cassettes. CAPS assay for three sub-genomes targeted by gRNA#10 was performed as described before [17] using SmaI restriction digestion. PC-D – digested WT control (cv. Fielder), PC-UD – undigested WT control (cv. Fielder), L - ladder. (B) Correlation analysis between GE rates estimated using CAPS assay and probe-based qPCR for the gRNA#10 in corresponding T0 transgenic plants. The x-axis represents the average intensity of the undigested bands for the three sub-genomes of respective T0 plants estimated using the CAPS assay. The GE rates for the qPCR assay were calculated through the normalization of ΔΔCt values of transgenic plants to WT control (ΔΔCtnorm, cv. Fielder), and the 1/ΔΔCtnorm ratios were used for plotting. The trendline was plotted with light blue, indicating the standard error. The R- and p-values were calculated using Pearson's correlation coefficient.
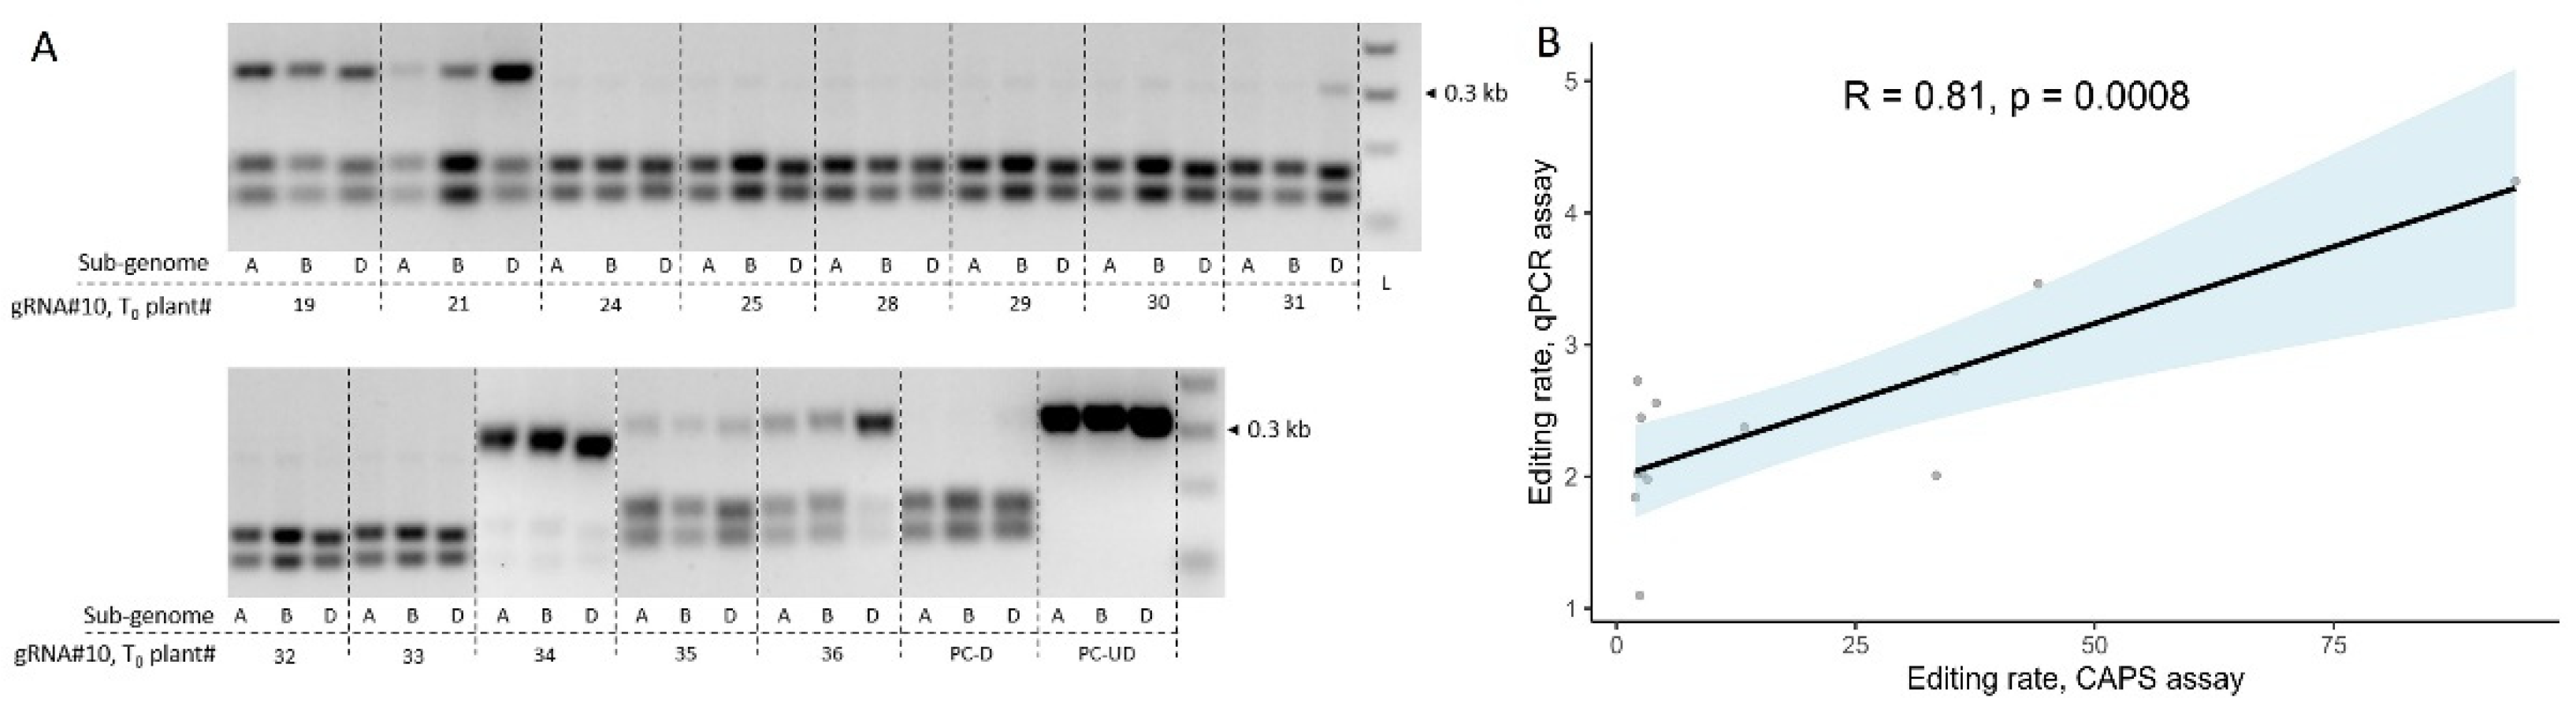
Figure 5.
Box plots showing relative normalized GE rates for ten gRNAs in T0 transgenic plants quantified using probe-based qPCR method. At least three independent T0 transgenic plants per gRNA were analyzed. The GE rates for the qPCR assay were calculated through the normalization of ΔΔCt values of transgenic plants to WT control (ΔΔCtnorm, cv. Fielder), and the 1/ ΔΔCtnorm ratios were used for plotting.
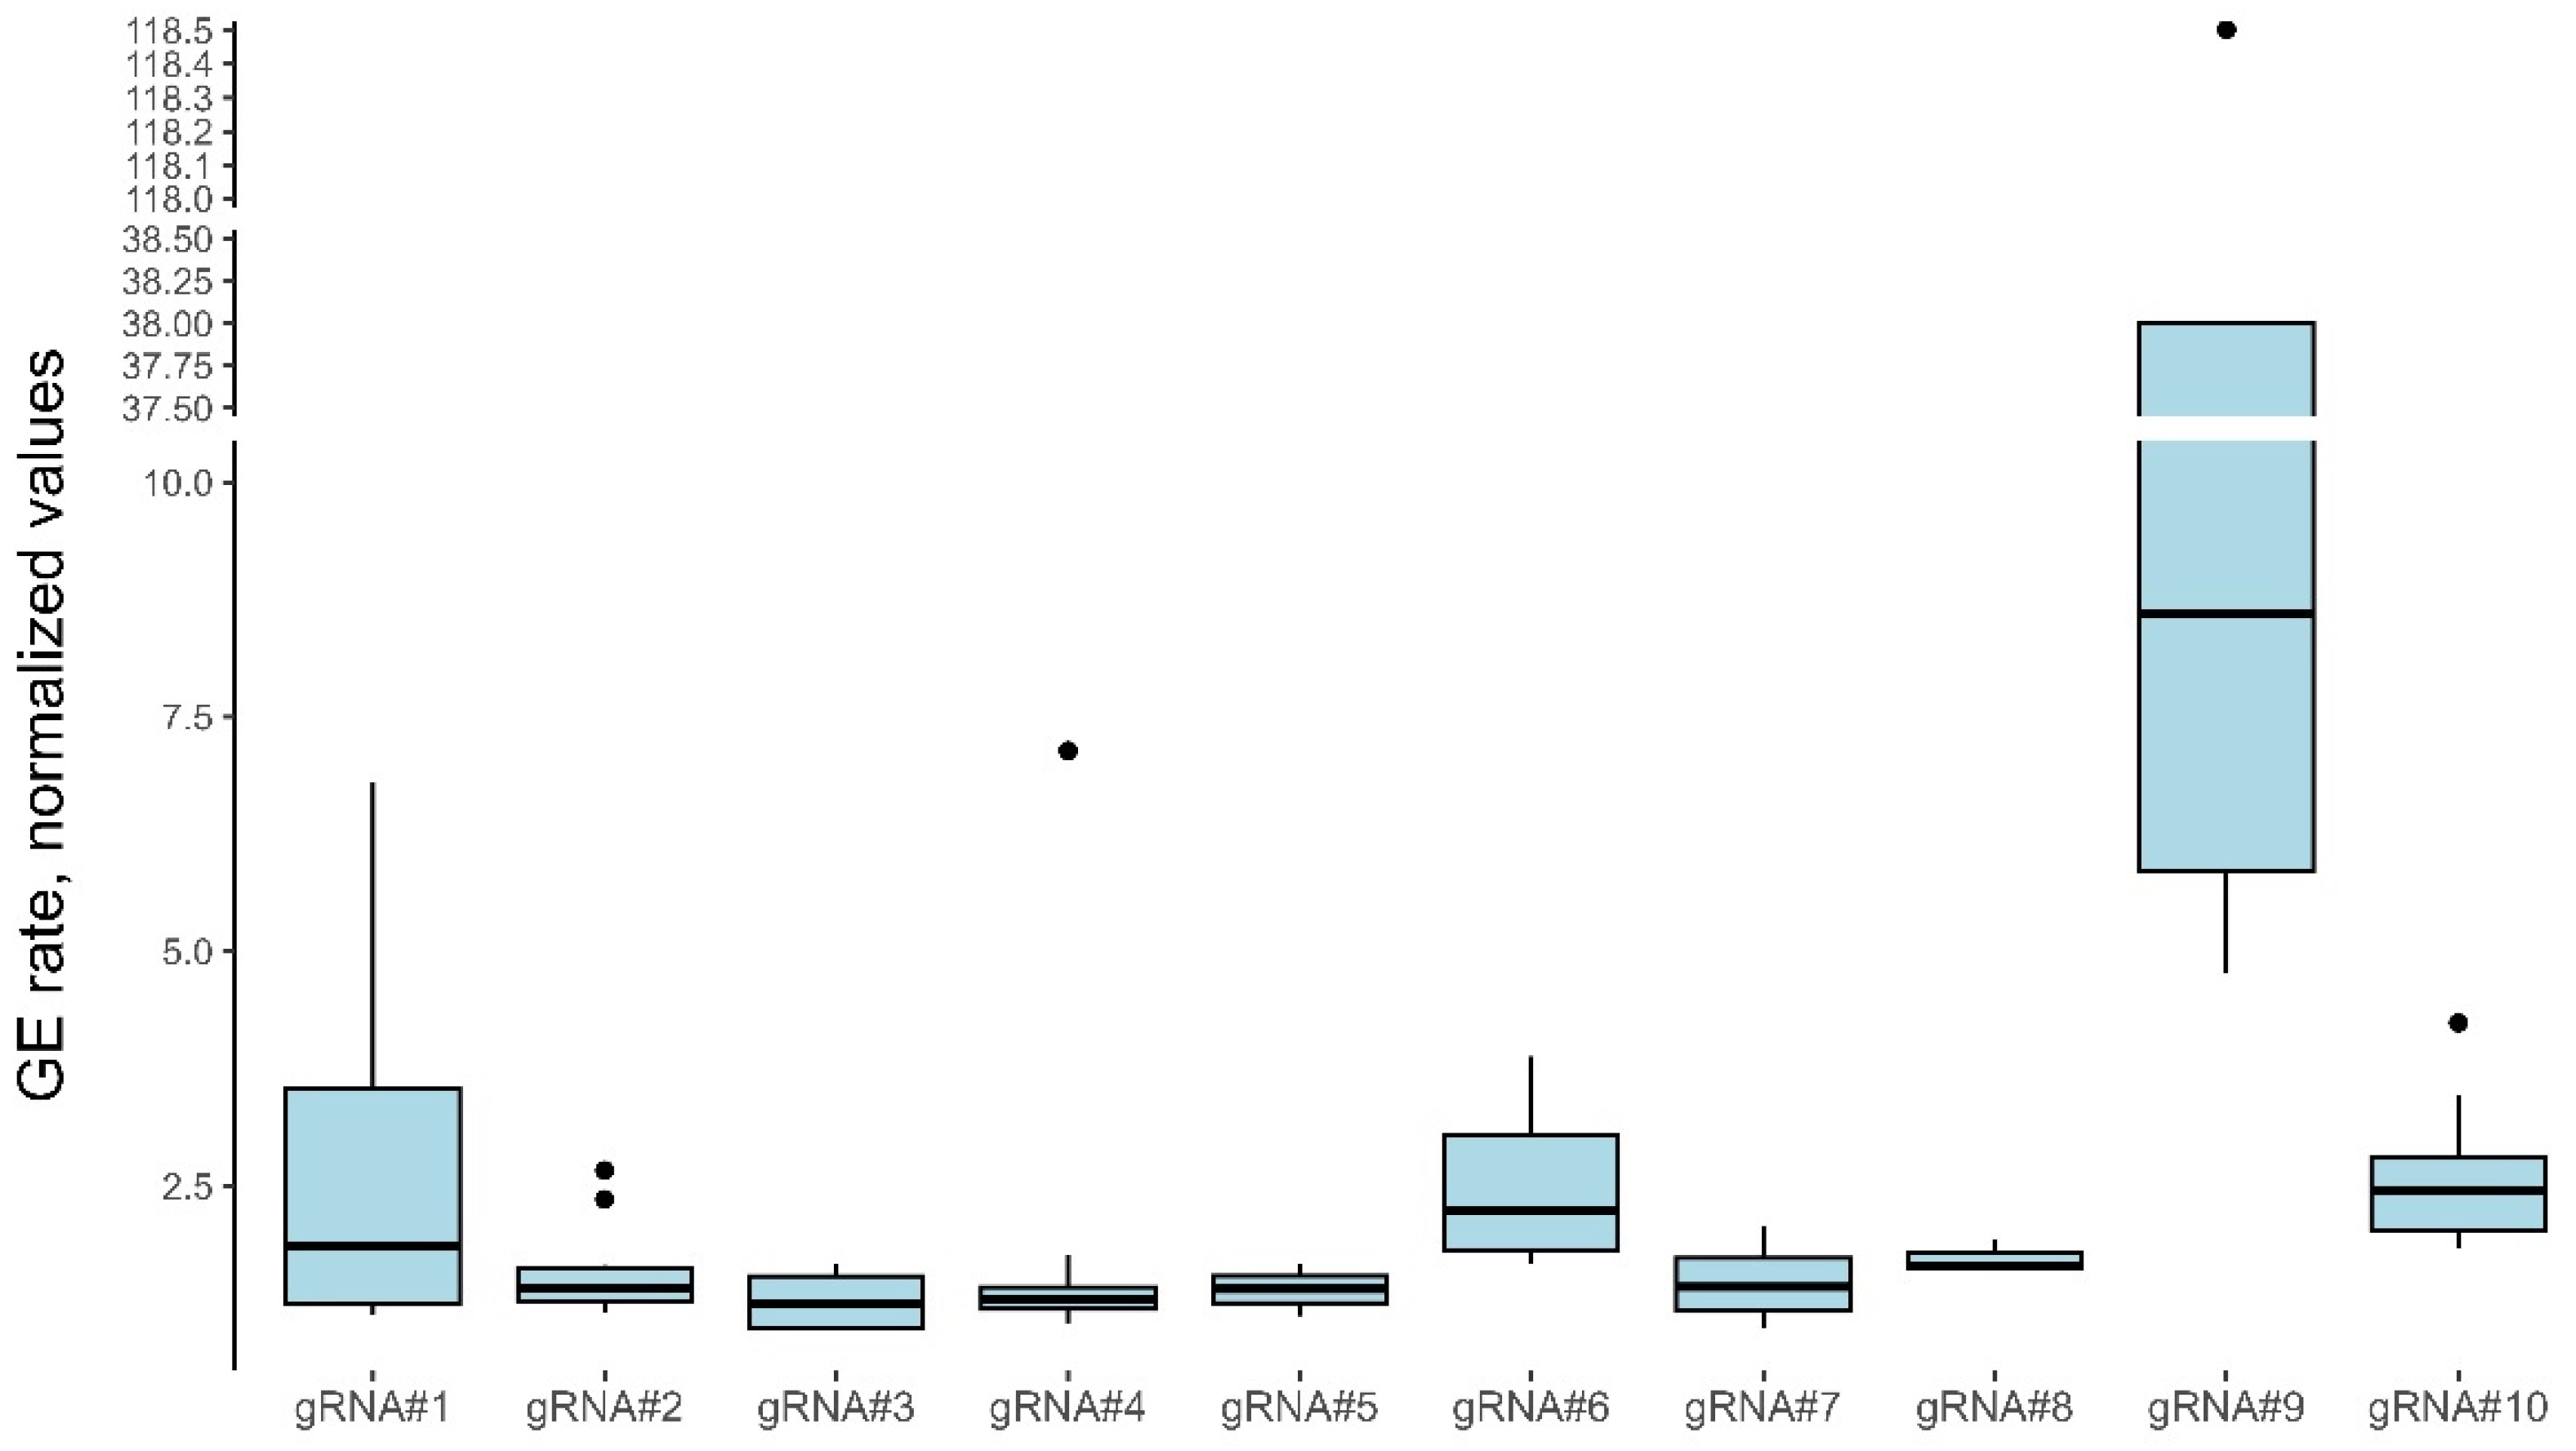
Table 1.
Typical Agrobacterium-mediated transformation rates for wheat (cv. Fielder) with the GRF-GIF embryogenesis construct co-delivery.
Table 1.
Typical Agrobacterium-mediated transformation rates for wheat (cv. Fielder) with the GRF-GIF embryogenesis construct co-delivery.
| Replicate | Cultivar | Agrobacterium strain/helper plasmid | Number of embryos transformed | Number of PCR-confirmed transgenics recovered | Transformation efficiency, % |
|---|---|---|---|---|---|
| #1 | Fielder | AGL1/pSOUP | 192 | 44 | 22.9 |
| #2 | Fielder | AGL1/pSOUP | 145 | 70 | 48.3 |
| #3 | Fielder | AGL1/pSOUP | 190 | 70 | 36.8 |
| #4 | Fielder | AGL1/pSOUP | 221 | 151 | 68.3 |
| Average | 187 | 84 | 44 |
Disclaimer/Publisher’s Note: The statements, opinions and data contained in all publications are solely those of the individual author(s) and contributor(s) and not of MDPI and/or the editor(s). MDPI and/or the editor(s) disclaim responsibility for any injury to people or property resulting from any ideas, methods, instructions or products referred to in the content. |
© 2023 by the authors. Licensee MDPI, Basel, Switzerland. This article is an open access article distributed under the terms and conditions of the Creative Commons Attribution (CC BY) license (http://creativecommons.org/licenses/by/4.0/).
Copyright: This open access article is published under a Creative Commons CC BY 4.0 license, which permit the free download, distribution, and reuse, provided that the author and preprint are cited in any reuse.


