
Submitted:
26 June 2023
Posted:
28 June 2023
You are already at the latest version
Abstract
Arsenic (As) contamination of groundwater is a common problem in BDP. The alkaline pH of the groundwater provides favourable condition for geomicrobiochemical processes, where organic matter also plays an important role in mobilization of As. The total arsenic content (AsT) of the groundwater is in the range of 69-178 µgL-1 with mean value of 118.58 µgL-1. The groundwater quality of monitored drinking water wells are related to local land–use pattern and rural sanitation installation and practices (which can have a strong influence on microbial contamination). The study indicates that As heterogeneity, probably a consequence of microbial heterogeneity is a feature of the study area. The excessive total and fecal coliform (TC and FC) count of the ponds possibly suggest uncontrolled surface run offs and sewage leakage, notably from nearby pit-latrine, which increased the microbial contamination in these water sources. The tube wells located in close proximity (~ 2-3 m) of the surveyed ponds are also contaminated with high TC and FC values, due to faulty water supply system, pond water infiltration and cracked tube well platforms. Coliforms may influence geomicrobiological processes in groundwater and thereby, contribute in As release and mobilization. The TC and FC values of monitored tube wells and ponds show seasonal variation, with high TC and FC values during wet season. Attempt has been made to focus on sanitation risk of the monitored wells (based on sanitation and fecal coliform scores) which is usually less explored. The sanitary risk score reveal the need of immediate attention to all the sites, as 25.0 %, 58.3 %, 11.1 % and 5 % of tube wells of the six sites fell under very high risk (sanitary risk score ≥ 9), high risk (sanitary risk score 6-8), intermediate risk (sanitary risk score 3-5) and low risk category (sanitary risk score 0-2), respectively. Fecal coliform score classified all the sites under intermediate risk category (FC count 10-100 per 100 ml of water). The predominance of As heterogeneity particularly in areas under high risk category (showing high TC and FC contamination) is observed along with the similar sinusoidal pattern of TC, FC and AsT content. Finally, this study shed light on the factors responsible for unsafe nature of monitored tube wells and the influence of anthropogenic activities on the microenvironment of the groundwater, which could be a probable reason behind the As heterogeneity in the groundwater of the study area.
Keywords:
Groundwater
; Surface water
; Arsenic
; Sanitary risk score
; Fecal coliform score
1. Introduction
Arsenic (As) is a well-known naturally occurring carcinogen and one of the most hazardous chemical compounds found in many environmental compartments. High occurrence of As in groundwater is globally recognized as a major risk to human health, especially in areas that are largely dependent on groundwaters as the main drinking water supply. In 1970s the green revolution had started in several parts of the Southeast Asia, significantly in Bengal Delta Plain (BDP) and particularly in west Bengal to safeguard food security in the region. During green revolution notably summer paddy cultivation (boro rice) solely depended upon large scale groundwater development. The millions of shallow tube well (>50 m) are indiscriminately installed in uncontrolled fashion throughout the alluvial plain of BDP. Simultaneously, the importance of rural sanitation (single/double pit latrines) in public health management had been campaigned by the state and the local governments with a vision to make the districts open defecation free. The synergistic effect of both sanitation installations vis-a-vis groundwater development has been ignored [1,2,3,4,5,6,7,8,9,10,11,12,13,14,15].
In the start of the millennium, several researchers carried out microcosm studies to explain As release and mobilization process with the help of native microbial population to further explain the geochemical process (involving iron (Fe)-oxides/hydroxide/oxyhydroxide) responsible for arsenic heterogeneity and atypical distribution pattern and variability in the entire alluvial plain. The earliest study by Islam et al. revealed that As release is possible by bacteria where As (V) is converted to As (III) with decoupling of Fe studies. Nevertheless, several researchers have also reported that infiltration of naturally degraded pond water into the shallow aquifer have been influencing the micro-environment, thereby resulting in As release [16,17,18,19]. Researchers are also keen to focus on the characterization of organic matter existing both in sedimentary and aqueous environment. The focus is on the possible source of fresh rich organic matter, where rural sanitation installation and practices has been highlighted as the major possible contributors. Also, the dissimilarity patterns of microbiogeochemical reactions have been explored [20,21,22,23]. A recent study from BDP Chakdaha have reported about the microbiogeochemical process in and around As hotspot areas. The study demonstrated that geomicrobiological process is prevailing in shallow aquifer, where As rich groundwater is common [18].
The As heterogeneity remains unexplained in the hotspot areas, where the ongoing geomicrobiological process has been sufficiently explained. In this study, we have attempted to examine the microbiological quality of the sampled groundwater and identification of risk associated with the presence of microbial community (including pathogenic bacteria). Attempt has been made to establish the inter-relationship of As heterogeneity and geomicrobiological processes in light of the existing microbial community. This study explains the taciturn factor (rural sanitation installation and sanitation practices) with respect to the local microbial community, associated biochemical processes and their complex inter-relationships resulting in microbiogeochemical processes responsible for the high As concentration and mobilization in the aquifer.
2. Methods and materials
2.1. Study area
The study area is located in 23.02-23.14° N, 88.49-88.62°E, Chakdaha Block, Nadia District, West Bengal. It is 65 km north of Kolkata and approximately 190 km inland from the present coastline of the Bay of Bengal (Figure 1). The regional river Ganges, locally known as Hooghly-Bhagirathi flows from the west to east, whereas the river Ichamati flows in the east and is relatively sluggish in nature [24]. The area falls within the deltaic basin of the river Ganges and Brahmaputra. The area is largely made of alluvial deposits and extends southward down to the Bay of Bengal [25]. In the study area, the climate is tropical (hot and humid). The ambient temperatures largely vary between 12 °C to 42 °C. The annual rainfall ranges between 1150 mm to 4025 mm and the rainfall is typically concentrated in the monsoon period (June-August).
2.2. Sample collection, preservation, and analysis
Six different gram panchayats of Chakdaha block (West Bengal, India) were selected for groundwater and surface water sample collection. Six groundwater and six surface water samples were collected from each of these gram panchayats: Chanduria-1 (Site A), Dewli (Site B), Dubra (Site C), Hingnara (Site D), Silinda-1 (Site E) and Silinda-2 (Site F) (Figure 2). Surface water samples were collected from ponds adjacent to the tube wells. Tube well sanitation survey was performed carefully and recorded for all the wells. During well head sampling, each tube well was purged for a half an hour prior to collection of groundwater sample to get the fresh groundwater samples from aquifers. Certain parameters (pH, Eh, conductivity, temperature and DO) were measured on-site continuously by using a flow cell and field multi-meter (WTW, field multi-meter, Germany). After stabilization of these parameters, the final values were recorded and the groundwater was sampled. The alkalinity was measured on-site using a field kit (Alkalinity Test Kit, Merck). After sampling, all the samples were stored in ~ 4 °C in an air-tight container and shipped to the laboratory where they were split into samples for chemical and microbial analysis. Samples for microbiological and anion analysis were processed as soon as possible.
2.3. Ion analysis
Ammonium ion (NH4+) and anions were analysed overnight after field sampling to minimize the redox alteration. NH4+ and anion analysis were performed using Ion Chromatography (761 Compact IC, Metrohm). For total iron (FeT) measurement, all the Fe was converted into the ferrous state by heating with hydrochloric acid and hydroxylamine hydrochloride and the concentration of Fe was determined spectrophotometrically by comparing against standards by following standard method using a UV-VIS spectrophotometer (Lamda 20, PerkinElmer). The major cations were also measured by Ion chromatography (761 Compact IC, Metrohom). The concentration of AsT in all tube well samples was analysed by hydride generation atomic absorption spectrophotometer (HG – AAS, Varian-240, which detection limit <1 µgL−1) [25].
2.4. Coliform analysis
For microbiological analysis, water samples were collected in sterile high density polyethylene vials (Tarsons) following the standard protocols [26,27]. The presumptive test to detect the presence of coliform bacteria was performed by culturing the sample water in lactose broth (pH 7.2). For determination of most probable number (MPN) of bacteria present in the water sample, experiment was performed in three sets with Durham’s tube and pH indicator bromothymol blue. Each set with five test tubes were inoculated with sample water. 10 ml double strength lactose broth was used as the media of choice for three test tubes of one set. In other two sets with three test tubes in each, 10 ml single strength lactose broth was used. 10 ml, 1 ml and 0.1 ml water sample was used as inoculums for one set with double strength and two set with single strength lactose broth, respectively. In all the tubes, Durham’s tube and bromothymol blue was used to observe the formation of gas bubbles and change in pH of the media, respectively, due to the possible fermentation of lactose by the coliform bacteria. The presence of gas bubble in Durham’s tube indicates a positive score and number of such tubes were counted to determine the MPN. Presence of coliform bacteria was further confirmed by spread plate method on EMB (Eosin Methylene Blue) agar plate. The water samples were further spread on Chromocult coliform agar (Merck) plate to further detect and enumerate faecal coliforms. All the tubes and plates were incubated at 37 °C and 42 °C for detection of total and faecal coliforms, respectively.
2.5. Risk assessment of groundwater
Sanitary inspection is a vital tool in assessing risks of bacterial contamination from different water sources [28,29]. It is beneficial in identifying contaminants, risk of future contamination and overall assessment of water resources, water quality and consumption particularly in rural areas [28,29,30]. Sanitary inspection is generally used to develop control measures to improve microbial water quality of drinking water [30]. The sanitary risk score is a reliable tool for predicting the possible levels of bacterial contamination of water sources often used for drinking purposes. The sanitary risk score of the six sites (Site A: Chanduria-1, Site B: Dewli, Site C: Dubra, Site D: Hingnara, Site E: Silinda-1, Site F: Silinda-2) were calculated based on the presence or absence of four factors near the monitored tube wells: pond, agricultural field, pit latrines and cracked platforms of the tube wells. These factors were selected based on the criteria mentioned in ‘sanitary inspection form for tubewells with hand pump’ designed by WHO. The aforementioned factors could act as fresh and continuous source of contamination to the groundwater. The factors should be considered during sanitary inspection and risk assessment as they might point out actual areas for remediation and prevention of any potential health hazards. The presence of all the four factors near a tube well marked it as a tube well of very high risk category, and subsequently, tube wells with three factors, two factors or any one factor were classified under high risk category, intermediate risk category and low risk category, respectively. The tube wells were given sanitary risk score of ≥ 9 (very high risk), 6 to 8 (high risk), 3 to 5 (intermediate risk) and 0 to 2 (low risk) for classifying them into different risk categories, according to WHO [30]. Percentage of such tube wells in each sites, falling under each category were estimated and used to plot a bar graph. Similarly, six sites were also classified as low risk, intermediate risk, high risk and very high risk category, based on increasing magnitude of faecal coliform contamination in tube wells of each sites. Mean of faecal coliform content of all the sites were calculated and each site was classified into a risk category based on faecal coliform score. Faecal coliform score of 0 indicated no risk, whereas faecal coliform score of 1 to 10, 10 to100, 100 to 1000, and ≥ 1000 indicated sites of low, intermediate, high and very high risk category, respectively [30]. For complete risk assessment the sanitary risk score and faecal coliform risk scores were compiled to identify and compare sites that required immediate attention and remedial measures both at local and regional level.
3. Results and Discussion
3.1. Characteristic of the Study Area
In the study area, aquifer recharge occurs mostly during monsoonal rain (June-August) whereas the major discharge is due to pumping (long-term groundwater extraction). The groundwater extraction is estimated to be up to 1x10⁻⁸ m3s−1 due to irrigation mostly for summer paddy cultivation. A significant backflow (~ 65 - 80 %) from shallow irrigation wells (< 50 m) have also been noticed. A trans-boundary base flow pattern has been observed into the north-west flowing rivers from aquifers in the dry season. The water table fluctuation is often few meters (up to 7m) due to the impact of local pumping and increasing significantly where community water supply systems are operating. These local imbalances in hydrological systems and their contribution on the local groundwater flow pattern are important issues because it may possibly influence the redox condition of the aquifers by supplying surface-derived fresh organic matters promoting Fe-reduction processes in the shallow aquifers [16,25,31,32,33]. Harvey et al has pointed out that the flat topography of the area resulted in the groundwater flow system to be controlled by the local scale flow and influenced by local withdrawal pattern [34]. This further supports the role of local discharge and recharge areas and their distribution pattern. The groundwater use pattern is typically from shallow tube-wells (depth <50 m) which is used for drinking water by the entire rural population of the surveyed villages. In many cases, the groundwater of the tube wells is under environmental stress from pit latrines, ponds often contaminated with sewage, surface and agricultural run offs. This land use pattern results in groundwater often contaminated with human pathogenic bacteria. Islam et al. reported pathogens originated from human waste to be present in tube well water samples from Matlab, Bangladesh [35].
3.2. Physical parameters of the Groundwater
A survey of the water quality of the monitored drinking wells (usually shallow, < 50 m) in the study area reveals a typical anoxic nature of the aquifer with the low Eh (- 278 mV) and low to very low (even absence) DO (Dissolved oxygen) regardless of land-use pattern (Table 1). The main significant facet in the monitored shallow aquifer containing tube well of the Gangetic alluvial (young deposits) is often found to be practically devoid of DO associated with low to very low Eh. This has also been reported by the earlier workers [11,13,14,15,23,32,36,37,38]. The pH of the groundwater is circumferent alkaline (range: 7.04-8.31) which indicates that it has high buffering capacity [14,15]. The highest temperature of the groundwater is up to 31.2 °C, whereas the mean is 27.3 °C. This means that the groundwater is typically in tropical environment [6,14,39,40,41]. The conductivity of the water has also been recorded (mean 538.7 mgL−1, max 876mgL−1, min 423 mgL−1). Such moderate conductivity indicates the freshness of groundwater and also indicates the presence of dissolved ions due to intensive sediment-water interaction. The TDS (total dissolved solids) has also been recorded where the mean value is 345 mgL−1. This suggests that there are several dissolved cations and anions in the system due to low residence time during sub-surface flow circulation [13,19,24,32,42].
3.3. Ion chemistry of the groundwater
The chemical characteristics of the groundwater are also studied (Table 2). It has been found that the major anion is HCO3− (mean 222 mgL−1) which is followed by Cl− (mean 21mgL−1), SO42− (mean 8.96 mgL−1), NH4+ (mean 2.64 mgL−1) and PO43− (mean 2.26 mgL−1). The AsT of the groundwater is in the range of 69-178 µgL−1 with mean value of 118.58 µgL−1 and FeT of the groundwater is in the range of 8.94-4.78 mgL−1 with mean value of 5.87 mgL−1. It is interesting to note that, among the anions Cl− concentration is largely varying up to 147 mgL−1 with a very low mean value of 21 mgL−1. Cl− is a conservative ion and such large variation of Cl− is an important event in the BDP shallow aquifer as it may indicate contamination of groundwater due to anthropogenic factors. Throughout the field visit, the wells having high concentration of Cl− are usually owned by private owners (household wells), whereas the low Cl− concentration wells are generally owned by local Government and usually used by the community. Earlier studies already demonstrated that land use pattern (sanitation coupled with surface water bodies and agriculture land) has some local influence in increasing both As and Fe in groundwater [1,4,13,14]. It has also been reported that among these factors, sanitation could be the most important factor towards enhancing the redox process where fresh organic matter may play an important role. The concentrations anions (HCO3−, PO43− and SO42−) are relatively less variable in sampled tube wells when compared with the variability of chloride. It is important to note that the mean value of HCO3− is relatively high (222 mgL−1) in comparison to the mean values of the other anions (PO43−-2.26 mgL−1, SO42−-8.96 mgL−1, Cl−-21 mgL−1). The high mean value of HCO3− is also a common feature of BDP shallow aquifer along with low Eh values [14,16,23,37,43,44,45,46]. In the context of breakdown of organic matter the local reducing conditions are important and often help to enhance such breakdown in natural environment [47,48]. The nature, characteristics, amount and type of organic matter is also playing an important role during their breakdown in natural environment [12,21,22,45,49,50]. The presence of SO42− could be from the mineral sources [24,32,51,52]. The presence of PO43− in shallow aquifer in BDP is already reported by several research groups [6,53,54]. The source of PO43− will be both anthropogenic and natural. In BDP, by and large the common PO43− bearing minerals are usually absent such as apatite, vivionite, whereas the PO43− from fertilizer source has already been reported by various research groups [55,56]. The study reveals that the groundwater is principally Ca-HCO3 type and thereby supports the carbonate dissolution process. It has also been found that Na-Cl type water has also been observed which reveals that the groundwater is also enriched with sea water with regard to delta forming process [57]. Nevertheless, high Na+ and low Cl− type water has also been noticed in few cases which indicates that groundwater is also influence by slow exchange process [37,56].
3.4. Microbiological Quality of Groundwater
A total of 36 tube wells from six sites were tested for detecting the presence of total and faecal coliforms. The number of total coliform (TC) and faecal coliform (FC) ranged from 18 to 67 CFU (colony forming units- a measure of microbial contamination) and 6 to 29 CFU, respectively, per 100 mL of water in monitored tube wells. The mean value of TC and FC were 37.08 ± 11.71 CFU and 16.61 ± 5.77 CFU, respectively, per 100 mL, in tube well water of the study area (Table 3). United States Environmental Protection Agency (USEPA) and WHO recommends absence of coliform bacteria in drinking water. Irrigation water should have less than 1000 CFU and 200 CFU of TC and FC, respectively, per 100ml [58,59,60]. The TC and FC counts of the monitored tube wells showed sinusoidal pattern (alternate peaks and troughs) when plotted in the graph (Figure 3A,B). The tube wells with shallow depth (< 20m) were more contaminated with coliforms and therefore, the TC and FC counts in these tube wells formed the TC and FC peaks of the graph. The deeper tube wells (<40m) with less coliforms showed TC and FC values in troughs of the graph (Figure 3A,B). The different types of coliforms were further isolated and differentiated on chromocult agar plate. Coliforms formed pink to red colonies due to their positive β-D-glactosidase activity on chromocult agar. On other hand E. coli formed dark blue colonies due to its β-D-galactosidase and β-D-glucourinidase activity, on the same agar plate (Figure 4). Therefore, the monitored tube wells were contaminated with different types of coliforms, including faecal coliforms like E.coli and different members of Enterobacteriaceae. The MPN value ranged from 6 to 28 per 100 ml of water in these monitored wells. The maximum permissible limit of MPN in drinking water is 2.2 per 100 ml of water, as recommended by WHO [61]. Therefore, the findings of the study indicate the unsafe nature of the groundwater, unhygienic sanitary practices and sewage leakage around the monitored wells and warn its use as drinking water [62]. Such groundwater might increase the prevalence of water borne diseases among the nearby residents. These tube wells could also act as source of pathogenic microbes and increase the transmission of such microbes to other water supplies and agricultural fields. Therefore, the results point towards the need of alternative source of groundwater for drinking and agricultural purposes. Currently, available alternative drinking water supplies are insufficient and deeper aquifers (> 150 ft) are the only reliable alternative source of groundwater for drinking and agricultural purposes [11]. Additionally, lack of adequate storage amenities and insufficient availability of groundwater, often force the local residents to use pond water for drinking and other purposes, particularly during the dry season. The alarming condition indicated by the aforementioned results seeks the attention of policy makers and the local government towards the need of safer source of groundwater.
3.5. Microbiological Quality of Surface water
In this study, the total and faecal coliform counts were also estimated in ponds adjacent to the monitored tube wells. The TC and FC count in pond water varies from 229 to 684 CFU and 88 to 378 CFU, respectively, per 100 ml of pond water sample at 10−3 dilution. The mean value of TC and FC were 484.03 ± 98.95 CFU and 252.75 ± 78.37 CFU, respectively, per 100 mL, in pond water of the study area at 10−3 dilution (Table 3). The TC and FC count of the pond water may indicate uncontrolled surface run off, unhygienic practices, sewage leakage, notably from nearby pit latrines and faulty water supply system of monitored tube wells adjacent to them. These ponds may also play significant role in transmission of coliforms to groundwater from the tube well, particularly during the wet season. These factors together increase the microbial contamination significantly in the pond water samples and adjacent tube wells making them unsafe for drinking [63,64]. The findings of this study corroborates with the findings of other studies focussed in several parts of BDP [11,37,65]. The TC and FC counts of the pond water samples showed saw tooth pattern similar to the TC and FC counts of tube well water. In most of the cases, the TC and FC peaks of monitored wells corresponded with the TC and FC peaks of water samples from ponds adjacent to them (~ 2-3m). Similarly, the TC and FC troughs of the monitored wells corresponded to TC and FC troughs of the pond water adjacent to those wells (Figure 5A,B). This again indicate the probable transmission of coliforms from tube wells with high TC and FC count to their adjacent ponds (~ 2-3m) or vice-versa, by groundwater leakage due to faulty water supply system or cracked platforms.
3.6. Seasonal variation in microbial quality of groundwater and surface water
Microbial growth, abundance and composition depend on multiple physical factors like temperature, pH, organic matter and therefore, groundwater and surface water usually show seasonal variation in their microbial quality [66,67]. In this study, seasonal variation in microbial quality of groundwater (from tube wells) and surface water (from ponds), has been investigated (Figure 6A). The groundwater and surface water of all the sites were contaminated with total and faecal coliforms, in both dry and wet seasons. Both groundwater and surface water samples showed high total and faecal coliform content during wet season (September to November). The coliform content was comparatively low in dry season (April to May) in both the type of water samples, which could be due to decreased leaching, decreased surface run off and increased temperature of the water samples. During wet season, groundwater samples from site E showed the maximum mean of total coliforms (107.3 CFU/ml), followed by groundwater samples from site F (102.2 CFU/ml), site B (101.5 CFU/ml), site D (92.2 CFU/ml), site C (92.0 CFU/ml) and site A (85.8 CFU/ml). Groundwater samples of site C had highest mean of faecal coliform (72.8 CFU/ml), followed by site E (67.3 CFU/ml), site F (66.3 CFU/ml), site B (65.2 CFU/ml), site D (65.0 CFU/ml) and site A (62.8 CFU/ml). During dry season there was a drastic drop in the number of total and faecal coliforms of all the sites. During dry season, maximum number of total coliforms was observed in groundwater samples of site A (mean 56.7 CFU/ml), followed by site B (mean 48.8 CFU/ml), site E (mean 48.5 CFU/ml), site D (mean 47.2 CFU/ml), site F (mean 45.2 CFU/ml) and site C (41.2 CFU/ml). The faecal coliform content was highest in groundwater samples of site D (mean 20.5 CFU/ml), followed by site C (mean 19.3 CFU/ml), site F (mean 18.3 CFU/ml), site E (18.0 CFU/ml), site A (16.7 CFU/ml) and site B (16.2 CFU/ml) (Figure 6A). All the tube wells of site E, C and B were close to pit latrines and more than 80% of tube wells in these sites had cracked platform. Site E showed highest number of total coliform and second highest number of faecal coliforms in wet season. Site C showed highest number of faecal coliforms in wet season. At least 65% of tube wells of site A, D and F were close to pit latrines and more than 65% of the tube wells in these sites had cracked platforms. Site F showed second highest total coliform content in wet season. Therefore, faulty construction of pit latrines could play a significant role in transmission of coliforms, including faecal coliforms to contaminate the groundwater of tube wells. Such transmission would be further enhanced by cracked platforms of tube wells and surface run offs from adjacent water bodies.
The seasonal variation in microbial quality of surface water was also investigated in this study (Figure 6B). In wet season, the highest number of total coliform was estimated in pond water sample of site F (mean 554.6 X 10³ CFU/ 100 ml), followed by site C (mean 521.2 X 10³ CFU/ 100 ml), site B (477.7 X 10³ CFU/ 100 ml), site D (469.5 X 10³ CFU/ 100 ml), site A (mean 443 X 103 CFU/ 100 ml) and site E (mean 438.2 X 10³ CFU/ 100 ml). In dry season, the total coliform content of pond water samples decreased to ̴50%, for all the sites (site A: mean 246.7 X 10³ CFU/ 100 ml, site B: mean 253.3 X 10³ CFU/ 100 ml, site C: mean 244.7 X 10³ CFU/ 100 ml, site D: mean 222 X 103 CFU/ 100 ml, site E: mean 221 X 103 CFU/ 100 ml and site F: mean 205.5 X 10³ CFU/ 100 ml). In wet season, the faecal coliform content was highest in pond water sample of site F (mean 304.8 X 10³ CFU/ 100 ml), followed by pond water sample of site C (mean 274.7 X 10³ CFU/ 100 ml), site B (mean 273.5 X 10³ CFU/ 100 ml), site E (mean 230.0 X 10³ CFU/ 100 ml), site A (mean 218.0 X 10³ CFU/ 100 ml) and site D (mean 215.5 X 10³ CFU/ 100 ml). Similar to the total coliform content, there was a drop (~ 50%) in the faecal coliform content of all the sites (site A: mean 114.5 X 10³ CFU/ 100 ml, site B: mean 126.3 X 10³ CFU/ 100 ml, site C: mean 142.3 X 10³ CFU/ 100 ml, site D: mean 120.7 X 10³ CFU/ 100 ml, site E: mean 127.5 X 10³ CFU/ 100 ml and site F: mean 139.7 X 10³ CFU/ 100 ml) (Figure 6B). The pond water of all the sites with high number of total and faecal coliforms might add coliforms to groundwater of adjacent tube wells by surface run offs and leaching. Also, pond waters with high coliforms should not be used for bathing and other household purposes. Such water samples with high total and faecal coliform content are not only unsafe for drinking purpose but also for agricultural purposes.
3.7. Risk Assessment of groundwater
Anthropogenic activities significantly influence the microbial and physicochemical quality of groundwater. Improper sanitation practices like adjoining and faulty construction of pit latrines, open defecation near the ponds, etc., contaminates the water sources directly or indirectly. The groundwater from monitored tube wells is often used for drinking purpose by the local residents. However, these tube wells might act as sink of total and faecal coliforms from sewage leakage (from pit latrines), surface runoffs (from ponds and abstraction). Intake of coliform contaminated groundwater might lead to serious health hazards in local residents and therefore, identification of such unsafe tube wells and implementation of remedial measures, both at local and regional level, is the need of hour. In this study, the six sites have been classified and compared according to sanitary risk score and faecal coliform score suggested by WHO [30]. Based on the sanitary risk score, 25.0 %, 58.3 %, 11.1 % and 5 % of tube wells of the six sites fell under very high risk (sanitary risk score ≥ 9), high risk (sanitary risk score 6-8), intermediate risk (sanitary risk score 3-5) and low risk category (sanitary risk score 0-2), respectively. Among the six sites, 33.3 % of tube wells from each of the site B, C, D and E fell under very high risk category. Only 16.6 % of tube wells of site F belonged to very high risk category. Site A lacked tube well of very high risk category. However, 83.3% of tube wells of site A fell under high risk category. 50 % of tube wells of site B and F, 66.6 % tube wells of site C and E, and 33.3 % tube wells of site D were in high risk category (Figure 7A). These results complement with the classification of the sites based on faecal coliform score. Faecal coliform scores indicate microbiological quality of groundwater and classify different sites according to increasing order of magnitude of faecal contamination [30]. All the six sites belong to intermediate risk category (FC count 10-100 per 100 ml of water) and are contaminated with mean 14.00 (site A), 13.33 (site B), 16.70 (site C), 22.00 (site D), 18.50 (site E) and 15.20 (site F), CFU, respectively, of faecal coliforms per 100 ml of groundwater (Figure 7B). Sanitary risk score represents the entire history of contamination in the groundwater, whereas faecal coliform score indicates recent contamination and provide information only for a very short period of time. Therefore, risk assessment of all the sites requires compilation of sanitary risk score and faecal coliform score [30]. Therefore, based on the sanitary and faecal coliform score, it can be suggested that all the sites possibly require immediate attention and falls under intermediate to high risk category. Such relative risk score is required for comparison and identification of groundwater sites, some of which might require urgent attention. Remedial measures must be taken for prevention of faecal coliform transmission to new sites and identification of faecal coliform transmission routes. Remedial measures are to be taken both from local and regional level. Such study might also play significant role in development of remediation strategy at national level.
3.8. As heterogeneity and responsible taciturn factor
The AsT content was estimated in monitored wells of six sites. Site B showed maximum As contamination in the groundwater (mean: 139.833 µgL−1, range: 98-163 µgL−1), followed by site D (mean: 124.833 µgL−1, range: 74-167 µgL−1), site C (mean: 120.167 µgL−1, range: 91-142 µgL−1), site E (mean: 113.5 µgL−1, range: 78-178 µgL−1), site A (mean: 109.667 µgL−1, range: 87-129 µgL−1) and site F (mean: 103.5 µgL−1, range: 69-171 µgL−1). The monitored wells showed As heterogeneity as well as microbial heterogeneity (Tc and Fc) within each sites and a positive correlation was observed between these three variables in most of these wells (Figure 8). Groundwater samples with high Tc and Fc content were contaminated with high concentration of AsT concentration in these monitored wells showed saw tooth pattern similar to their pattern of Tc and Fc contents mentioned earlier (Figure 3 and Figure 8). Both As levels and microbial contamination (Fc and MPN) are found to be remarkably high (AsT up to 178 µgL-1 and TC & FC up to 67 and 29, respectively) in some monitored wells and they are increasing in similar pattern. However, the relationship between As levels and microbial contamination cannot be generalised. On the other hand, As and Fe correlation from similar study area have been found to be significantly positive (even strongly positive) [18]. The systemic change in relationship between As & Fe and As & microbial contamination is an important observation, which is generally underexplored. The relationship between As & Fe is often due to geochemical processes like Fe-reduction and dissolution of both As & Fe in the groundwater [12,32]. On the contrary, the relationship between As & microbial contamination is usually guided by natural geomicrobiological processes, which are predominantly dissimilar in nature [17,35]. Additionally, the pH of the monitored wells are also found to be alkaline in nature, significantly on those wells, where both As & microbial contaminants are found in relatively higher levels. This further strengthens the ongoing geomicrobiological processes in these shallow aquifers [18]. Recent study by Barman et al. from this study area has already reported Enterobacter sp. in the shallow well water. Earlier studies have also suggested that BDP shallow groundwater has been contaminated with fecal coliform of pathogenic origin [18].
The risk analysis study between As and sanitary assessment are more encouraging and interesting to further corroborate the geomicrobiological process in the shallow aquifer of the study area. The sanitary risk score reveal the need of immediate attention to all the sites, as 25.0 %, 58.3 %, 11.1 % and 5 % of tube wells of the six sites fell under very high risk (sanitary risk score ≥ 9), high risk (sanitary risk score 6-8), intermediate risk (sanitary risk score 3-5) and low risk category (sanitary risk score 0-2), respectively (Figure 7). In this study, a taciturn factor (sanitary installation) could reasonably explain the usual source of microbial contamination, which is pathogenic in nature and is of fecal origin. The earlier researchers also mentioned about various land use patterns (pit latrine, pond, agricultural field, cattle shelter) that can be linked with As mobilization in significantly higher levels with respect to both national water quality standards and WHO guideline. Several microcosm experiments are also conducted to decipher As and microbial relationship regarding As mobilization [4,28,29,30]. In those studies, it has also been found that As, Fe relationship is decoupling and role of microbial community is important to increase As concentration [35]. This further suggests that the high concentration of As in groundwater can be associated with geomicrobiological processes, which is dissimilar in nature [17,35].
Both the aforementioned findings focus towards As heterogeneity generally found in these hotspots, when microbiological processes are playing significant role in shallow aquifer, where leakage of sewage from pit latrines are common (particularly the contaminated tube wells located very near to sanitary installation). The characteristics of As heterogeneity (degree, nature and type) largely depend upon the ongoing geomicrobiological processes, microbial diversity, which shows wide variation in these habitats. Finally, the depth of the tube wells, the nature of the bacteria, availability of fresh organic matter and aquifer characteristics may also play important roles regarding upscaling/downscaling of the characteristic heterogeneity [18]. Therefore, sanitation installation has to be given more priority during selection of tube well installation site rather than installation practices in uncontrolled manner. Local and rural tube well drillers should be made aware about the importance of land use pattern.
Conclusion
The occurrence of high As concentration in the groundwater of the study area (Chakada Block, Nadia Distract) has drawn attention along with the pattern of its distribution. The monitored drinking wells (usually shallow, < 50 m) of the study area reveals the typical anoxic nature of the aquifer with the low Eh, very low DO, moderate to high conductivity and TDS, and variable chloride concentration. The groundwater is principally Ca-HCO3 type followed by Na-Cl water type. High Na and low Cl type water in few cases indicates groundwater influence by low exchange process and contamination from local anthropogenic sources. The predominant mechanism of As mobilization in the monitored drinking water wells is dissolution of Fe–phases (oxy-hydroxides) and desorption of As from these oxy-hydroxides thereby, releasing As into the groundwater. The microbiological quality of the sampled groundwater indicates the unplanned human habitation, unhygienic sanitary practices and poor maintenance of pit latrines and tube well platforms in the study area. The TC and FC count of the pond water suggest uncontrolled surface run offs and sewage leakage, notably from nearby pit-latrine, which increased the microbial contamination levels in the ponds. The tube wells located in close proximity (~ 2-3 m) of the surveyed ponds are also contaminated with high TC and FC values, due to faulty water supply system, pond water infiltration, cracked platforms, etc. All these finding suggested that local land-use pattern has significant influence on groundwater quality. The TC and FC values of monitored tube wells and ponds showed seasonal variation, with high TC and FC values during wet season. The sanitary risk score and the abundance of faecal coliform also revealed the need of immediate attention to all the sites, as most of the tube wells belonged to very high or high risk category. The monitored tube wells also showed As heterogeneity in a positive correlation with microbial heterogeneity and followed the similar sinusoidal pattern with the TC and FC content of the wells. Therefore, the findings of this study shed light on the factors responsible for unsafe nature of monitored tube wells and the influence of anthropogenic activities on the microenvironment of the groundwater, which could be a probable reason behind the As heterogeneity in the groundwater of the study area.
Author Contributions
D.M., A.B. and D.C. conceived the idea and design of research. D.M., M.A., S.K.D., S.M., D.C. and A.B. conducted the experiments. D.M., M.A., S.K.D., S.M., D.C. and A.B. analyzed the data. D.M., A.B. and D.C. were involved in manuscript preparation. All authors have read and agreed to the published version of the manuscript.
Funding
This work was supported by Department of Science & Technology and Biotechnology, Government of West Bengal, India [Grant No. STBT-11012(15)/26/2019-ST SEC].
Acknowledgements
The authors acknowledge Department of Science & Technology and Biotechnology, Government of West Bengal, India, for funding the research by its R&D Project Scheme – ‘Gobeshonay Bangla’.
Availability of data and materials
Not applicable.
Conflicts of interest/Competing interests
The Authors declare no Conflicts of interest/ Competing interests of financial or any other nature.
Ethics approval
Not applicable.
Consent to participate
Not applicable.
Code availability
Not applicable.
Consent for publication
All the authors have given the consent for publication.
References
- Smith, A.H.; Lingas, E.O.; Rahman, M. Contamination of drinking-water by arsenic in Bangladesh: A public health emergency. Bulletin of the World Health Organization 2000, 78, 1093–1103. [Google Scholar]
- Majumder, S.; Nath, B.; Sarkar, S.; Islam, S.M.; Bundschuh, J.; Chatterjee, D.; Hidalgo, M. Application of natural citric acid sources and their role on arsenic removal from drinking water: A green chemistry approach. Journal of Hazardous Materials 2013, 262, 1167–1175. [Google Scholar] [CrossRef] [PubMed]
- Majumder, S.; Nath, B.; Sarkar, S.; Chatterjee, D.; Roman-Ross, G.; Hidalgo, M. Size-fractionation of groundwater arsenic in alluvial aquifers of West Bengal, India: The role of organic and inorganic colloids. Science of the Total Environment 2014, 468–469, 804–812. [Google Scholar] [CrossRef]
- Majumder, S.; et al. An Insight into the Spatio-vertical Heterogeneity of Dissolved Arsenic in Part of the Bengal Delta Plain Aquifer in West Bengal (India). In Safe and Sustainable Use of Arsenic-Contaminated Aquifers in the Gangetic Plain; Ramanathan, A., Johnston, S., Mukherjee, A., Nath, B., Eds.; Springer: Cham, 2015. [Google Scholar] [CrossRef]
- Majumder, S.; Marguí, E.; Roman-Ross, G.; Chatterjee, D.; Hidalgo, M. Hollow fiber liquid phase microextraction combined with total reflection X-ray fluorescence spectrometry for the determination of trace level inorganic arsenic species in waters. Talanta 2020, 217, 121005. [Google Scholar] [CrossRef]
- Smedley, P.L.; Kinniburgh, D.G. A review of the source, behaviour and distribution of arsenic in natural waters. Applied Geochemistry 2002, 17, 517–568. [Google Scholar] [CrossRef]
- Chen, C.J.; Chen, C.; Wu, M.; Kuo, T. Cancer potential in liver, lung, bladder and kidney due to ingested inorganic arsenic in drinking water. British Journal of Cancer 1992, 66, 888–892. [Google Scholar] [CrossRef]
- Rahman, A.; Persson, L.-Å.; Nermell, B.; Arifeen, S.E.; Ekström, E.-C.; Smith, A.H.; Vahter, M. Arsenic exposure and risk of spontaneous abortion, stillbirth, and infant mortality. Epidemiology 2010, 797–804. [Google Scholar] [CrossRef] [PubMed]
- Parvez, F.; Wasserman, G.A.; Factor-Litvak, P.; Liu, X.; Slavkovich, V.; Siddique, A.B.; Sultana, R.; Sultana, R.; Islam, T.; Levy, D. Arsenic exposure and motor function among children in Bangladesh. Environmental Health Perspectives 2011, 119, 1665–1670. [Google Scholar] [CrossRef]
- Ravenscroft, P.; Brammer, H.; Richards, K. Arsenic Pollution: A Global Synthesis; John Wiley & Sons: Hoboken, NJ, USA, 2011. [Google Scholar]
- Chatterjee, D.; Halder, D.; Majumder, S.; Biswas, A.; Nath, B.; Bhattacharya, P.; Bhowmick, S.; Mukherjee-Goswami, A.; Saha, D.; Hazra, R.; et al. Assessment of arsenic exposure from groundwater and rice in Bengal Delta region, West Bengal, India. Water Research 2010, 44, 5803–5812. [Google Scholar] [CrossRef] [PubMed]
- Chatterjee, D.; Roy, R.K.; Basu, B.B. Riddle of arsenic in groundwater of Bengal Delta Plain—Role of non-inland source and redox traps. Environmental Geology 2005, 49, 188–206. [Google Scholar] [CrossRef]
- Bhattacharya, P.; Jacks, G.; Ahmed, K.M.; Routh, J.; Khan, A.A. Arsenic in Groundwater of the Bengal Delta Plain Aquifers in Bangladesh. Environ. Contam. Toxicol. 2002, 69, 538–545. [Google Scholar] [CrossRef]
- Bhattacharyya, R.; Chattarjee, D.; Nath, B.; Jana, J.; Jacks, G.; Vahter, M. High Arsenic Groundwater: Mobilization, Metabolism and Mitigation-An overview in the Bengal Delta Plain. Journal of Molecular and Cellur Bio-Chemistry 2003, 253, 347–355. [Google Scholar] [CrossRef]
- Ahmed, M.F. Groundwater arsenic contamination on the Ganges Delta: Biogeochemistry, hydrology, human perturbations, and human suffering on a large scale. C.R. Geosci. 2005, 337, 285–296. [Google Scholar] [CrossRef]
- Lawson, M.; Polya, D.A.; Boyce, A.J.; Bryant, C.; Ballentine, C.J. Tracing organic matter composition and distribution and its role on arsenic release in shallow Cambodian groundwaters. Geochimica et Cosmochimica Acta 2016, 178, 160–177. [Google Scholar] [CrossRef]
- Islam, F.; Gault, A.; Boothman, C.; et al. Role of metal-reducing bacteria in arsenic release from Bengal delta sediments. Nature 2004, 430, 68–71. [Google Scholar] [CrossRef] [PubMed]
- Barman, S.; Mandal, D.; et al. Identification of microbiogeochemical factors responsible for arsenic release and mobilization, and isolation of heavy metal hyper-tolerant bacterium from irrigation well water: A case study in Rural Bengal. Environ Dev Sustain 2023. [Google Scholar] [CrossRef]
- Majumder, S.; Datta, S.; Nath, B.; Neidhardt, H.; Sarkar, S.; Roman-Ross, G.; Berner, Z.; Hidalgo, M.; Chatterjee, D.; Chatterjee, D. Monsoonal influence on variation of hydrochemistry and isotopic signatures: Implications for associated arsenic release in groundwater. Journal of Hydrology 2016, 535, 407–417. [Google Scholar] [CrossRef]
- Oremland, R.S.; Stolz, J.F. The ecology of arsenic. Science 2003, 300, 939–944. [Google Scholar] [CrossRef]
- Oremland, R.S.; Stolz, J.F. Arsenic, microbes and contaminated aquifers. Trends Microbiol. 2005, 13, 45–49. [Google Scholar] [CrossRef]
- Kappler, A.; Benz, M.; Schink, B.; Brune, A. Electron shuttling via humic acids in microbial iron(III) reduction in a freshwater sediment. FEMS Microbiol. Ecol. 2004, 47, 85–92. [Google Scholar] [CrossRef] [PubMed]
- Nath, B.; Berner, Z.; Chatterjee, D.; Mallik, S.B.; Stüben, D. Mobility of arsenic in West Bengal aquifers conducting low and high groundwater arsenic. Part II: Comparative geochemical profile and leaching study. Applied Geochemistry 2008, 23, 996–1011. [Google Scholar] [CrossRef]
- Biswas, A.; Nath, B.; Bhattacharya, P.; Halder, D.; Kundu, A.K.; Mandal, U.; Mukherjee, A.; Chatterjee, D.; Mörth, C.M.; Jacks, G. Hydrogeochemical contrast between brown and grey sand aquifers in shallow depth of Bengal Basin: Consequences for Sustainable drinking water supply. Science of the Total Environment 2012, 431, 402–412. [Google Scholar] [CrossRef]
- CGWB. High incidence of As in groundwater in West Bengal. Central Groundwater Board, India. Ministry of Water Resources, Government of India. 1999. [Google Scholar]
- American Public Health Association (APHA). Standard Methods for the Analysis of Water and Wastewater, 17th ed.; American Public Health Association: Washington, DC, USA, 1998. [Google Scholar]
- WHO. Guidelines for Drinking-Water Quality, 4th ed.; World Health Organization: Geneva, Switzerland, 2010; Available online: http://whqlibdoc.who.int/publications/2011/9789241548151_eng.pdf.
- Howard, A.G. Water Supply Surveillance: A Reference Manual; WEDC, Loughborough University, 2002. [Google Scholar]
- Haruna, R.; Ejobi, F.; Kabagambe, E.K. The Quality of water from protected springs in Katwe and Kisenyi parishes, Kampana city, Uganda. African Health Sciences 2005, 5, 14–20. [Google Scholar]
- WHO. Guidelines for Drinking Water Quality, Volume 3: Surveillance and Control of Community Water Supplies, 2nd ed.; World Health Organization: Geneva, Switzerland, 1997. [Google Scholar]
- Michael, H.A.; Voss, C.I. Estimation of regional-scale groundwater flow properties in the Bengal Basin of India and Bangladesh. Hydrogeol. J. 2009, 17, 1329–1346. [Google Scholar] [CrossRef]
- Mukherjee, A.; von Bromssen, M.; Scanlon, B.R.; Bhattacharya, P.; Fryar, A.E.; Hasan, M.A.; Ahmed, K.M.; Chatterjee, D.; Jacks, G.; Sracek, O. Hydrogeochemical comparison and effects of overlapping redox zones on groundwater arsenic near the western (Bhagirathi sub-basin, India) and Eatsren (Meghna sub-basin, Bangladesh) margins of the Bengal Basin. Journal of Contaminant Hydrology 2008, 99, 31–48. [Google Scholar] [CrossRef] [PubMed]
- Sengupta, S.; MCArthur, J.M.; Sarkar, A.; Leng, M.J.; Ravenscroft, P.; Howarth, R.J.; Banerjee, D.M. Do Ponds Cause Arsenic-Pollution of Groundwater in the Bengal Basin? An Answer from West Bengal. Environ. Sci. Technol. 2008, 42, 5156–5164. [Google Scholar] [CrossRef]
- Harvey, C.F.; Ashfaque, K.N.; Yu, W.; Badruzzaman, A.B.M.; Ali, M.A.; Oates, P.M.; Michael, H.A.; Neumann, R.B.; Beckie, R.; Islam, S.; et al. Groundwater dynamics and arsenic contamination in Bangladesh. Chem. Geol. 2006, 228, 112–136. [Google Scholar] [CrossRef]
- Islam, M.S.; Siddika, A.; Khan, M.N.H.; Goldar, M.M.; Sadique, M.A.; Kabir, A.N.M.H.; Colwell, R.R. Microbiological analysis of tube-well water in a rural area of Bangladesh. Applied Environmental Microbiology 2001, 67, 28–30. [Google Scholar] [CrossRef]
- Van Geen, A.; Radloff, K.A.; Aziz, Z.; Cheng, Z.; Huq, M.R.; Ahmed, K.M.; Weinman, B.; Goodbred, S.; Jung, H.B.; Zheng, Y.; et al. Comparison of arsenic concentrations in simultaneously-collected groundwater and aquifer particles from Bangladesh, India, Vietnam, and Nepal. Appl. Geochem. 2008, 23, 3244–3251. [Google Scholar] [CrossRef]
- Nath, B.; Norra, S.; Chatterjee, D.; Stuben, D. Finger Printing of Land Use Related Chemical patterns in Street Sediment from Kolkata, India. Environmental Forensics 2007, 313–328, Neumann, R.B.; Ashfaque, K.N.; Badruzzaman, A.B.M.; Ali, M.A.; Shoemaker, J.K.; Harvey, C.F. Anthropogenic influence on groundwater arsenic concentration in Bangladesh. Nat Geosci 2010, 3, 46–52. [Google Scholar] [CrossRef]
- Fendorf, S.; Michael, H.A.; van Geen, A. Spatial and temporal variations of groundwater arsenic in south and southeast Asia. Science 2010, 328, 1123–1127. [Google Scholar] [CrossRef]
- Reimann, C.; Matschullat, J.; Birke, M.; Salminen, R. Arsenic distribution in the environment: The effects of scale. Applied Geochemistry 2009, 24, 1147–1167. [Google Scholar] [CrossRef]
- Melamed, D. Monitoring arsenic in the environment: A review of science and technologies with the potential for field measurements. Analytica Chimica Acta 2005, 532, 1–13. [Google Scholar] [CrossRef]
- Matschullat, J. Arsenic in the geosphere—A review. Sci. Tot. Environ. 2000, 249, 297–312. [Google Scholar] [CrossRef] [PubMed]
- Postma, D.; Larsen, F.; Hue, N.T.M.; Duc, M.T.; Viet, P.H.; Nhan, P.Q.; Jessen, S. Arsenic in groundwater of the Red River floodplain, Vietnam: Controlling geochemical processes and reactive transport modeling. Geochim. Cosmochim. Acta 2007, 71, 5054–5071. [Google Scholar] [CrossRef]
- Charlet, L.; Chakraborty, S.; Appelo, C.; Roman-Ross, G.; Nath, B.; Ansari, A.; Lanson, M.; Chatterjee, D.; Mallik, S.B. Chemodynamics of an arsenic “hotspot” in a West Bengal aquifer: A field and reactive transport modeling study. Applied geochemistry 2007, 22, 1273–1292. [Google Scholar] [CrossRef]
- Kocar, B.D.; Poliozotto, M.L.; Bebber, S.G.; Ying, S.C.; Ung, M.; Ouch, K.; Samreth, S.; Suy, B.; Phan, K.; Sampson, M.; et al. Integrated biogeochemical and hydrologic processes driving arsenic release from shallow sediments to groundwaters of the Mekong delta. Appl. Geochem. 2008, 23, 3059–3071. [Google Scholar] [CrossRef]
- Polizzotto, M.L.; Kocar, B.D.; Benner, S.G.; Sampson, M.; Fendorf, S. Near-surface wetland sediments as a source of arsenic release to ground water in Asia. Nature 2008, 454, 505–508. [Google Scholar] [CrossRef]
- Datta, S.; Neal, A.W.; Mohajerin, T.J.; Ocheltree, T.; Rosenheim, B.E.; White, C.D.; Johannesson, K.H. Perennial ponds are not an important source of water or dissolved organic matter to groundwaters with high arsenic concentrations in West Bengal, India. Geophysical Research Letters 2011, 38. [Google Scholar] [CrossRef]
- MCArthur, J.M.; Ravenscroft, P.; Banerjee, D.M.; Milsom, J.; Hudson-Edwards, K.A.; Sengupta, S.; Bristow, C.; Sarkar, A.; Tonkin, S.; Purohit, R. How paleosols influence groundwater flow and arsenic pollution: A model from the Bengal Basin and its worldwide implication. Water Resour. Res. 2008, 44, 1–30. [Google Scholar] [CrossRef]
- Ravenscroft, P.; MC arthur, J.M.; Hoque, B.A. Geochemical and palaeohydrological controls on pollution of groundwater by arsenic. In Arsenic Exposure and Health Effects; Chappel, W.R., Abernathy, C.O., Calderon, R., Eds.; Elsevier: Oxford, 2001; pp. 53–78. [Google Scholar]
- Lawson, M.; Polya, D.A.; Boyce, A.J.; Bryant, C.; Mondal, D.; Shantz, A.; Ballentine, C.J. Pond-derived organic carbon driving changes in arsenic hazard found in Asian groundwaters. Environmental Science & Technology 2013, 47, 7085–7094. [Google Scholar] [CrossRef]
- Lovley, D.R.; Coates, J.D.; Blunt-harris, E.L.; Phillips, E.J.P.; Woodward, J.C. Humic substances as electron acceptors for microbial respiration. Nature 1996, 382, 445–448. [Google Scholar] [CrossRef]
- Bhowmick, S.; Halder, D.; Kundu, A.K.; Saha, D.; Iglesias, M.; Nriagu, J.; Guha Mazumder, D.N.; Roman-Ross, G.; Chatterjee, D. Is saliva a potential biomarker of arsenic exposure? A case-control study in West Bengal, India. Environmental Science & Technology 2013, 47, 3326–3332. [Google Scholar] [CrossRef]
- Biswas, A.; Bhattacharya, P.; Mukherjee, A.; Nath, B.; Alexanderson, H.; Kundu, A.K.; Chatterjee, D.; Jacks, G. Shallow hydrostratigraphy in an arsenic affected region of Bengal Basin: Implication for targeting safe aquifers for drinking water supply. Science of the Total Environment 2014, 485–486, 12–22. [Google Scholar] [CrossRef]
- Okazaki, T.; Kuramitz, H.; Hata, N.; Taguchi, S.; Murai, K.; Okauchi, K. Visual colorimetry for determination of trace arsenic in groundwater based on improved molybdenum blue spectrophotometry. Analytical Methods 2015, 7, 2794–2799. [Google Scholar] [CrossRef]
- Stauffer, R.E.; Jenne, E.A.; Ball, J.W. Chemical studies of selected trace elements in hot spring drainages of YelIowstone National Park. U.S. Geol. Survey Pro$ Paper Series 1044F. 1980; 20p. [Google Scholar]
- Dittmar, J.; Voegelin, A.; Maurer, F.; Roberts, L.C.; Hug, S.J.; Saha, G.C.; Kretzschmar, R. Arsenic in Soil and Irrigation Water Affects Arsenic Uptake by Rice: Complementary Insights from Field and Pot Studies. Environmental Science & Technology 2010, 44, 8842–8848. [Google Scholar] [CrossRef]
- Von Brömssen, M.; Häller Larsson, S.; Bhattacharya, P.; Hasan, M.A.; Ahmed, K.M.; Jakariya, M.; Jacks, G. Geochemical characterisation of shallow aquifer sediments of MatlabUpazila, Southeastern Bangladesh—Implications for targeting low-As aquifers. Journal of Contaminant Hydrology 2008, 99, 137–149. [Google Scholar] [CrossRef]
- Bhattacharya, P.; Chatterjee, D.; Jacks, G. Occurrence of arsenic contaminated groundwater in alluvial aquifers from Delta Plains, Eastern India: Options for safe drinking water supply. International Journal of Water Resources Development 1997, 13, 79–92. [Google Scholar] [CrossRef]
- World Health Organization (WHO). Excreta and Greywater Use in Agriculture. In Excreta and Greywater; Guidelines for the Safe Use of Wastewater; World Health Organization: Geneva, Switzerland, 2006; Volume 4, https://www.who.int/publications.
- World Health Organization. Safely Managed Drinking Water—Thematic Report on Drinking Water 2. 2017. Available online: https://apps.who.int/iris/handle/10665/325897 (accessed on 10 June 2022).
- Kgopa, P.M.; Mashela, P.W.; Manyevere, A. Microbial quality of treated wastewater and borehole water used for irrigation in a semi-arid area. Int. J. Environ. Res. Public Health 2021, 18, 8861. [Google Scholar] [CrossRef]
- Addo, K.K.; Mensah, G.I.; Donkor, B.; Bonsu, C.; Akyeh, M.L. Bacteriological quality of bottled water sold on the Ghanaian market. African Journal of Food, Agriculture, Nutrition and Development 2009, 9. [Google Scholar] [CrossRef]
- Kabir, A.H.M.E.; Chakraborty, T.K.; Ghosh, G.C. Bio-Sand Filter (BSF): A Simple Water Treatment Device for Safe Drinking water Supply and to Promote Health in Hazard Prone Hard-to-Reach Coastal Areas of Bangladesh. 2016. [Google Scholar]
- Frisnie, S.H.; Ortega, R.; Maynard, D.M.; Sarkar, B. The concentrations of arsenic and other toxic elements in Bangladesh. Environmental Health Perspective 2002, 110, 1147–1153. [Google Scholar] [CrossRef]
- Ercumen, A.; Pickering, A.J.; Kwong, L.H.; Arnold, B.F.; Parvez, S.M.; Alam, M.; Sen, D.; Islam, S.; Kullmann, C.; Chase, C.; et al. Animal Feces Contribute to Domestic Fecal Contamination: Evidence from E. coli Measured in Water, Hands, Food, Flies, and Soil in Bangladesh. Environ Sci Technol. 2017, 51, 8725–8734. [Google Scholar] [CrossRef]
- Van Geen, A.; Ahmed, K.M.; Akita, Y.; Alam, M.J.; Culligan, P.J.; Emch, M.; Yunus, M. Fecal Contamination of Shallow Tube wells in Bangladesh Inversely Related to Arsenic. Environmental Science & Technology 2012, 45, 1199–1205. [Google Scholar] [CrossRef]
- Shrestha, S.; Nakamura, T.; Malla, R.; Nishida, K. Seasonal variation in the microbial quality of shallow groundwater in the Kathmandu Valley, Nepal. Water Science & Technology: Water Supply 2014, 14, 390–397. [Google Scholar] [CrossRef]
- Ouyang, Y.; Nkedi-Kizza, P.; Wu, Q.T.; Shinde, D.; Huang, C.H. Assessment of seasonal variations in surface water quality. Water Res. 2006, 40, 3800–3810. [Google Scholar] [CrossRef] [PubMed]
Figure 1.
Map of the study area.
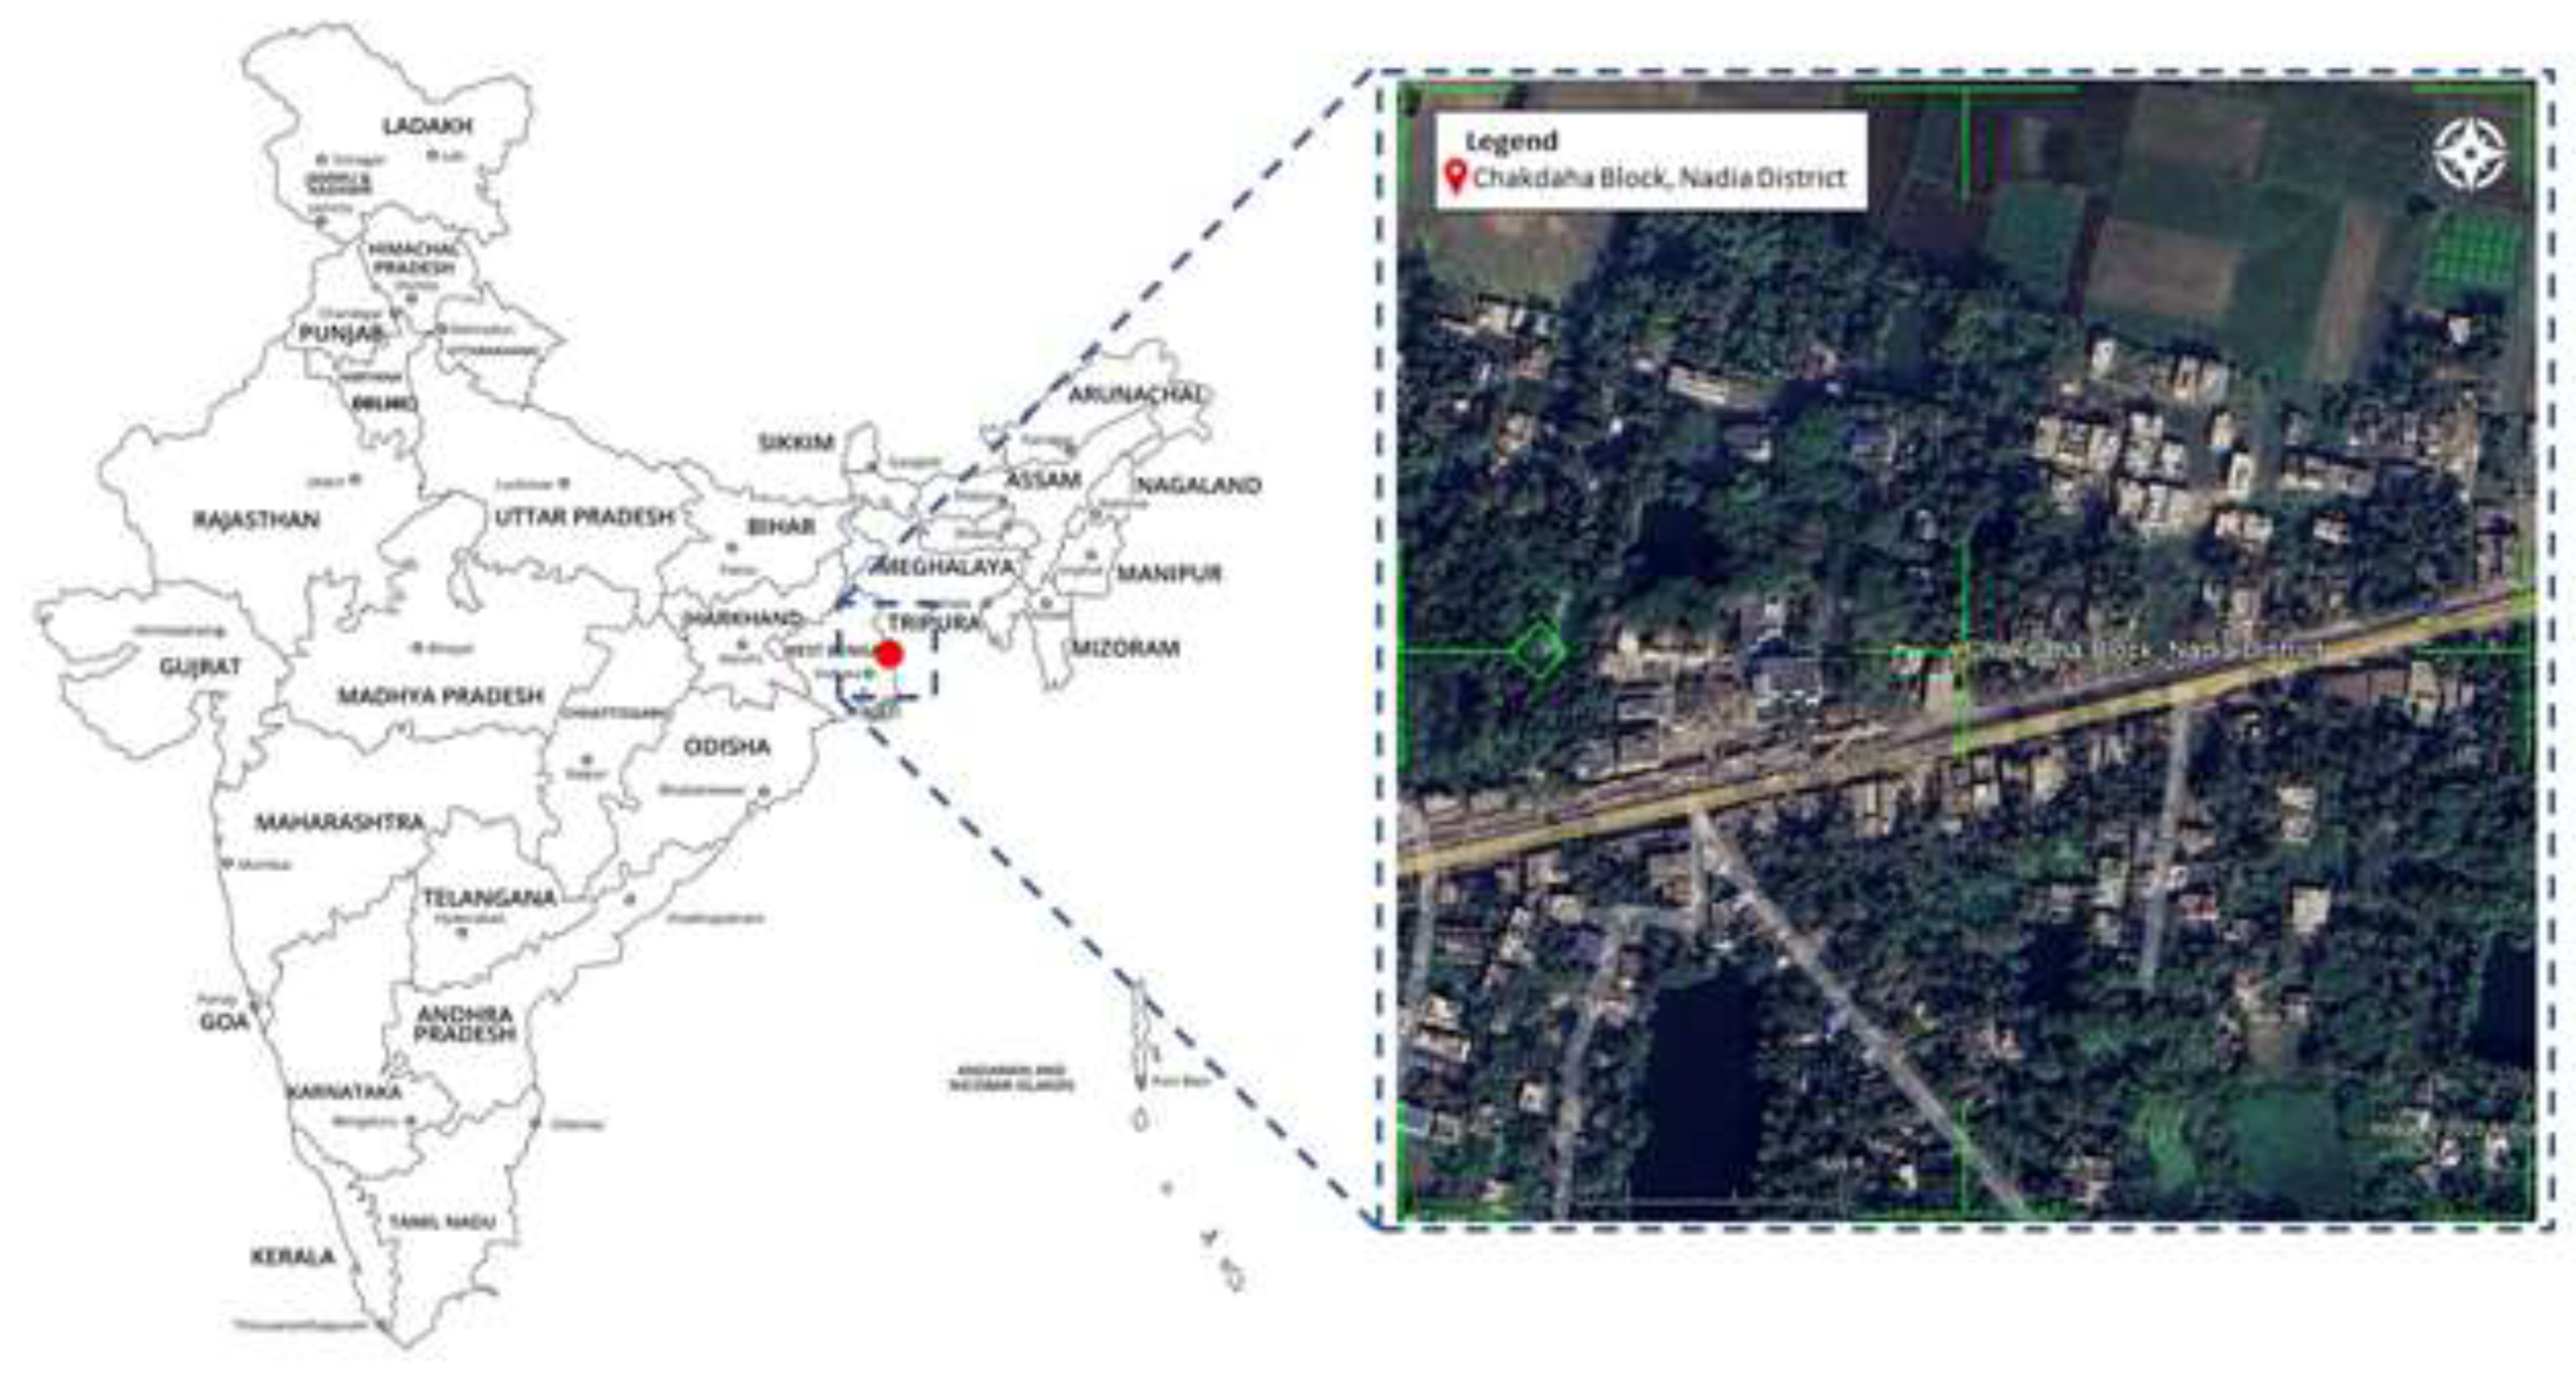
Figure 2.
Six sampling locations of each of the sites- 1-6: Site A (Chanduria-1), 7-12: Site B (Dewli), 13-18: Site C (Dubra), 19-24: Site D (Hingnara), 25-30: Site E (Silinda-1) and 31-36: Site F (Silinda-2).
Figure 2.
Six sampling locations of each of the sites- 1-6: Site A (Chanduria-1), 7-12: Site B (Dewli), 13-18: Site C (Dubra), 19-24: Site D (Hingnara), 25-30: Site E (Silinda-1) and 31-36: Site F (Silinda-2).
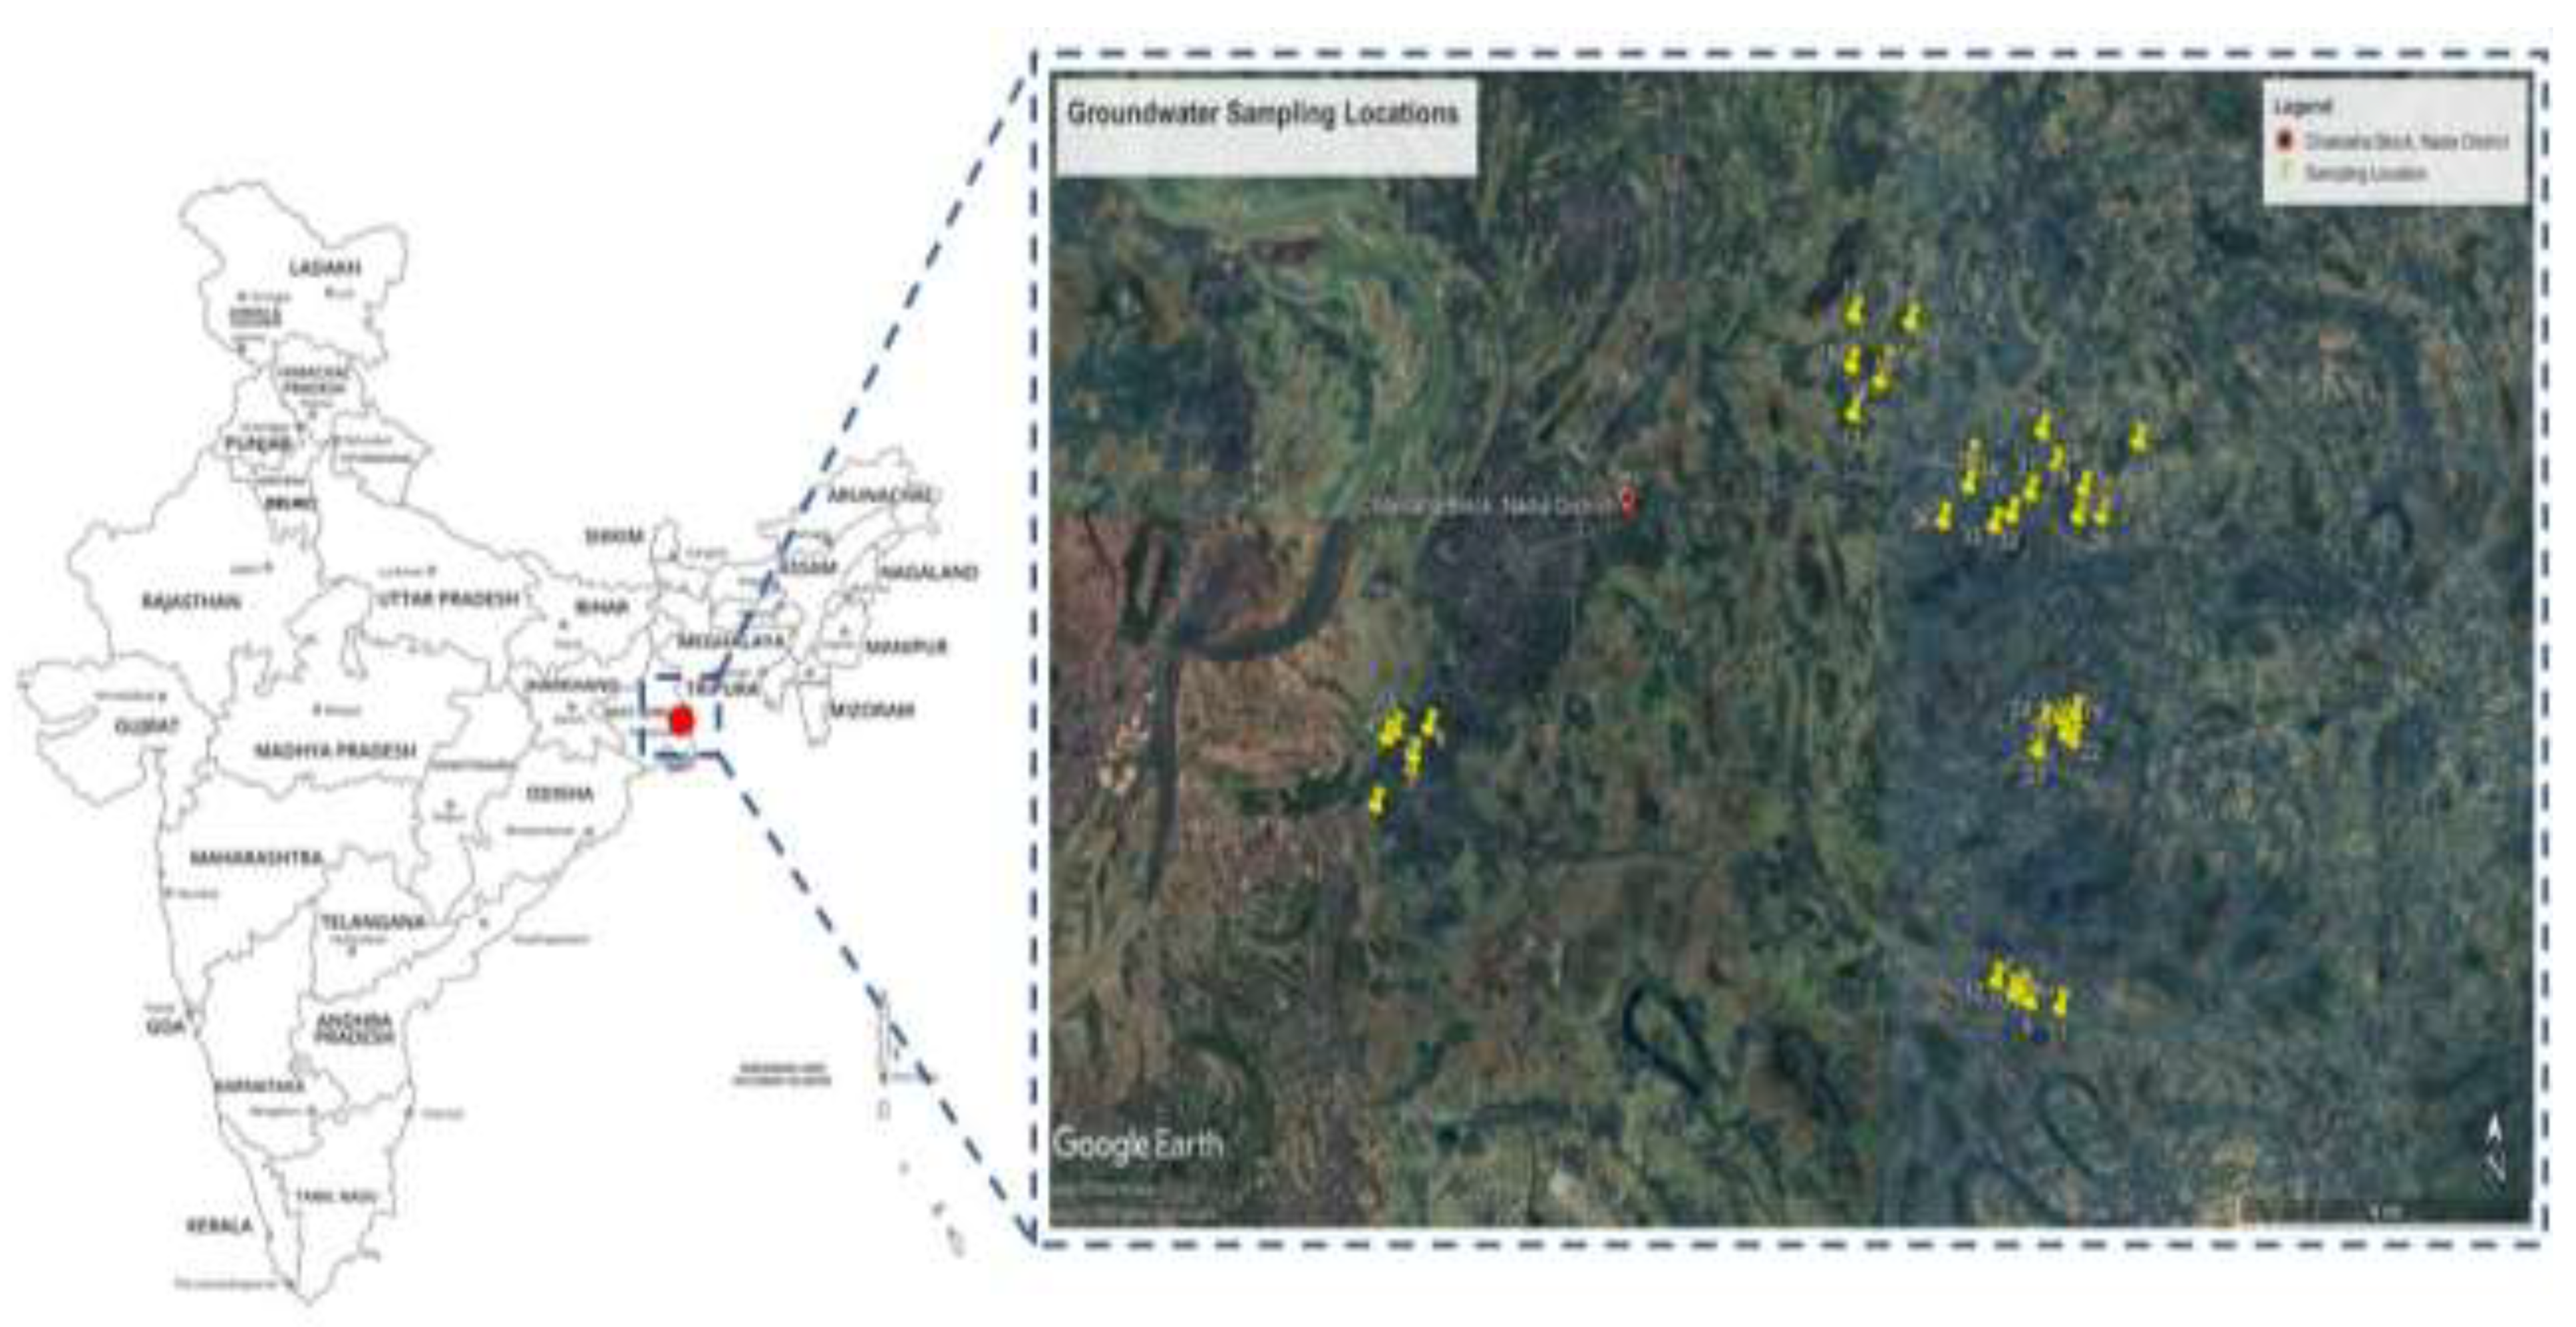
Figure 3.
Total coliform and Faecal coliform count in groundwater (tube well). (A). Total coliform count in tube well water samples of the study area. (B). Fecal coliform count in tube well water samples of the study area.
Figure 3.
Total coliform and Faecal coliform count in groundwater (tube well). (A). Total coliform count in tube well water samples of the study area. (B). Fecal coliform count in tube well water samples of the study area.
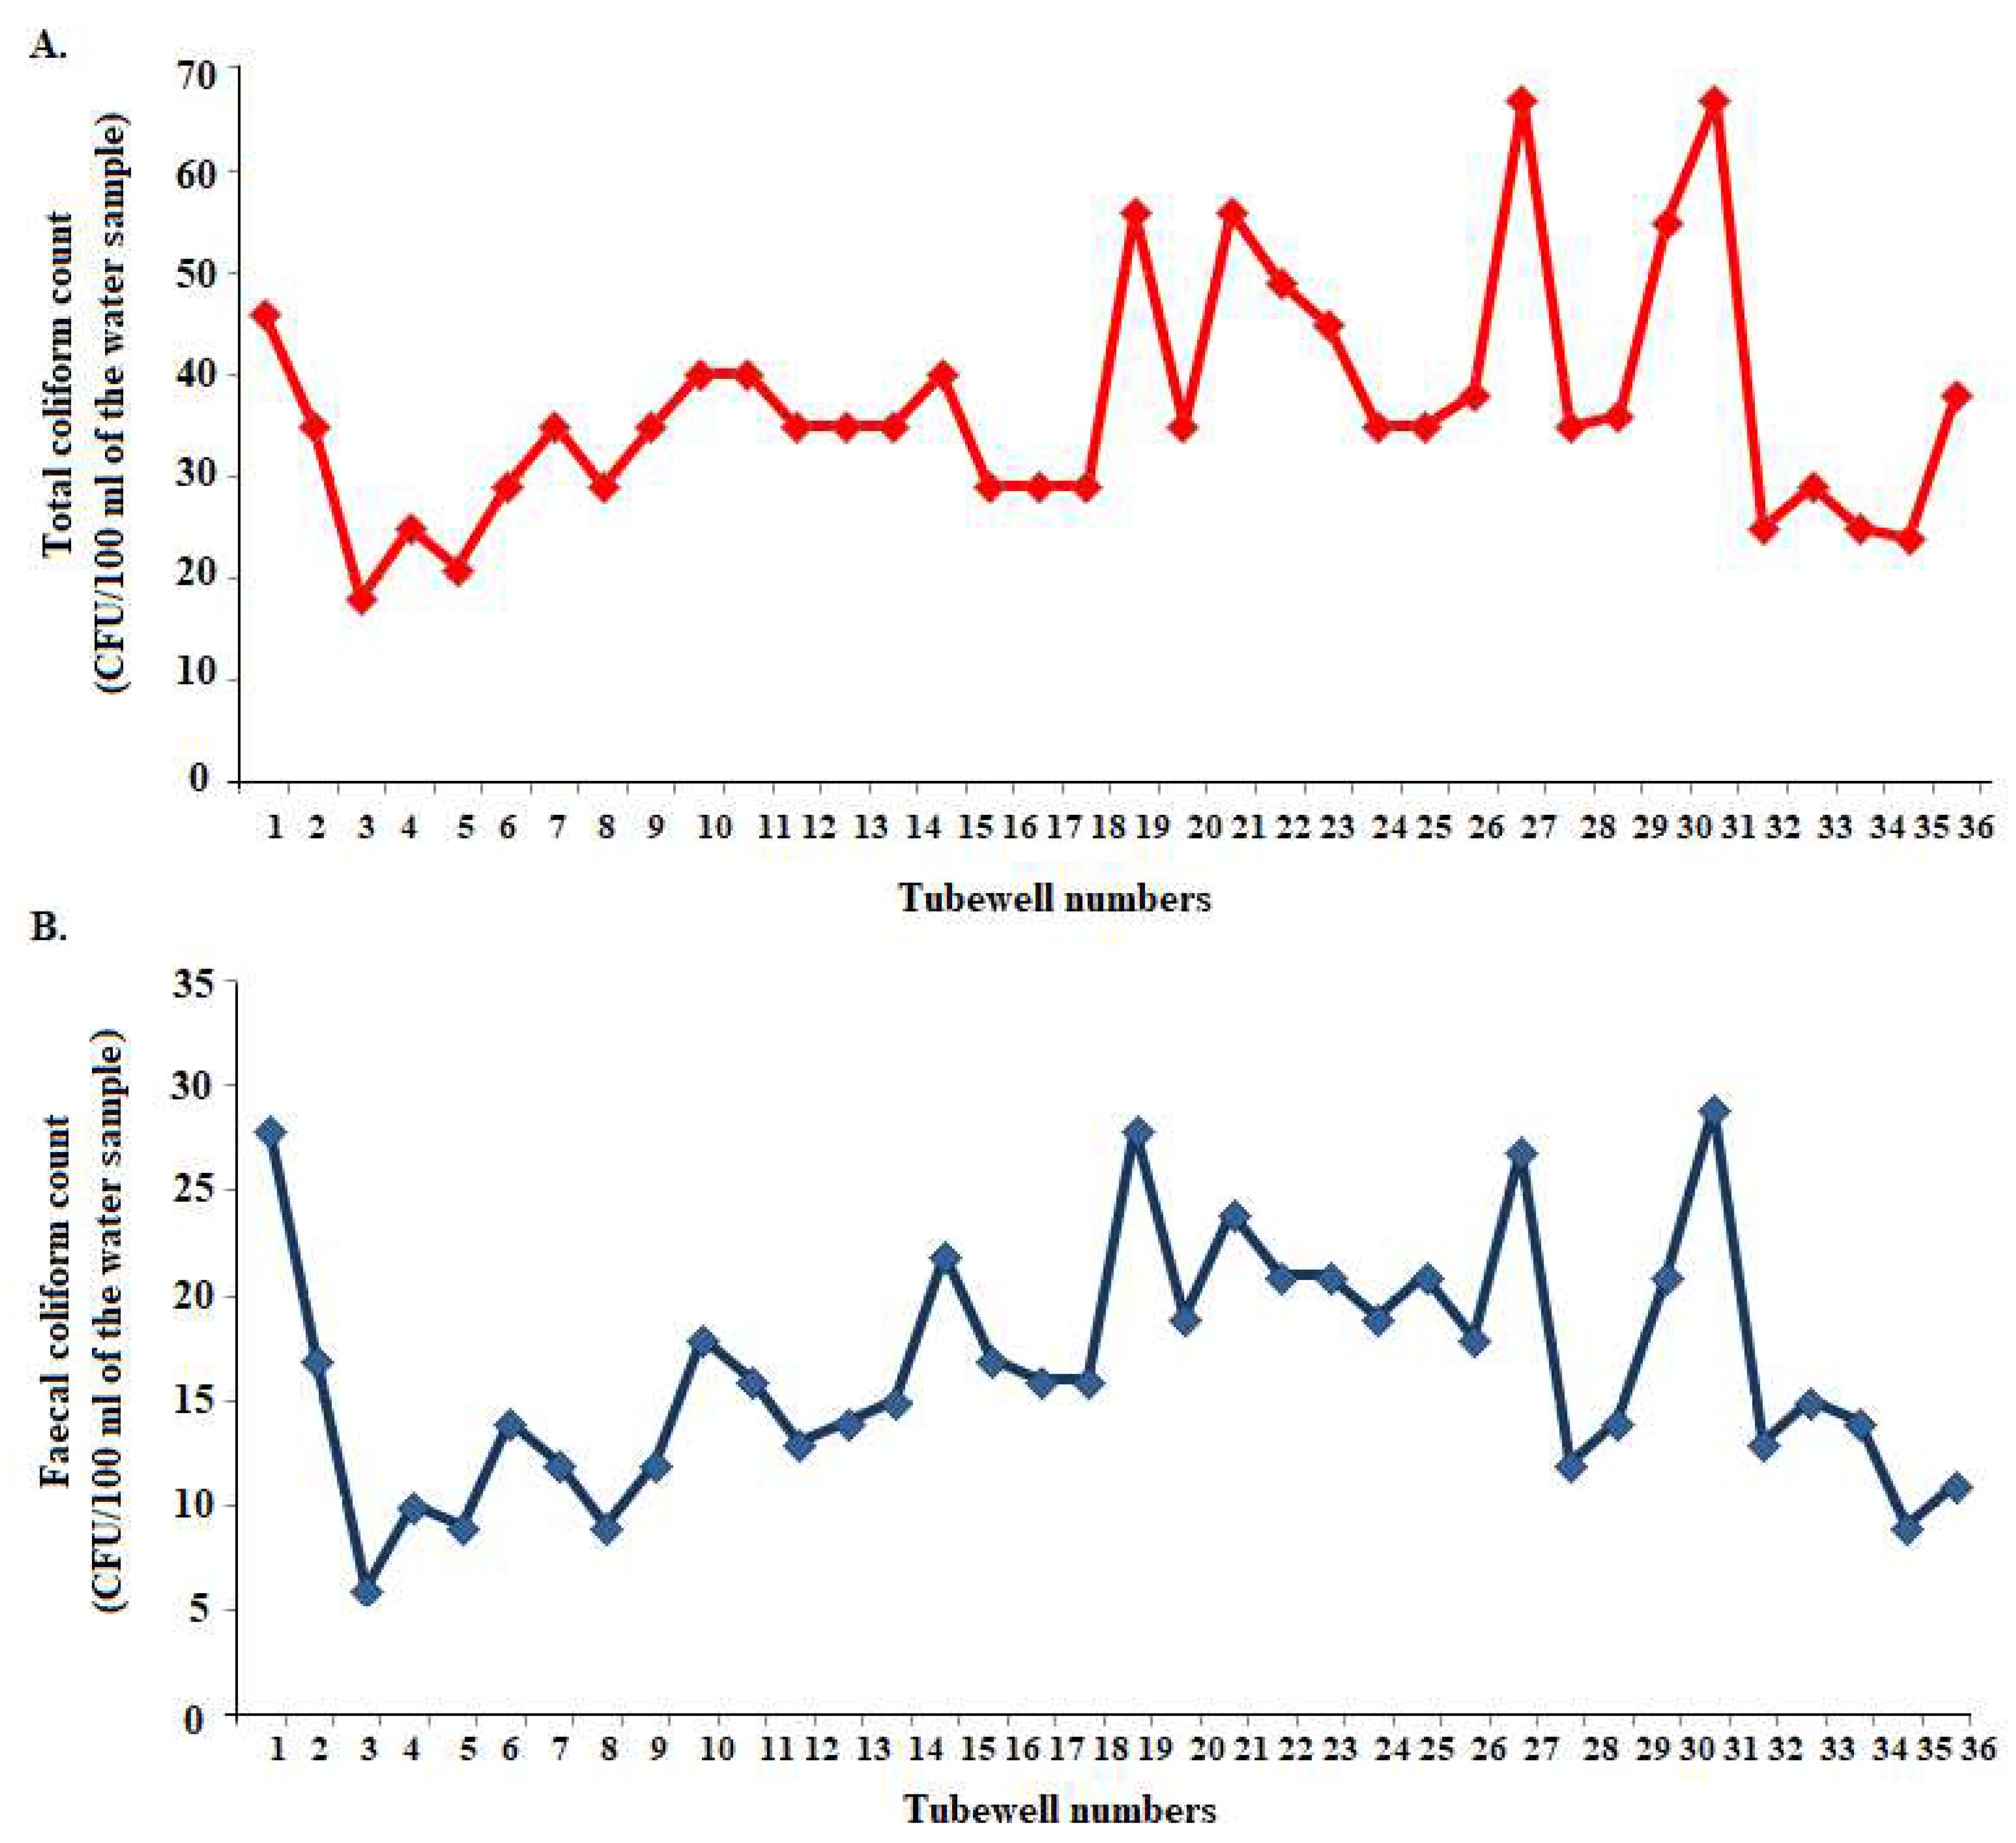
Figure 4.
Chromocult agar plate with different coliform bacteria.
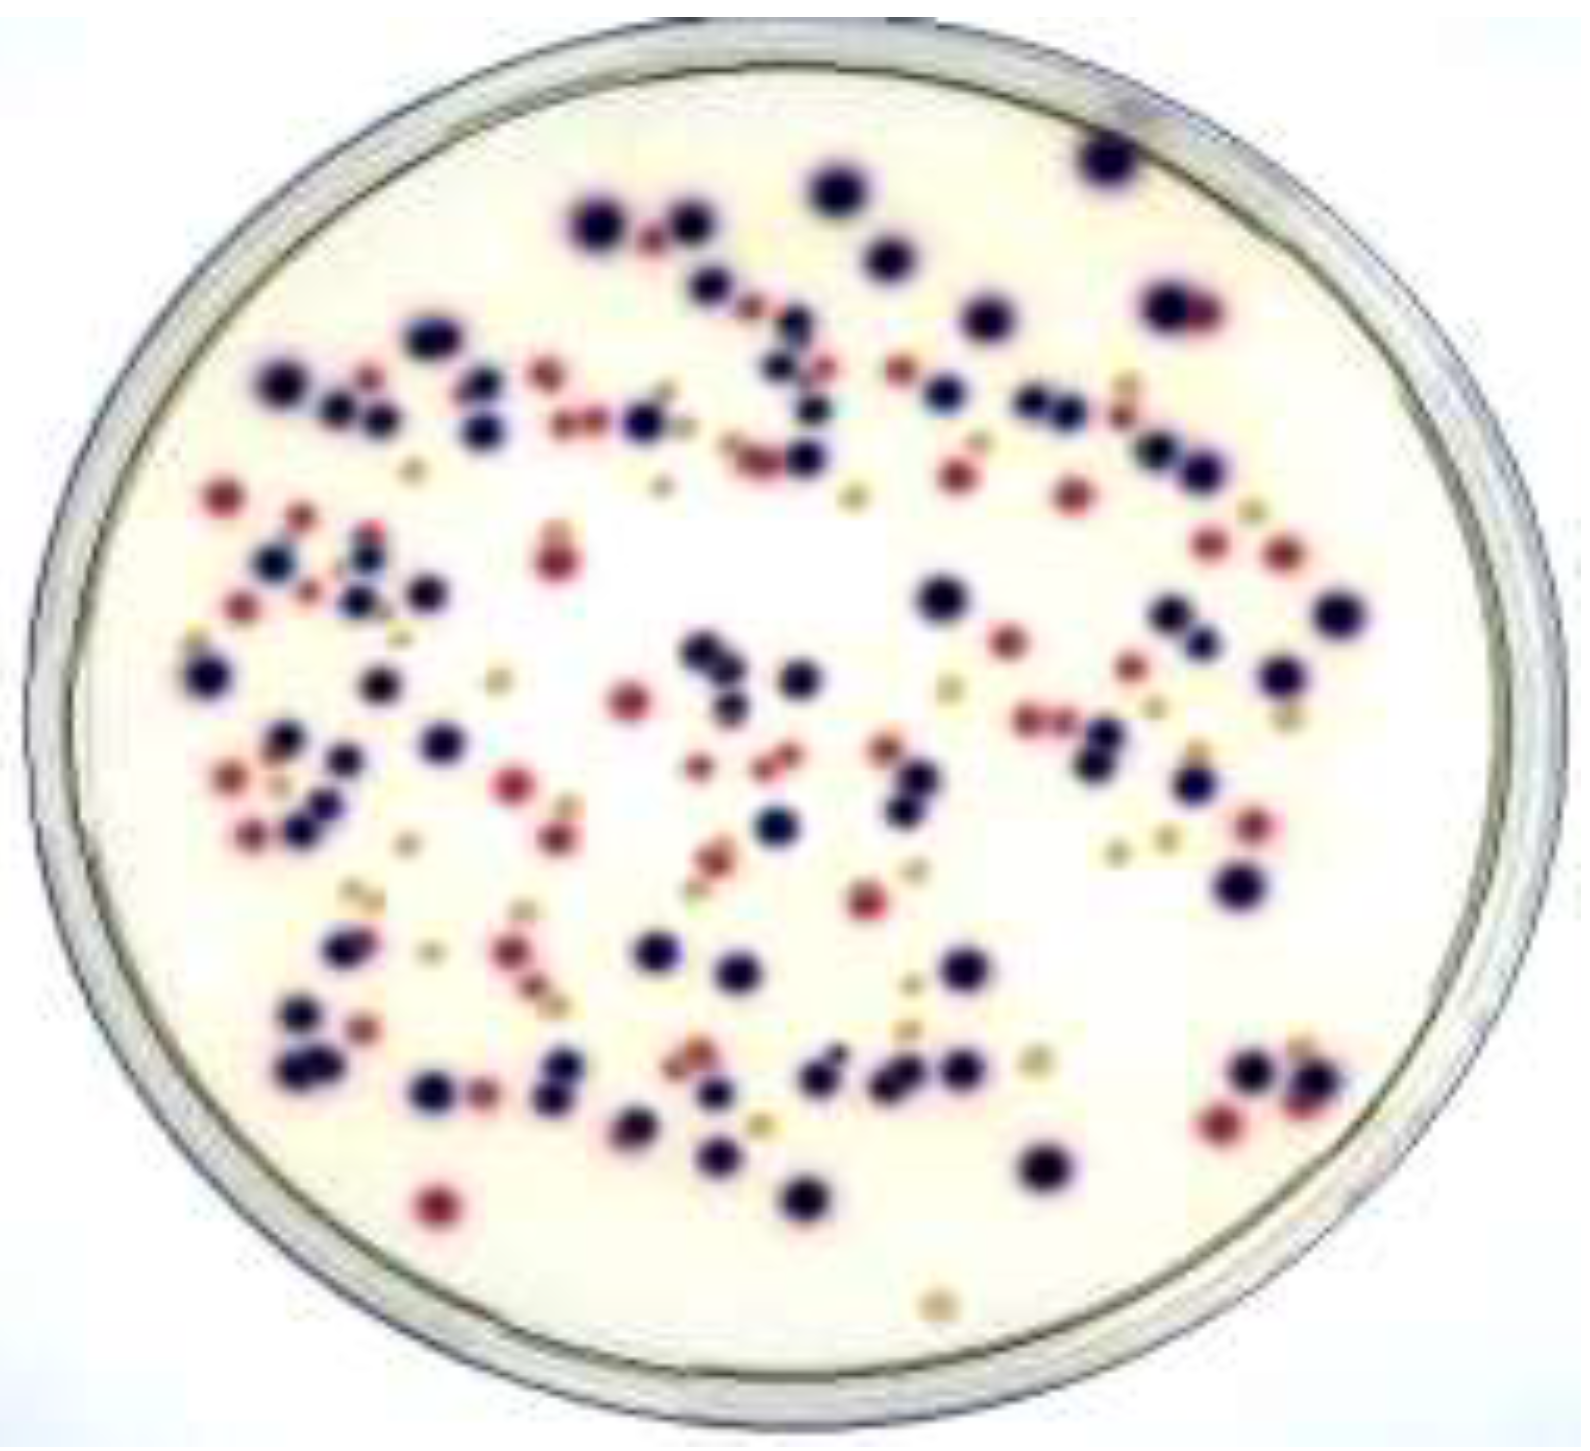
Figure 5.
Total coliform and Faecal coliform count in surface water (pond). (A). Faecal coliform count in pond water samples of the study area. (B). Faecal coliform count in pond water samples of the study area.
Figure 5.
Total coliform and Faecal coliform count in surface water (pond). (A). Faecal coliform count in pond water samples of the study area. (B). Faecal coliform count in pond water samples of the study area.
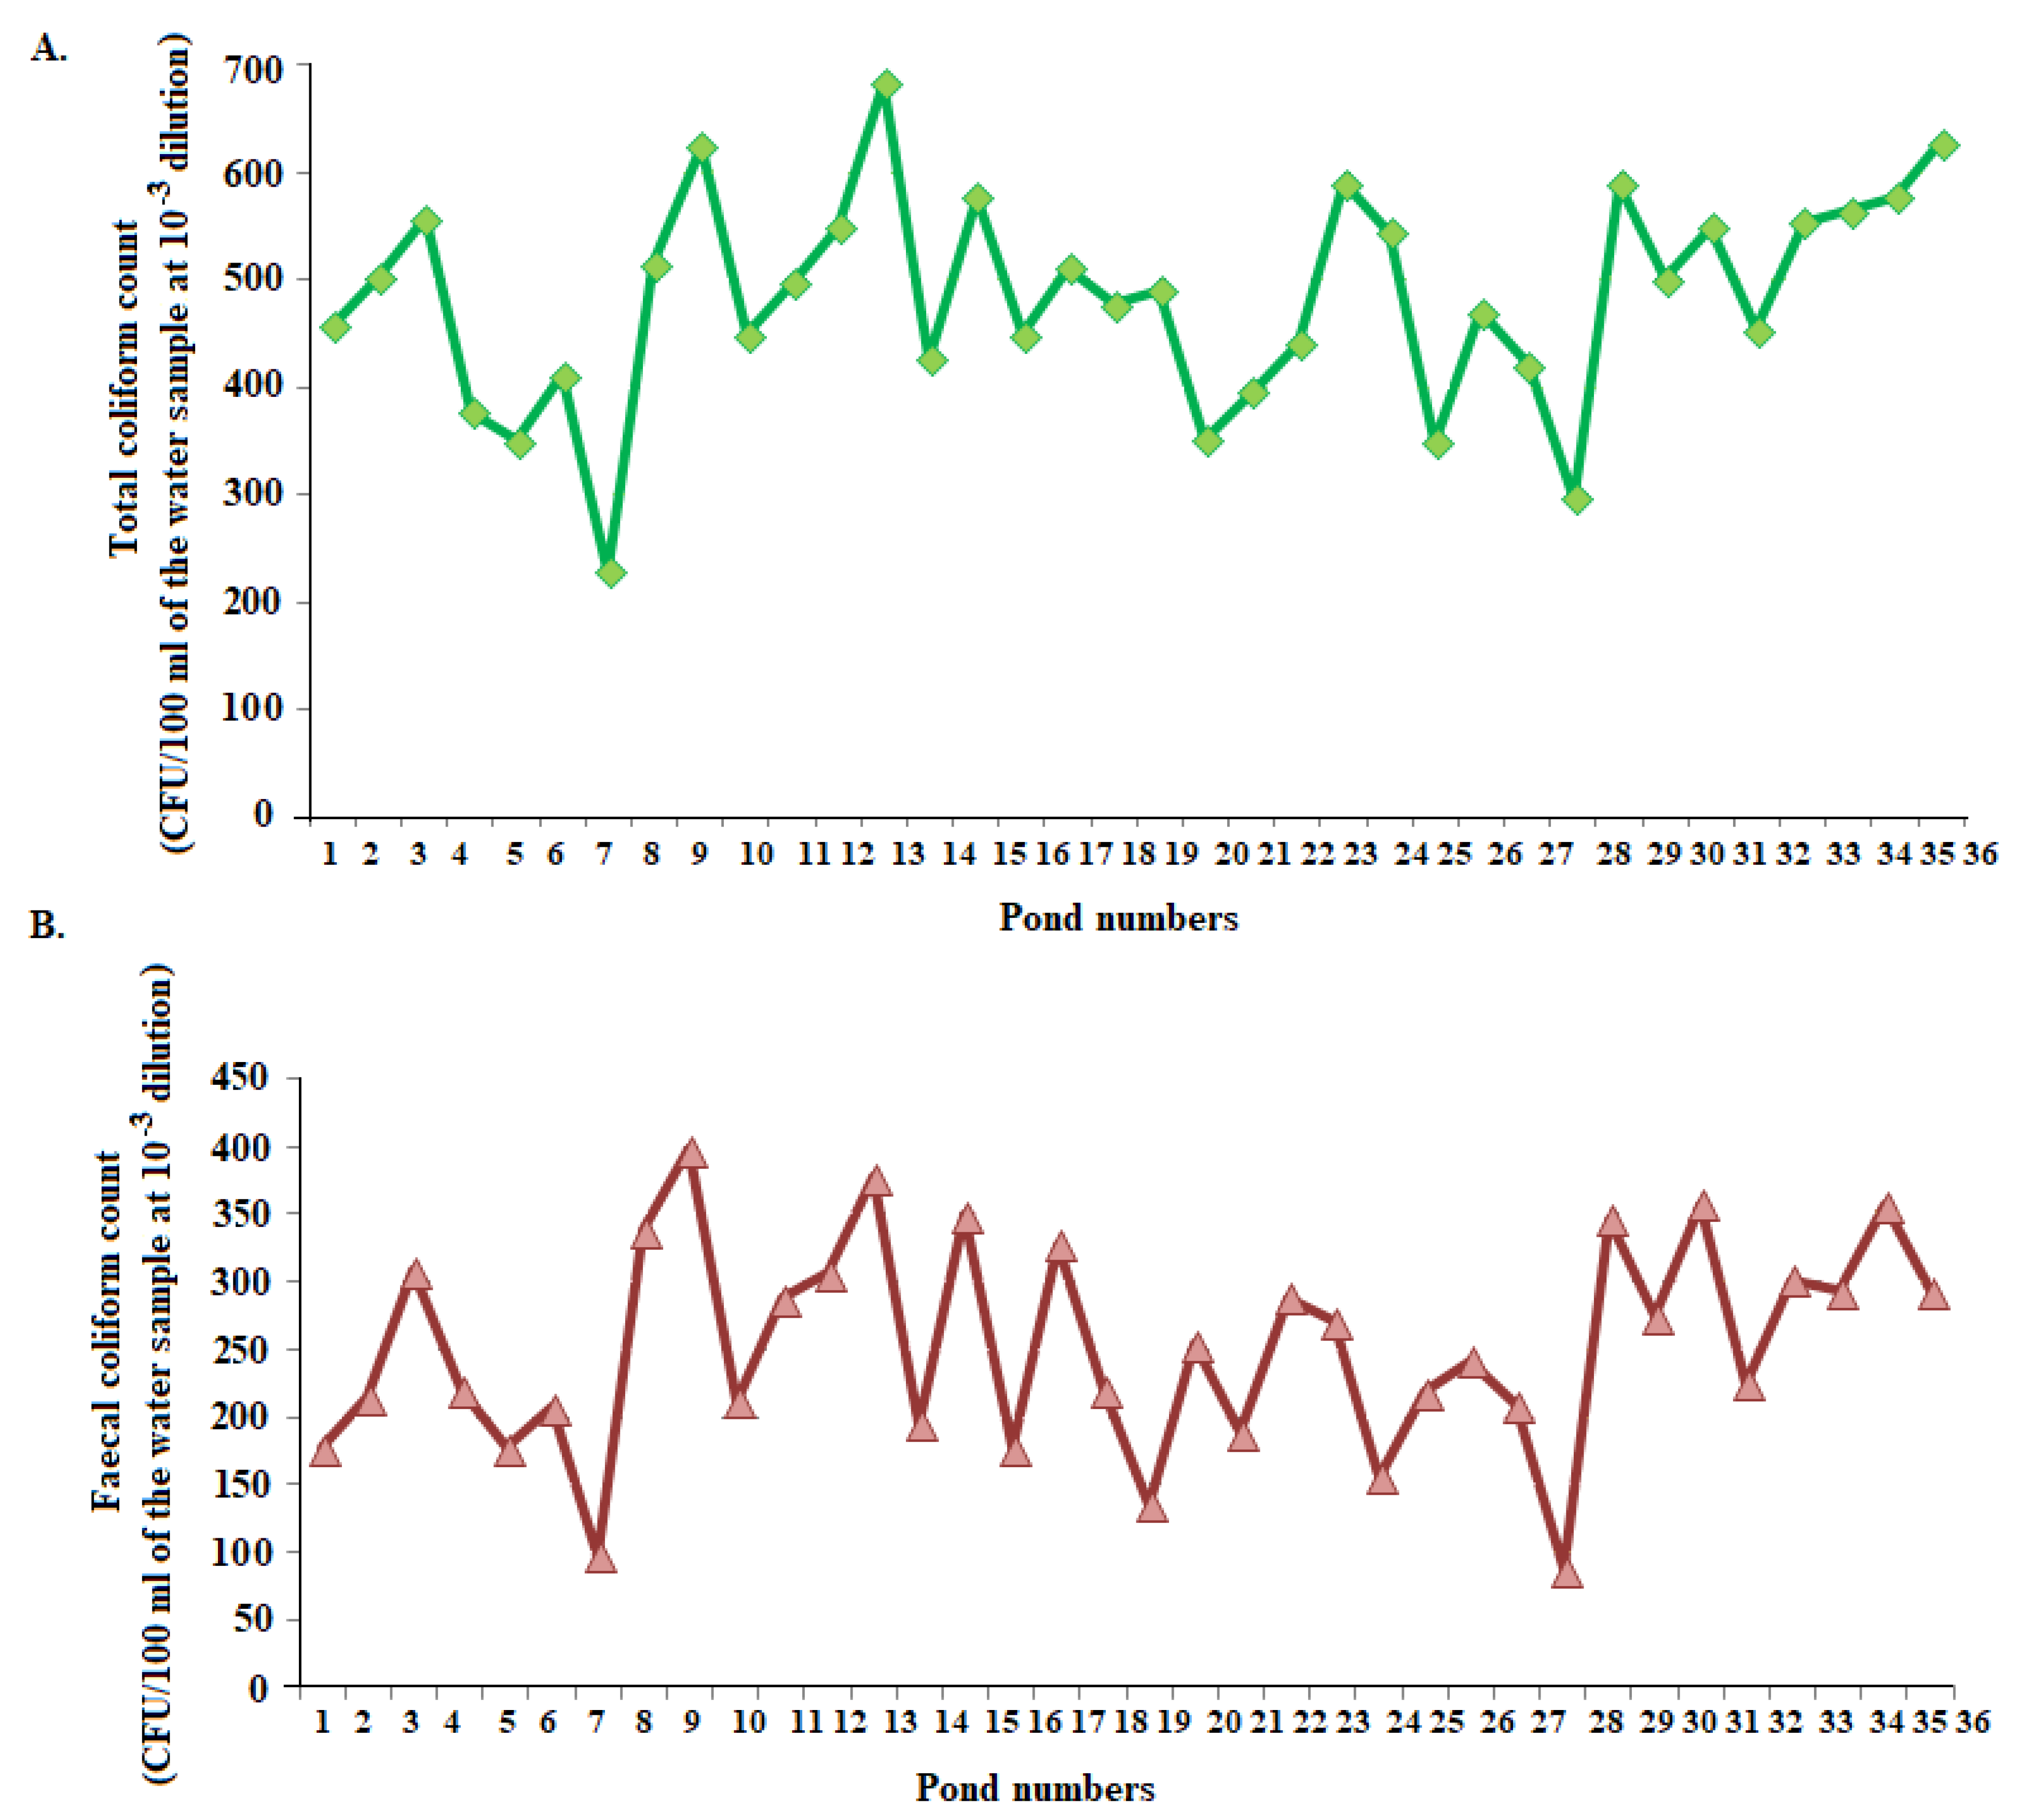
Figure 6.
Seasonal variation in total and faecal coliform counts of groundwater and surface water. (A). Mean of total and faecal coliform counts in tube well water samples of different sites in dry and wet season. (B). Mean of total and faecal coliform counts in pond water samples of different sites in dry and wet season.
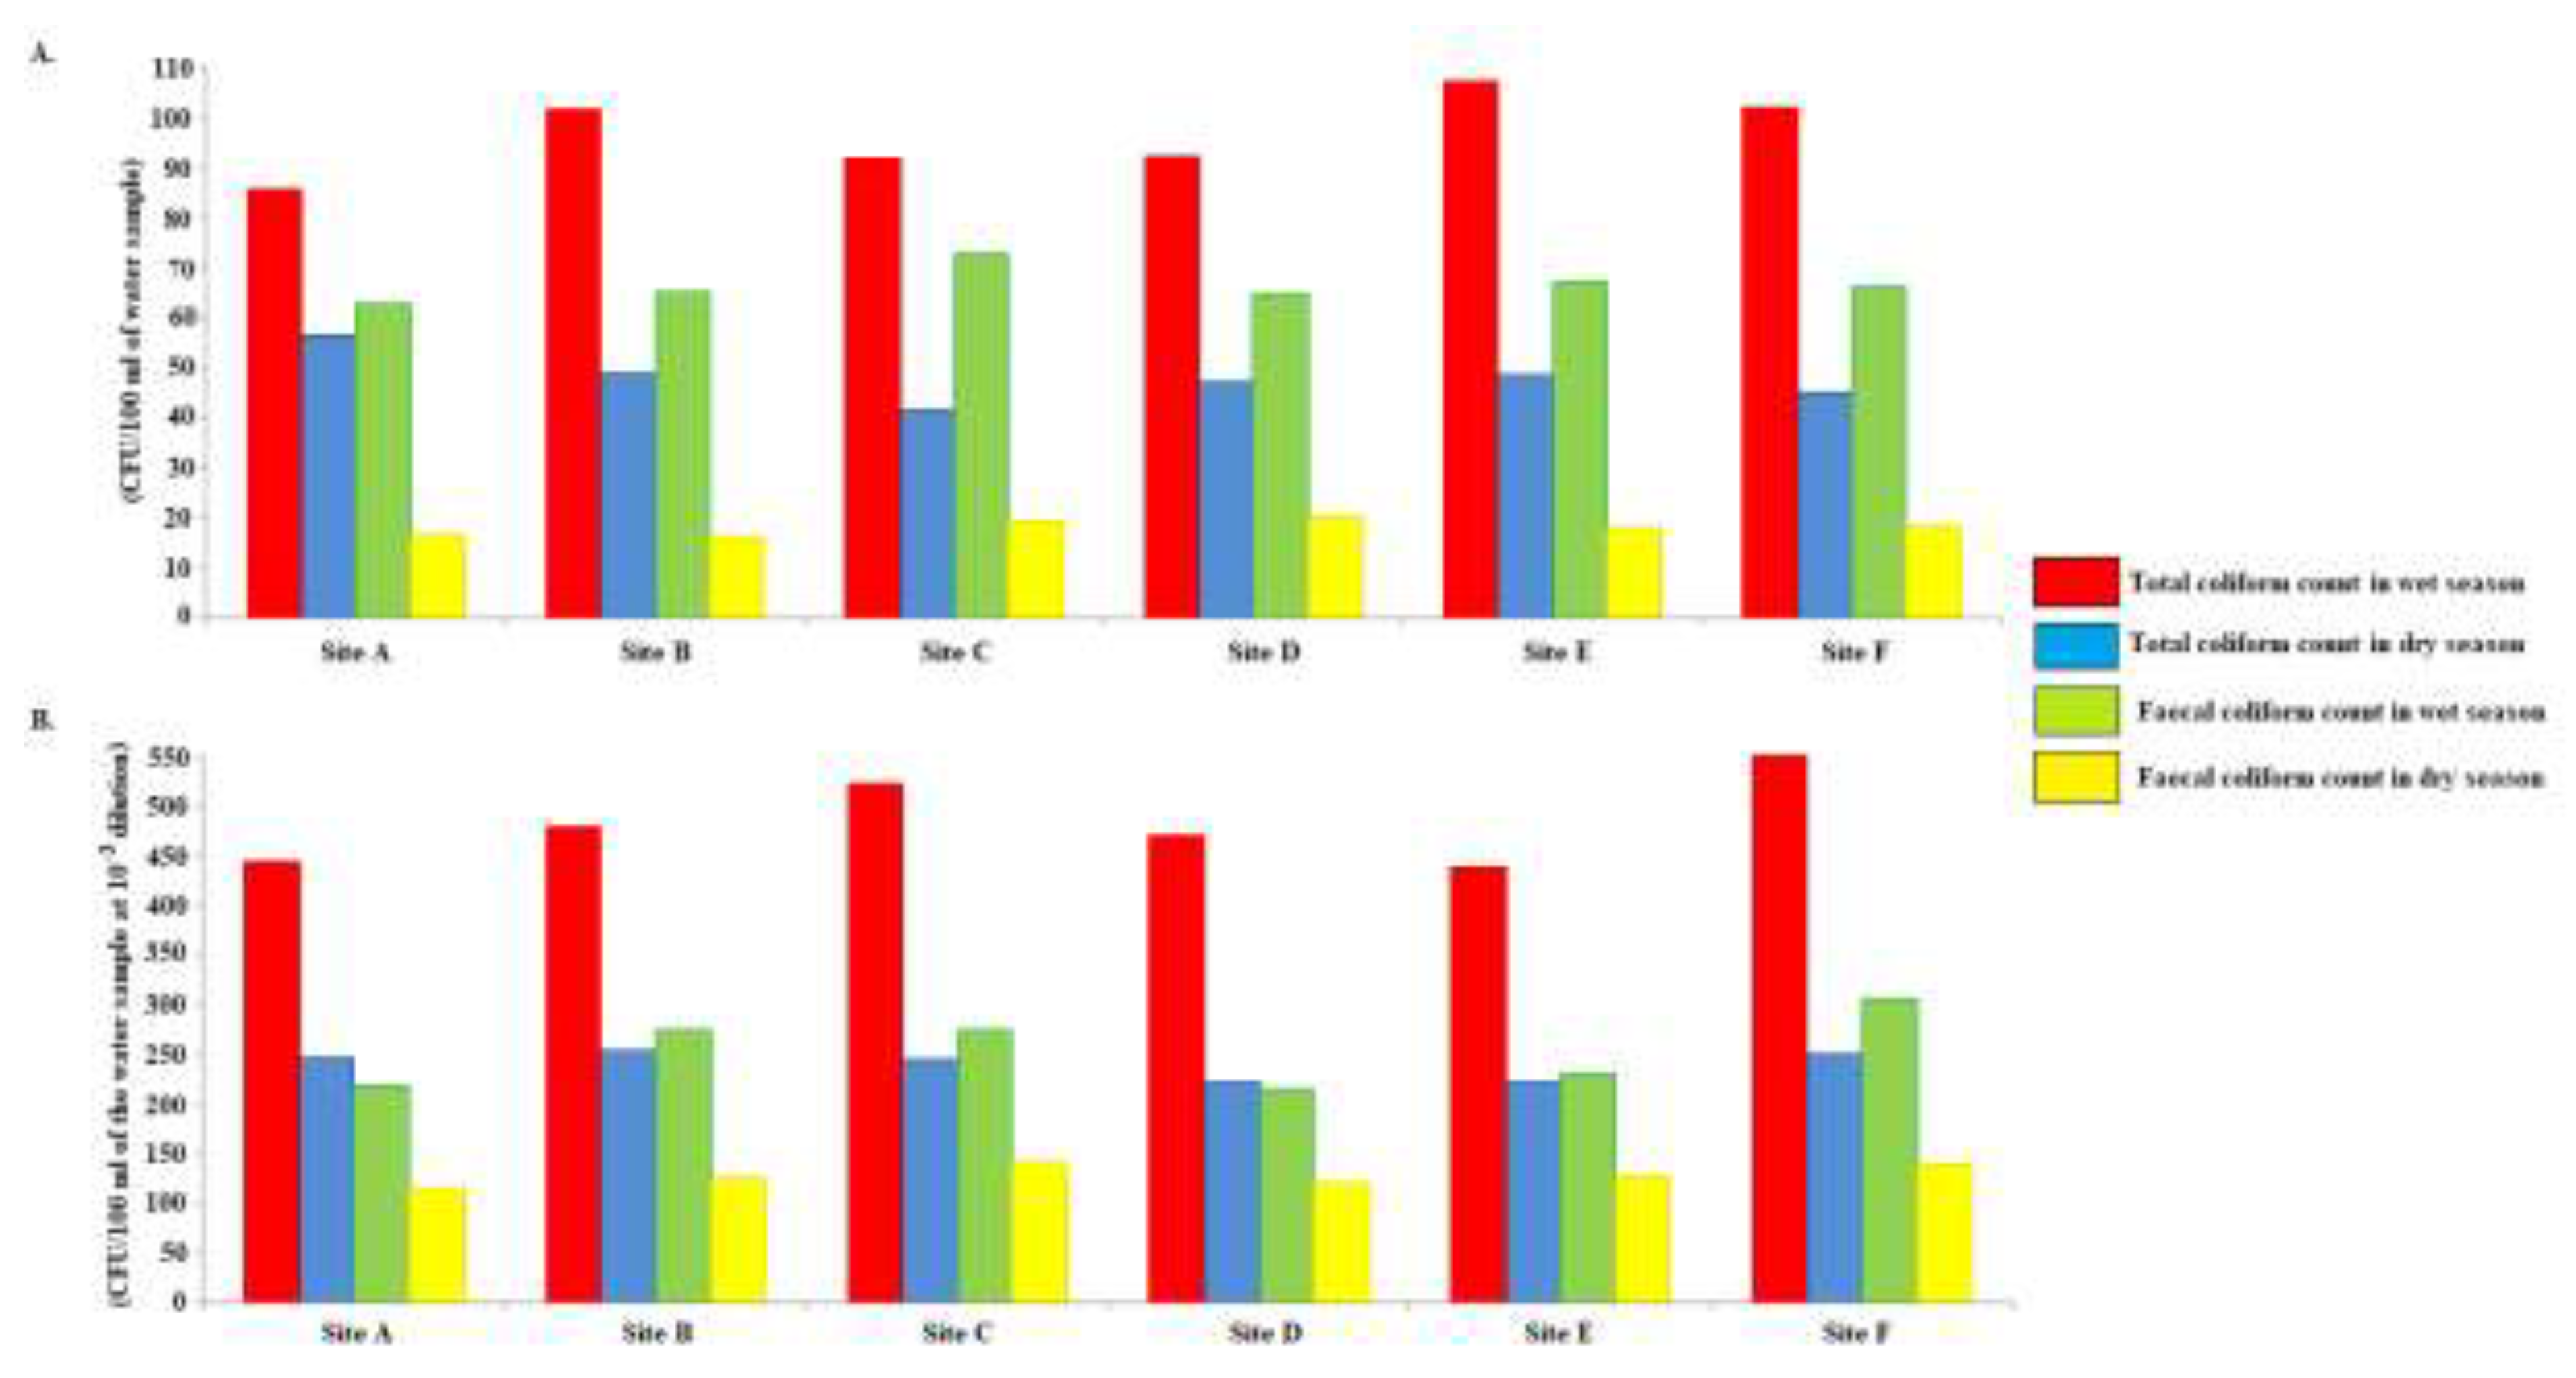
Figure 7.
Risk assessment from sanitary risk score and faecal coliform score of different sites. (A). Sanitary risk category of tube wells of different sites. (B). Mean faecal coliform count based faecal coliform score of tube wells of different sites.
Figure 7.
Risk assessment from sanitary risk score and faecal coliform score of different sites. (A). Sanitary risk category of tube wells of different sites. (B). Mean faecal coliform count based faecal coliform score of tube wells of different sites.
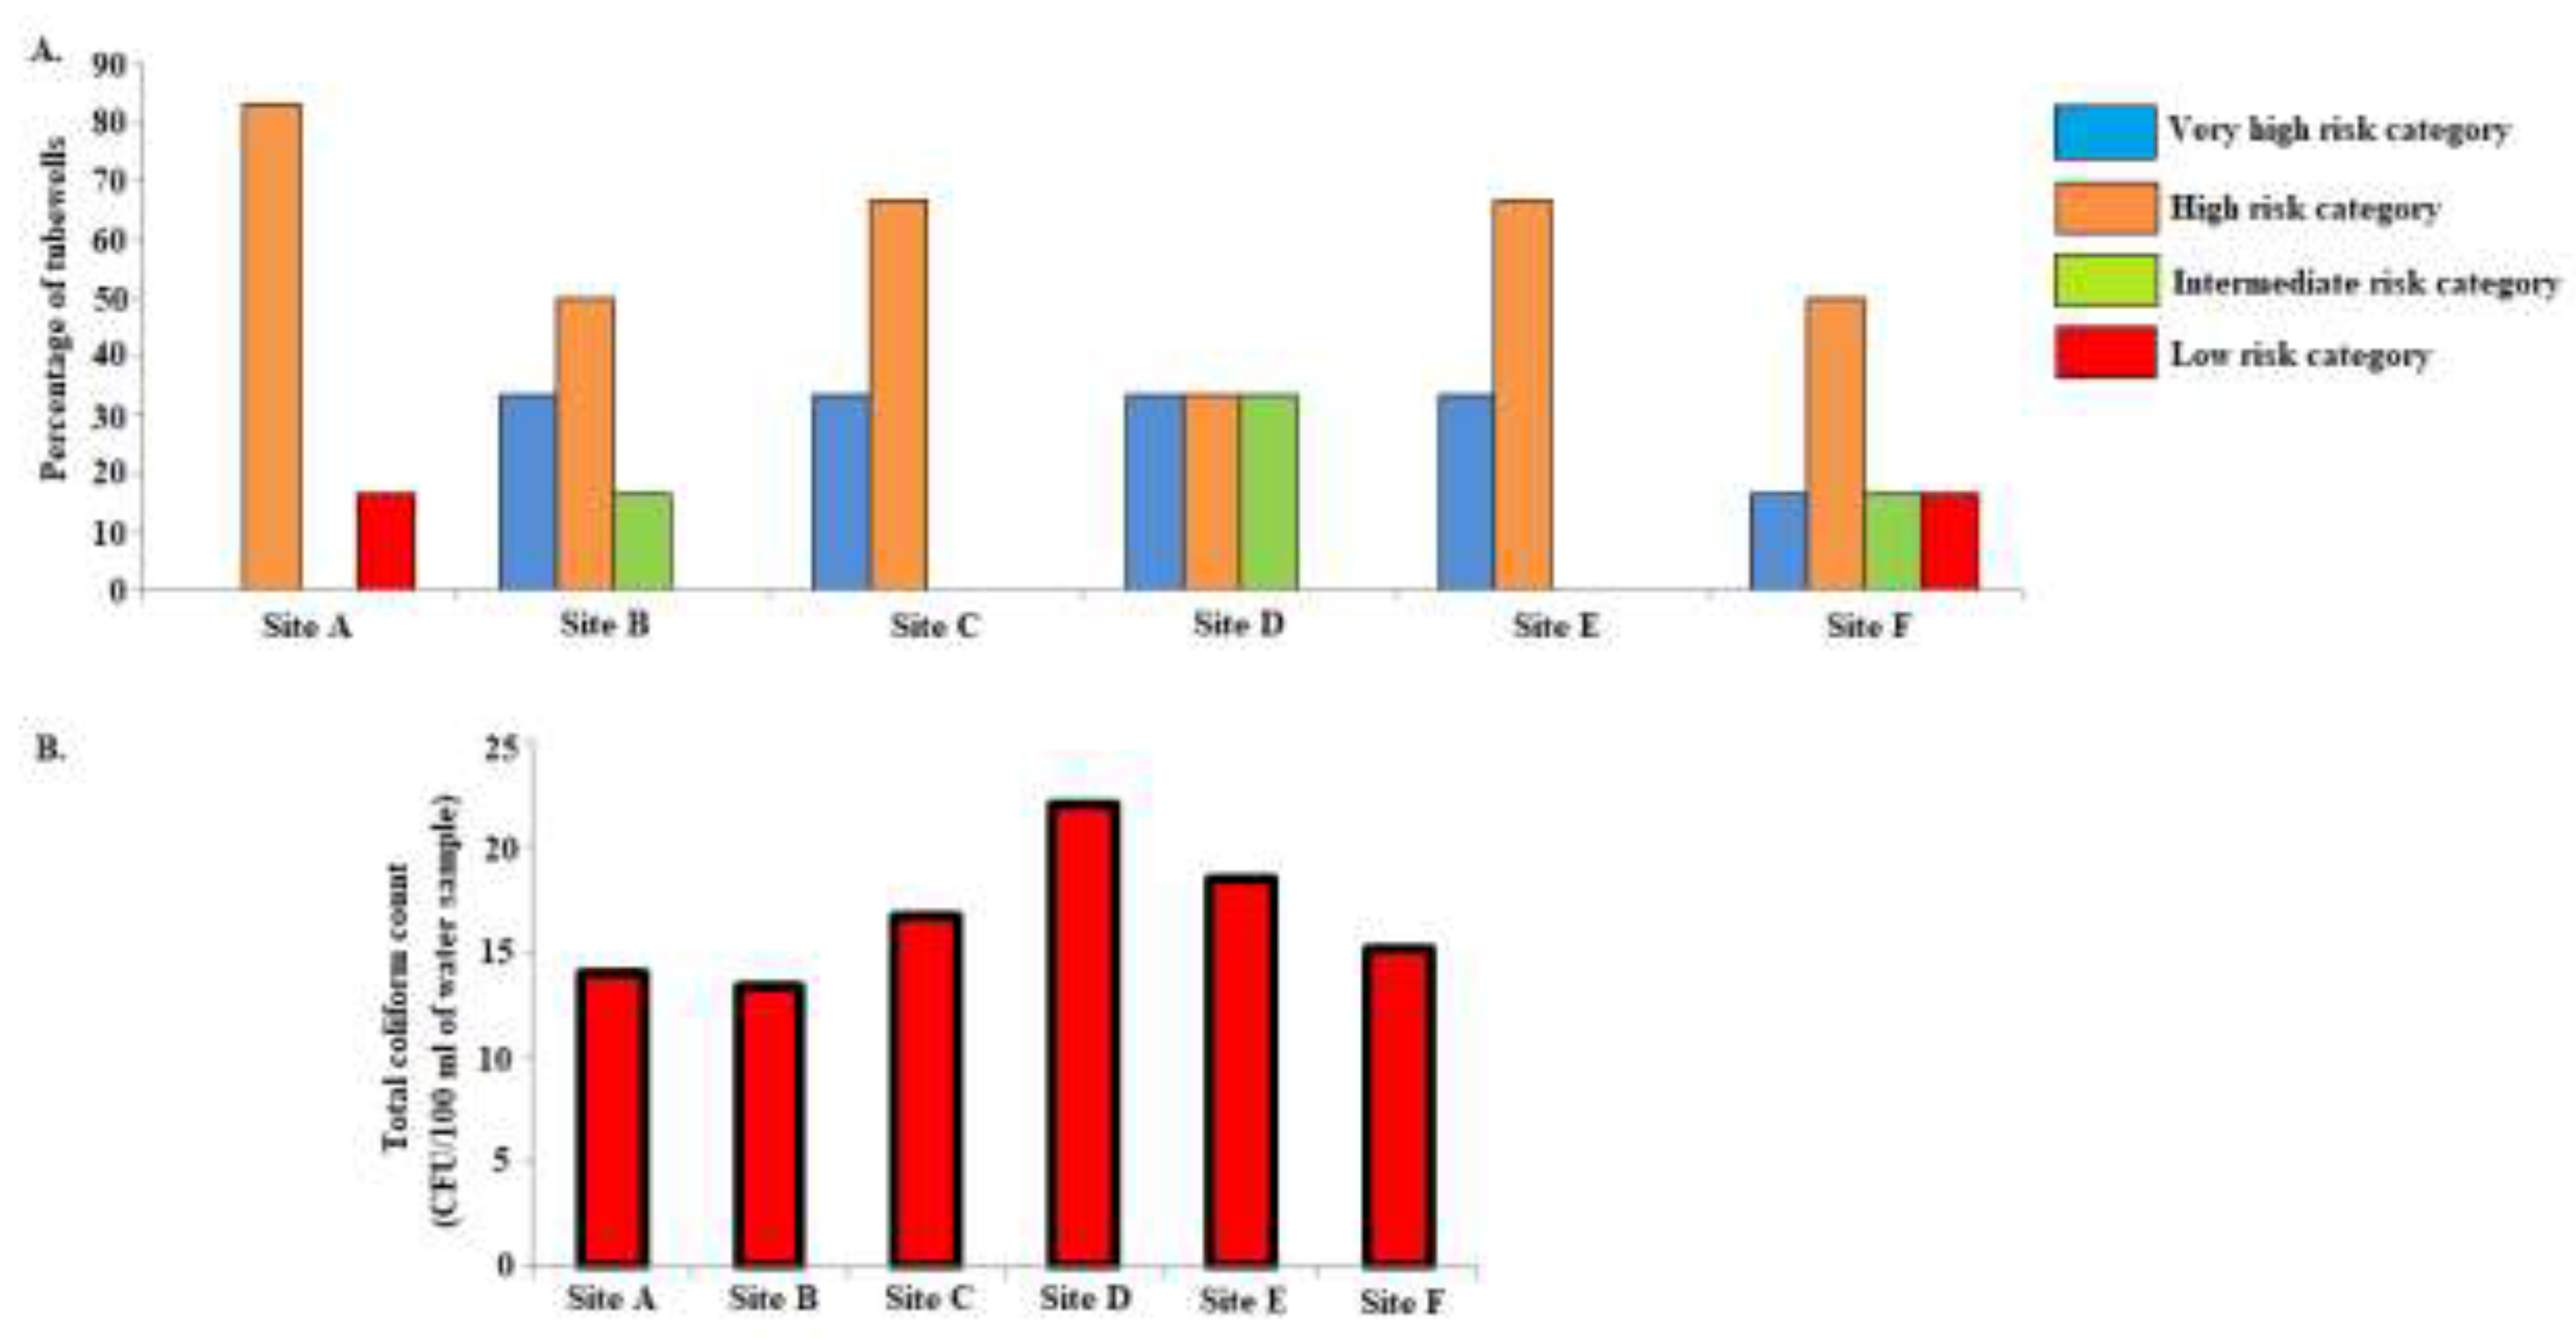
Figure 8.
As heterogeneity showing correlation with microbial heterogeneity in monitored wells of six sites.
Figure 8.
As heterogeneity showing correlation with microbial heterogeneity in monitored wells of six sites.
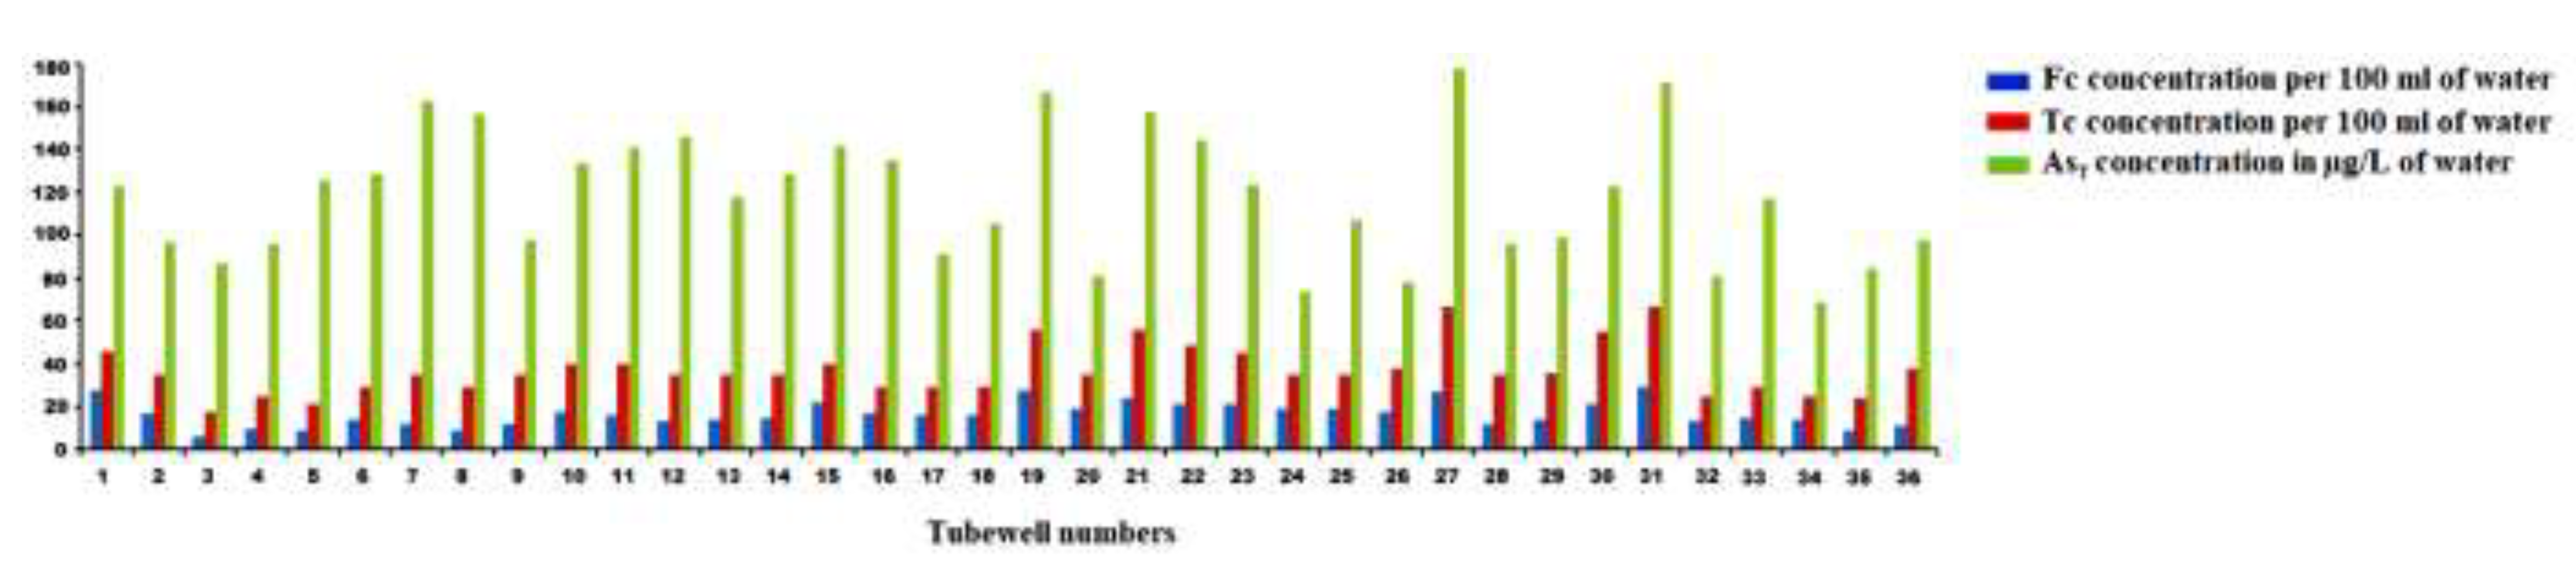

Table 1.
Physical parameters of the groundwater samples.
| Physical Parameters | Max | Min | Mean |
|---|---|---|---|
| Temperature (°C) | 31.2 | 23.4 | 27.3 |
| pH | 8.31 | 7.04 | 7.43 |
| Conductivity (µScm−1) | 876 | 423 | 538.7 |
| Eh (mV) | 459 | -161 | 278 |
| DO (mgL−1) | 0.3 | BDL | BDL |
| TDS (mgL−1) | 561 | 271 | 345 |
Table 2.
Major element concentration of the groundwater samples.
| Chemical Parameters | Max | Min | Mean |
|---|---|---|---|
| HCO3− (mgL−1) | 388 | 83 | 222 |
| Ca+2 (mgL−1) | 341 | 186 | 274 |
| Mg+2 (mgL−1) | 192 | 56 | 98 |
| Cl− (mgL−1) | 147 | 1 | 21 |
| PO43− (mgL−1) | 3.24 | 0.96 | 2.26 |
| SO42− (mgL−1) | 16.8 | 3.53 | 8.96 |
| NO3 − (mgL−1) | 0.07 | --- | 0.04 |
| NH4+ (mgL−1) | 4.52 | 2.03 | 2.64 |
| DOC (mgL−1) | 3.96 | 0.57 | 2.35 |
| Na+ (mgL−1) | 31.4 | 11.5 | 24.3 |
| K+ (mgL−1) | 12.6 | 5.17 | 8.32 |
| FeT (mgL−1) | 8.94 | 4.78 | 5.87 |
| % Fe (II) | 98.5 | 69.6 | 93.6 |
| AsT (µgL−1) | 178 | 69 | 118.58 |
| % As (III) | 119 | 82.4 | 95.6 |
Table 3.
Total and faecal coliform counts in groundwater and surface water samples of the study area.
Table 3.
Total and faecal coliform counts in groundwater and surface water samples of the study area.
| Microbial parameters | Groundwater | Surface water (at 10−3 dilution) |
|---|---|---|
| Total coliform count (CFU/100 ml of the water sample) |
Range: 18 to 67 | Range: 229 to 684 |
| Mean: 37.08 ± 11.71 | Mean: 484.03 ± 98.95 | |
| Faecal coliform count (CFU/100 ml of the water sample) |
Range: 6 to 29 | Range: 88 to 378 |
| Mean: 16.61 ± 5.77 | Mean: 252.75 ± 78.37 |
Disclaimer/Publisher’s Note: The statements, opinions and data contained in all publications are solely those of the individual author(s) and contributor(s) and not of MDPI and/or the editor(s). MDPI and/or the editor(s) disclaim responsibility for any injury to people or property resulting from any ideas, methods, instructions or products referred to in the content. |
© 2023 by the authors. Licensee MDPI, Basel, Switzerland. This article is an open access article distributed under the terms and conditions of the Creative Commons Attribution (CC BY) license (http://creativecommons.org/licenses/by/4.0/).
Copyright: This open access article is published under a Creative Commons CC BY 4.0 license, which permit the free download, distribution, and reuse, provided that the author and preprint are cited in any reuse.


