Submitted:
27 June 2023
Posted:
28 June 2023
You are already at the latest version
Abstract
By shifting the focus from aggregate-level analysis to individual-level analysis, we believe that the DAD model can contribute to a more comprehensive understanding of driving behavior. Combing DAD with a conflict identification (CIM) model can potentially enhance the effectiveness of Advanced Driver Assistance Systems (ADAS) in terms of crash evasion capabilities. This paper is part of our research titled Automatic Safety Diagnosis in Connected Vehicle Environment, which received funding from the Southeastern Transportation Research, Innovation, Development, and Education Center.
Keywords:
driving status
; anomaly
; outlier detection
; BSM
; crash
; CV
; cloud
1. Introduction
A crash is the result of a chain of malfunctions of the driving components. Among all the crash causation factors, misbehavior of the driver presented most frequently, as more than 90% of all the crashes (Dingus, et al., 2016). From the geniture of the crash, psychological precursors of abnormal status already existed before the crash scene (Reason, 1990). Therefor,it is possible to identify abnormal driving status before the crash scene. Anomaly detection (AD) is a data mining technology to identify the events that deviate from the majority and do not conform to a pre-defined normal behavior (Chandola, Banerjee, & Kumar, 2009). Driving anomaly detection (DAD) is the operation to identify driving anomaly (DA), and the methods for DAD can be classified by how to define DAs.
Although the definition of DA is not yet legitimized, there were three major approaches: the common sense, the statistics of the majority drivers and the individual driving pattern. From common sense DA can be defined the status and behavior that would likely cause crashes, such as aggressiveness, drowsiness, and impaired driving (driving under influence and driving with distraction) (Miyaji, Danno, & Oguri, 2008). Most of the drivers normally comply with the traffic control rules, therefore if complying with the majority the individual driving maneuver was considered normal. Hence DA can be defined as deviating from the statistical majority. A crash was a rare event for a driver, which means a driver can drive for years without a crash. Every driver had one’s own driving pattern, such as the way of hitting the gas and brake pedals, the way of wheel steering, and the distance they kept when following a vehicle. Driving was a complicated behavior controlled by both consciousness and subconsciousness, each driver had one’s own familiar way to drive safely, in this regard, not complying with one’s own driving pattern could also be considered a DA (Igarashi, et al., 2004) (Fancher, 1998).
From the first definition of DA, DAD was conducted through monitoring the driver’s physical body, such as exhalation using in-vehicle alcohol sensors, facial and body movements using cameras and images processing technology. These methods were straightforward but had many drawbacks, such as high cost of devices, technical limitations, and the privacy issue (Jafari & others, 2017). From the second definition of DA, many DADs used the social-economic (SE) data, such as age, gender, and income level etc. SE factors were assumed to have impacts on driving behavior psychologically (Boyle & Lampkin, 2007) and were found statistically correlated with the occurrence of crashes. The SE methods were widely utilized by the automobile manufacturers and insurance companies to identify risky drivers because the measurements were easily and economically available (Ayuso, Guillen, & Nielsen, 2019). Also, from the second definition of DA the trajectory data, the footprints of driving maneuvers, were utilized. For example, the highway patrol policemen observed the trajectories of the vehicles to catch traffic violations. “Aggressive driving” is a term used by the National Highway Traffic Safety Administration to classify “driving actions that markedly exceed the norms of safe driving behavior”. However, how to define the “norms” theoretically was declared challenging to reach consensus (Richard, Magee, Bacon-Abdelmoteleb, Brown, & others, 2018). For one reason was the individual driving pattern differ significantly, the norm that fitted a slow driver might not fit an acute driver. Nonetheless, in the non-administrative safety research, driving aggressive was replaced by the term of “driving volatility”, a more objective and measurable term to describe the instantaneous driving decisions (Lajunen, Karola, & Summala, 1997).
Embedded in the trajectories, speed, acceleration (Lajunen, Karola, & Summala, 1997), jerk (Ericsson, 2000) were studied and selected as key performance indicators (KPIs) to measure driving volatility. Directly using speed as a KPI for DAD was considered naïve because speed was contextual to speed limits (Ellison & Greaves, 2010). A simple solution was to use higher maximum speeds, which were associated with drivers who had more accident records (Lajunen, Karola, & Summala, 1997). Acceleration which was also found associated with risky drivers. The cut-off values for abnormal acceleration were choose as 1.47 m/s2 for aggressive acceleration and 2.28 m/s2 for extremely aggressive acceleration (Kim & Choi, 2013); and (De Vlieger, De Keukeleere, & Kretzschmar, 2000) set the range of 0.85 to 1.10 m/s2 as aggressive acceleration. No consensus had been reached because the thresholds on normal accelerations were contextual sensitive (Wang, Khattak, Liu, Masghati-Amoli, & Son, 2015). To include both speed and accelerations to classify drivers driving behavior, the changes of acceleration with respect to the speed (Langari & Won, 2005) and with respect to the time (Murphey, Milton, & Kiliaris, 2009) were studied. Accelerations were found varied with speeds and on different directions accelerations could not change together. A multivariate KPIs for longitudinal and lateral accelerations of various speed bins were introduced (Liu & Khattak, Delivering improved alerts, warnings, and control assistance using basic safety messages transmitted between connected vehicles, 2016). The rule-based method had the advantages of simplicity and efficiency (Martinez, Heucke, Wang, Gao, & Cao, 2017) while its disadvantage was it cannot address the different driving patterns of individuals. Thus, a DAD on the individual level from the third definition of DA was impending.
The DAD on the individual level was expected to be more accurate than those on the aggregate level. If a swift driver were forced to driving slowly, the driver might be overrelax and pay less attention on driving than necessary for driving safely. A driver was more skillful or safer when using the driving pattern of her/his own. The aggregate level used the average of all and might even out the individual characters. The advantage of the individual over the aggregate also lied in that it could be tailored and fine turned to fit a particular driver. The safety measures at individual level can reveal more clearly the criticalness of a safety situation for a specific driver.
Although with prominent advantages, the DAD on the individual-level was not found in literature. One reason might be it required massive computation power, which was not available. More probably, driving behavior was considered formidably complex. Diving was a serial of activities directed by spontaneous decisions from the human brain, reacting to a series of instantaneous changes of surrounding circumstances, such as adjacent vehicles, roadway, geometric and weather conditions (Wang, Khattak, Liu, Masghati-Amoli, & Son, 2015). Driving required four pairs of brain lobes — occipital, temporal, parietal, and frontal to active and combine both conscious and unconscious brain activities (Halim & Rehan, 2020) . A complete study of DAD would be multidisciplinary involving not only transportation, computer science, but also neurology and the cognitive science (Lees, 2010). However, if jumping directly to the consequences, the anomaly of the factors would all derive abnormal trajectory. Therefore, examine the vehicle trajectory might be a shortcut before a complete study launching. This DAD would be a tweaking from highway patrol policemen eyeballing the vehicle trajectories to catch traffic violations to the in-vehicle-computer running computation molders to catch driving anomalies.
In essence, a DAD was a model for anomaly detection or outlier detection (OD). In data science, outliers were the data points that deviate outstandingly from the majority. For a machine learning (ML) program, OD was an initial step of data cleaning, however, OD itself developed ML algorithms. OD was typically unsupervised ML because the data were often in lack of labels as the outliers were usually rare (Boukerche, 2020). This non-label nature posted difficulty in defining statistical and mathematical measurement for deviation. It triggered significant research and numerous OD algorithms of were developed in various programming languages. The basic categories of unsurprised OD algorithms included Angle-Based Outlier Detection (ABOD) (Kriegel, et al., 2008), Cluster-based Local Outlier Factor (CBLOF) (Duan, et al., 2009), Histogram-base Outlier Detection (HBOS) (Putrada & Abdurohman, 2021), Isolation Forest (Xu, et al., 2017), and K Nearest Neighbors (KNN) (Larose & Larose, 2014). The varied OD algorithm had different way of measuring the deviations while different datasets had various dimensions and features, and the users had different interests. Therefore, it was challenging to determine a universally best OD ML algorithm and hard to reach consensus. Thus, the selecting of algorithm became important for OD processing. For the users’ convenience, packages were developed to pack the OD algorithms together. For example, the PyOD package summarized more than forty OD algorithms and has been utilized in many academic and industrial with over 10 million downloads (Zhao, et al., 2019). The domains of DAD included but not limited to finance for credit card fraud detection, healthcare for malignant tumors detection (Wilson, Johnston, Macleod, & Barker, 1934), astronomy for spacecraft damage detection, cybersecurity for intrusion detection (Chandola, Banerjee, & Kumar, 2009), and connected vehicle (CV) environment for signal intrusion detection (Richard, Magee, Bacon-Abdelmoteleb, Brown, & others, 2018).
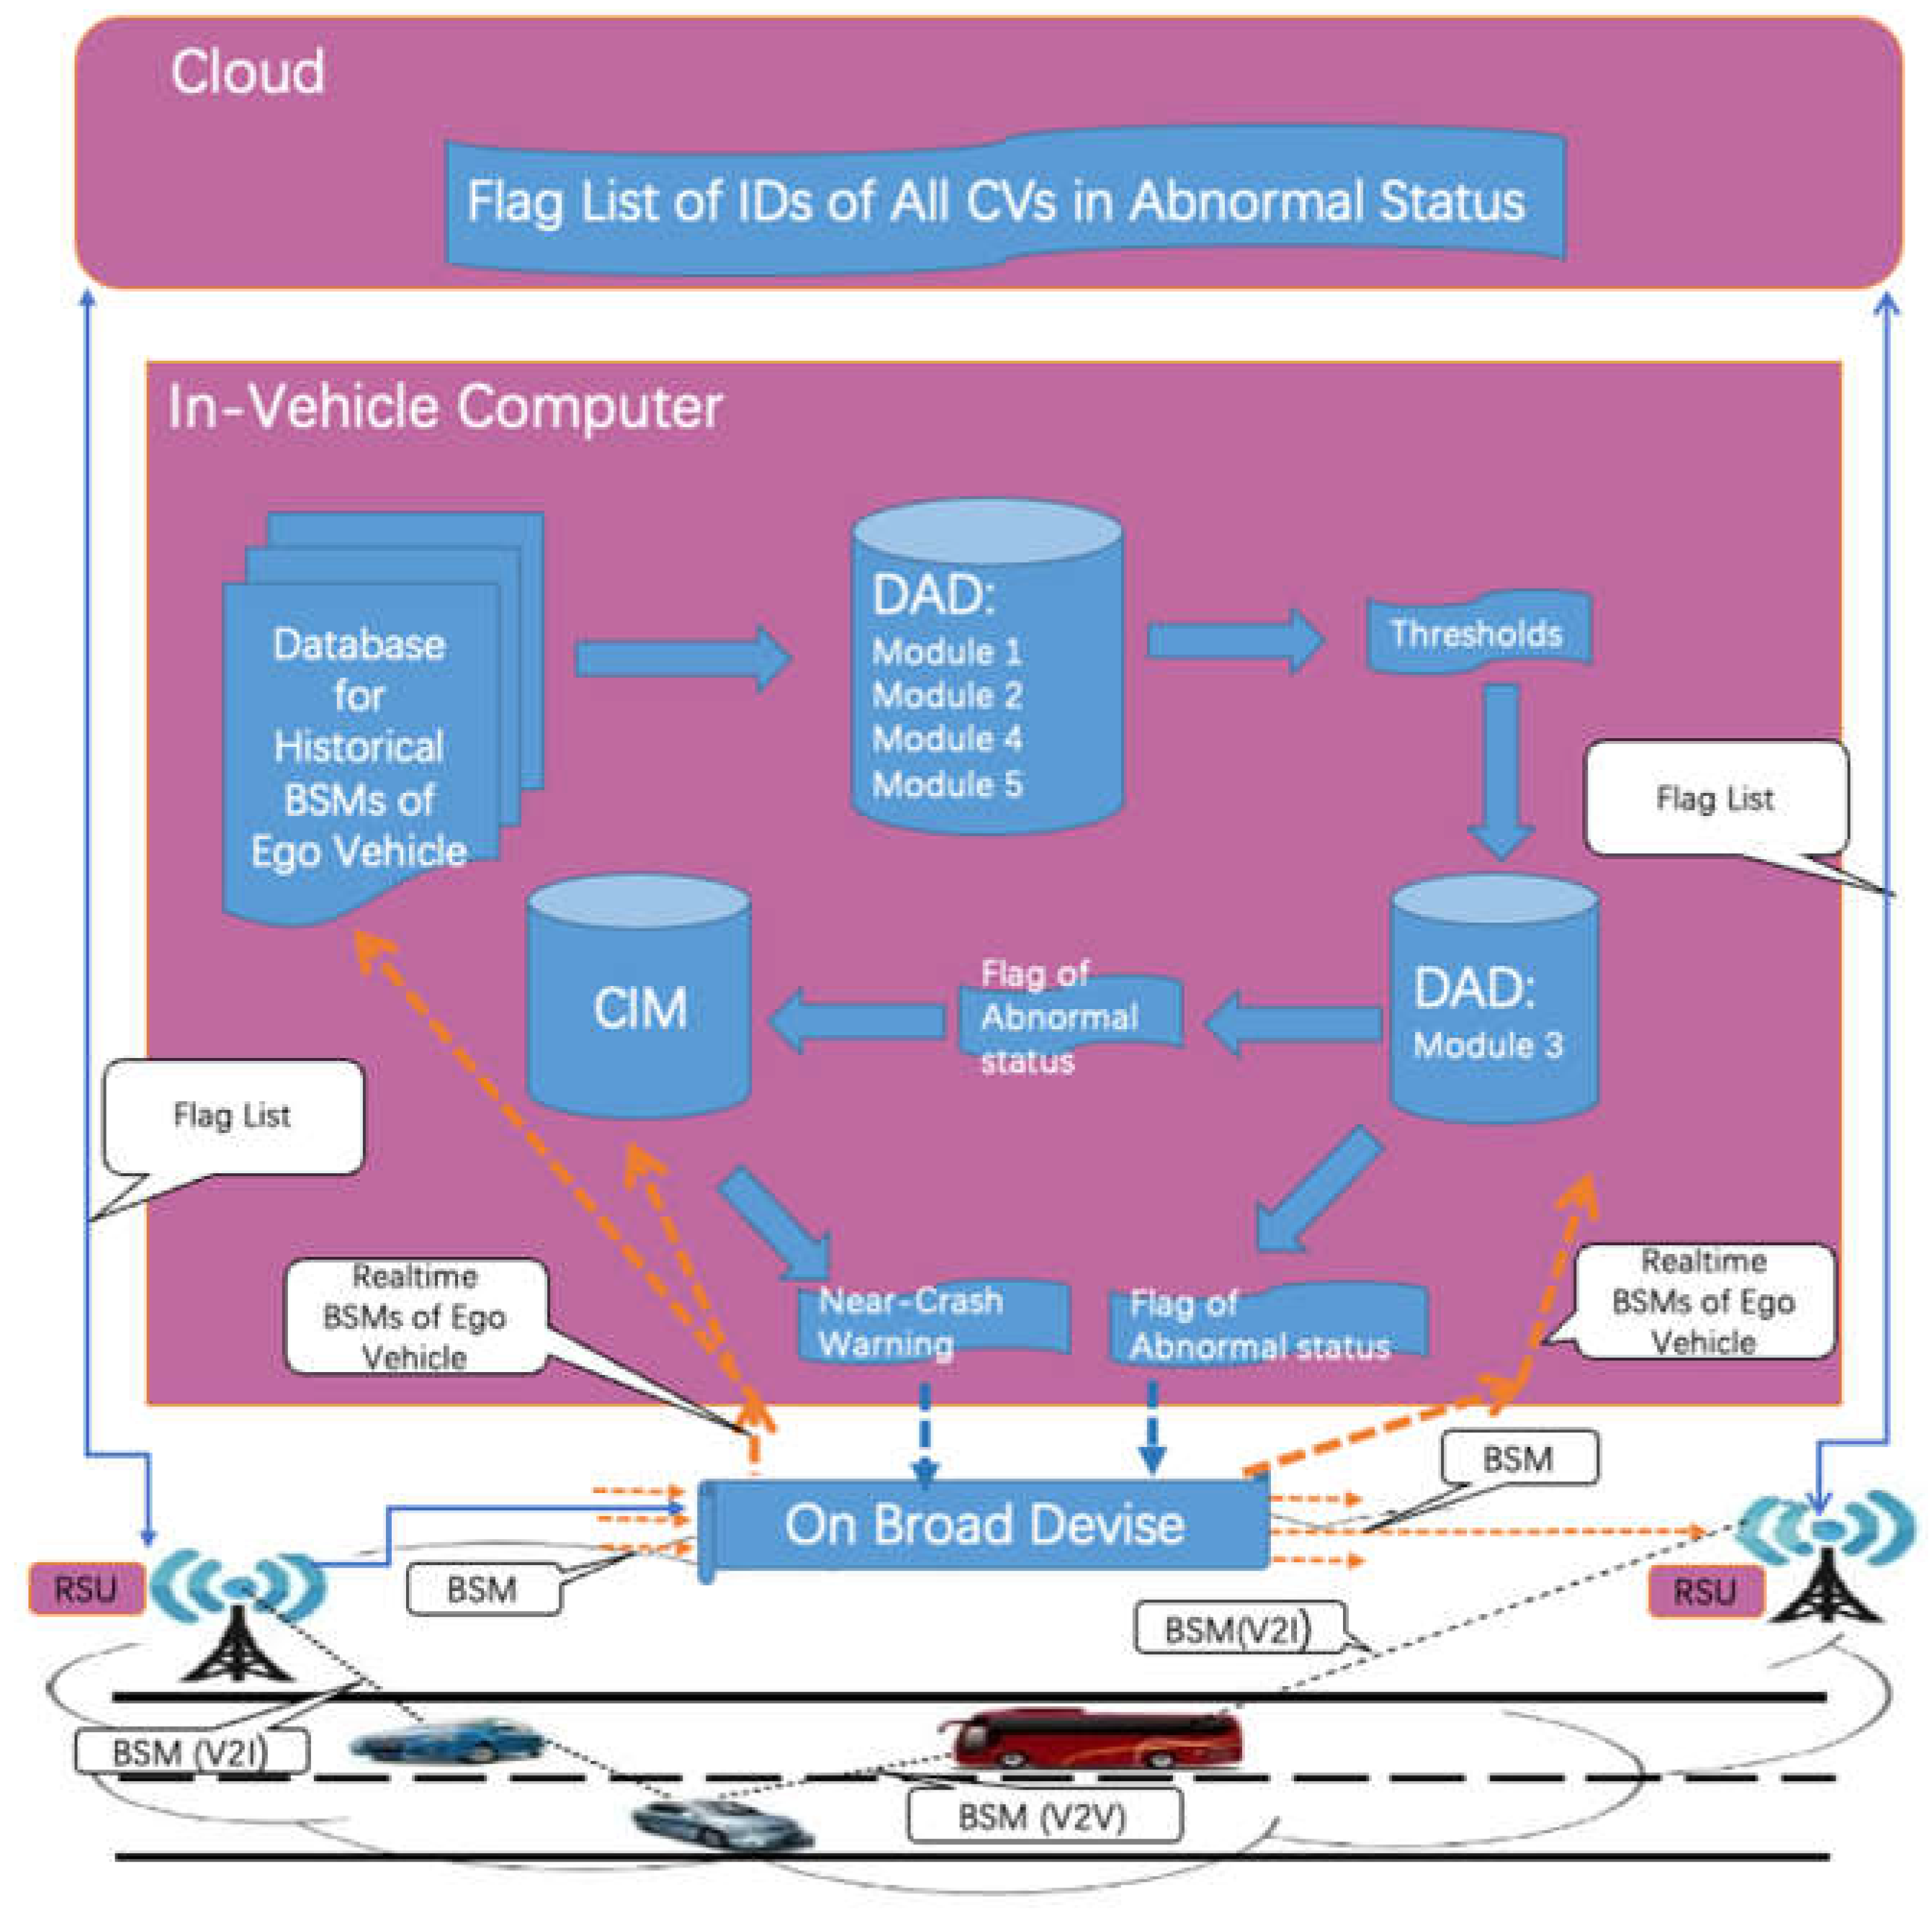
Our research, Automatic Safety Diagnosis in the CV Environment, was initiated to develop a near crash waring system on the individual level using basic safety messages (BSMs) only. Diverse as the existing OD algorithms, none of them were found fit our need. The closest research was using vehicle trajectories to identify abnormal driving behavior at the aggregated level (Liu & Khattak, Delivering improved alerts, warnings, and control assistance using basic safety messages transmitted between connected vehicles, 2016) (Liu, Wang, & Khattak, Generating real-time driving volatility information, 2014), but no application of DAD using BSMs on individual level was found. We define a near crash as a traffic situation that fulfill two conditions: (a) a conflict is identified, and (b) at least one of the drivers involved in the conflict exhibits abnormal driving status. As shown in the conceptual architecture of our research, the cloud maintains a flag list of all abnormal CVs in its region kept broadcasting the list to all CVs. In each CV, the In-vehicle computer (IVC) collects the BSMs of its own. The DAD uses the historical BSMs to generates the thresholds differentiating the normal and abnormal driving status, then with the real-time BSMs the DAD determines if the status of the ego vehicle is abnormal. If an anomaly event detected, a flag will be sent to the cloud. When a CV is running on the road, it also keeps receiving BSMs from the nearby CVs. The CV will run the conflict identification model (CIM) (Wu, Zhang, Whalin, & Tu, 2022) to check the conflict if any of the CV pair is on the flag list. This paper summarizes our DAD model, and the rest of the paper is organized as follows: Section 2 introduces the methods of the DAD; Section 3 presents the model evaluation; and Section 4 gives the results and discussions, and Section 5 gives the conclusions.
Figure 1.
The Conceptual Architecture of the Near Crash Warning System.
2. Materials and Methods
2.1. Data Description
The BSM data from the Safety Pilot Model Deployment (SPMD) were selected as working data and the BSMs from the second Strategic Highway Research Program (SHRP2) of the Naturalist Driving Study (NDS) were selected as model evaluation data.
2.1.1. BSM Data
BSM was a basic application of the CV program known as the “Here I Am” data message. BSMs were generated in the on-board-devices (OBDs) that were specifically designed for CVs. In the air, the BSMs were broadcasted by low latency communication devices such as at the dedicated bound of 5.9 GHz spectrum at the frequency of 10 Hz (Henclewood, Abramovich, & Yelchuru, 2014) or 5G network. BSMs could be received by the nearby CVs and roadside units (RSU). The effective transmitting distances of BSMs were ranged from 300 meters to 1000 meters. The format of a BSM was defined by the Society of Automotive Engineers J2735: The Dedicated Short-Range Communications (DSRC) Message Set Dictionary. A typical BSM was composed of the vehicle ID, epoch time, GPS location, speed, acceleration, yaw rate, and the supplementary information. BSMs were considered disposable and not reused.
The SPMD project was a part of the US DOT’s CV program. The SPMD data are available on the Intelligent Transportation System (ITS) Data Hub (its.dot.gov/data/). The working data used in this project are the field BSM data from a SPMD test conducted in Ann Arbor, Michigan, in October 2012. A Comma Separated Values (CSV) BsmP1 file of a size of 67GB stores all the BSMs generated by the 1527 test vehicles in the test. The original downloaded data file had 19 attributes and over 500 million records. During our data pre-processing, the irrelevant attributes were filtered out and the resulted data file has 11 attributes including DevID for the vehicle ID, EpochT for timestamp and attributes for latitude, longitude, accelerations, heading and yaw-rate. The descriptions of the attributes are shown in Table 1.
2.1.2. SHRP2 Data
The Driving Study (NDS) for the second Strategic Highway Research Program (SHRP2) is a research program to address the impact of driver performance and behavior in traffic safety. The Virginia Tech Transportation Institute (VTTI) serves as the technical coordination and study design contractor for the NDS and maintains the InSight Data Access Website (Janai, Güney, Behl, & Geiger, 2017).
In the InSight Data Access Website, the Event Detail Table section there lists 41,530 records of crashes and near crashes. Each record was posted online with detailed information of the event including a video of up to 25 seconds before the event, event detail data and the final narrative. We selected 46 crash events and retrieved 12500 trajectories of historical and crash SHRP2 trips. As crashes were rare invent and the instrumented vehicles were limited, no crash that between instrumented vehicles recorded. All the crashes incurred between an instrumented vehicle and a stationary object, such as a tree, fence, or roadway curb. To the SHRP2 trajectory data, restrictions were applied to protect potentially identifying information. For example, the GPS coordinates for crash trips, the exact time, and any information can trace the driver’s identification were not released. The attributes of the time series data were similar to the BSM data as shown in Table 1.
As previous research showed that, there were relationships between the accelerations and the speed, we examined the raw data from selected test CVs. As shown in Figure 2, the Acceleration_ longitudinal to Speed and Acceleration_ lateral to Speed exhibited a distribution somewhat gathering to a central axil, which was in line with the previous studies (Liu & Khattak, Delivering improved alerts, warnings, and control assistance using basic safety messages transmitted between connected vehicles, 2016) (Liu, Wang, & Khattak, Generating real-time driving volatility information, 2014).
2.2. Methods
The DAD is designed to take recent historical BSM data of a CV to learn the thresholds, and with the thresholds to identify the anomalies using the real-time BSM data. The DAD process has five modules: Module 1. Data Preprocessing and Selecting KPIs; Module 2: Learning What Is Normal; Module 3: Detecting Outliers; Module 4: Determine Abnormal Driving Event; Module 5: System Updating, as shown in Figure 3.
Module 1: Data Preprocessing and Selecting KPIs
The key to construct a DAD is the nature of the working data. By structure, BSMs are discontinuous time series (TS) data, which is a type of sequence data where data instances are linearly ordered but have lots of not available (NA) records. TS data typically consist of two components: contextual attributes (CA), which are used to determine the context for that instance, such as timestamps and coordinates; and behavior attributes (BA), such as speed and accelerations. BSMs are also spatial data because coordinates are included. Here if we treat timestamps as CA and coordinates as BA, then BSM has high cardinality; If alternatively, we treat coordinates as the CA and time as the BA, then BSM will also has high cardinality; If we treat both time and coordinates as CA, then the number of contexts will be almost infinite. To make the problem solvable, we propose to divide and conquered with multiple sub-problems: Time-related and Space-related. The Time-related information are used in DAD and the spatial attributes - the coordinates- to be used in CIM.
In the data visualization for the KPIs with respect to time, no identifiable periodicity was observed. In autocorrelation tests, no seasonality was identified either. As the KPIs of Acceleration-longitudinal, acceleration-lateral, jerk-longitudinal, jerk-lateral are found to co-exist with abnormal driving status (Lajunen, Karola, & Summala, 1997) (Ericsson, 2000) (Langari & Won, 2005) (Murphey, Milton, & Kiliaris, 2009), we used speed as a context variable instead of time. As the yaw rate describes the rate of change of the heading angle and is directly related to the lateral acceleration, we excluded heading and raw rate for KPI. Since the cut-off values of the thresholds for normal vs. abnormal are contextually sensitive, and no consensus thresholds have been reached (Wang, Khattak, Liu, Masghati-Amoli, & Son, 2015), we set up the thresholds as variables.
Furthermore, we divide the KPIs to be positive and negative groups, e.g., Acceleration-longitudinal_possitive and Acceleration-longitudinal_negative, because they represent different movements of the driver stepping on the gas or the brake and might have different patterns. Therefore, we have eight KPIs in total, as shown in Table 3.
Module 2: Learning What Is Normal
It would be convenient if we can utilize the existing OD algorithms. The typical unsupervised OD algorithms of ABOD, CBLOF, HBOS, IF and KNN were tested on our working data. We hoped these ODs would output the thresholds that can be applied in the succussing modules. The test results are shown in Table 2. OUTPUT OF OD ALGORITHMS.Table 2 and Figure 4. The OD ML algorithms output the number of outliers, were about 5 percent of the total instances. This was because the parameter of “outliers_fraction” was set up as 0.05 when we ran the tests. As the secession modules of our DAD need use the thresholds but no appropriate physical meaning of the threshold outputs could be costumed. Therefore, none of these ODs were found applicable to our DAD.
To develop appropriate thresholds that align with the physical meaning specific to our DAD, “what is normal” need to be defined first. As researched had found that the driving pattern vary with the speeds (Liu & Khattak, Delivering improved alerts, warnings, and control assistance using basic safety messages transmitted between connected vehicles, 2016) (Liu, Wang, & Khattak, Generating real-time driving volatility information, 2014). We set up the speed bins with a length of 1mph and grouped the instances by speed bins. The mean and standard deviations of each KPI are calculated for each speed bin. Thus, the panel of what is normal for an individual vehicle, which is the information needs to be abstracted from historical BSMs, as shown in Table 3.
Module 3: Detecting Outliers
Outliers or anomalies are data points that do not meet the condition of what is normal in Module 2. We assume the BSMs are normally distributed, the data located in the 95% probability regions are considered normal and the other 5% as outliers. From statistics, the cut-off value of 95% is two times of standard deviation away from the mean. Question might arise on our assumption: are the KPIs normally distributed? If a data set is normally distributed, the residual needs to be random. The answer is no and but approximately yes. As shown in the acceleration_longitudinal of ID 6010 is not strictly normally distributed but close enough. Other scholars found it can be simulated with Negative Binomial distribution (Liu & Khattak, Delivering improved alerts, warnings, and control assistance using basic safety messages transmitted between connected vehicles, 2016), but we decide to take an approximation of normal distribution because we are solving an engineering problem, all we need to know is whether the vehicle has the potential to cause a crash, and we can use engineering alternatives to replace difficult mathematical problems. This philosophy is similar to our leaving the coordinates (environmental) impact from BSM to CIM.
Module 4: Determine Abnormal Driving Event
In our tests of Module 3, many outliers were detected, from a few to thousands depending on the driver and trip duration of a trip file. Too frequent alarms might annoy the driver. A single outlier might not mean abnormal driving status, but multiple outliers over a short period of time do signal anomaly. Therefore, we added Module 4 in our DAD model to cut down the occurrences of alarms. As no labeled dataset available, we used sensitivity analysis (SA) to calibrate the model parameters. SA is a model developing tool that is widely used to determine the proper value for a parameter through observing the dynamic model response to different settings of the parameter. The following rules were set up for the SA: an abnormal event (can triggering an alarm with CIM) will be warranted if any of the following conditions is met:
- 1)
- The number of KPIs being identified as outliers in the same second is larger or equal to .
- 2)
- Within more than one KPI are identified as an outlier in a row.
Where:
As we are interested in how the model would respond to how to define the in liners and how many days of historical BSMs need to be kept, the and were also included as a testing parameter, where:
In our model, there are 8 KPIs: acceleration-longitudinal, acceleration-lateral, jerk-longitudinal, jerk-lateral, each of which has positive and negative items. Sensitivity 1 of Figure 5 shows the system responding to a step increase in . With set to be 1 or 2, more than 15% of the instances of the trip seconds will be identified as alarms, which will result in too many alarms. Meanwhile the detailed recorded data show that in many cases, the acceleration and jerk at the same direction were identified as outliers at the same time, which indicated that the pair are correlated to some extent. So, we eliminated values 1 and 2. When is more than 3, the curve becomes flat, which means the number of abnormal cases identified are very close. Therefore was determined to be 3. Sensitivity 2 of Figure 5 shows the system responding to a step increase in . The value of 10 seconds is selected for because it is where the curve changes the slope at that point and the value of the ratio is close to 5%. Sensitivity 3 of Figure 5 shows the system responding to a step increase in . The value of 2 and 2.5 did not result in significant change in system respond. And from Sensitivity 4 of Figure 5, no alarms (Zeros %) are generated for the testing file after the value of 2.25, which violates the purpose of the model, which is to detect abnormal for all the potential crashes. We decided to use 2 for because this is the widely used value and 2.25 did not make significant difference. Sensitivity 5 of Figure 5 shows the system responding to a step increase in . We assume that the cloud uses the batch mode to calculate the thresholds. The curve changes values within a small range, which means that system is not highly sensitive to the change of . We selected 30 days because it identifies the most anomaly events. In practice, this parameter is better to be determined by the number of vehicles covered by the cloud and the computational capacity of the server. Furthermore, the auto-tuning is expected to replace the batch mode, then this parameter will no longer exist. Table 4. summaries the results of the SA.
Module 5: System Updating
The system will update all the thresholds in batch mode periodically. After the BSMs are collected for the next month, the procedures described before will be repeated and the thresholds will be updated. This set up is the easiest way in practice but not the smartest way.
3. Model Evaluation
The assumption of our DAD was: when the CV was in abnormal status, then trajectory of the CV would exhibit more outliers than when the CV was in normal status. We set up the outlier factor as 95%, which means in normal driving status the outlier would b be up to 5%. We took the threshold panel of what is normal from the historical BSMs of a CV and applied to the real-time BSMs of the same CV. If the DAD is valid, then when the CV is in abnormal driving status the outliers would be more than 5%. Hence, we set up the test as follows: select the 42 accident trip files from the SHRP2 Data and tested with the thresholds calculated from the individual’s historical trajectories, if the number of anomaly cases detected is more than 5%, then the DAD model is valid.
The results of the test show that all the 42 drivers have been found to exhibit more than 5% abnormal in the accident trips, which proves that the DAD model is valid, as shown in Figure 7.
4. Discussion
Our DAD came after we performed standard approaches of TS analysis, in which no periodicity was identified. It is understandable because driving behavior was complicated, and the majority of TS data did not have periodicity any way. We also tried the exiting OD algorithms but did not find any applicable. We developed the DAD from scratch based on the founding of previous research. In this DAD two issues might be controversial: the first is our bold attempt to define near-crash in a new way: a near-crash is identified when at least one of the vehicles is in abnormal driving status and a conflict is present. Another issue was we assumed the KPIs were normally distributed, while strictly speaking they are not. We think it is an acceptable relaxation for all we need to know is if the KPI value is in abnormal range. Once an anomaly identified we catch it, so we do not need to predict it with sophisticated mathematic models.
Another purpose of the study was to find out a way for BSM reuse. BSMs were considered disposable. When CVs are widely deployed, the amount of BSMs would be overwhelming and it would be impractical to store all of them although they contain valuable information. But extract and store valuable information from the BSMs are possible. We propose to use the threshold panel of what is normal for an individual CV that were resulted in Module 2 of the DAD.
There are several limitations. First, human behavior is complicated, and the attempt of determining the behavior status based on the footprint of a vehicle can be challenge. Second, the KPIs might be correlated, we did not run the statistical testing to exclude those not statistically related KPIs. This is again because of the complication of human behavior, and we do not have the luxury of plenty of data nor the understanding of human mental processing. And finally, we did not run the auto-tuning due to lack of data and the changing of driving habits might need time longer than one month.
5. Conclusions
In this paper, we present the experience of developing a DAD model that determines if the driver is in abnormal driving status on individual level using solely BSM data. It was a tweaking from highway patrol policemen eyeballing the vehicle trajectories to catch traffic violations to the in-vehicle-computer running computation molders to catch driving anomalies. For an extremely complicated case like human driving behavior, examine the footprint can be an effective shortcut. The contribution of this paper is a showcase of processing complicated data like BSMs, instead of formulating complex models for all the attributes of the data, we can split the data attributes to Time-related and Space-related and solved them on different stages using different models: DAD and CIM. Our research is expected to have systematic impact on reducing false traffic safety alarms and consequently will reduce crash occurrence and its impacts on traffic congestion. A comprehensive DAD system might cost a team of data engineers years to complete. With this paper we try to call for attention of the scholars and transportation practitioners on DAD through BSMs of the CV environment.
References
- Ayuso, M., Guillen, M., & Nielsen, J. P. (2019). Improving automobile insurance ratemaking using telematics: incorporating mileage and driver behaviour data. Transportation, 46, 735–752. [CrossRef]
- Boyle, J. M., & Lampkin, C. (2007). Motor vehicle occupant safety survey—volume 2—seat belt report (report no. DOT-HS-810-975). Washington, DC: US Department of Transportation.
- Chandola, V., Banerjee, A., & Kumar, V. (2009). Anomaly detection: A survey. ACM computing surveys (CSUR), 41, 1–58. [CrossRef]
- De Vlieger, I., De Keukeleere, D., & Kretzschmar, J. G. (2000). Environmental effects of driving behaviour and congestion related to passenger cars. Atmospheric Environment, 34, 4649–4655. [CrossRef]
- Dingus, T. A., Guo, F., Lee, S., Antin, J. F., Perez, M., Buchanan-King, M., & Hankey, J. (2016). Driver crash risk factors and prevalence evaluation using naturalistic driving data. Proceedings of the National Academy of Sciences, 113, 2636–2641. [CrossRef]
- Ellison, A. B., & Greaves, S. (2010). Driver characteristics and speeding behaviour. Proceedings of the 33rd Australasian Transport Research Forum (ATRF’10).
- Ericsson, E. (2000). Variability in urban driving patterns. Transportation Research Part D: Transport and Environment, 5, 337–354. [CrossRef]
- Fancher, P. (1998). Intelligent cruise control field operational test. Final report. Volume II: appendices A-F. Tech. rep.
- Halim, Z., & Rehan, M. (2020). On identification of driving-induced stress using electroencephalogram signals: A framework based on wearable safety-critical scheme and machine learning}. Information Fusion, 53, 66--79. [CrossRef]
- Henclewood, D., Abramovich, M., & Yelchuru, B. (2014). Safety pilot model deployment–one day sample data environment data handbook. Research and Technology Innovation Administration. Research and Technology Innovation Administration, US Department of Transportation, McLean, VA.
- Igarashi, K., Miyajima, C., Itou, K., Takeda, K., Itakura, F., & Abut, H. (2004). Biometric identification using driving behavioral signals. 2004 IEEE international conference on multimedia and expo (ICME)(IEEE Cat. No. 04TH8763), 1, pp. 65–68.
- Jafari, M., & others. (2017). Traffic safety measures using multiple streams real time data. Tech. rep., Rutgers University. Center for Advanced Infrastructure & Transportation.
- Janai, J., Güney, F., Behl, A., & Geiger, A. (2017). Computer vision for autonomous vehicles: Problems, datasets and state of the art. Arxiv, arXiv–1704. [CrossRef]
- Kim, E., & Choi, E. (2013). Estimates of critical values of aggressive acceleration from a viewpoint of fuel consumption and emissions. 2013 Transportation Research Board Annual Meeting.
- Lajunen, T., Karola, J., & Summala, H. (1997). Speed and acceleration as measures of driving style in young male drivers. Perceptual and motor skills, 85, 3–16. [CrossRef]
- Langari, R., & Won, J.-S. (2005). Intelligent energy management agent for a parallel hybrid vehicle-part I: system architecture and design of the driving situation identification process. IEEE Transactions on Vehicular Technology, 54, 925-934. [CrossRef]
- Lees, M. N. (2010). Translating cognitive neuroscience to the driver’s operational environment: a neuroergonomic approach. The American journal of psychology, 123, No. 4(University of Illinois Press ), 391-411. [CrossRef]
- Liu, J., & Khattak, A. J. (2016). Delivering improved alerts, warnings, and control assistance using basic safety messages transmitted between connected vehicles. Transportation research part C: emerging technologies, 68, 83–100. [CrossRef]
- Liu, J., Wang, X., & Khattak, A. (2014). Generating real-time driving volatility information. 2014 World Congress on Intelligent Transport Systems.
- Martinez, C. M., Heucke, M., Wang, F.-Y., Gao, B., & Cao, D. (2017). Driving style recognition for intelligent vehicle control and advanced driver assistance: A survey. IEEE Transactions on Intelligent Transportation Systems, 19, 666–676. [CrossRef]
- Miyaji, M., Danno, M., & Oguri, K. (2008). Analysis of driver behavior based on traffic incidents for driver monitor systems. 2008 IEEE Intelligent Vehicles Symposium, (pp. 930–935). [CrossRef]
- Murphey, Y. L., Milton, R., & Kiliaris, L. (2009). Driver's style classification using jerk analysis. 2009 IEEE Workshop on Computational Intelligence in Vehicles and Vehicular Systems, (pp. 23–28).
- Reason, J. (1990). Human error. Cambridge university press.
- Richard, C. M., Magee, K., Bacon-Abdelmoteleb, P., Brown, J. L., & others. (2018). Countermeasures That Work: A Highway Safety Countermeasure Guide for State Highway Safety Offices, 2017. Tech. rep., United States. Department of Transportation. National Highway Traffic Safety.
- Wang, X., Khattak, A. J., Liu, J., Masghati-Amoli, G., & Son, S. (2015). What is the level of volatility in instantaneous driving decisions? Transportation Research Part C: Emerging Technologies, 58, 413–427.
- Wilson, F. N., Johnston, F. D., Macleod, A. G., & Barker, P. S. (1934). Electrocardiograms that represent the potential variations of a single electrode. American Heart Journal, 9, 447–458. [CrossRef]
- Wu, D., Zhang, L., Whalin, R., & Tu, S. (2022). Conflict Identification Using Speed Distance Profile on Basic Safety Messag-es. Procedings of International Conference on Transportation and Development 2022.
Figure 2.
The Scatter Plots of Accelerations to Speeds. (a) Acceleration_ longitudinal to Speed. (b) Acceleration_ lateral to Speed.
Figure 2.
The Scatter Plots of Accelerations to Speeds. (a) Acceleration_ longitudinal to Speed. (b) Acceleration_ lateral to Speed.
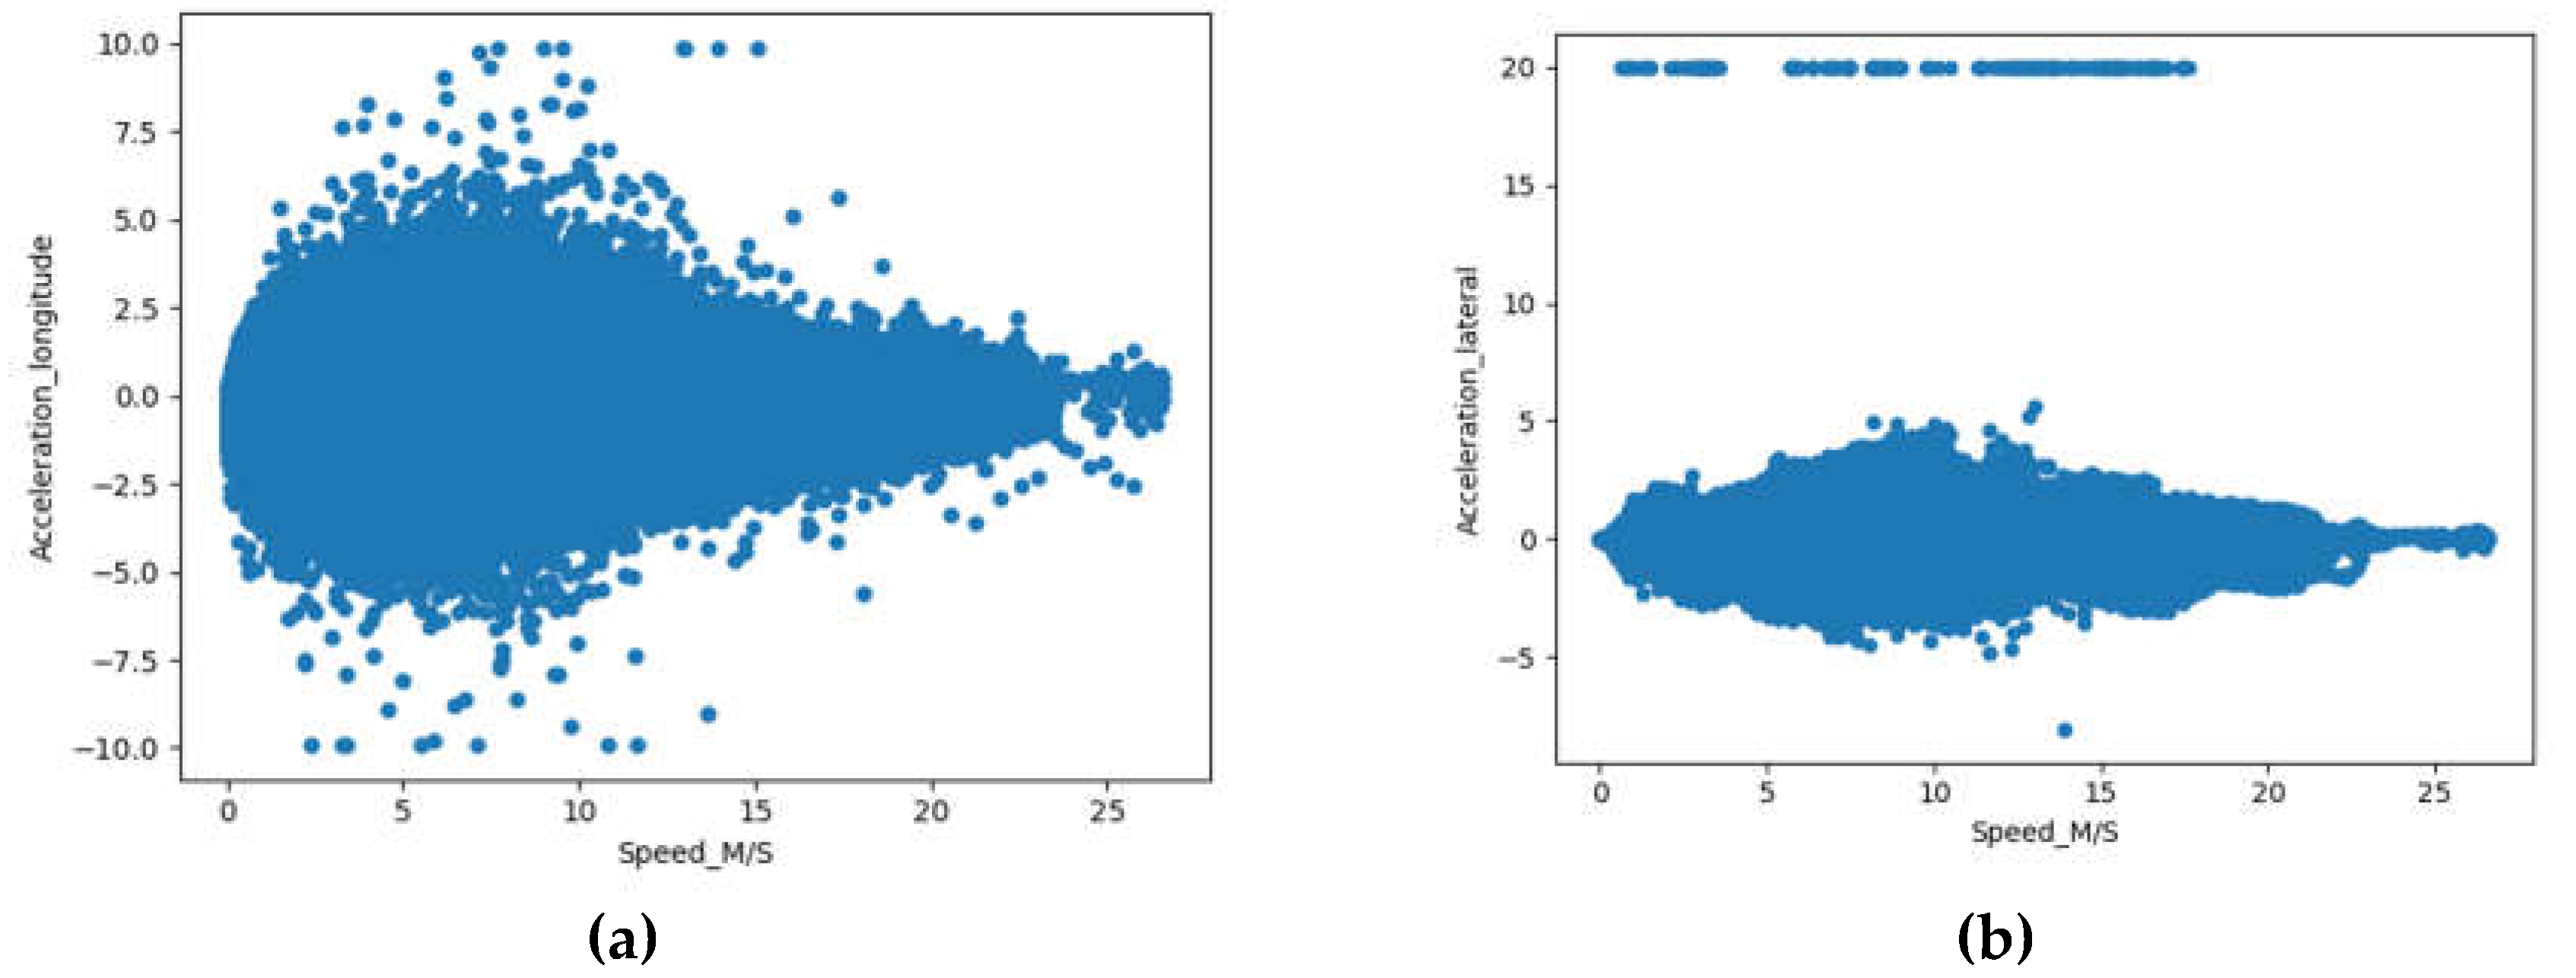
Figure 3.
The Flowchart of the DAD Model.
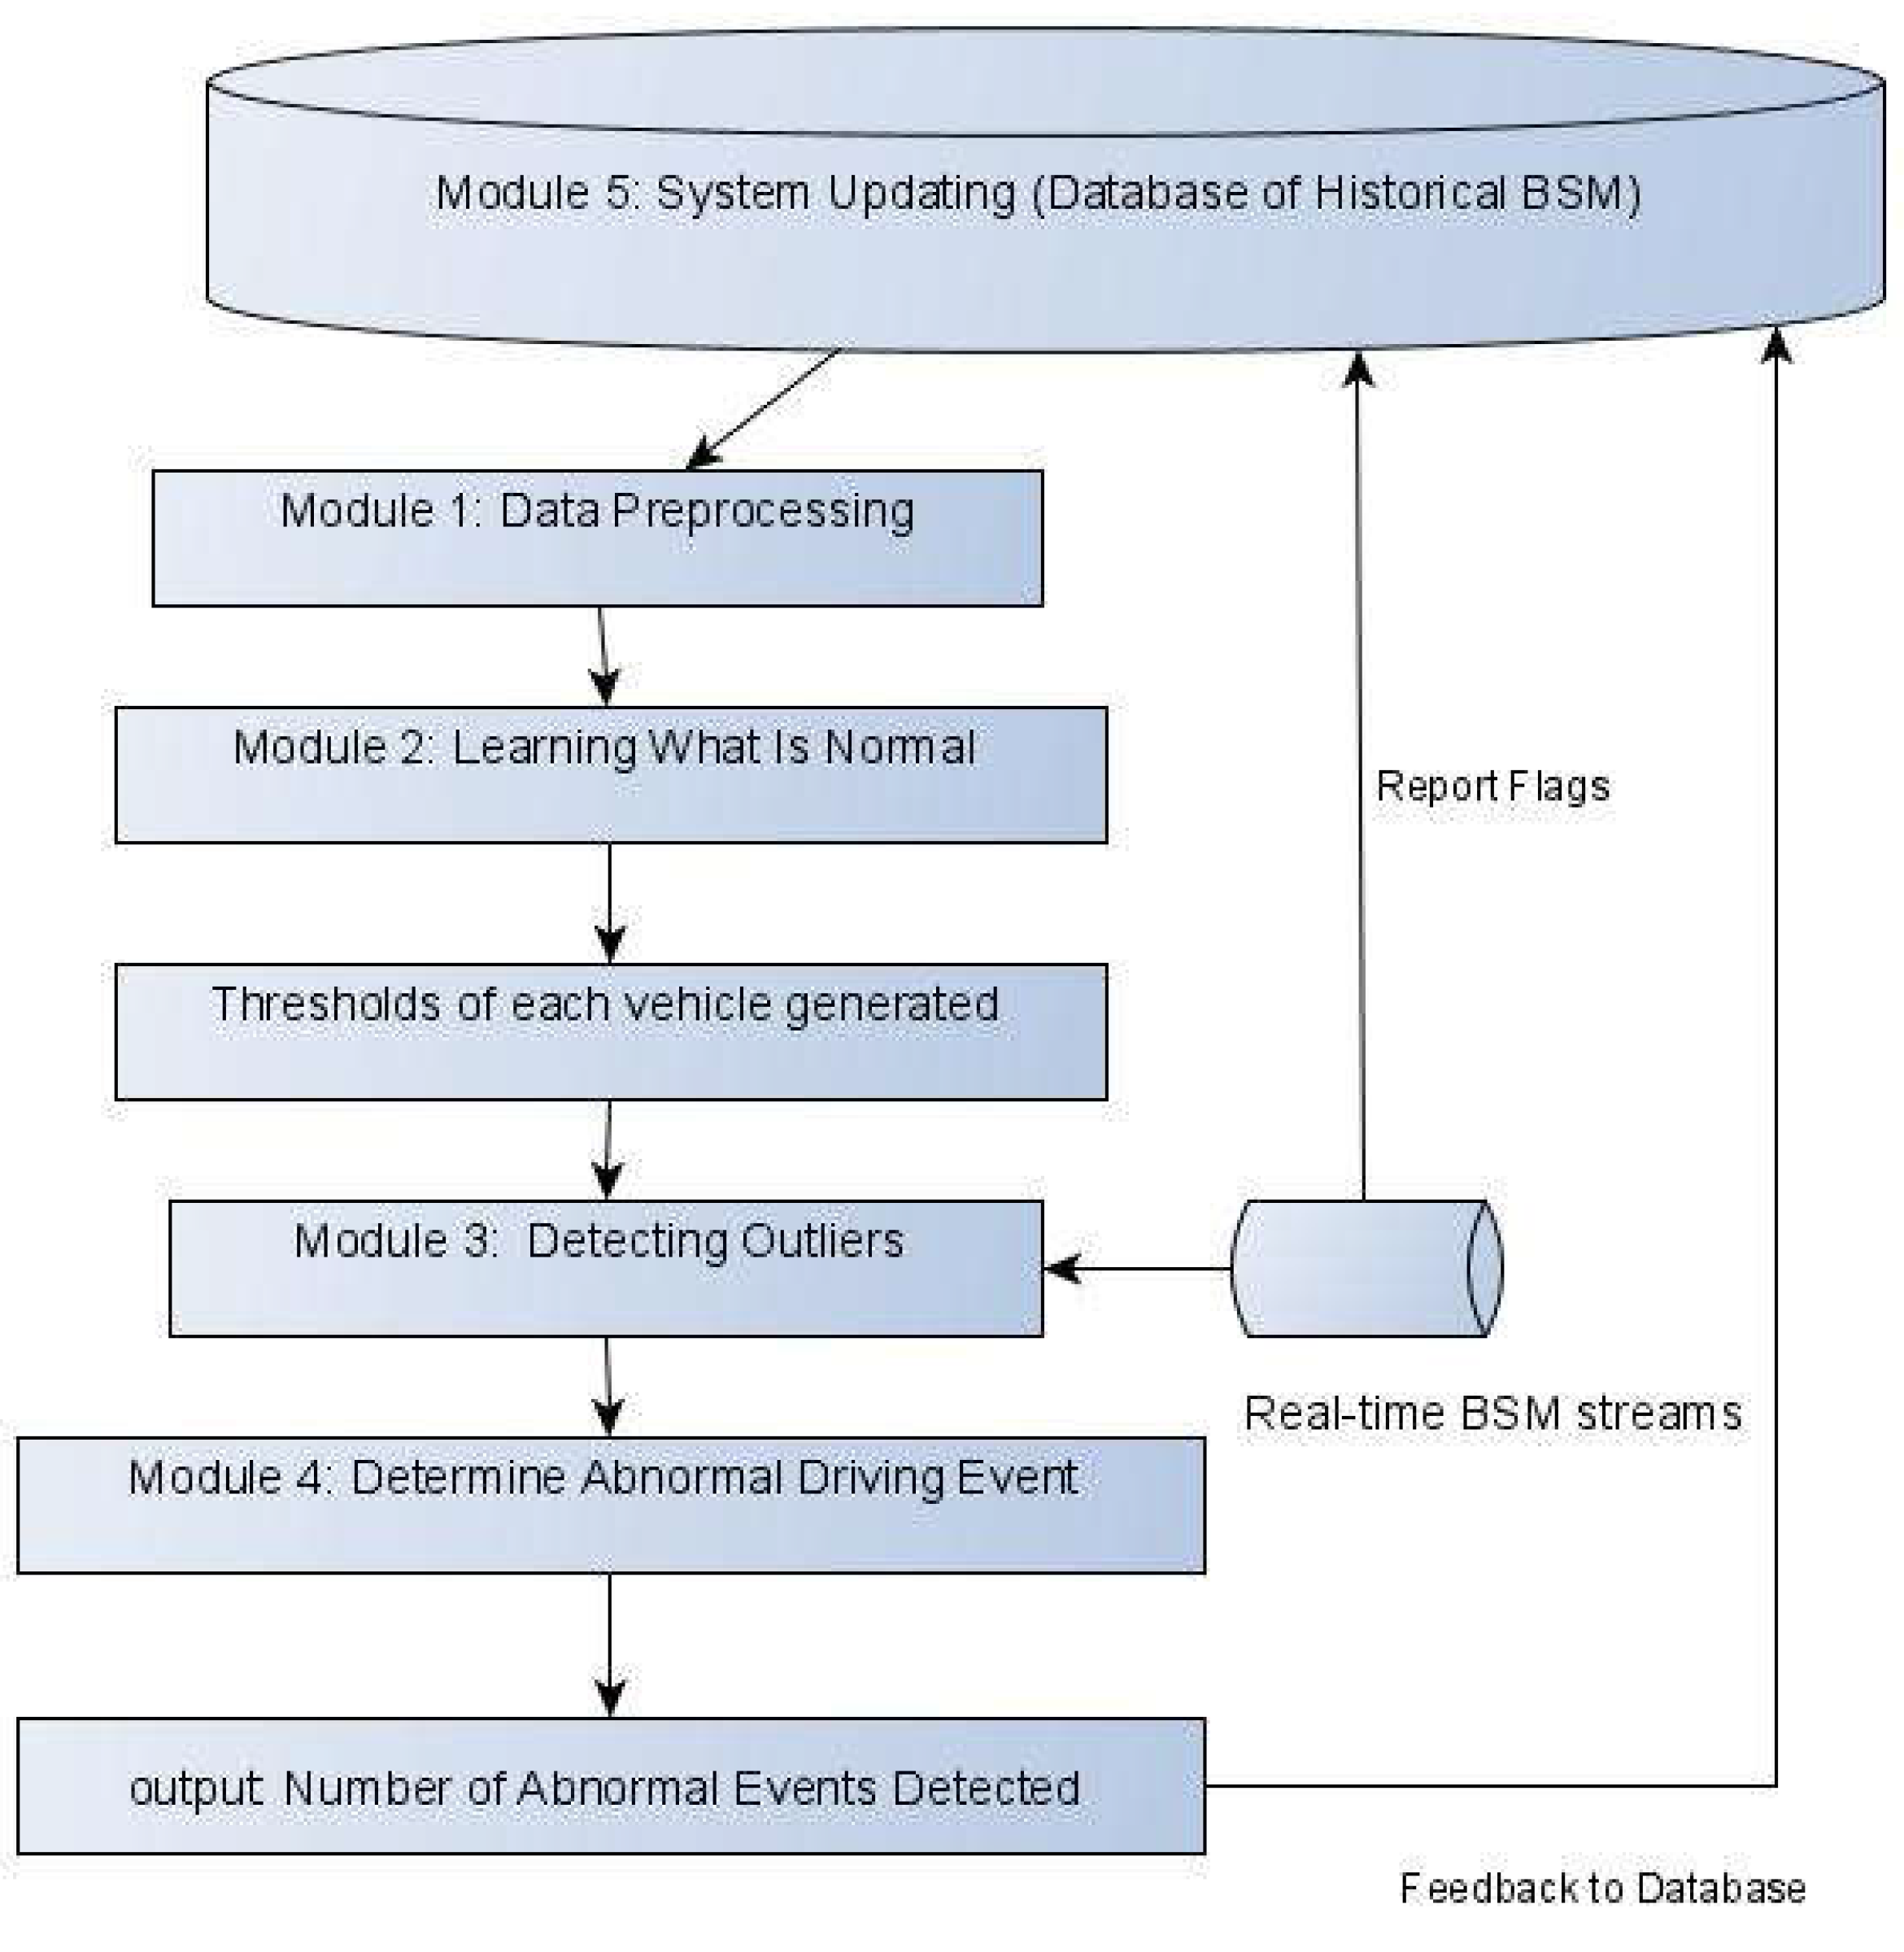
Figure 4.
THE OUTPUT PLOTS OF OD ML ALGORITHMS.
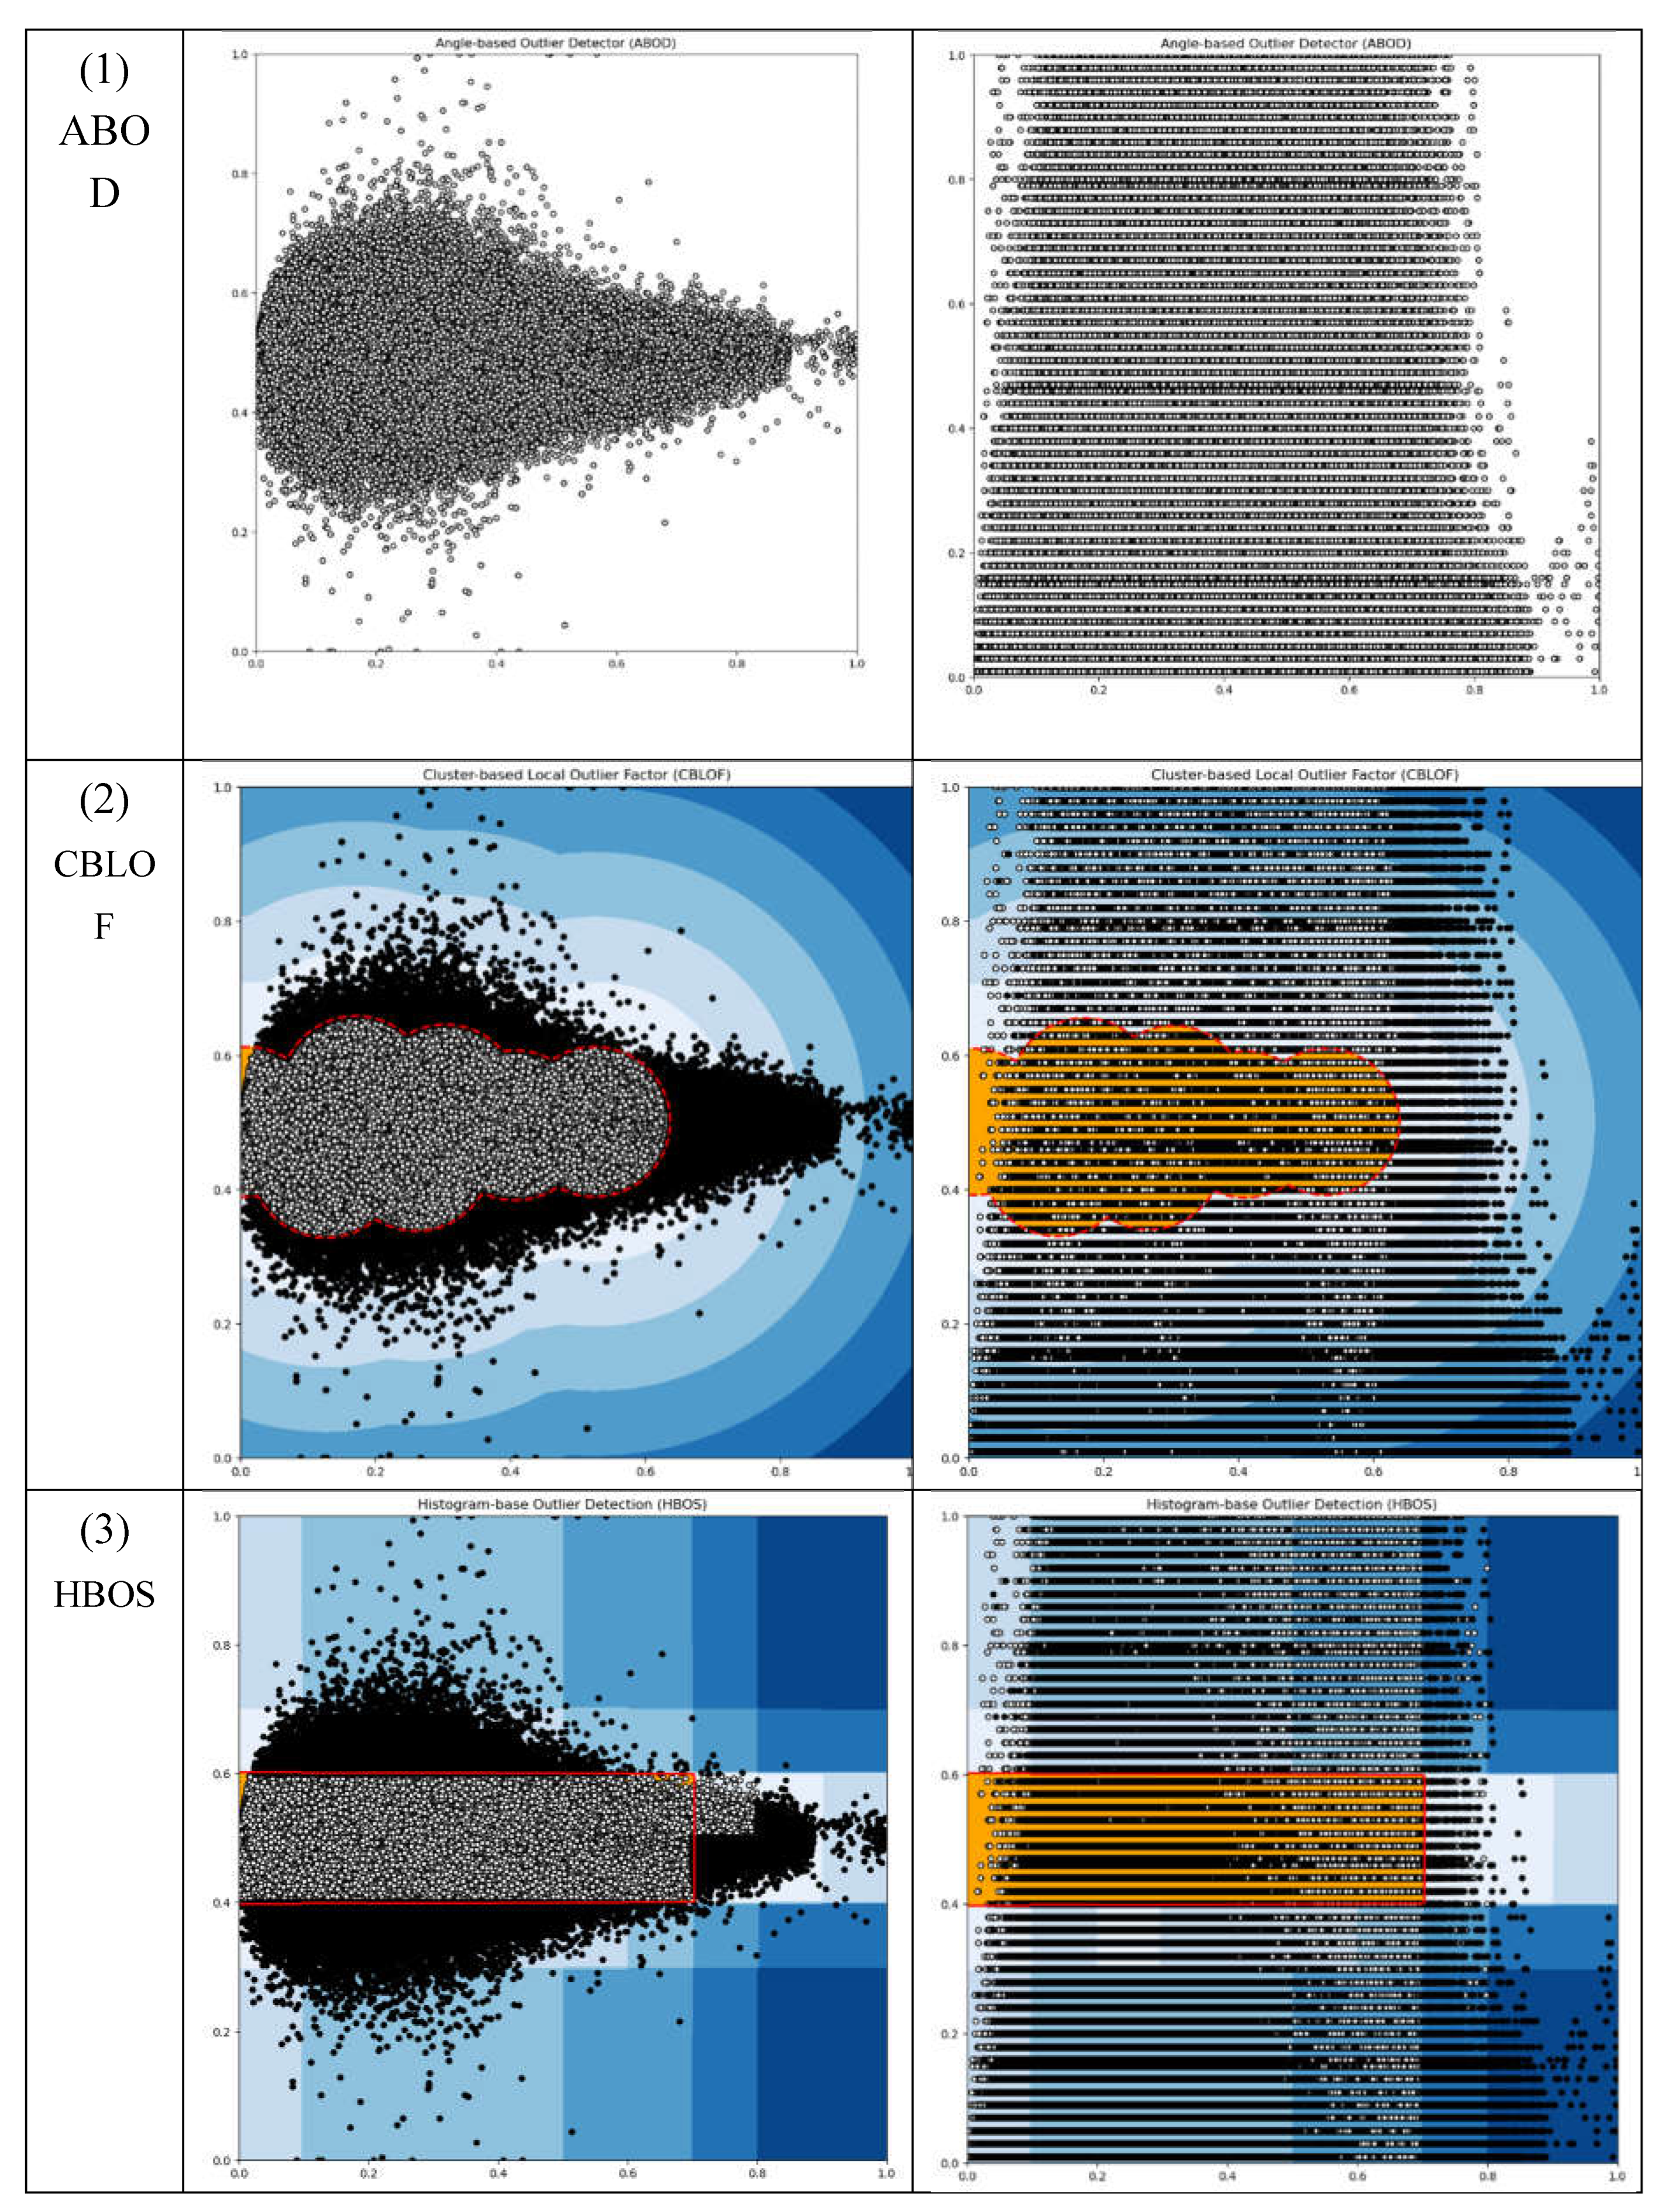
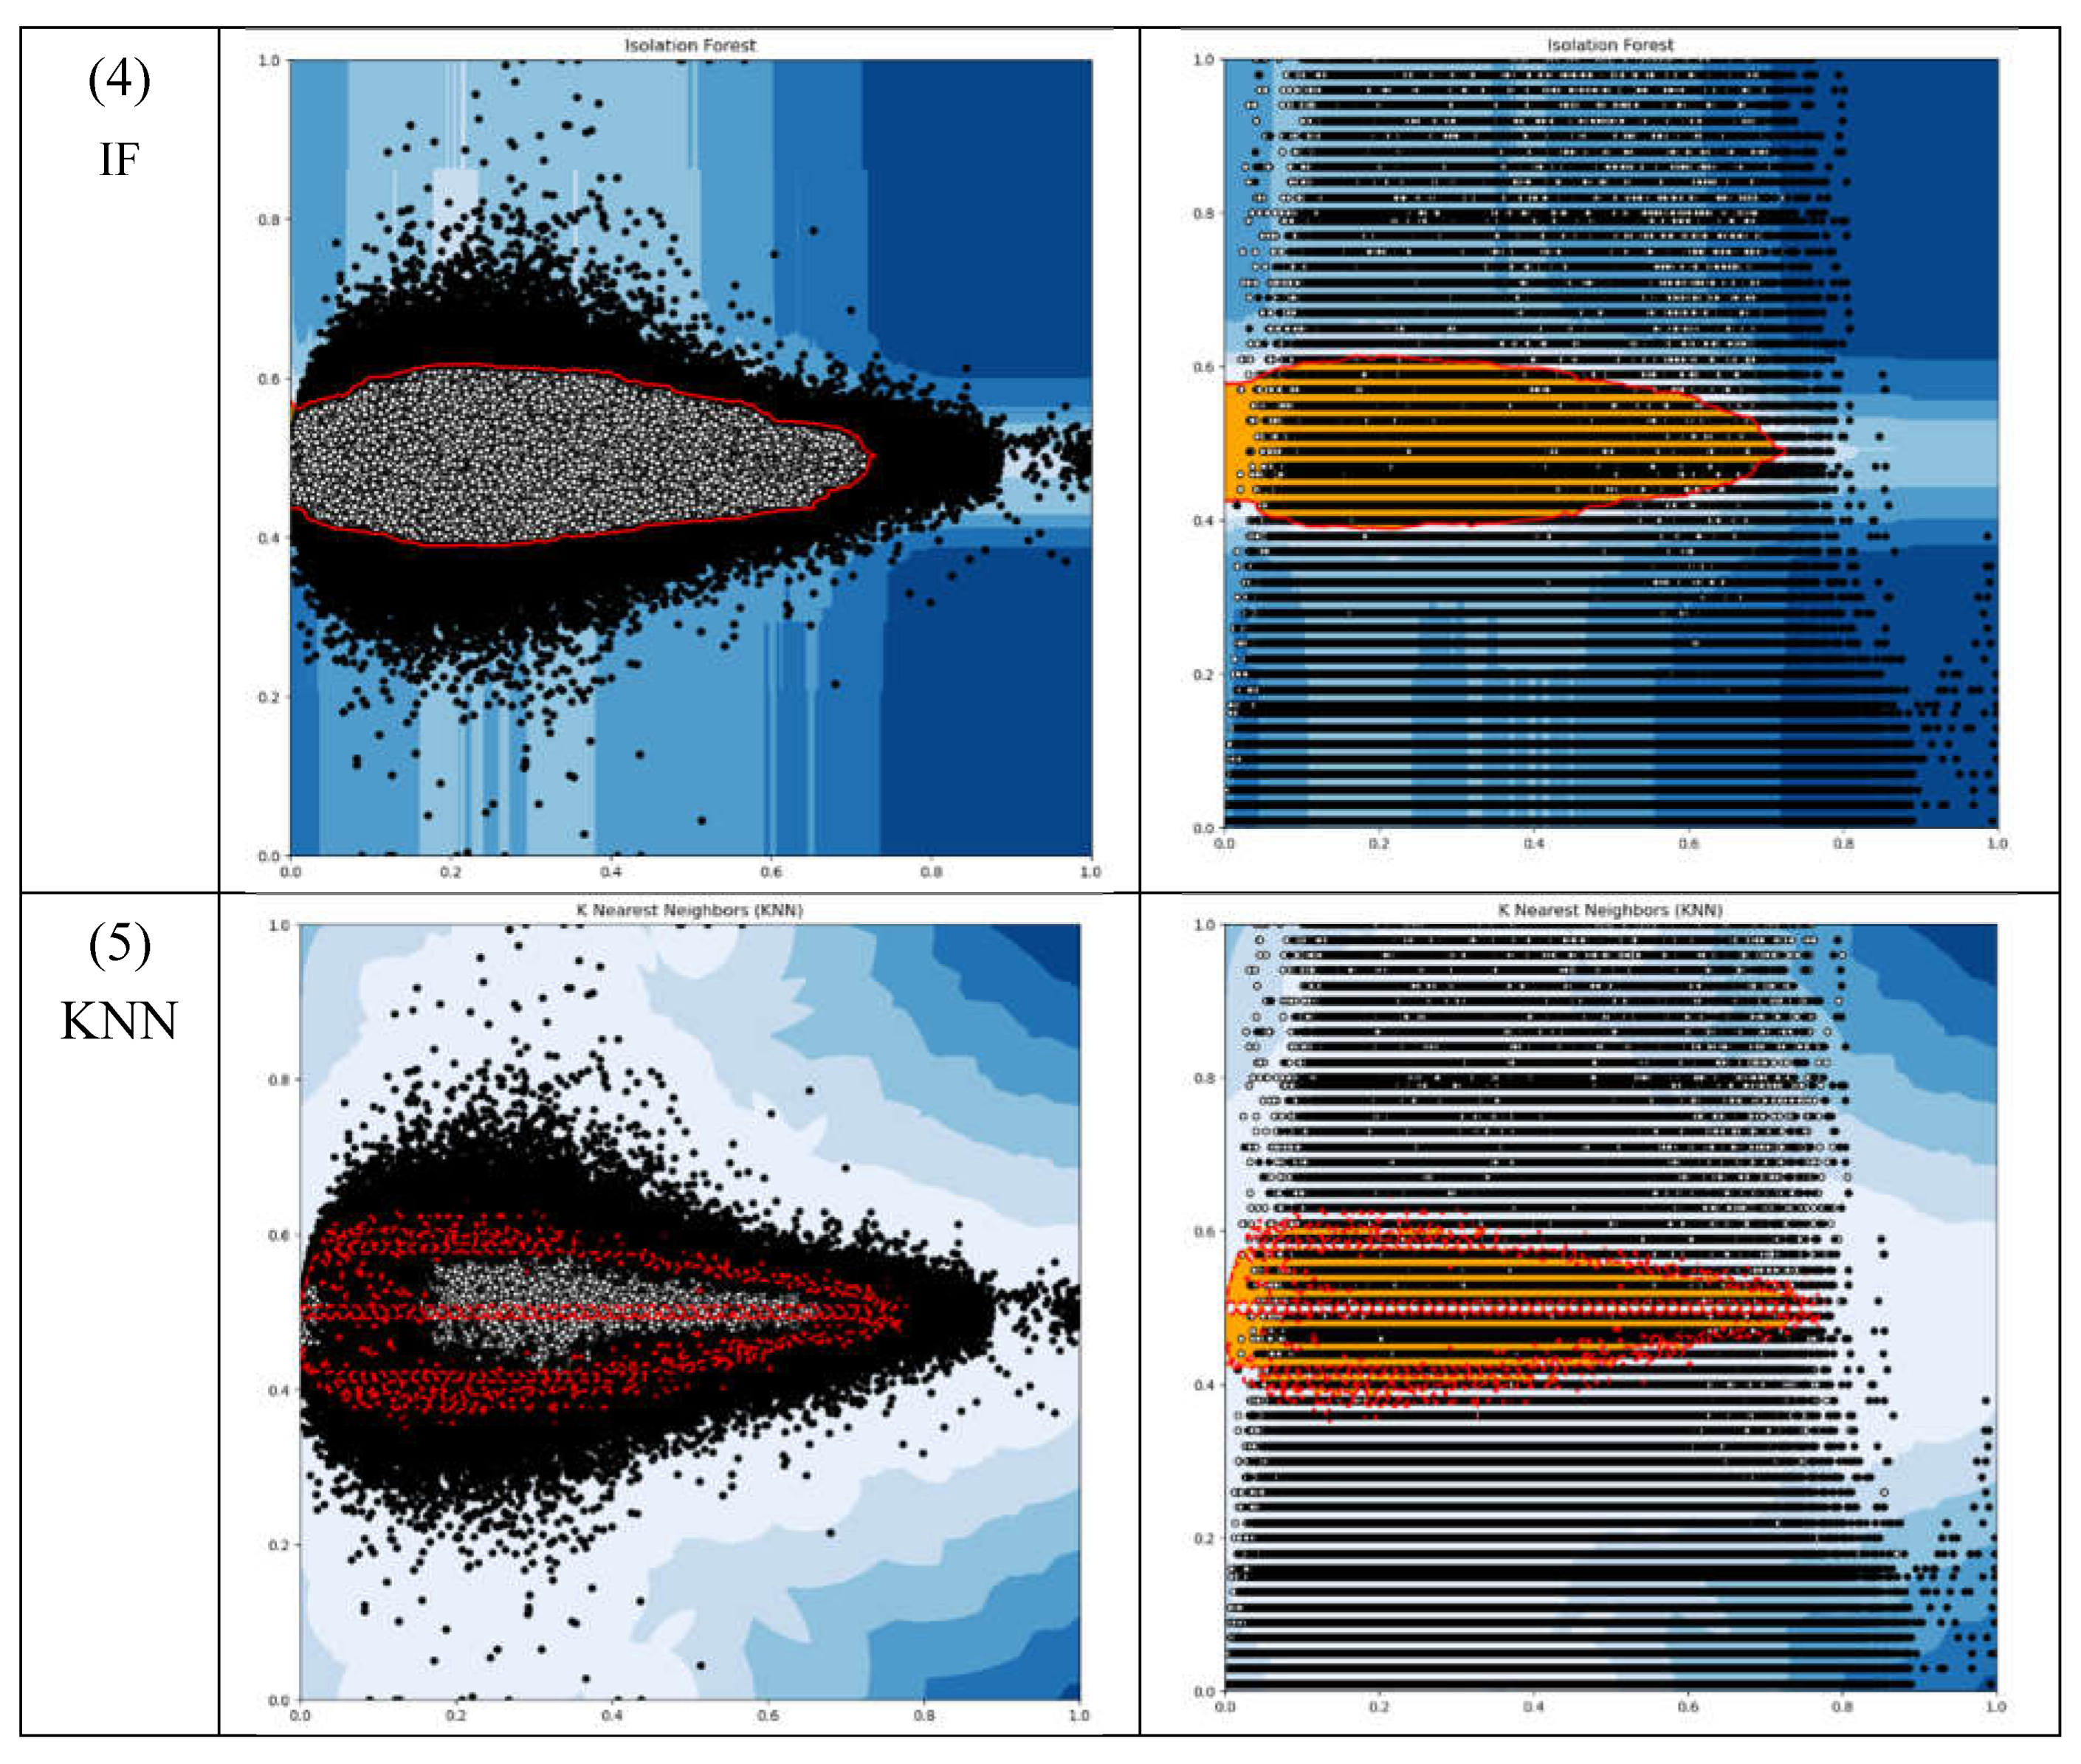
Figure 5.
Q-Q Plot of Longitudinal Acceleration of a Sample Vehicle.
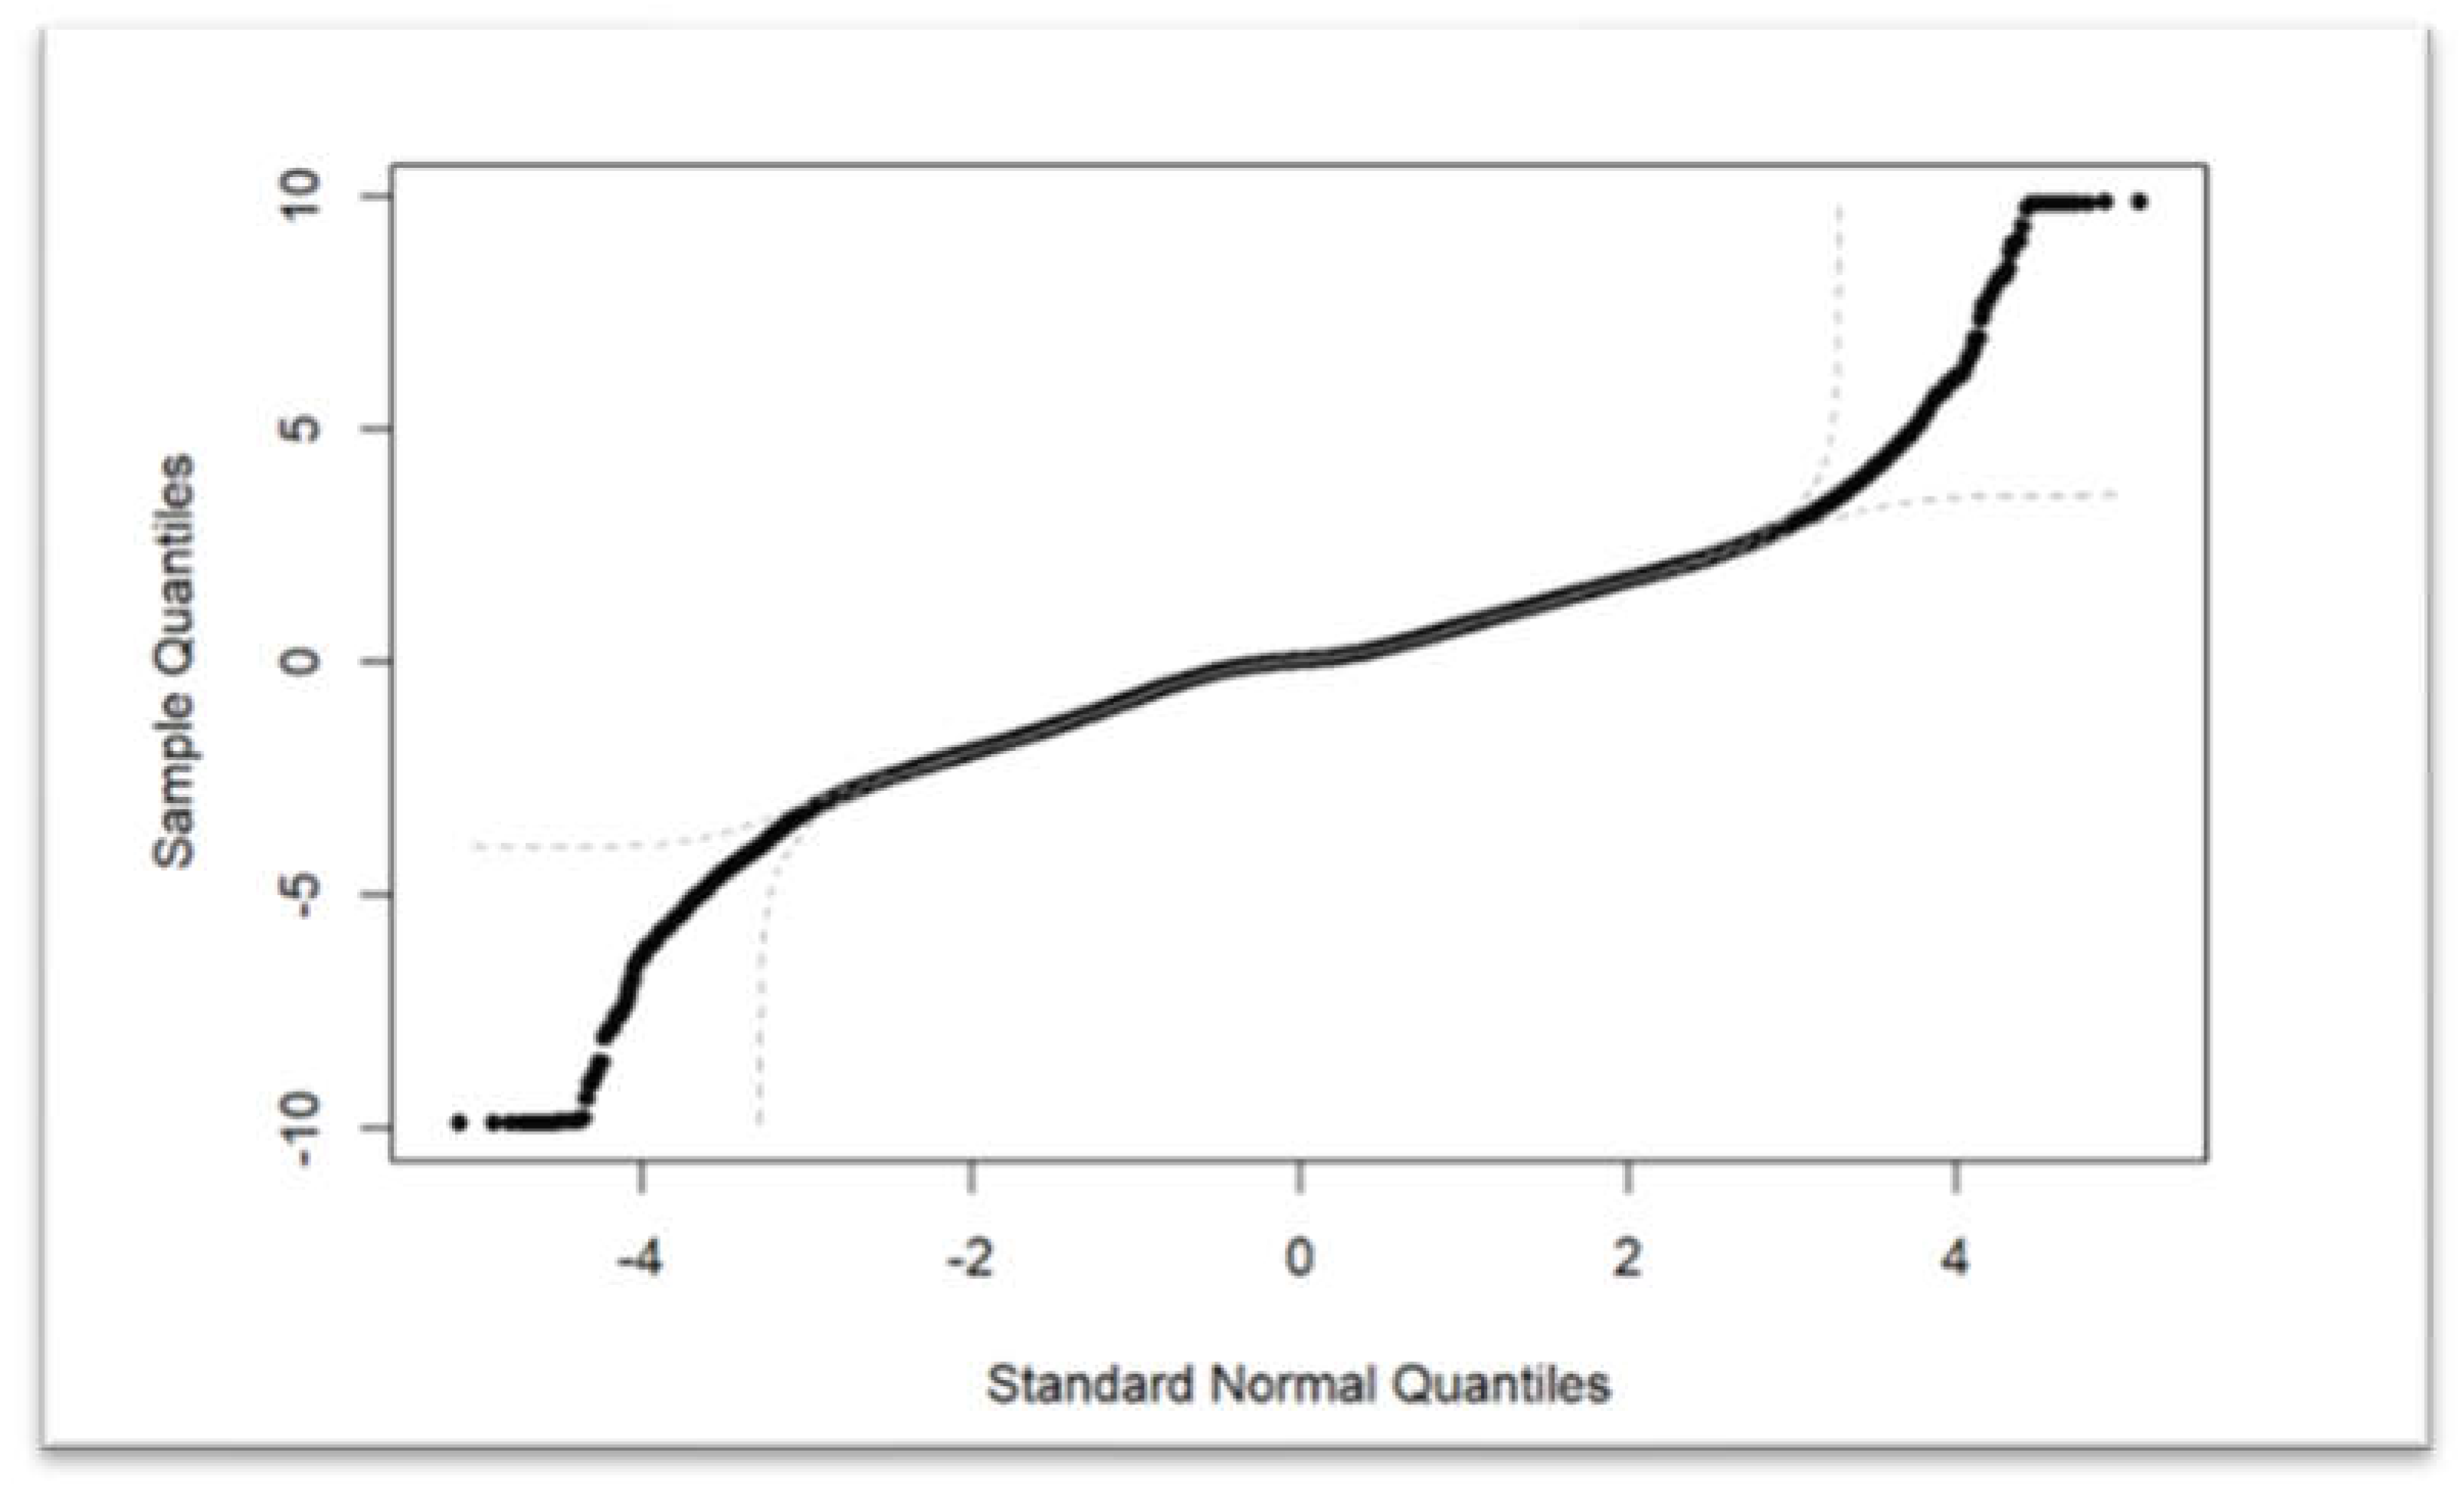
Figure 6.
Sensitivity Analysis.
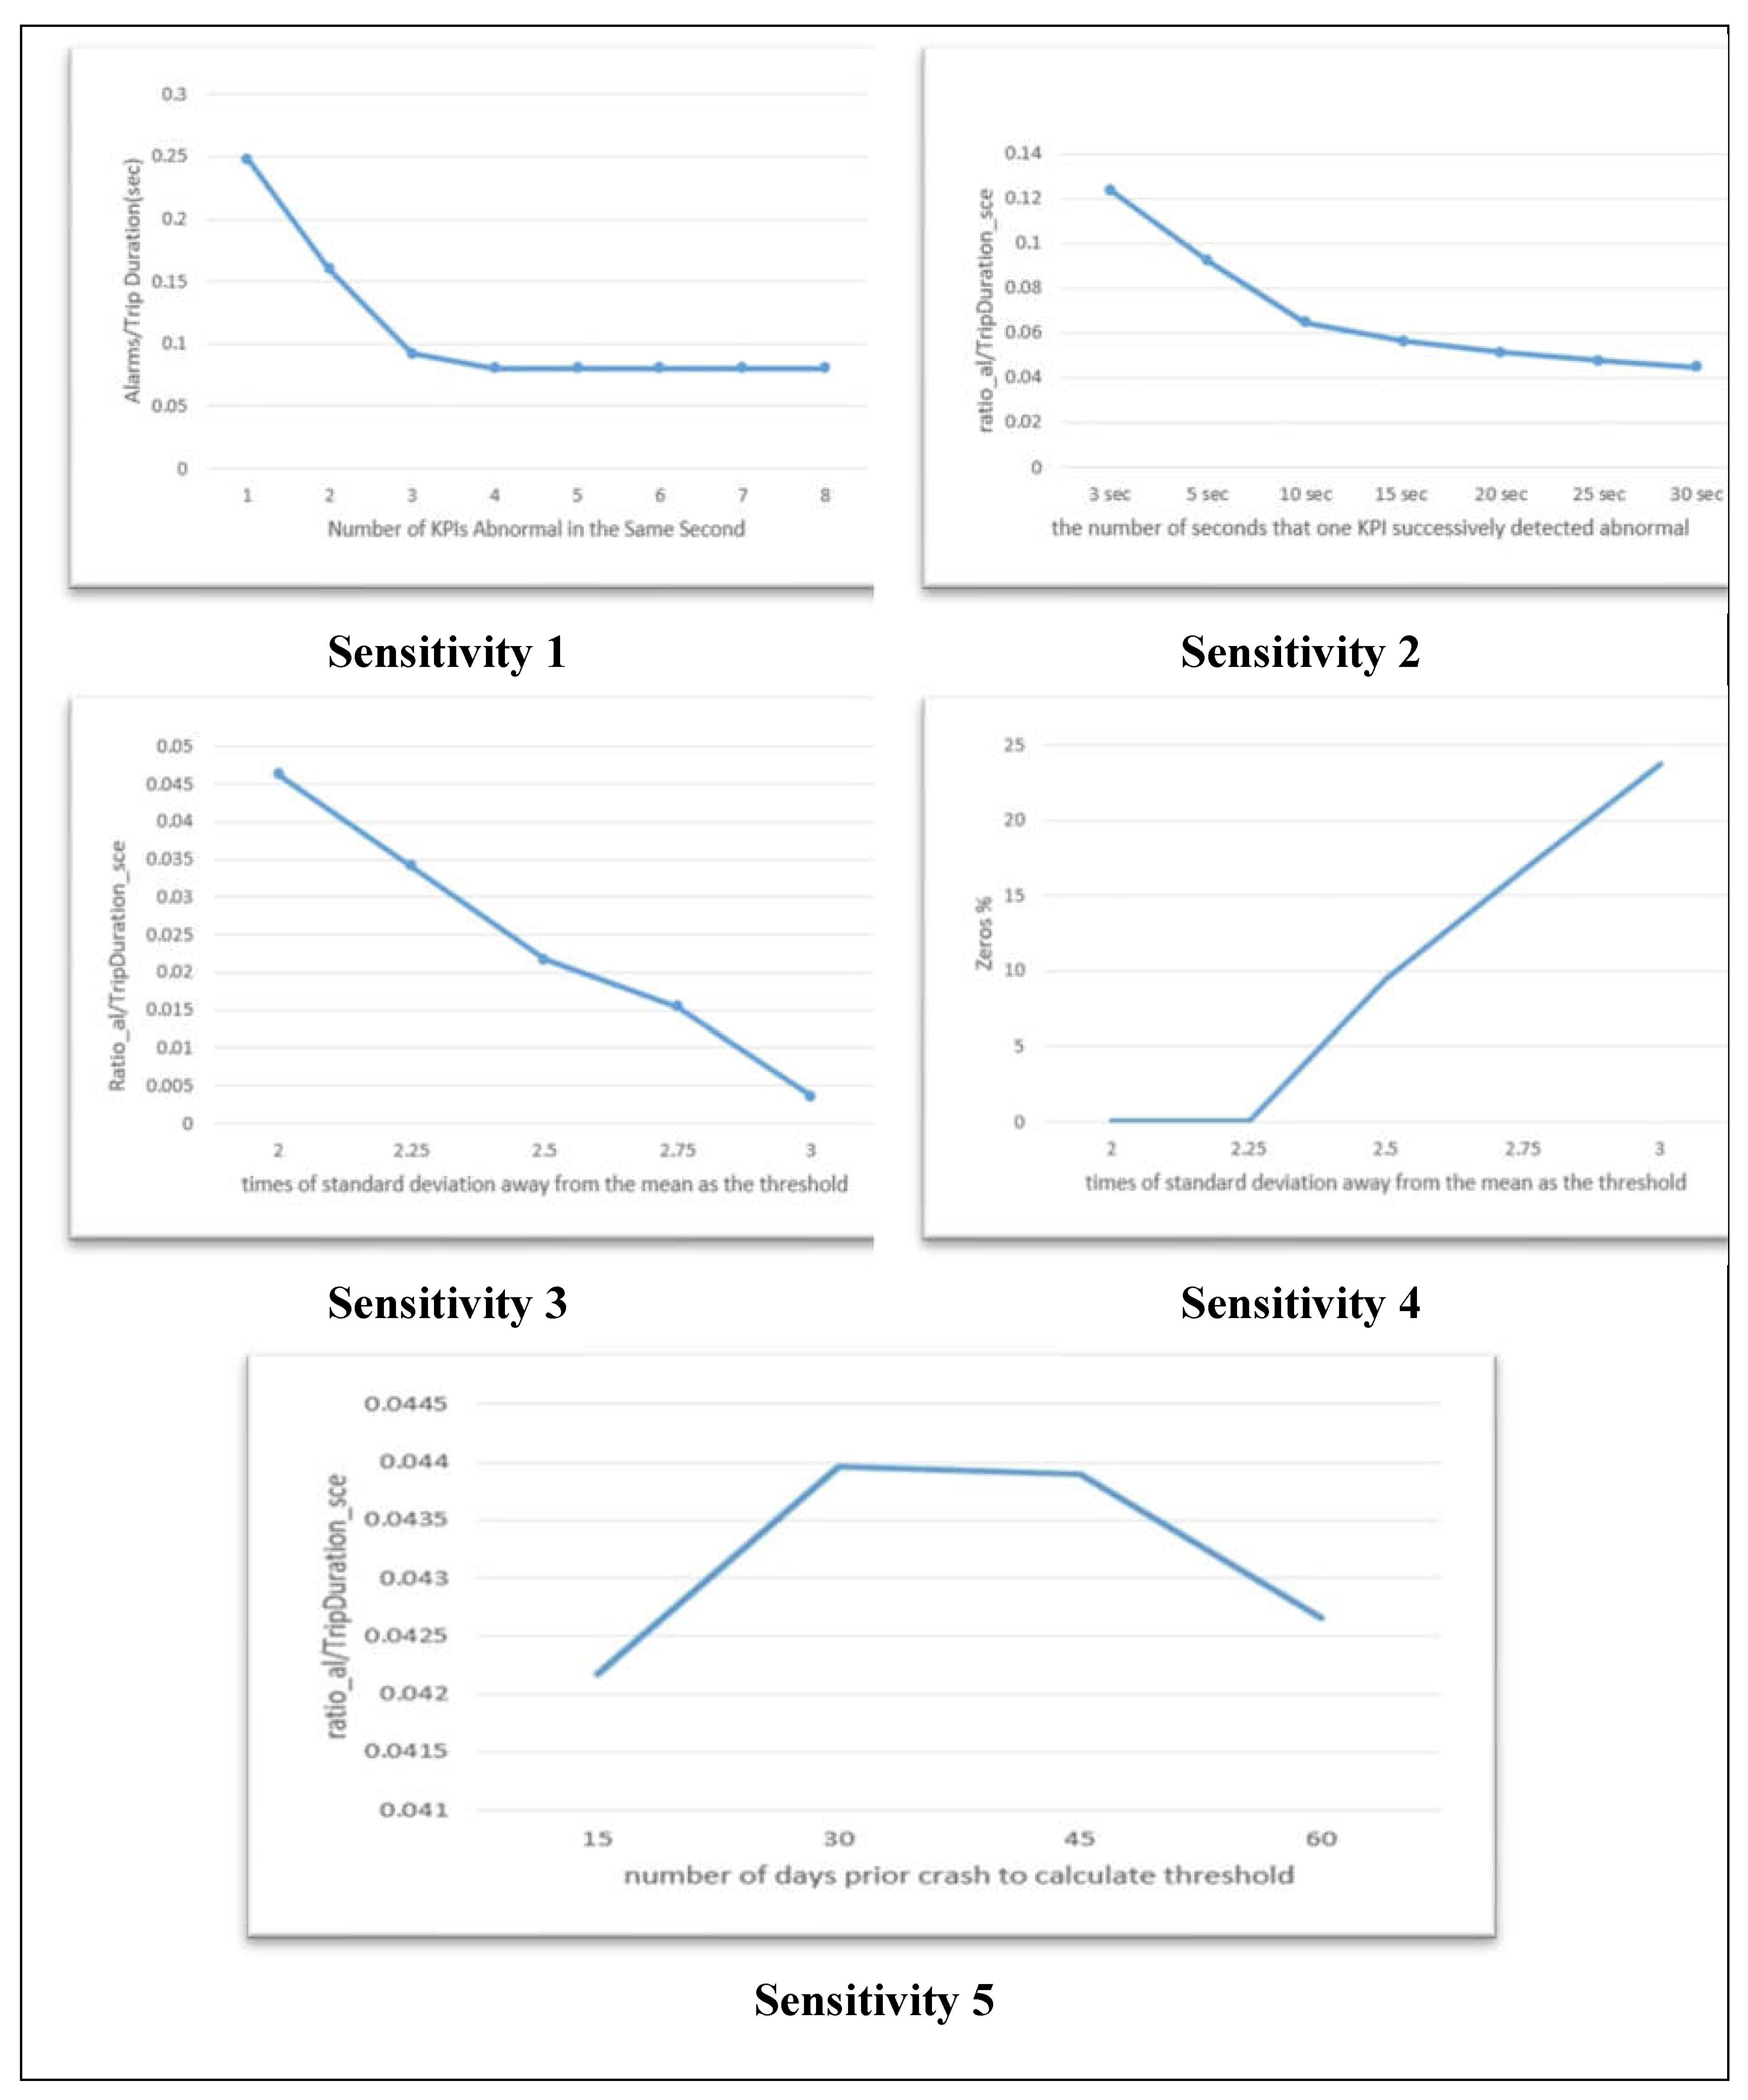
Figure 7.
Evaluation of the DAD Model.
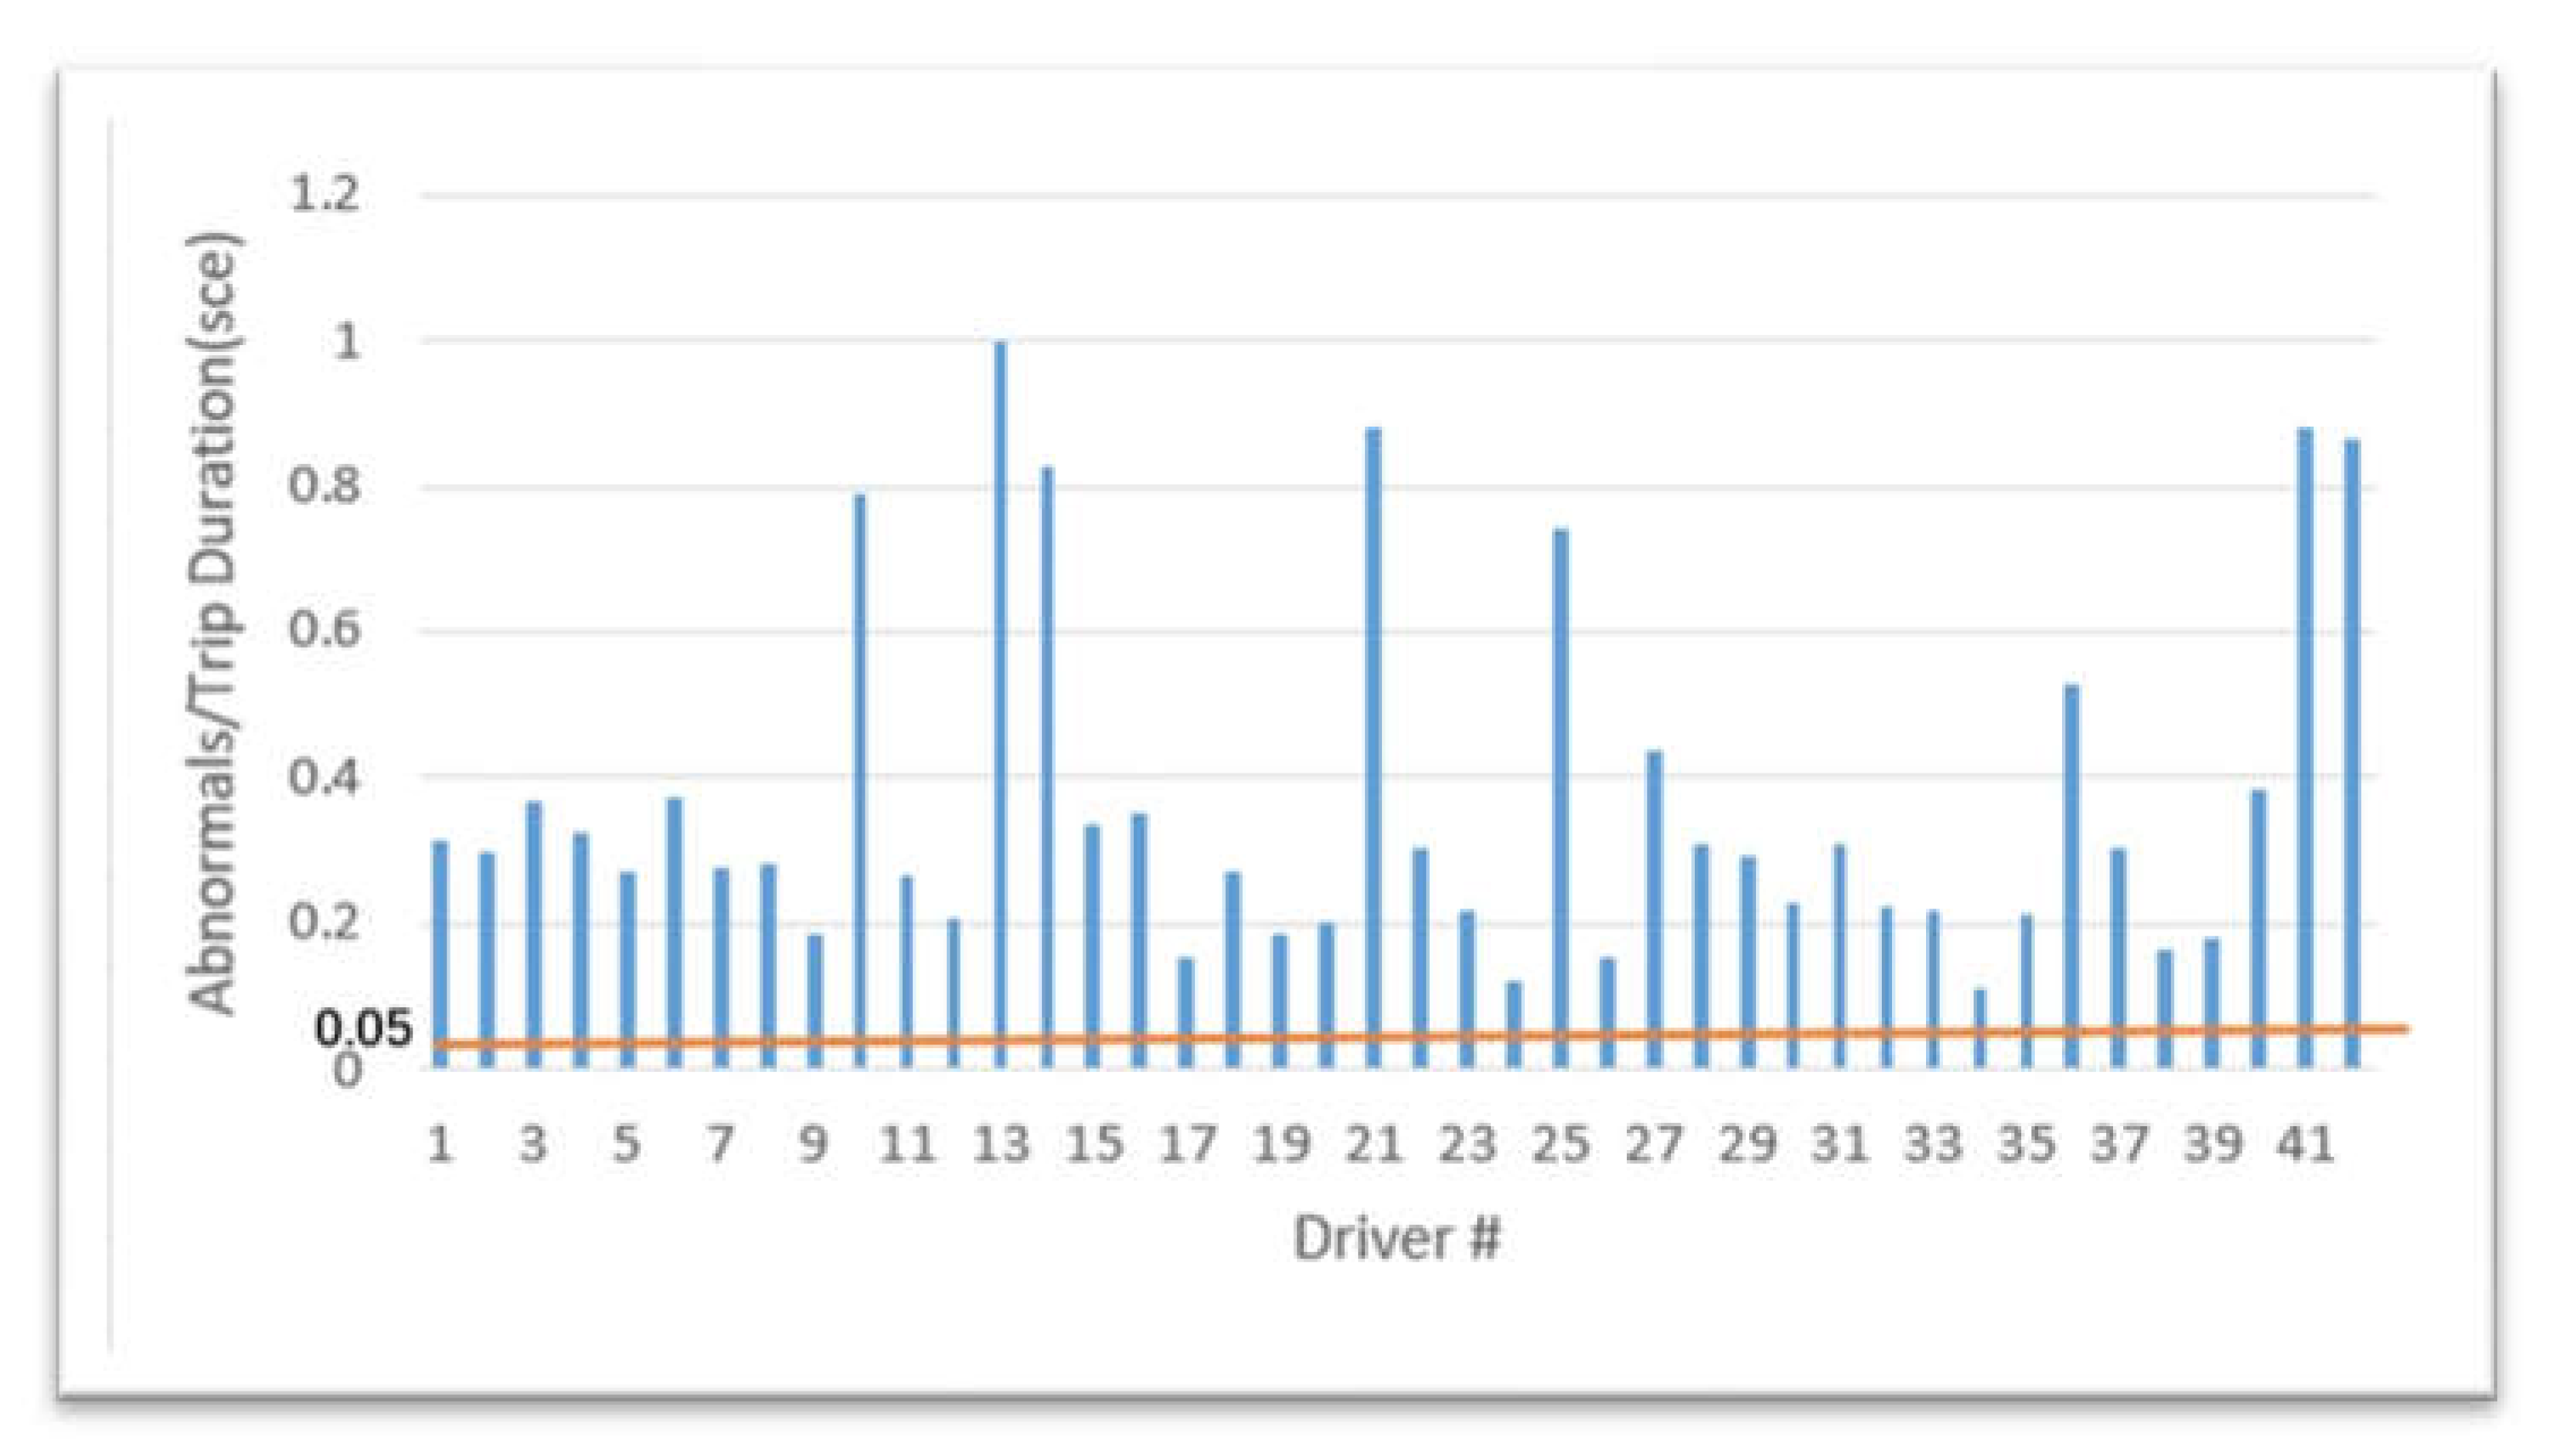

Table 1.
The Selected Attributes of BSM Data.
| Attributes Name | Type | Units | Description |
|---|---|---|---|
| DevID | Integer | None | Test vehicle ID assigned by the CV program |
| EpochT | Integer | seconds | Epoch time, the number of seconds since the January 1 of 1970 Greenwich Mean Time (GMT) |
| Latitude | Float | Degrees | Current latitude of the test vehicle |
| Longitude | Float | Degrees | Current longitude of the test vehicle |
| Elevation | Float | Meters | Current elevation of test vehicle according to GPS |
| Speed | Real | m/sec | Test vehicle speed |
| Heading | Real | Degrees | Test vehicle heading/direction |
| Ax | Real | m/sec^2 | Longitudinal acceleration |
| Ay | Real | m/sec^2 | Lateral acceleration |
| Az | Real | m/sec^2 | Vertical acceleration |
| Yawrate | Real | Deg/sec | Vehicle yaw rate |
| R | Real | m | Radius |
Table 2.
OUTPUT OF OD ALGORITHMS.
| Algorithm Name | Total Instance | Outliers | Threshold | |||||
|---|---|---|---|---|---|---|---|---|
| Longitudinal | Longitudinal Percentage | Lateral | Lateral Percentage | Longitudinal | Lateral | |||
| 1 | ABOD | 3166950 | 0 | 0 | nan | nan | 0 | 0 |
| 2 | CBLOF | 3166950 | 158345 | 158344 | -0.11175434977913001 | -0.10919071757369557 | 158345 | 158344 |
| 3 | HBOS | 3166950 | 153140 | 135949 | -1.9078634333717992 | 0.2580508062387792 | 153140 |
135949 |
| 4 | IF | 3166950 | 158348 | 0 158335 |
-2.0801210125544493e-17 | 0.0 | 158348 | 0 158335 |
| 5 | KNN | 3166950 | 142490 | 142490 | 0.0001503609022556196 | 0.000505561180569658 | 142490 | 142490 |
Table 3.
Data Panel Extracted from BSMs of an Individual Vehicle (partial).
| Speed bin | 5 | 6 | 7 | 8 | |
|---|---|---|---|---|---|
| KPI | Measure | ||||
| Acceleration-longitudinal_possitive | Mean | 1.192235 | 1.337538 | 1.32516 | 1.398614 |
| Std | 0.806321 | 0.839056 | 0.804345 | 0.804976 | |
| Acceleration-longitudinal_negative | Mean | -1.04187 | -1.14423 | -1.1853 | -1.20188 |
| Std | 0.753567 | 0.74688 | 0.771699 | 0.786363 | |
| Acceleration-lateral_possitive | Mean | 0.069047 | 0.085095 | 0.096859 | 0.120503 |
| Std | 0.431809 | 0.085095 | 0.096859 | 0.120503 | |
| Acceleration-laterall_negative | Mean | -0.02688 | -0.03648 | -0.05113 | -0.06153 |
| Std | 0.040362 | 0.07236 | 0.132858 | 0.170901 | |
| Jerk-longitudinal_possitive | Mean | 0.824624 | 0.802729 | 0.692773 | 0.62276 |
| Std | 0.696375 | 0.680028 | 0.612652 | 0.605413 | |
| Jerk -longitudinal_negative | Mean | -0.42201 | -0.46223 | -0.39244 | -0.40045 |
| Std | 0.433433 | 0.487027 | 0.401976 | 0.395484 | |
| Jerk -lateral_possitive | Mean | 0.035219 | 0.050722 | 0.043935 | 0.054583 |
| Std | 0.286576 | 0.237766 | 0.083867 | 0.110184 | |
| Jerk -lateral_negative | Mean | -0.05251 | -0.03598 | -0.04478 | -0.05237 |
| Std | 0.582464 | 0.064078 | 0.084626 | 0.126077 | |
Table 4.
Parameter Setting for Sensitivity Analysis.
| Parameter | Test Value | Initial Value | Determined Value |
|---|---|---|---|
| 1,2,3,4,5,6,7,8 | 2 | 3 | |
| 3,5,10,15,20,30 | 5 | 10 | |
| 2,2.25,2.5,2.75,3 | 2 | 2 | |
| 15,30,45,60 | 30 | 30 |
Disclaimer/Publisher’s Note: The statements, opinions and data contained in all publications are solely those of the individual author(s) and contributor(s) and not of MDPI and/or the editor(s). MDPI and/or the editor(s) disclaim responsibility for any injury to people or property resulting from any ideas, methods, instructions or products referred to in the content. |
© 2023 by the authors. Licensee MDPI, Basel, Switzerland. This article is an open access article distributed under the terms and conditions of the Creative Commons Attribution (CC BY) license (http://creativecommons.org/licenses/by/4.0/).
Copyright: This open access article is published under a Creative Commons CC BY 4.0 license, which permit the free download, distribution, and reuse, provided that the author and preprint are cited in any reuse.


