
Submitted:
27 June 2023
Posted:
27 June 2023
You are already at the latest version
Abstract
Drought is one natural disaster with the greatest impact worldwide. Southern Africa (SA) is susceptible and vulnerable to drought due to its type of climate. In the last four decades, droughts have occurred more frequently, with increasing intensity and impacts on ecosystems, agriculture and health. The work consisted of a systematic literature review on the drought regime’s characteristics in the SA, under current and future climatic conditions, conducted on the Web of Science and Scopus platforms, using the PRISMA2020 methodology, with usual and appropriate inclusion and exclusion criteria to minimize/eliminate the risk of bias, which lead to 41 documents published after the year 2000. The number of publications on the drought regime in SA is still very small. The country with the most drought situations studied is South Africa and the fewer studies are Angola and Namibia. The analysis revealed that the main driver of drought in SA is the ocean-atmosphere interactions including the El Niño Southern Oscillation. The documents used drought indices, evaluating drought descriptors for some regions, but it was not possible to identify one publication that reports the complete study of the drought regime, including the spatial and temporal distribution of all drought descriptors in SA.
Keywords:
drought regime
; Southern Africa
; drought factors
; drought impacts
; drought indices
1. Introduction
Drought can be defined as a period of abnormally dry weather, long enough to cause a significant hydrological imbalance [1]. Drought is a relative term, in the sense that the rainfall deficit must be evaluated about the climatological normality of precipitation and all precipitation/water-related activities, as well as because the local hydrological imbalance depends on the supply, demand and management of water, which reflects the role of the hardly quantifiable human interference [2]. Therefore, drought cannot be defined as a purely natural phenomenon that occurs when precipitation is significantly lower than the climatological normal [3,4], which also depends on the study period, especially in the non-stationary context of climate change [2].
As opposed to traditional and conventional definitions of drought based on the deficit in water-dependent variables or activities (for example, precipitation, soil moisture, surface and groundwater storage and irrigation) associated with natural climate variability, more recently the definition of anthropogenic drought, within the scope of the coupling of climate-water systems, which understands drought as a process and not a product to better frame and describe the complex and interrelated dynamics of natural and human-induced conditions and changes [5]. In this definition, drought includes the entire spectrum of dynamic processes that are not necessarily linear in human-nature systems (e.g., earth-atmosphere interactions, water and energy balance), which explains drought as a composite multidimensional and multiscale phenomenon, governed by climate variability and change, natural variability of the water cycle, human decisions and activities, including land and water management. Drought is part of the climate, occurs in any type of climate and is not restricted to periods of abundant or scarce precipitation [6,7].
One of the drought’s complexities is quantifying its associated impacts [8]. For example, a precipitation deficit during the plant growth phase affects agricultural production, water supply systems, groundwater storage and changes in soil moisture conservation [1]. In this sense, traditionally droughts can be classified into four types of droughts: meteorological drought, hydrological drought, agricultural drought and socioeconomic drought [2,9,10].
Meteorological drought is characterized by a deficit of precipitation in historical records and depends on the type of local climate [4]. Meteorological drought refers to the deficiency of precipitation, can be related to the increase in potential evapotranspiration in a given temporal space [11] and normally affects the ecological patterns and processes of terrestrial ecosystems [12]. Agricultural drought or simply soil moisture drought [1] refers to a deficit of soil moisture or a decrease in the amount of water available in the different soil layers [13]. During the agricultural drought there is, a reduction in the supply of soil moisture to the vegetation [11].
Hydrological drought describes a period with a significant decrease in the average levels of surface and underground water resources or negative anomalies in groundwater flow levels. Hydrological drought is characterized by the occurrence of longer periods of significant rainfall deficit and is observed after meteorological and agricultural droughts [9,13]. Concretely, hydrological drought refers to the significant reduction in the amount of water in the hydrological system, namely in abnormally low flows in rivers and abnormally low levels in lakes, reservoirs and groundwater [11]. Socioeconomic drought is associated with the impossibility of water resource management systems to meet human needs, or even the lack of water to meet the water needs of populations [6,9,14].
Operational and customary drought is assessed with different drought indices. Drought indices are time series of numerical values that allow us to evaluate the start and end dates, duration and other characteristics of droughts [9]. The World Meteorological Organization (WMO) categorizes and classifies drought indices, based on the type of data used (e.g., data observed in situ or by remote sensing, climatic or hydro-meteorological elements or parameters) as being meteorological, soil moisture, hydrological, remote sensing as well as composite or modelled indices [4]. While there are several drought indices, there is no index that is globally and adequately applicable in all cases. The most well-known and widely used drought indices around the world are the Palmer Drought Severity Index (PDSI), Standardized Precipitation Index (SPI), and Standardized Precipitation Evapotranspiration Index (SPEI) [15,16].
The PDSI is typically used to measure very long droughts and is calculated from monthly precipitation and surface air temperature data to estimate soil moisture supply and demand [9,17]. PDSI is used to measure land surface aridity anomalies which are correlated with soil moisture and land water accumulation variations [18]. The SPI is a drought index calculated based on precipitation alone and can identify drought across multiple time scales [16,19]. The SPEI is calculated with precipitation and air temperature data, it is considered an improvement of the SPI to also take into account the evapotranspiration process in addition to precipitation deficit and can also be calculated on several time scales [10,20]. These three standardized indices have the advantage that they can be acquired and compared for different locations and periods [21].
The vegetation indices can also be used to assess drought based on its effects on vegetation. The most commonly used vegetation indices to assess drought are the Normalized Difference Vegetation Index (NDVI), Enhanced Vegetation Index, (EVI), and Vegetation Condition Index (VCI) [4]. The NDVI is a plant index that is based on plants’ reflectance visible and near-infrared wavelength bands of the electromagnetic spectrum and is used for identifying and monitoring droughts affecting agriculture [22]. The EVI allows the identification of plant water stress associated with drought. The VCI is a vegetation index fine-tuned to quantitatively and qualitatively determine the impact of drought on vegetation and provides details linked to terrestrial ecological conditions and is widely applied in agriculture [23].
Drought indices are one of the most common tools to assess the occurrence and effects of drought, as well as different drought descriptors or parameters, which involve number, frequency, duration, intensity, severity and spatial extent [9]. For example, meteorological drought indices allow for an operational definition of drought and its characteristics. These indices are computed for specific time scales, i.e., precipitation frequencies at time scales of 1, 3, 6, 12, 24, 36 and 48 months [24,25,26]. Drought over these range of time scales is associated with a specific type of drought; For example, 1- to 2- month SPI drought is indicative of meteorological drought; 1- to 6 - month SPI corresponds to agricultural drought; and, 6-month to longer scales SPI can be used to assess hydrological and socioeconomic drought [6,27].
The analysis of the time series of each drought index obtained for each time scale allow us evaluating of the occurrence and characteristics of the drought at that time scale [26]. For example, in the case of PDSI, SPI and SPEI a drought starts when the index assumes a negative value and ends when the index back to assume positive values (Table 1). The duration of a drought event is simply the difference between the end and start date [28,29] i.e., the period of consecutive months of drought is considered a drought event [10]. Usually, drought is assessed at monthly scale and each event last, at least, two to three months, but can extend to several months or years [30]. Drought frequency can be defined by the number of months of drought that occurred in all months during 30 years [10] or by the number of drought events divided by the duration of the study period [24]. Drought severity is determined by the absolute value of the sum of the index values during a drought episode [24]. Drought intensity is the average value of the drought index below the climatic normal and is determined by dividing the drought severity by the duration [9,24]. Some authors link the severity of the drought to the duration, intensity and spatial extent of the occurrence of a specific drought event, as well as to the impacts on ecosystems due to lack of water, being more severe the more negative the drought index values are (Table 1) [30].
The impacts of drought vary according to the type of drought. For example, meteorological and soil moisture droughts affect agriculture, terrestrial and aquatic ecosystems. On the other hand, hydrological drought affects several systems from the reduction of the amount of water for agriculture and consumption human, affects ecosystems, energy production and industry [11]. Due to the size of the impacts associated with drought, this is thus considered one of the most costly natural disasters with significant impacts widespread worldwide and particularly in Africa [3,4]. Worldwide and in the period from 1970 to 2019, droughts accounted for 6% of the total number of natural disasters, accounted for 7% of reported economic losses, were responsible for 34% of all human deaths caused by natural disasters, which makes it droughts the second natural disaster responsible for the highest number of human deaths, after tropical cyclones. For Africa, these results are even more significant, given that 15% of natural disasters are related to climate and water and 35% of associated deaths [32]. For example, in Southern Africa (SA) the drought of 1991 – 1992 affected more than 20 million people [30].
As drought is one of the natural disasters with high socioeconomic costs [33], understanding its characteristics and how they evolve is essential to improve our ability to plan the management of water resources. Based on the scientific literature, many studies of systematic reviews on drought have been carried out globally, but through a random search in Web of Science and Scopus databases, it was possible to identify a few studies for some African countries and regions e.g., [9,34,35,36,37,38,39,40,41], but rarely for entire SA. Therefore, to assess and fill this gap shortly, the present study aims to evaluate the current state of knowledge about the characteristics of the drought regime in SA, under current and future climate conditions. Consequently, this study will also identify knowledge gaps about the drought regime in SA. Specifically, our study seeks to answer the following research questions (RQ):
RQ1 What are the characteristics of the drought regime in the current climatic conditions? In the context of this RQ1, it is hypothesized that: (i) at least some of the drought descriptors in SA are known; (ii) at least some of the spatial and temporal patterns of the drought regime in SA are known. Additionally, the main objective is to characterize the drought regime in SA, under current climate conditions.
RQ2 What are the main materials and methods used to characterize the drought regime in SA? In the framework of the RQ2 the hypothesis were the following: (i) most of the previous studies relied on drought and/or vegetation indices; (ii) most of the previous studies were based on remote sensing and ground data; (iii) most of the previous studies used physical and/or statistical methods/models to characterize the drought regime. Within RQ2, the objective is to assess the methodological approaches used to characterize the drought regime in SA.
RQ3 What are the main factors and impacts of drought in SA? Within the scope of this RQ3, the research hypotheses were: (i) the El Niño/Southern Oscillation (ENSO) is likely to be one of the main drivers of drought in SA; (ii) ocean circulation and sea surface temperature (SST) patterns in the Atlantic and Indian Oceans play an important role in the occurrence and character of droughts; (iii) some of the atmospheric circulation patterns in the region can influence the precipitation regime and, consequently, the drought regime; and, (iv) the list of effects of drought in SA will include all the socioeconomic consequences resulting directly and indirectly from water scarcity in natural and human systems, namely in agricultural, hydroelectric, industrial, health, hunger and human mortality. In the context of RQ3, the objective is to better understand the main driver and consequences of drought in SA.
RQ4 What are the existing projections on the drought regime in SA for different periods and scenarios of future climate? In this case, our hypothesis included: (i) there are already some drought regime projections for the SA; (ii) namely, for some future periods and scenarios; but, (iii) there should not yet be estimates for the new climate scenarios or for the entire territory of SA.
Studies or review articles are excellent elements of study for researchers, especially the younger ones and those starting research on a new topic. In this sense, this study also has the secondary aim of gathering and providing a set of fundamental information on the drought regime in general and in Southern Africa, in particular.
2. Materials and Methods
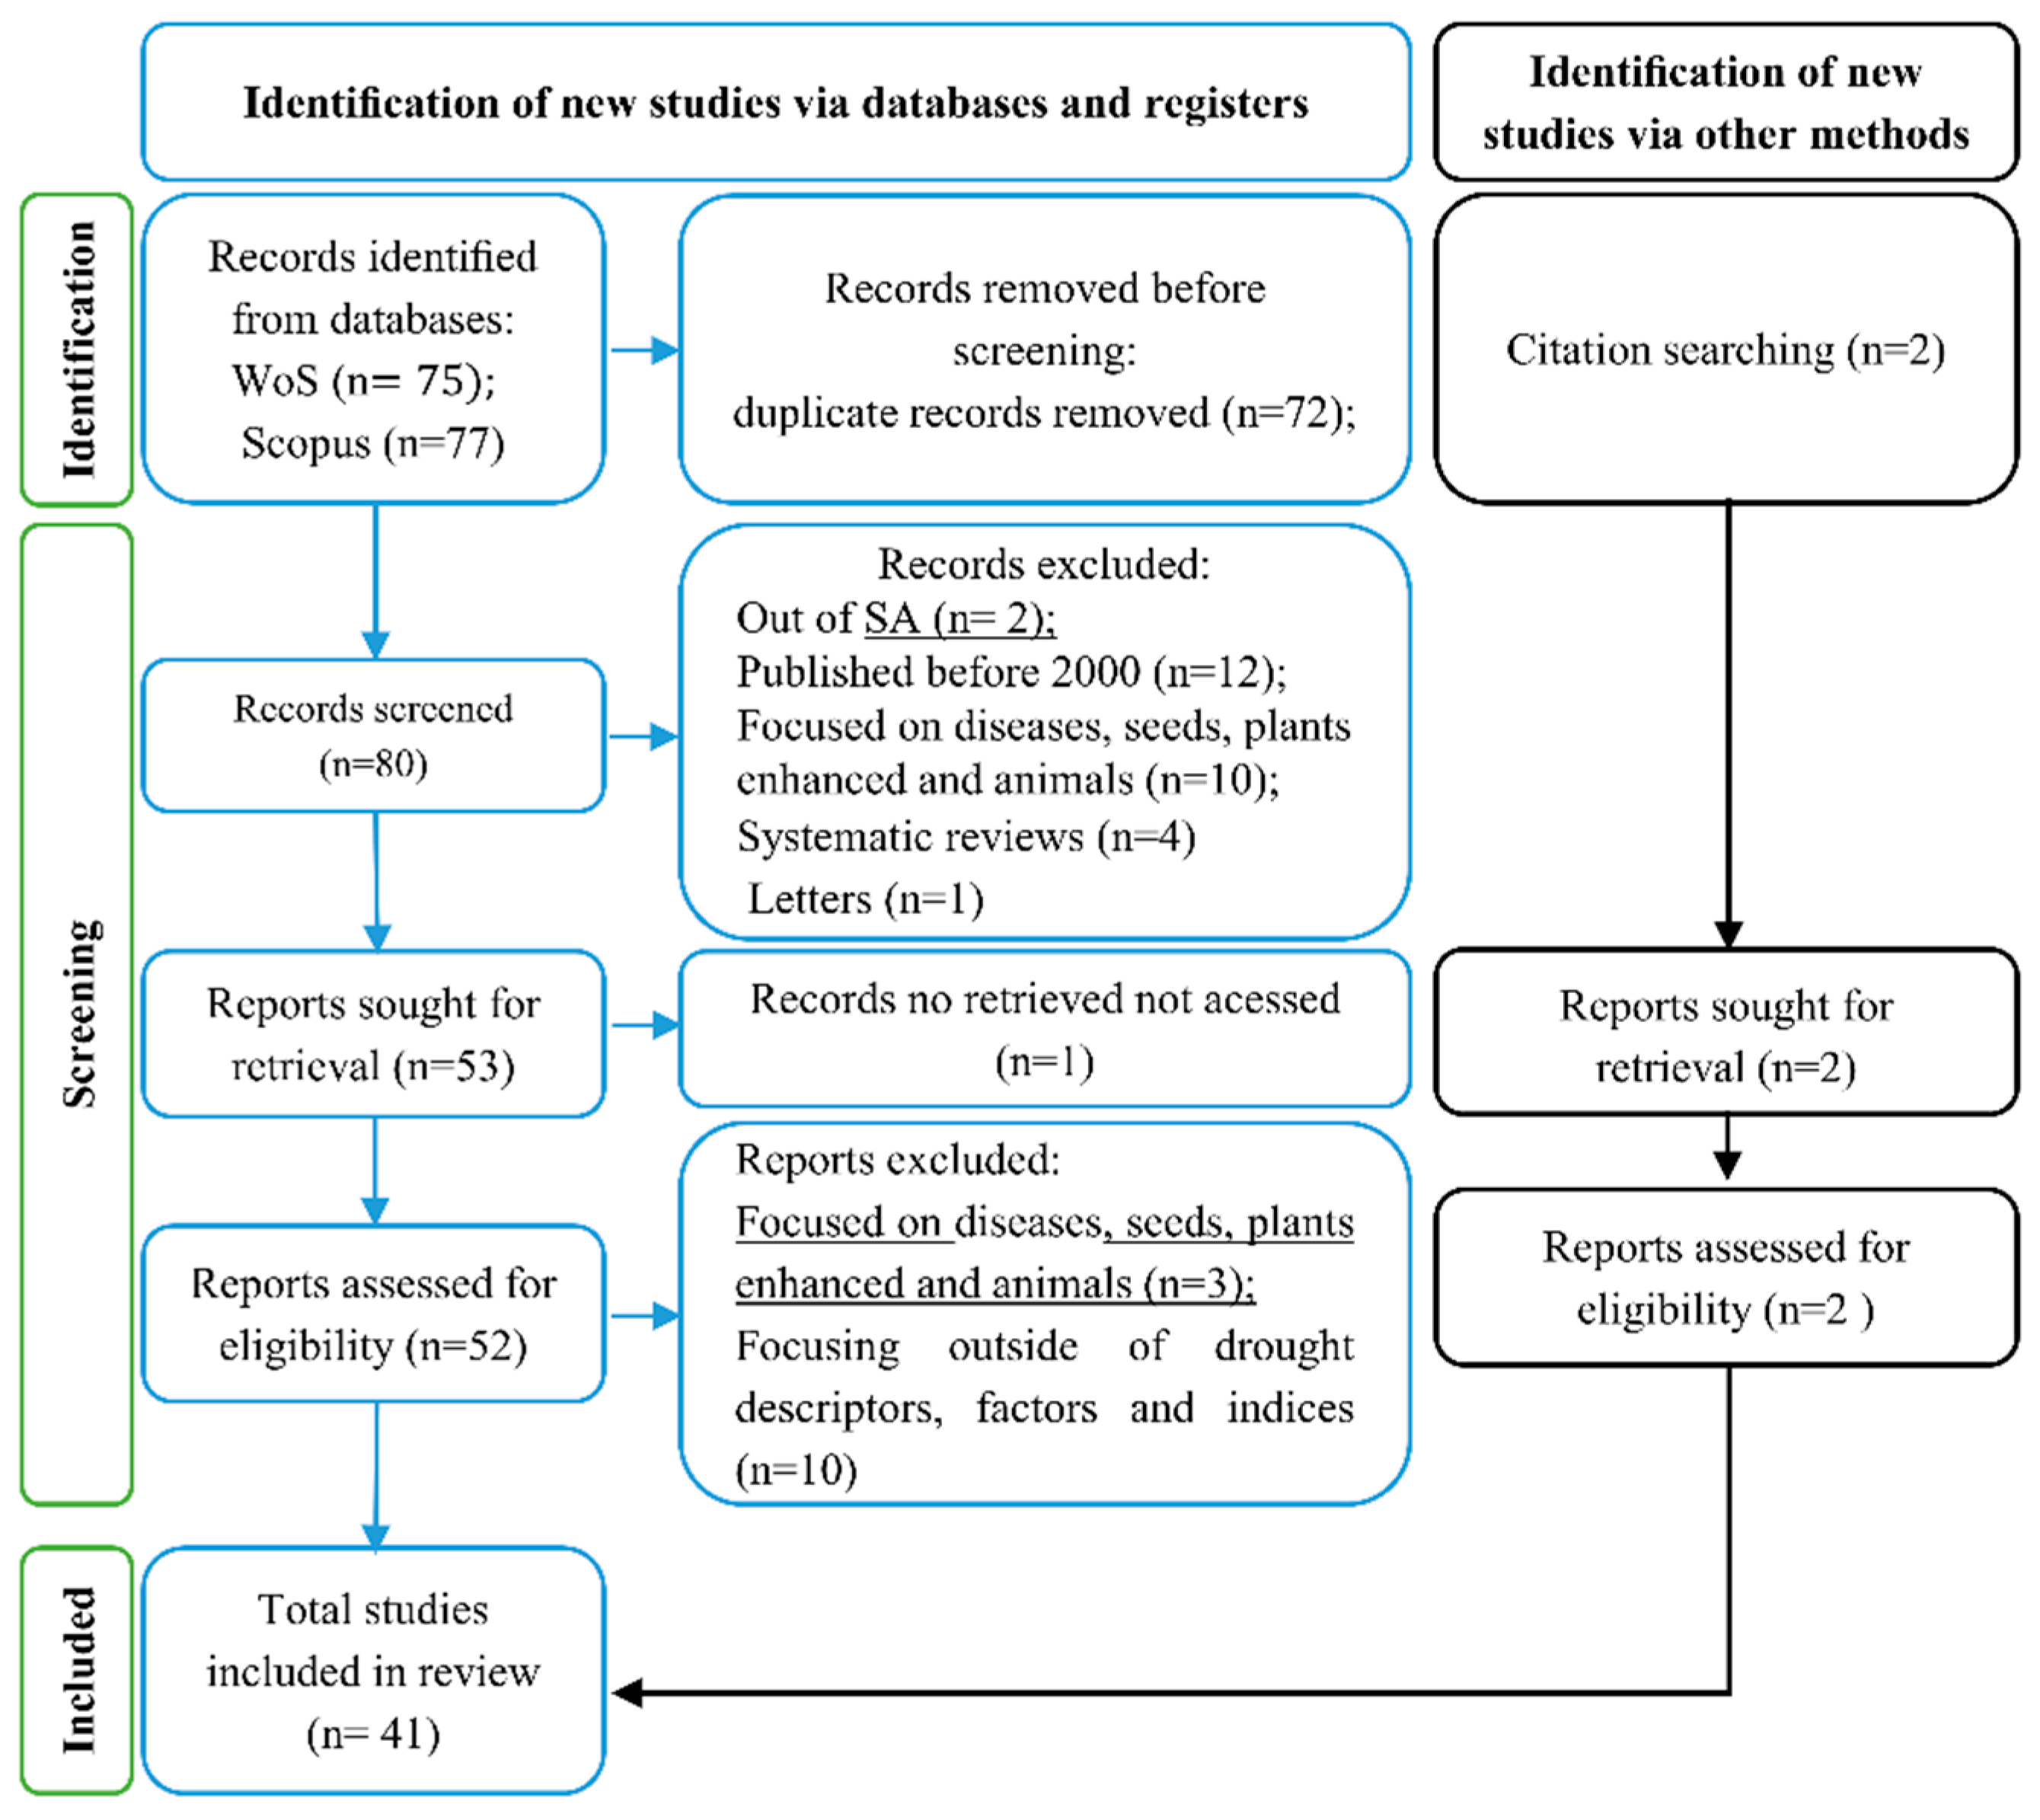
This review was conducted systematically using the structure of the flowchart (Figure 1) of the Preferred Reporting Items for Systematic Reviews and Meta-Analysis protocol (PRISMA) and consisted of (1) identifying the bibliographic databases; (2) defining the research equation; (3) selecting the selected documents through criteria; and (4) evaluate the quality of the studies and synthesize the information [42]. The development of the search strategy to identify the studies about the drought regime in SA was carried out in March and April 2023, on the Web of Science (WoS) and Scopus platforms, complemented by the Google Scholar search engine and using a search equation in the title of the articles:
Drought* AND Southern AND Africa*
The equation made it possible to identify all studies that include, in the title, the keywords indicated in the research equation above. We decide to use the wildcard characters (*) in the keywords Drought and Africa to be able to find other nearby words like Droughts and African. To achieve the research objectives, several inclusion and exclusion criteria were also adopted/defined (Table 2). It is important to point out that the inclusion and exclusion criteria were defined with two main objectives: (i) to achieve the main goal/aim of identifying a complete set of recently published documents (after 2000), accessible to the generality of the scientific community, on the drought regime in southern Africa, under current and future regime conditions; and, (ii) ensure that they do not contribute to increasing the risk of bias.
The PRISMA2020 methodology defines three fundamental steps for carrying out a systematic review: (i) identification, (ii) screening and (iii) inclusion (Figure 1). The first step consisted of identifying the publications from the two databases and the exclusion of duplicates through the screening carried out in the Mendeley Desktop reference management and human intervention. The second step includes three stages: the first stage includes the reading and analysis of the title, abstract and keywords of each publication which may lead to excluding an additional number of publications; in the second stage, the inaccessible publications are also excluded from the list; finally, in the third stage of step two, the publications are completely read and the inclusion and exclusion criteria (Table 2) are used to further keep or reject publications.
The application of these three steps led to the final list of publications that served as the basis for the systematic literature review on the drought regime in SA. This entire process that led to the final list of publications was carried out based on the collection and analysis in Microsoft Excel of qualitative and quantitative information extracted from the publications, throughout the different steps. The Excel spreadsheet allowed the inclusion and organization of information on the different topics of the drought regime, including drought descriptors, current and future patterns; factors/drivers; consequences/impacts, input data and methodology (use of drought indices and other methods).
3. Results and discussion
3.1. Publications identified with the PRISMA2020 methodology
The application of the PRISMA2020 methodology allowed us to identify a total of 152 publications via databases and registers as well as 2 publications via other methods, namely citation searching. All the identified publications in databases can be accessed at the website address presented in Table 3. The publication identification via databases included a very small number of studies about drought carried out in Angola and Namibia which motivate the inclusion of these two publications identified by citation searching to present some interesting information on the drought regime in these two countries (Figure 1). The first publication is a case study for southern Angola performed to evaluate drought risk in data-scarce contexts [43], while the second publication is about the use of the Blended Drought Index to assess the integrated drought hazard [44].
All identified studies in the search were entered into Mendeley Desktop reference management software and reconfirmed by human verification. In the first phase, 72 duplicate publications were excluded which corresponds to 47% of the total number (152) of identified publications via databases. In the second phase, 19% of the publications were excluded due to: study area out of SA (1.3%), publication year before 2000 (7.9%), focus only on drought impacts (6.6%), and being systematic reviews (2.6%) or letter (0.67%). In the third phase, 8.6% of publications were excluded for not including drought descriptors, factors or indices (6.6%) and focusing only on drought impacts (2.0%).
Figure 1.
PRISMA 2020 systematic review flowchart. Adapted from [42].
Figure 1.
PRISMA 2020 systematic review flowchart. Adapted from [42].
Of the 154 publications initially identified in the databases, records and citation search, 82 remained after removing repetitions and 41 after applying the inclusion/exclusion criteria. The 82 documents were published between 1987 and 2023, which corresponds to an average of 2.2 publications per year, but 85% of these documents were published from 2000 onwards (Figure 2). The 41 documents selected for the bibliographic review were published after 2000, which corresponds to an average of 1.8 publications per year (Figure 2). However, 80% of these documents were published in the last decade and 2020 was the year in which the largest number of these documents was published (15%). This growing trend suggests/demonstrates that this subject has gained interest in recent years by the scientific community, eventually associated with the frequency and magnitude of drought impacts in SA. However, the number of publications on the drought regime in SA is still very small, given the large size of its territory.
Although the bibliographical research was carried out to identify documents whose study region was SA, only 32% of the 82 documents refer to studies in this region, that is, most documents report/describe studies carried out in a region, part or all of it of a country or group of countries of SA (Figure 3). Most of these studies accounted for across SA are restricted, for example, to a drought event, to one or two drought descriptors, or to some drought classes and time scales. In addition, 17% of these documents include publications before the year 2000, literature reviews, studies aimed at minimizing the social and economic impacts of drought, creation of monitoring tools, drought warning systems or even improvements in seeds and crops to adapt them to drought.
An analysis of the study areas of the 82 documents identified in the databases, registries and citation searches (Figure 3) reveals that the countries where the most studies were carried out were South Africa 30 (37%), Zimbabwe 20 (24%) and Mozambique 18 (22%) while the countries where drought was less studied were Eswatini (formerly Swaziland) 9 (11%), Namibia 4 (5%) and Angola 4 (7%). It is important to highlight that the study area of each document can be more than one country, which explains the sum of percentages greater than 100%. Regarding the 41 documents selected for the literature review, the distribution is essentially similar, with an increase of documents for SA (by 5%), South Africa (4%) and Angola (3%). These results disclose the need to acquire and/or update knowledge about drought throughout the SA, as none of the documents fully describe the drought regime in this region. This need is particularly evident and urgent for SA countries for which there is a greater lack of more and better information about this natural disaster.
3.2. Literature review
From this section, the statistics presented, unless otherwise indicated, will be related to the 41 articles and book chapters selected for the literature review.
3.2.1. Drought factors
About half (21 in 41, 49%) of the documents included in the literature review studied drought factors or drivers in SA (Table 4). It is important to highlight that each document can study/discuss more than one factor. The document analysis revealed that the most important drought drivers in SA are (i) Ocean-Atmosphere interactions with 61% of the total number of studies included, comprising El Niño Southern Oscillation (ENSO), other Ocean-Atmosphere interaction events, namely between the Indian and/or Atlantic Ocean and the Atmosphere, SST anomalies, (ii) anthropic influence, including fires, gas emissions, and global warming (15%), (iii) heat waves (5%) and (vi) lack of preparation and follow-up (1%), which are important factors of the magnitude of the drought impacts.
The results of the literature review about the drought factors (Table 4) point to ENSO as the main driver of the most severe drought events and source of climate variability and predictability in the SA region [45]. ENSO plays a crucial role in defining drought in SA, associated with more than 66% of the severe droughts that occurred in the region e.g., [45,46,47,48,49,50,51,52]. For example, 8 of the 12 most severe droughts at 6– and 24–months in the 1901 – 1999 period were also ENSO years [45].
ENSO is the combination of El Niño (EN) and Southern Oscillation (SO). El Niño is characterized by a positive and significant anomaly of SST in the equatorial Pacific Ocean near South America. The Southern Oscillation is an interannual fluctuation of atmospheric pressure at sea level over the Pacific Ocean, usually evaluated with the Southern Oscillation Index (SOI) which is a standardized index based on the sea level pressure (SLP) differences between Tahiti and Darwin, Australia [48,53,62].
ENSO is associated with a vast set of significant anomalies in different climatic elements (e.g., temperature, precipitation) and linked to the occurrence of extreme events and natural disasters (e.g., wildfires, droughts, floods) observed all over the world through a process usually called teleconnection. Teleconnections are relationships between atmospheric disturbances or the Ocean-Atmosphere interaction with the climate in distant regions of the globe. Usually (neutral or La Niña conditions), SST is characterized by lower values at the eastern edge and higher values at the western edge of the equatorial Pacific, while a Walker cell circulation is observed in the atmosphere. In this case, precipitation is particularly high over the western edge of the Pacific Ocean as a result of convection promoted by strong heating and evaporation in that region [45,50,53,55].
Under El Niño conditions, an inversion of the SST pattern is observed, an Eastward shift of the Walker cell and, consequently, of the region of high precipitation. The large-scale heating (El Niño) or cooling (La Niña) of the equatorial Pacific SST affects lower tropospheric pressure fields and alters the Walker circulation which in turn affects the transport of moisture causing excess or deficit of precipitation in different regions [50]. These climate anomalies also include variability within the Indian and Atlantic Oceans [50]. El Niño years are associated with generalized dry conditions during summer, being stronger in the south-eastern part of SA, while La Niña years are more favourable to rainy conditions or high precipitation in many regions of the globe [50,62]. Additionally, anthropogenic climate change will contribute substantially to a significant increase in the severity and frequency of droughts in SA as anthropogenic warming will significantly contribute to the increase of the El Niño events and increase the likelihood of changing drought characteristics in the region [29,59,60].
Events similar to El Niño are also observed in the South Atlantic coasts of Angola and Namibia where an event called Benguela Niños is usually caused by specific wind stress events in the equatorial Atlantic Ocean which triggers the occurrence of warm and extreme events in the region [50]. Benguela Niños are associated with floods in Angola and Namibia, heavy precipitation events in the arid Namib desert as well as frequent droughts in the semi-arid region of SA, namely in the Benguela region of Angola [50].
SST/Ocean-Atmosphere interactions are not the only driver of drought in SA, as 20% of the studies point also to other factors [33,52,53,55,58,61]. Drought is caused by below-normal rainfall but also by changes in the hydrological year, i.e., delay of the beginning or anticipation of the end of the rainy season [45]. For example, the severe drought in 2002 – 2003 was caused by a rainfall deficit during 2002 – 2003 and a delayed start of the rainy season in 2003 – 2004 [45].
Heat waves cannot be considered causes of drought, not least because of their usual shorter duration. While heat waves last from a few days to a few weeks, droughts can last for several years [59,62]. Drought favours the occurrence of heat waves by reducing soil moisture and, consequently, its ability to absorb energy. On the other hand, heat waves intensify droughts by promoting additional evaporation of soils and living beings and can promote short droughts, from a few days to 2 months, in SA [59,61].
3.2.2. Drought indices
Of the total number of studies used in the systematic review, 30 (73%) documents used indices (Table 5), namely 25 (61%) used drought indices, 8 (34%) vegetation indices and 7 (22%) climate indices. The most used indices were the SPI (32%) and the SPEI (29%), followed by the Standardized Runoff Index (10%), ENSO (10%), VCI (7%), NDVI (7%) and Southern Oscillation Index (7%).
Although less frequently, other indices were also used in the documents selected for the literature review, namely: Base Flow Index [63]; Leaf Area Index [64,65]; Standardized Soil Moisture Index [24,52]; Antarctic Oscillation; Indian Ocean Dipole; North Atlantic Oscillation; Quasi-Biennial Oscillation; Tropical North Atlantic; Tropical South Atlantic; Sunspot Count [48]; Soil Moisture Deficit Index; Evapotranspiration Deficit Index; Root Stress Anomaly Index; Groundwater Resource Index [66]; Southern African Rainfall Index [52]; Drought Excess Probability Index [43]; and PDSI. Although the PDSI is usually considered a good and globally used index, only one study included in the literature review used this index to study drought in SA [15,16].
A total of 15 (37%) documents used more than one index, which suggests that one single index may not be able to capture all aspects of the drought regime [49,63,66]. Some studies recommend the use of more than one type of index to study drought [24,44,65,73].
It is important to assess the use of drought indices as these time series/fields are used by researchers to determine drought descriptors (frequency, duration, severity, etc.) at different time and space scales. These indices aim to assess the local water balance and can be computed based on different climate, soil and vegetation data. This approach allows historical climatological assessment of the drought regime, including the spatial and temporal distributions of the descriptors, as well as the monitoring of drought at shorter time scales. Knowledge of the spatial and temporal variabilities (intra and interannual) of drought regime descriptors is essential for a diverse audience and supports political decisions and drought management, including risk assessment and mapping and early warning systems [4,44,45].
3.2.3. Other drought assessment methodologies
The literature review includes 11 (27%) studies that did not use drought, climate or vegetation indices, but adopted other methodologies to study the drought in SA, including: (i) historical climatological analysis, such as correlation and anomaly methods [43,49,57,73,74,75] (ii) mathematical/statistical methods and models, as Wavelet analysis [48], maximum value composite technique and Mann-Kendal Tau correlation coefficient [56], Run – sum method [73], linear regression models and non-linear methods [29,46], and extreme value theory [55]; (iii) management tools [24,69,76]; and, (iv) atmospheric and hydrological physical models, including the use of global hydrological models and simulations [24,59,60,64,66,77], regional circulation models [33,67], global circulation models [60,78] or their simulations to estimate drought projections for future climate scenarios, such as the Phase 3 (CMIP3) and Phase 5 (CMIP5) Coupled Model Intercomparison Project [59,61].
The documents that describe studies that did not use indices and did not intend to study the drought regime in SA focused on the study of factors or impacts of drought, namely in biomes, watersheds, diseases, and food security, as well as case studies of specific droughts identified and characterized in previous studies e.g., [51,58,60,74,75,79].
3.2.4. Drought descriptors
The documents included in the literature review describe studies on meteorological, hydrological and agricultural droughts. Only one document describes a drought study from a 1-month to 24-month scale, every 3 months [65]. Additionally, this study focused on the impacts of drought on vegetation in biomes in particular. We identified 10 (24%) studies assessing the spatial distribution e.g., [45,46,55,56,65,79], 8 (20%) evaluated the intra-annual variability e.g., [45,46,53,57,66] and 17 (42%) estimated the interannual variability of drought descriptors e.g., [33,46,48,52,56,65,77]. We also found that 16 (39%) studies assessed the frequency of drought [24,45,59,66,71,79]. It was possible to identify in the documents that the assessed drought classes were severe/extreme drought with 14 (34%) studies [44,45,55,65,71] and 17% for severe/moderate drought [24,33,46,48,57]. However, none of the documents reports a complete study of the drought regime or the spatial and temporal distribution of all drought descriptors. For example, only 5 documents mention the drought duration, but in specific types of drought, study areas or drought events [66,71,77,79].
3.2.5. Current drought regime
Number/frequency
The analysed documents provide information on the number or frequency of droughts in SA. The values vary with the period and area of analysis. Some studies suggest an average frequency of one drought every 3 to 5 years, in the period from 1980 to 2007 [69,75,78]. In a study that investigate the response of LAI to drought in SA, the authors analysed the drought in the period 1982 – 2011 and concluded an average number of 58. Similar number of events (ranging from 41 to 71) of droughts were estimated at all scales (from 1 to 24 months), although a relatively higher frequency in the second decade (1992 – 2001) [65]. Results for specific countries are relatively different. In Zimbabwe, during the 1901 – 2000) period there were 7 extreme, 3 severe, 9 moderate and 12 mild droughts [53]. Meteorological droughts were more frequent in the Upper Kafue watershed compared to hydrological and agricultural droughts from 1984 to 2013 [24]. In the study that developed the Blended Drought Index (BDI), which is an integrated tool for estimating the impacts of meteorological and agricultural drought as a climate-induced hazard in the semi-arid Cuvelai-Basin of Angola and Namibia [44], the SPI, SPEI, SSI and VCI indices were used and assessed. The obtained results depict different spatial patterns of drought frequency for each index. The frequency of occurrence is higher in the southeast when using SPI and SPEI, in the southwest for VCI, and in central/north for SSI.
Some studies report trends in the number/frequency of droughts, with the highest values occurring in the more recent decades [56]. Authors report a significant increase in the frequency of drought on a 24–month scale since the 1970s [45] and a higher frequency of droughts related to El Niño events [49]. For example, from the 1970s to 2016, the frequency of decadal droughts at 3– to 12–months scale increased in SA [48] and on average, they occurred in conjunction with heatwave events [59]. Although, most of the studies reviewed do not cover the whole study area (SA), but only part of it, and generally focus on South Africa and never on Lesotho, Eswatini, Malawi and Botswana.
Duration
The literature revealed that the drought of the early 1990s was the longest even when compared to the extreme drought event of 2015 – 2016 [49,66,71]. The extreme agricultural drought of 1991 only ended in early 1993, but the effects of the hydrological drought only ended in late 1993 [66]. In South Africa, the average duration of agricultural and hydrological droughts was longer when compared to meteorological droughts in the Upper Kafue Watershed/SA from 1984 to 2013 [24]. In the Berg River alone, in the Mediterranean part of South Africa, about 40% of the length of dry days occurred in the rainy season (December, January and February: DJF) of 1994 – 1995 and 2015 to 2017 [77].
There are also some studies reporting trends in drought duration. For example, in the 1961 – 2016 period, the occurrence of long-lasting droughts varied from 20% to 68% in Zambia and the duration of the rainy season tends to decrease since 1991, with a delay of (3 to 7) weeks from the beginning of the rainy season or which brings the onset of the dry season forward by (1 to 7) weeks [79]. The lack of information on the duration of the drought suggests the need for further studies focusing this feature/descriptor of the drought.
Severity
The most intense drought in the 116-year historical record (from 1900 to 2016), which occurred in the period between October 2015 and March 2016 is also considered to be the most meteorologically severe since the 1980s [29,45,46,53,55,56,64,71,77]. The years 2001 – 2002, 2002 – 2003 and 2003 – 2004 experienced severe droughts at various scales [45,78]. The six strongest droughts on the 2-year scale occurred during the last two decades and increased in severity and extent [45,65]. Since 1970 there has been an increase in the severity of severe droughts in the SA river basins (Orange, Limpopo, Zambezi and Okavango) [33,66,69]. From 1980 to 2010, were also recorded mild droughts in the southwest and northwest of the Cuvelai River basin, in Angola and Namibia [44]. Drought impacts on the biomes and vegetation of SA were recorded over the 20 years from 1998 to 2017 [53,54,65,76] and, these impacts, proved to be severe in the semi-desert areas of Angola, South Africa, Mozambique and Zambia, exacerbating plant stress [57] and increased aridity by 11% between 1980 and 2007 [48]. The literature does present some data on drought severity but never at all timescales rarely for the entire SA.
Spatial extension
The included studies describe a considerable interdecadal variability in the spatial extent of drought since the early 20th century in Zimbabwe, Lesotho, South Africa, Eswatini, Mozambique, Southern Zambia, Botswana, Namibia and part of Angola [45,55]. On the other hand, since 1970 there has been an increase in the extension of droughts in the major river basins of SA, specifically Orange, Limpopo, Zambezi, and Okavango [33,66], in the river basins of the Incomati that crosses Eswatini, South Africa and Mozambique [71], in the Cuvelai watershed, in Angola and Namibia since 1980 [44]. There is also an increase in the drought-affected area, since 1903, in the biomes of the southwestern part of SA, especially rangelands and crops [46,56,65]. Based on the studies included in the review it was not possible to assess the total extent of the area affected by all types of drought in all countries of SA so this knowledge gap opens up new future challenges for the complete study of the spatial extent of drought in SA.
Lastly, in the previously mentioned study that developed the BDI which uses a copula function to combine the SPI, SPEI, SSI and VCI indices, were used to assess drought frequency, duration, severity and, therefore, the spatial extent of the drought-affected area in the semi-arid Cuvelai-Basin of Angola and Namibia [44]. Preliminary results, obtained with each of the drought indices results, depict different spatial patterns for each index and drought descriptor which suggest that the evaluation of the drought regime depends on the index used to assess drought and may require the combination of more than one drought index.
3.2.6. Drought impacts
The literature review identified 7 major types of drought impacts in SA: (i) scarcity of potable water, food insecurity, and hunger [29,33,75,78,43,44,51,55,56,58,60,64]; (ii) increases in malnutrition, morbidity and mortality [29,54,56,58,67,71]; (iii) loss of agricultural production [33,44,54,55,56,71,77]; (iv) reduction of industrial and hydroelectric energy production [33,60]; (v) pressure on the economy and promotion of emigration [33,58,75,77] (vi) regional humanitarian crisis [78] (vii) risk of groundwater drought [76]; and (viii) degradation of ecosystems [58,65,78,80]. Drought is indeed one of the natural hazards that affect various sectors in the SA, where many socioeconomic activities depend on rainfed agriculture [62,79].
The impacts of drought depend on its intensity, duration and preparedness. SA has been characterized by strong interannual precipitation variability [45] and drought is considered by many authors to be a regular and recurrent feature of the types of climate of the region, as recurrent droughts continue to impact rural livelihoods and degrade the climate environment [69]. For example, from 1900 to 2013 about 870 thousand people died and 414 million people were affected by drought in SA [78]. The extreme El Niño event of 2015 – 2016 caused a high rainfall deficit, which led to a major food crisis, severe hydroelectric power shortages, shortages of potable water, reduced harvests and livestock, conflicts and access to water [60]. The same El Niño event resulted in more than half a million cases of acute malnutrition in children, 3.2 million children with reduced availability of drinking water, and increased infant mortality of children under five years, especially with the worsening of the drought in Angola, Malawi, Mozambique, Namibia and Zambia [71]. Women's vulnerability to contracting diseases, generating public health crises including the human immunodeficiency virus is also promoted during drought events [29,43,55].
The impacts associated with droughts are evident and the expected population increase will increase the pressure on water resources for consumption and human activities, including farming production, energy, industrial and service sectors as well as natural ecosystems. For these reasons, it is necessary to deepen the scientific knowledge about the regime of drought in SA under current and future climate conditions.
3.2.7. Future drought regime
The drought projection studies in SA indicate that by 2050, air temperatures will be significantly higher and there will be a reduction in precipitation, which will lead to the worsening of drought descriptors/regime [54,58]. Future projections indicate changes in oceanic, atmospheric and climatic processes that will lead to an increase in temperature variability in the region, as well as a reduction in the amount of precipitation and duration of rainy seasons. Some of these studies also suggest a large increase in sudden droughts in semi-humid and semi-arid regions, which will reduce food production in these regions [59], while the dry areas will become even drier [78]. Projections from the CMIP3 suggest an increasing trend of droughts during the summer seasons, from December to February [61]. Increased global warming levels (GWL) will differentially intensify the frequency, severity and spatial extent of drought in different regions of SA [45,61,63,78] as well as in the watersheds of the main rivers (Orange, Limpopo, Zambezi and Okavango) of the region [24,33]. In an assessment of future groundwater drought risk in the Southern African Development Community (SADC countries), the authors compare the projections for future (2080 – 2099) and reference (1989 – 2008) periods [76] and conclude an average increase of 36.4% in population and of 18.5% in the area affected by very high groundwater drought risk [76]. Findings are even more impressive for SA-specific countries. For example, in the reference period, only three countries have more than 5% of the country area at very high groundwater drought risk (Malawi 9.8%, Lesotho 6.6% and Zimbabwe 5.3%) but the estimated increase in the area is greater than 40% in Zimbabwe (66.1%) Malawi (56%) and Mozambique (41.2%) [76]. Results for the population with very high groundwater drought risk are even more significant. In the reference period three countries have more than 30% of the population at risk (South Africa 37.5%, Malawi 31.9% and Zimbabwe 31.8%), but the projected increase is greater than 50% in Malawi (64.5%), Mozambique (63.5%) and Zimbabwe (53.9%) [76]. These projections of population and area increase in very high groundwater drought risk are particularly important, as they suggest, on the one hand, an important worsening of dry conditions in future climate conditions and, on the other hand, because they refer to hydrological drought imply increases, at least identical, in the risk of meteorological and agricultural droughts.
It is important to mention the limitations of the literature review results in the sense that, these results, depend on the selected and analysed documents. Although the research equation was defined in the most general way possible to achieve the main goal of evaluating the state of the art on the drought regime in SA. The inclusion and exclusion criteria were the most usual and adequate, and a large number of documents were excluded to avoid introducing bias. Although, some of these deleted documents report studies carried out some time ago (before 2000) and may not contain up-to-date information. More recently published documents that could eventually contain relevant information were also excluded.
Finally, we consider that this work may constitute an element of study for all researchers interested in starting to explore the drought regime, anywhere in the world and especially in SA. This is why the introduction provides a vast set of fundamental information about drought and section 4 is concerned with presenting and discussing the results of the literature review on the drought regime in SA.
4. Conclusions
The bibliographical research carried out in the Web of Science and Scopus databases allowed the general objective of identifying 154 documents on the drought regime in SA to be fulfilled. The application of the PRISMA2020 methodology, including the usual inclusion and exclusion criteria, suitable for the purpose, and aiming to minimize/eliminate the risk of bias, made it possible to reduce this list to 41 documents, published after the year 2000, on which the bibliographic review was carried out. Most of these documents addressed drought mainly in just a few countries, such as South Africa (41%), Mozambique (27%) and Zimbabwe (22%). Only 37% of the 41 documents describe studies carried out for the entire SA but mostly restricted to a drought event, one or two drought descriptors, some drought classes and time scales, impacts or the creation of monitoring tools.
The bibliographical review revealed that Ocean-Atmosphere interactions are the main factor of drought in SA, in particular, the ENSO is associated with more than 66% of the severe droughts that occurred in the region. Other factors such as anthropic influence (including fires, gas emissions and global warming) and heat waves were mentioned in 20% of the documents.
The systematic review revealed that 73% of the studies used drought, vegetation and climate indices, especially the SPI and SPEI, as well as atmospheric/climatic and hydrological models to characterize the drought regime. In general, the authors study only some of the drought descriptors (number/frequency, duration, severity, area affected by the drought) and the results vary according to the used methodology (e.g., drought index) and region of study. However, there is some unanimity as to the fact that the drought of the early 1990s was historically the longest and the drought of 2015 – 2016 the most meteorologically extreme.
The impacts of drought depend on its intensity, duration and preparedness of communities, but include scarcity of potable water, reduced agricultural and energy production, food insecurity, morbidity and mortality, socioeconomic pressure and degradation of natural ecosystems. For the future, the studies project a general worsening of the regime of all types of drought, the increase of the GWL will intensify the frequency, intensity and severity of the drought in different regions, including in the main river basins of the region.
Although some studies analyse some drought descriptors, with different methodologies, no document describes the complete characterization of the drought regime across the SA, namely, a detailed space-time analysis that includes the inter- and intra-annual distribution of the different types of drought on all time scales. This conclusion suggests and motivates the realization of studies that fill this knowledge gap, support water/drought monitoring and managers as well as support decision/policymakers.
Author Contributions
Conceptualization, M.G.P. and M.A.; methodology, M.G.P. and F.M.C.; software, F.M.C.; validation, F.M.C., M.A. and M.G.P.; formal analysis, F.M.C.; investigation, F.M.C. and M.G.P.; resources, M.G.P. and M.A.; data curation, F.M.C.; writing—original draft preparation, F.M.C.; writing—review and editing, M.G.P. and M.A.; visualization, F.M.C. and M.G.P.; supervision, M.G.P. and M.A.; project administration, M.G.P.; funding acquisition, M.G.P. All authors have read and agreed to the published version of the manuscript.
Funding
This work is supported by National Funds from FCT—Portuguese Foundation for Science and Technology, under the project UIDB/04033/2020.
Data Availability Statement
All data used in this study are freely accessible on the platforms of data providers, referred to in Section 2 and Section 3. The list of publications identified by the bibliographic search in Web of Science (WoS) and Scopus are platforms accessed with the link provided in Table 3 but can be provided by the corresponding author upon request.
Acknowledgments
We wish to thank Web of Science (WoS) and Scopus for providing access to the databases. Comments from the anonymous referees and the editor are also gratefully appreciated.
Conflicts of Interest
The authors declare no conflict of interest. The funders had no role in the design of the study; in the collection, analyses, or interpretation of data; in the writing of the manuscript; or in the decision to publish the results.
References
- IPCC Summary for Policymakers. In: Global Warming of 1.5°C. An IPCC Special Report on the Impacts of Global Warming of 1.5°C above Pre-Industrial Levels and Related Global Greenhouse Gas Emission Pathways, in the Context of Strengthening the Global Response To; Masson-Delmotte, V., Zhai, P., Pörtner, H.-O., Roberts, D., Skea, J., Shukla, P.R., Pirani, A., Moufouma-Okia, W., Péan, C., Pidcock, R., Connors, S., Science, J.B.R.M., Chen, Y., Zhou, X., Gomis, M.I., Lonnoy, E., Maycock, T., Tignor, M., Waterfield, T., Eds.; Cambridge University Press, Cambridge, UK and New York, NY, USA, pp. 3-24, 2018; ISBN 9781009157940.
- Lloyd-Hughes, B. The Impracticality of a Universal Drought Definition. Theor. Appl. Climatol. 2014, 117, 607–611. [Google Scholar] [CrossRef]
- Herrera-Estrada, J.E.; Satoh, Y.; Sheffield, J. Spatiotemporal Dynamics of Global Drought. Geophys. Res. Lett. 2017, 2254–2263. [Google Scholar] [CrossRef]
- World Meteorological Organization (WMO) and Global Water Partnership (GWP). Handbook of Drought Indicators and Indices. Manag. Tools Guidel. Ser. 2. Geneva 2016, 1, 1068–1069. [CrossRef]
- AghaKouchak, A.; Mirchi, A.; Madani, K.; Di Baldassarre, G.; Nazemi, A.; Alborzi, A.; Anjileli, H.; Azarderakhsh, M.; Chiang, F.; Hassanzadeh, E.; et al. Anthropogenic Drought: Definition, Challenges, and Opportunities. Rev. Geophys. 2021, 59. [Google Scholar] [CrossRef]
- Parente, J.; Amraoui, M.; Menezes, I.; Pereira, M.G. Portugal : Current Regime, Comparison of Indices and Impacts on Extreme Wild Fi Res. Sci. Total Environ. 2019, 685, 150–173. [Google Scholar] [CrossRef]
- Schwarz, M.; Landmann, T.; Cornish, N.; Wetzel, K.F.; Siebert, S.; Franke, J. A Spatially Transferable Drought Hazard and Drought Risk Modeling Approach Based on Remote Sensing Data. Remote Sens. 2020, 12. [Google Scholar] [CrossRef]
- Blauhut, V. The Triple Complexity of Drought Risk Analysis and Its Visualisation via Mapping: A Review across Scales and Sectors. Earth-Science Rev. 2020, 210, 103345. [Google Scholar] [CrossRef]
- Mishra, A.K.; Singh, V.P. A Review of Drought Concepts. J. Hydrol. 2010, 391, 202–216. [Google Scholar] [CrossRef]
- Rhee, J.; Cho, J. Future Changes in Drought Characteristics: Regional Analysis for South Korea under CMIP5 Projections. J. Hydrometeorol. 2016, 17, 437–451. [Google Scholar] [CrossRef]
- Van Loon, A.F. Hydrological Drought Explained. Wiley Interdiscip. Rev. Water 2015, 2, 359–392. [Google Scholar] [CrossRef]
- Carroll, C.J.W.; Slette, I.J.; Griffin-Nolan, R.J.; Baur, L.E.; Hoffman, A.M.; Denton, E.M.; Gray, J.E.; Post, A.K.; Johnston, M.K.; Yu, Q.; et al. Is a Drought a Drought in Grasslands? Productivity Responses to Different Types of Drought. Oecologia 2021, 197, 1017–1026. [Google Scholar] [CrossRef]
- IPCC Managing the Risks of Extreme Events and Disasters to Advance Climate Change Adaptation; Field, C.B., Barros, V., Stocker, T.F., Dahe, Q., Dokken, D.J., Ebi, K.L., Mastrandrea, M.D., Pauline, K.J.M., Plattner, G.-K., Allen, S.K., Tignor, M., Midgle, P.M., Eds.; Cambridge University Press, Cambridge, UK, and New York, NY, USA, 582 pp., 2012; Vol. 9781107025; ISBN 9781139177245.
- Mehran, A.; Mazdiyasni, O.; Aghakouchak, A. A Hybrid Framework for Assessing Socioeconomic Drought: Linking Climate Variability, Local Resilience, and Demand. J. Geophisycal Res. Atmos. 2015, 175, 238. [Google Scholar] [CrossRef]
- Hoffmann, D.; Gallant, A.J.E.; Arblaster, J.M. Uncertainties in Drought From Index and Data Selection. J. Geophys. Res. Atmos. 2020, 1–21. [Google Scholar] [CrossRef]
- Paulo, A.A.; Rosa, R.D.; Pereira, L.S. Climate Trends and Behaviour of Drought Indices Based on Precipitation and Evapotranspiration in Portugal. Nat. Hazards Earth Syst. Sci. 2012, 12, 1481–1491. [Google Scholar] [CrossRef]
- Ramirez, S.G.; Hales, R.C.; Williams, G.P.; Jones, N.L. Extending SC-PDSI-PM with Neural Network Regression Using GLDAS Data and Permutation Feature Importance. Environ. Model. Softw. 2022, 157, 105475. [Google Scholar] [CrossRef]
- DAI, A. Global Palmer Drought Severity Index (PDSI). Available online: https://rda.ucar.edu/datasets/ds299.0/citation/ (accessed on 14 April 2023).
- Xu, Y.; Wang, L.; Ross, K.W.; Liu, C.; Berry, K. Standardized Soil Moisture Index for Drought Monitoring Based on Soil Moisture Active Passive Observations and 36 Years of North American Land Data Assimilation System Data: A Case Study in the Southeast United States. Remote Sens. 2018, 10. [Google Scholar] [CrossRef] [PubMed]
- Ali, Z.; Hussain, I.; Faisal, M.; Almanjahie, I.M.; Ahmad, I.; Khan, D.M.; Grzegorczyk, M.; Qamar, S. A Probabilistic Weighted Joint Aggregative Drought Index (PWJADI) Criterion for Drought Monitoring Systems. Tellus, Ser. A Dyn. Meteorol. Oceanogr. 2019, 71, 1–21. [Google Scholar] [CrossRef]
- Zhao, H.; Gao, G.; An, W.; Zou, X.; Li, H.; Hou, M. Timescale Differences between SC-PDSI and SPEI for Drought Monitoring in China. Phys. Chem. Earth 2017, 102, 48–58. [Google Scholar] [CrossRef]
- Carlson, T.N.; Ripley, D.A. On the Relation between NDVI, Fractional Vegetation Cover, and Leaf Area Index. Remote Sens. Environ. 1997, 62, 241–252. [Google Scholar] [CrossRef]
- Kamble, D.B.; Gautam, S.; Bisht, H.; Rawat, S.; Kundu, A. Drought Assessment for Kharif Rice Using Standardized Precipitation Index (SPI) and Vegetation Condition Index (VCI). J. Agrometeorol. 2019, 21, 182–187. [Google Scholar] [CrossRef]
- Lweendo, M.K.; Lu, B.; Wang, M.; Zhang, H.; Xu, W. Characterization of Droughts in Humid Subtropical Region, Upper Kafue River Basin (Southern Africa). Water (Switzerland) 2017, 9, 242. [Google Scholar] [CrossRef]
- Paulo, A.A.; Pereira, L.S.; Matias, P.G. Analysis of Local and Regional Droughts in Southern Portugal Using the Theory of Runs and the Standardised Precipitation Index. 2003, 55–78. [CrossRef]
- Vicente-Serrano, S.M. Differences in Spatial Patterns of Drought on Different Time Scales: An Analysis of the Iberian Peninsula. Water Resour. Manag. 2006, 20, 37–60. [Google Scholar] [CrossRef]
- Svoboda, M.; Hayes, M.; Wood, D. Standardized Precipitation Index User Guide. World Meteorol. Organ. Wather.Climate.Water, WMO-No.1090. Water, WMO-No.1090, 2012; 63, 197–200. [Google Scholar]
- Singh, O.; Saini, D.; Bhardwaj, P. Characterization of Meteorological Drought over a Dryland Ecosystem in North Western India; Springer Netherlands, 2021; Vol. 109; ISBN 0123456789.
- Khan, M.Z.K.; Rahman, A.; Rahman, M.A.; Renzaho, A.M.N. Impact of Droughts on Child Mortality: A Case Study in Southern African Countries. Nat. Hazards 2021, 108, 2211–2224. [Google Scholar] [CrossRef]
- Wilhite, D.A. Drought as a Natural Hazard: Concepts and Definitions. Droughts 2021, 33–33. [Google Scholar] [CrossRef]
- Nam, W.H.; Hayes, M.J.; Svoboda, M.D.; Tadesse, T.; Wilhite, D.A. Drought Hazard Assessment in the Context of Climate Change for South Korea. Agric. Water Manag. 2015, 160, 106–117. [Google Scholar] [CrossRef]
- World Meteorological Organization (WMO) Atlas of Mortality and Economic Losses From Weather, Climate and Water Extremes (1970-2019); Weather Climate Water, 2021; ISBN 9789263112675.
- Abiodun, B.J.; Makhanya, N.; Abatan, A.; Oguntunde, P.G. Future Projection of Droughts over Major River Basins in Southern Africa at Specific Global Warming Levels. 2019. [CrossRef]
- Fasihi, S.; Lim, W.Z.; Wu, W.; Proverbs, D. Systematic Review of Flood and Drought Literature Based on Science Mapping and Content Analysis. Water (Switzerland) 2021, 13. [Google Scholar] [CrossRef]
- Gautier, D.; Denis, D.; Locatelli, B. Impacts of Drought and Responses of Rural Populations in West Africa: A Systematic Review. Wiley Interdiscip. Rev. Clim. Chang. 2016, 7, 666–681. [Google Scholar] [CrossRef]
- Hasan, H.H.; Fatin, S.; Razali, M.; Muhammad, N.S.; Ahmad, A. Research Trends of Hydrological Drought : 2019, 1–19.
- Kamara, J.K.; Sahle, B.W.; Agho, K.E.; Renzaho, A.M.N. Governments’ Policy Response to Drought in Eswatini and Lesotho: A Systematic Review of the Characteristics, Comprehensiveness, and Quality of Existing Policies to Improve Community Resilience to Drought Hazards. Discret. Dyn. Nat. Soc. 2020, 2020. [Google Scholar] [CrossRef]
- Lieber, M.; Chin-Hong, P.; Kelly, K.; Dandu, M.; Weiser, S.D. A Systematic Review and Meta-Analysis Assessing the Impact of Droughts, Flooding, and Climate Variability on Malnutrition. Glob. Public Health 2022, 17, 68–82. [Google Scholar] [CrossRef]
- Ngcamu, B.S.; Chari, F. Drought Influences on Food Insecurity in Africa: A Systematic Literature Review. Int. J. Environ. Res. Public Health 2020, 17, 1–17. [Google Scholar] [CrossRef]
- Seka, A.M.; Zhang, J.; Prodhan, F.A.; Ayele, G.T.; Finsa, M.M.; Sharma, T.P.P.; Melesse, A.M. Hydrological Drought Impacts on Water Storage Variations: A Focus on the Role of Vegetation Changes in the East Africa Region. A Systematic Review. Environ. Sci. Pollut. Res. 2022, 29, 80237–80256. [Google Scholar] [CrossRef]
- Coughlan de Perez, E.; Fuentes, I.; Jack, C.; Kruczkiewicz, A.; Pinto, I.; Stephens, E. Different Types of Drought under Climate Change or Geoengineering: Systematic Review of Societal Implications. Front. Clim. 2022, 4. [Google Scholar] [CrossRef]
- Page, M.J.; McKenzie, J.E.; Bossuyt, P.M.; Boutron, I.; Hoffmann, T.C.; Mulrow, C.D.; Shamseer, L.; Tetzlaff, J.M.; Akl, E.A.; Brennan, S.E.; et al. The PRISMA 2020 Statement: An Updated Guideline for Reporting Systematic Reviews. BMJ 2021, 372. [Google Scholar] [CrossRef]
- Limones, N.; Marzo-artigas, J.; Wijnen, M. Evaluating Drought Risk in Data-Scarce Contexts. The Case of Southern Angola. 2020. [CrossRef]
- Luetkemeier, R.; Stein, L.; Drees, L.; Liehr, S. Blended Drought Index: Integrated Drought Hazard Assessment in the Cuvelai-Basin. Climate 2017, 5. [Google Scholar] [CrossRef]
- Rouault, M.; Richard, Y. Intensity and Spatial Extent of Droughts in Southern Africa. Geophys. Res. Lett. 2005, 32, 2–5. [Google Scholar] [CrossRef]
- Marumbwa, F.M.; Cho, M.A.; Chirwa, P.W. Geospatial Analysis of Meteorological Drought Impact on Southern Africa Biomes. Int. J. Remote Sens. 2021, 42, 2155–2173. [Google Scholar] [CrossRef]
- Ambeje, P.G. Regional Drought Monitoring Centres – The Case of Eastern and Southern Africa. In Early Warning Systems for Drought Preparedness and Drought Management; Wilhite, D.A., Sivakumar, M.V.K., Wood, D.A., Ambenje, P.G., Eds.; Proceedings of an Expert Group Meeting held in Lisbon, Portugal, 5-7 September 2000.; Geneva, Switzerland: World Meteorological Organization, 2000; p. 147. ISBN 2013206534. [Google Scholar]
- Ujeneza, E.L.; Abiodun, B.J. Drought Regimes in Southern Africa and How Well GCMs Simulate Them. 2014, 1595–1609. [CrossRef]
- Manatsa, D.; Mushore, T.; Lenouo, A. Improved Predictability of Droughts over Southern Africa Using the Standardized Precipitation Evapotranspiration Index and ENSO. Theor. Appl. Climatol. 2017, 127, 259–274. [Google Scholar] [CrossRef]
- Gore, M.; Abiodun, B.J.; Kucharski, F. Understanding the Influence of ENSO Patterns on Drought over Southern Africa Using SPEEDY. Clim. Dyn. 2020, 54, 307–327. [Google Scholar] [CrossRef]
- Milgroom, J.; Giller, K.E. Courting the Rain: Rethinking Seasonality and Adaptation to Recurrent Drought in Semi-Arid Southern Africa. Agric. Syst. 2013, 118, 91–104. [Google Scholar] [CrossRef]
- Richard, Y.; Fauchereau, N.; Poccard, I.; Rouault, M.; Trzaska, S. 20th Century Droughts in Southern Africa: Spatial and Temporal Variability, Teleconnections with Oceanic and Atmospheric Conditions. Int. J. Climatol. 2001, 21, 873–885. [Google Scholar] [CrossRef]
- Manatsa, D.; Chingombe, W.; Matsikwa, H.; Matarira, C.H. The Superior Influence of Darwin Sea Level Pressure Anomalies over ENSO as a Simple Drought Predictor for Southern Africa. Theor. Appl. Climatol. 2008, 92, 1–14. [Google Scholar] [CrossRef]
- Funk, C.; Davenport, F.; Harrison, L.; Magadzire, T.; Galu, G.; Artan, G.A.; Shukla, S.; Korecha, D.; Indeje, M.; Pomposi, C.; et al. Anthropogenic Enhancement of Moderate-to-Strong El Niño Events Likely Contributed to Drought and Poor Harvests in Southern Africa during 2016. Bull. Am. Meteorol. Soc. 2018, 99, S91–S96. [Google Scholar] [CrossRef]
- Blamey, R.C.; Kolusu, S.R.; Mahlalela, P.; Todd, M.C.; Reason, C.J.C. The Role of Regional Circulation Features in Regulating El Niño Climate Impacts over Southern Africa: A Comparison of the 2015/2016 Drought with Previous Events. Int. J. Climatol. 2018, 38, 4276–4295. [Google Scholar] [CrossRef]
- Marumbwa, F.M.; Cho, M.A.; Chirwa, P.W. An Assessment of Remote Sensing-Based Drought Index over Different Land Cover Types in Southern Africa. Int. J. Remote Sens. 2020, 41, 1–15. [Google Scholar] [CrossRef]
- Lawal, S.; Lennard, C.; Jack, C.; Wolski, P.; Hewitson, B. The Observed and Model-Simulated Response of Southern African Vegetation to Drought. Agric. For. Meteorol. 2019, 279, 107698. [Google Scholar] [CrossRef]
- Zeidler, J.; Chunga, R. Drought Hazard and Land Management in the Drylands of Southern Africa. In Climate and Land Degradation; K.Sivakumar·, M. V., NdegwaNdiang’ui, Eds.; Tanzania Meteorological Agency (TMA) United NationsConventiontoCombat Desertification (UNCCD) World Meteorological Organization (WMO), 2007; p. 309 ISBN 9783540724377.
- Yuan, X.; Wang, L.; Wood, E.F. Anthropogenic Intensification of Southern African Flash Droughts as Exemplified by the 2015/16 Season. Bull. Am. Meteorol. Soc. 2018, 99, S86–S90. [Google Scholar] [CrossRef]
- Funk, C.; Harrison, L.; Shukla, S.; Hoell, A.; Korecha, D.; Magadzire, T.; Husak, G.; Galu, G. Assessing the Contributions of Local and East Pacific Warming to the 2015 Droughts in Ethiopia and Southern Africa. in Explaining Extreme Events of 2015; Herring, S.C., Hoell, A., Hoerling, M.P., Kossin, J.P., III, C.J.S., Stott, P.A., Eds.; Explaining extreme events of 2015 from a climate perspective. Special Supplement to the Bulletin of the American Meteorological Society/Vol. 97, No. 12, (pp. S75-S80)., 2016; p. 75.
- Lyon, B. Southern Africa Summer Drought and Heat Waves: Observations and Coupled Model Behavior. J. Clim. 2009, 22, 6033–6046. [Google Scholar] [CrossRef]
- Meque, A.; Abiodun, B.J. Simulating the Link between ENSO and Summer Drought in Southern Africa Using Regional Climate Models. Clim. Dyn. 2015, 44, 1881–1900. [Google Scholar] [CrossRef]
- Tate, E.L.; Freeman, S.N. Three Modelling Approaches for Seasonal Streamflow Droughts in Southern Africa: The Use of Censored Data. Hydrol. Sci. J. 2000, 45, 27–42. [Google Scholar] [CrossRef]
- Shukla, S.; R. Arsenault, K.; Hazra, A.; Peters-Lidard, C.; D. Koster, R.; Davenport, F.; Magadzire, T.; Funk, C.; Kumar, S.; McNally, A.; et al. Improving Early Warning of Drought-Driven Food Insecurity in Southern Africa Using Operational Hydrological Monitoring and Forecasting Products. Nat. Hazards Earth Syst. Sci. 2020, 20, 1187–1201. [CrossRef]
- Lawal, S.; Sitch, S.; Lombardozzi, D.; Nabel, J.E.M.S.; Wey, H.W.; Friedlingstein, P.; Tian, H.; Hewitson, B. Investigating the Response of Leaf Area Index to Droughts in Southern African Vegetation Using Observations and Model Simulations. Hydrol. Earth Syst. Sci. 2022, 26, 2045–2071. [Google Scholar] [CrossRef]
- Trambauer, P.; Maskey, S.; Werner, M.; Pappenberger, F.; Van Beek, L.P.H.; Uhlenbrook, S. Identification and Simulation of Space-Time Variability of Past Hydrological Drought Events in the Limpopo River Basin, Southern Africa. Hydrol. Earth Syst. Sci. 2014, 18, 2925–2942. [Google Scholar] [CrossRef]
- Rusca, M.; Savelli, E.; Di Baldassarre, G.; Biza, A.; Messori, G. Unprecedented Droughts Are Expected to Exacerbate Urban Inequalities in Southern Africa. Nat. Clim. Chang. 2023, 13, 98–105. [Google Scholar] [CrossRef]
- Tesfaye, K.; Sonder, K.; Cairns, J.; Magorokosho, C.; Tarekegn, A.; Kassie, G.T.; Getaneh, F.; Abdoulaye, T.; Abate, T.; Erenstein, O. Targeting Drought-Tolerant Maize Varieties in Southern Africa: A Geospatial Crop Modeling Approach Using Big Data. Int. Food Agribus. Manag. Rev. 2016, 19, 75–92. [Google Scholar]
- Trambauer, P.; Werner, M.; Winsemius, H.C.; Maskey, S.; Dutra, E.; Uhlenbrook, S. Hydrological Drought Forecasting and Skill Assessment for the Limpopo River Basin, Southern Africa. Hydrol. Earth Syst. Sci. 2015, 19, 1695–1711. [Google Scholar] [CrossRef]
- Chisadza, B.; Tumbare, M.J.; Nyabeze, W.R.; Nhapi, I. Linkages between Local Knowledge Drought Forecasting Indicators and Scientific Drought Forecasting Parameters in the Limpopo River Basin in Southern Africa. Int. J. Disaster Risk Reduct. 2015, 12, 226–233. [Google Scholar] [CrossRef]
- Sifundza, L.; Zaag, P. van der; Masih, I. Evaluation of the Responses of Institutions and Actors to the 2015 / 2016 El Niño Drought in the Komati Catchment in Southern Africa : Lessons to Support Future Drought Management. 2019, 45, 547–559. [Google Scholar] [CrossRef]
- Nangombe, S.; Zhou, T.; Zhang, L.; Zhang, W. Attribution of the 2018 October–December drought over South Southern Africa. In Explaining Extreme Events of 2018 from a Climate Perspective; Herring, S.C., Christidis, N., Hoell, A., Hoerling, M.P., Stott, P.A., King, A., Knutson, T., Nielsen-Gammon, J., Special, F.O., Eds.; Bulletin of the American Meteorological Society, 2020; Vol. 101, p. 135.
- Meigh, J.; Tate, E.; McCartney, M. Methods for Identifying and Monitoring River Flow Drought in Southern Africa. IAHS-AISH Publ. 2002, 181–188.
- Nash, D.J.; Klein, J.; Endfield, G.H.; Pribyl, K.; Adamson, G.C.D.; Grab, S.W. Narratives of Nineteenth Century Drought in Southern Africa in Different Historical Source Types. Clim. Change 2019, 152, 467–485. [Google Scholar] [CrossRef]
- Vogel, C.; Koch, I.; Van Zyl, K. “A Persistent Truth”-Reflections on Drought Risk Management in Southern Africa. Weather. Clim. Soc. 2010, 2, 9–22. [Google Scholar] [CrossRef]
- Villholth, K.G.; Tøttrup, C.; Stendel, M.; Maherry, A. Integrated Mapping of Groundwater Drought Risk in the Southern African Development Community (SADC) Region. Hydrogeol. J. 2013, 21, 863–885. [Google Scholar] [CrossRef]
- Watson, A.; Miller, J.; Künne, A.; Kralisch, S. Using Soil-Moisture Drought Indices to Evaluate Key Indicators of Agricultural Drought in Semi-Arid Mediterranean Southern Africa. Sci. Total Environ. 2022, 812. [Google Scholar] [CrossRef]
- Nhamo, L.; Mabhaudhi, T.; Modi, A.T. Preparedness or Repeated Short-Term Relief Aid? Building Drought Resilience through Early Warning in Southern Africa. Water SA 2019, 45, 75–85. [Google Scholar] [CrossRef]
- Makondo, C.C.; Thomas, D.S.G. Seasonal and Intra-Seasonal Rainfall and Drought Characteristics as Indicators of Climate Change and Variability in Southern Africa: A Focus on Kabwe and Livingstone in Zambia. Theor. Appl. Climatol. 2020, 140, 271–284. [Google Scholar] [CrossRef]
- Hope, A.; Fouad, G.; Granovskaya, Y. Evaluating Drought Response of Southern Cape Indigenous Forests, South Africa, Using MODIS Data. Int. J. Remote Sens. 2014, 35, 4852–4864. [Google Scholar] [CrossRef]
Figure 2.
Several documents were identified by literature search (1987 – 2023) and selected/included in the review (2000 – 2023).
Figure 2.
Several documents were identified by literature search (1987 – 2023) and selected/included in the review (2000 – 2023).
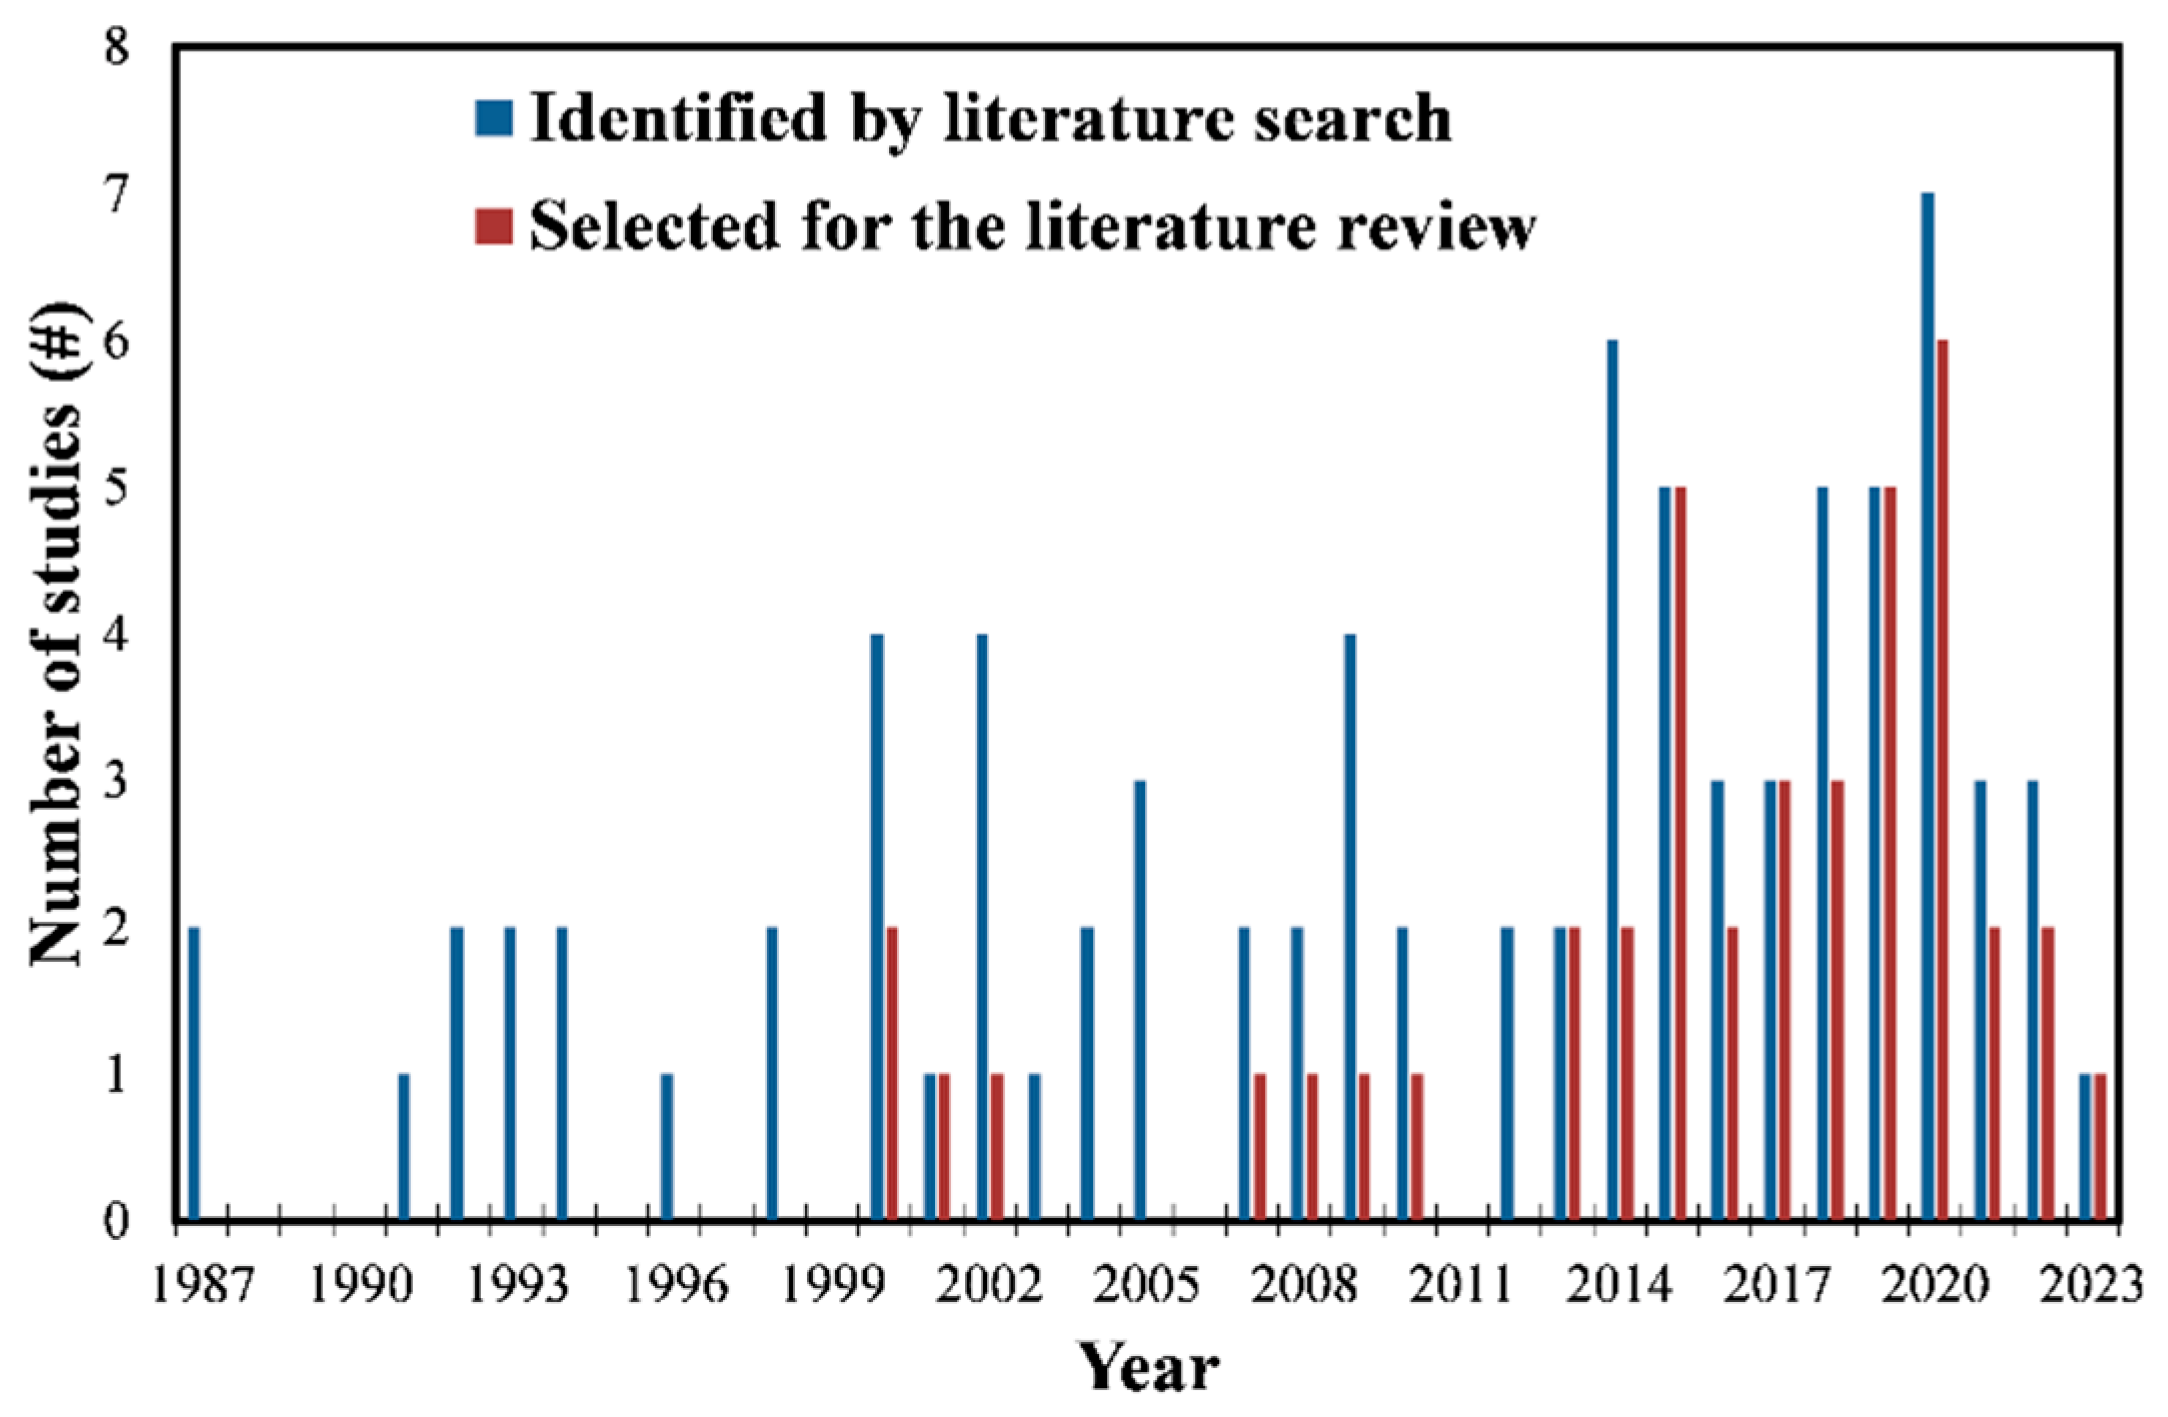
Figure 3.
Several publications related to each country of the study region were identified by literature search (1987 – 2023) and selected/included in the bibliographic review (2000 – 2023).
Figure 3.
Several publications related to each country of the study region were identified by literature search (1987 – 2023) and selected/included in the bibliographic review (2000 – 2023).
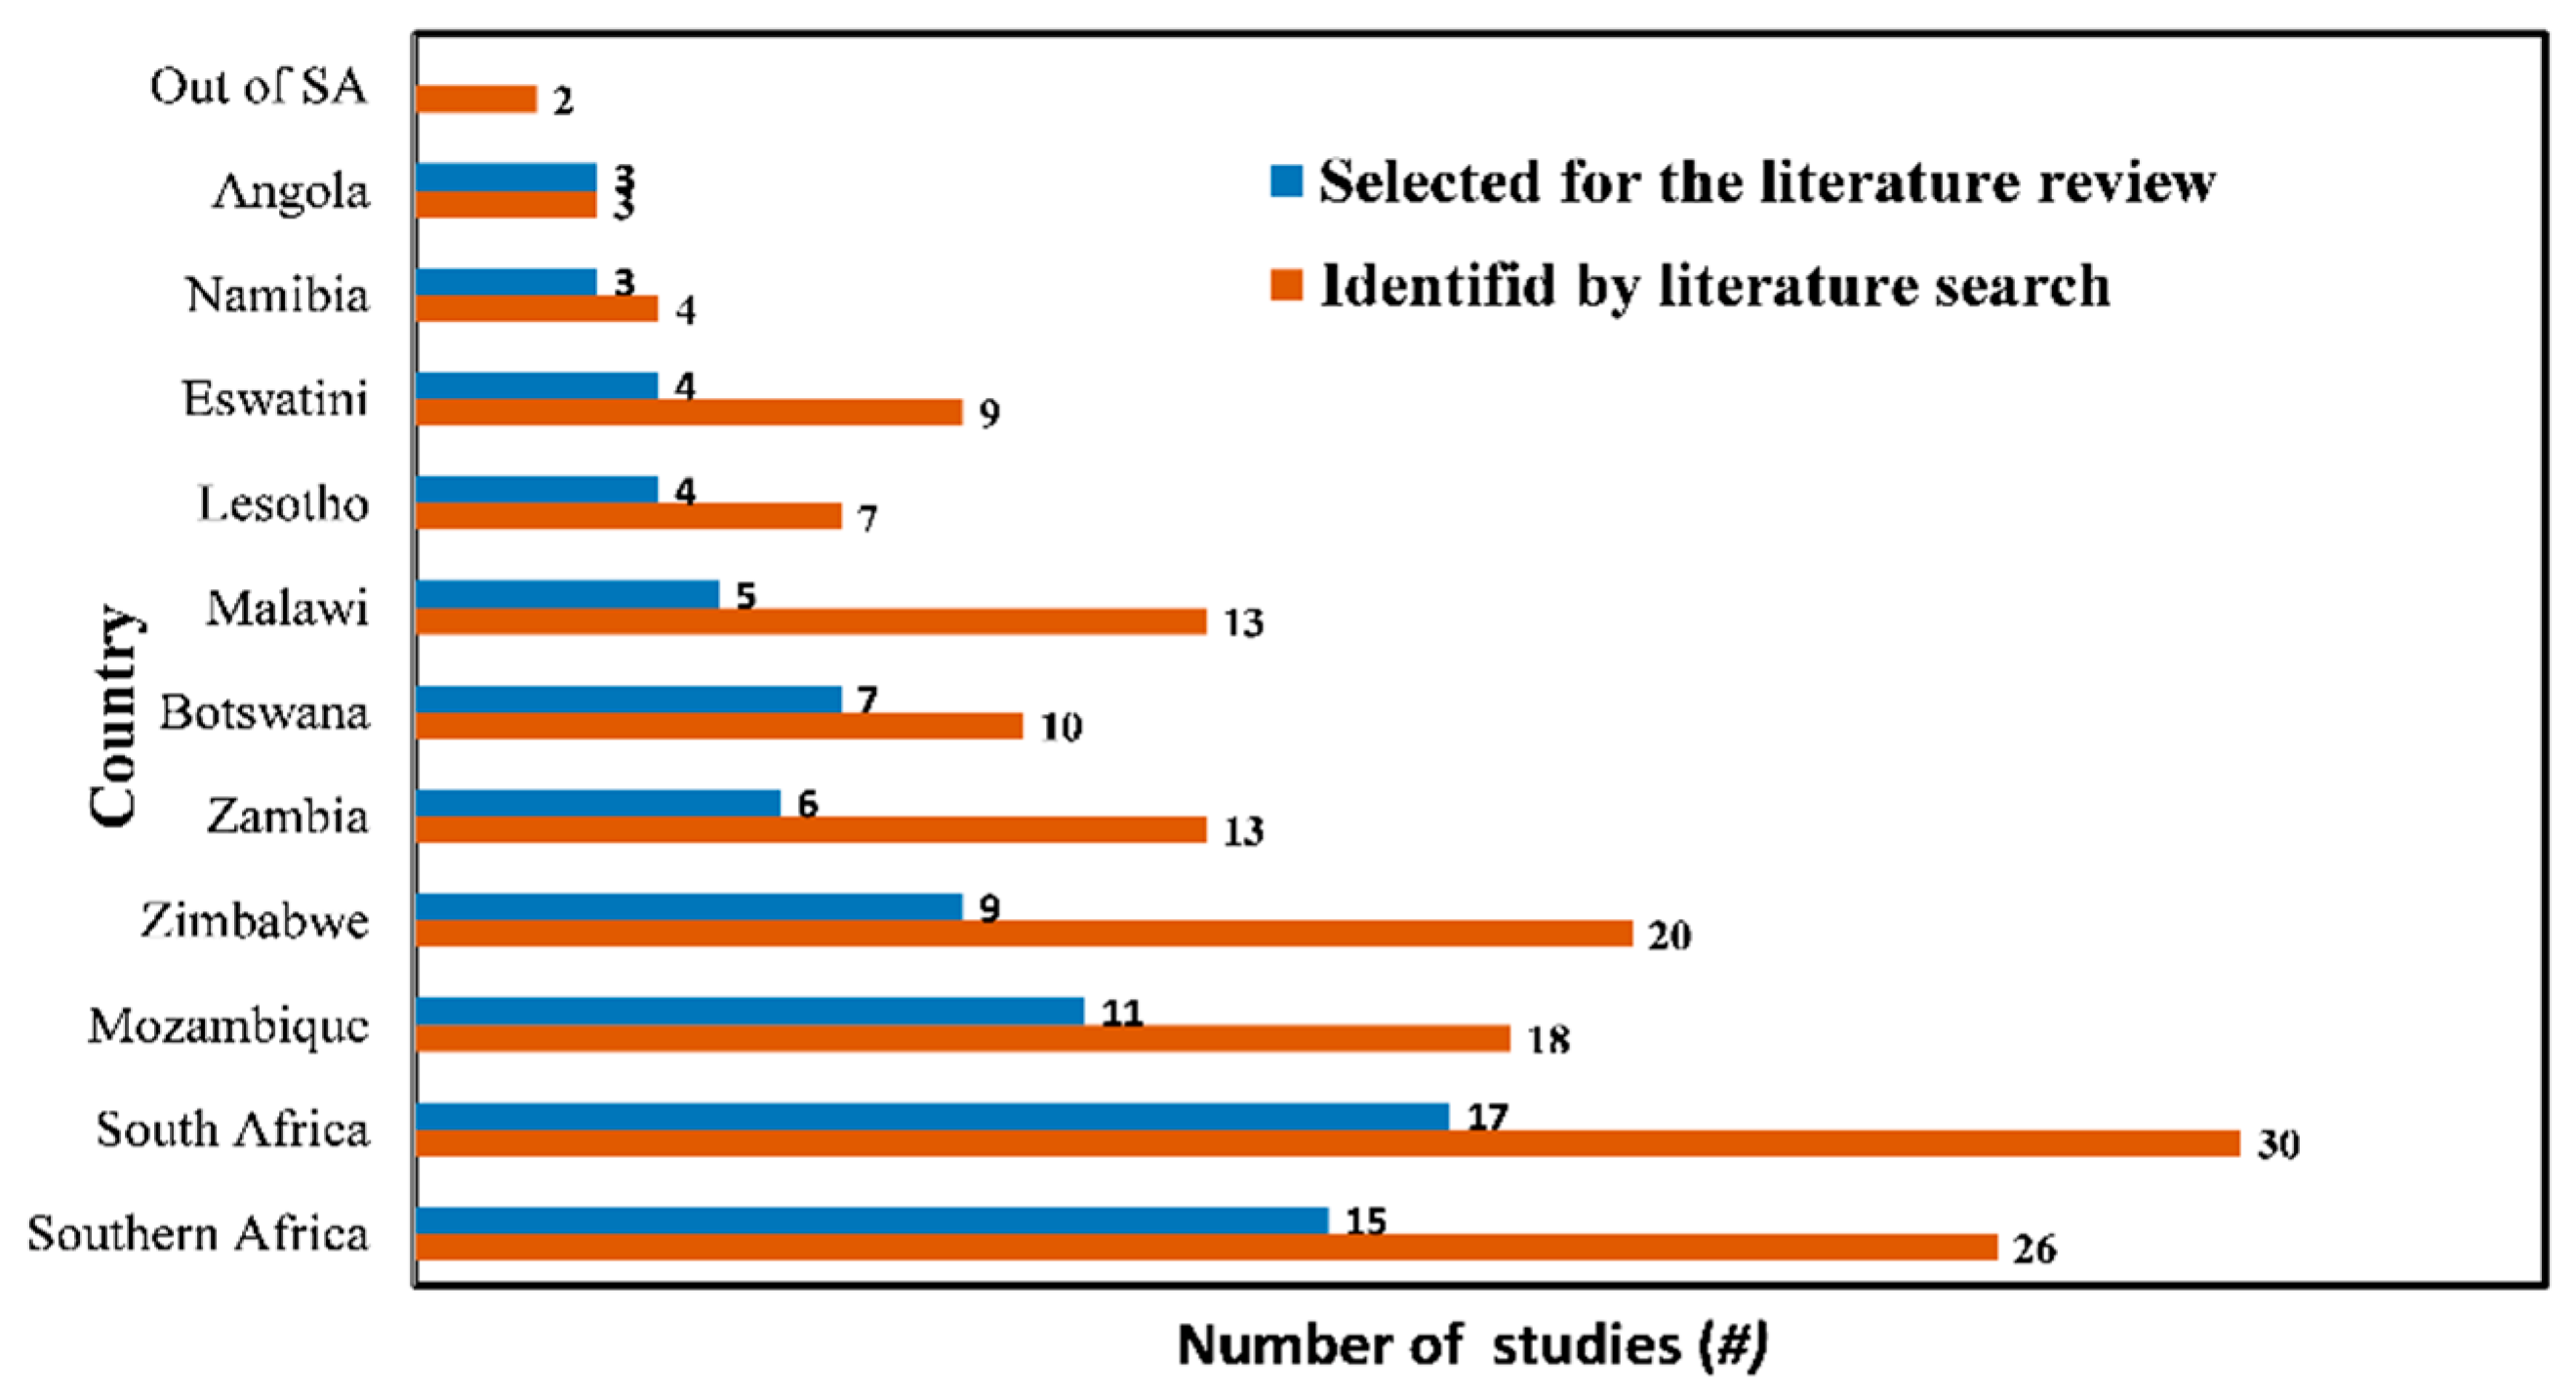

Table 1.
Drought classification criteria of PDSI, SPI and SPEI [31].
Table 1.
Drought classification criteria of PDSI, SPI and SPEI [31].
| Drought class | PDSI value | SPI and SPEI value |
|---|---|---|
| Extremely wet | ≥4.00 | ≥2.00 |
| Severely wet | 3.00 to 3.99 | 1.50 to 1.99 |
| Moderately wet | 2.00 to 2.99 | 1.00 to 1.49 |
| Slightly wet | 1.00 to 1.99 | 0.50 to 0.99 |
| Near Normal | -0.99 to 0.99 | -0.49 to 0.49 |
| Mild dry | -1.99 to -1.00 | -0.99 to -0.50 |
| Moderate dry | -2.99 to -2.00 | -1.49 to -1.00 |
| Severe dry | -3.99 to -3.00 | -1.99 to -1.50 |
| Extremely dry | ≤ -4.00 | ≤-2.00 |
Table 2.
Criteria for inclusion and exclusion of documents in the systematic search.
| Inclusion criteria | Exclusion criteria |
|---|---|
| Written in English. | Not be written in English. |
| Peer-reviewed articles and journals. | Non-peer-reviewed articles and journals. |
| Published after the year 2000 | Publishes before 2000 |
| Focus on the drought descriptors, factors and impacts. | Not focused on drought descriptors, factors and impacts. |
| WMO Reports. | Documents, letters and reports not published by WMO and indexed journals. |
| Review Articles and Letters. | |
| Study area outside SA. |
Table 3.
Bibliographic databases, website address where the output of the search is saved, number of publications identified (N), access date and search procedure to identify the publications to perform the systematic review.
Table 3.
Bibliographic databases, website address where the output of the search is saved, number of publications identified (N), access date and search procedure to identify the publications to perform the systematic review.
| Database | Website address | N | Access date | Search procedure |
|---|---|---|---|---|
| WoS | https://www.webofscience.com/ | 75 | March 14, 2023 | Research equation |
| SCOPUS | https://www.scopus.com/ | 77 | March 14, 2023 | Research equation |
| Google Scholar | https://www.mdpi.com/2225-1154/5/3/51 | 1 | April 22, 2023 | Citation searching |
| https://iwaponline.com/jwcc/article/ | 1 | April 22, 2023 | Citation searching 1 |
Table 4.
Main drought factors in SA. The absolute (N) and relative (n) number of citations are also provided.
Table 4.
Main drought factors in SA. The absolute (N) and relative (n) number of citations are also provided.
| Factors | Studies | N(#) | n(%) |
| El Niño Southern Oscillation (ENSO) | [29,45,54,55,56,46,47,48,49,50,51,52,53] | 13 | 32 |
| Other Ocean-Atmosphere interactions | [33,47,49,50,53,55,57] | 7 | 17 |
| Sea surface temperature (SST) | [48,52,53,54,55] | 5 | 12 |
| Anthropic influence (e.g., fires, gas emissions and global warming) | [24,33,56,58,59,60] | 6 | 15 |
| Heatwaves | [59,61] | 2 | 5 |
Table 5.
Most used indices of the studies. The absolute (N) and relative (n) number of citations are also provided.
Table 5.
Most used indices of the studies. The absolute (N) and relative (n) number of citations are also provided.
| Indices | Studies | N(#) | n(%) |
| SPI | [24,29,69,70,71,33,45,49,53,55,57,67,68] | 13 | 32 |
| SPEI | [24,33,65,69,44,46,48,49,50,56,57,62] | 12 | 29 |
| SRI | [24,66,69,71] | 4 | 10 |
| ENSO | [47,48,54,72] | 4 | 10 |
| VCI | [44,46,56] | 3 | 7 |
| NDVI | [56,57,70] | 3 | 7 |
| SOI | [49,52,53] | 3 | 7 |
Disclaimer/Publisher’s Note: The statements, opinions and data contained in all publications are solely those of the individual author(s) and contributor(s) and not of MDPI and/or the editor(s). MDPI and/or the editor(s) disclaim responsibility for any injury to people or property resulting from any ideas, methods, instructions or products referred to in the content. |
© 2023 by the authors. Licensee MDPI, Basel, Switzerland. This article is an open access article distributed under the terms and conditions of the Creative Commons Attribution (CC BY) license (http://creativecommons.org/licenses/by/4.0/).
Copyright: This open access article is published under a Creative Commons CC BY 4.0 license, which permit the free download, distribution, and reuse, provided that the author and preprint are cited in any reuse.


