Submitted:
21 June 2023
Posted:
22 June 2023
You are already at the latest version
Abstract
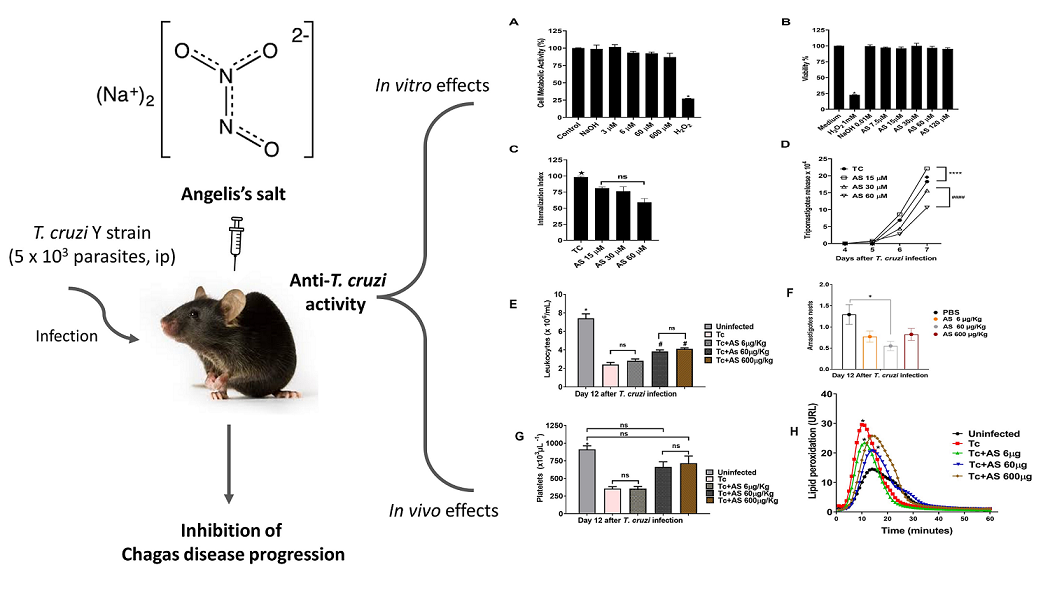
Chagas disease (CD), caused by Trypanosoma cruzi, is a neglected tropical disease prevalent in Latin America. The treatment of infected patients is aimed at eliminating the parasite, reducing the risk of cardiomyopathy, and interrupting the disease transmission cycle. At present, the World Health Organization only recognizes benznidazole (BZ) and nifurtimox as effective drugs for treating CD. However, both present low cure rates in the chronic phase and often have serious side effects. T. cruzi infection produces an intense inflammatory response in several tissues, critical for controlling parasite proliferation and CD evolution. Compounds that liberate nitric oxide (NO) (NO donors) have been used as therapeutic agents against T. cruzi. However, to date, there is no evidence about the related nitrogen oxide, nitroxyl (HNO) on the outcome of T. cruzi infection. In this study, we investigated the effect of the HNO donor Angeli's salt (AS) on C57BL/6 mice infected with T. cruzi (Y strain, 5 × 10³ trypomastigotes, i.p.). The use of AS showed positive results, such as a decrease in the number of parasites present in the bloodstream and in nests within the heart, as well as improved the protective antioxidant capacity of erythrocytes in infected animals, leading to an overall decrease in the severity of the disease. Furthermore, in vitro experiments showed that AS treatment reduced parasite uptake and the release of trypomastigotes by macrophages. Taken together, these findings from both the mouse model and in vitro testing suggest that AS could be a promising therapy for CD.
Keywords:
Chagas disease
; Therapy
; Nitroxyl
; Leukopenia
; Thrombocytopenia
; Oxidative stress
; Macrophages
1. Introduction
Chagas disease (CD) is a medical condition first identified by the Brazilian physician Carlos Chagas in 1909, and it arises from an infection with protozoan Trypanosoma cruzi. CD continues to be a significant public health concern, particularly in endemic regions of Latin America, where it mainly spreads through contact between humans and the feces or urine of triatomine bugs that feed on blood [1].
Due to the migration of infected individuals and non-vector transmission pathways such as blood transfusion, organ transplantation, and congenital infection, CD has emerged as a potential menace to non-endemic countries, particularly in the United States, Europe, and the Western Pacific region [2,3]. In areas endemic to CD, chronic cardiomyopathy associated with the condition is the leading cause of cardiac-related morbidity [4,5].
Although Benznidazole (BZ) and nifurtimox have been utilized to treat CD since the 1960s [6], there is still no satisfactory treatment available for the chronic stage of the disease. These drugs have both limited efficacy and are often associated with side effects. Additionally, require long periods of administration, making it essential to develop new and effective alternatives to treat CD. Experimental infection of various animals with T. cruzi has facilitated the study of the natural history of CD. Research using mice, rats, dogs, rabbits, guinea pigs, hamsters, and monkeys has yielded a wealth of information about the immunopathology of CD since its discovery [7,8]. However, the major aspects of CD pathogenesis remain poorly understood.
Over the past three decades, experimental investigations have demonstrated that BALB/c mice, when acutely infected with T. cruzi, produce interferon-gamma (IFN-γ) and tumor necrosis factor-alpha (TNF-α). This immune response leads to the activation of inducible nitric oxide synthase (iNOS) and an increase in the production of nitric oxide (NO), which is crucial for macrophage trypanocidal activity [9,10,11]. However, cytokines and NO are also involved in host immunity suppression [12].
Experimental findings also indicate that NO may play a role in regulating various other processes that are crucial for an effective immune response against the parasite [13,14]. The discovery that T. cruzi infection induces NO production in the myocardium raises new questions, and the consequences of this discovery are far from fully understood [15,16,17].
Nitroxyl (HNO) is a molecule that has been shown to act as a regulator of cardiovascular function and has been investigated as a potential treatment for heart failure, myocardial infarction, and hypertension, among other cardiovascular conditions [18] including CD [19] and hyperalgesia [20]. It has both a role as endothelium relaxing factor and hyperpolarizing factor as well [21]. However, it is a different entity than the related nitrogen oxides NO and NO+ [22,23]. Our investigation focused on examining the pharmacological properties of Angeli’s salt (AS; Na2N2O3), a known nitroxyl (HNO) donor [24] in T. cruzi infection pathogenesis.
2. Materials and Methods
2.1. Ethics Statement
The handling of animals and experimental procedures were carried out in strict adherence to the Guide for the Care and Use of Laboratory Animals, as recommended by the Brazilian National Council of Animal Experimentation (COBEA). The Internal Scientific Commission and the Ethics in Animal Experimentation Committee of Londrina State University approved the study protocol in compliance with the guidelines of the National Council for the Control of Animal Experimentation (CONCEA) under the Approval Number: CEUA nº 4628.2016.40/ 002.2021. All necessary measures were taken to reduce the pain and suffering of the animals involved in the experiments.
2.2. Animals and Experimental Design
We obtained male C57BL/6 mice (8-12 weeks old) from the Multidisciplinary Center for Biological Research (CEMIB), University of Campinas (UNICAMP; Campinas, Brazil). The mice were then kept under standard conditions in the animal house of the Department of Immunology, Parasitology and General Pathology, Center for Biological Sciences, State University of Londrina.
The mice were kept in an animal house with a controlled environmental temperature (21-23°C) and a 12-hour light/dark cycle. They were provided with commercial rodent diet (Nuvilab-CR1, Quimtia-Nuvital, Colombo, Paraná, Brazil) and sterilized water ad libitum. For the experiment, mice (n = 5–10 per group), were inoculated intraperitoneally (i.p.) with 5 × 10³ T. cruzi bloodstream trypomastigotes (Y strain of T. cruzi I lineage) [25]. Control groups received an injection of the same amount of sterile phosphate-buffered saline (PBS) (pH 7.2).
To quantity parasitemia, 5 µL of fresh blood were collected from the tail vein of mice. The number of parasites in 50 microscopic fields at 400× magnification was counted using an Olympus CH30LF100 - (Olympus Optical CO., LTD) light microscope. This procedure was performed on days 3, 5, 7, 9, 13, 15, 19, 21,23,25,27,29 and 31 after infection. The data obtained were expressed as number of parasites per mL [26]. Confirmation of T. cruzi infection was done through direct microscopic observation of circulating trypomastigotes in the peripheral blood of mice at three days post-infection (dpi). The survival rate was assessed at 31 dpi (Figure 1). Only mice with positive parasitemia were included in the infected groups. To euthanize the animals, they were anesthetized using ketamine (100 mg/kg) and xylazine (10 mg/kg) before performing cervical dislocation.
2.3. Treatment Schemes
The synthesis and use of AS (sodium trioxodinitrate) followed previously described methods [20,27]. Stock solutions were prepared in 10 mM NaOH and stored at −20°C. The stability of solutions was determined from the extinction coefficients at 250 nm (ε of 8000 M−1 cm−1 for AS [28] and prepared at 7 mg/mL of 10 mM NaOH. Mice were treated with PBS-diluted AS (6 µg/kg/animal, 60 µg/kg/animal, and 600 µg/kg/animal), prepared daily 15 min before the beginning of the treatment [20]. The treatment began 15 min after T. cruzi inoculation and continued for 12 consecutive days. Control animals, both infected and uninfected, were administered the same volume (100 µL) of PBS as per the schedule for the intraperitoneally infected mice. The experimental design is depicted in Figure 1.
2.4. Hematological Analysis
Mice were anesthetized and whole blood was collected through intracardiac puncture using syringes and needles containing ethylenediaminetetraacetic acid (EDTA). Standard methods were utilized to count the leukocytes, platelets, and reticulocytes [29,30,31].The plasma was separated and stored at −20°C until use.
The microcentrifugation of capillary tubes filled with blood was performed to obtain the hematocrits, while a manual hemocytometer was used to determine the total number of nucleated cells collected. The normal values obtained from uninfected C57BL/6 mice kept under the same conditions [32] were considered in all experiments performed to determine the hematological parameters of the animals (12 dpi).
2.5. Cardiac Parasitism
At 12 dpi, the hearts were collected, immersed in 10% buffered formalin, and the fixed tissues were embedded in paraffin, processed for microtomy, and subsequently stained with hematoxylin and eosin (H&E). The tissue sections were examined under light microscopy, and the number of parasite nests in each section was counted across 50 microscope fields at a magnification of ×400. Three sections were evaluated, and the results were expressed as the average of the three sections. Images were captured with a video camera adapted to a BX43 microscope (Olympus, Tokyo, Japan). The images were analyzed with the ImageJ software, a public domain Java image processing (http://imagej.nih.gov/ij/).
2.6. Evaluation of Oxidative Stress and Antioxidant Capacity in Erythrocytes
Blood samples from the control and experimental groups (12 dpi) were used to determine erythrocyte oxidative stress. After removing the plasma and white blood cells from whole blood, the remaining erythrocytes were washed three times with PBS then resuspended in the same buffer (1:99, v/v). Oxygen uptake and induction time (Tind) (induced by 2 mM tert-butyl hydroperoxide, t-BHP) were measured using a Clark-type oxygen electrode at 37°C [32,33]. Tind value is closely associated with the intracellular capacity of protective antioxidants, while oxygen uptake serves as an indirect indicator of the vulnerability of erythrocyte membranes to lipid peroxidation triggered by t-BHT [32,34,35].
2.7. Oxidative Processes Induced by Tert-butyl Hydroperoxide in Erythrocytes
Mouse erythrocytes from control and experimental groups were collected by centrifugation (800 × g, 10 min) at 25°C and then washed thrice with PBS. A 1% erythrocyte suspension in PBS was prepared when needed. To initiate the chemiluminescence (CL) reaction, 20 µL of t-BHT was added to a final concentration of 0.6 mM in 1 mL [36,37]. Relative light units (RLU) were used to express the results obtained from measuring CL using a TD20/20 luminometer (Turner Biosystems, Sunnyvale, CA, USA) [35]. The relative amount of pre-existing lipid hydroperoxide in erythrocyte membranes was determined using the integrated area under the curve.
2.8. Evaluation of Nitric Oxide (NO)
Nitrite levels in the plasma (12 dpi) were determined as an indirect measure of NO. We used the cadmium-copper system followed by the Griess reaction, as described previously [38] with some modifications proposed by Panis et al. [17]. Briefly, 60 µL aliquots were deproteinized by adding 50 µL of 75 mM ZnSO4 solution (Merck, Germany), vortexed, and centrifuged at 11200 × g for 2 min at 25°C. Then, 70 µL of 55 mM NaOH solution (Merck, Germany) was added to each supernatant, which was again vortexed and centrifuged at 11200 × g for 5 min at 25°C. The final supernatants were diluted in glycine buffer solution (45 g/L; pH 9.7) (Merck, Germany) at a buffer-to-supernatant ratio of 5:1.
Cadmium granules stored in a 100 mM H2SO4 solution (Merck, Germany) were rinsed three times in distilled sterile water and added to a 5 mM CuSO4 solution in glycine-NaOH buffer (15 g/L; pH 9.7) (Merck, Germany) for 5 min to obtain copper-coated cadmium granules. Cadmium treatment was used to convert all nitrates into nitrites in the biological samples, providing a more accurate estimation of total NO in the original samples. The glycine-buffered diluted supernatants were treated with activated granules (600-1000 mg, approximately 1-2 granules) and gently stirred for 10 min. Aliquots (200 µL) were transferred to microfuge tubes for nitrite determination. Griess reagent (200 µL) was added to each tube, consisting of Reagent I (50 mg of N-naphthyl ethylenediamine in 250 mL of distilled water) and Reagent II (5 g of sulfanilic acid in 500 mL of 3 M HCl) (Sigma-Aldrich). The tubes were incubated for 10 min at room temperature and centrifuged at 11200 × g for 2 min at 25°C. The resulting supernatants were used for nitrite determination, and 100 µL of each sample was added to triplicate wells of a 96-well microplate. A calibration curve was prepared by diluting NaNO2 (Merck, Germany) in distilled sterile water to obtain concentrations ranging from 125 µM to 0 µM. The absorbance was read at 550 nm using a LabSystems Multiskan EX microplate reader (Thermo Scientific, Waltham, MA, USA), and the results were expressed in µM nitrite.
2.9. Cellular Metabolic Assay by Reducing Resazurin in Trypomastigotes
AS was incubated for 24 h with trypomastigotes forms of T. cruzi (Y strain) and the cell viability was determined by the resazurin assay [39]. Resazurin sodium salt was obtained from Sigma-Aldrich, St. Louis, USA, and stored at 4°C while protected from light. A solution of resazurin was prepared in DMEM (pH 7.4) and filter-sterilized prior to use. Experiments were carried out in 96-well microplates containing 1 × 10⁶ parasites per milliliter. The plates were incubated at 37°C for 24 h, testing the different concentrations of AS (3,6,60 and 600 μM). After incubation, the medium was removed. Subsequently, DMEM (200 μL) containing resazurin (20 μM) was added to each well, and the plates were incubated for an additional 2 h and the fluorescence intensity was quantified in the Glomax® fluorescence reader (520 nm excitation and 580 nm emission). Viable cells with an active metabolism can reduce resazurin, a blue compound, to form resorufin, a pink molecule with emission at 580 nm. Controls included the incubation of trypomastigotes alone with culture medium (DEMEN and NaOH 10mM, vehicle for AS), and H2O2 1mM (positive control). The assays were performed in quadruplicate.
2.10. Inflammatory Peritoneal Macrophages Culture
Groups of C57BL/6 mice (five to ten) received intraperitoneally 2 mL of 5% thioglycollate solution. After four days, the resulting elicited cells from the peritoneal exudates were collected in cold PBS. The mouse peritoneum was washed with 5 mL of ice-cold serum-free RPMI. Peritoneal cells were pooled and left to adhere to the complete medium (RPMI, 2 mM glutamine, 1 mM sodium pyruvate, 40 µg/mL gentamicin, and 10 mM HEPES) for 24 h in 24-well plates at 2 × 10⁶ cells/well. Each suspension of pooled peritoneal cells was plated in triplicate. The non-adherent cells were removed by washing, and the adherent cells were cultured in a complete medium. Macrophages were seeded onto 13 mm round glass coverslips and washed with warm PBS prior to the interaction assays. Additionally, macrophages were seeded at a density of 2 × 10⁵ cells per well in 96-well plates.
2.11. Treatment of Macrophages and Invasion Assay
To examine the impact of AS on the host cell’s ability to internalize the parasite, elicited peritoneal macrophages that had been washed beforehand were incubated with AS (15 µM, 30 µM and 60 µM) in a 5% CO2 atmosphere at 37°C for 1 hour prior to the experiments. After removing the medium containing AS, macrophages were incubated with trypomastigotes at a ratio of five parasites per cell. The mixture was allowed to react for 2 hours at 37°C in a 5% CO2 atmosphere. The cells were washed three times, fixed with Bouin’s fixative, stained with Giemsa stain (Merck, Darmstadt, Germany), and observed under a light microscope at 1000× magnification. To serve as a positive control for T. cruzi infection, some macrophages were incubated in medium alone.
To calculate the internalization index, we multiplied the percentage of infected cells by the mean number of parasites per infected cell [40,41,42,43]. The internalization indices of all treated macrophages were normalized to those of untreated macrophages. The experiments were repeated thrice, and six independent experiments were conducted. Infected peritoneal macrophages that were untreated were included in all experiments as controls. Light microscopy was used for quantification, and 500 cells were randomly counted.
2.12. Cytotoxicity Assay
The cells’ viability was determined by using an MTT assay, which measures mitochondrial activity in living cells. The cells were incubated with MTT for 4h at 37°C, and the formazan crystals formed were dissolved using dimethyl sulfoxide. Negative controls were also used. The plates were read using a Bio-Rad Microplate reader at a test wavelength of 570 nm and a reference wavelength of 630 nm.
2.13. Production of Nitric oxide (NO) by Macrophages Treated with AS
The level of NO produced by macrophages after treatment with AS was determined by measuring the accumulated nitrite level in the culture supernatant. After 48 hours of treatment, the culture supernatants were collected and mixed with Griess reagent, and the absorbance was measured at 550 nm. The nitrite concentrations were calculated using a standard curve generated from known concentrations of sodium nitrite.
2.14. Statistical Analysis
The results are presented as the mean ± standard error of the mean (SEM) from three independent experiments, with 5-10 samples per group in each experiment. The Shapiro Wilk test was performed to evaluate normality and after checking non-normality in the data, non-parametric tests were used. The non-parametric Friedman ANOVA paired test was used to evaluate the evolution over the 3rd - 31st days after infection. Parasitemia levels were also estimated by the area under the curve (AUC) during the T. cruzi acute infection. Survival curves were compared using a log-rank (Mantel-Cox) test. For variables that had a normal distribution, we performed parametric testing as two-way analysis of variance (ANOVA) followed by the Tukey post-test. GraphPad Prism software, version 8 (La Jolla, CA, USA) was used for all statistical analyses. All analyses were two-tailed, and p values under 5% were considered significant (p ≤ 0.05).
3. Results and Discussion
3.1. Correlation between T. cruzi Infection and AS-Therapy Response in Mice
NO is an important agent involved in T. cruzi-induced CD parasitemia and pathogenesis control [16]. The use of NO-based therapies to combat T. cruzi is a promising option, as demonstrated in various studies involving NO donor compounds that can effectively regulate NO levels both in vitro and in vivo [35,44,45]. However, reports on how HNO affects T. cruzi infections are lacking. In this study, the anti-inflammatory and antiparasitic effects of AS, an HNO-donor, were observed in an acute T. cruzi infection. We found that AS improved resistance to T. cruzi infection both in vivo and in vitro. Figure 2 shows the parasitemia curves of T. cruzi-infected mice treated with AS (AS group) or no treatment (PBS group). Six days after inoculation (dpi) with T. cruzi, parasitemia was similar between the two groups (p > 0.05). Interestingly, the peak parasitemia level in AS-treated mice (7 dpi) was lower than that in untreated mice (Fig(s). 2A, 2B, and 2C; p = 0.0067, Friedman test), showing the effect of AS therapy in the early phase of infection. Parasitemia levels were also estimated by the area under the curve (AUC) during the course of the T. cruzi acute infection. The AUC in untreated infected-mice was significantly higher that observed for treated infected-mice (Figure 2D, p = 0.0025; Figure 2E, p = 0.00190; Figure 2F, p = 0.0091, Unpaired t test). All the animals in the PBS group survived until 31 dpi. There were no statistically significant differences (p > 0.05) in survival between the AS and PBS groups (data not shown).
Acute T. cruzi infection is associated with significant alterations in hematological parameters, such as anemia, thrombocytopenia, and leukopenia [29]. Contributing NO elevates circulating reticulocytes and reduces circulating leukocytes and neutrophils [32]. At 12 days post-infection, we performed blood cell counts and measured hematological values in both uninfected and T. cruzi-infected mice. We observed significant decreases in hematocrit (Figure 3A) (p ≤ 0.05) and hemoglobin (Figure 3B) (p ≤ 0.05) in the T. cruzi-infected mice, indicating the presence of anemia, as expected. AS treatment did not change these hematological parameters in uninfected animals (data not shown), as in infected animals (Figure 3A,B) (p > 0.05).
Unexpectedly, AS treatment had an impact on the degree of leukopenia and thrombocytopenia observed at 12 days post-infection (Figure 4A,B) (p ≤ 0.05) but did not alter the significantly higher number of reticulocytes in the T. cruzi-infected mice compared to the uninfected mice (Figure 4C) (p > 0.05). The importance of addressing thrombocytopenia, leukopenia in CD lies in their potential impact on an individual’s health. Thrombocytopenia can lead to excessive bleeding, while leukopenia can weaken the immune system, making individuals more susceptible to infections. Therefore, our data show that treatment with AS did not alter anemia and the increase in reticulocytes, but mitigated thrombocytopenia and leukopenia, which developed at 12 dpi [32]. Further research is necessary to determine the potential of AS in the treatment of these hematological alterations observed during the acute phase of disease.
AS treatment (60 µg/kg/mouse) markedly reduced the number of amastigote nests. Treatments with 6 µg and 600 µg AS showed a tendency to reduce the number of nests, but they were not statistically different from the infected and untreated animals (Figure 5) (p > 0.05). Mice treated with the NO-donor ruthenium nitrosyls (Ru(NO)isn or Ru(NO)imN) showed a reduced blood parasite load [44] and could eliminate amastigote nests in the myocardium tissue of infected BALB/c mice compared to the controls [45]. Thus, T. cruzi-infected mice treated with AS displayed promising results because the compound concentration used (60 µg/Kg/mouse) in the short-term treatment could significantly reduce parasite load in the heart. However, our study focused on examining the effects of AS on the course of T. cruzi infection and cardiac parasitism during the acute phase. Nevertheless, we did not investigate the progression of cardiac CD. Further experiments are required to address these issues.
3.2. AS Attenuates Oxidative Stress in Erythrocytes
The imbalance between antioxidants and oxidants is linked to the progression of CD [46]. At 12 dpi, erythrocytes from infected mice displayed a substantial increase in oxygen uptake (Figure 6A). Oxygen uptake by erythrocytes exposed to t-butyl hydroperoxide (t-BHP) exhibited an induction period, denominated by T ind. An induction period refers to a delay or lag phase before a specific response or reaction occurs. In this case, it refers to a time interval during which the erythrocytes exposed to t-BHP do not immediately exhibit an increase in oxygen uptake.AS treatment reduced oxygen uptake at concentrations of 60 µg and 600 µg (Figure 6A) (p ≤ 0.05). So, Tind is directly related to the intracellular protective antioxidant capacity of erythrocytes [33]. T. cruzi infection (day 12) significantly reduced the Tind (Figure 6B) (p ≥ 0.05). AS treatment modified Tind (p ≤ 0.05) (Figure 6B) and improved the protective antioxidant capacity of erythrocytes in infected animals. In addition, we determined the time-course curve of t-BHT CL in erythrocytes and our findings revealed an increase in chemiluminescence (CL) that was related to oxidative stress previously induced in vivo. This led to the consumption of antioxidants and the formation of lipoperoxides, resulting in the emission of photons [35,36,47].
Means with different letters are significantly different (p ≤ 0.05, two-way ANOVA with Bonferroni’s Multiple Comparison Test.
According to Figure 7, the profiles of mice infected with T. cruzi (Tc group) had significantly higher levels of lipoperoxidation compared to the controls (uninfected group) (p ≤ 0.05). On the other hand, the AS group had a significantly shorter initial rate of lipoperoxidation than the controls (Tc group), as indicated by the ascending part of the curve in Figure 7 (p ≤ 0.05). The AS treatment did not affect these parameters in the uninfected animals (data not shown). While the mechanism by which HNO impacts these parameters is unknown, the data suggest that HNO donors have therapeutic potential for preventing erythrocyte damage during the acute phase of CD.
3.3. AS modifies Nitrite Levels in the Plasma
As Figure 8 shows, nitrite levels in the plasma on day 12 of infection increased compared to uninfected mice (18.11 ± 0.87 vs. 69.52 ± 3.68) (p ≤ 0.05), consistent with an immune response anti-T. cruzi. Interestingly, AS treatment reduced nitrite levels at the highest concentrations used: 60 µg/kg/mouse (69.52 ± 3.68 vs. 47.91 ± 4.29) (p ≤ 0.05) and 600 µg/kg/mouse (69.52 ± 3.68 vs. 51.42 ± 2.63) (p ≤ 0.05) (Figure 8). Nitrite lower levels are consistent with a reduced immune response due to higher parasite numbers as shown in Figure 2 (after 11 days of infection).
3.4. AS does not Alter the Metabolic Activity of Trypomastigotes
AS concentrations tested from 3-600 μM did not cause parasite toxicity, as shown in Figure 9A. Additionally, to validate the non-effectiveness of the AS antiparasitic activity against T. cruzi, the parasites treated with AS and with 100% cell metabolic activity were cultivated in a LLCMK-2 culture, and these parasites maintained their infectivity capacity (results not shown).
3.5. AS Modulates T. cruzi Infection in Macrophages
The MTT assay was utilized to assess drug cytotoxicity in macrophages. AS did not induce cell death (Figure 9B). To establish the effect of AS in the process of parasite invasion, peritoneal macrophages were treated with varying AS concentrations for 1 hour before the macrophage invasion assay. The medium containing the NO donor was removed to ensure that the treatment affected only the host cells and not the parasites. Following a 2-hour incubation with the trypomastigotes, they were removed, and in some cases, AS was added to the medium every 24 h until the end of the T. cruzi infection period (7 dpi). Our results show that the treatment with AS significantly decreased trypomastigote internalization by macrophages at 15 µM, 30 µM and 60 µM concentrations (Figure 9C) (p ≤ 0.05). Additionally, AS reduced trypomastigote release into the culture supernatants from T. cruzi-infected macrophages only at concentrations of 30µM and 60 µM (Figure 9D) (p ≤ 0.0001).
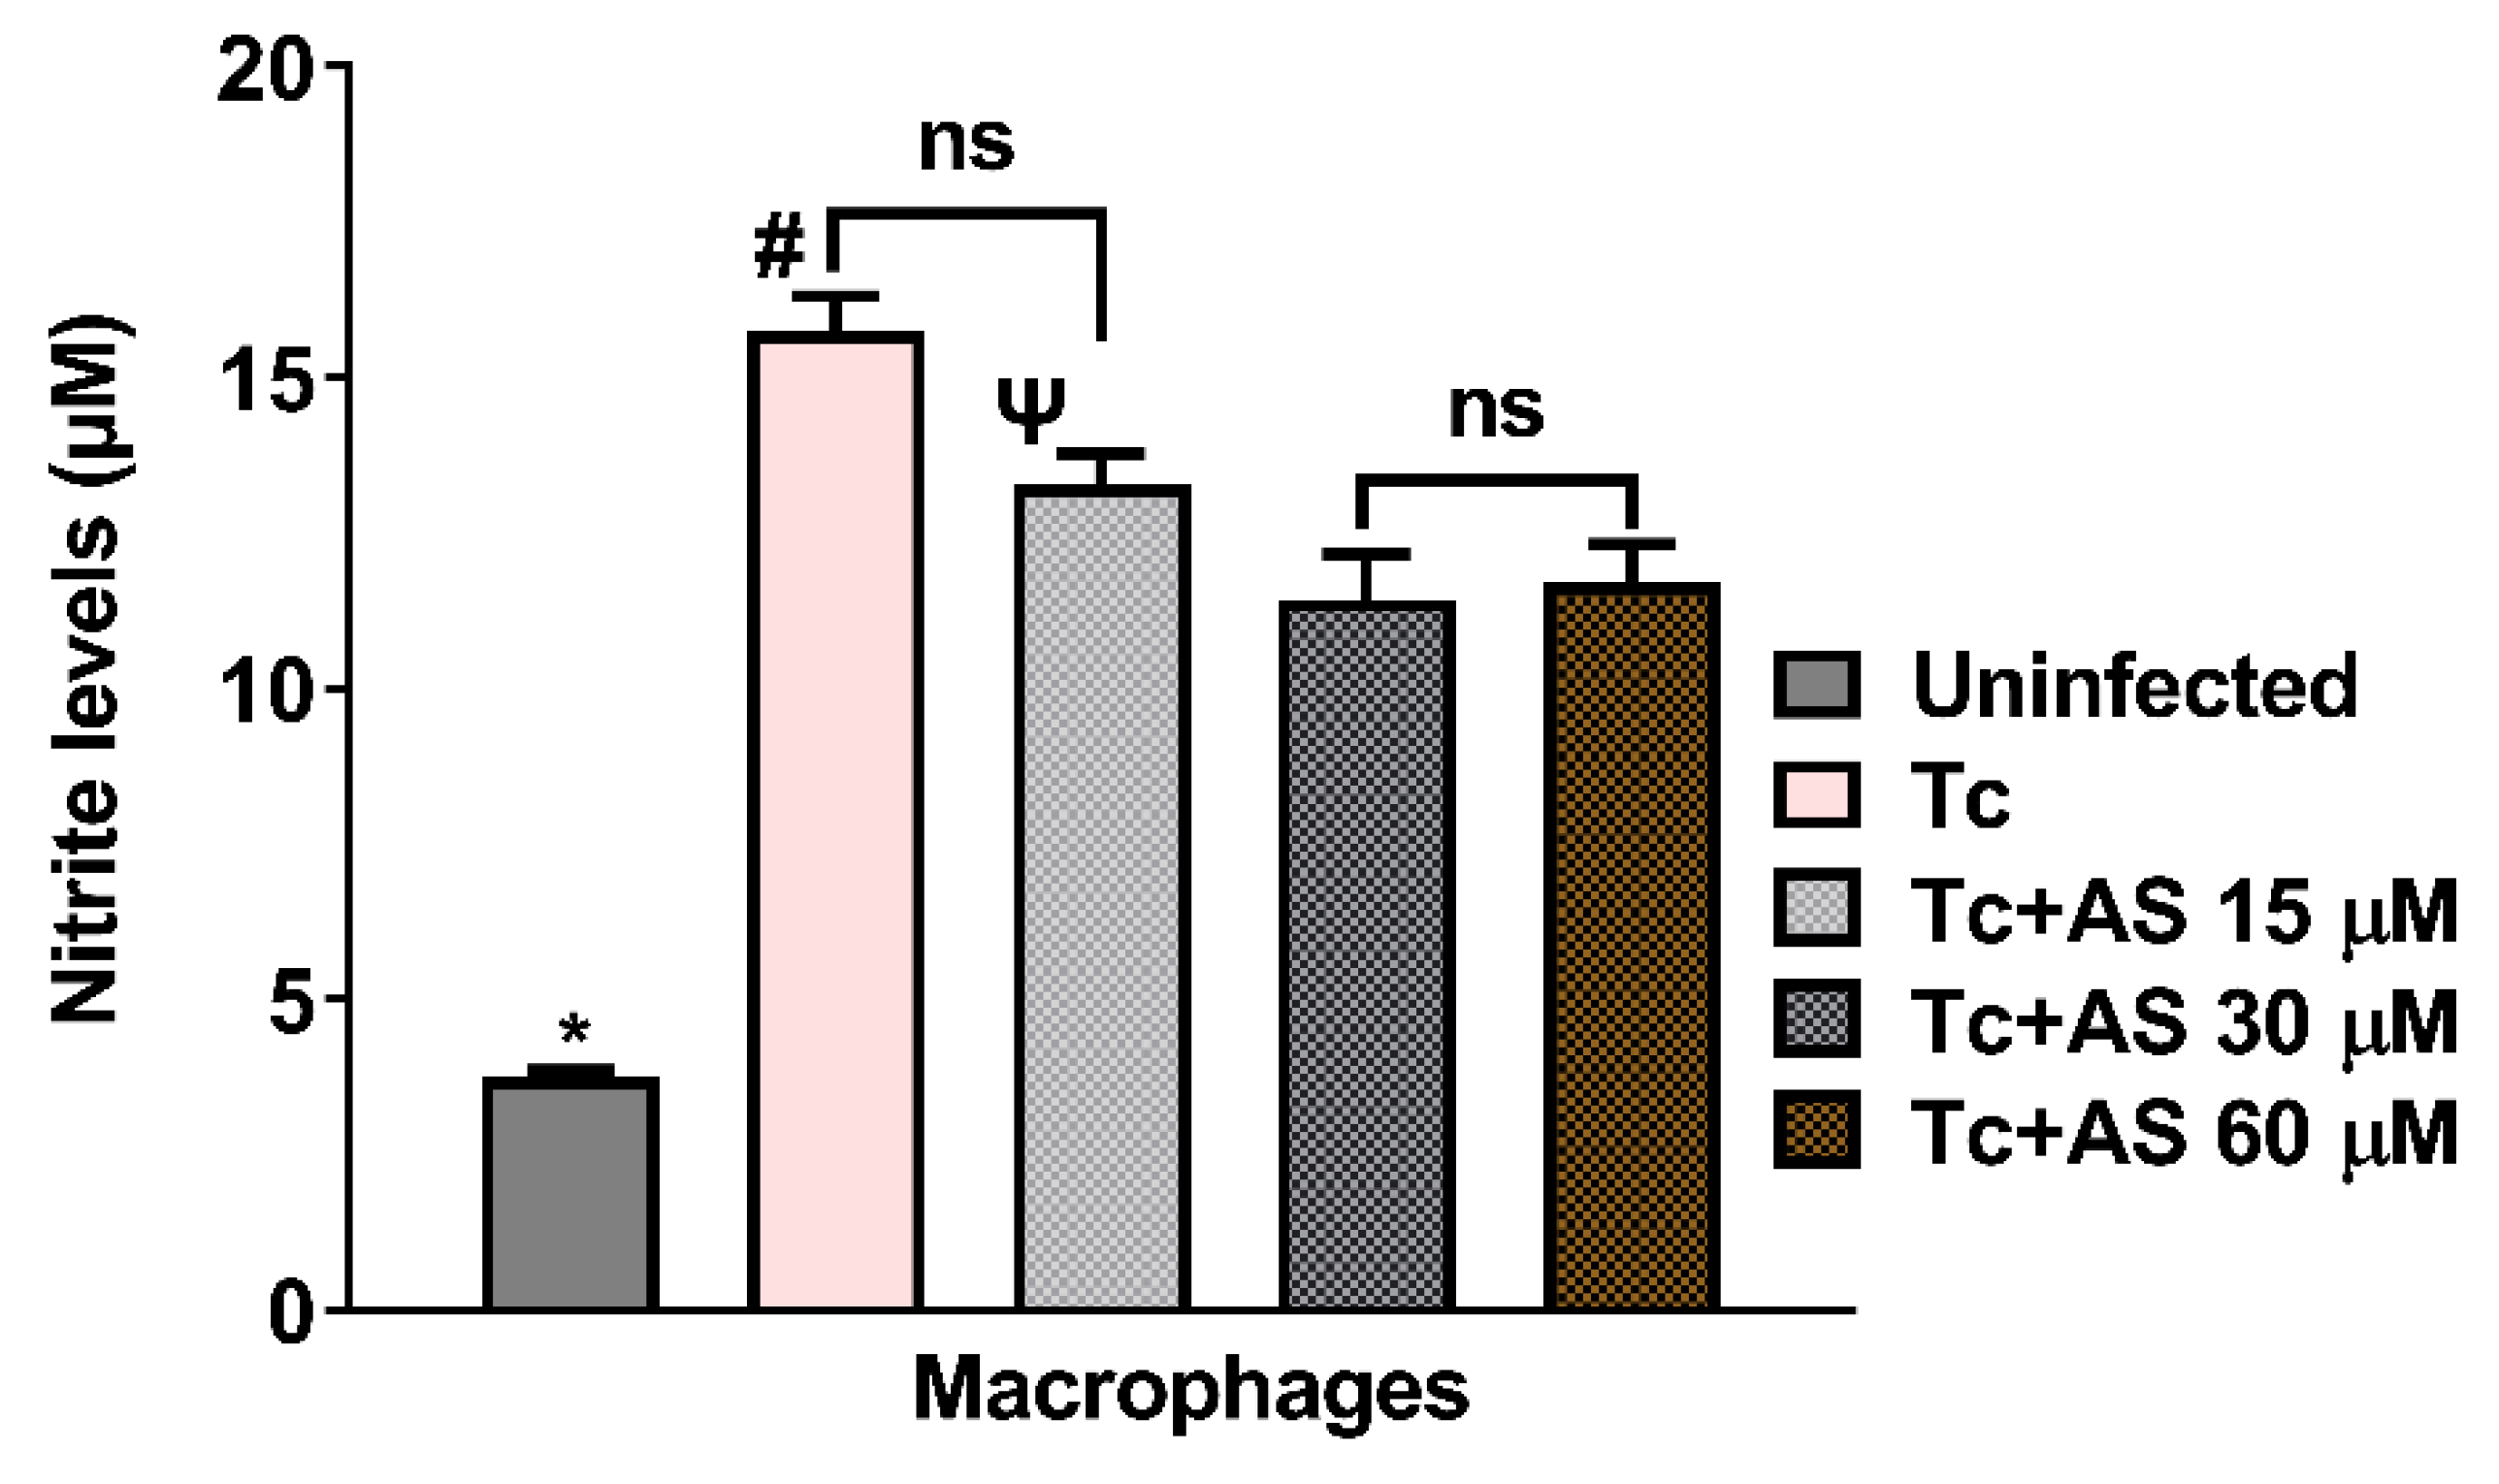
We also investigated if the production of NO by macrophages was influenced by treatment with AS. As shown in Figure 10, the nitrite level from infected macrophages was elevated (p < 0.05) and AS treatment decreased nitrite level in comparison with macrophages infected and not treated (p < 0.05). This reduction was also observed in plasma of infected mice treated with AS (12 dpi). Lower nitrite levels are consistent with a reduced immune response due to the higher number of parasites observed in treated animals, compared to controls, from day 11 post-infection, as shown in Figure 2. Taken together, our data indicate that AS inhibits NO production, an important cytotoxic effector for T. cruzi. One hypothesis is that AS at a concentration of 15,30 and 60 µM (Figure 9C), the amount of available NO after the treatment, was sufficient to reduce the entry of trypomastigote forms, but over time, it became insufficient to control the proliferation of trypomastigote forms (Figure 2). After 11 days of infection, the immune system may be struggling to control the parasite, and AS, by modulating the oxidative stress response downwards, interfere with this immune response (e.g., modulating the cytokine production such as IL-10 and IFN-gamma), resulting in more difficulty in controlling the infection. Further studies focused on this question will provide better clarification.
4. Conclusions
Our research revealed that AS targets T. cruzi, resulting in a decrease in parasite burden, accompanied by reduced levels of peroxidation of erythrocyte membranes and mitigation of thrombocytopenia and leukopenia during the acute infection phase. Additionally, AS altered the immunological patterns of infected macrophages, leading to enhanced anti-T. cruzi activity. The precise nature of these events is still unknown and may depend on the balance between host-produced NO and AS-released HNO, as well as the contribution of immunological mediators, such as pro- or anti-inflammatory cytokines. New perspectives for treating Chagas disease may include the use of HNO donors in combination with BZ to attenuate the consequences of oxidative insults in Chagas patients.
Author Contributions
Vera Lúcia Hideko Tatakihara: Conceptualization, Methodology, Investigation, Writing – original draft. Aparecida Donizette Malvezi: Methodology, Formal analysis, Validation. Rito Santo Pereira: Methodology, Formal analysis, Validation. Lucas Felipe Dos Santos: Methodology, Formal analysis. Bruno Fernando Cruz Lucchetti: Methodology, Formal analysis, Validation. Rubens Cecchini: Conceptualization. Formal analysis. Resources. Lucy Megumi Yamauchi: Resources. Funding acquisition. Sueli Fumie Yamada-Ogatta: Resources. Funding acquisition. Katrina M. Miranda: Conceptualization, Methodology. Resources. Waldiceu A. Verri Jr: Conceptualization, Methodology. Resources. Funding acquisition. Marli Cardoso Martins-Pinge: Conceptualization, Methodology, Writing – original draft. Funding acquisition. Phileno Pinge-Filho P: Conceptualization. Supervision, Project administration, Formal analysis. Resources. Writing – original draft. Funding acquisition. All Authors read and approved the final version of the manuscript.
Funding
This work was supported by Fundação Araucária - (chamada de projeto 09/2016, Programa Institucional de Pesquisa Básica e Aplicada-Convênio 001/2017 - Protocolo 47.396, SIT. 31675). RSP was supported by Ministério da Ciência e Tecnologia, Ensino Superior e Técnico Profissional de Moçambique.
Acknowledgments
We thank J.A. Vargas and Fabricio Seidy Ribeiro Inoue for excellent technical assistance, Coordenação de Aperfeiçoamento de Pessoal de Nível Superior (CAPES) for the fellowship to BFCL and Conselho Nacional Desenvolvimento Científico e Tecnológico (CNPq) for the research fellowship to SFYO, WAVJ, MCMP and PPF.
Conflicts of Interest
The authors declare that there are no conflicts of interest.
Abbreviations
| Angeli’s salt | AS |
| benznidazole | BZ |
| Chagas disease | CD |
| Dimethyl Sulfoxide | DMSO |
| ethylenediaminetetraacetic acid | EDTA |
| inducible nitric oxide synthase | iNOS |
| Intraperitoneally | i.p. |
| 3-(4,5-dimethylthiazol- 2-yl)-2,5-Diphenyltetrazolium Bromide | MTT |
| nitric oxide | NO |
| Phosphate-buffered saline | PBS |
| t-butyl hydroperoxide | t-BHT |
| Roswell Park Memorial Institute | RPMI |
| relative light units | RLU |
| Standard error of the mean | SEM |
References
- WHO. Chagas disease (also known as American trypanosomiasis). Available online: https://www.who.int/news-room/fact-sheets/detail/chagas-disease-(american-trypanosomiasis).
- Coura, J.R.; Viñas, P.A. Chagas disease: A new worldwide challenge. Nature 2010, 465, S6–S7. [Google Scholar] [CrossRef]
- Lidani, K.C.F.; Andrade, F.A.; Bavia, L.; Damasceno, F.S.; Beltrame, M.H.; Messias-Reason, I.J.; Sandri, T.L. Chagas Disease: From Discovery to a Worldwide Health Problem. Front. Public Health 2019, 7, 166. [Google Scholar] [CrossRef]
- Cunha-Neto, E.; Chevillard, C. Chagas disease cardiomyopathy: Immunopathology and genetics. Mediat. Inflamm. 2014, 2014, 683230. [Google Scholar] [CrossRef]
- Tanowitz, H.B.; Machado, F.S.; Spray, D.C.; Friedman, J.M.; Weiss, O.S.; Lora, J.N.; Nagajyothi, J.; Moraes, D.N.; Garg, N.J.; Nunes, M.C.; et al. Developments in the management of Chagas cardiomyopathy. Expert Rev. Cardiovasc. Ther. 2015, 13, 1393–1409. [Google Scholar] [CrossRef]
- Vermelho, A.B.; Rodrigues, G.C.; Supuran, C.T. Why hasn't there been more progress in new Chagas disease drug discovery? Expert Opin. Drug Discov. 2020, 15, 145–158. [Google Scholar] [CrossRef]
- Andrade, Z.A. Immunopathology of Chagas disease. Mem. Do Inst. Oswaldo Cruz 1999, 94 (Suppl. S1), 71–80. [Google Scholar] [CrossRef] [PubMed]
- De Lana, M. Experimental studies of Chagas disease in animal models. In American Trypanosomiasis Chagas Disease; Elsevier, 2017; pp. 299–320. [Google Scholar] [CrossRef]
- Muñoz-Fernández, M.A.; Fernández, M.A.; Fresno, M. Synergism between tumor necrosis factor-alpha and interferon-gamma on macrophage activation for the killing of intracellular Trypanosoma cruzi through a nitric oxide-dependent mechanism. Eur. J. Immunol. 1992, 22, 301–307. [Google Scholar] [CrossRef] [PubMed]
- Borges, M.M.; Kloetzel, J.K.; Andrade, H.F., Jr.; Tadokoro, C.E.; Pinge-Filho, P.; Abrahamsohn, I. Prostaglandin and nitric oxide regulate TNF-alpha production during Trypanosoma cruzi infection. Immunol. Lett. 1998, 63, 1–8. [Google Scholar] [CrossRef]
- Martins, G.A.; Cardoso, M.A.; Aliberti, J.C.; Silva, J.S. Nitric oxide-induced apoptotic cell death in the acute phase of Trypanosoma cruzi infection in mice. Immunol. Lett. 1998, 63, 113–120. [Google Scholar] [CrossRef]
- Abrahamsohn, I.A.; Coffman, R.L. Cytokine and nitric oxide regulation of the immunosuppression in Trypanosoma cruzi infection. J. Immunol. 1995, 155, 3955–3963. [Google Scholar] [CrossRef] [PubMed]
- Gutierrez, F.R.; Mineo, T.W.; Pavanelli, W.R.; Guedes, P.M.; Silva, J.S. The effects of nitric oxide on the immune system during Trypanosoma cruzi infection. Mem. Do Inst. Oswaldo Cruz 2009, 104 Suppl 1, 236–245. [Google Scholar] [CrossRef]
- Rogério Pavanelli, W.; Nogueira Silva, J.J. The Role of Nitric Oxide in immune response against Trypanosoma cruzi infection. Open Nitric Oxide J. 2010, 2. [Google Scholar] [CrossRef]
- Chandrasekar, B.; Melby, P.C.; Troyer, D.A.; Freeman, G.L. Differential regulation of nitric oxide synthase isoforms in experimental acute chagasic cardiomyopathy. Clin. Exp. Immunol. 2000, 121, 112–119. [Google Scholar] [CrossRef] [PubMed]
- Silva, J.S.; Machado, F.S.; Martins, G.A. The role of nitric oxide in the pathogenesis of Chagas disease. Front. Biosci. A J. Virtual Libr. 2003, 8, s314–s325. [Google Scholar] [CrossRef] [PubMed]
- Panis, C.; Mazzuco, T.L.; Costa, C.Z.; Victorino, V.J.; Tatakihara, V.L.; Yamauchi, L.M.; Yamada-Ogatta, S.F.; Cecchini, R.; Rizzo, L.V.; Pinge-Filho, P. Trypanosoma cruzi: Effect of the absence of 5-lipoxygenase (5-LO)-derived leukotrienes on levels of cytokines, nitric oxide and iNOS expression in cardiac tissue in the acute phase of infection in mice. Exp. Parasitol. 2011, 127, 58–65. [Google Scholar] [CrossRef] [PubMed]
- Irvine, J.C.; Favaloro, J.L.; Widdop, R.E.; Kemp-Harper, B.K. Nitroxyl anion donor, Angeli's salt, does not develop tolerance in rat isolated aortae. Hypertension 2007, 49, 885–892. [Google Scholar] [CrossRef]
- Pinge-Filho, P.; Pereira, R.S.; Malvezi, A.D.; Lucchetti, B.F.C.; Cecchini, R.; Yamauchi, L.M.; Yamada-Ogatta, S.F.; Verri Jr, W.A.; Martins-Pinge, M.C.; Tatakihara, V.L.H. Actions of Angeli's salt, a nitroxyl (HNO) donor, on Trypanosoma cruzi infection. FASEB J. 2019, 33, 662. [Google Scholar] [CrossRef]
- Zarpelon, A.C.; Souza, G.R.; Cunha, T.M.; Schivo, I.R.; Marchesi, M.; Casagrande, R.; Pinge-Filho, P.; Cunha, F.Q.; Ferreira, S.H.; Miranda, K.M.; et al. The nitroxyl donor, Angeli's salt, inhibits inflammatory hyperalgesia in rats. Neuropharmacology 2013, 71, 1–9. [Google Scholar] [CrossRef]
- Andrews, K.L.; Irvine, J.C.; Tare, M.; Apostolopoulos, J.; Favaloro, J.L.; Triggle, C.R.; Kemp-Harper, B.K. A role for nitroxyl (HNO) as an endothelium-derived relaxing and hyperpolarizing factor in resistance arteries. Br. J. Pharmacol. 2009, 157, 540–550. [Google Scholar] [CrossRef] [PubMed]
- Miranda, K.M.; Paolocci, N.; Katori, T.; Thomas, D.D.; Ford, E.; Bartberger, M.D.; Espey, M.G.; Kass, D.A.; Feelisch, M.; Fukuto, J.M. A biochemical rationale for the discrete behavior of nitroxyl and nitric oxide in the cardiovascular system. Proc. Natl. Acad. Sci. USA 2003, 100, 9196–9201. [Google Scholar] [CrossRef]
- Irvine, J.C.; Ritchie, R.H.; Favaloro, J.L.; Andrews, K.L.; Widdop, R.E.; Kemp-Harper, B.K. Nitroxyl (HNO): The Cinderella of the nitric oxide story. Trends Pharmacol. Sci. 2008, 29, 601–608. [Google Scholar]
- Kemp-Harper, B.K. Nitroxyl (HNO): A novel redox signaling molecule. Antioxid. Redox Signal. 2011, 14, 1609–1613. [Google Scholar] [CrossRef] [PubMed]
- Zingales, B.; Andrade, S.G.; Briones, M.R.; Campbell, D.A.; Chiari, E.; Fernandes, O.; Guhl, F.; Lages-Silva, E.; Macedo, A.M.; Machado, C.R.; et al. A new consensus for Trypanosoma cruzi intraspecific nomenclature: Second revision meeting recommends TcI to TcVI. Mem. Do Inst. Oswaldo Cruz 2009, 104, 1051–1054. [Google Scholar] [CrossRef]
- Brener, Z. Therapeutic activity and criterion of cure on mice experimentally infected with Trypanosoma cruzi. Rev. Do Inst. De Med. Trop. De Sao Paulo 1962, 4, 389–396. [Google Scholar]
- Smith, P.A.; Hein, G.E. The alleged role of nitroxyl in certain reactions of aldehydes and alkyl halides1. J. Am. Chem. Soc. 1960, 82, 5731–5740. [Google Scholar] [CrossRef]
- Maragos, C.M.; Morley, D.; Wink, D.A.; Dunams, T.M.; Saavedra, J.E.; Hoffman, A.; Bove, A.A.; Isaac, L.; Hrabie, J.A.; Keefer, L.K. Complexes of.NO with nucleophiles as agents for the controlled biological release of nitric oxide. Vasorelaxant effects. J. Med. Chem. 1991, 34, 3242–3247. [Google Scholar] [CrossRef]
- Marcondes, M.C.; Borelli, P.; Yoshida, N.; Russo, M. Acute Trypanosoma cruzi infection is associated with anemia, thrombocytopenia, leukopenia, and bone marrow hypoplasia: Reversal by nifurtimox treatment. Microbes Infect. 2000, 2, 347–352. [Google Scholar] [CrossRef]
- da Silva, R.V.; Malvezi, A.D.; Augusto Lda, S.; Kian, D.; Tatakihara, V.L.; Yamauchi, L.M.; Yamada-Ogatta, S.F.; Rizzo, L.V.; Schenkman, S.; Pinge-Filho, P. Oral exposure to Phytomonas serpens attenuates thrombocytopenia and leukopenia during acute infection with Trypanosoma cruzi. PLoS ONE 2013, 8, e68299. [Google Scholar] [CrossRef]
- Lovo-Martins, M.I.; Malvezi, A.D.; da Silva, R.V.; Zanluqui, N.G.; Tatakihara, V.L.H.; Câmara, N.O.S.; de Oliveira, A.P.L.; Peron, J.P.S.; Martins-Pinge, M.C.; Fritsche, K.L.; et al. Fish oil supplementation benefits the murine host during the acute phase of a parasitic infection from Trypanosoma cruzi. Nutr. Res. 2017, 41, 73–85. [Google Scholar] [CrossRef]
- Malvezi, A.D.; Cecchini, R.; de Souza, F.; Tadokoro, C.E.; Rizzo, L.V.; Pinge-Filho, P. Involvement of nitric oxide (NO) and TNF-alpha in the oxidative stress associated with anemia in experimental Trypanosoma cruzi infection. FEMS Immunol. Med. Microbiol. 2004, 41, 69–77. [Google Scholar] [CrossRef]
- Lissi, E.; Franz, R.; Cabezas, J.; Fernández, V.; Videla, L.A. Effects of antioxidants and haemoglobin status on the t-butyl hydroperoxide-induced oxygen uptake by red blood cells. Cell Biochem. Funct. 1986, 4, 61–68. [Google Scholar] [CrossRef] [PubMed]
- Hideko Tatakihara, V.L.; Cecchini, R.; Borges, C.L.; Malvezi, A.D.; Graça-de Souza, V.K.; Yamada-Ogatta, S.F.; Rizzo, L.V.; Pinge-Filho, P. Effects of cyclooxygenase inhibitors on parasite burden, anemia and oxidative stress in murine Trypanosoma cruzi infection. FEMS Immunol. Med. Microbiol. 2008, 52, 47–58. [Google Scholar] [CrossRef] [PubMed]
- Tatakihara, V.L.; Malvezi, A.D.; Panis, C.; Cecchini, R.; Zanluqui, N.G.; Yamauchi, L.M.; Martins, M.I.; da Silva, R.V.; Yamada-Ogatta, S.F.; Rizzo, L.V.; et al. Nitric oxide-releasing indomethacin enhances susceptibility to Trypanosoma cruzi infection acting in the cell invasion and oxidative stress associated with anemia. Chem. -Biol. Interact. 2015, 227, 104–111. [Google Scholar] [CrossRef]
- Gonzalez Flecha, B.; Llesuy, S.; Boveris, A. Hydroperoxide-initiated chemiluminescence: An assay for oxidative stress in biopsies of heart, liver, and muscle. Free Radic. Biol. Med. 1991, 10, 93–100. [Google Scholar] [CrossRef] [PubMed]
- Casado, M.F.; Cecchini, A.L.; Simão, A.N.; Oliveira, R.D.; Cecchini, R. Free radical-mediated pre-hemolytic injury in human red blood cells subjected to lead acetate as evaluated by chemiluminescence. Food Chem. Toxicol. Int. J. Publ. Br. Ind. Biol. Res. Assoc. 2007, 45, 945–952. [Google Scholar] [CrossRef]
- Navarro-Gonzálvez, J.A.; García-Benayas, C.; Arenas, J. Semiautomated measurement of nitrate in biological fluids. Clin. Chem. 1998, 44, 679–681. [Google Scholar] [CrossRef]
- Polanco-Hernández, G.; Escalante-Erosa, F.; García-Sosa, K.; Acosta-Viana, K.; Chan-Bacab, M.J.; Sagua-Franco, H.; González, J.; Osorio-Rodríguez, L.; Moo-Puc, R.E.; Peña-Rodríguez, L.M. In vitro and in vivo trypanocidal activity of native plants from the Yucatan Peninsula. Parasitol. Res. 2012, 110, 31–35. [Google Scholar] [CrossRef]
- Barrias, E.S.; Reignault, L.C.; De Souza, W.; Carvalho, T.M. Dynasore, a dynamin inhibitor, inhibits Trypanosoma cruzi entry into peritoneal macrophages. PLoS ONE 2010, 5, e7764. [Google Scholar] [CrossRef]
- Malvezi, A.D.; da Silva, R.V.; Panis, C.; Yamauchi, L.M.; Lovo-Martins, M.I.; Zanluqui, N.G.; Tatakihara, V.L.; Rizzo, L.V.; Verri, W.A., Jr.; Martins-Pinge, M.C.; et al. Aspirin modulates innate inflammatory response and inhibits the entry of Trypanosoma cruzi in mouse peritoneal macrophages. Mediat. Inflamm. 2014, 2014, 580919. [Google Scholar] [CrossRef]
- Malvezi, A.D.; Panis, C.; da Silva, R.V.; de Freitas, R.C.; Lovo-Martins, M.I.; Tatakihara, V.L.; Zanluqui, N.G.; Neto, E.C.; Goldenberg, S.; Bordignon, J.; et al. Inhibition of cyclooxygenase-1 and cyclooxygenase-2 impairs Trypanosoma cruzi entry into cardiac cells and promotes differential modulation of the inflammatory response. Antimicrob. Agents Chemother. 2014, 58, 6157–6164. [Google Scholar] [CrossRef]
- Lonien, S.C.H.; Malvezi, A.D.; Suzukawa, H.T.; Yamauchi, L.M.; Yamada-Ogatta, S.F.; Rizzo, L.V.; Bordignon, J.; Pinge-Filho, P. Response to Trypanosoma cruzi by Human Blood Cells Enriched with Dentritic Cells Is Controlled by Cyclooxygenase-2 Pathway. Front. Microbiol. 2017, 8, 2020. [Google Scholar] [CrossRef]
- Silva, J.J.; Osakabe, A.L.; Pavanelli, W.R.; Silva, J.S.; Franco, D.W. In vitro and in vivo antiproliferative and trypanocidal activities of ruthenium NO donors. Br. J. Pharmacol. 2007, 152, 112–121. [Google Scholar] [CrossRef] [PubMed]
- Silva, J.J.; Pavanelli, W.R.; Pereira, J.C.; Silva, J.S.; Franco, D.W. Experimental chemotherapy against Trypanosoma cruzi infection using ruthenium nitric oxide donors. Antimicrob. Agents Chemother. 2009, 53, 4414–4421. [Google Scholar] [CrossRef] [PubMed]
- Sánchez-Villamil, J.P.; Bautista-Niño, P.K.; Serrano, N.C.; Rincon, M.Y.; Garg, N.J. Potential Role of Antioxidants as Adjunctive Therapy in Chagas Disease. Oxidative Med. Cell. Longev. 2020, 2020, 9081813. [Google Scholar] [CrossRef]
- Panis, C.; Herrera, A.C.; Victorino, V.J.; Campos, F.C.; Freitas, L.F.; De Rossi, T.; Colado Simão, A.N.; Cecchini, A.L.; Cecchini, R. Oxidative stress and hematological profiles of advanced breast cancer patients subjected to paclitaxel or doxorubicin chemotherapy. Breast Cancer Res. Treat. 2012, 133, 89–97. [Google Scholar] [CrossRef] [PubMed]
Figure 1.
Experimental design. C57BL/6 mice were treated daily with varying doses of Angeli’s salt (6, 60, and 600 µg/kg/animal) diluted in phosphate buffer (PBS) with pH 7.2 via intraperitoneal route. The treatment was administered 15 minutes post-infection for a duration of 12 days. During the acute phase, parasitemia was monitored by counting blood-borne trypomastigotes, while survival was observed daily until day 31 post-infection. At 12 days post-infection, plasma nitrite level, oxidative stress and macrophage infection were measured. All blood analyses and cell counts were conducted using standard methods.
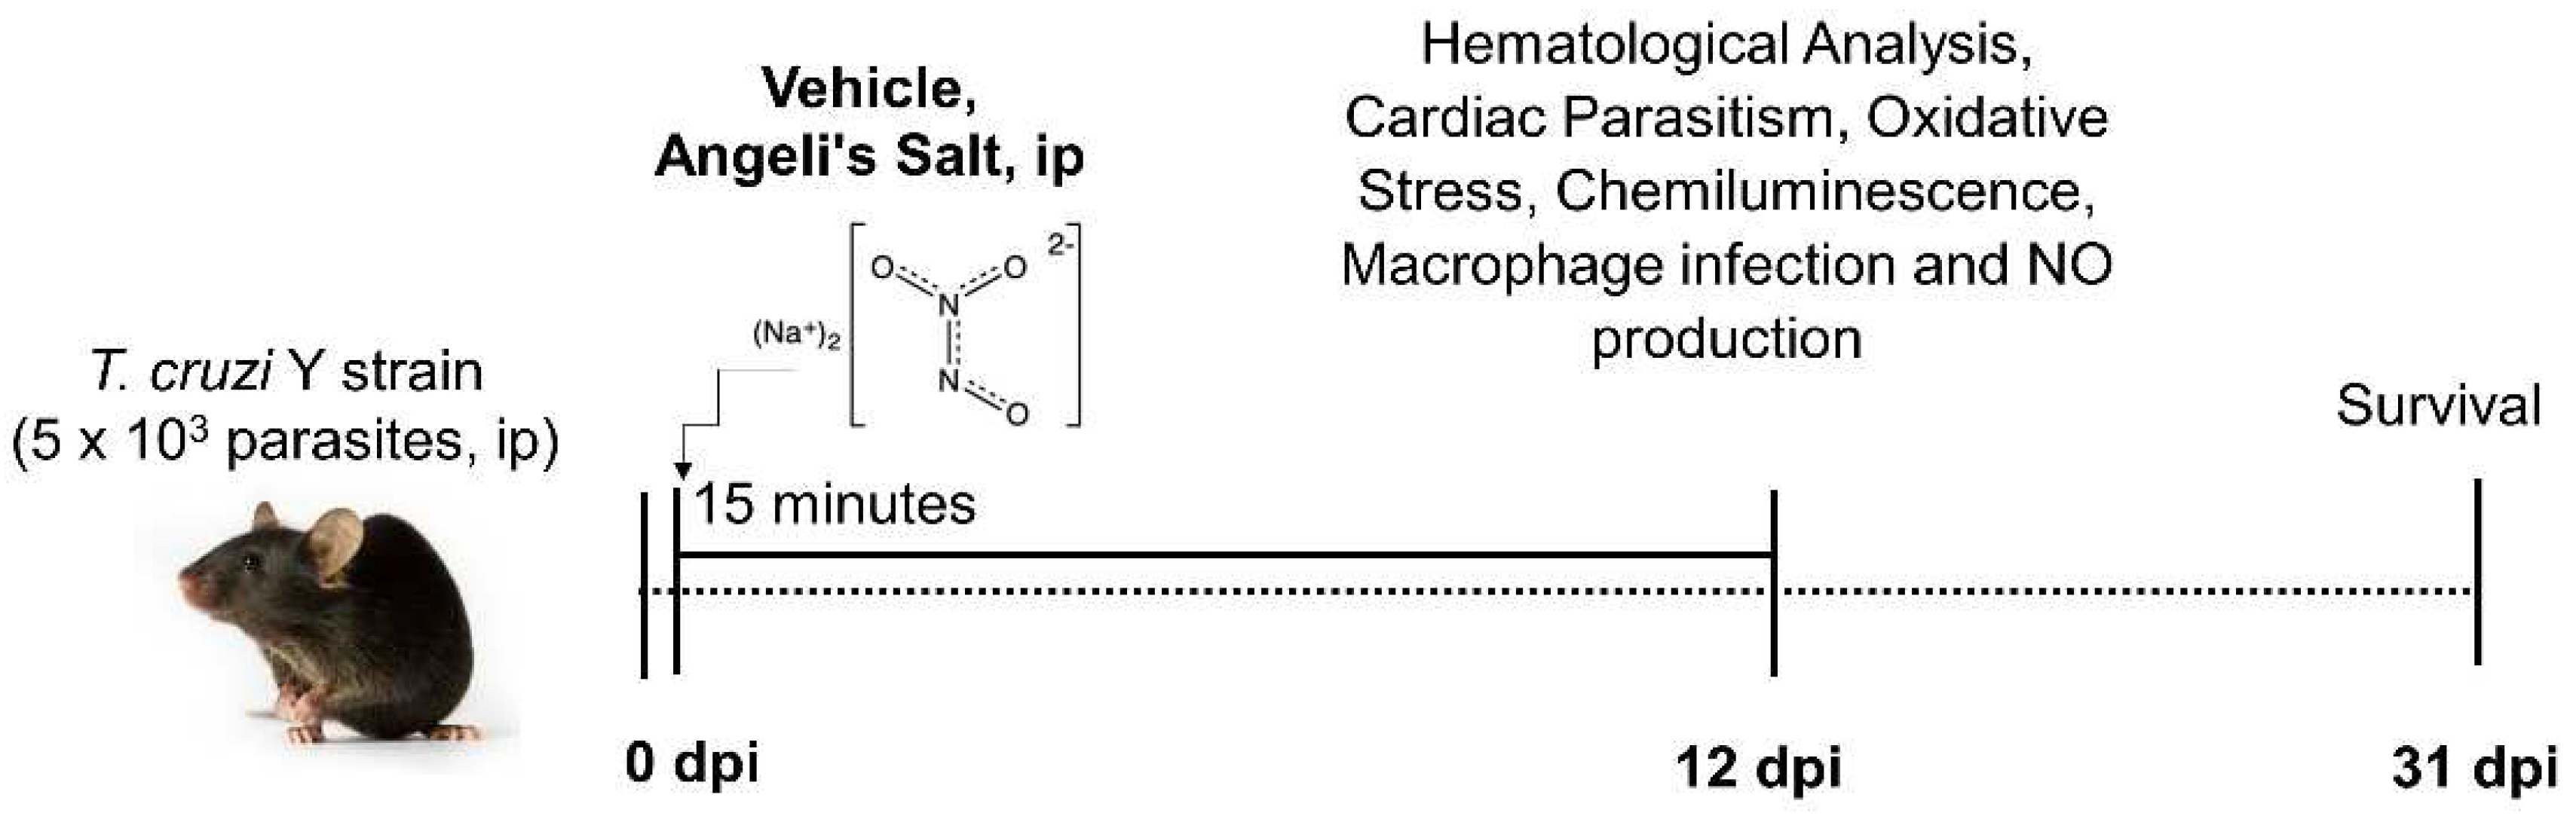
Figure 2.
T. cruzi infection course and response to AS-therapy. C57BL/6 mice were infected with 5 x 10³ trypomastigotes of T. cruzi. Daily treatment with AS (6-600 µg/kg/mouse) was initiated 15 minutes after infection and continued for 12 days. Control T. cruzi-infected mice received PBS (n = 5–10). The mean ± SEM values shown are representative of three independent experiments, and significant differences in parasitemia were observed (*p = 0.0067, Friedman test). (A) treatment with AS at doses of 6ug/kg, (B) 60ug/kg, and (C) 600ug/kg. Overall parasitemia was also represented as area under the curve (AUC) analysis. Significance was determined as *p = 0.0025 (D); *p = 0.00190 (E) and *p = 0.0091 (F), applying unpaired t test.
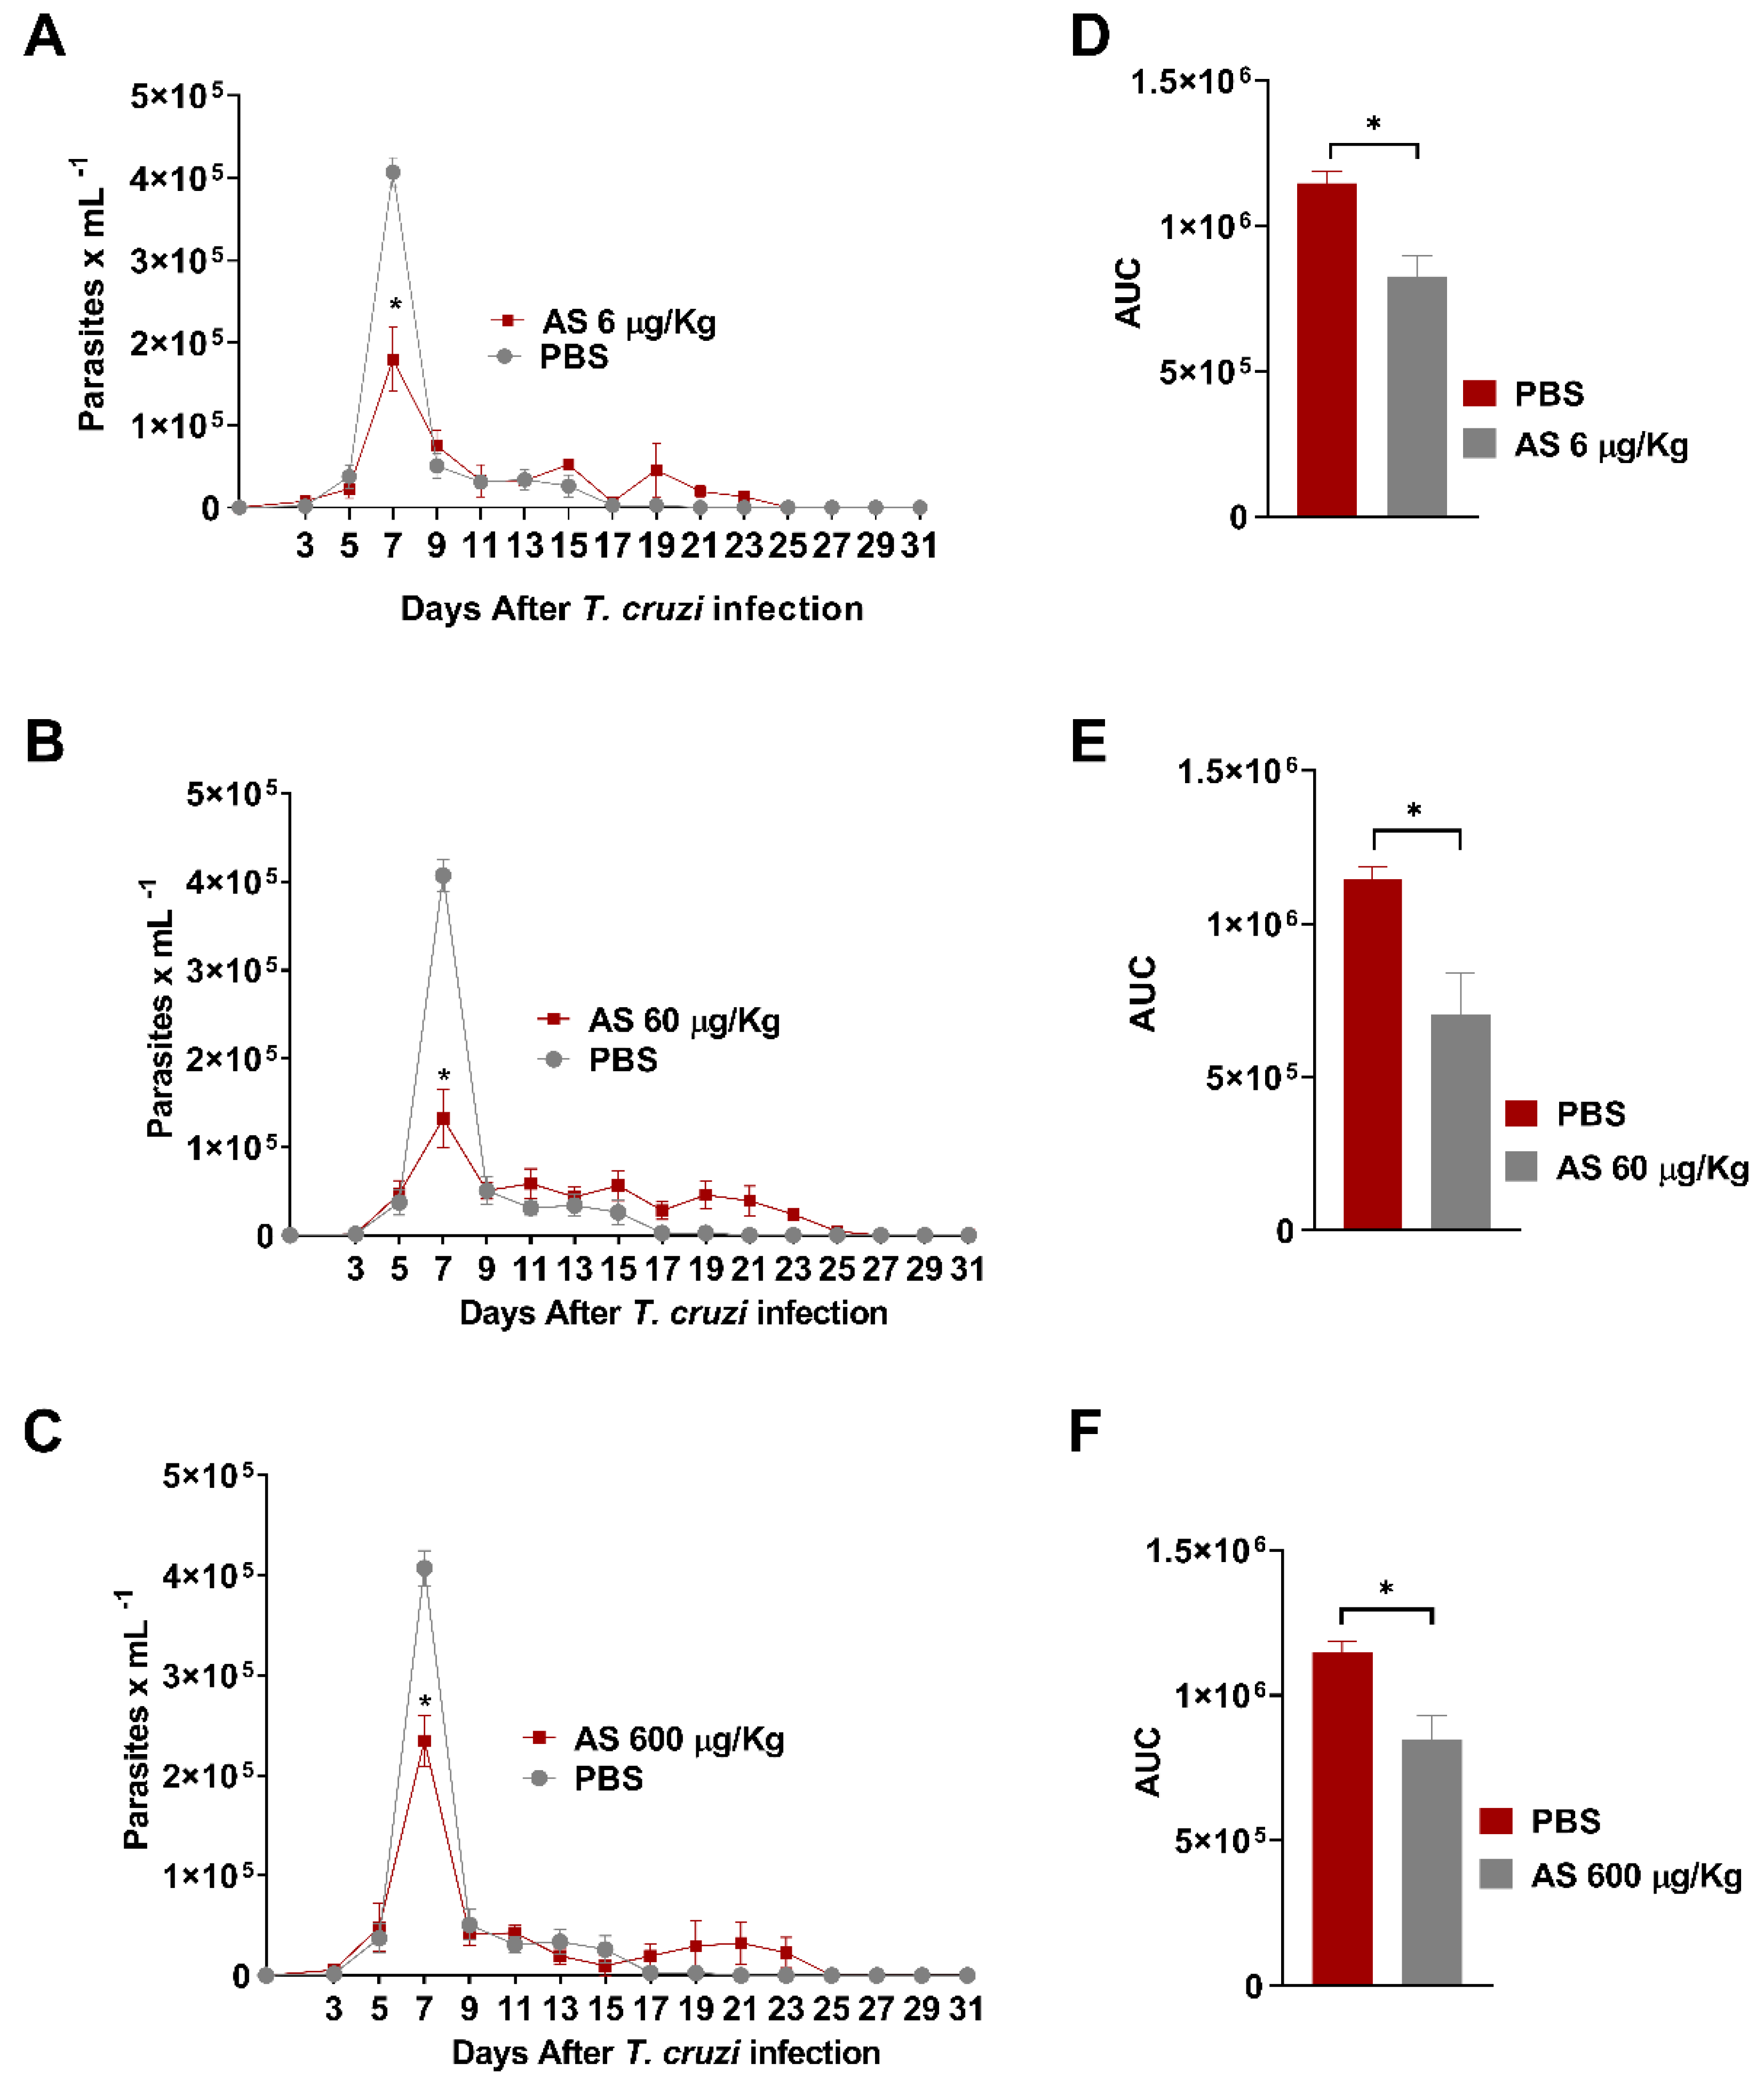
Figure 3.
The effect of AS on anemia in T. cruzi-infected mice. At day 12 post-infection, (A) hematocrit and (B) hemoglobin were evaluated. C57BL/6 mice were divided into groups of five and infected with 5 x 10³ T. cruzi, treated or not with AS (6-600 µg/Kg/mouse). Control T. cruzi-infected mice (Tc group) received PBS. The mean ± SEM values shown are representative of three independent experiments, and significant differences were observed between uninfected and infected groups. *p ≤ 0.05, two-way ANOVA with Tukey post-test, ns = non significance.
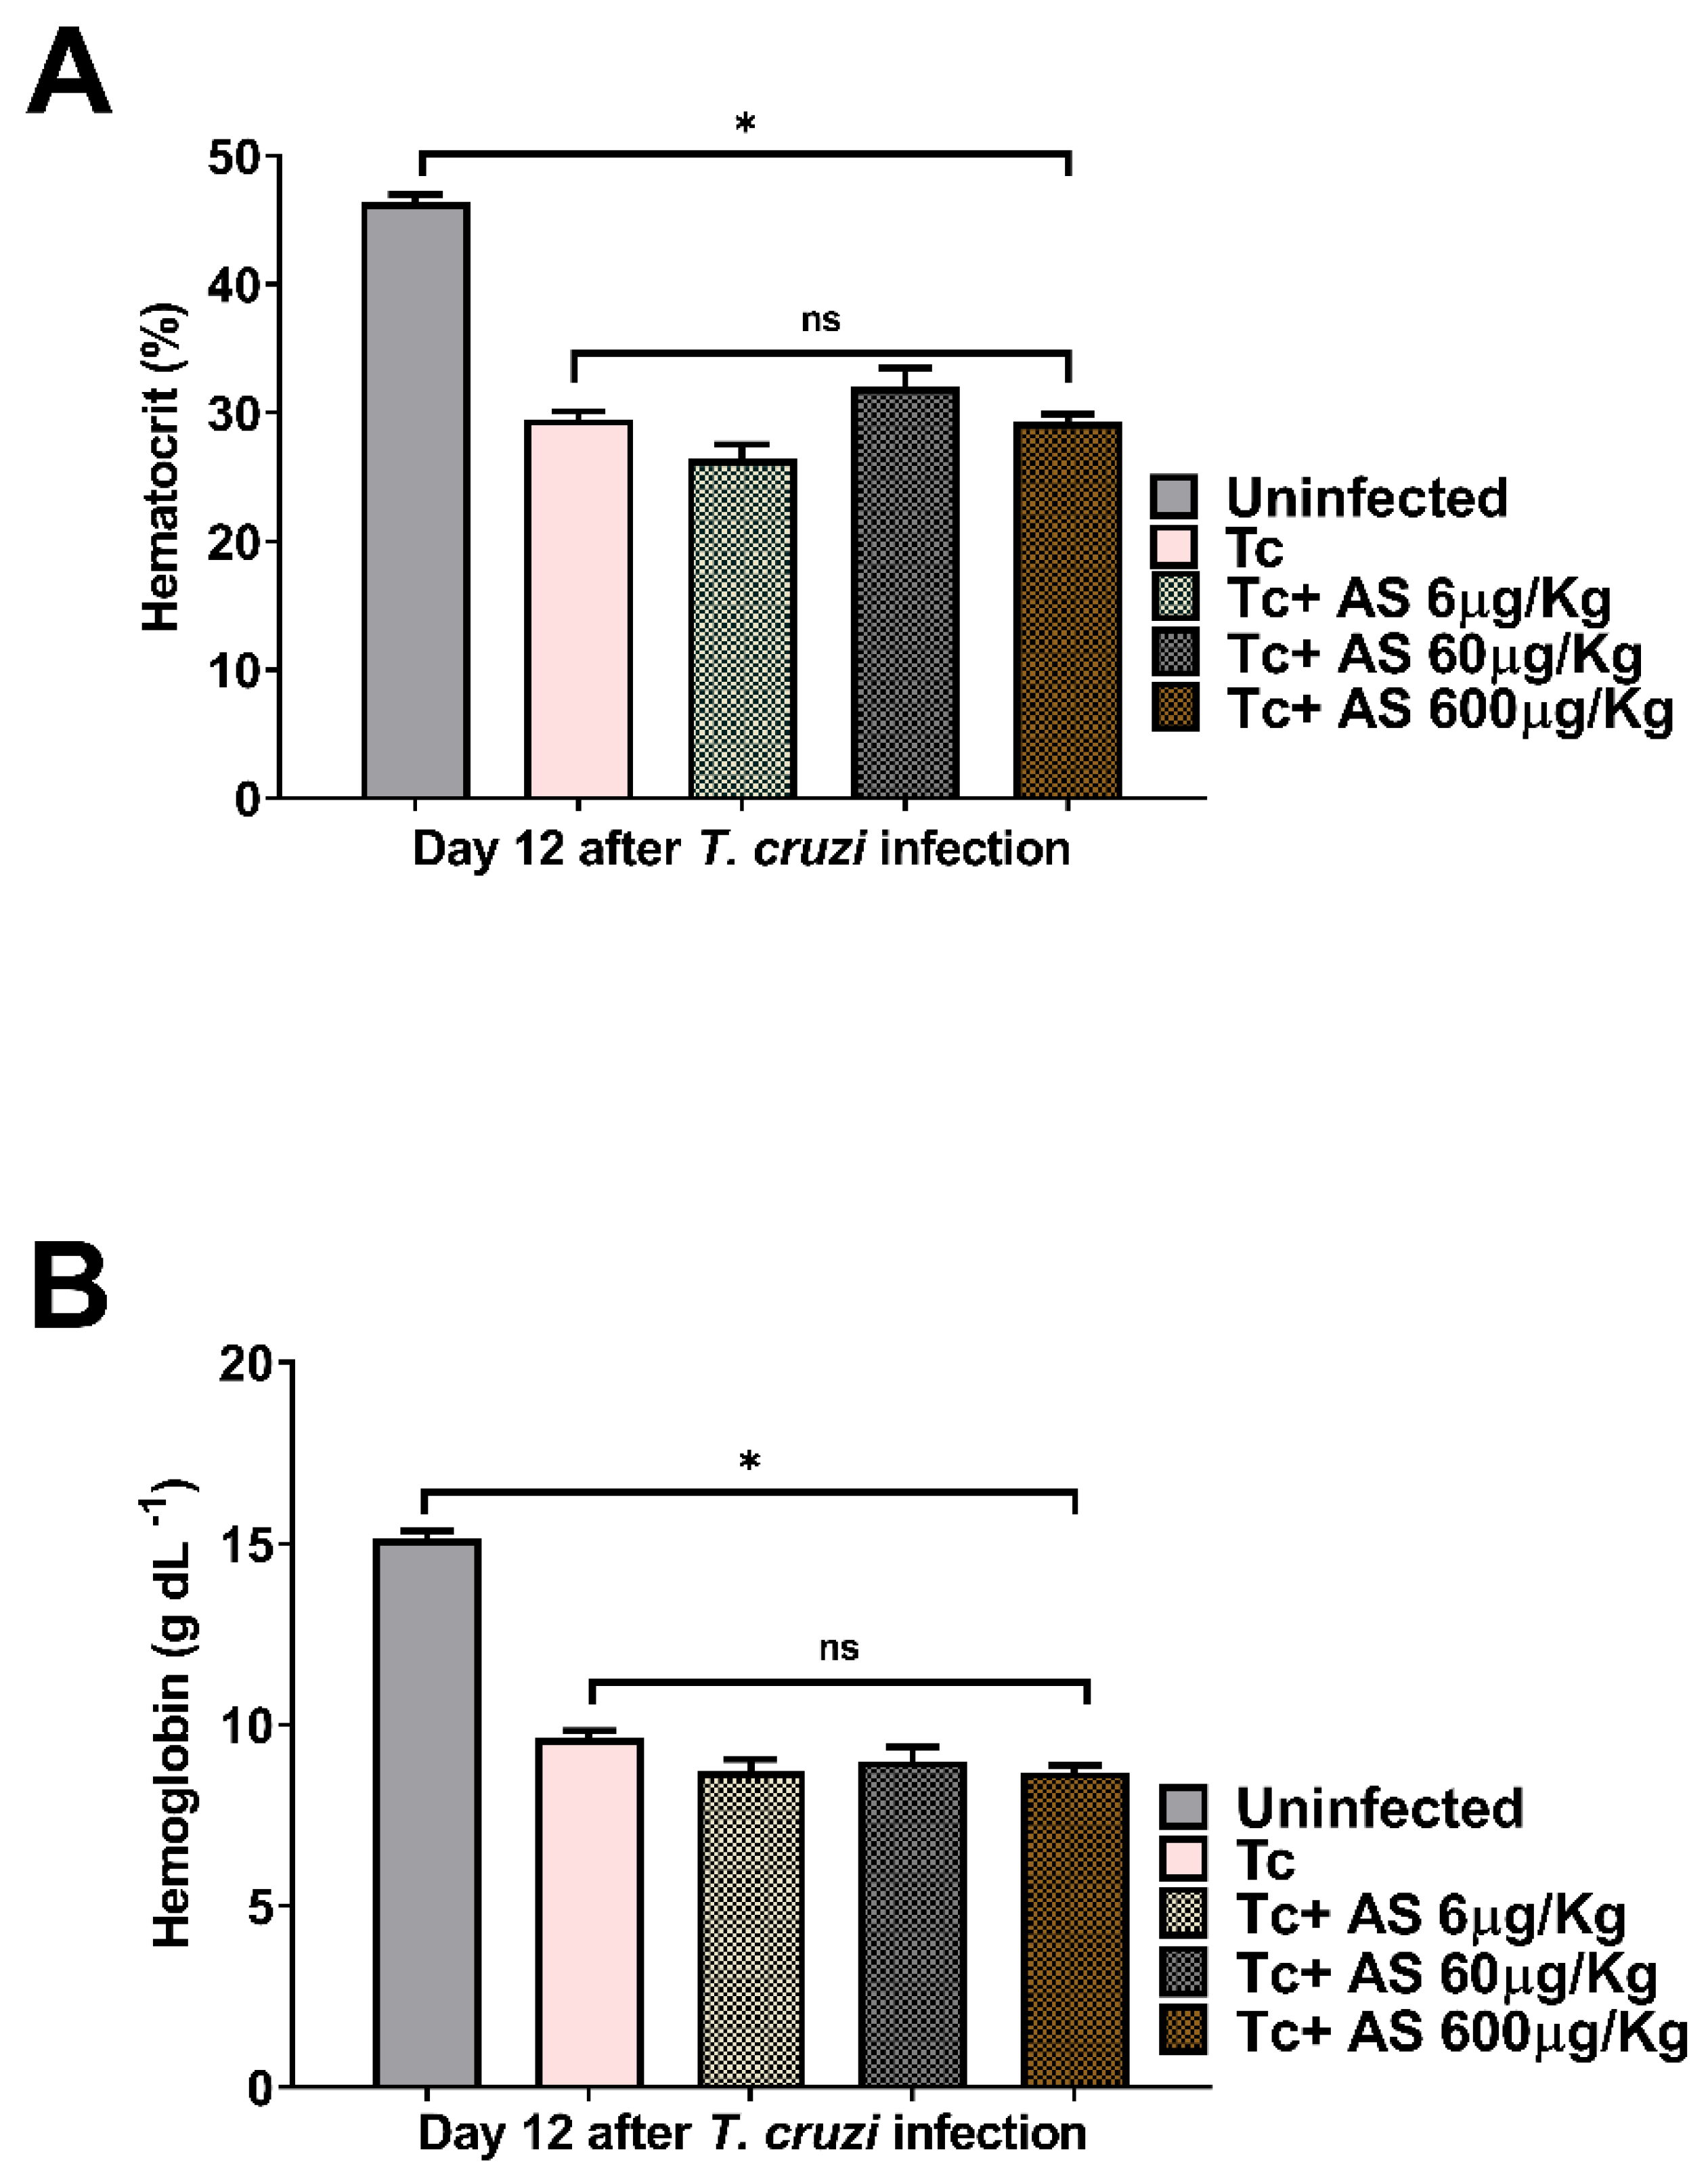
Figure 4.
AS mitigates leukopenia and thrombocytopenia observed during the acute phase of T. cruzi infection (day 12 p.i). C57BL/6 mice were divided into groups of five and infected with 5 x 10³ T. cruzi, treated or not with AS (6-600 µg/Kg/mouse). Control T. cruzi-infected mice (Tc group) received PBS. The mean ± SEM values shown are representative of three independent experiments. (A) leukocytes, *p ≤ 0.05, two-way ANOVA with Tukey post-test (*Uninfected vs experimental groups), (# infected groups treated with AS 60 and 600 µg/Kg/mouse group vs uninfected group and vs infected group treated with AS 6 µg/Kg/mouse group). (B) Platelets and (C) reticulocytes, *p ≤ 0.05, two-way ANOVA with Tukey post-test (*Uninfected vs experimental groups), ns = non significance.
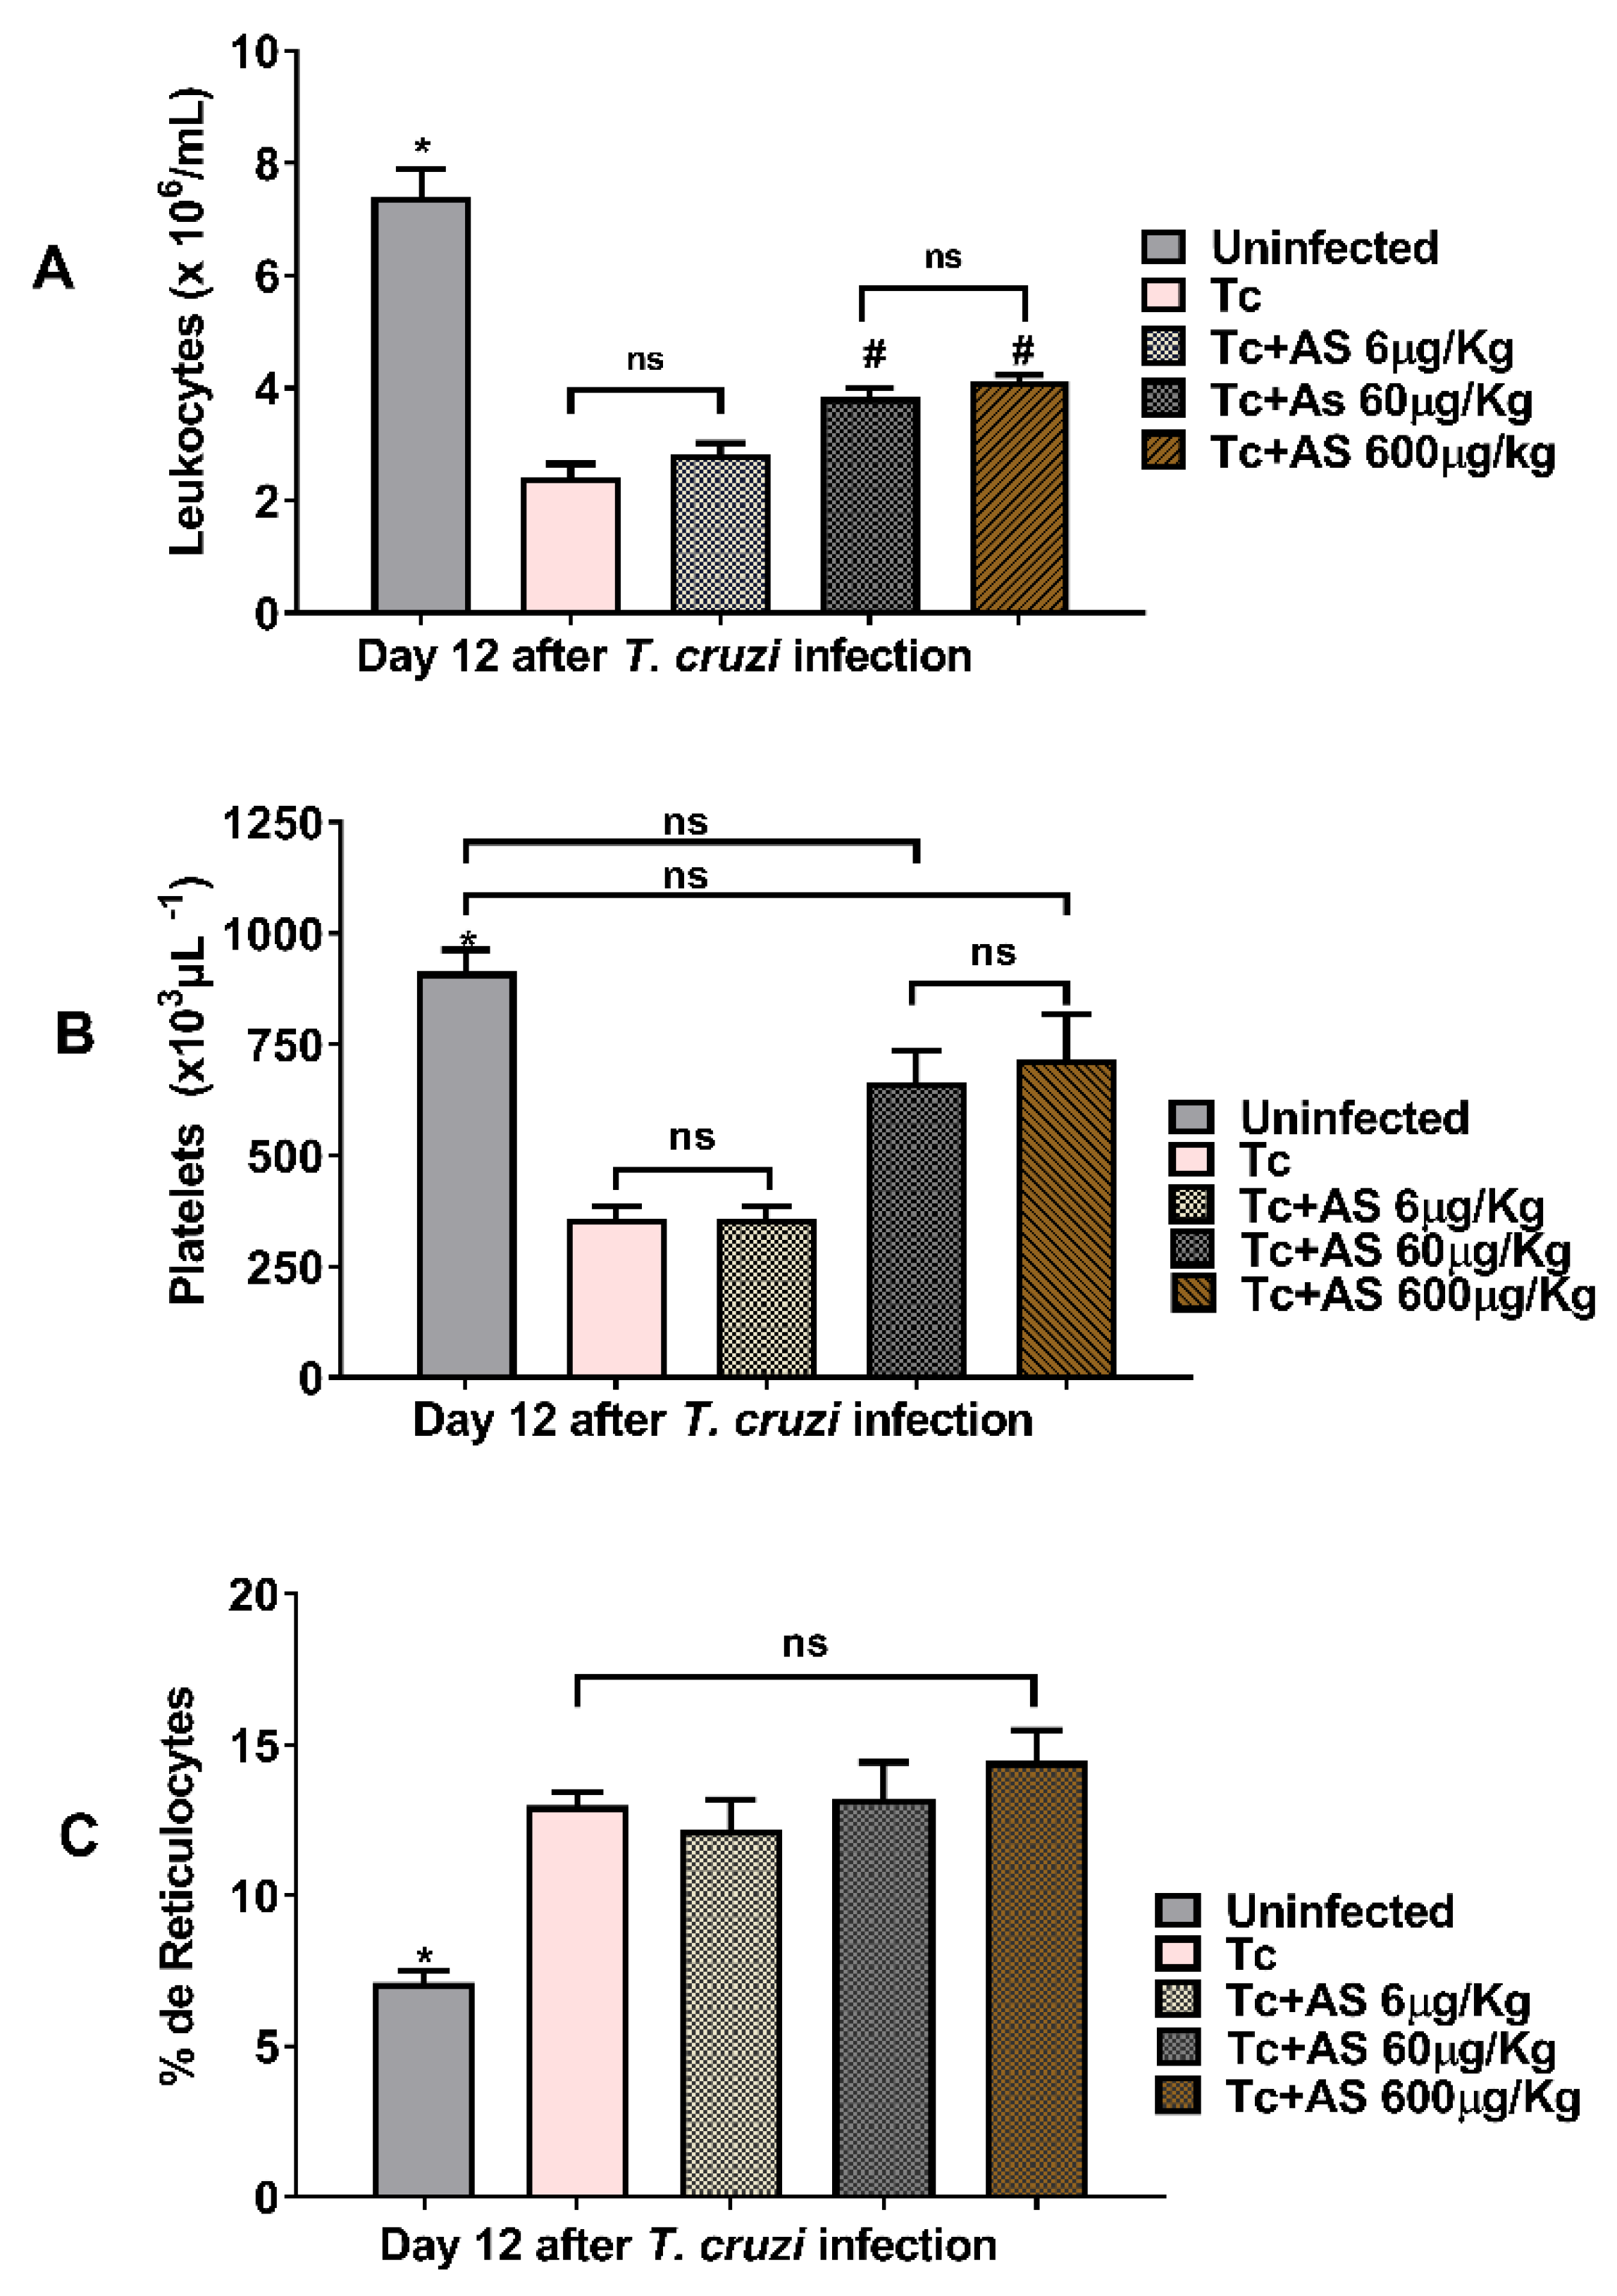
Figure 5.
Effect of AS on heart parasitism. C57BL/6 mice were divided into groups of three to five and infected with 5 x 10³ T. cruzi, treated or not with AS (6-600 µg/Kg/mouse). Control T. cruzi-infected mice received PBS. Animals were euthanized 12 days after infection and sections of the heart from each mouse were collected for histopathology analysis. Tissue fragments were fixed in 10% buffered formalin solution, dehydrated, cleared and embedded in paraffin. Frozen tissue was cut into 5-mm-thick sections and stained with hematoxylin-eosin (H&E) for the assessment of amastigote nests. (A) Tissue parasitism was scored by counting the total number of amastigote nests in 25 microscope fields (1 × 400 magnification) per histopathological section. The mean ± SEM values shown are representative of two independent experiments, *p ≤ 0.05, two-way ANOVA with Tukey post-test (*Control vs experimental groups). (B) Representative photomicrograph of cardiac tissue from controls and experimental groups.
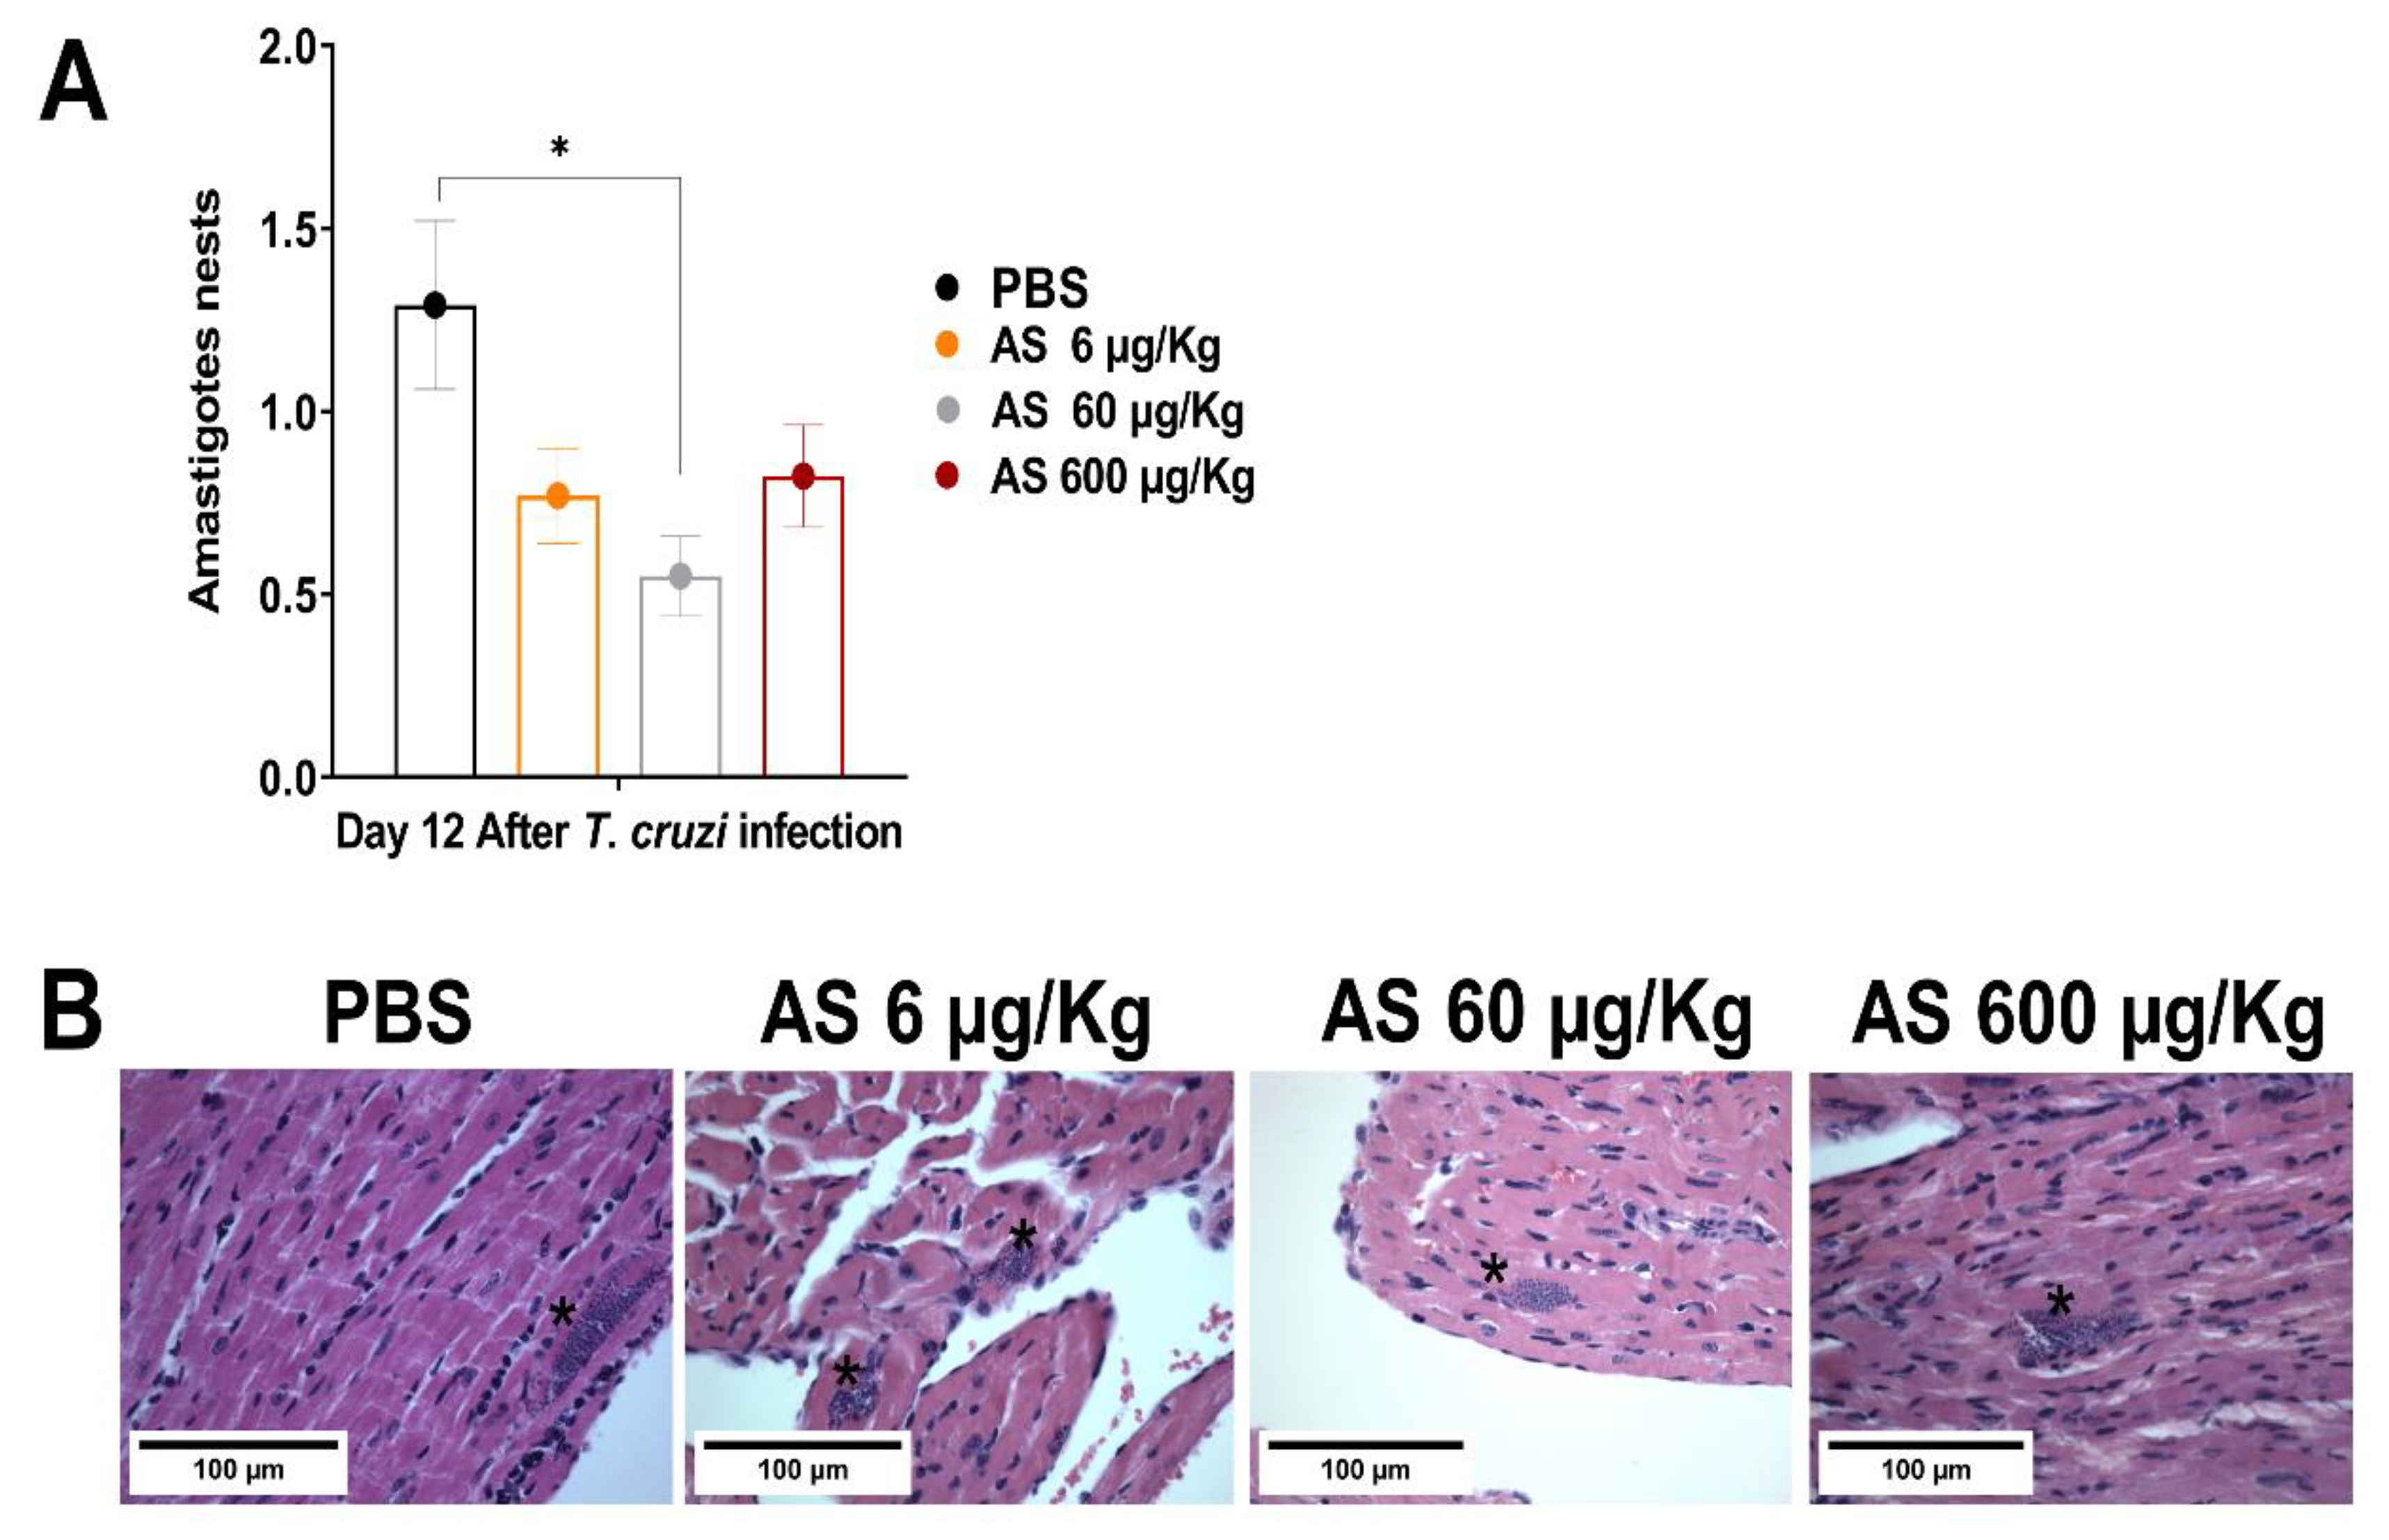
Figure 6.
AS attenuates erythrocyte oxidative stress on day 12 after T. cruzi infection. (A) Oxygen uptake and (B) induction time. Groups of C57BL/6 mice (n = 5/group) were infected with 5 x 10³ T. cruzi and treated or not with AS (6-600 µg/Kg/mouse). Control T. cruzi-infected) mice (Tc group) received PBS. Values represent the mean ± SEM and are representative of three independent experiments. The mean ± SEM values shown are representative of two independent experiments, *p ≤ 0.05, two-way ANOVA with Tukey post-test (*Uninfected vs experimental groups), # p ≤ 0.05, two-way ANOVA with Tukey post-test (*Control vs experimental groups). ns = non significance.
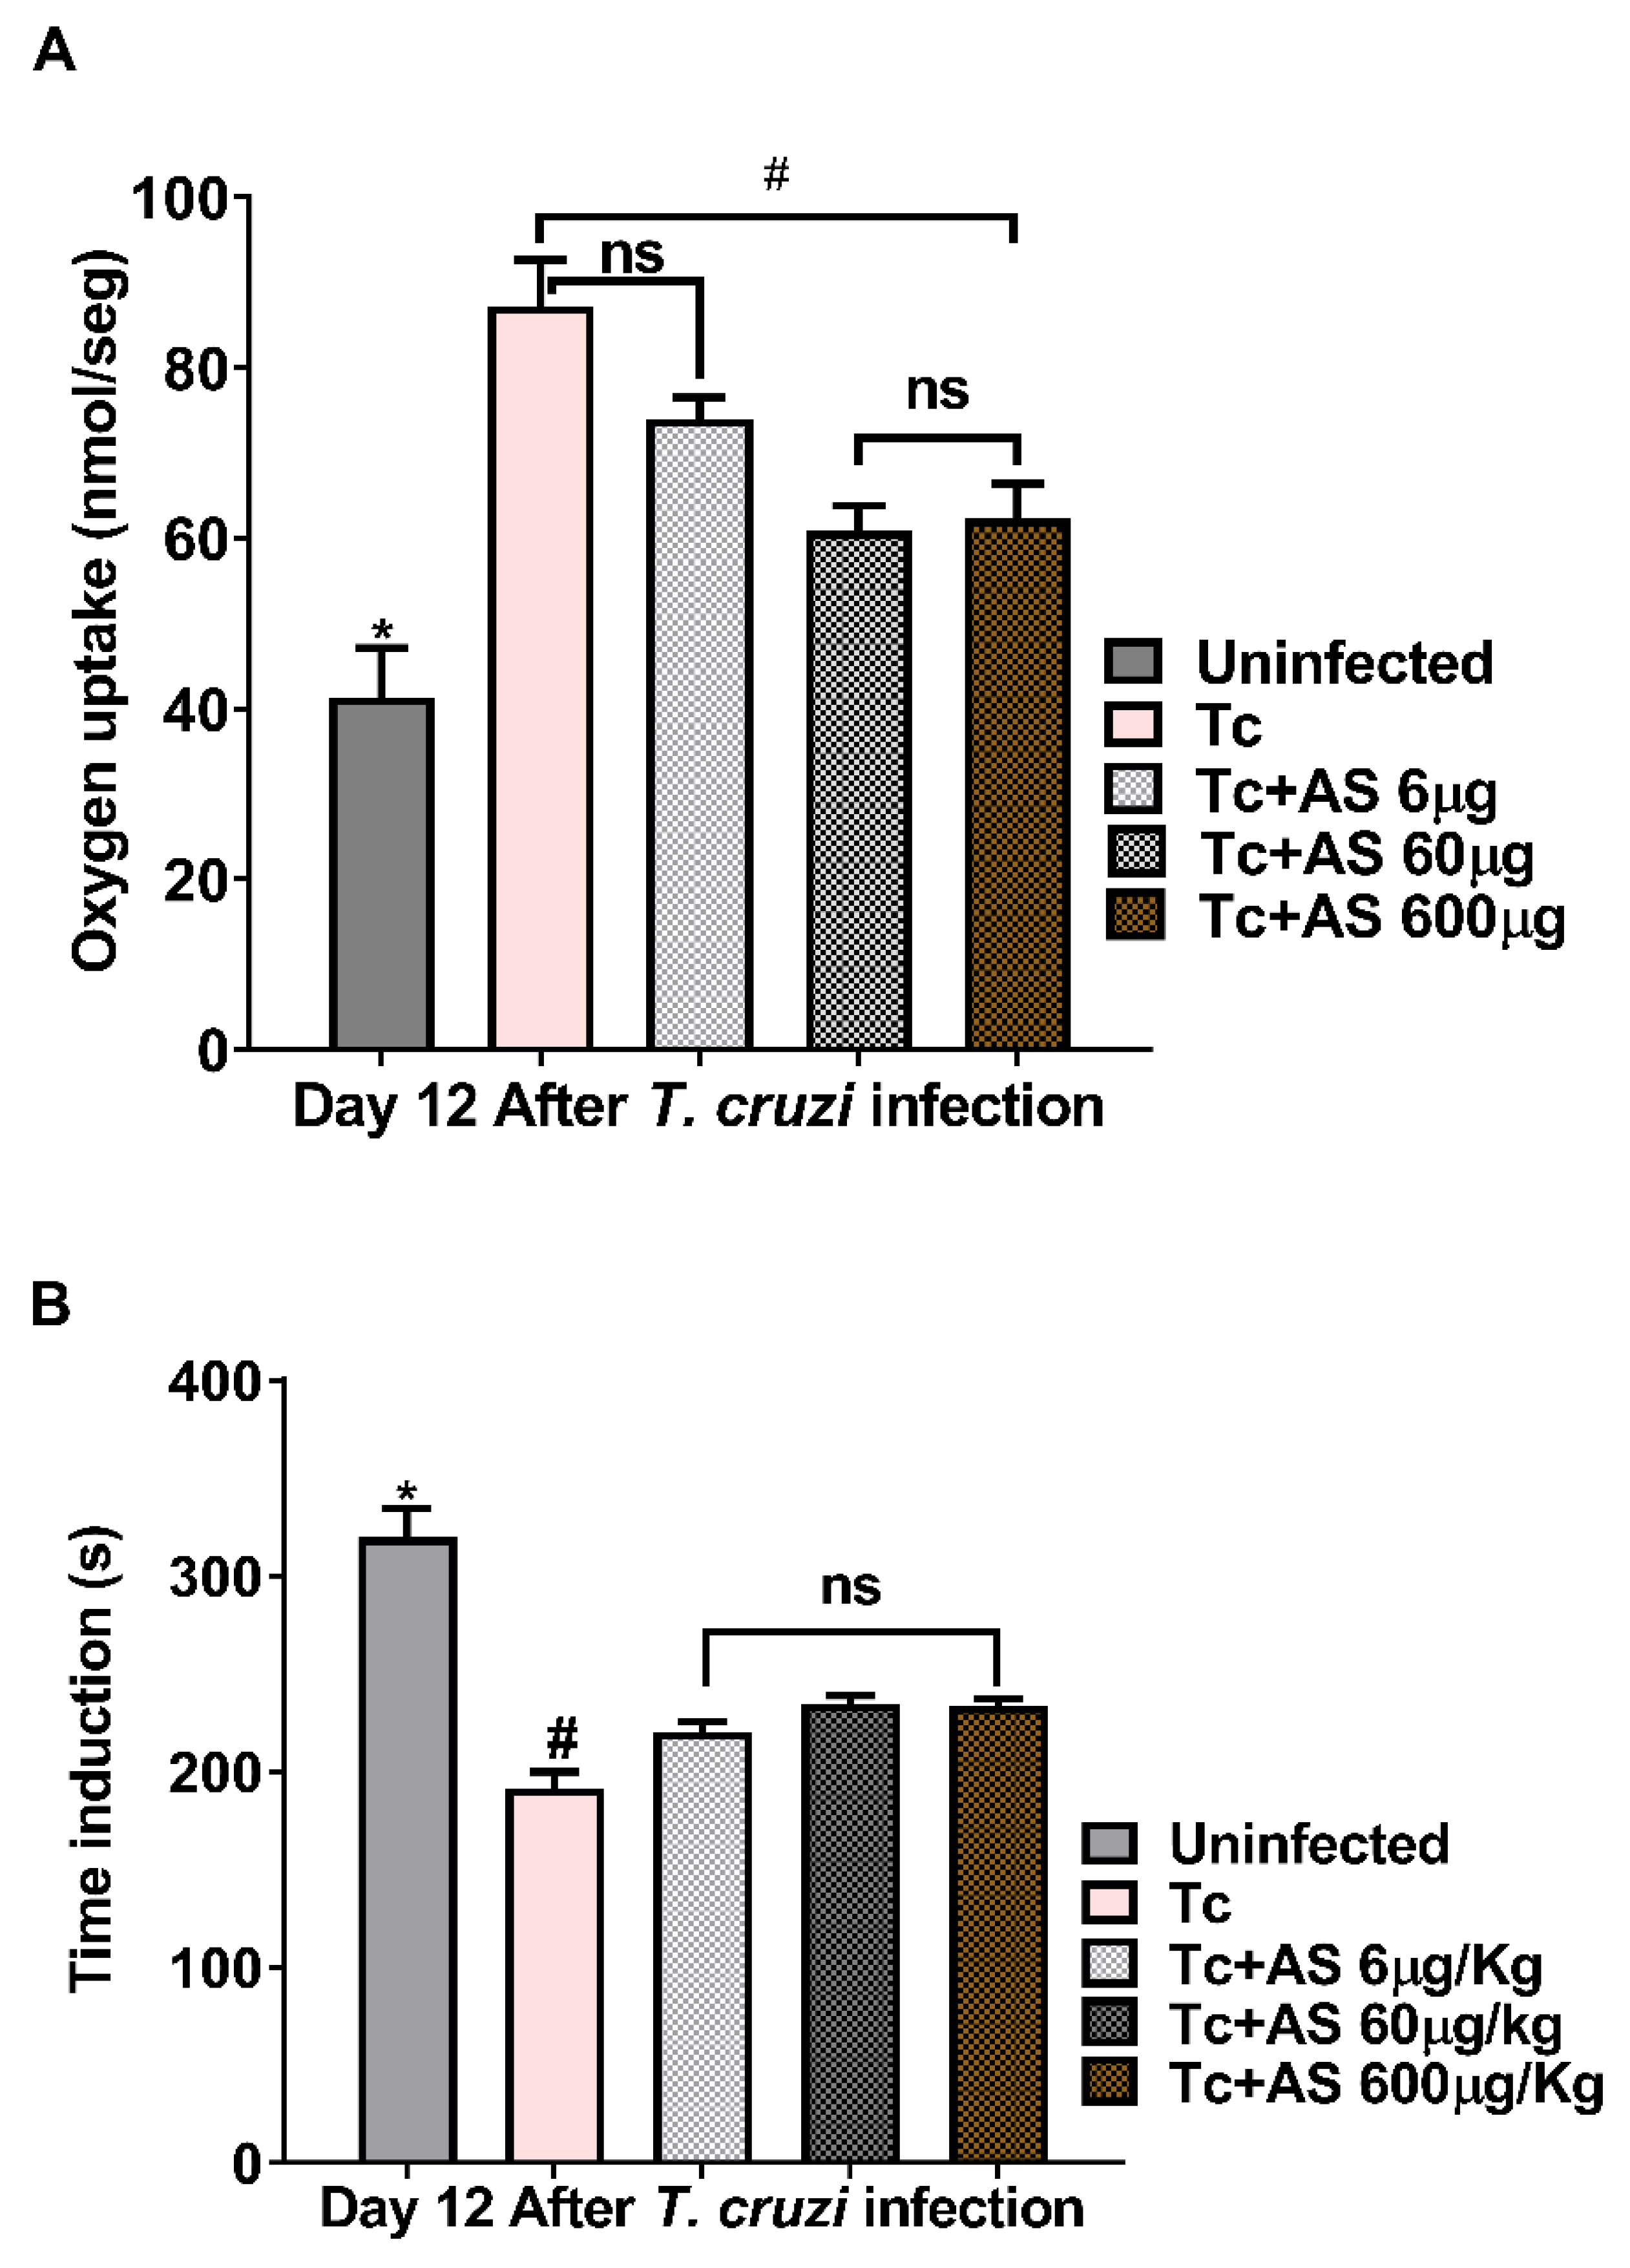
Figure 7.
Time course curve of t-butyl hydroperoxide-initiated chemiluminescence in erythrocytes. Groups of C57BL/6 mice (n = 5/group) were infected with 5 x 10³ T. cruzi and either treated or not treated with AS (6-600 µg/Kg/mouse). Uninfected mice and untreated T. cruzi-infected mice (Tc group) were included as controls. The values presented are the mean ± SEM and are representative of two independent experiments. Significance was determined as *p ≤ 0.05, using Kruskal-Wallis’s test, indicating a significant difference from the values observed in the controls (uninfected/infected-non-treated group or infected/non-treated group/infected treated group).
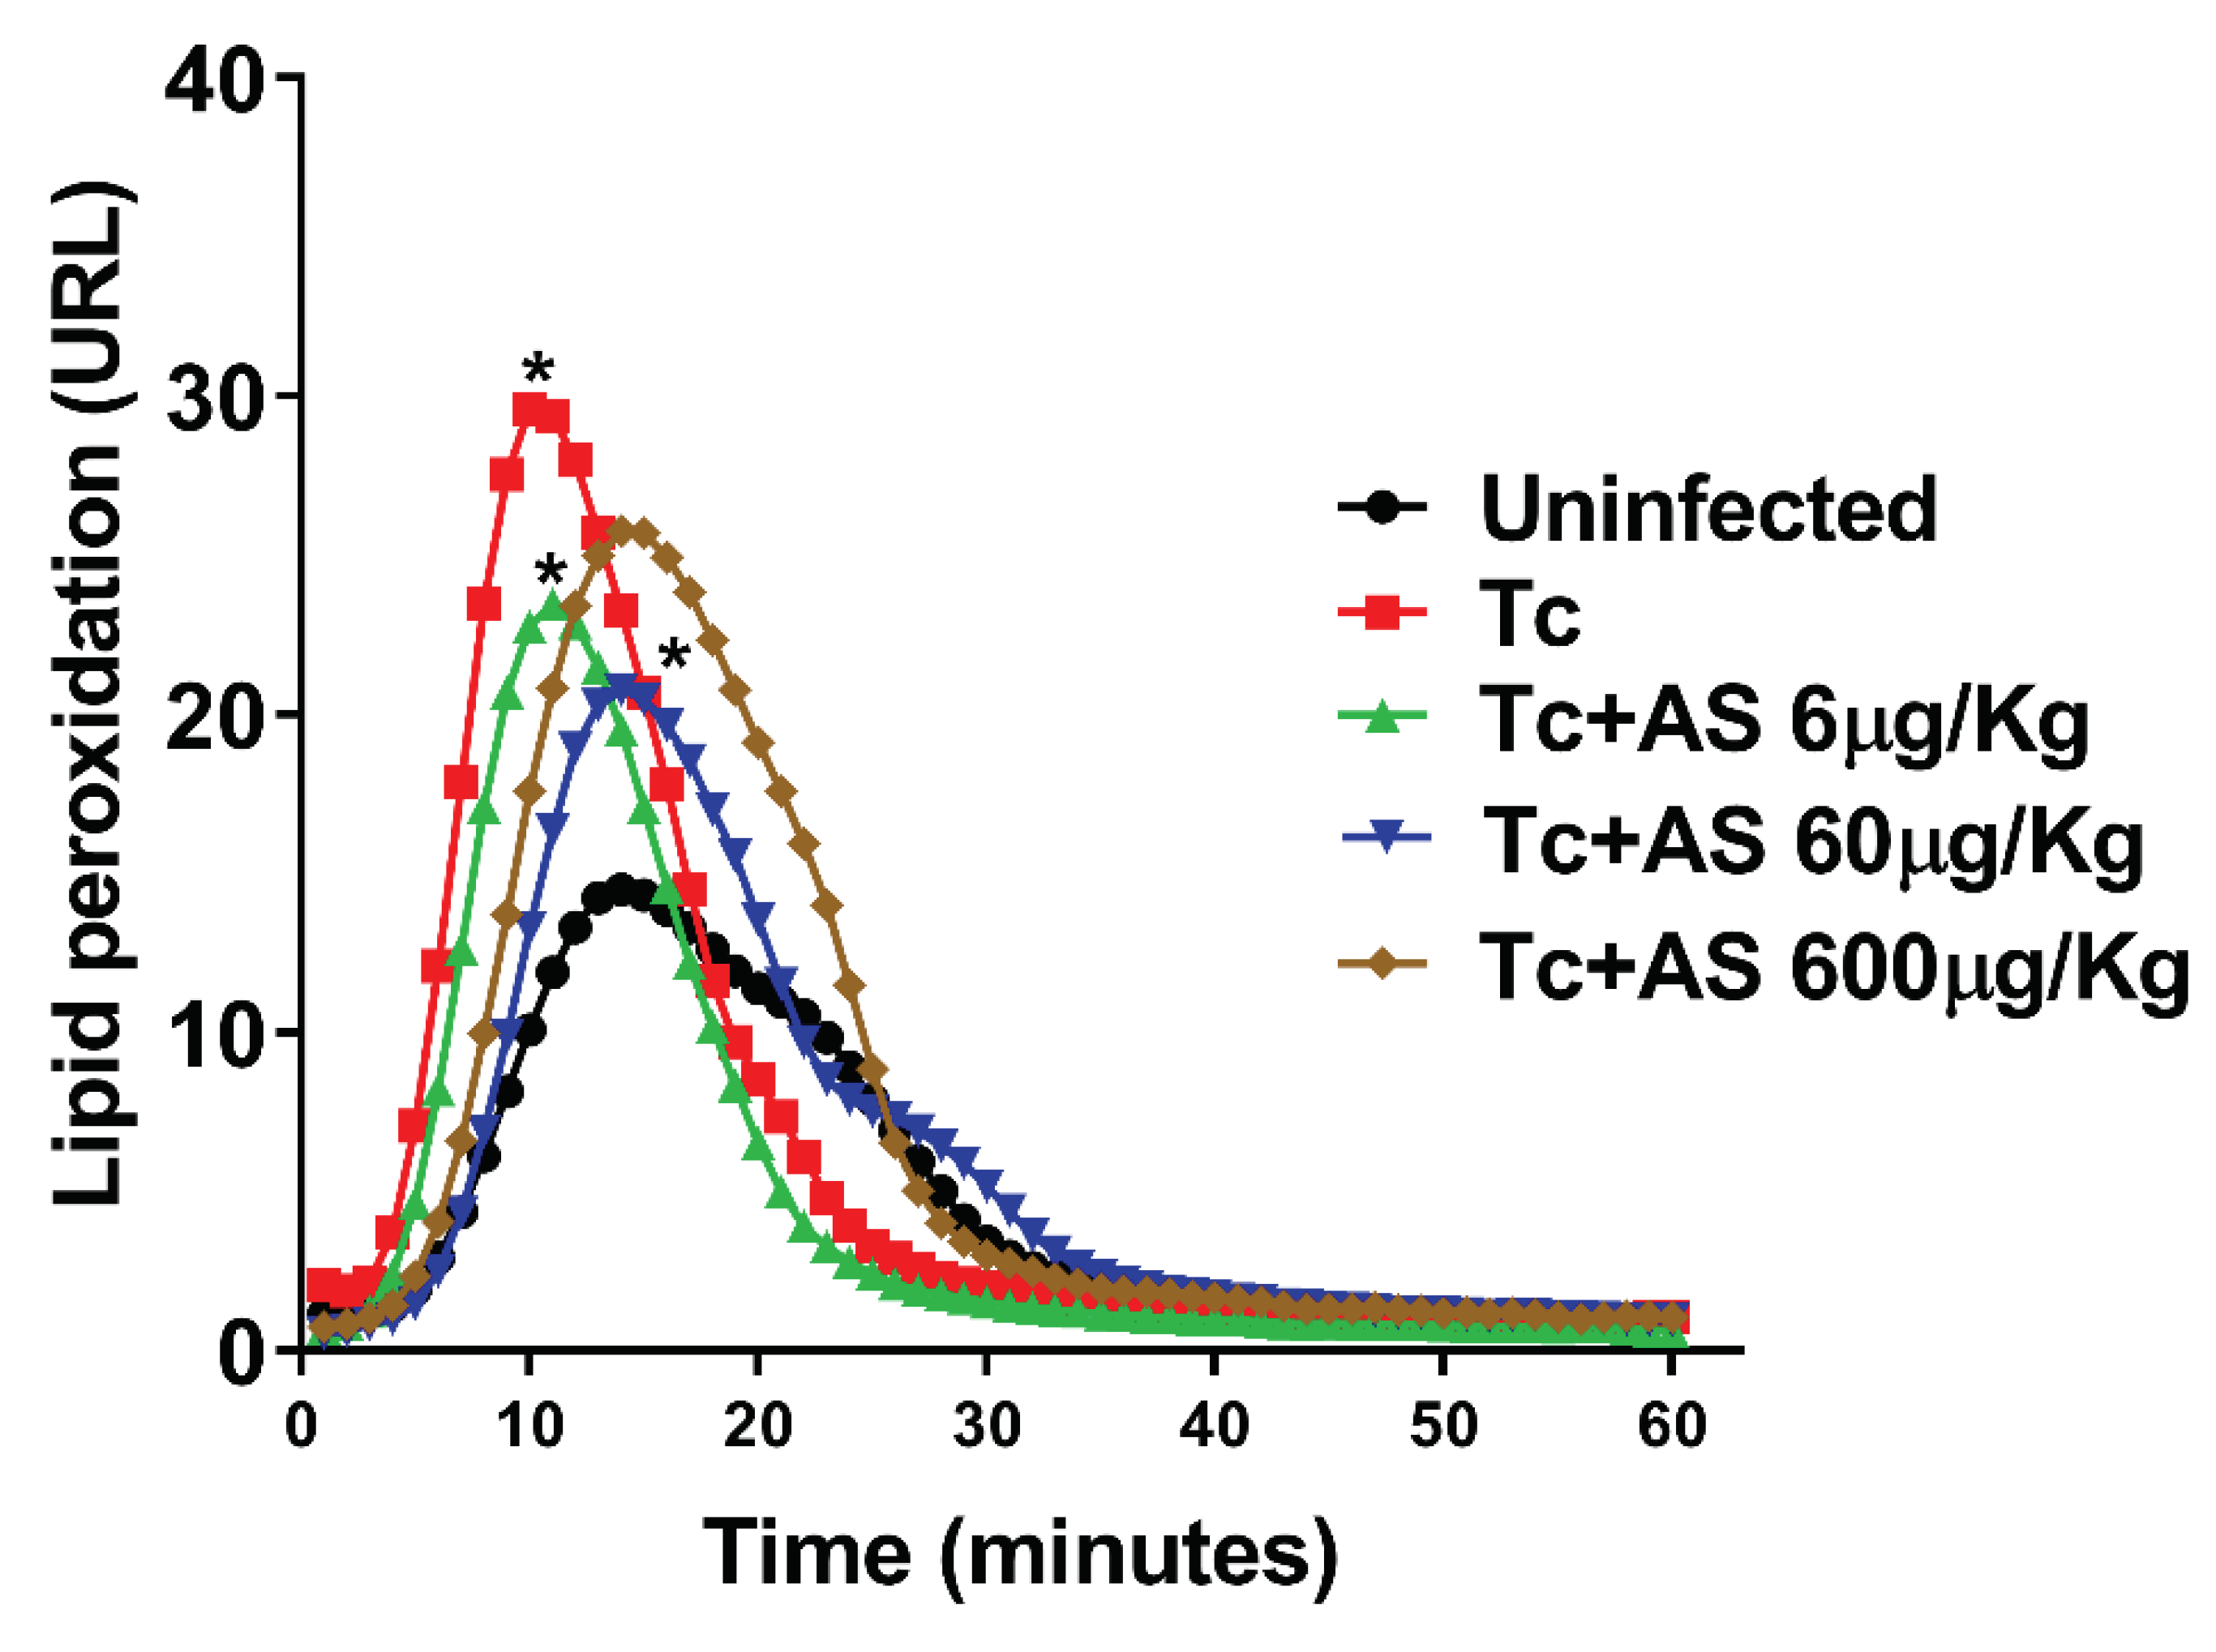
Figure 8.
Effect of AS therapy on nitrite levels in the plasma (day 12 p.i). C57BL/6 mice were divided into groups of five and infected with 5 x 10³ T. cruzi, treated or not with AS (6-600 µg/Kg/mouse). T. cruzi-infected mice (Tc group) and uninfected mice received PBS and were used as controls. The mean ± SEM values shown are representative of two independent experiments, *p ≤ 0.05, two-way ANOVA with Tukey post-test (*Uninfected vs experimental groups), # p ≤ 0.05, two-way ANOVA with Tukey post-test (Control vs experimental groups), Ψ p ≤ 0.05, two-way ANOVA with Tukey post-test (Tc + 6 µg/Kg vs Tc 60 µg/Kg and Tc + 6 µg/Kg vs Tc 600 µg/Kg). ns = non significance.
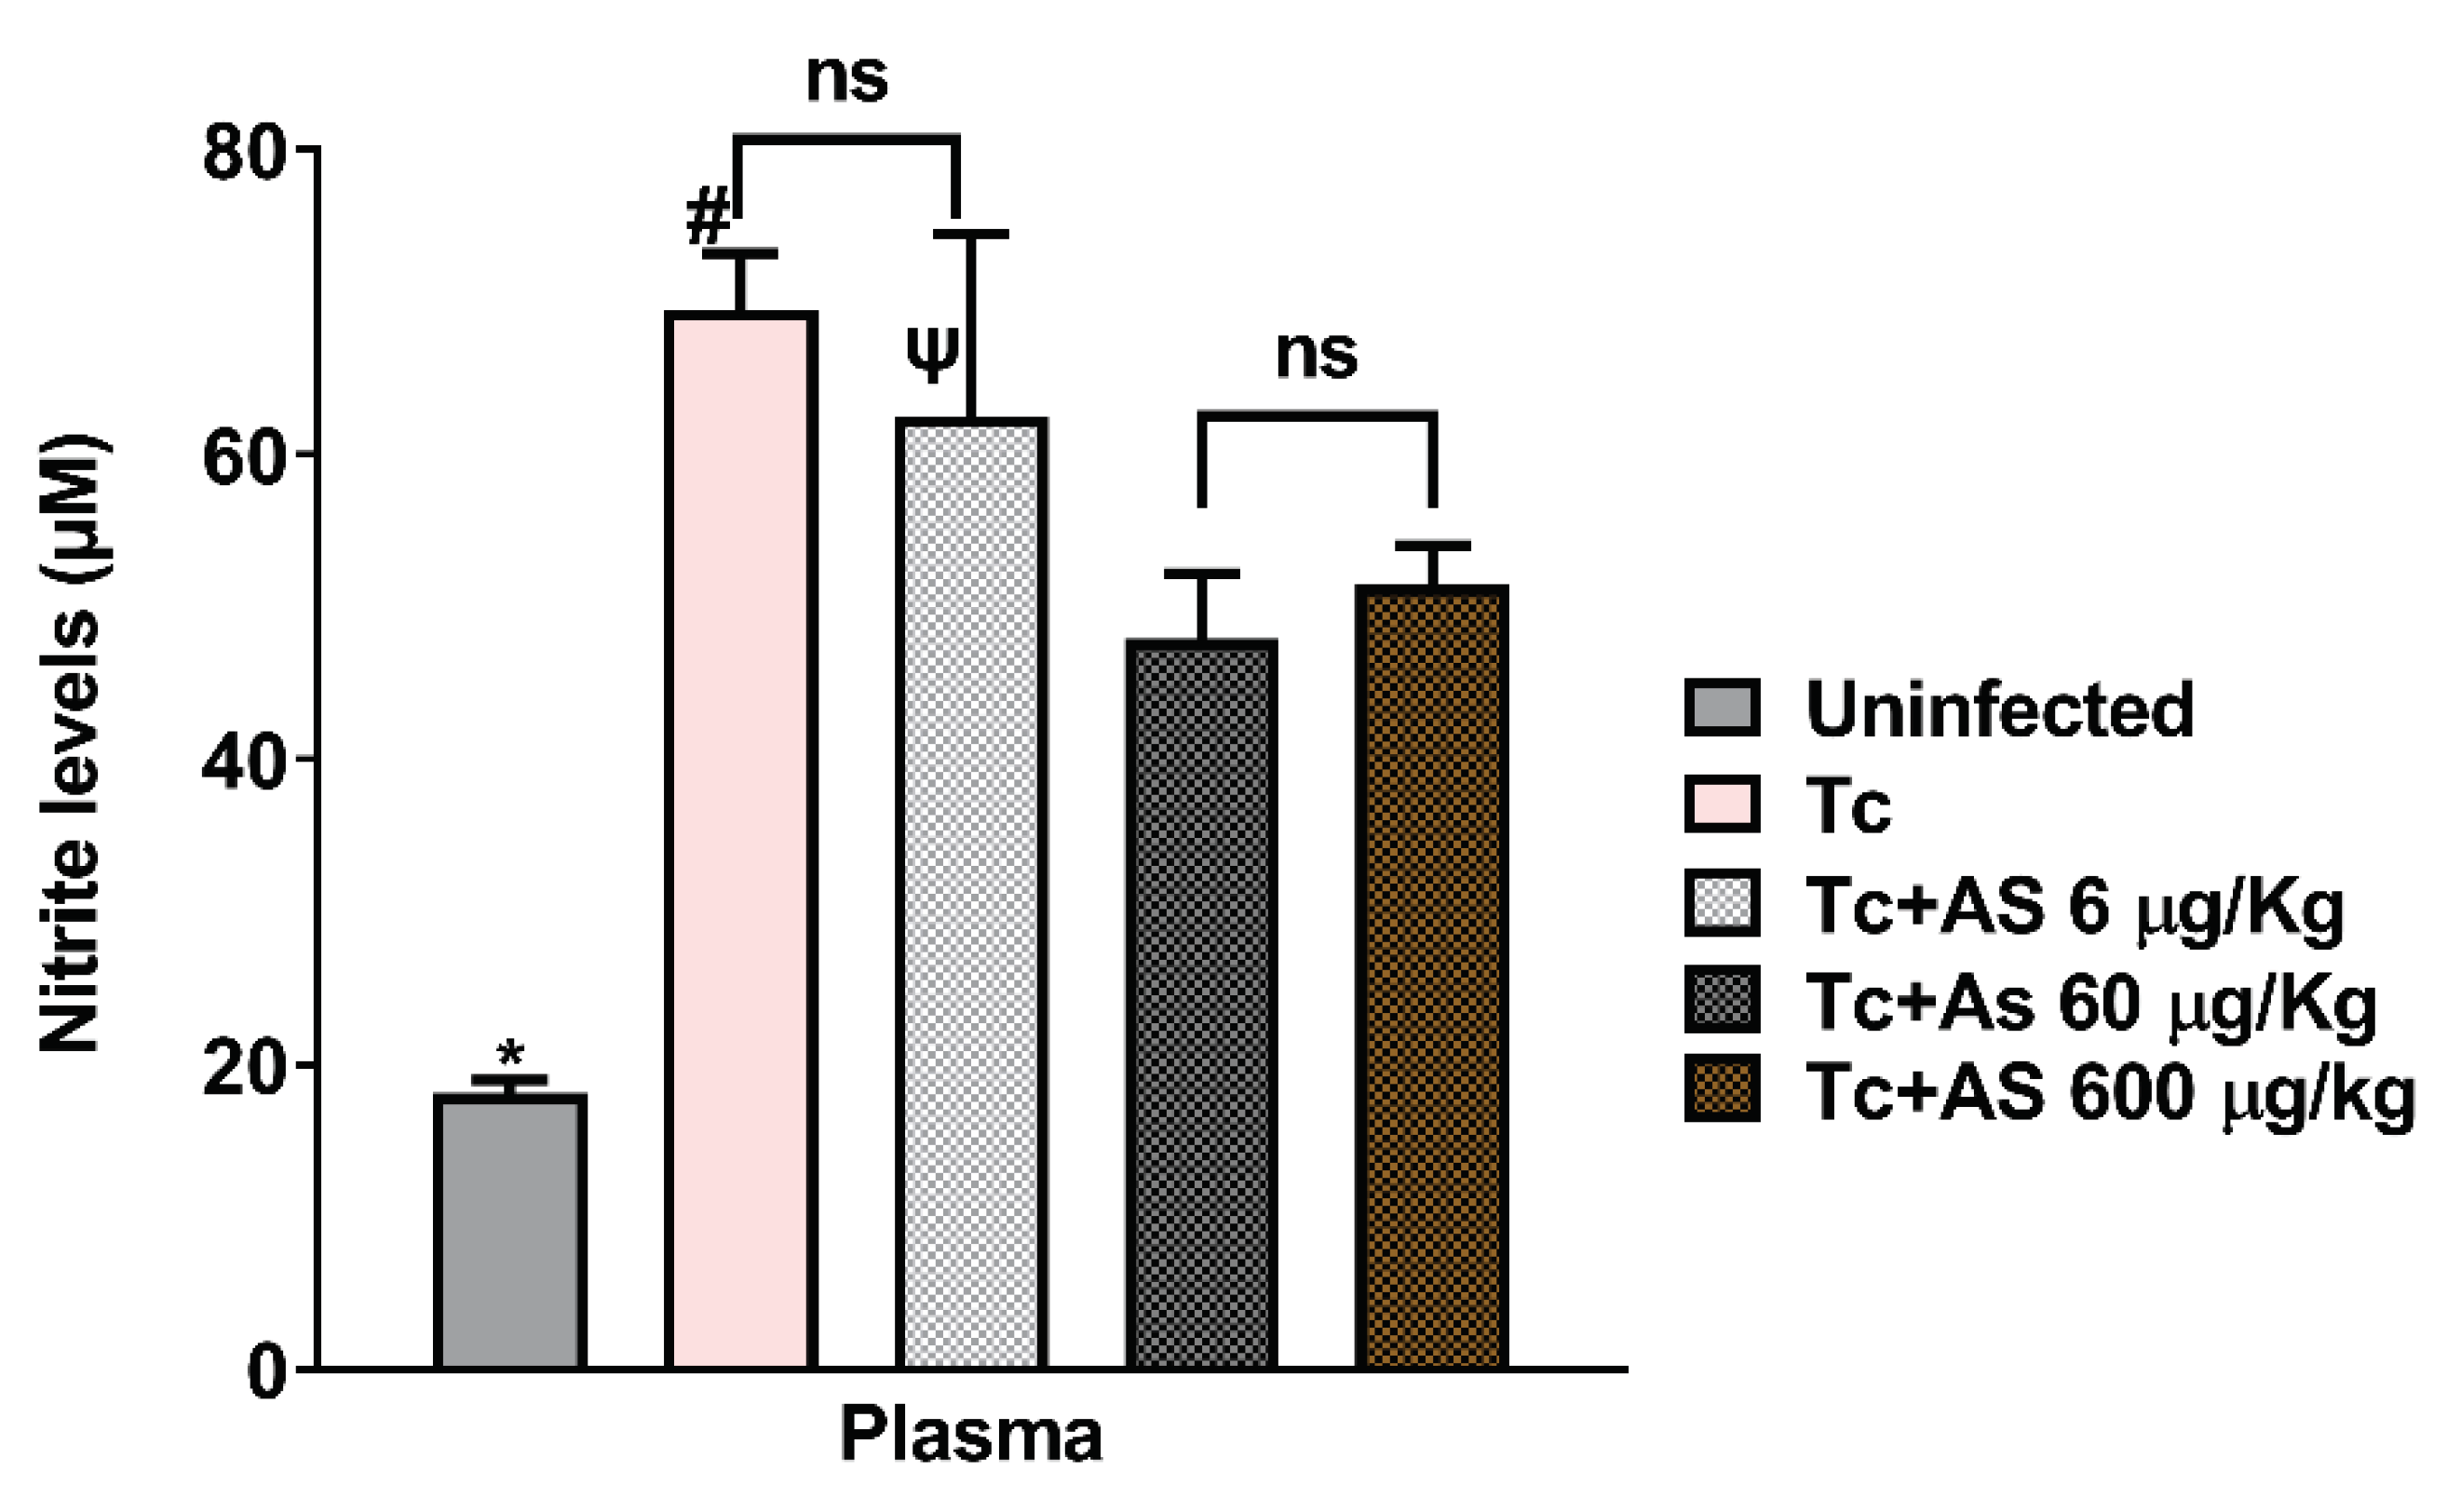
Figure 9.
AS mediates T. cruzi infection in macrophages. (A) Cellular metabolic activity by reducing resazurin in T. cruzi trypomastigotes. (B) Cell viability in macrophages treated with AS (7.5-120 µM) by MTT assay. Controls consisting of H2O2 (1 mM) and NaOH (0.01 mM). (C) Internalization index of the interaction process between macrophages, treated with AS (15-60 µM) for 1 hour and exposed to T. cruzi (5:1). (D) The effect of AS on trypomastigote release in T. cruzi-infected macrophages. Cells were infected with T. cruzi trypomastigotes and treated daily or not with AS. The release of trypomastigotes into the supernatant was detected and measured from day 4 to day 7 after infection. Values represent the mean ± SEM for triplicate determination and are representative of two independent experiments. * p ≤ 0.05, two-way ANOVA with Tukey post-test (H2O2 vs experimental groups), ★ p ≤ 0.05, two-way ANOVA with Tukey post-test (Tc vs experimental groups), ♦ p ≤ 0.0001, two-way ANOVA with Tukey post-test (Tc vs experimental groups), **** p ≤ 0.0001, two-way ANOVA with Tukey post-test (Tc vs AS 15µM), #### p ≤ 0.0001, two-way ANOVA with Tukey post-test (AS 30µM vs AS 60 µM). ns = non significance.
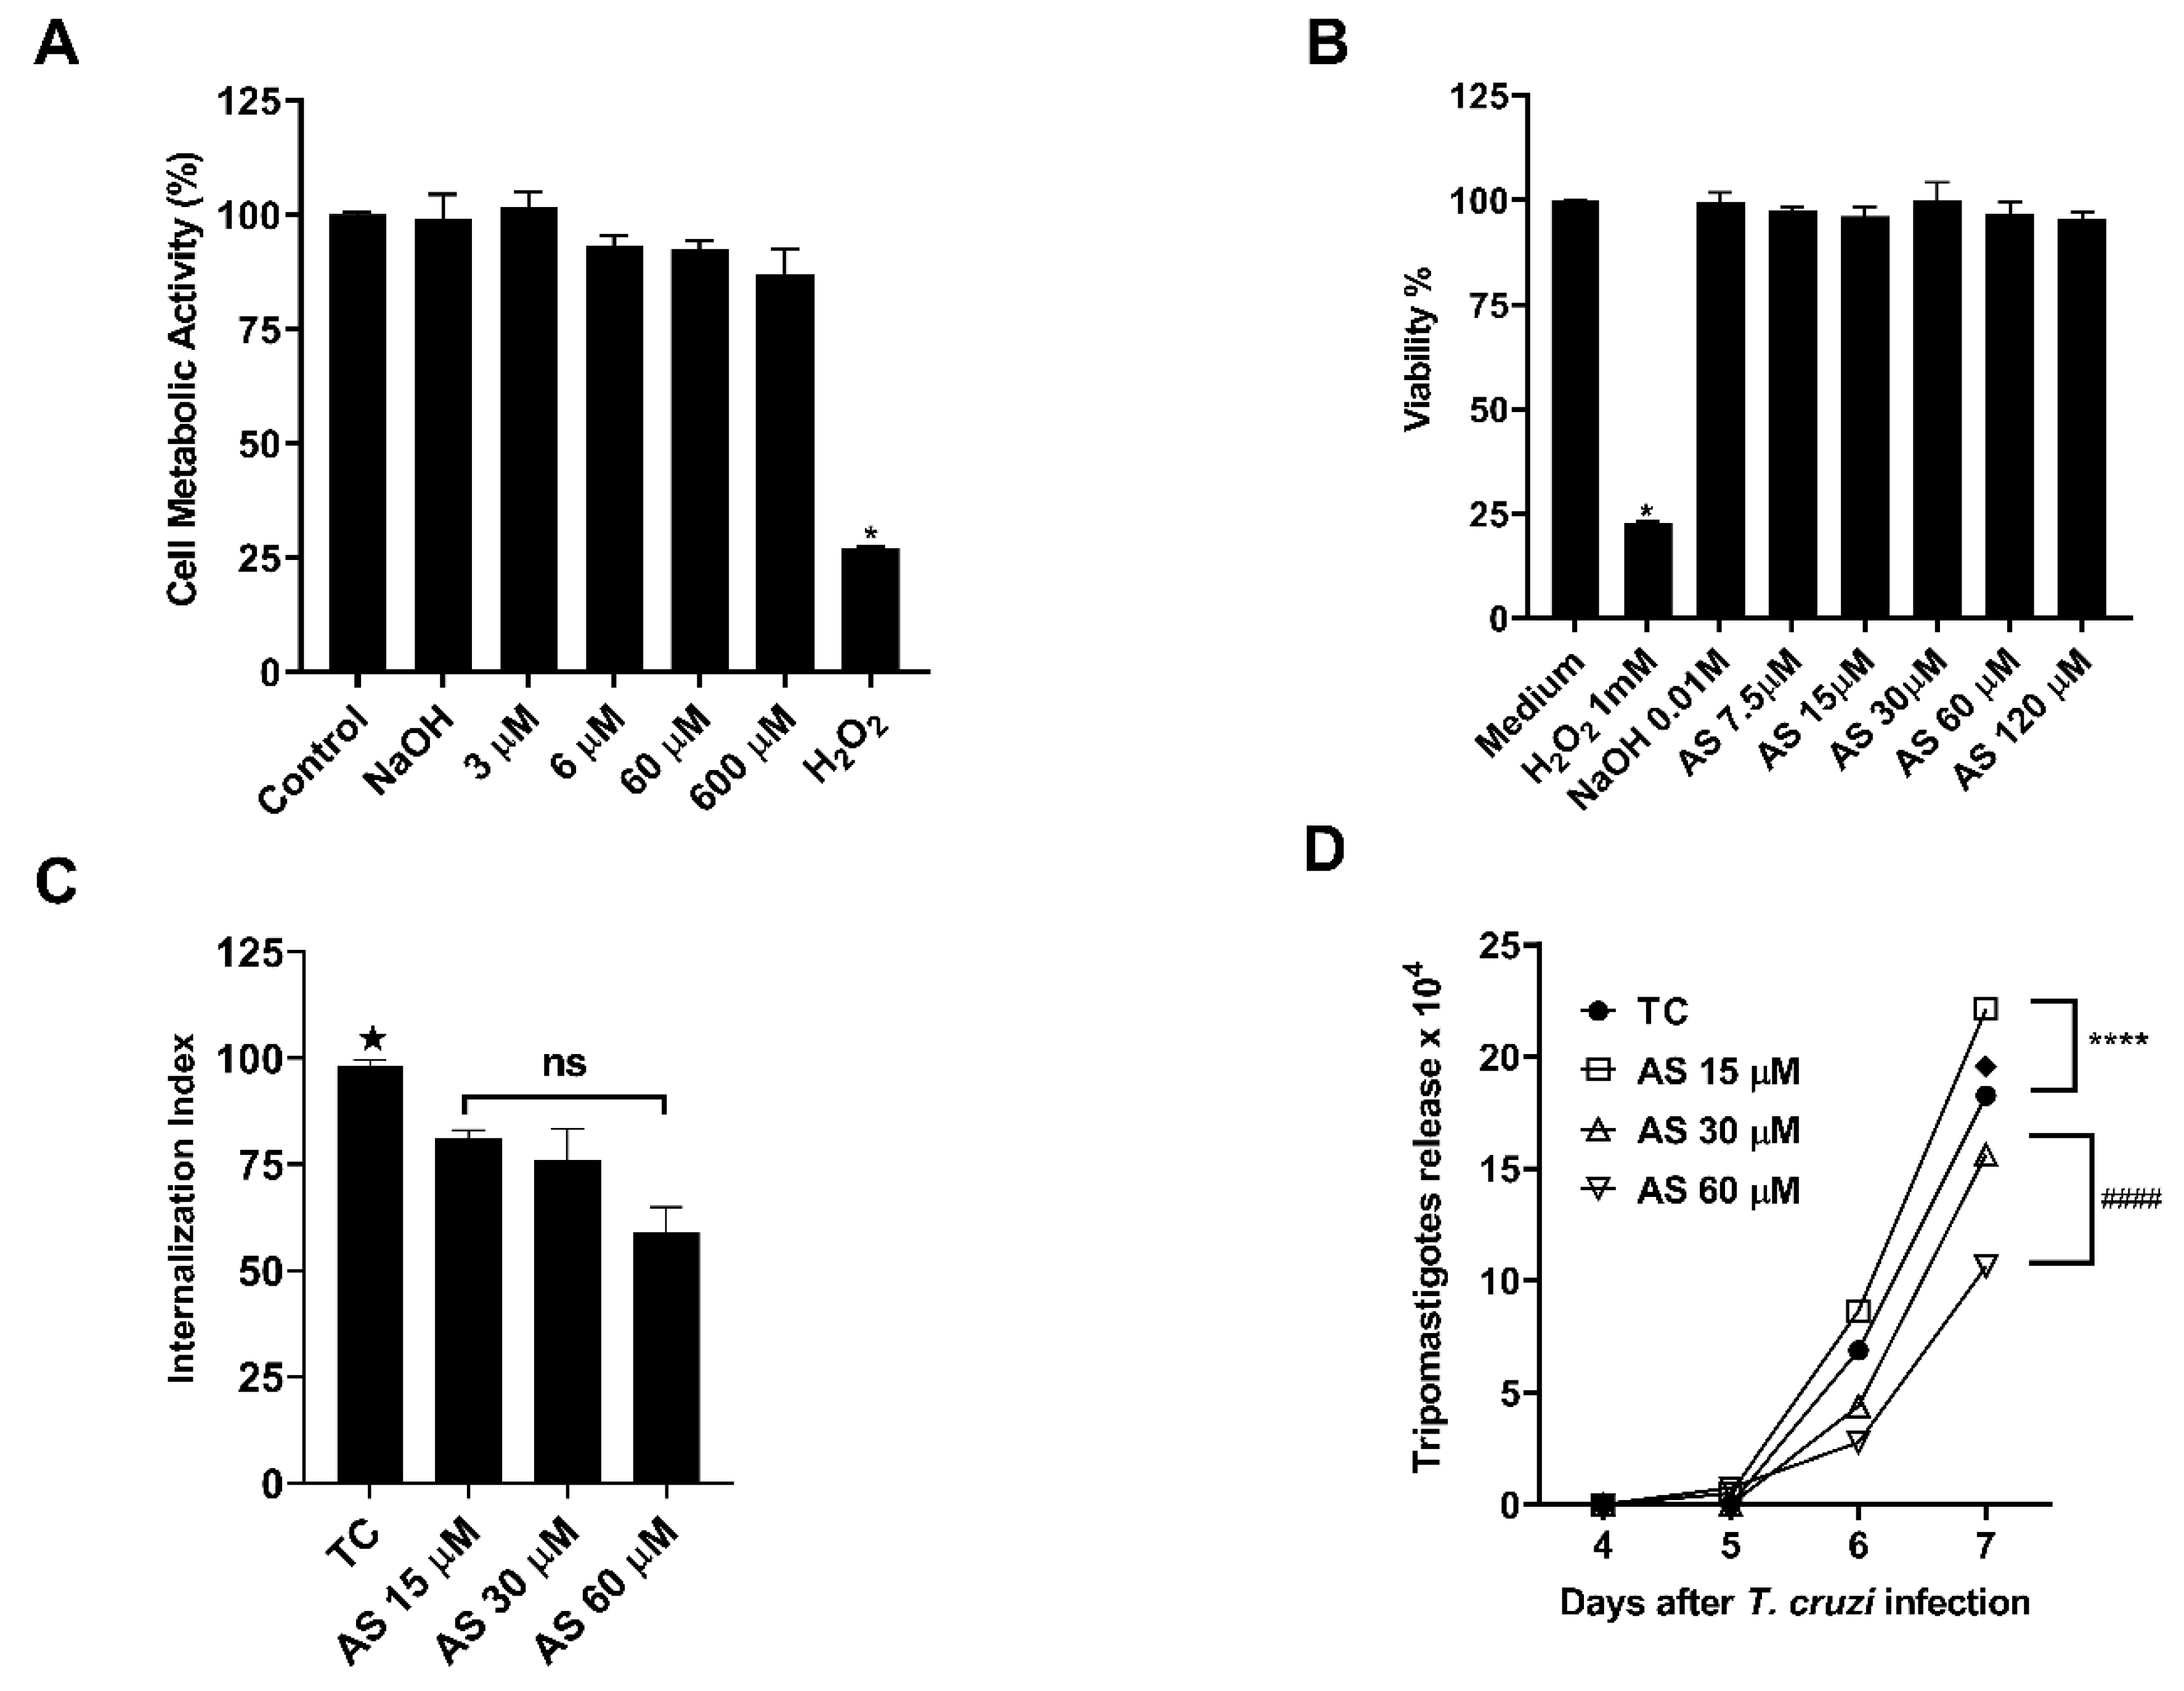
Figure 10.
Effect of AS on nitric oxide (NO) production. Production of NO by macrophages was determined by measuring the level of accumulated nitrite, a metabolite of NO in the culture supernatant using Griess reagent. Values are the mean ± SEM and is representative of two independent experiments. *p ≤ 0.05, two-way ANOVA with Tukey post-test (*Uninfected vs experimental groups), # p ≤ 0.05, two-way ANOVA with Tukey post-test (Control vs experimental groups), Ψ p ≤ 0.05, two-way ANOVA with Tukey post-test (Tc + 15µM vs Tc 30 µM and Tc + 15 µM vs Tc 60 µM).
Disclaimer/Publisher’s Note: The statements, opinions and data contained in all publications are solely those of the individual author(s) and contributor(s) and not of MDPI and/or the editor(s). MDPI and/or the editor(s) disclaim responsibility for any injury to people or property resulting from any ideas, methods, instructions or products referred to in the content. |
© 2023 by the authors. Licensee MDPI, Basel, Switzerland. This article is an open access article distributed under the terms and conditions of the Creative Commons Attribution (CC BY) license (http://creativecommons.org/licenses/by/4.0/).
Copyright: This open access article is published under a Creative Commons CC BY 4.0 license, which permit the free download, distribution, and reuse, provided that the author and preprint are cited in any reuse.


