
Submitted:
21 June 2023
Posted:
25 June 2023
You are already at the latest version
Abstract
The current design process of a new aircraft includes several mod- eling and testing steps.The main purpose of the Ground Vibration Testing is to achieve experimental vibration data of the whole aircraft structure, in terms of frequencies, damping factors, and mode shapes to ensure that the aircraft will be free from any aeroelastic instability and safe to fly in the desired flight envelope. GVT results are also mainly used for validating and eventually im- proving FEM models of the aircraft examined. On the other hand, structural dynamic models are used to predict the flutter behavior and carefully plan the in-flight flutter tests, and lead to mitigation of the risks related to them. This paper aims to compare different aeroelastic methods outcomes achieved using two diverse commercial software: the widely used NASTRAN™ and the most recently developed Zonatech ZAERO. The flutter computation results are obtained by means of P-K, K, and G methods. The first case presented is the aeroelastic analysis of a forward-swept wing whereas the second case concerns the stabilator of a two-seater ultralight aircraft, for which an experimental campaign of vibrations test is also carried out. The structural mode shapes at each generated frequency mode are also visually presented.
Keywords:
Aeroelasticity
; Flutter
; Divergence
; NASTRAN
; ZAERO
; GVT
1. Introduction
The Flutter is the unstable self-excited oscillation of an airfoil and its associated structure, caused by a combination of aerodynamic, inertia, and elastic effects in such a manner as to extract energy from the airstream. At the critical flutter speed, the amplitude of oscillation following an initial disturbance will be maintained while at a higher speed these amplitudes will increase [1].
The general purpose of any methods of Vibration and Flutter analysis for a conventional airplane is to prove that the airplane is free from flutter, control reversal, and divergence for any condition of operation within the limit V-n envelope, plus a supplementary safety margin. In other terms, the main scope of flight flutter test and numerical analysis is to determine the aeroelastic stability for new or modified vehicles and sub-components of them in the nominal flight envelope established by the project. The approval process concerning aeroelastic matters, flutter, divergence, and control reversal at all speeds in the entire flight envelope, during the overall design process and critical stages of the certification phase of a new aircraft, is a combination of numerical modeling backed up by testing. In spite of the prevalence of the computational analysis field and its ever-growing involvement in the design of aircraft structures, the verification at large-scale components and experimental modal testing (EMA) have always been a fundamental step, being the most realistic representation of the expected response of the structure [2]. In terms of testing, mainly static and dynamic tests, widely defined as Ground Vibration Testing (GVT), are typically conducted to evaluate the stiffness and the dynamic properties of the structure under investigation. For the GVT, natural frequencies, mode shapes, structural damping coefficients and the generalized mass of the main vibration modes are sought. The GVT method is broadly recognized in the literature and has been used for various aircraft structures, from commercial civil airliners [3,4] to fighter aircrafts [5] and, more recently, unmanned aerial vehicles (UAVs) [6,7]. The full scale tests are becoming progressively imperative due to the wide use of composite materials in the aeronautics industry, due to the advantages of the development of lighter yet stiffer airframe configurations with aeroelastic tailoring [8] and active load alleviation capabilities. Flight flutter testing is very expensive, time-consuming, and often undertaken at a time-critical part of an aircraft’s development program. For this reason, GVT and aeroelastic computational modeling and prediction are of fundamental importance in the design and certification process.
Commonly, structures are represented by Finite Element Method (FEM) models, while the aerodynamics via high-fidelity Computational Fluid Dynamics (CFD) models at this design stage. Coupled solvers of several fidelities are also often used to search the aeroelastic stability boundaries, mainly in terms of flutter speed. Such methods are used in connection with GVT and model updating techniques [9,10]] to improve their accuracy and increase their predictive capabilities with respect to a variety of aeroelastic phenomena. The flutter numerical investigations of aircraft are commonly based on the normal modes structural analysis and no aerodynamic model was required. The natural modes are initially computed by means of FEM using a model of the structure and then, after the inclusion of aerodynamics in the structural model by spline operation, the output Velocities vs Damping and Velocities vs Frequencies curves are used for the Flutter speed estimation and establish the aeroelastic stability conditions.
In addition to the easily interpreted frequency and damping plots versus airspeed for strongly coupled systems, a second advantage is offered by the P-K method regarding computational effort. The k method requires numerous computer runs at a constant density to ensure matching of the Mach number with air-speed and altitude. Currently, most flutter analyses in the aircraft industry are performed using k and/or P-K methods. Although the k method remains popular because of its speed, when accuracy is important and the p method is not feasible, industry users seem to favor the P-K method, especially those who run the NASTRANTM package [11].
The ZAERO flutter module contains different flutter solution techniques. For this article, the K-method and the g-method are used. The g-method is ZONA’s newly developed flutter solution method that generalizes the K-method and the P-K method for true damping prediction. It is shown that the P-K method is only valid at the conditions of zero damping, zero frequency, or linearly varying generalized aerodynamic forces with respect to reduced frequency. In fact, if the generalized aerodynamic forces are highly nonlinear, the P-K method may produce unrealistic roots due to its inconsistent formulation. One of the aims of this work is to get confident with ZAERO, a relatively new software compared to the much more used NASTRANTM. Section 2 briefly reports the operational flow of ZAERO and some useful information obtained from the manuals. Finally, the results obtained for two case studies are reported. In the first case, the aeroelastic behavior of an innovative design for-ward-swept wing is analyzed. Within the framework of the analysis, two wing configurations were considered, wing with empty fuel tanks and full fuel tanks. In the second case, based on the availability of data deriving from vibration measurements on an ultralight aircraft, a problem of a more practical than design nature is reported. Both the experimental results (including the extraction of the natural modes and frequencies, the calculation of any flutter instabilities) obtained through vibration tests on the stabilator of an ultralight aircraft, and numerical aeroelasticity activity are shown [12].
2. A brief overview of NASTRAN and ZAERO
To achieve the aeroelastic behavior of the wing, the flexural and torsional stiffness and structural and non-structural mass distribution along the wingspan, will feed the dynamic structural Finite Elements model. For the case studies reviewed in this article, stick-beam models are used.
The firsts Aeroelastic analyses are performed using NASTRANTM solver. NASTRANTM computes matrices of aerodynamic influence coefficients from the input data describing the structural model and also provides an automated interpolation procedure to relate the aerodynamics (panels) to the structural degrees of freedom (structural grid point of the model) [13,14].
Splining techniques for both lines and surfaces can be used to generate the transformation matrix from structural grid point deflections to aerodynamic grid point deflections. The transpose of this matrix transfers the aerodynamic forces and moments at aerodynamic boxes to structural grid points. For this work, the subsonic theory is used and in particular the Doublet-Lattice Method (DLM) [15,16,17,18], an extension of the steady Vortex-Lattice method to unsteady flow. It can be used for interfering with lifting surfaces in subsonic flow.
The second step of the aeroelastic analyzes consists of comparing the results obtained by the NASTRANTM and Zonatech ZAERO software respectively [19]. ZAERO integrates the crucial disciplines required for aeroelastic analysis and it represents a valid alternative to the widespread commercial codes such as NASTRANTM. For the aeroelastic analysis, ZAERO does not run the structural finite element solutions, but firstly it imports the structural grid point and the externally calculated structural normal modes solutions generated by one of the following FEM codes: NASTRANTM, ANSYS, ABAQUS, ASTROS, and I-DEAS. Then, the aerodynamic method is implemented. In particular, the six methods (or aerodynamic codes) incorporated in the ZAERO software, cover the entire Mach number range:
- ZONA6 - Subsonic Unsteady Aerodynamics;
- ZSAP - Sonic Acceleration Potential Method;
- ZTAIC - Transonic Unsteady Aerodynamics using a Transonic Equivalent Strip Method;
- ZTRAN - Transonic Unsteady Aerodynamics using an Overset Field-Panel Method;
- ZONA7 - Supersonic Unsteady Aerodynamics;
- ZONA7U - Hypersonic Unsteady Aerodynamics.
About the capability and applicability advantages of the ZAERO code over that of other commercially available aeroelastic analysis software is that ZAERO seems to provide a higher level of geometric fidelity than other aeroelastic packages such as NASTRAN. The Figure 1 shows the ZAERO file processing that occurs during code execution.
Three files are required to run the code:
- the input file which contains the executive control, case control, and bulk data sections that describe the aerodynamic model, flight conditions, etc.;
- the structural FEM output file containing the structure natural frequencies and mode shapes;
- DIRNAME.FIX which contains the pathname where the ZAERO run-time database files are to be located.
- About the outputs, a minimum of two files is generated for every ZAERO run. These are:
- the output file of the job;
- the log file which contains the elapsed and step CPU times for each module call during the execution of ZAERO. Additional output plot files can be generated through bulk data input requests.
3. Comparison Between the g-Method and the P-K Method
3.1. 1st Test Case - Forward swept wing
The first test case presented is the aeroelastic analysis of a forward-swept wing. This type of wing, unlike conventional wings, presents a criticality due to the phenomenon of static aeroelasticity of divergence. In other words, the negative sweep angle causes the divergence speed to be lower than the equivalent straight or sweep back wing [19,20]. Figure 2 shows the aeroelastic model: aerodynamic paneling or Double Lattice panel model connected to the structural beam-like model. In a stick model, the wing is represented by beams capable of bending, shear, torsional and axial deformations.
In this example Figure 3 and Figure 4 represent the wingspan distribution of the stiffness and mass respectively. Each beam is divided into several elements with a flexural stiffness EI and torsional stiffness GJ estimated from the member section properties by classical structural analysis methods.
A considerable degree of detail is known for the mass distribution on the wing structure, but only part of the mass is structural, and therefore associated with the FE structural model, whereas a significant amount of mass is linked with non-structural elements such as fuel [21].
To represent the mass distribution, the wing is divided into several strips, centered on the nodes of the beam-like model. For each section, the mass is lumped at the reference positions and attached to the beam axis node by a rigid link element that allows the lumped mass to be represented by section mass, a moment of inertia, and mass moments [22,23]. The aerodynamic panels distribution for the wing is carried out by taking into account the criteria suggested by [24]. The first ten structural elastic modes are used for flutter analysis. Figure 5 shows the mode shapes and natural frequencies only for the first 4 modes for the sake of brevity.
Figure 6 show the V-g and V-f diagrams of the P-K-method and the V-g and V-f diagrams of the G method for the wing with 10 modes at Mach number M = 0.
Figure 6 shows the NASTRAN™ P-K solutions of the wing previously described at different given velocities from 50 to 500 m/s.
From the damping plot versus airspeed, it is possible to observe that the aerodynamic damping of mode 5, corresponding to the wing torsional mode, is nil at a speed of about 430 m/s.
In the frequency versus airspeed plot, at the same velocity, a coalescence of the frequencies of mode 3 and mode 5 is observed: there is a modal coupling between the aforementioned wing torsional mode and the 2nd wing bending mode. A flutter condition is attributed to this speed.
A significant aeroelastic observation is needed where divergence speed instability appears at 300 m/s i.e. a speed lower than the flutter velocity. This divergence speed instability is evident by its associated zero frequency. Comparing the upper plots with the lower ones in Figure 6, it can be seen that the agreement between the damping computed by the P-K method and the g-method is expected. Good agreement in terms of the overall V-g and V-f comparisons between these methods is obtained except the g-method predicts one extra aerodynamic lag root (represented by the crosses in Figure 6).
This aerodynamic lag root appears at divergence speed (about V=300 m/s) with stable damping. This is an interesting phenomenon because it indicates that the divergence speed could be a bifurcation point. This result suggests that the divergence speed is caused by the coupling of a structural mode and an aerodynamic lag root and should be considered as a special case of flutter instability, the so-called dynamic divergence. This is supported by the g-method results shown in the lower plots of the figures where the frequency coalescence of the first bending mode and the aerodynamic lag root is seen. On the other hand, the plots of the P-K method do not show this result due to its incapacity of generating the non-zero-frequency aerodynamic lag root.
Table 1 shows the flutter analysis results obtained by means ZAERO, in terms of the mode associated with flutter, natural frequency, and flutter speed.
For this first comparison, two types of instability are predicted by both the P-K method and the g-method: a flutter speed at about V = 430 m/s and a divergence speed at about V = 300 m/s. This agreement is expected since at damping g = 0 the flutter equation of both methods reduces to the same form. The damping curves of the structural modes computed by both methods are in excellent agreement. The frequency curves of the two structural modes computed by both methods are also in good agreement except for the absence of the aerodynamic lag roots of the P-K method.
For a question of investigation completeness, a second step involved an analysis of the same wing by adding the mass due to the fuel. The V-g and V-f diagrams relating to the case of full fuel tanks and a table with the flutter data are reported.
The V-g diagram shows that the damping of mode 3 crosses the zero damping axis, indicating a fluctuation limit of the wing structure, at higher values than in the previous case.
From the V-g and V-f diagrams, calculated for the different load conditions we can draw the following conclusions:
- in all the calculations the divergence condition for the wing is present, the latter being independent of the mass contributions from the model;
- in both cases, with and without fuel, the divergence rate does not change;
- the most critical condition for flutter occurs when the wing is unloaded (the addition of the masses of the fuel involves the removal of the bending frequencies from the torsional ones);
- when the wing tanks are full there is the annulment of the aerodynamic damping of the first torsional frequency at a speed of about 44% higher than in the case of empty tanks. From the V-f diagram, we can ob-serve a coalescence of the aforesaid frequency with the second flexural frequency.
Upon completion of the study of the first test case, a dynamic flutter analysis was performed as the stiffness distribution varies along the wingspan. In particular, a wing section of about 1 meter was chosen, a representative for example of an inspection window for maintenance or the extraction of the landing gear. It has been hypothesized that, in the notch area, with the same mass distribution, the flexural and torsional stiffnesses decreased by 30% of the initial value, i.e. wing without the door.
To study how the flutter speed varies as a function of the location of the trap door, for the two stiffness variations the first area was considered respectively between 20 and 30% of the wingspan Figure 8a and the second between 30 and 40% Figure 8b. For the first variation of stiffness distribution, a flutter speed of 410 m/s is obtained (Figure 8c) or a decrease of about 4.7% compared to the starting wing. For the second variation of stiffness distribution, on the other hand, the flutter speed is about 418 m/s (Figure 8d) and therefore is decreased by 2.8% compared to the reference wing.
Figure 7.
V-g and V-f curves P-k method (Nastran) and G method (ZAERO) - wing with full fuel tank.
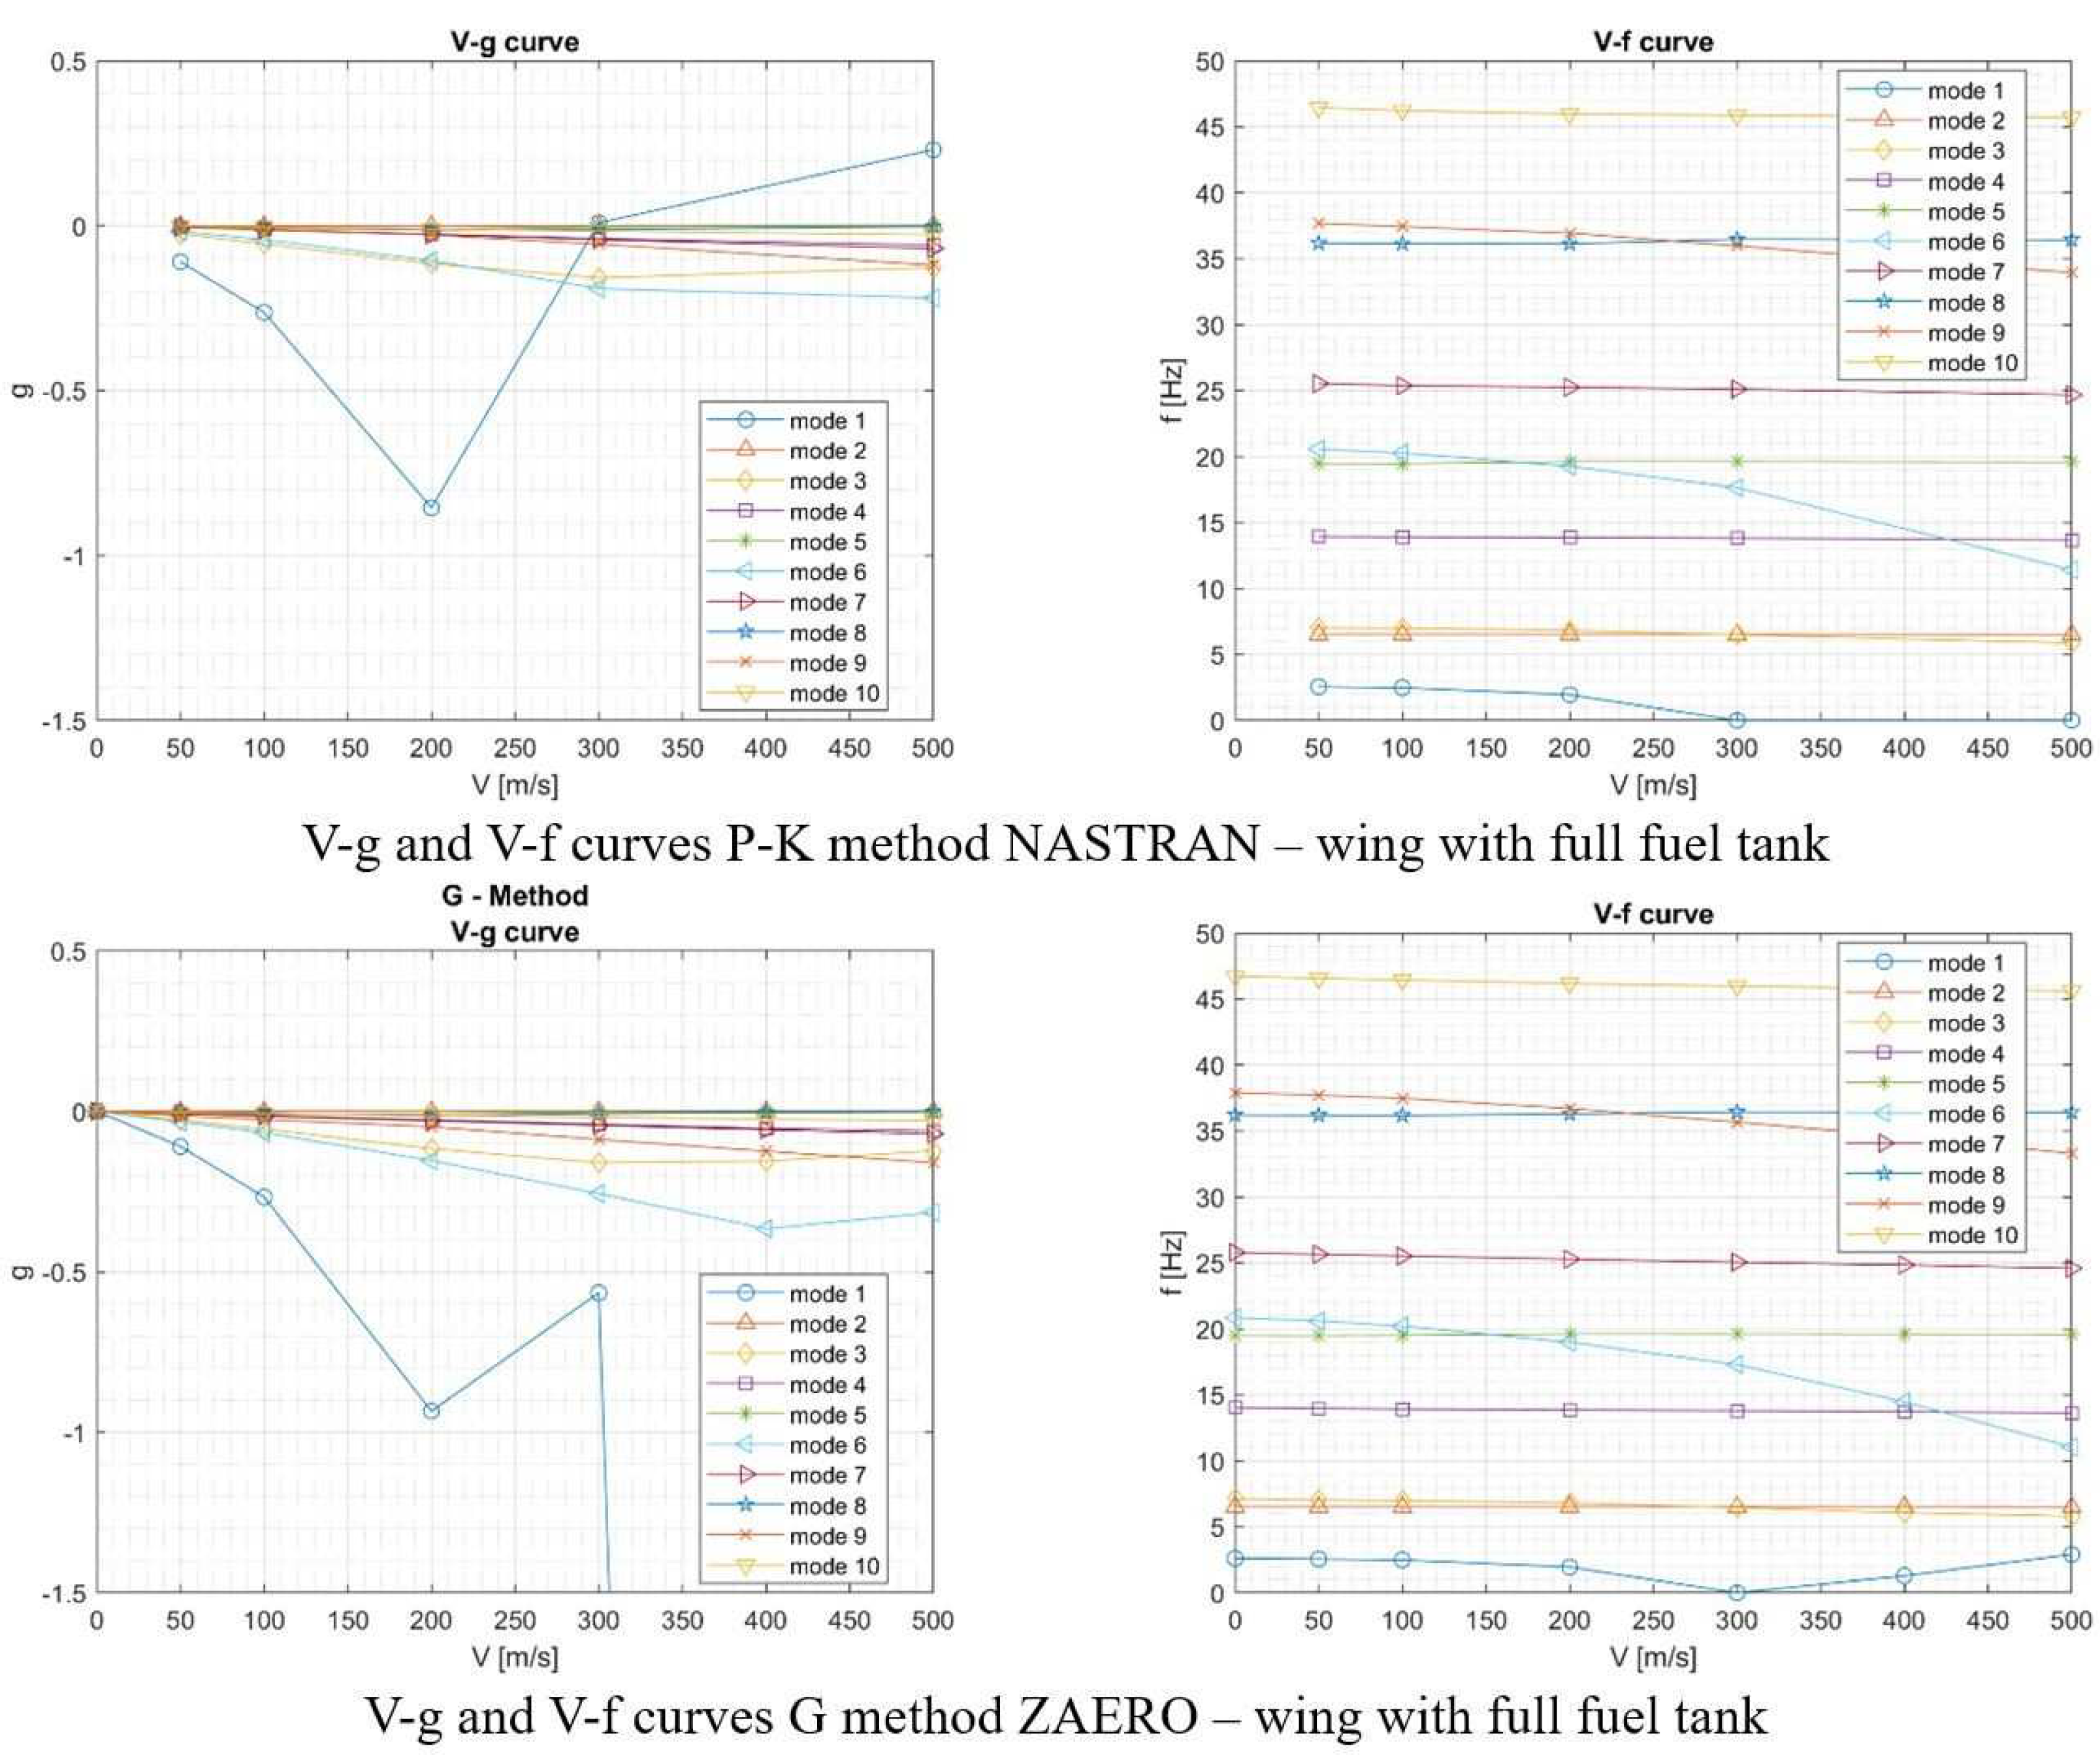

Table 2.
ZAERO Aeroelastic Analysis results - wing with full fuel tanks.
| K method | G method | ||||
| mode | vf(m/s) | Freq. (Hz) | mode | vf(m/s) | Freq. (Hz) |
| 2 | 326.1 | 6.53 | 2 | 324.5 | 6.53 |
| 3 | 671.0 | 5.60 | 4 | 665.8 | 5.77 |
| 5 | 591.9 | 19.59 | 5 | 581.8 | 19.59 |
3.2. 2nd Test Case - Forward swept wing
The second test case has been selected due to the availability of the experimental modal analysis results and offered the opportunity to study a realistic case. The aircraft under study is an ultralight twin-seat aircraft whose fuselage has been changed from metallic to a carbon-fiber material (max cruise speed = 59 m/s and max take-off weight = 600 kg). The main dimensions are shown in Figure 9. A complex FEM model of the aircraft under examination made it possible to perform preliminary dynamic flutter analyzes. This model and the mode shapes deriving from the dynamic analysis, is shown in the Figure 10.
For the study of the comparison between the two different codes, it was instead decided to adopt a simplified model of the horizontal tailplane, which would allow obtaining adequate results with the advantage of saving time.
Table 3.
Results of the aeroelastic analysis as the stiffness varies along the wingspan.
| Reference | Stiffness var. | Stiffness var. |
| stiffness distribution | @ 20-30% | @ 30-40% |
| vf(m/s) | vf(∆%) | vf(∆%) |
| 430 | −4.7 | −2.8 |
In particular, the flutter analysis refers only to the horizontal tailplane. As regards the first, simplified stabilator FEM model, the structure of the fuselage is simplified and idealized through six elastic elements that constitute the degrees of freedom. In more detail, the central node of the stabilator is connected to a fixed node of the fuselage utilizing six elastic elements, which represent the stiffness of the fuselage. Rigid elements have also been introduced in the model to better highlight the modes, facilitating their visualization in the post-processing phase and therefore the distinction between bending and torsional mode shapes. The aeroelastic FEM model is shown in Figure 11, in which it is possible to appreciate the constraint, the concentrated masses, the rigid elements, the aerodynamic panels, the set of nodes used for the interpolation, the spline itself.
For the analysis of flutter of the stabilator, various study cases are taken into account and they differ in the constraint condition (fixed) or in the unconstrained degree of freedom (rotation around the longitudinal axis x, rotation around the transverse axis y, and rotation around the vertical axis z) and for the value assumed for the stiffness of the elastic element. From the calculations performed by NASTRANTM, the Flutter condition is not found in any of the previously mentioned cases. A comparison is then made with the results obtained using the ZAERO code. First, however, it was deemed necessary to carry out a sort of sensitivity analysis to better understand how the aeroelastic responses of the structure are influenced by changes to the variables of the ZAERO code such as the number of aerodynamic panels along chord and along wingspan, nodes used for structural and aerodynamic interpolation, type of spline: linear or surface spline.
The purpose is to identify the parameters that make the analysis more conservative concerning the identification of the Flutter condition.
By neglecting to report the results of the numerous sensitivity analysis, from an evaluation of the values and the trend of the V-g and V-f graphs obtained from the analysis, it is possible to conclude that the best way to proceed is to use a surface-type spline that allows the end nodes of the rigid elements to be included for interpolation. In any case, the numerical flutter modes obtained through this model have too high and unrealistic natural frequencies.
When ensuring the safety of aircraft against aeroelasticity phenomena, one of the important steps of investigation is Ground Vibration Test.
GVT can be performed to obtain the vibration amplitude distributions and the frequencies of the structure. The GVT results can be used for checking FEM results or used directly in the prediction of the flutter problems [25].
The next phase concerns the verification and tuning of the analytical results to the experimental ones. At this point, aerodynamic loads are modeled and measured using a wind tunnel test and combined with the dynamic properties in an analytical flutter prediction.
Finally, test flights are carried out for validation of the reached results and final certification, according to the requirement of the airworthiness standard [26].
The vibrations test has been performed by measuring the frequency response functions (FRF) between several points of the stabilator structure, each concerning a fixed position of the excitation point.
The excitation point is located in the middle of the rear spar of the horizontal tail. A maximum of 12 points for each side of the stabilator was measured. The excitation signal used during these tests has been a Sine Sweep Excitation, obtained through an electro-dynamic exciter Modal Shop Model 2100 E11 while the structural response has been measured with PCB 333B32 ICP piezoelectric accelerometers.
The evaluation of the FRF was carried out by using a standard 8 channels FFT analyzer, the LMS Scadas 05 Mobile. The LMS TestLab software provides the subsequent steps for the analysis and the extraction of the modal parameters by means LMS PolyMAX algorithm. This modal parameters identification method yields extremely clear stabilization charts. Following the vibration tests, based on the experimental modal analysis results (4), the idea of updating the model of the horizontal tailplane was evaluated, thus making it better representative of the test article on which the tests were carried out.
The best modeling consists of discretizing the tailplane in as many points as are those considered in the test setup, in which the accelerometers have been placed (Figure 12). As regards the masses, it has been assumed that the stabilator weighs a total of 0.8 kg. This weight is distributed equally over the 24 nodes in which the stabilator is discretized while for the fuselage section weight of about 2 kg is assumed, equally distributed over the 5 nodes of the fuselage.
The aerodynamic model consists of 10 boxes along the chord and 15 along the wingspan. The new aeroelastic model is shown in Figure 13 in which the distribution of concentrated masses and the nodes used for the aerodynamic-structural spline are highlighted.
Preliminarily, a modal analysis and a Dynamic Flutter analysis are carried out of the new model using the P-K method. The results of these analyzes are reported for the first 20 modes. Table 4 indicates the natural frequencies obtained while Figure 13 indicates the mode shapes.
As regards the dynamic flutter analysis, as can be seen from Figure 14, employing the P-K method of Nastran, no Flutter instability occurs for zero structural damping up to Vmax = 200 m/s. The analysis results obtained using the ZAERO software, on the other hand, highlights a flutter instability associated with the 9th mode of a torsional nature, as shown in Figure 15 and Figure 16. The flutter speed calculated with both the k and g methods is shown in Table 5. In the same table it is also observed how by increasing the value of the structural damping, the flutter speed increases.
4. Conclusions
This paper aims to compare different aeroelastic methods outcomes achieved using both NASTRAN™ and Zonatech ZAERO software. To obtain a numerical comparison between the results, the P-K, K, and G methods have been used to perform the aeroelastic analysis of two cases study: a forward-swept wing and the stabilator of a two-seater aircraft of the general aviation. In the first case, the flutter speed identified with the two software and with different aeroelastic methods outputs almost similar results, very close to each other. In the second case study, ZAERO provides a solution identified as flutter for the vertical tailplane but in any case much greater than the maximum speed. The free flutter condition is verified. In a flutter analysis, the computation could be repeated many times, so the computational time of a particular job is important. The computational time is below one minute in both examined cases in this work. This fact is due to quite simple models geometries and aerodynamic but in general, it is necessary to point out the most time-consuming part of the ZAERO computation is the Aerodynamic Influence Coefficients matrix that is proportional to the squared number of aerodynamic boxes. This study allowed the authors to familiarize with ZAERO software, noting the simplicity with which it is possible to use it rather than Nastran solver, based on the same nomenclature of the instructions used. Greater convenience in using the ZAERO software rather than Nastran can be seen for more complex geometries than those attributable to stick-beam structures for the aeroelastic analyses.
Table 6.
Experimental Modal Analysis Results.
| No. mode | Freq. (Hz) | Mode shape |
|---|---|---|
| 1 | 1.99 | Rigid body mode |
| 2 | 4.0 | Rigid body mode |
| 3 | 9.76 | Fuselage tail torsion |
| 4 | 12.59 | Fuselage tail bending |
| 5 | 14.09 | Fuselage tail bending |
| 6 | 18.23 | Fuselage tail bending |
| 7 | 19.42 | Horizontal tail bending |
| 8 | 29.12 | Horizontal tail bending |
Author Contributions
Conceptualization, A.D.M. and F.M.; methodology, F.M.; software, A.D.M.; validation, A.D.M., and F.M.; formal analysis, A.D.M.; investigation, A.D.M., M.G., T.P.; resources, M.G., T.P., F.M.; data curation, A.D.M. and T.P.; writing—original draft preparation, A.D.M.; writing—review and editing, M.G., T.P., and F.M; visualization, M.G. and T.P.; supervision, F.M. All authors have read and agreed to the published version of the manuscript.
Funding
This research received no external funding.
Data Availability Statement
The data presented in this study is unavailable due to industrial privacy re-strictions.
Conflicts of Interest
The authors declare no conflict of interest.
Abbreviations
The following abbreviations are used in this manuscript:
| CFD | Computational Fluid Dynamics |
| EMA | Experimental Modal Analysis |
| FEM | Finite Element Method |
| GVT | Ground Vibration Test |
| UAV | Unmanned Aerial Vehicle |
References
- Pines, S. An Elementary Explanation of the Flutter Mechanism, Proceedings Nat. Specialists Meeting on Dynamics and Aeroelasticity, Institute of the Aeronautical Sciences, Ft. Worth, TX, USA, pp. 52-58.
- C. Niu, M. C.-Y. Niu, Composite Airframe Structures, 1992.
- P. Lubrina, S. Giclais, C. Stephan, M. Boeswald, Y. Govers, N. Botargues, AIRBUS a350 XWB GVT: State-of-the-art tech-niques to perform a faster and better GVT campaign, in: Topics in Modal Analysis II, Volume 8, Springer International Publishing, 2014, pp. 243–256.
- G. Dessena, D. I. Ignatyev, J. F. Whidborne, A. Pontillo, L. Z. Fragonara, Ground vibration testing of a flexible wing: A benchmark and case study, Aerospace 9 (2022) 438. [CrossRef]
- J. P. N oel, L. Renson, G. Kerschen, B. Peeters, S. Manzato, J. Debille, Nonlinear dynamic analysis of an f-16 aircraft using gvt data, in: International Forum on Aeroelasticity Structural Dynamics 2013 Conference Programme Proceedings 24-26 June Bristol UK, 2013, pp. 1–13.
- K. J. Lemler, W. H. Semke, Application of modal testing and analysis techniques on a sUAV, in: Special Topics in Structural Dynamics, Volume 6, Springer New York, 2013, pp. 47–57.
- G. Coppotelli, C. Grappasonni, M. Arras, D. Valyou, J. Miller, P. Marzocca, System identification from GVT and taxiing of an unmanned aerial vehicle, in: SAE Technical Paper Series, SAE International, 2013. [CrossRef]
- Marano, A.D.; Belardo, M.; Beretta, J.; Starace, F.; Orlando, S.; Punzi, C.; Frajese, R.; Paletta, N.; Di Palma, L. Aeroelastic Tailoring of the Next Generation Civil Tiltrotor Technological Demonstrator Composite Wing. Aerospace 2022, 9, 335. [Google Scholar] [CrossRef]
- Goge, D. Automatic updating of large aircraft models using experimental data from ground vibration testing. Aerospace Science and Technology 2003, 7, 33–45. [Google Scholar] [CrossRef]
- S. Giclais, P. Lubrina, C. Stephan, Aircraft ground vibration testing at onera, AerospaceLab Journal Issue 12 (2016) December 2016; ISSN: 2107–6596.
- Dewey, H. Hodges; G. Alvin Pierce: Introduction to Structural Dynamic and Aeroelasticity. Cambridge Aerospace Series.
- B. Peeters, H. Climent, R. De Diego, J. De Alba, J. R. Ahlquist, J. M. Carreño, W. Hendricx, A. Rega, G. García, J. Deweer, J. Debille, Modern solutions for ground vibration testing of large aircraft. 26th Conference and Exposition on Structural Dynamics 2008, IMACXXVI.
- R.L. Bisplinghoff, H. Ashley Principle of Aeroelasticity, Dover Publications,1962.
- Raymond, L. Bisplinghoff; Holt Ashley; Robert L. Halfman: Aeroelasticity. Dover publications, Inc.
- Albano, E.; Rodden, W.P. A doublet-lattice method for calculating lift distributions on oscillating surfaces in subsonic flows. AIAA Journal 1969, 7, 279–285. [Google Scholar] [CrossRef]
- Rodden, W.P.; Johnson, E.H. MSC/NASTRAN Aeroelastic Analysis User’s Guide Ver.68; MSC Software Corporation: Los Angeles, CA, USA, 1994. [Google Scholar]
- MSC Software. MSC Nastran Aeroelastic Analysis User’s Guide; MSC Software Corporation: Los Angeles, CA, USA, 2004. [Google Scholar]
- Rodden, W.P. The development of the doublet-lattice method”, International Forum on Aeroelasticity and Structural Dynamics, Rome, June 1997.
- ZAERO User’s Manual ver.9.3.
- Weisshaar, T.A. Forward Swept Wing Static Aeroelasticity, AFFDL TR-79-3087, June 1979.
- Weisshaar, T.A. Aeroelastic Stability and Performance Characteristics of Aircraft with Advanced Composite Sweptforward Wing Structures, AFFDL TR-78-116, Sept. 1978.
- Wright, J.R.; Cooper, J.E. Introduction to Aircraft Aeroelasticity and Loads, 2nd Edition ed; John Wiley Sons Inc.; p. 2015.
- Wright, J.R.; Cooper, J.E. Aircraft Aeroelasticity and Loads; Jon Wiley Sons Ltd: Manchester, UK, 2007. [Google Scholar]
- W.R. Rodden; E.H. Johnson. MSC/Nastran Aeroelastic Analysis.
- Thomson, W.T. Theory of Vibration with Applications, Third Edition, Prentice-Hall, 1988.
- Reed, W.H., III. Flight Flutter Testing: Equipment and Techniques, Presented at the FAS Southwest Region Annual Designer Conference, Ft. Worth, Texas, and November 5 and 6, 1991.
Figure 1.
The ZAERO Software System File Processing [19].
Figure 1.
The ZAERO Software System File Processing [19].
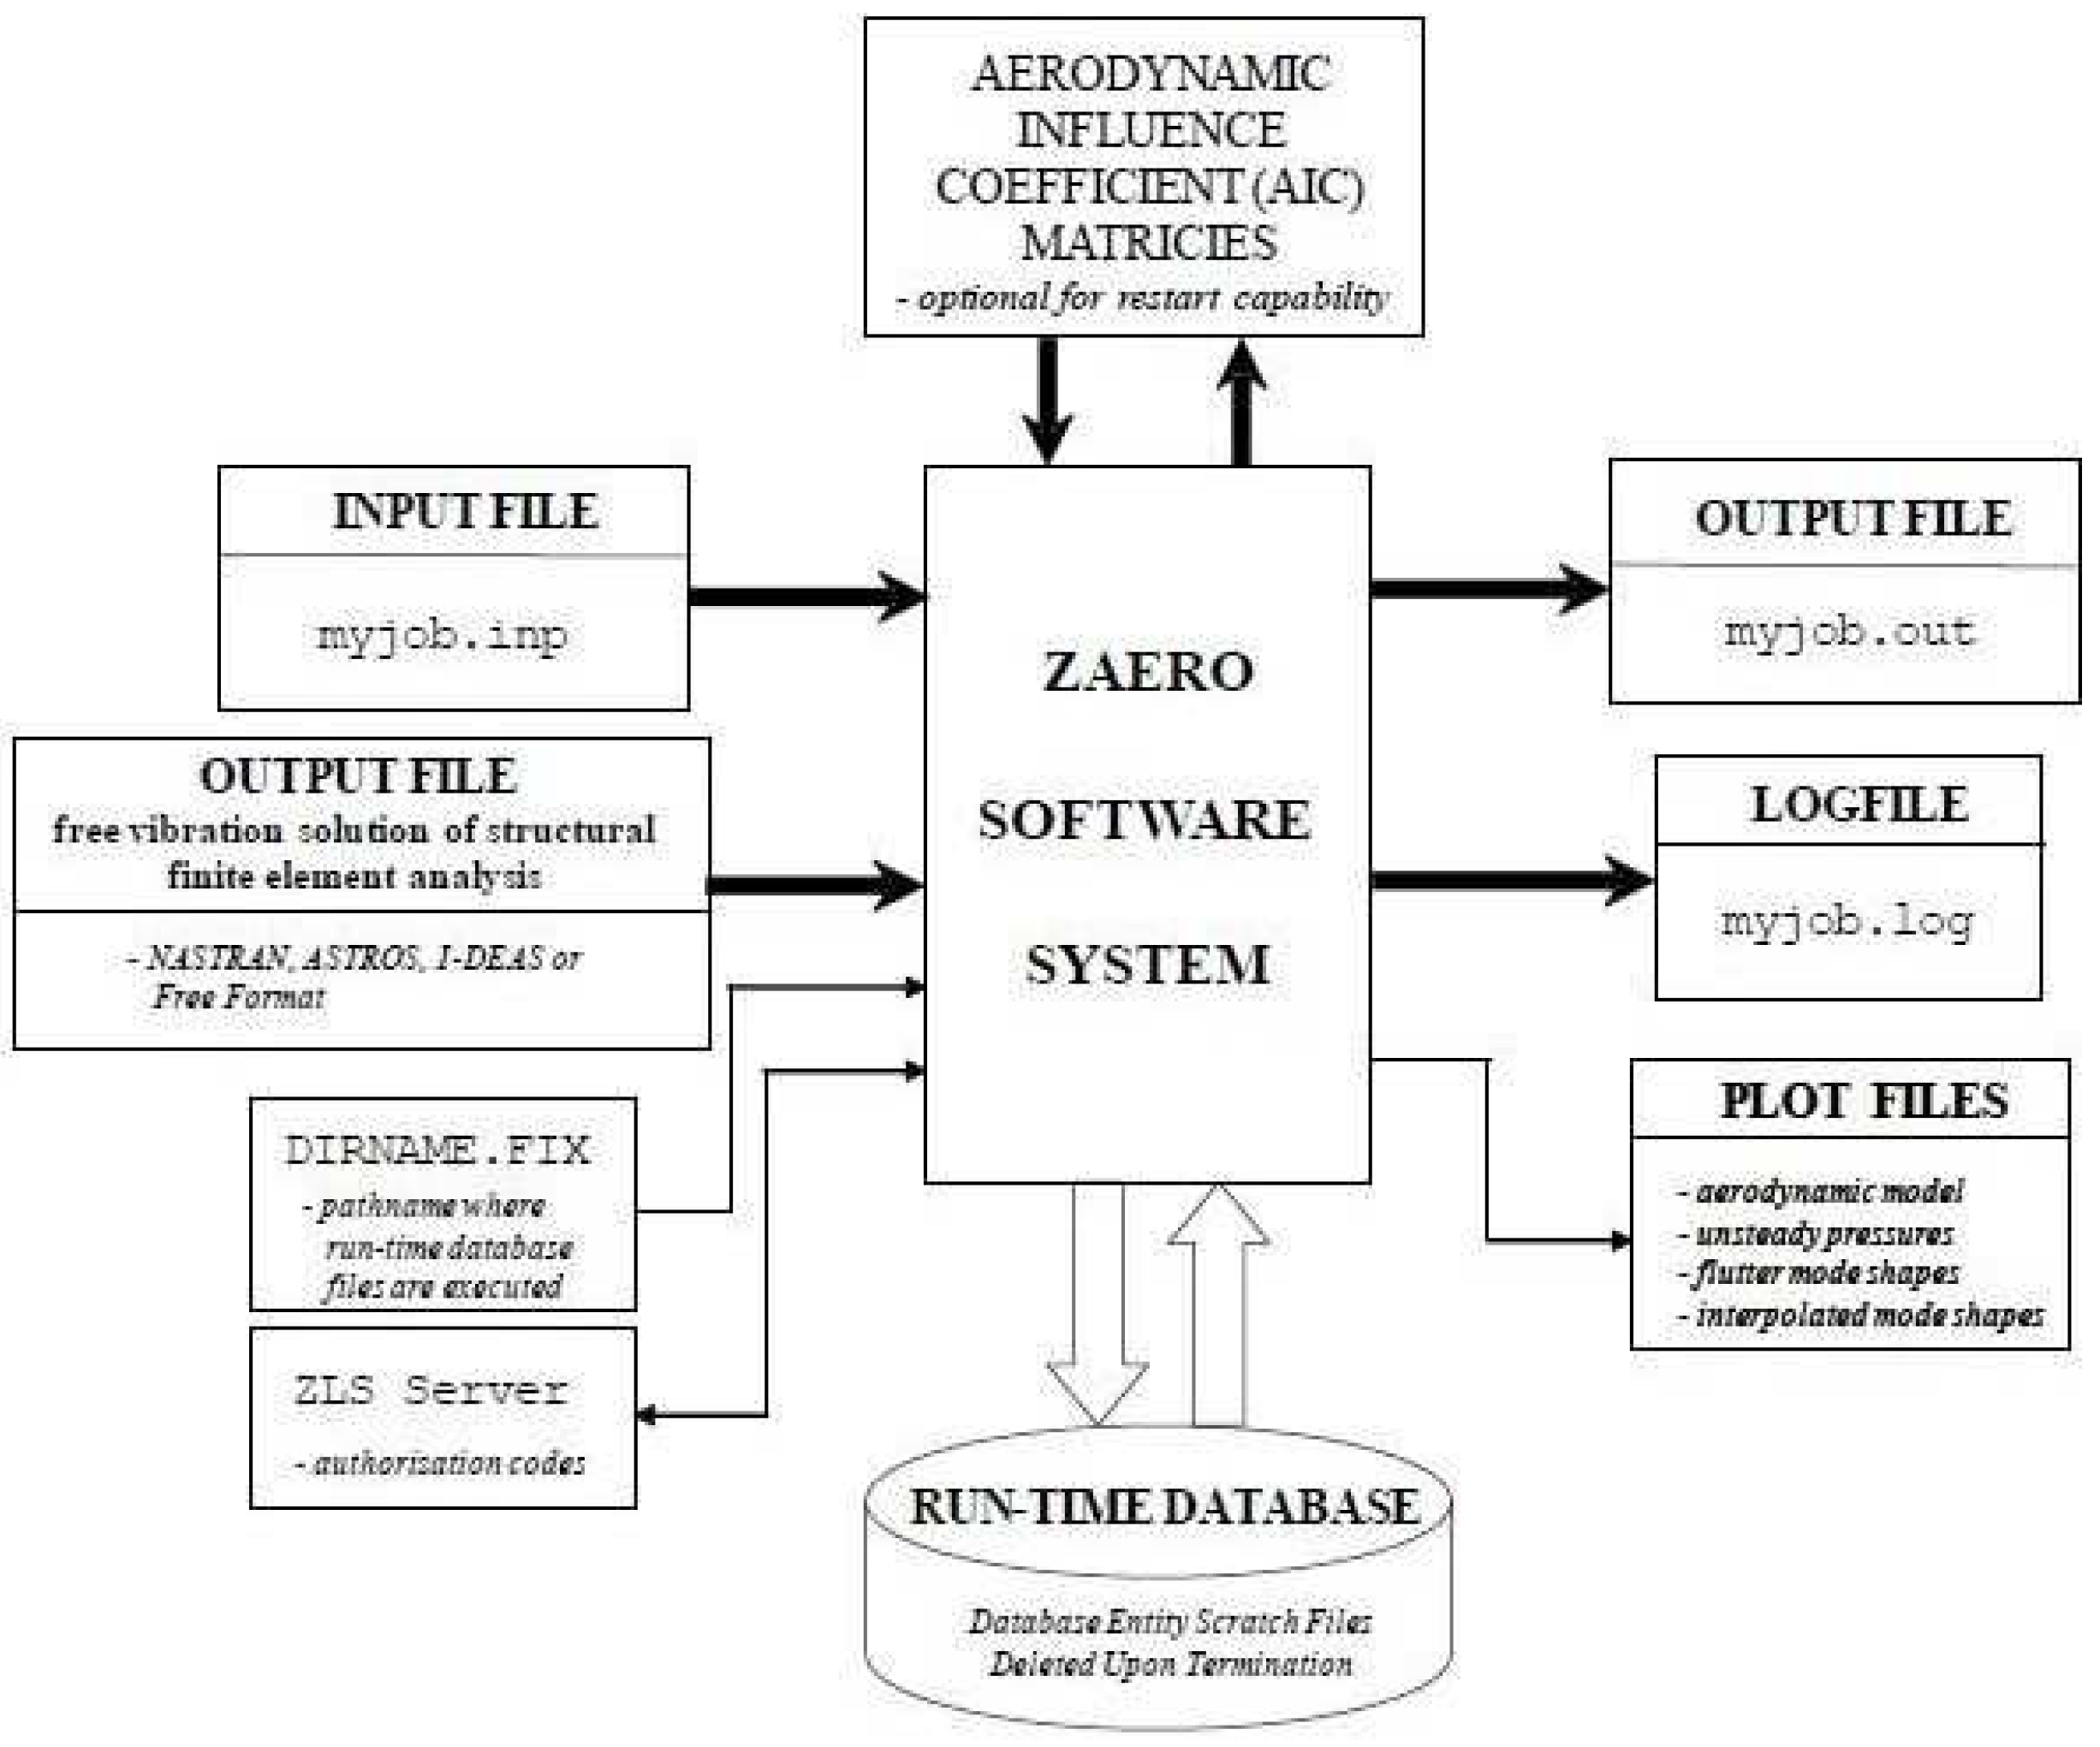
Figure 2.
Forward swept wing - aeroelastic stick model.
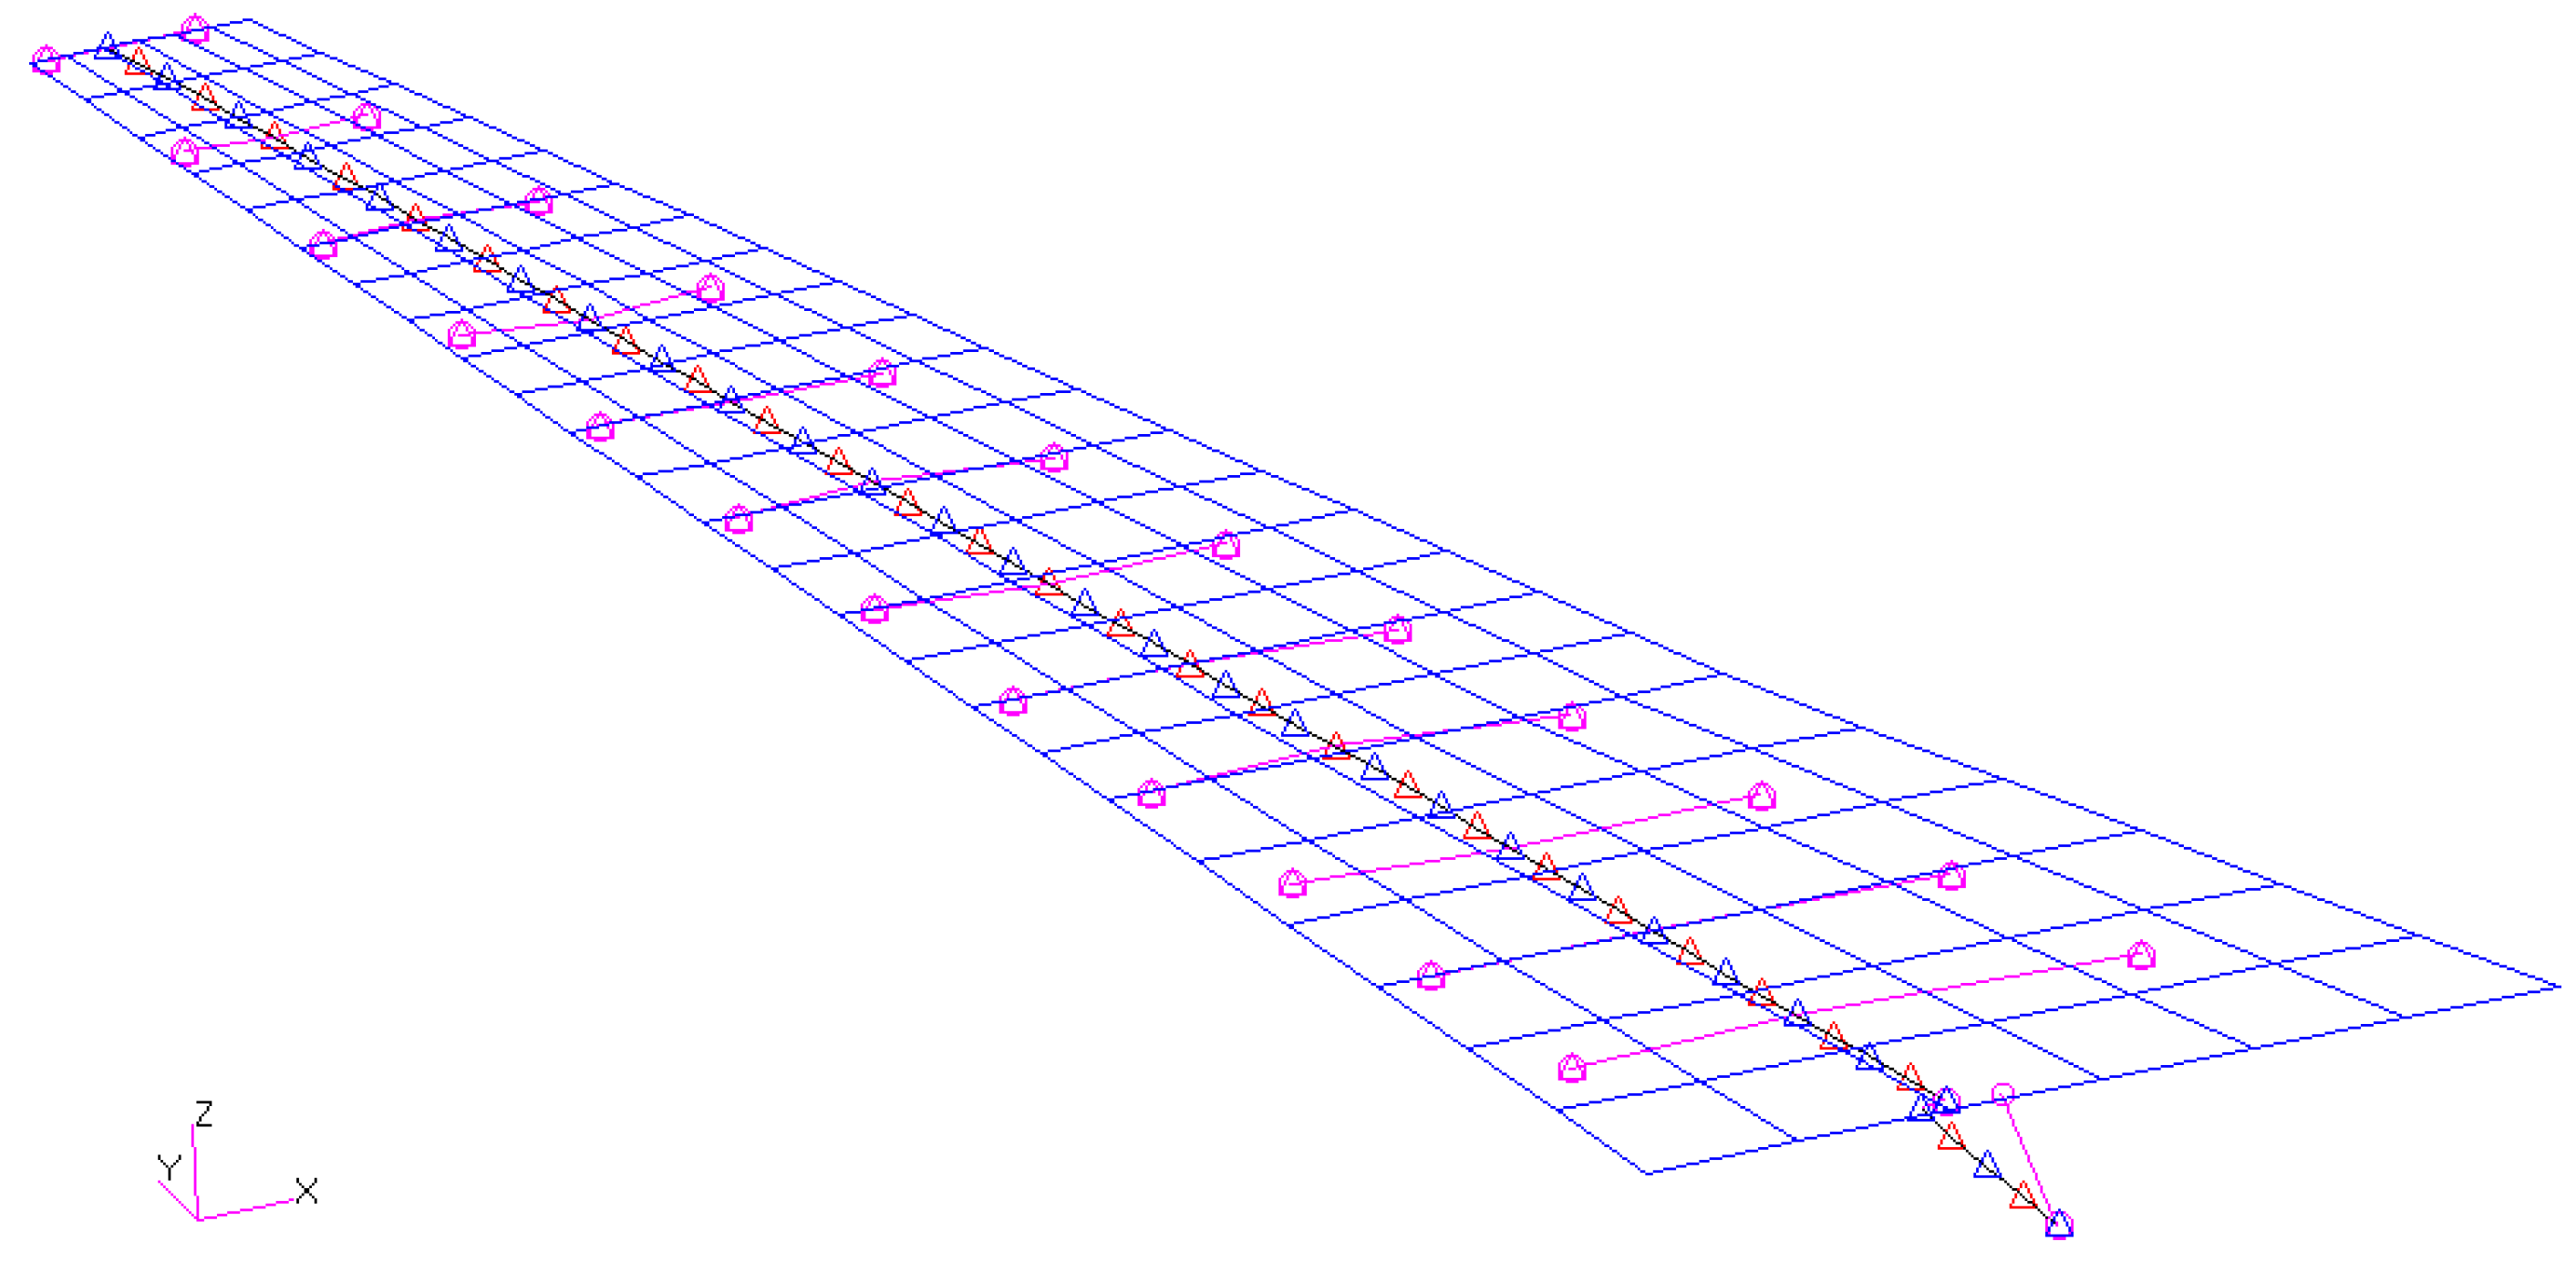
Figure 3.
Flexural and Torsional Stiffness distribution along wingspan.
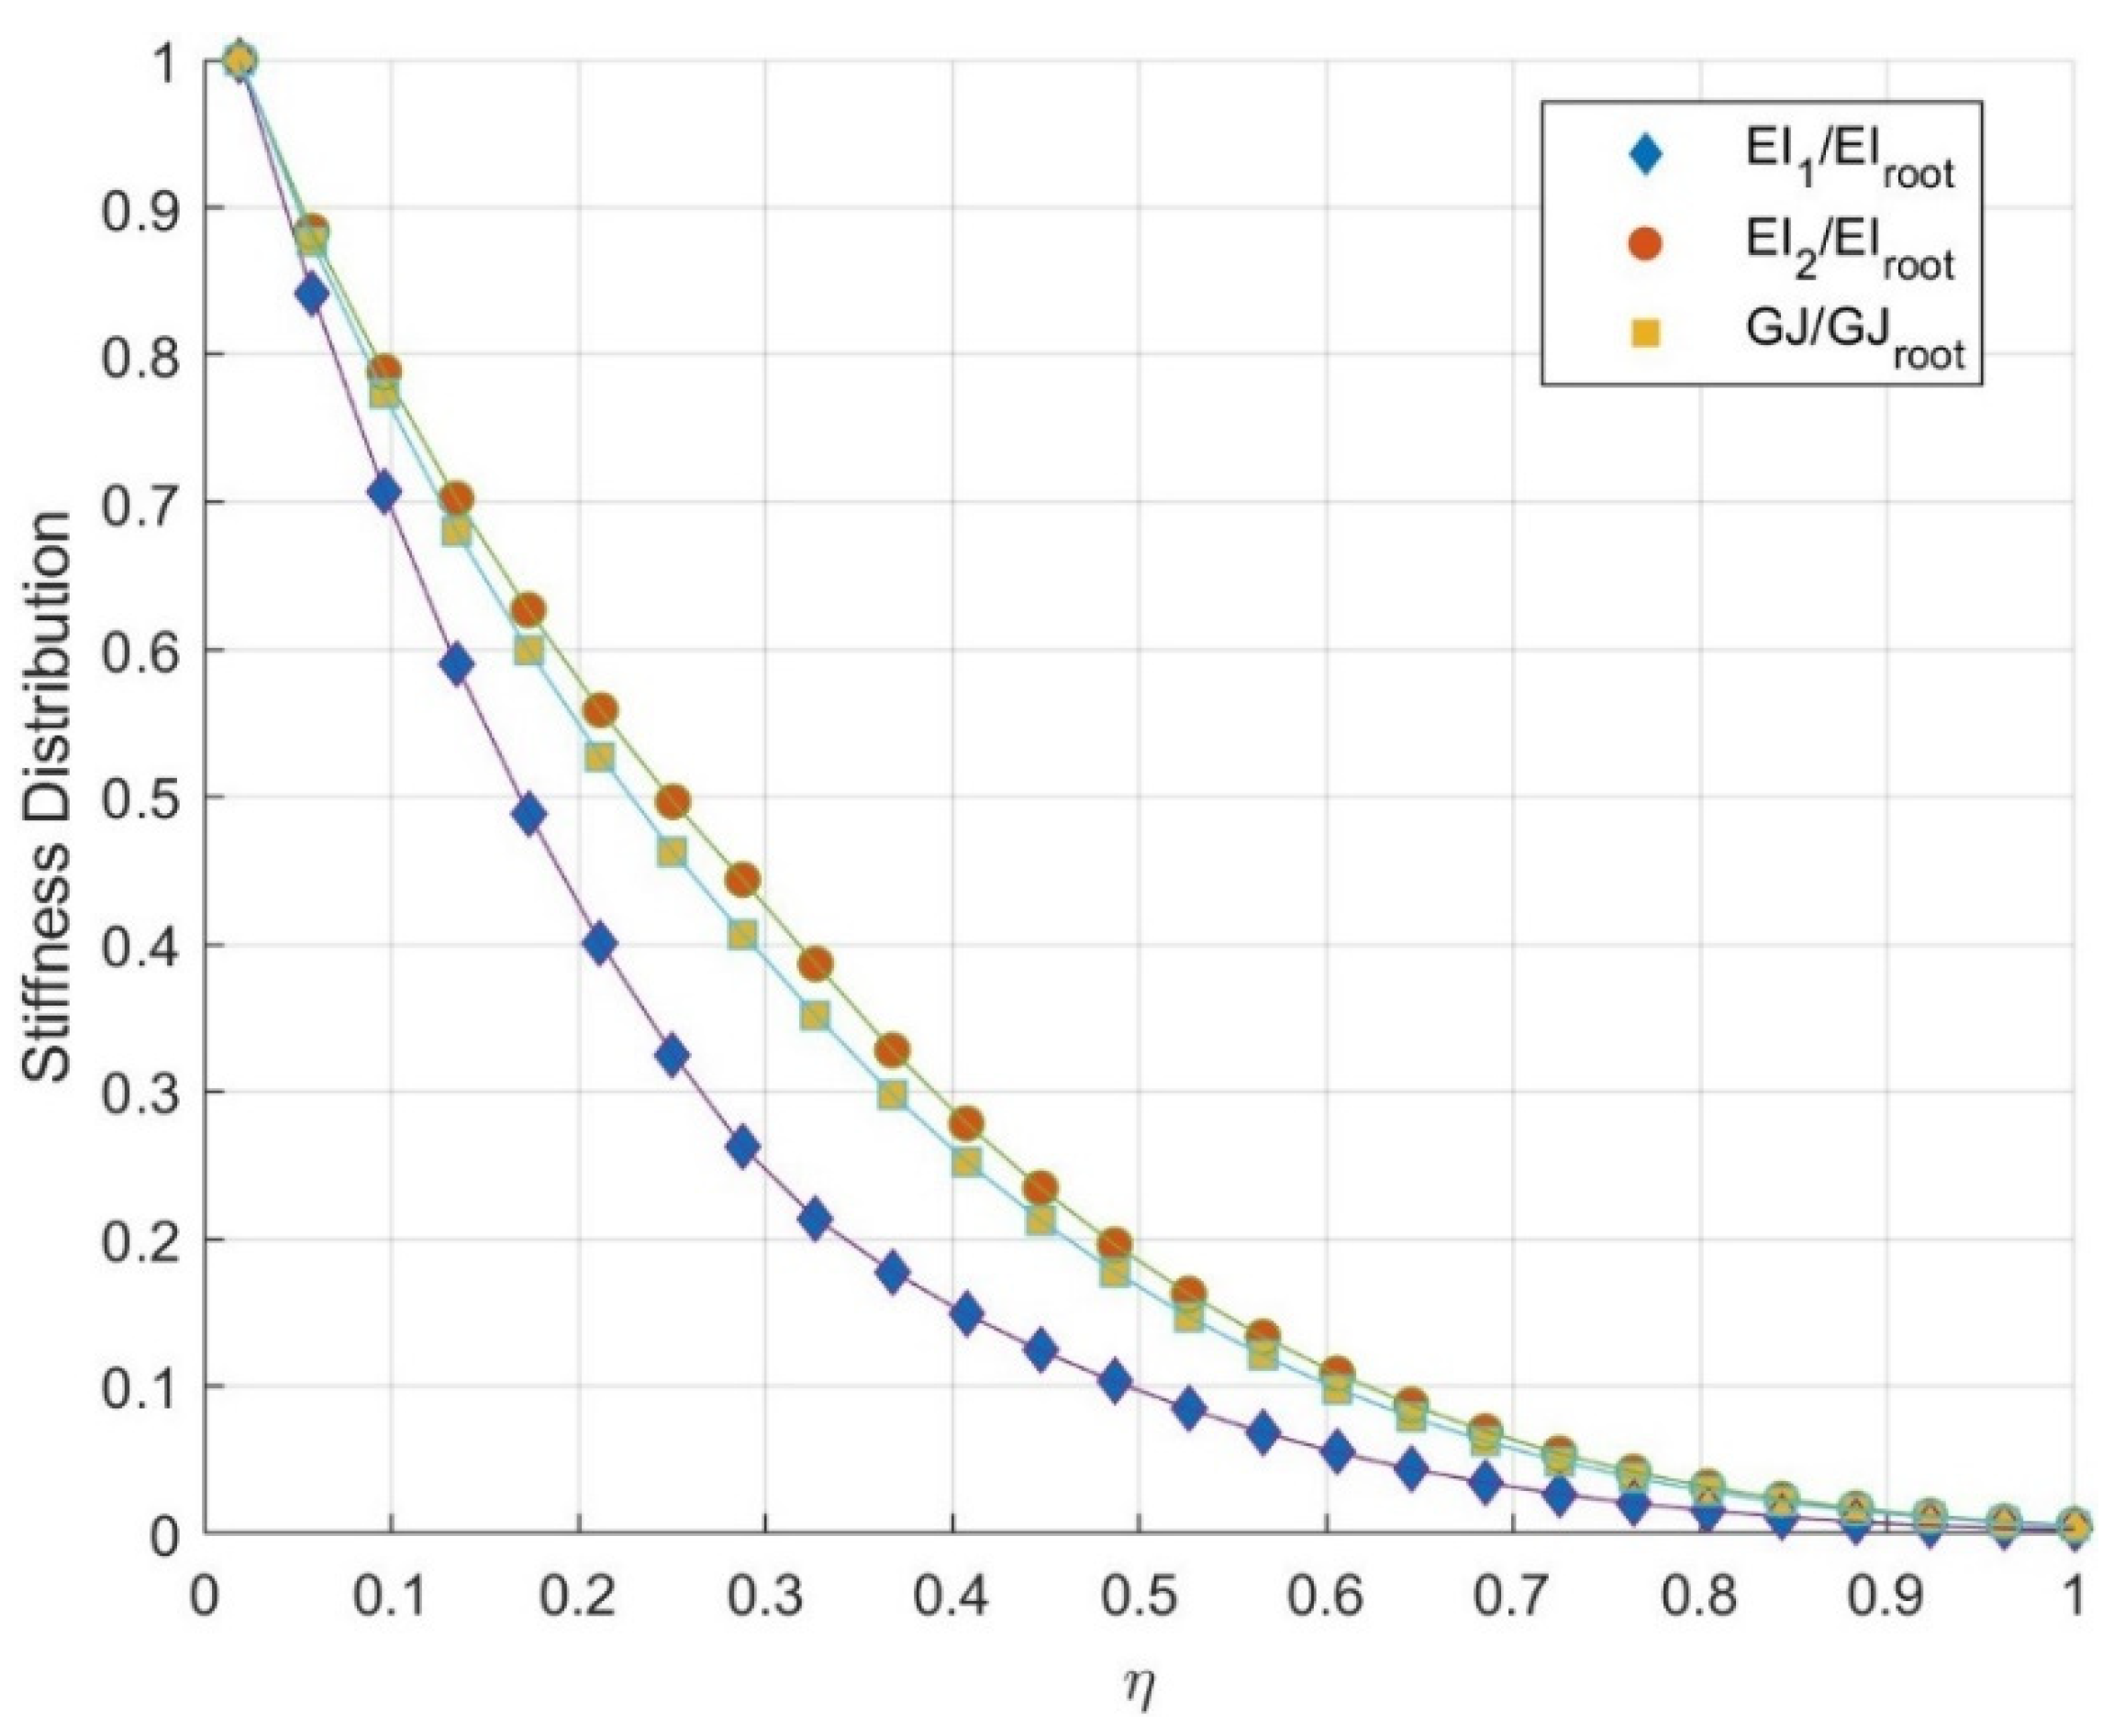
Figure 4.
Mass distribution along wingspan.
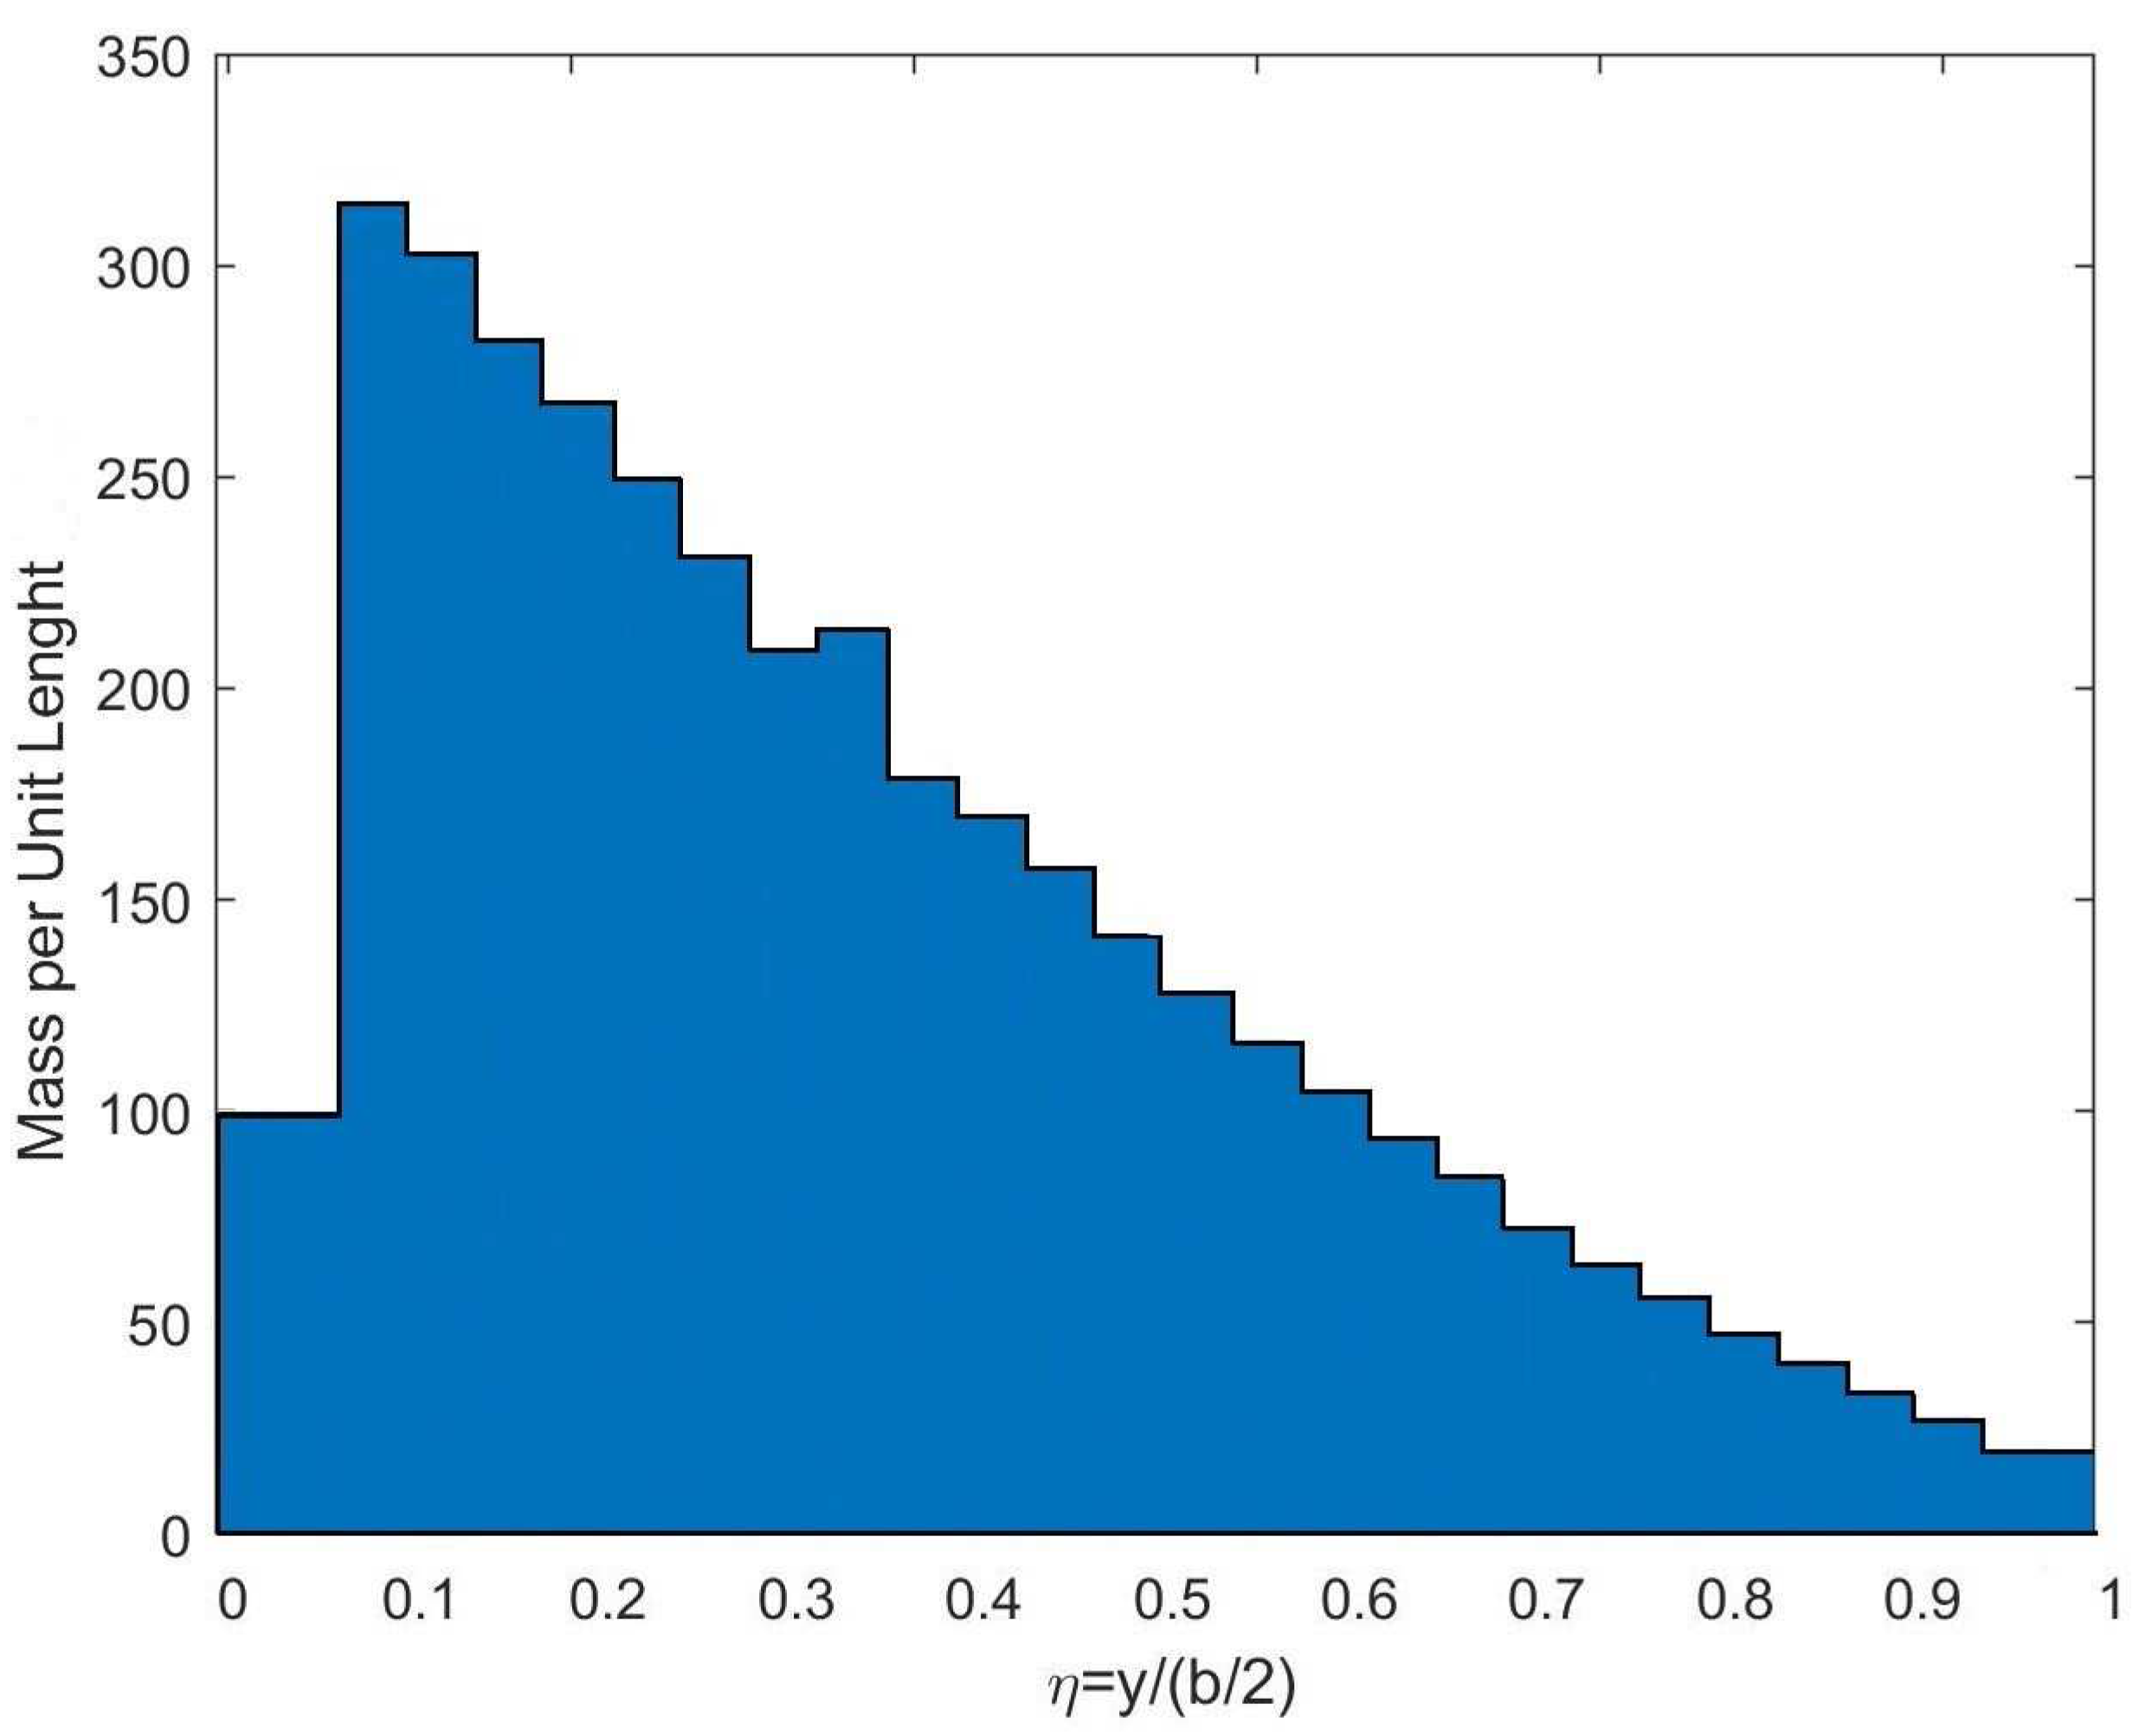
Figure 5.
Nastran Dynamic Analysis - Wing Normal Modes.
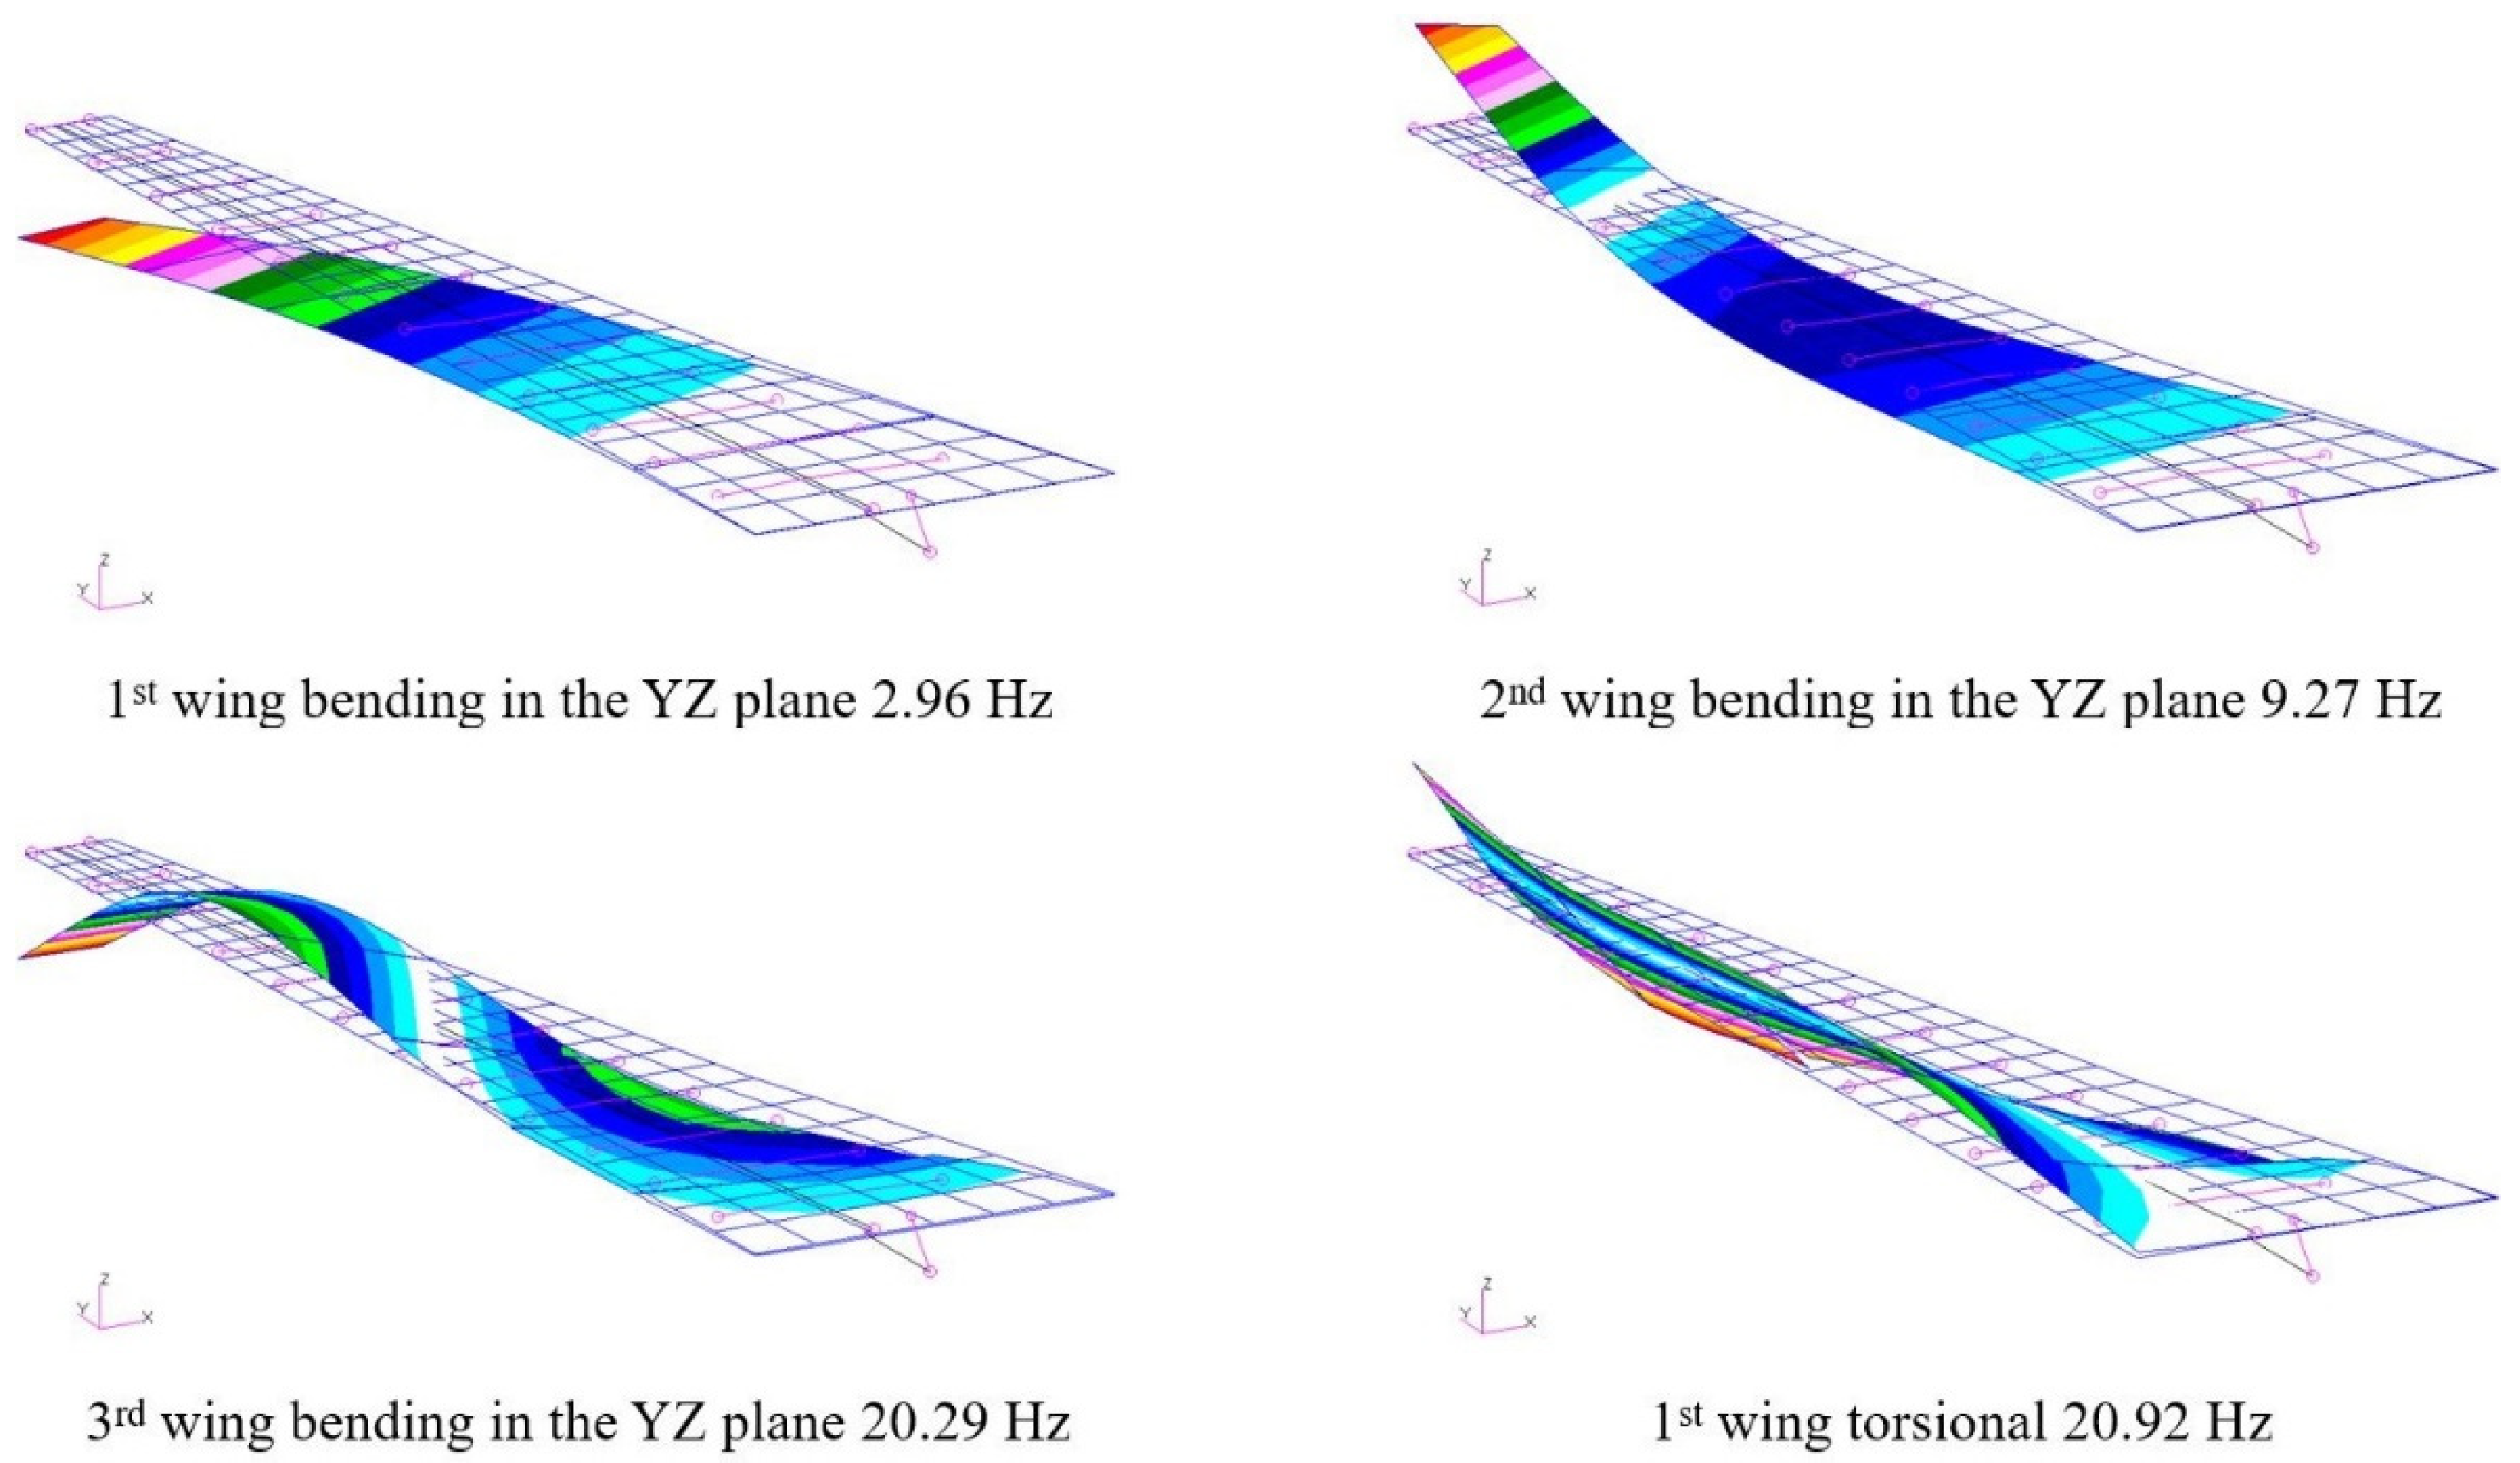
Figure 6.
V-g and V-f curves P-k method (Nastran) and G method (ZAERO) - wing with empty fuel tanks.
Figure 6.
V-g and V-f curves P-k method (Nastran) and G method (ZAERO) - wing with empty fuel tanks.
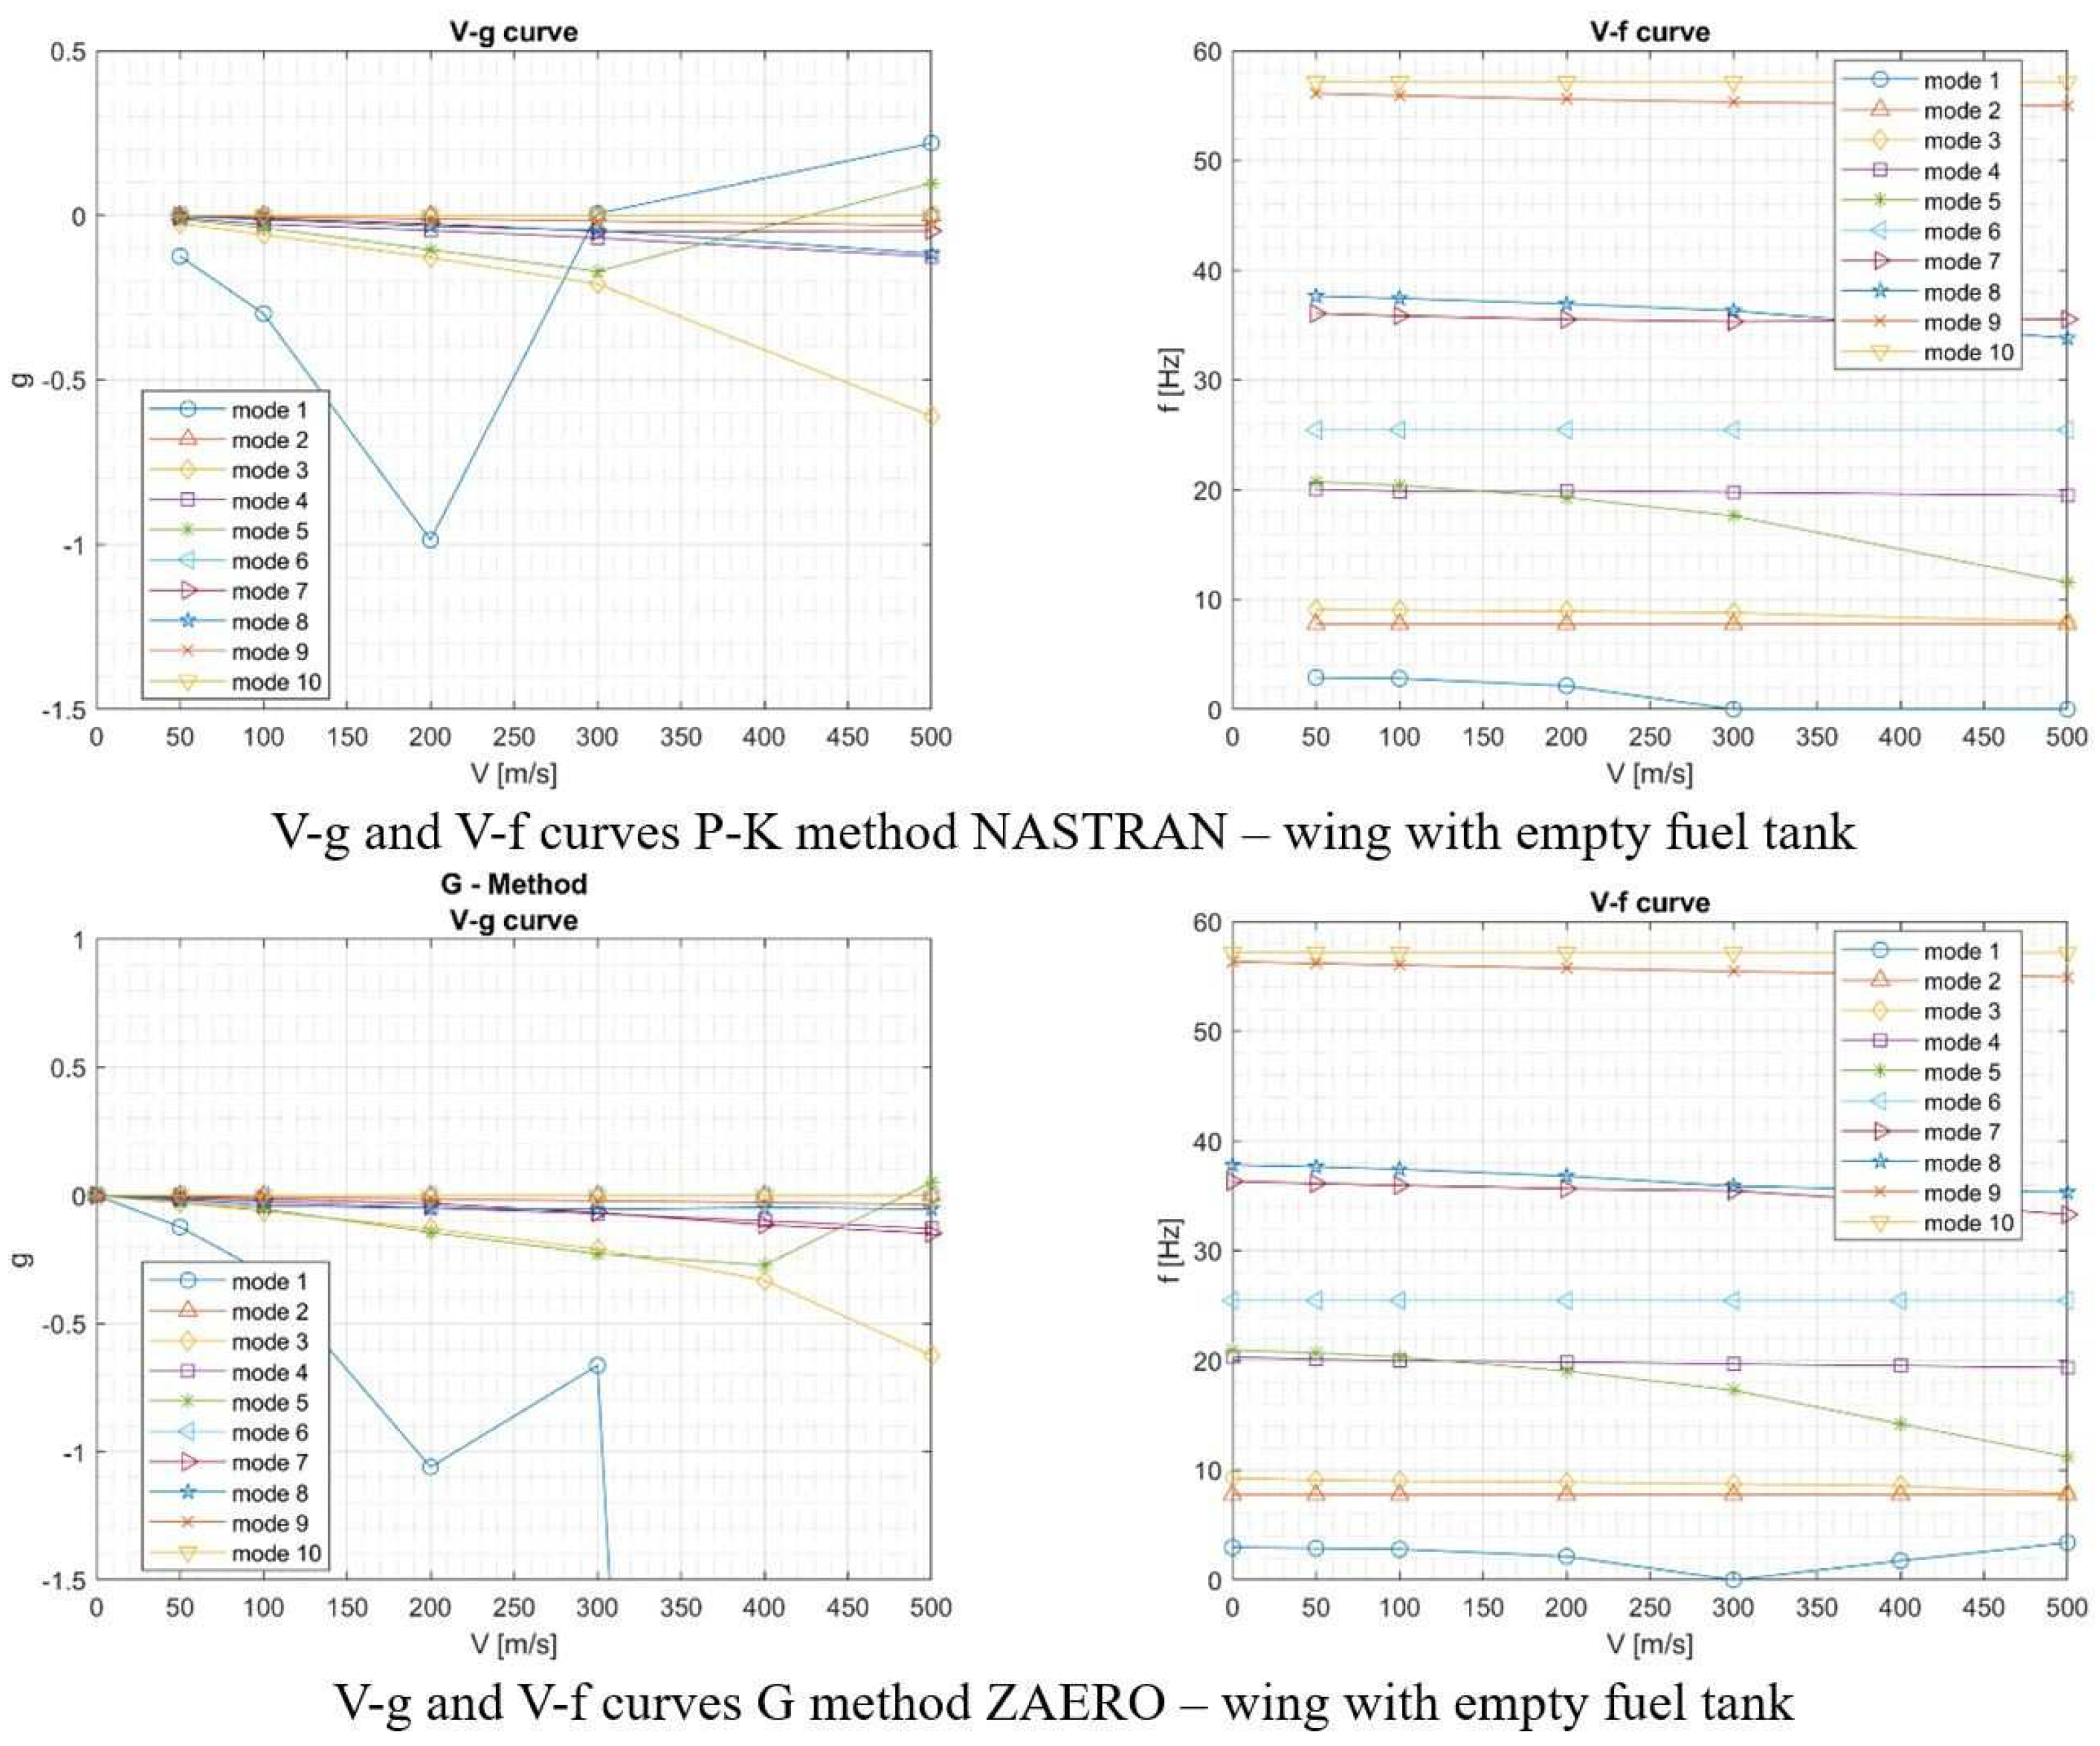
Figure 8.
Variation of stiffness distribution along the wingspan and consequent variation of the flutter speed.
Figure 8.
Variation of stiffness distribution along the wingspan and consequent variation of the flutter speed.
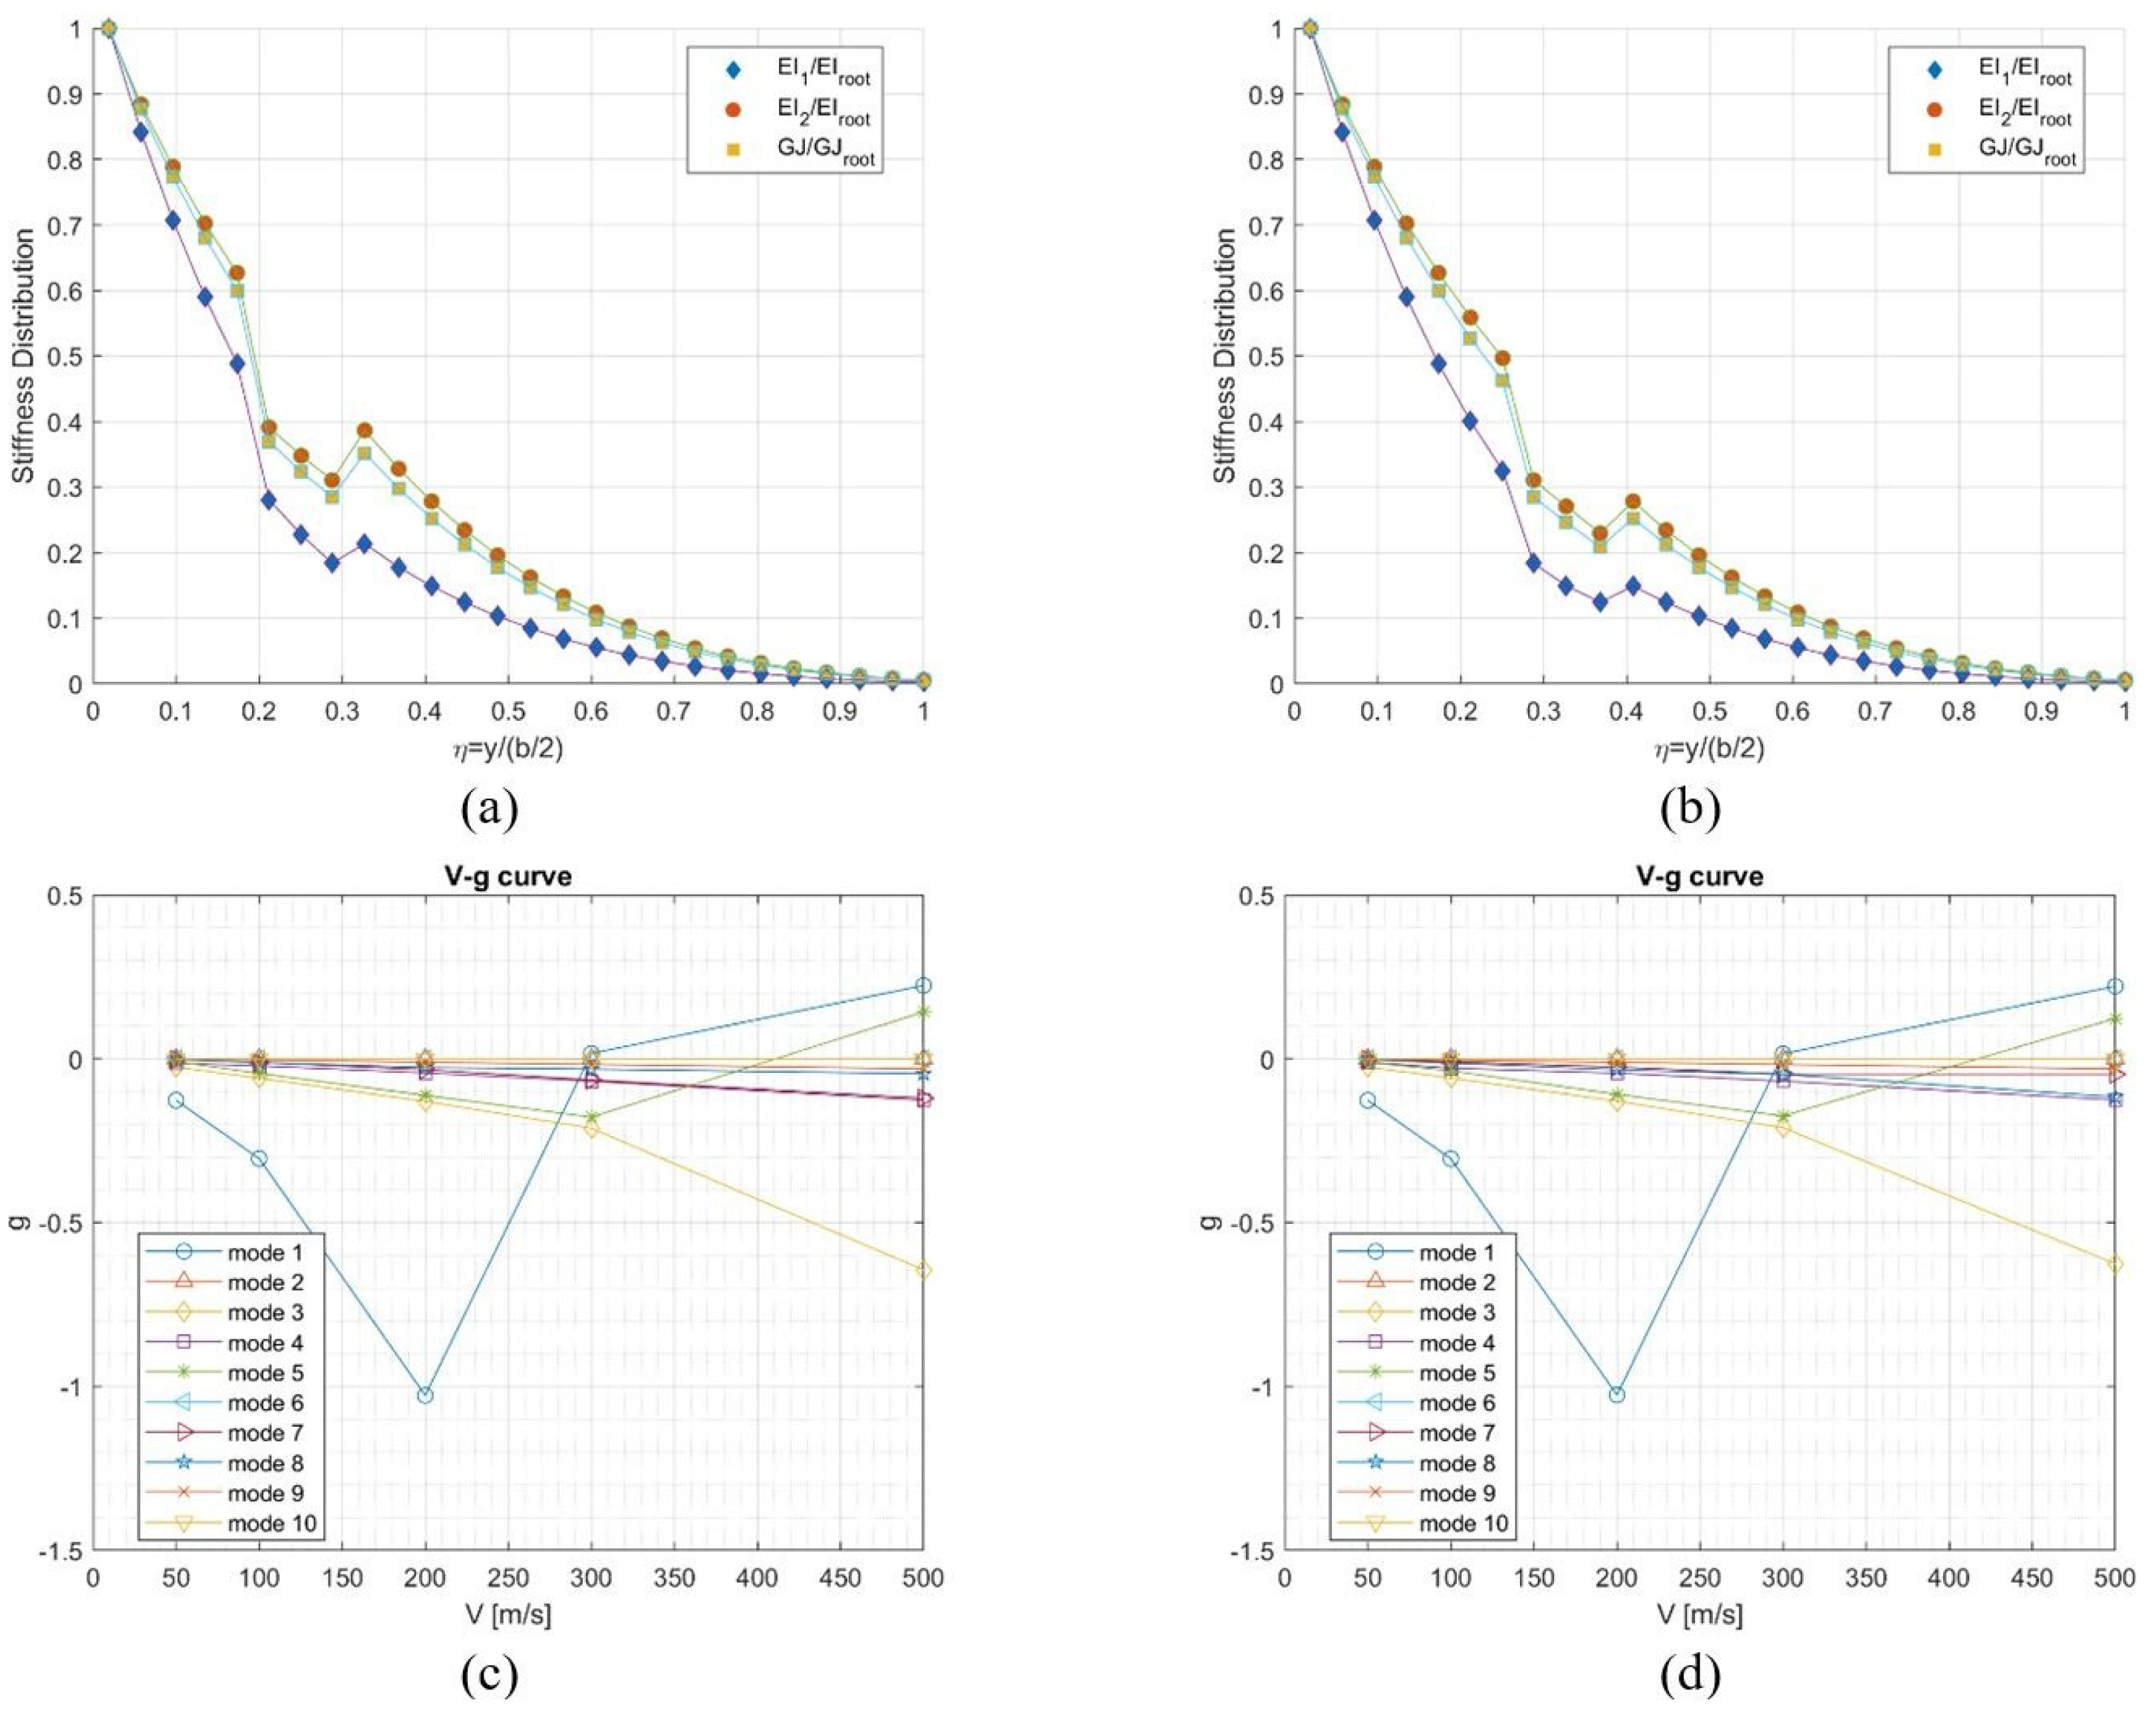
Figure 9.
Ultralight aircraft 3-views drawing.
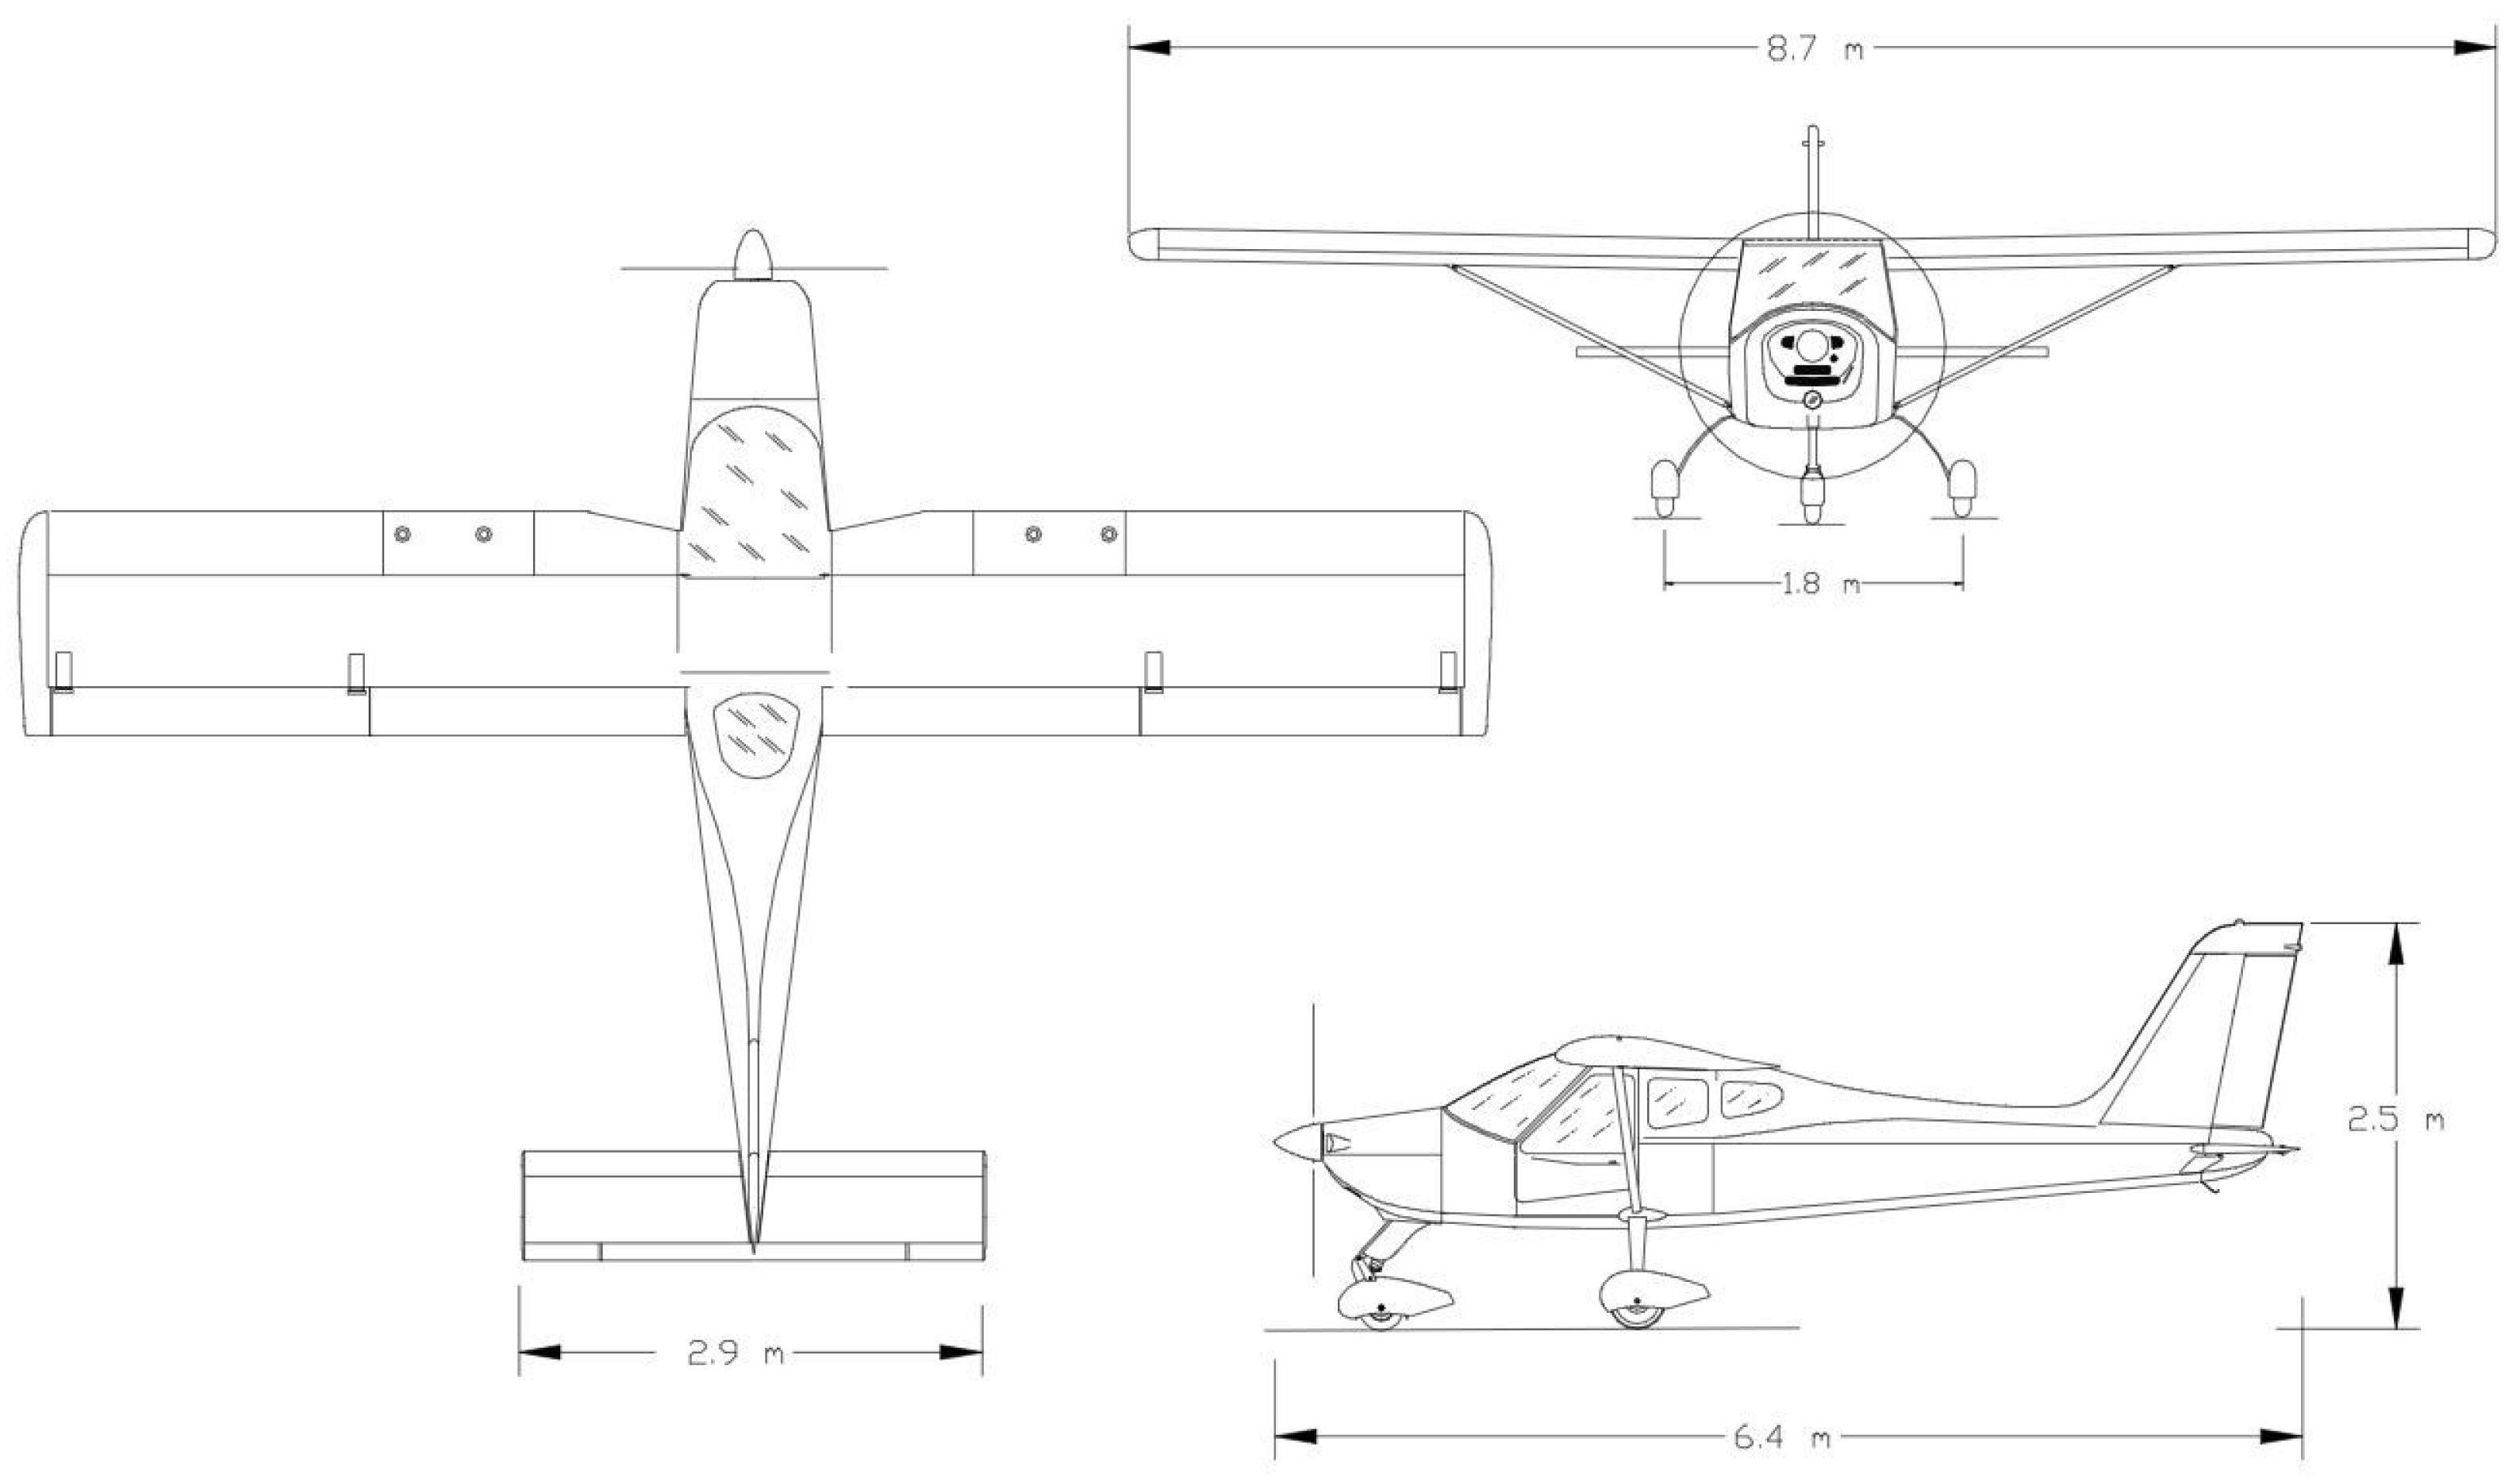
Figure 10.
Whole ultralight aircraft FEA model and mode shapes.
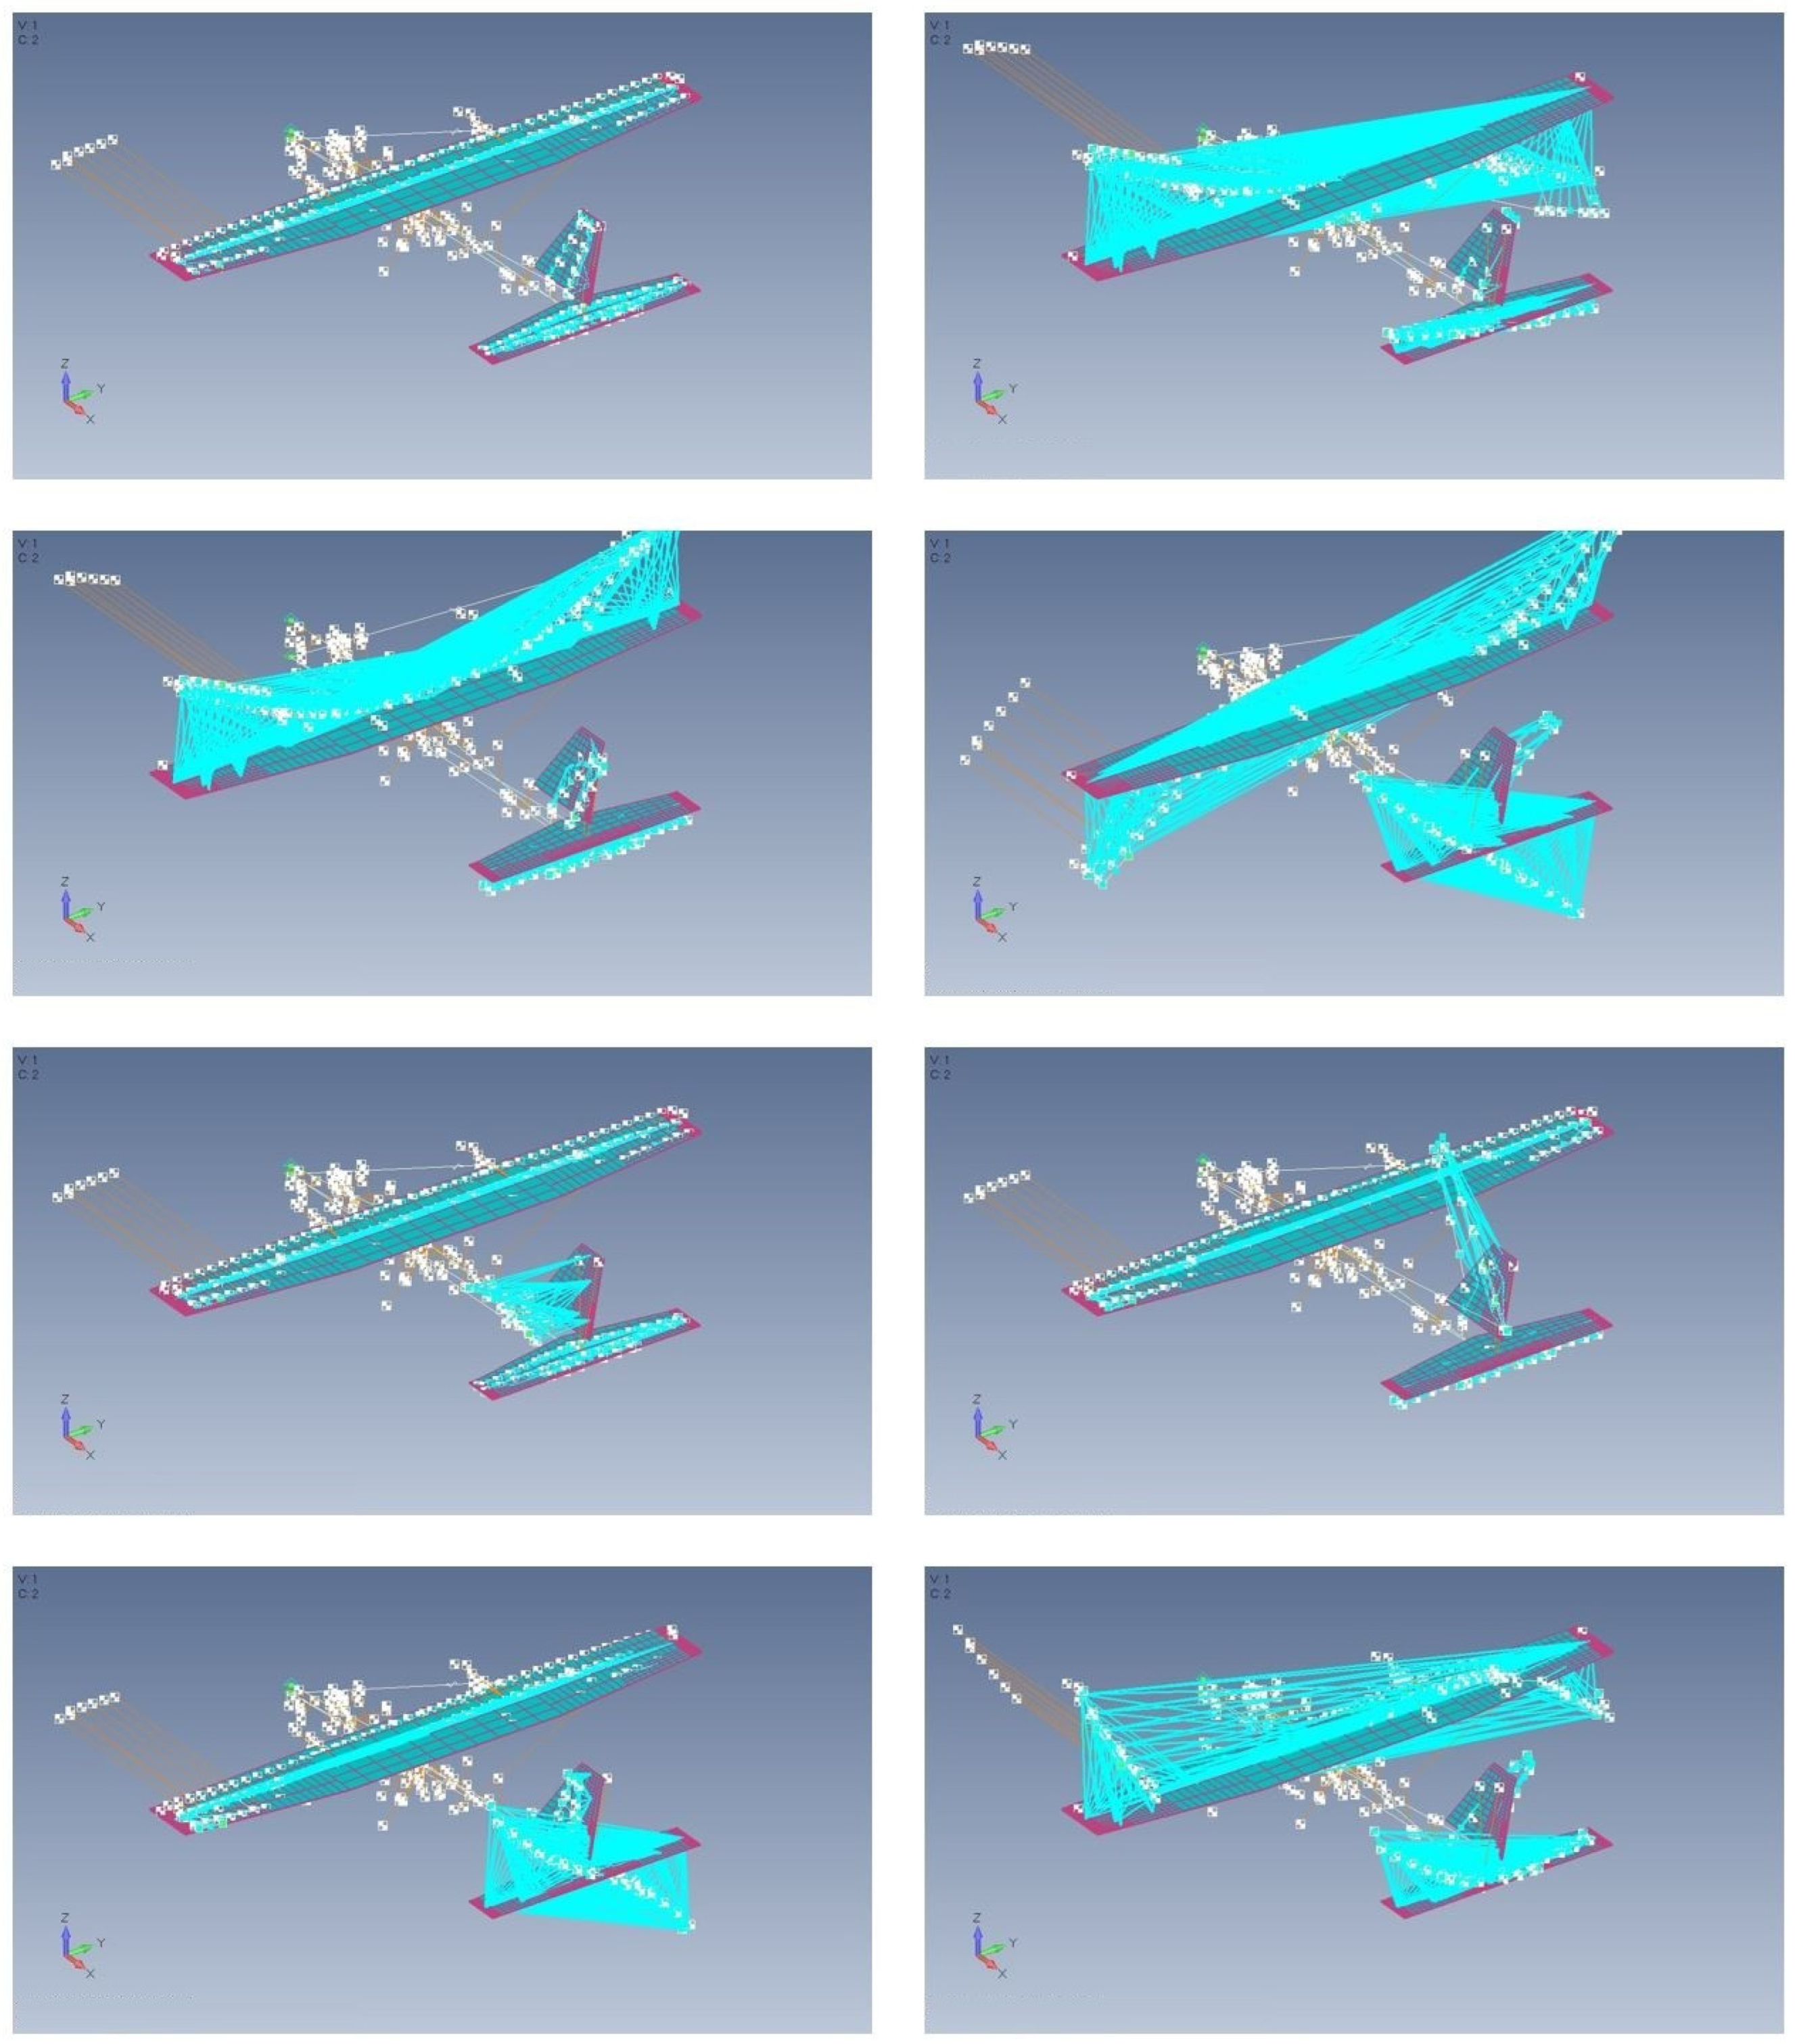
Figure 11.
FEM model Horizontal tail.
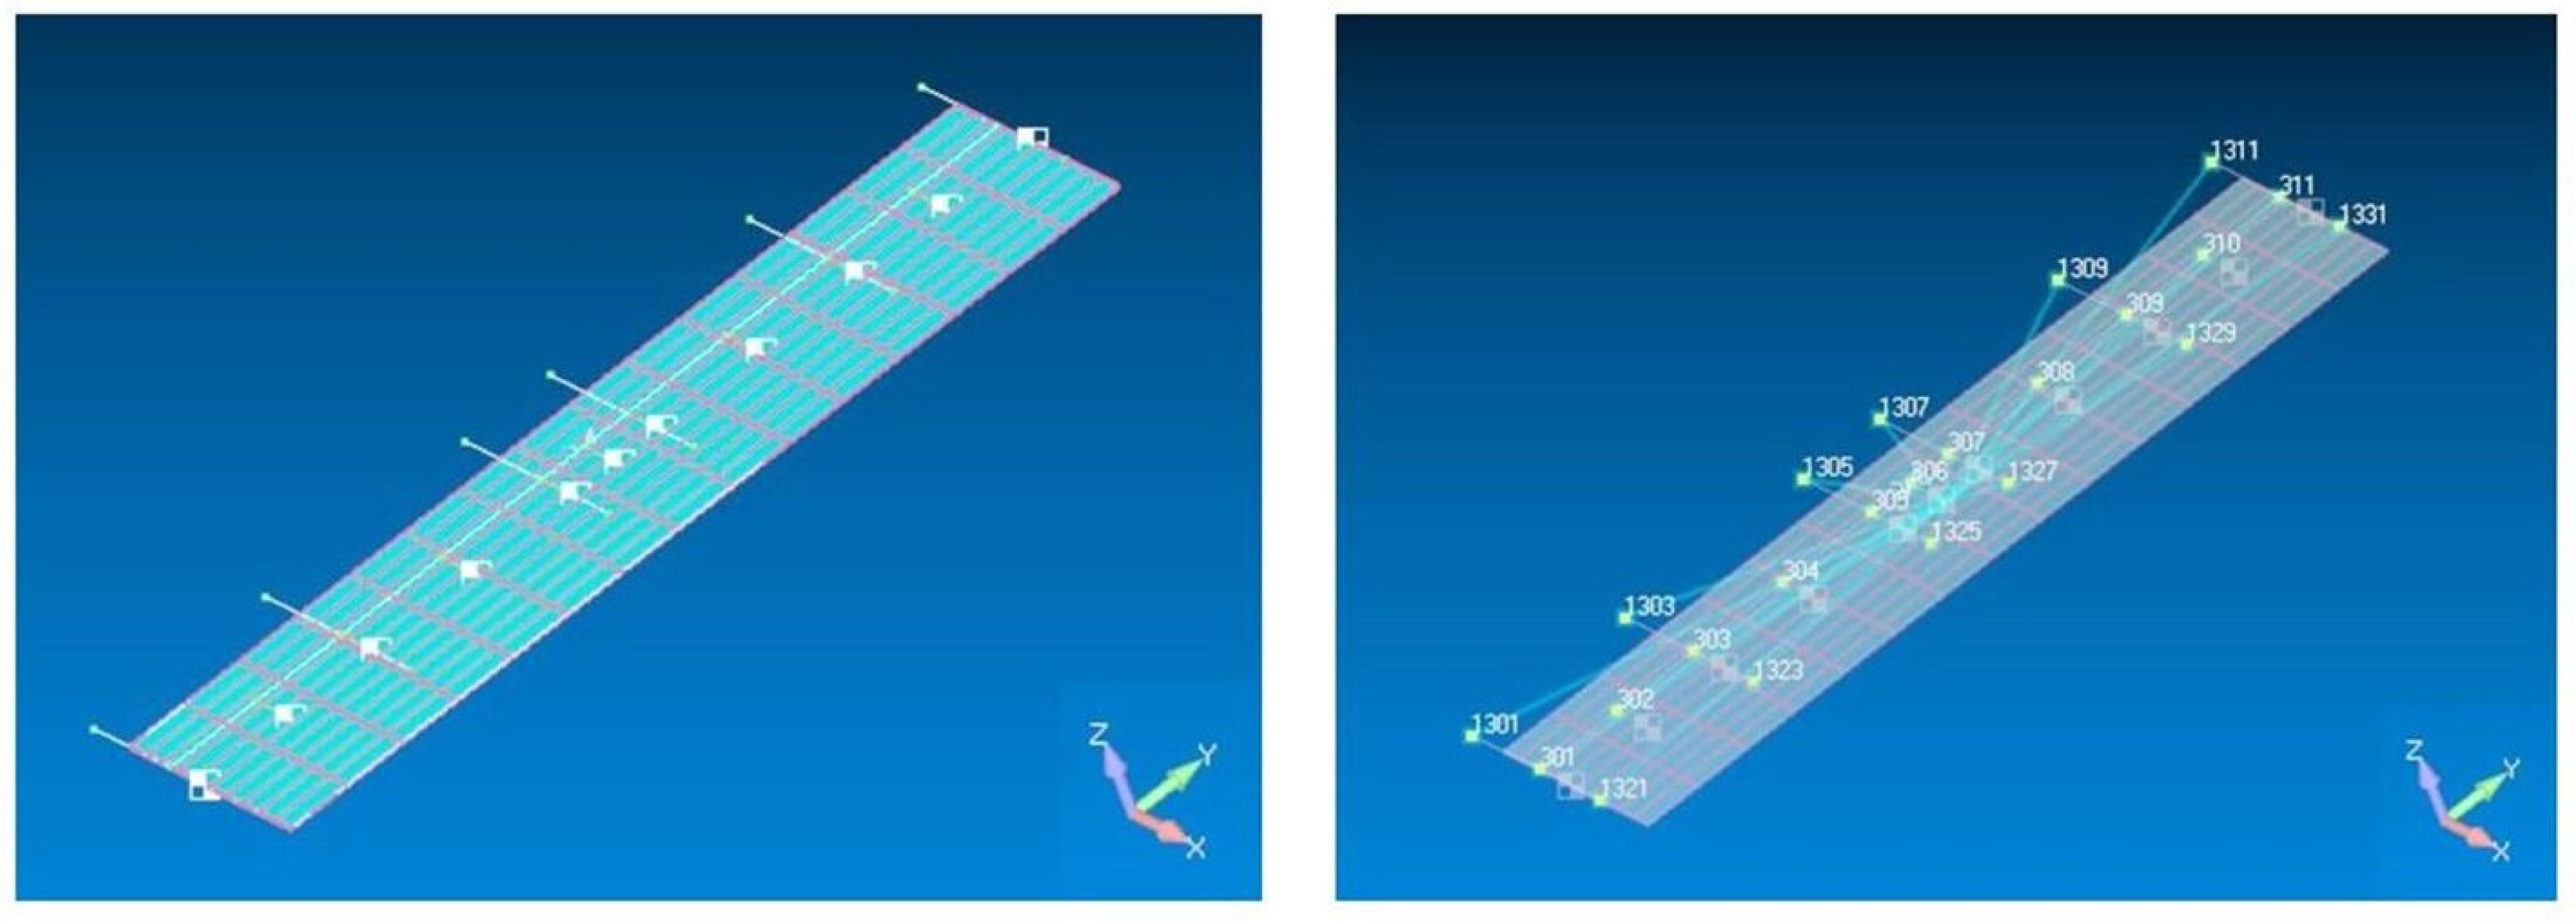
Figure 12.
Test setup Vibration Tests Horizontal tail twin-seat ultralight aircraft.
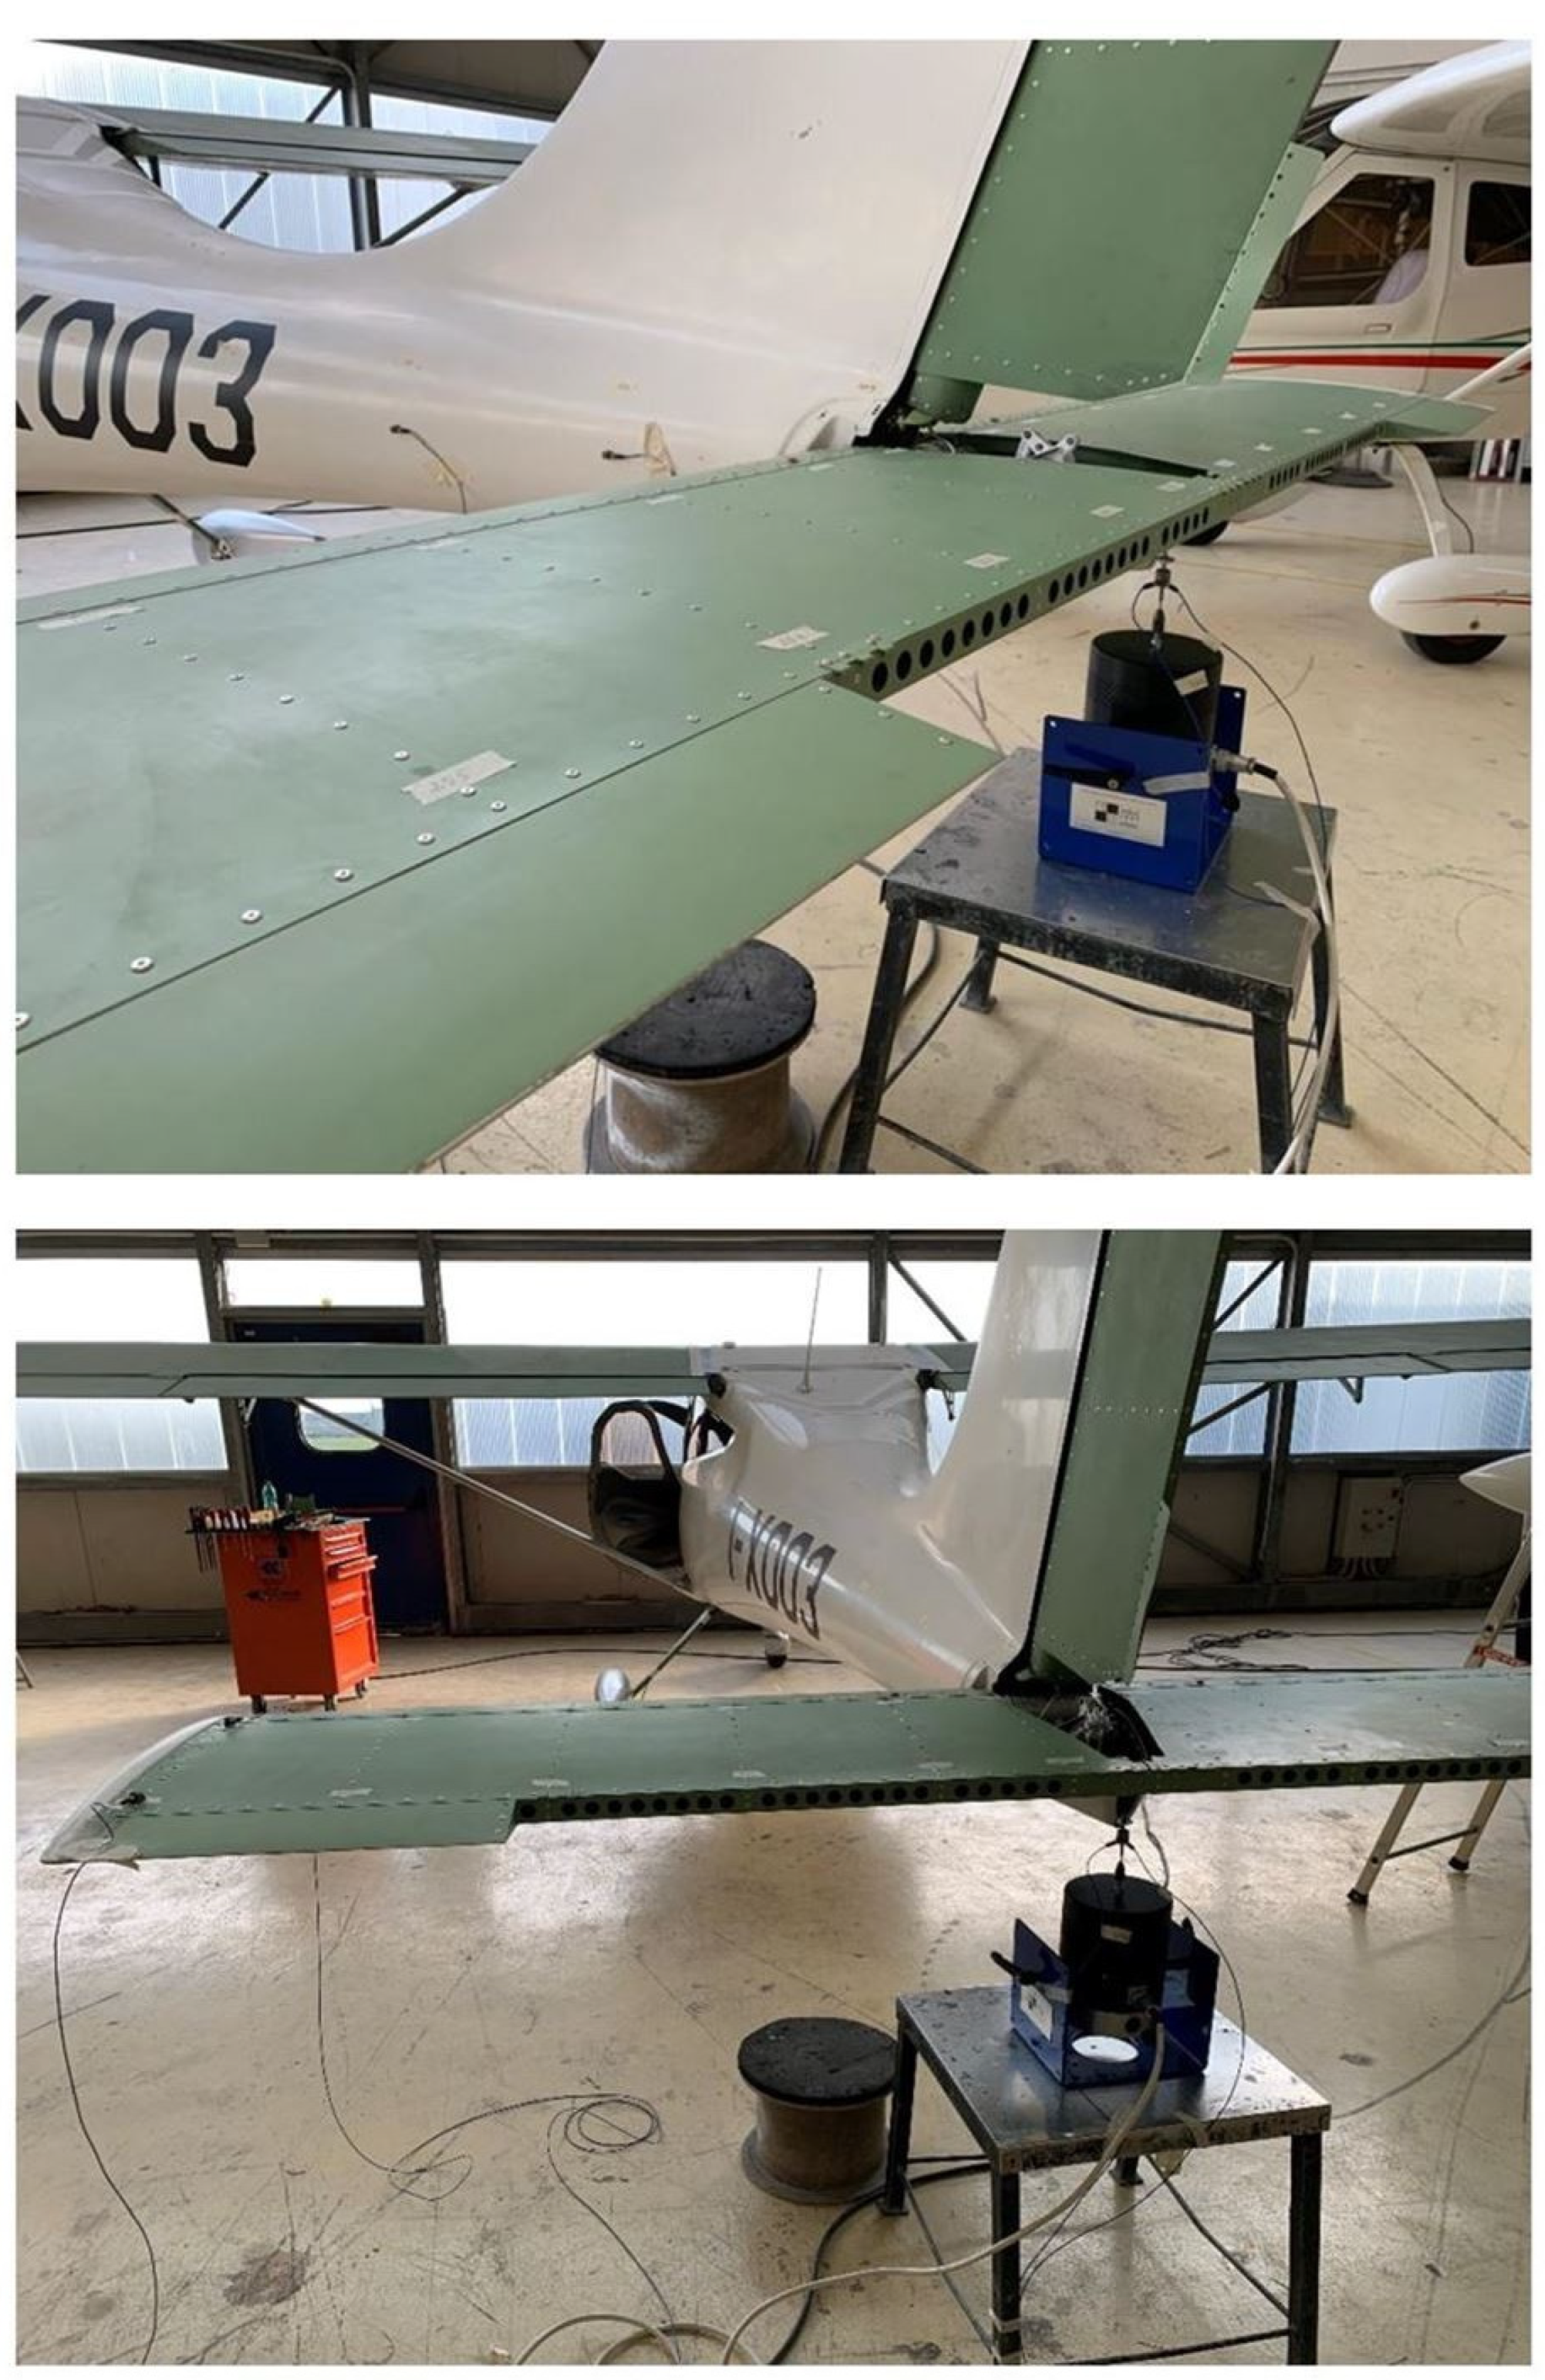
Figure 13.
Updated FEM model Horizontal tail.
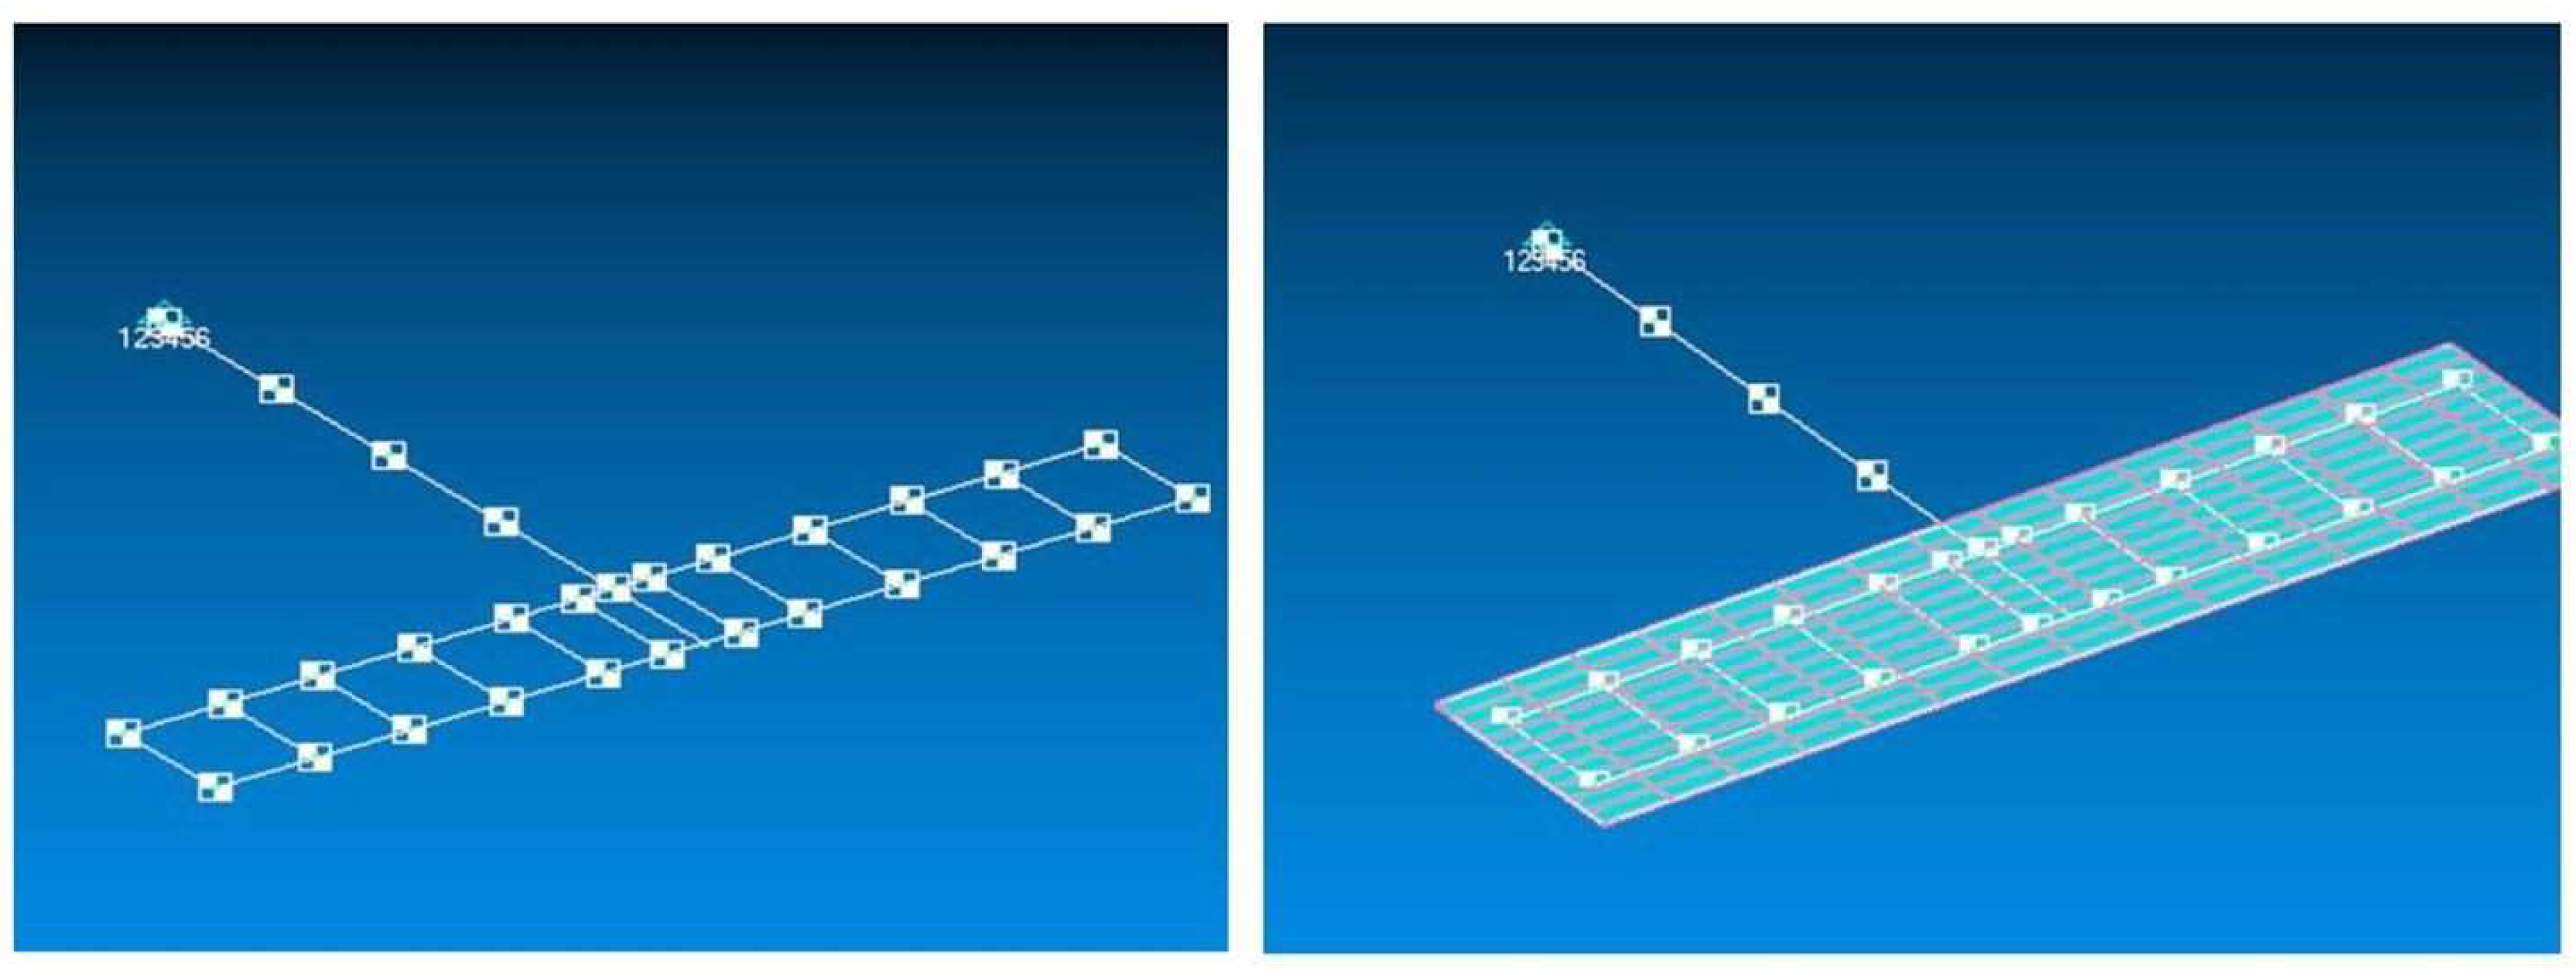
Figure 14.
Damping and Frequency vs Velocities plots, Method P-K, NASTRAN™.

Figure 15.
Damping vs Velocities plots, Method P-K, ZAERO.
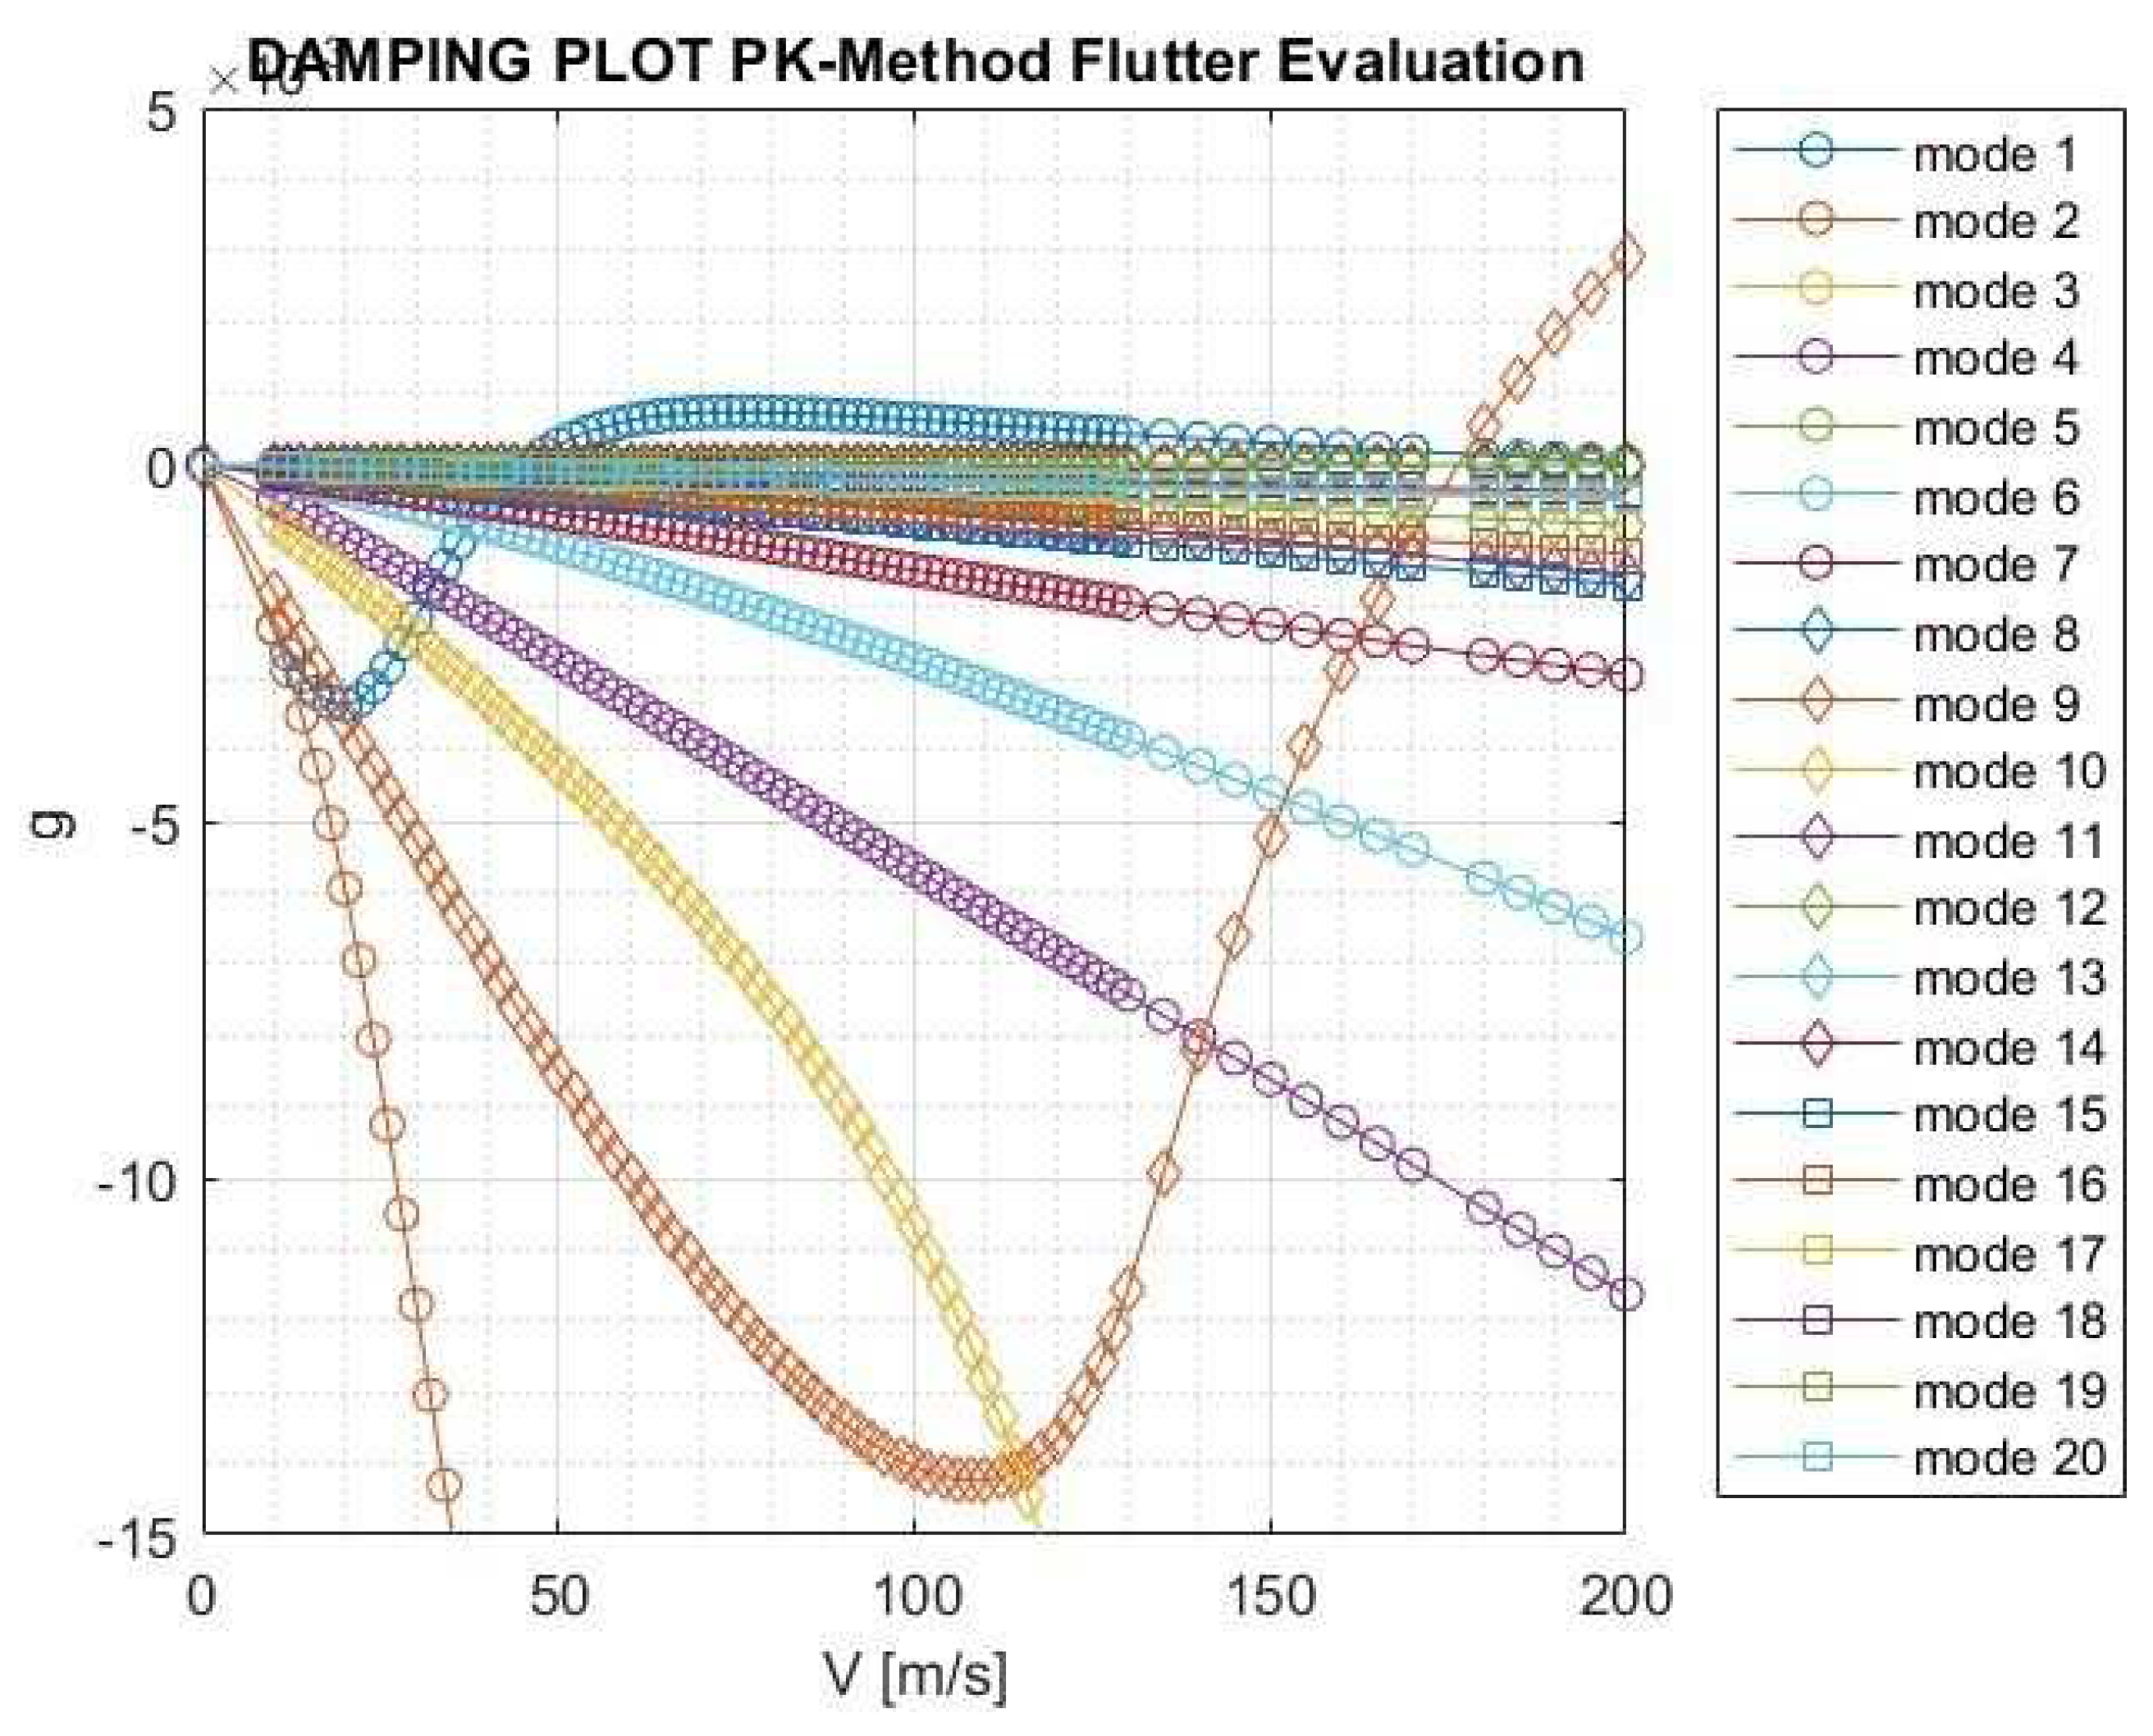
Figure 16.
Frequency vs Velocities plots, Method P-K, ZAERO.
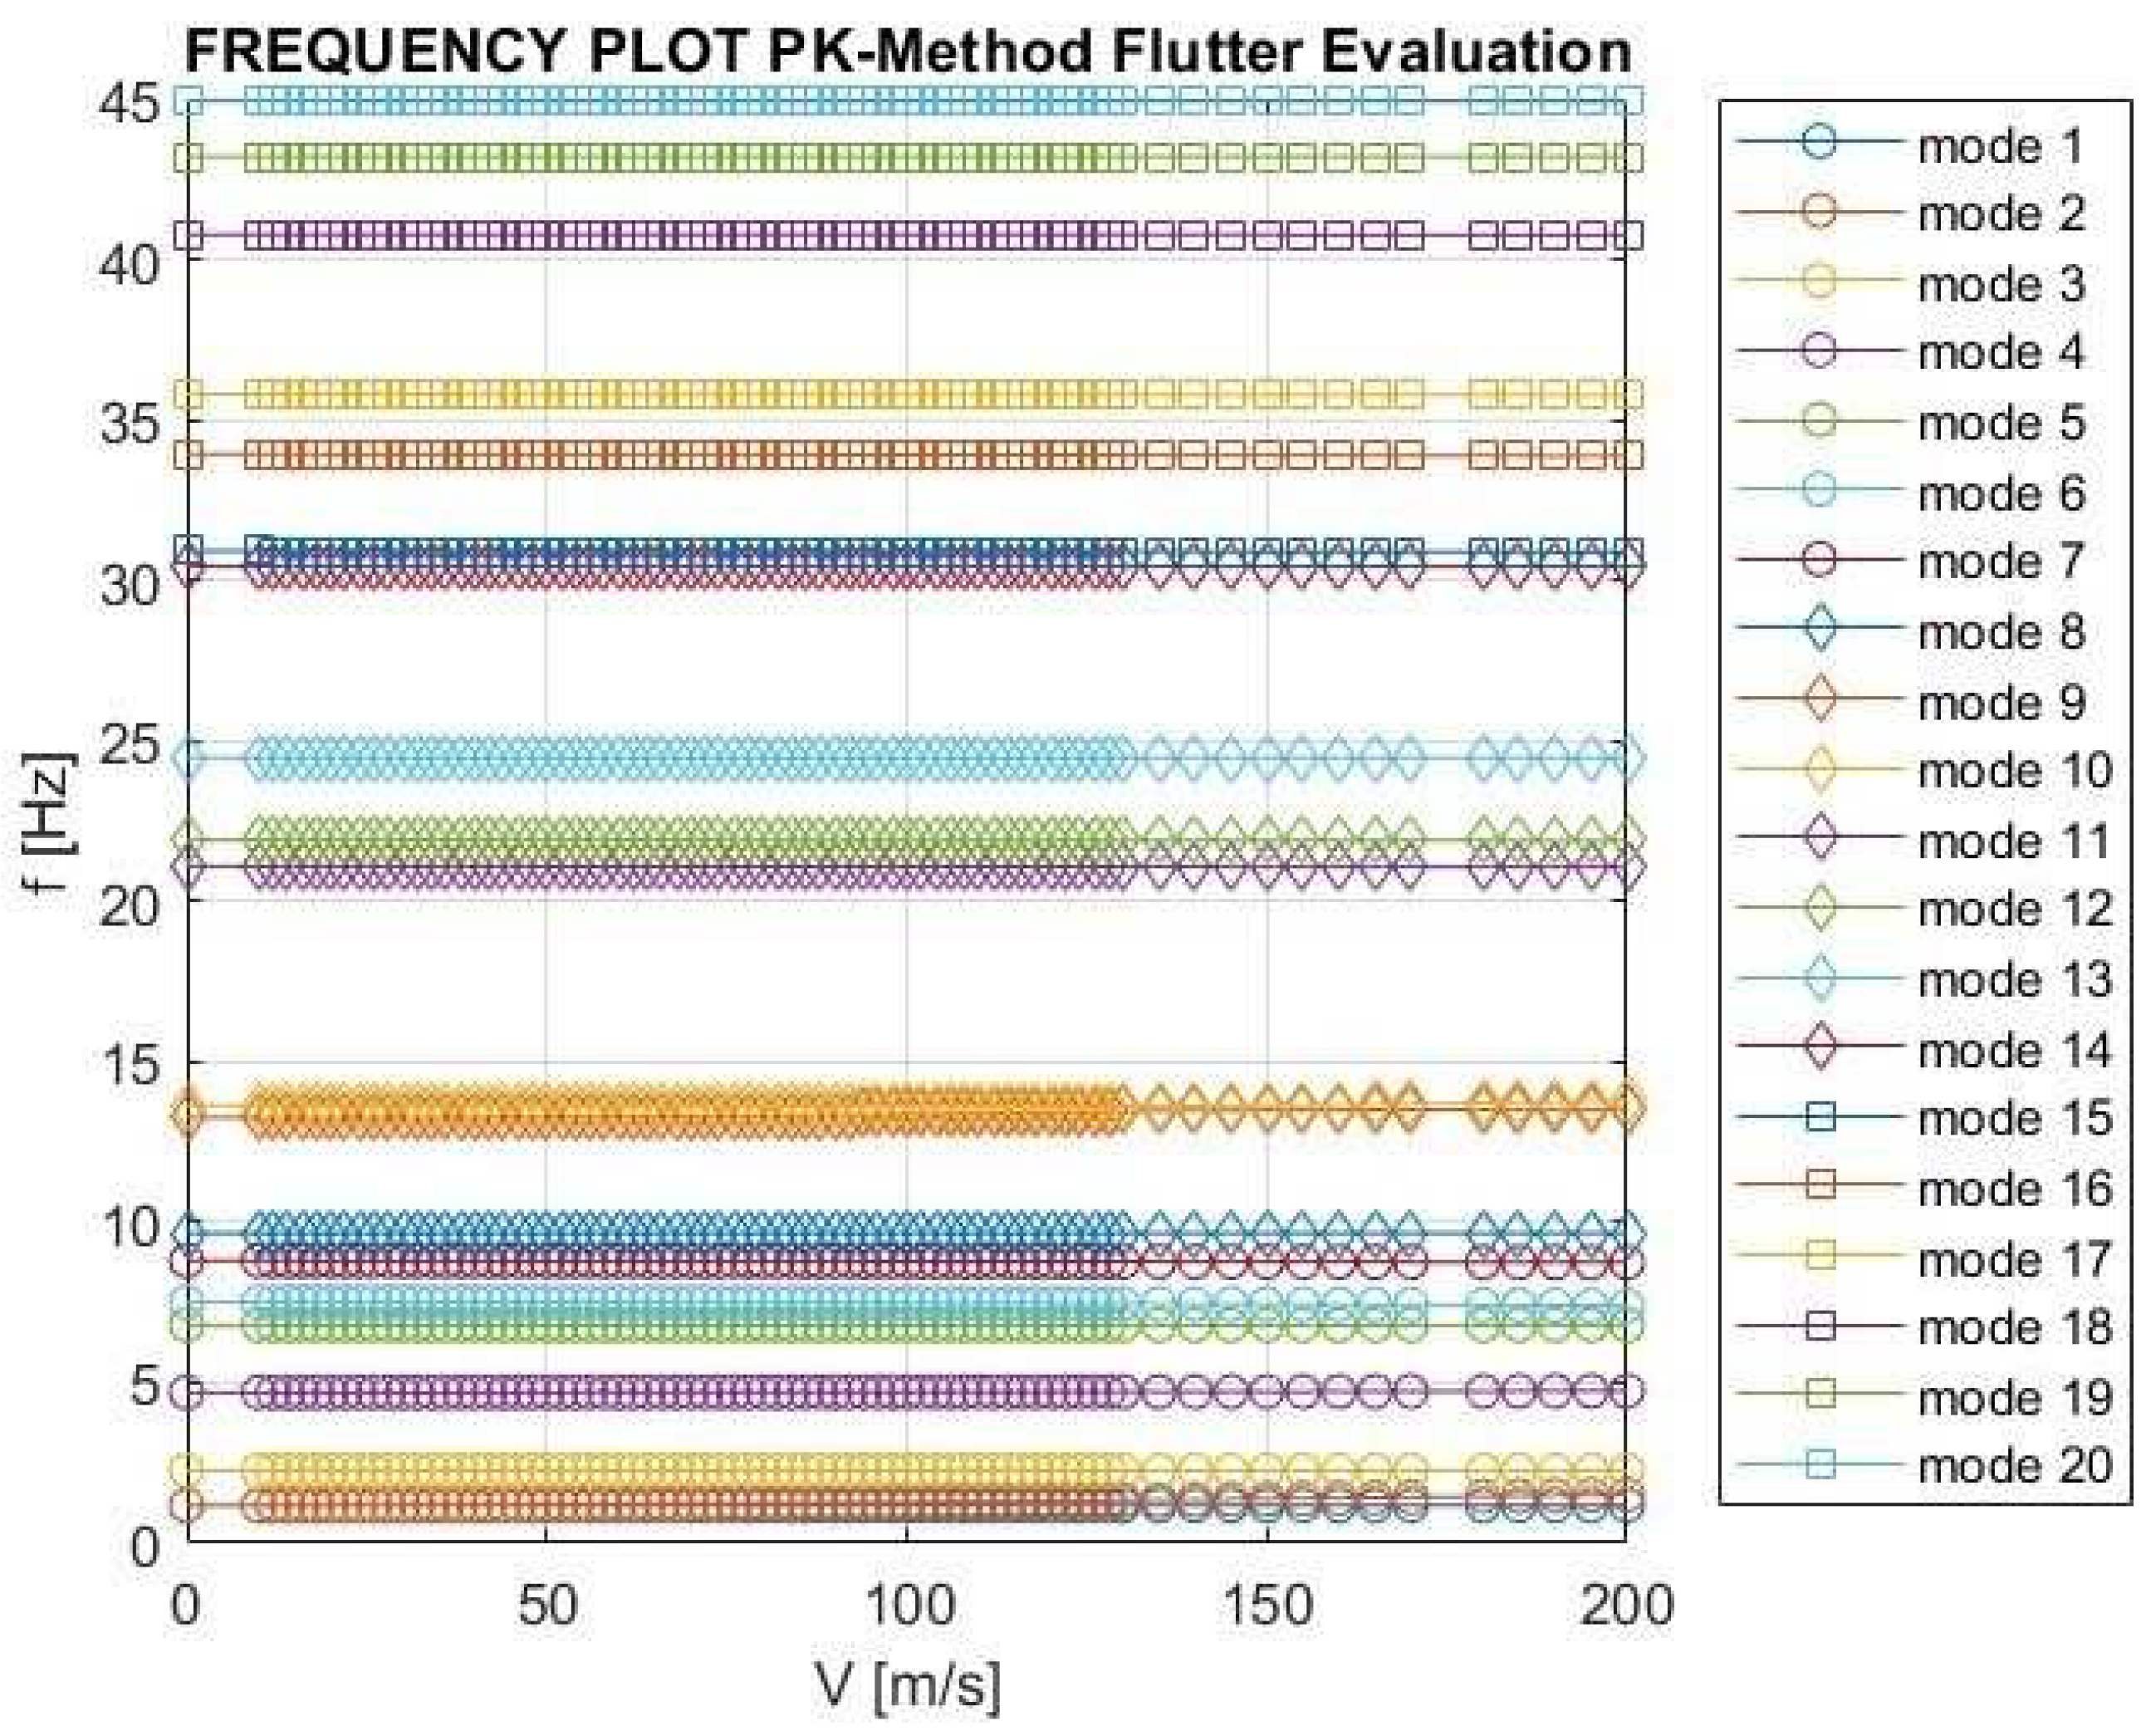
Table 1.
ZAERO Aeroelastic Analysis results - wing with empty fuel.
| K method | G method | ||
| Mode vf(m/s) |
Freq. (Hz) | mode vf(m/s) | Freq. (Hz) |
| 2 428.7 |
7.74 | 2 452.2 |
7.74 |
| 5 486.3 |
11.57 | 5 484.2 |
11.69 |
Table 4.
Experimental Modal Analysis and Nastran Dynamic Analysis Results.
| No. mode | Nastran | EMA | Mode shape description |
| Freq. (Hz) | Freq. (Hz) | ||
| 7 | 9.67 | 9.76 | Fuselage tail torsion |
| 8 | 12.27 | 12.59 | Fuselage bending along z, wing sym. bending |
| 9 | 14.09 | 14.61 | Fuselage torsion, wing anti-sym. bending |
| 10 | 19.32 | 18.23 | Fuselage bending along y |
| 11 | 21.10 | 20.42 | Horizontal tail bending along z |
| 12 | 25.81 | 24.48 | Fuselage torsion |
| 13 | 30.19 | 30.42 | Horizontal tail bending |
Table 5.
ZAERO Aeroelastic Analysis results - Horizontal tail.
| K method | G method | |||
| Mode vf(m/s) |
Freq. (Hz) | mode | vf(m/s) | Freq. (Hz) |
| 9 176.47 |
13.57 | (No Damping, G = 0) | 211.8 | 13.54 |
| —- —- |
—- | (Damping, G = 0.5) | 259.7 | 13.54 |
Disclaimer/Publisher’s Note: The statements, opinions and data contained in all publications are solely those of the individual author(s) and contributor(s) and not of MDPI and/or the editor(s). MDPI and/or the editor(s) disclaim responsibility for any injury to people or property resulting from any ideas, methods, instructions or products referred to in the content. |
© 2023 by the authors. Licensee MDPI, Basel, Switzerland. This article is an open access article distributed under the terms and conditions of the Creative Commons Attribution (CC BY) license (http://creativecommons.org/licenses/by/4.0/).
Copyright: This open access article is published under a Creative Commons CC BY 4.0 license, which permit the free download, distribution, and reuse, provided that the author and preprint are cited in any reuse.


