
Submitted:
20 June 2023
Posted:
25 June 2023
You are already at the latest version
Abstract
The last decade the impulse-radio ultra-wideband (IR-UWB) radar sensors have tended to substitute the gold standard, polysomnography (PSG), for the acquisition of the primary vital signs of the human body. However, the main drawback of the radar sensor is its sensitivity to the environmental noise and body motion. In this work, we aim to investigate whether radar sensor recordings of the chest and heart motion can be accurate substitutes to the PSG chest and heartbeat signals measurements. In terms of this scientific issue, we develop an innovative pipeline of handling the radar-based recordings, which includes: (a) the motion detection, (b) the extraction of the respiration, heartbeat and activity vital signs and (c) the estimation of the respiratory and heartbeat rates, i.e., the RR and HR, respectively. Our experimental results, applying our proposed methodology to 5 subjects during their sleep, showed that the radar sensor’s measurements can be comparative to the those producted by the PSG. Moreover, the corresponding RR and HR frequencies were proven to have Pearson’s correlation, between the radar and the PSG, greater than 0.9 and 0.78, respectively. Finally, the relative errors between the PSG, and the radar-based RR and HR rates were proven to be less than 6% and 10%, respectively.
Keywords:
IR-UWB radar
; polysomnography
; spectrograms
; respiratory rate
; heartbeat rate
1. Introduction
Conducting a sleep study is the most important procedure for the identification and assessment of various sleep disorders, such as obstructive sleep apnea (OSA), a serious medical condition, even resulting in cognitive dysfunctions, cardiovascular and cerebrovascular diseases [1]. The most frequently-used diagnostic tool during a sleep study is polysomnography (PSG), which is widely considered the gold standard [2]. Nonetheless, the multiple on-body sensors, required for it, increase the patients’ discomfort, while its long duration renders it expensive and appropriate only for use in hospitals and research settings [3].
To remedy the problems encountered during the use of the PSG, impulse-radio ultra-wideband (IR-UWB) radars have started to be extensively used during sleep studies. These sensors admit the contactless monitoting and have the ability to record body motions, ranging from the micro-motions of the chest to the macro-motions of objects or people falling, with a high accuracy [4,5].
Although radar sensors are user-friendly and accurate, in the case of sleep monitoring, they do have the drawback of being highly affected by the motions of the body during sleep, rendering the identification of vital signs more complicated. Note that, picking up the body’s motions, is not actually a drawback of the sensor but the radar’s main function, which, in the context of a sleep study, becomes an issue only for the case of identifying micro-motions.
Nevertheless, radar-based devices are convenient tools for sleep monitoring at home settings, as they can accurately identify chest and heart oscillations. Consequently, using those recorded oscillations, radar sensors provide an easy solution for extracting the respiratory rate, the heartbeat and the activity signal (that is the activity of the human body during sleep), which provide crucial information about the sleep quality [6].
As mentioned previously, the radar’s sensitivity to the environmental noise and the body’s motion creates the scientific issue of noise/motion detection and limitation, so as to have more accurate respiration and heartbeat signals. In order to address this problem, the radar sensor’s recordings are analyzed through a spectrogram-based approach. Specifically, inspired by the study of [7], the spectrograms are capable of providing useful information about the body motion, through the changes of radar’s characteristics over time [7]. In essence, through the spectrogram-based analysis we can detect from light to intense motions, and further limit them.
The extraction of the activity signal, not only provides motion information, but also enables the researchers to exclude those parts of the recordings that contain intense noise. Thus, by further analyzing the data, we can acquire more accurate signals which represent the displacement of chest due to the lungs and the heart. Additionally, the more precise the radar-extracted vital signs are, the more reliable the estimation of the respiratory and heartbeat rates will also be. This is an important point for consideration, given the impact that those frequencies have for a sleep study.
In this work, we aim to investigate whether the vital signs extracted from a radar sensor can be representative to those acquired from a PSG. Specifically, we compare the chest and electrocardiogram signals acquired from the PSG, with those acquired from the radar and we evaluate their accuracy by estimating the corresponding RR and HR frequencies. Moreover, we aim to extract the activity signal concerning the light motion detection.
The main contributions of our study are: (a) The creation of a system for the analysis of radar-based recordings which can provide three vital signals, namely the respiration, the heartbeat and the activity. (b) The noise treatment of the signals, due to either body motion or environmental factors, by an innovative spectrogram-based analysis. In terms of our work, simple, yet state-of-the-art procedures are employed to provide the accurate extraction of the aforementioned vital signals and subsequently the RR and HR. The evaluation of our pipeline was conducted using, mainly, the Pearson’s correlation, between the PSG- and the radar-extracted results, as well as the computation of the relative errors. Note that our evaluation was conducted using 5 recordings of patients with OSA disorder, totalling to almost 25 hours of sleep.
The rest of the paper is organized as follows: in Section 2 we describe the main building blocks of our proposed processing pipeline, including: (a) the radar’s settings and the preprocessing of the radar recordings, (b) the extraction of the activity signal, (c) the extraction of the respiration signal, (d) the extraction of the heartbeat signal and (e) the estimation of the RR and HR In Section 3, we describe the experimental evaluation of our methodology. Specifically, first, we introduce the main procedure followed for the analysis of the PSG data, and then, we provide the results of the comparison between the PSG- and radar-extracted vital signs. Next, Section 4 concerns the evaluation of our proposed methodology compared to the state-of-the-art approaches, while, we conclude with Section 5 in which we provide future directions of the current work.
2. Materials and Methods
In the following section, the detailed description of our processing pipeline is presented.
2.1. IR-UWB Data Acquisition
The general specifications of the radar device used for the purposes of this work are presented in Table 1 below [12].
Generally, the procedure of monitoring vital signs using a radar, involves measuring the torso displacement caused by the motion of the lungs and the heart. IR-UWB radars track the amplitude of a human body point to extract the vital signals [8], by detecting and quantifying the periodic expanding of the chest. Thus, an important parameter in the extraction of the vital signals is the distance between the radar antenna and the human chest, which changes over time t. The distance can be described by the following equation:
where is the nominal distance and are the mean values over the range of all possible displacements of the chest cavity caused by the respiration and the heartbeat, respectively. Moreover, with we denote the respiratory and heartbeat frequencies, respectively [9]. In Figure 1 we show the position of the radar sensor used in our examinations.
The IR-UWB radar sensor’s acquisition consists of a 2-dimensional matrix, that is a function of the samples K and the bins M (equal to 359 in our case). Specifically, the radar’s output is the , where as K we denote the number of samples in the sample space and M the radar’s bins in fast time (in nsec). A bin is considered a space to which the chest and heart displacements are stored. As a consequence, analogously to the distance between the human body and the radar sensor, the useful information is stored to the corresponding bin [9].
In our experimental analysis we worked on the sample domain, implying that it was not necessary to be concerned with the slow time t (in sec) domain.
2.2. Preprocessing of the Radar Recordings
As mentioned earlier, the radar recordings belong to a 2-dimensional space. Especially the bins are of major importance. Each bin has stored almost the same human body information but each recording differs from the other especially in the amplitude, i.e., to the strength of the acquired displacements. Thus, it is very crucial to search for the most prominent bin: Specifically, the most well-established and simple method of finding the bin of interest is by computing the variance of each recording which belongs to a bin and then to take the bin with the maximum variance [9].
In our experimental procedure, as the patients may change position quite often, we split the matrix into N non-overlapping segments, of 30 seconds duration, and for each segment we repeated the aforementioned procedure. After that, by combining the signal parts of the most intense human chest and heart motion, we constructed the signal of interest, denoted as .
2.3. Extraction of the Activity Signal
The activity signal is among the most important vital signs especially when the data concern sleep disorders. Our methodology of detecting the motion was based on the spectrogram computation of the extracted s signal. Specifically, our procedure depended on the steps described in Algorithm 1. Analytically, as inputs to this function are the signal extracted from the radar-based recordings, the s, and the sampling frequency of the radar, which in our experimental case was equal to 40Hz. After that, we estimate the spectrogram of each examination, as this is presented in Figure 2. In our experimental case we are interested in detecting the low frequency points, i.e., the time-points which present a non-uniform behaviour, in contrary to the majority of the time-points. Essentially, we are interested in detecting the signal samples which have light motion. Thus, we set a threshold of 0.3 order multiplied by the maximum value of the spectrogram matrix (in line 9) so as to isolate the signal samples which have dark blue color. Then, the next steps concern the replacement of these samples with ones if motion exists, otherwise zeros. This is addressed by setting a threshold, denoted as , which in our experimental procedure was equal to 8 or 10. However, notice that, we have to be accurate for each examination to set the threshold not very large-so as do not lose important information. Moreover, the threshold should not be very small, as then we will eliminate the signal fluctuations which possibly imply the patients condition from sleep to apneas, for instance.
| Algorithm 1 Activity signal extraction procedure. |
|
The proposed methodology proved to be very sensitive even though the noise was not very intense.
In Figure 3 we present an example of an activity signal. Specifically, as it is observed our proposed methodology has captured not only the intense signal’s noise (probably from motion) but also the noise with lower amplitude (probably from environmental noise).
To conclude, it is worth mentioning that this process is very beneficial, as through the appropriate analysis of the spectrogram, the researchers can detect not only motions during sleep but also motions during human activity [7].
2.4. Extraction of the Respiration Signal and the Respiratory Rate
The respiration signal is a vital sign of major importance, especially for the study of sleep and further the sleep apneas. Thus, its accurate extraction from the radar-based recordings equals to more accurate estimations of the RR. In our procedure, as mentioned, we followed the “maximum variance” process, which renders the detection of the signals’ fluctuations with the maximum amplitudes. After that, our purpose was to estimate the respiratory rates with a simple, fast and accurate manner.
The estimation of the RR was based on the computation of the power spectral density. Analytically, the first step was to split the previously extracted s signal into non-overlapping windows of duration 60 or 120 seconds, so as to take sufficient signal’s information. For each segment, if the corresponding activity signal’s part was full of zeros, we applied the well-known Fast Fourier Transform (FFT) and then the power spectral density (PSD) was estimated. In the literature, the number of respirations during sleep belongs to the range of [12:20] [10], which equals to a respiration frequency [0.2:0.35]Hz. As a consequence, having estimated the PSD we search for its maximum value into the aforementioned frequency range. Then, we multiple the estimated frequency with 60 (i.e., respirations per minute).
On the other hand, in the case that the activity signal has motion in a signal part, we apply a linear interpolation by taking into consideration the two left and two right neighboring samples’ values.
2.5. Extraction of the Heartbeat Signal and the Heartbeat Rates
The heart signal acquired from the radar sensor is more difficult to be captured and further extracted, as it is somehow “hidden” in the respiration signal, as we can observe in Figure 4. Specifically, with the black color we denote the respiration signal, which has many small fluctuations in is respiration. These small fluctuations are the heartbeats, i.e., to red signal.
Inspired by [11], the first step to reach to an accurate heartbeat signal extraction was to avoid the fluctuations which correspond to the respiration frequencies. Thus, again, we split the s signal into non-overlapping windows of the same duration as we took in the case of the respiration analysis, and we apply an IIR butterworth filter of 2nd order on the respiration frequency which was estimated before for this specific signal’s segment. Then, two more filters are applied, a lowpass, with a cut-off frequency equal to 0.5Hz and a highpass, with a cut-off frequency equal to almost 2Hz [10]. Finally, the already extracted signal passes through a median filter to avoid the very small signal’s fluctuations, which usually are created by the tool’s noise (i.e., artifacts).
The most important steps of the above procedures are presented in the block diagram of Figure 5.
Having retained the most prominent fluctuations of the raw radar signal, we suppose that we have captured the majority of the heartbeats. The final step is to estimate the corresponding HR values. Similarly to the RR estimation, for each heartbeat signal segment, if the activity signal is inactive, we apply the well-established method of peak detection. Counting the peaks per segment, the HR is defined by the following equation:
where, the window is defined by the multiplication of the duration we have chosen (i.e., 60 or 120 seconds) with the radar’s .
To conclude, in the case of active human behaviour, again, we replaced the corresponding samples values with a 2-neighbor (left and right) linear interpolation.
3. Results
The results of our processing pipeline are presented below.
3.1. HealthSonar Protocol – PSG Dataset
Data collection is supported by the HealthSonar project, an ongoing one-arm observational clinical study curried out at the Sleep Disorders Center, University Critical Care Unit, Evangelismos Hospital, Athens, Greece. The purpose of this study was to evaluate the accuracy and validity of identifying sleep stages and apnea-related events, using a wireless monitoring device based on an IR-UWB radar sensor and a PSG recording in parallel, as the gold standard. The ethical committee of Evangelismos Hospital approved the study (Reference No. 198, 6/6/2022). In order to be enrolled, participants needed to be above 18 years old and able to complete the inform consent form.
All the participants have completed clinical evaluation and sleep monitoring, following the American Academy of Sleep Medicine Manual for the Scoring of Sleep and Associated Events; recommendations of the AASM Scoring Manual Committee (v2.6). Their basic demographics characteristics are presented in Table 2. Each subject was monitored for an entire night, annotating sleep stages at 30-sec intervals.
The PSG data used for our analysis included the following sensors’ signals:
It is worth mentioning that the signals, from both PSG and radar, were synchronized and the radar-based activity signal, was also used in the analysis of the PSG recordings, in order to clean the signals from the patients’ motion and improve the synchronization.
3.2. PSG-based RR and HR
In order to estimate the corresponding RR and HR frequencies from the chest and ECG signals, we followed the procedures described on Section 2. Specifically, for the estimation of the RR, the chest signal recorded from PSG was split in windows (60 or 120 seconds) and for each window the PSD was estimated based on the FFT transform. The most prominent frequency of the PSD was considered as the respiratory rate for each window.
Regarding the HR, again, through a peak detection process, the peaks of the ECG, having amplitude greater than a threshold, were identified. This threshold was defined in the range of of the maximum signal’s amplitude. Splitting the signal into windows of similar duration to the rest of the analysis, i.e., 60 or 120 seconds, enabled the estimation of the HR, as described in Section 2.
For the estimation of both HR and RR, the regions of activity (as described in Section 2.3) were replaced by linear interpolation, which was taken into consideration the 2-left and the 2-right neighbors.
3.3. Performance Evaluation
In our experimental analysis, we evaluated our results through 3 main metrics, i.e., the relative error between the PSG rates as ground truth and the radar-based rates, the Pearson’s correlation and the Intraclass Coefficient (ICC), as this is also used in [1] between the rates of the two tools. In Table 3, we present the evaluations concerning the RR per patient and the averaged values. Notice that, these evaluations concern a 120 seconds window duration.
The results of the estimated HR values are presented in Table 4.
Furthermore, in Figure 6 and Figure 7 we observe the total number of rates for all the patients/examinations. Each spike corresponds to a rate derived from the analysis of a window of duration 120 seconds.
It is obvious that, especially in the case of the RR comparison, the values of both tools are very close. This is also verified by the high Pearson’s correlation, and it is enhanced through the even higher ICCs. Notice that all the frequencies were transferred to the number of respirations and heart beats, respectively.
4. Discussion
The scientific objective of our study was to investigate whether the radar sensor can accurately substitute PSG, especially in the case of respiration and heartbeat acquisition. Our analysis was focused on constructing an innovative pipeline which takes into consideration the radar-based recordings, represented by a 2-dimensional matrix and results in the following clinical information: (a) the respiration and heartbeat signals, (b) the RR and HR and (c) the activity signalOur experimental results proved that our simple and fast procedure for processing the radar-based data can result in accurate respiration and heartbeat signals, that are highly correlated with the ground truth values derived from the corresponding PSG signals. Moreover, the relative errors imply that, the RR is closer to its ground truth value than the HR, as it was expected, as the the heartbeat signal required a more complicated procedure to be extracted from the radar recordings.
Regarding the procedure for extracting the activity vital sign it also proved to be very effective, leading to an improved performance in extracting the respiration and heartbeat signals as well as estimating the corresponding frequencies.
It is worth mentioning that after changing the window’s duration to 60 seconds, the correlation values were lower and almost reached 0.8. Although, still it is a high correlation, this result implies that our methodology has as a limitation the samples we take into consideration. Thus, the 60 seconds duration seems not to be able to provide sufficient information for the procedure to estimate the rates with more accuracy. However, the error could also be attributed to signal synchronization, since it was not possible for the two devices (PSG and UWB Radar) to be synchronized perfectly. The error is expected to be amplified in smaller time windows.
Overall, our methodology is simple and fast, and can also be robust for home use scenarios. The analysis of our data does not require a large number of parameters. Specifically, the only parameters that the user needs to provide include the cut-off frequencies for the lowpass and highpass filters utilized for the heartbeat signal extraction. Moreover, based on the motion that needs to be captured, an approapriate threshold needs to be selected.
5. Conclusions
This study was concerned with investigating whether radar-based recordings can identify sleep stages, as well as OSA type of apneas.
Towards that end, a robust pipeline was constructed for a) analyzing the clean radar-based data (b) extracting the activity signal (c) extracting the respiration and heartbeat signals, and finally (d) estimating the RR and HR, which are necessary indicators for the detection of sleep stages and various sleep disorders, such as OSA.
The respiration, heartbeat and activity signals were not only utilized for the estimation of the RR and HR, but also for evaluation purposes through comparing them with their ground truth values, i.e., those calculated with the PSG. For the analysis, data from 5 patients with sleep disorders were used, totalling almost 25 hours of sleep.
Our methodology proved to be accurate for all patient cases, highlighting that it is robust to different patients’ characteristics and also to different sleep patterns. This is an important finding given the versatile nature of the radar sensor which could also be provided to patients for home use.
Author Contributions
Conceptualization, D. I. F, G. R., and M. T.; methodology, software, validation, formal analysis, and investigation, A.P.; resources and data curation, E. F. and E. V.; writing—original draft preparation, A. P.; writing—review and editing, A. P., G. R., A. N. and M. T.; visualization, A. P.; supervision, M. T..; project administration, G. R.; All authors have read and agreed to the published version of the manuscript.
Funding
This research was funded by the European Regional Development Fund of the European Union and Greek national funds through the Operational Program Competitiveness, Entrepreneurship, and Innovation, under the call RESEARCH-CREATE–INNOVATE (project name: HealthSonar, project code:T1EDK-03990).
Institutional Review Board Statement
The ethical committee of Evangelismos Hospital approved the study (Reference No. 198, 6/6/2022).
Informed Consent Statement
All subjects participating in the study were fully informed regarding all aspects of their participation, as well as regarding the use of the resulting data. All subjects were presented with an informed consent form, were given enough time to read it and signed it prior to their participation.
Conflicts of Interest
The authors declare no conflict of interest.
Abbreviations
The following abbreviations are used in this manuscript:
| IR-UWB | Impulse-Radio Ultra-Wideband |
| PSG | Polysomnography |
| OSA | Obstructive Sleep Apnea |
| RR | Respiratory Rate |
| HR | Heartbeat Rate |
| ECG | Electrocardiogram |
| FFT | Fast Fourier Transform |
| PSD | power spectral density |
| ICC | Intraclass Coefficient |
References
- Choi JW, Kim DH, Koo DL, Park Y, Nam H, Lee JH, Kim HJ, Hong SN, Jang G, Lim S, Kim B., Automated Detection of Sleep Apnea-Hypopnea Events Based on 60 GHz Frequency-Modulated Continuous-Wave Radar Using Convolutional Recurrent Neural Networks: A Preliminary Report of a Prospective Cohort Study. Sensors (Basel). 2022 Sep 21;22(19):7177. 7: 21;22(19). [CrossRef]
- J. V. Rundo, R. Downey, Chapter 25 - Polysomnography, Handbook of Clinical Neurology, Elsevier, vol. 160, pp. 381-392, 2019.
- Hanne Siri Amdahl Heglum et.al., Distinguishing sleep from wake with a radar sensor: a contact-free real-time sleep monitor, Sleep, August 2021, Volume 44, Issue 8. 20 August. [CrossRef]
- Lee WH, Kim SH, Na JY, Lim YH, Cho SH, Cho SH, Park HK., Non-contact Sleep/Wake Monitoring Using Impulse-Radio Ultrawideband Radar in Neonates. Front Pediatr., 2021 Dec, 21;9:782623. 7: 21;9. [CrossRef]
- Ma L, Liu M, Wang N, Wang L, Yang Y, Wang H., Room-Level Fall Detection Based on Ultra-Wideband (UWB) Monostatic Radar and Convolutional Long Short-Term Memory (LSTM). Sensors (Basel). 2020 Feb, 18;20(4):1105. [CrossRef]
- Zhang, X., Yang, X., Ding, Y., Wang, Y., Zhou, J., Zhang, L., Contactless Simultaneous Breathing and Heart Rate Detections in Physical Activity Using IR-UWB Radars. Sensors, 2021, 21, 5503. [CrossRef]
- Kang S-w, Jang M-h, Lee S. Identification of Human Motion Using Radar Sensor in an Indoor Environment. Sensors, 2021, 21(7):2305. [CrossRef]
- Wang D, Yoo S, Cho SH. Experimental Comparison of IR-UWB Radar and FMCW Radar for Vital Signs. Sensors, 2020, 20(22):6695. [CrossRef]
- Pentari A., Mansousos D., Kassiotis T., Rigas G., Tsiknakis M., Respiration and heartbeat rates estimation using IR-UWB non-contact radar sensor recordings: A pre-clinical study, published in the Workshop Proceedings of the EDBT/ICDT 2023 Joint Conference (March 28-March 31, 2023), Ioannina, Greece. 28 March.
- Avram, R., Tison, G.H., Aschbacher, K. et al., Real-world heart rate norms in the Health eHeart study, npj Digit. Med., 2019 2, 58. [CrossRef]
- Khan F, Cho SH., A Detailed Algorithm for Vital Sign Monitoring of a Stationary/Non-Stationary Human through IR-UWB Radar. Sensors. 2017; 17(2):290. [CrossRef]
- ARIA, SENSING, Lt102 datasheet, 2020. URL: https://ariasensing.com/core-technology/wp-content/uploads/2020/11/LT102_Datasheet_r1_2_web.pdf.
Figure 1.
A depiction of the height and placement of the radar sensor relative to the patient. During the monitoring procedure, the radar sensor, based on our experimental protocol, was placed on top of a nightstand, next to the bed of the test subject.
Figure 1.
A depiction of the height and placement of the radar sensor relative to the patient. During the monitoring procedure, the radar sensor, based on our experimental protocol, was placed on top of a nightstand, next to the bed of the test subject.
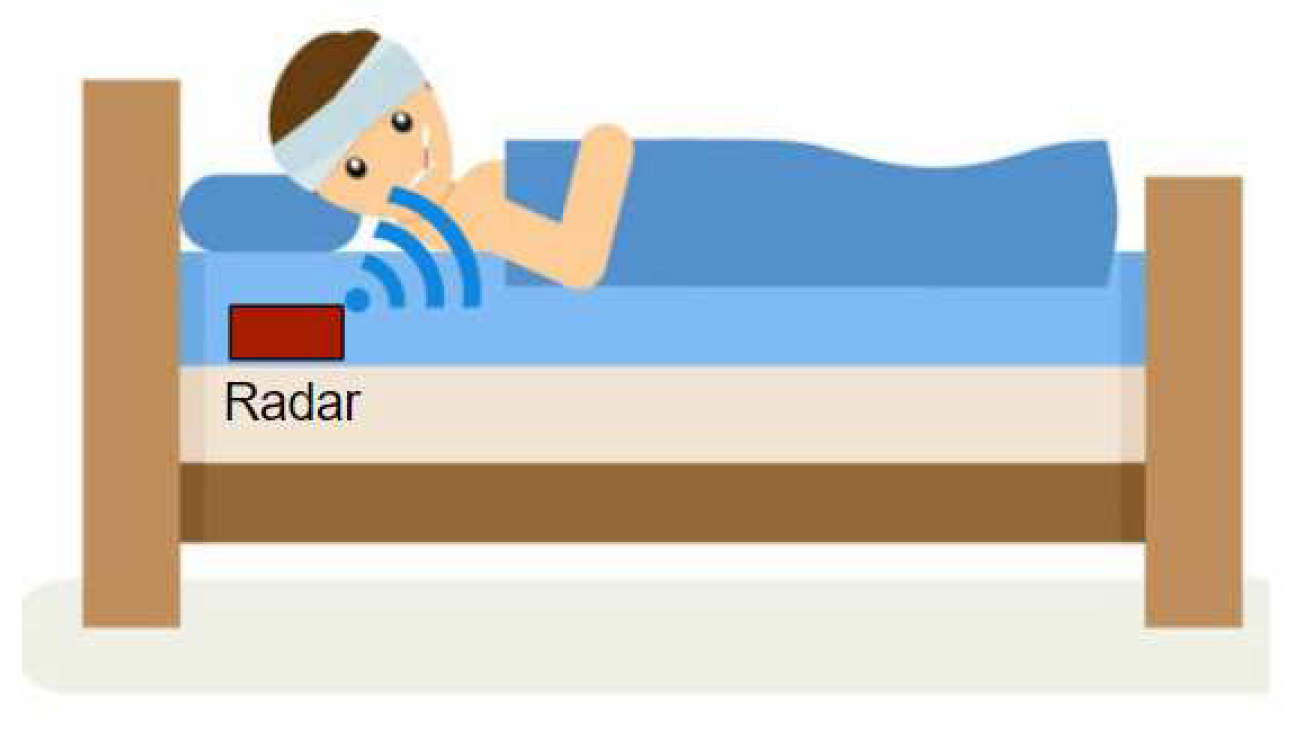
Figure 2.
An example of a spectrogram derived from the process of an examination.
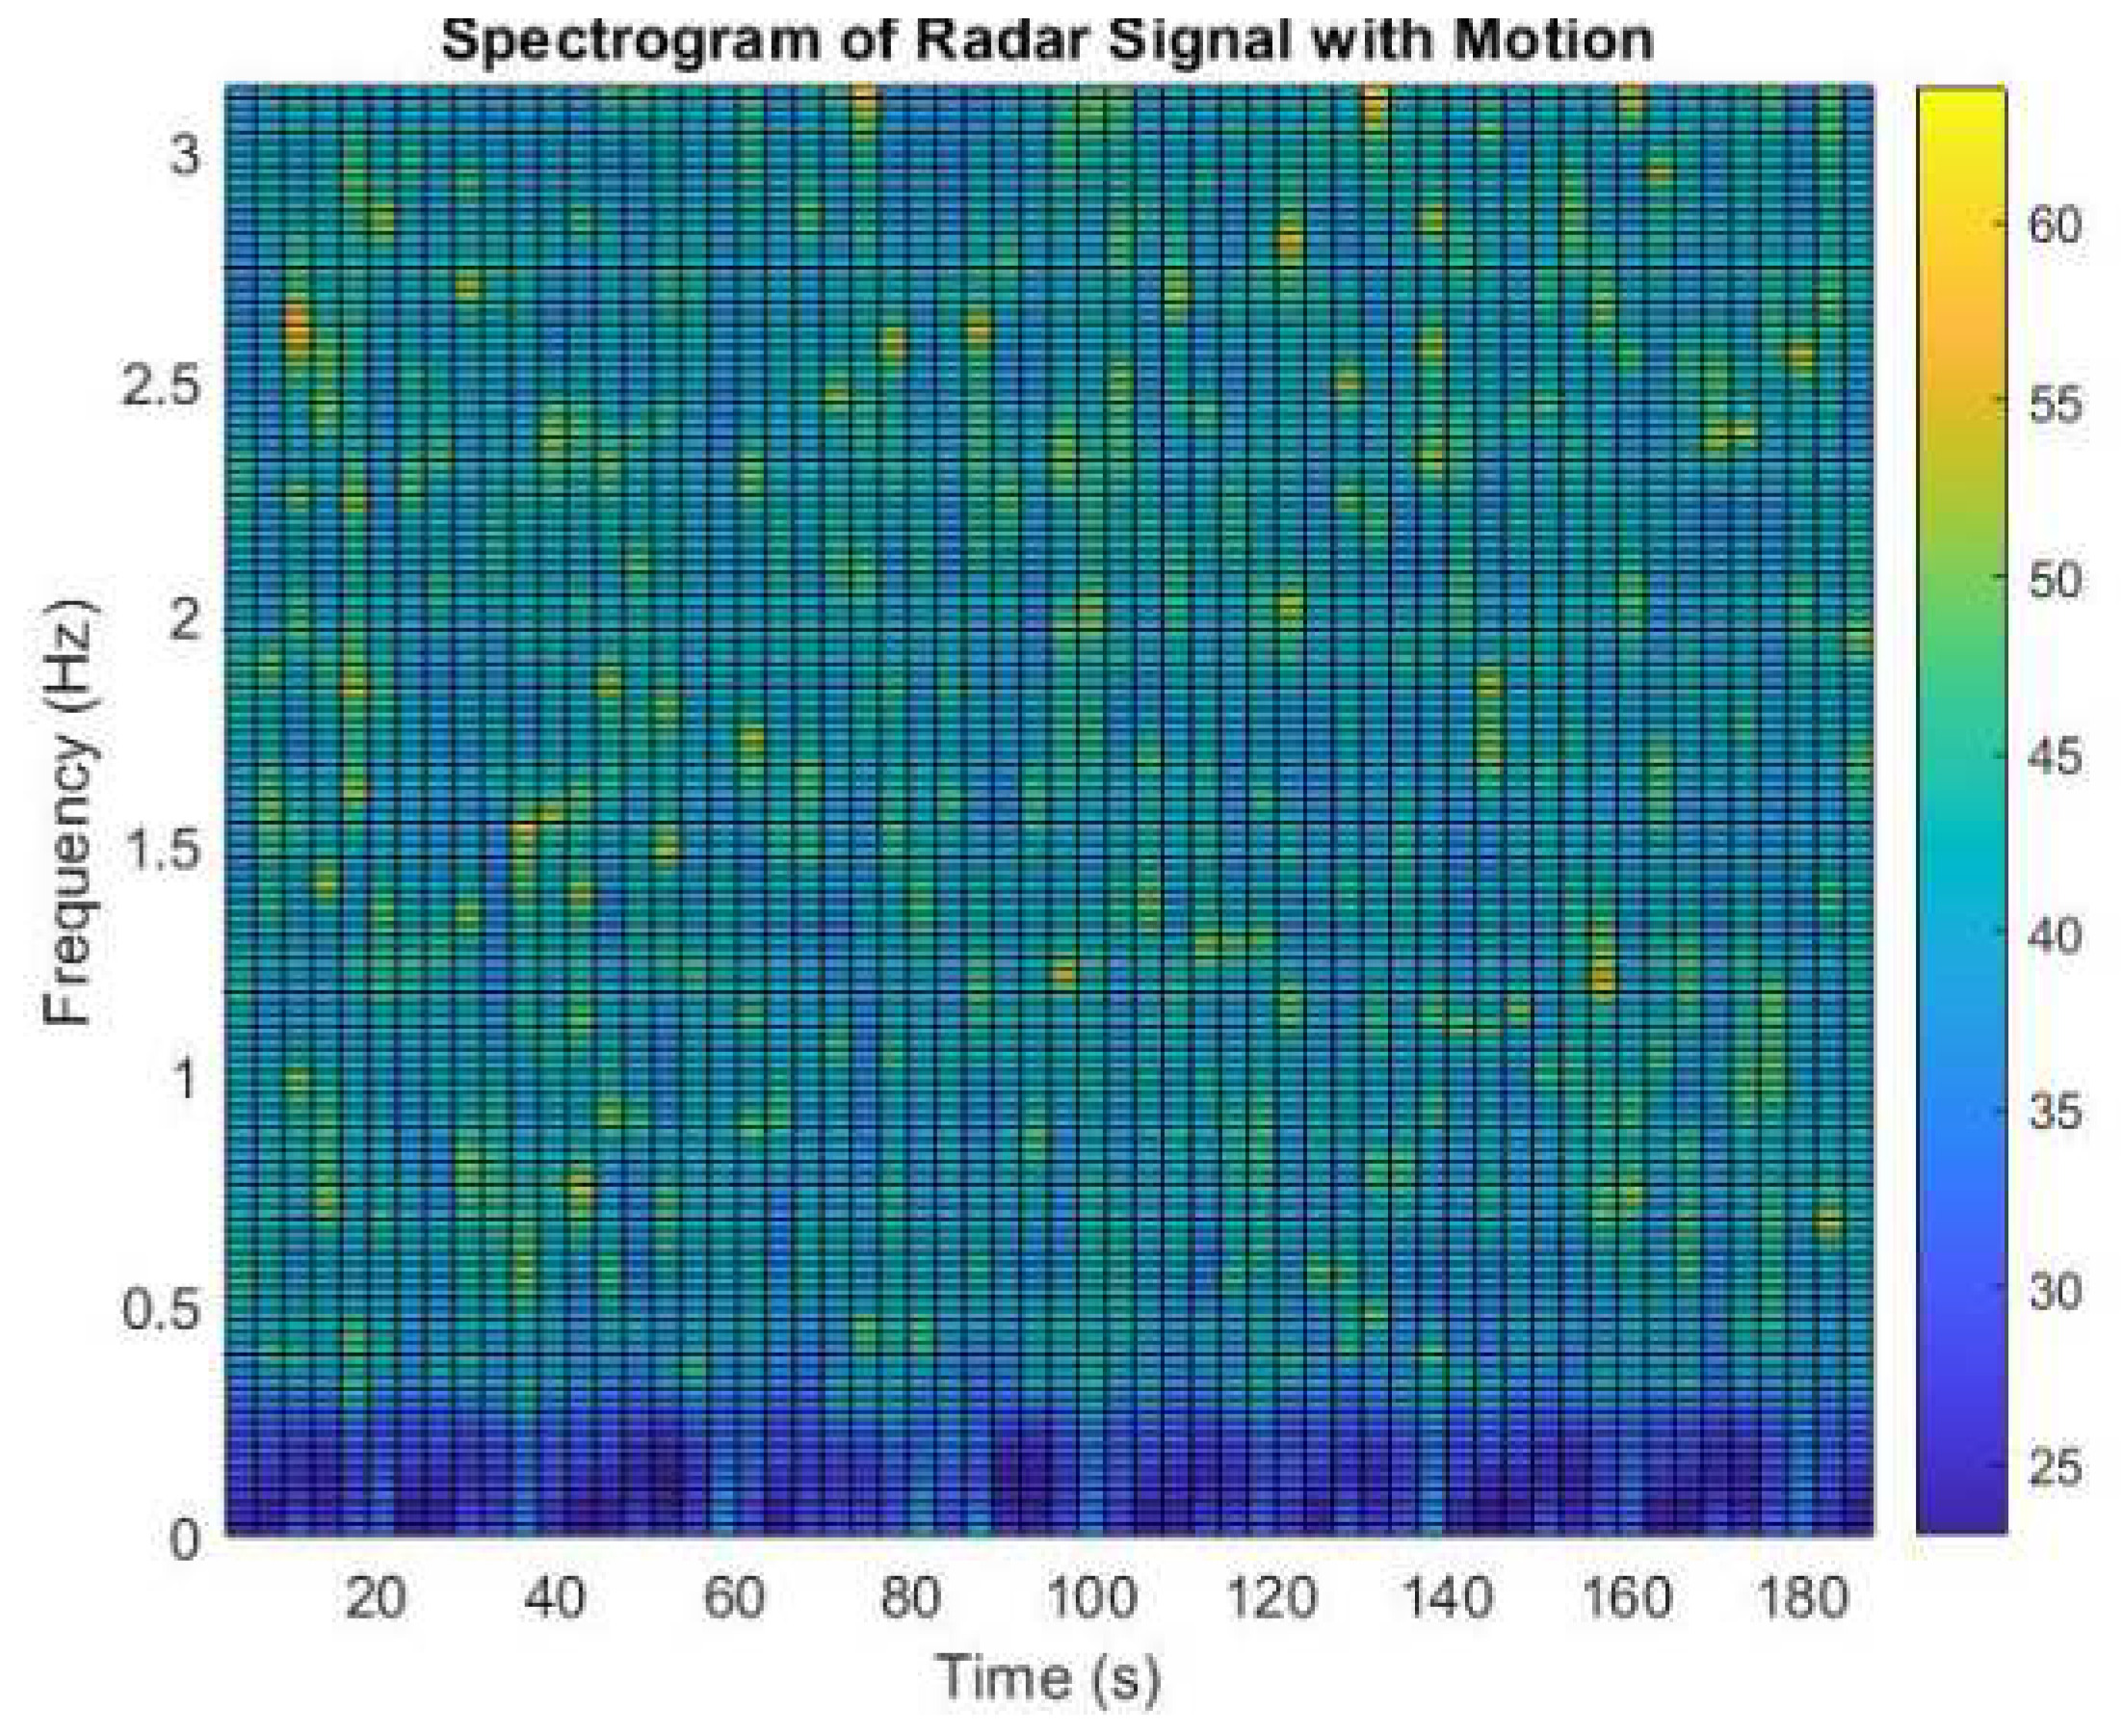
Figure 3.
The procedure for extracting an activity signal. (a) Raw respiration signal from the radar recordings; (b) The same signal’a part with reduced noise; (c) the corresponding activity signal.
Figure 3.
The procedure for extracting an activity signal. (a) Raw respiration signal from the radar recordings; (b) The same signal’a part with reduced noise; (c) the corresponding activity signal.
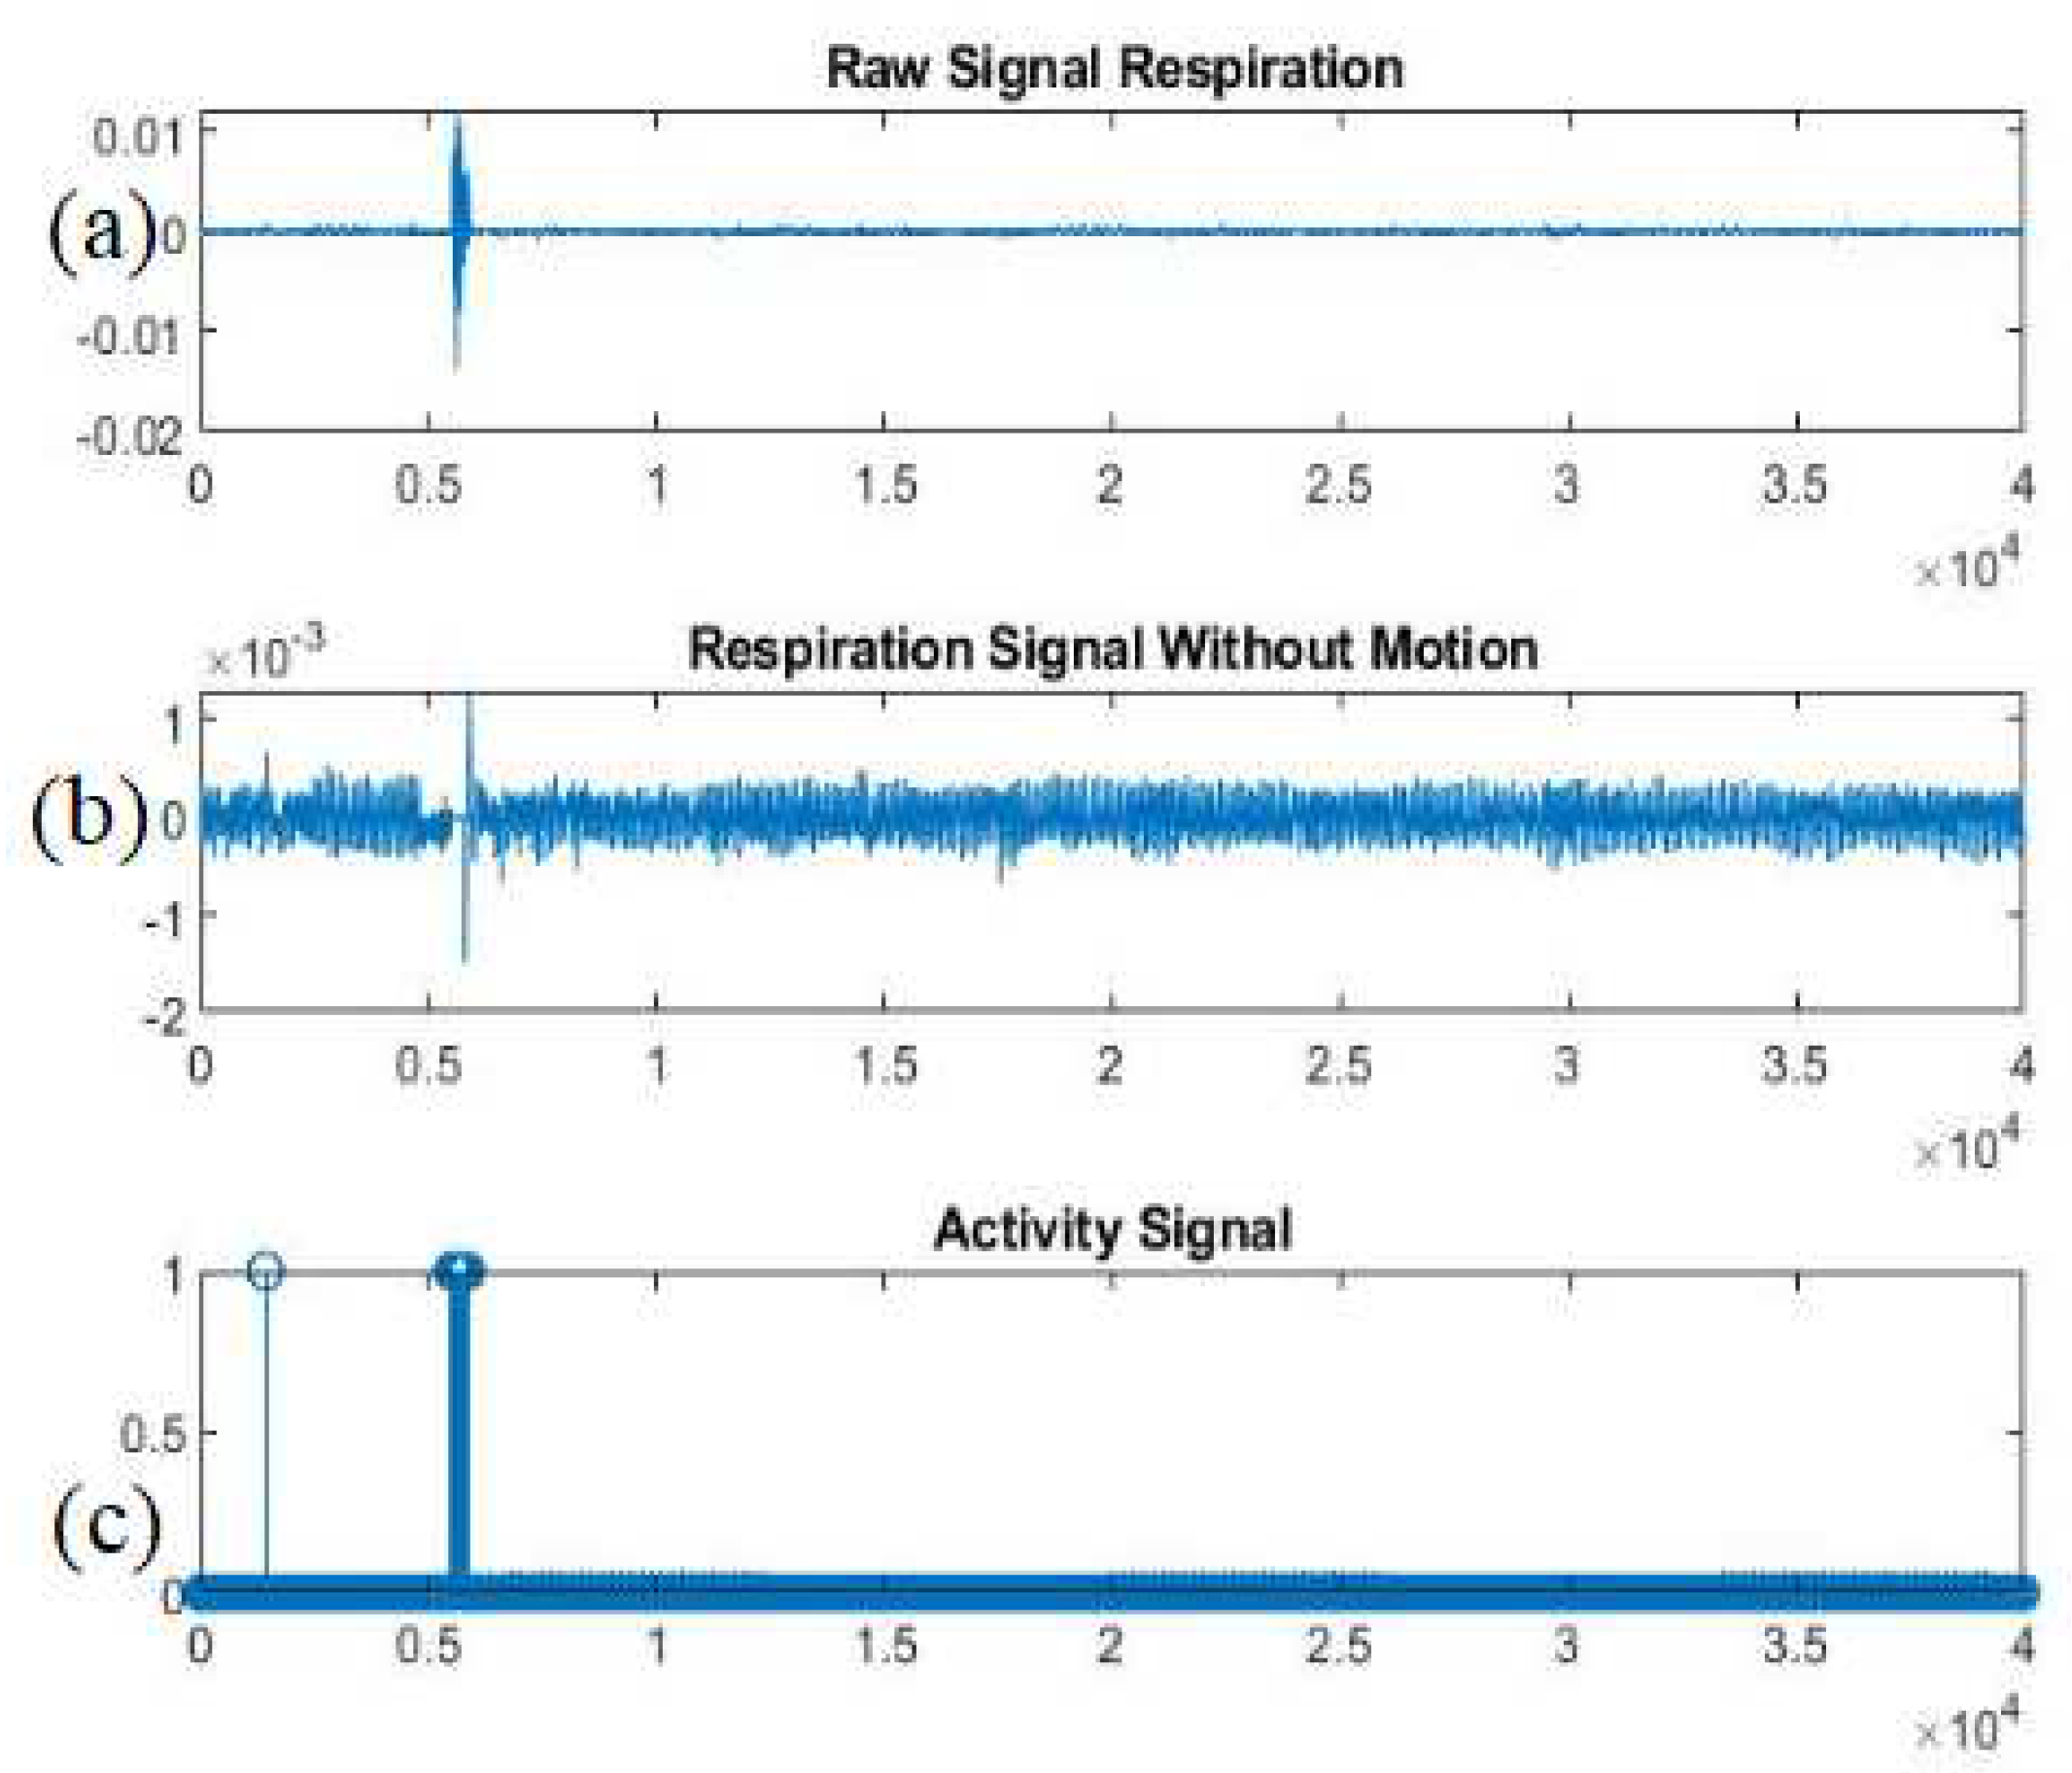
Figure 4.
Example of a radar’s extracted signal: with black color we denote the respiration while with red the heartbeat.
Figure 4.
Example of a radar’s extracted signal: with black color we denote the respiration while with red the heartbeat.
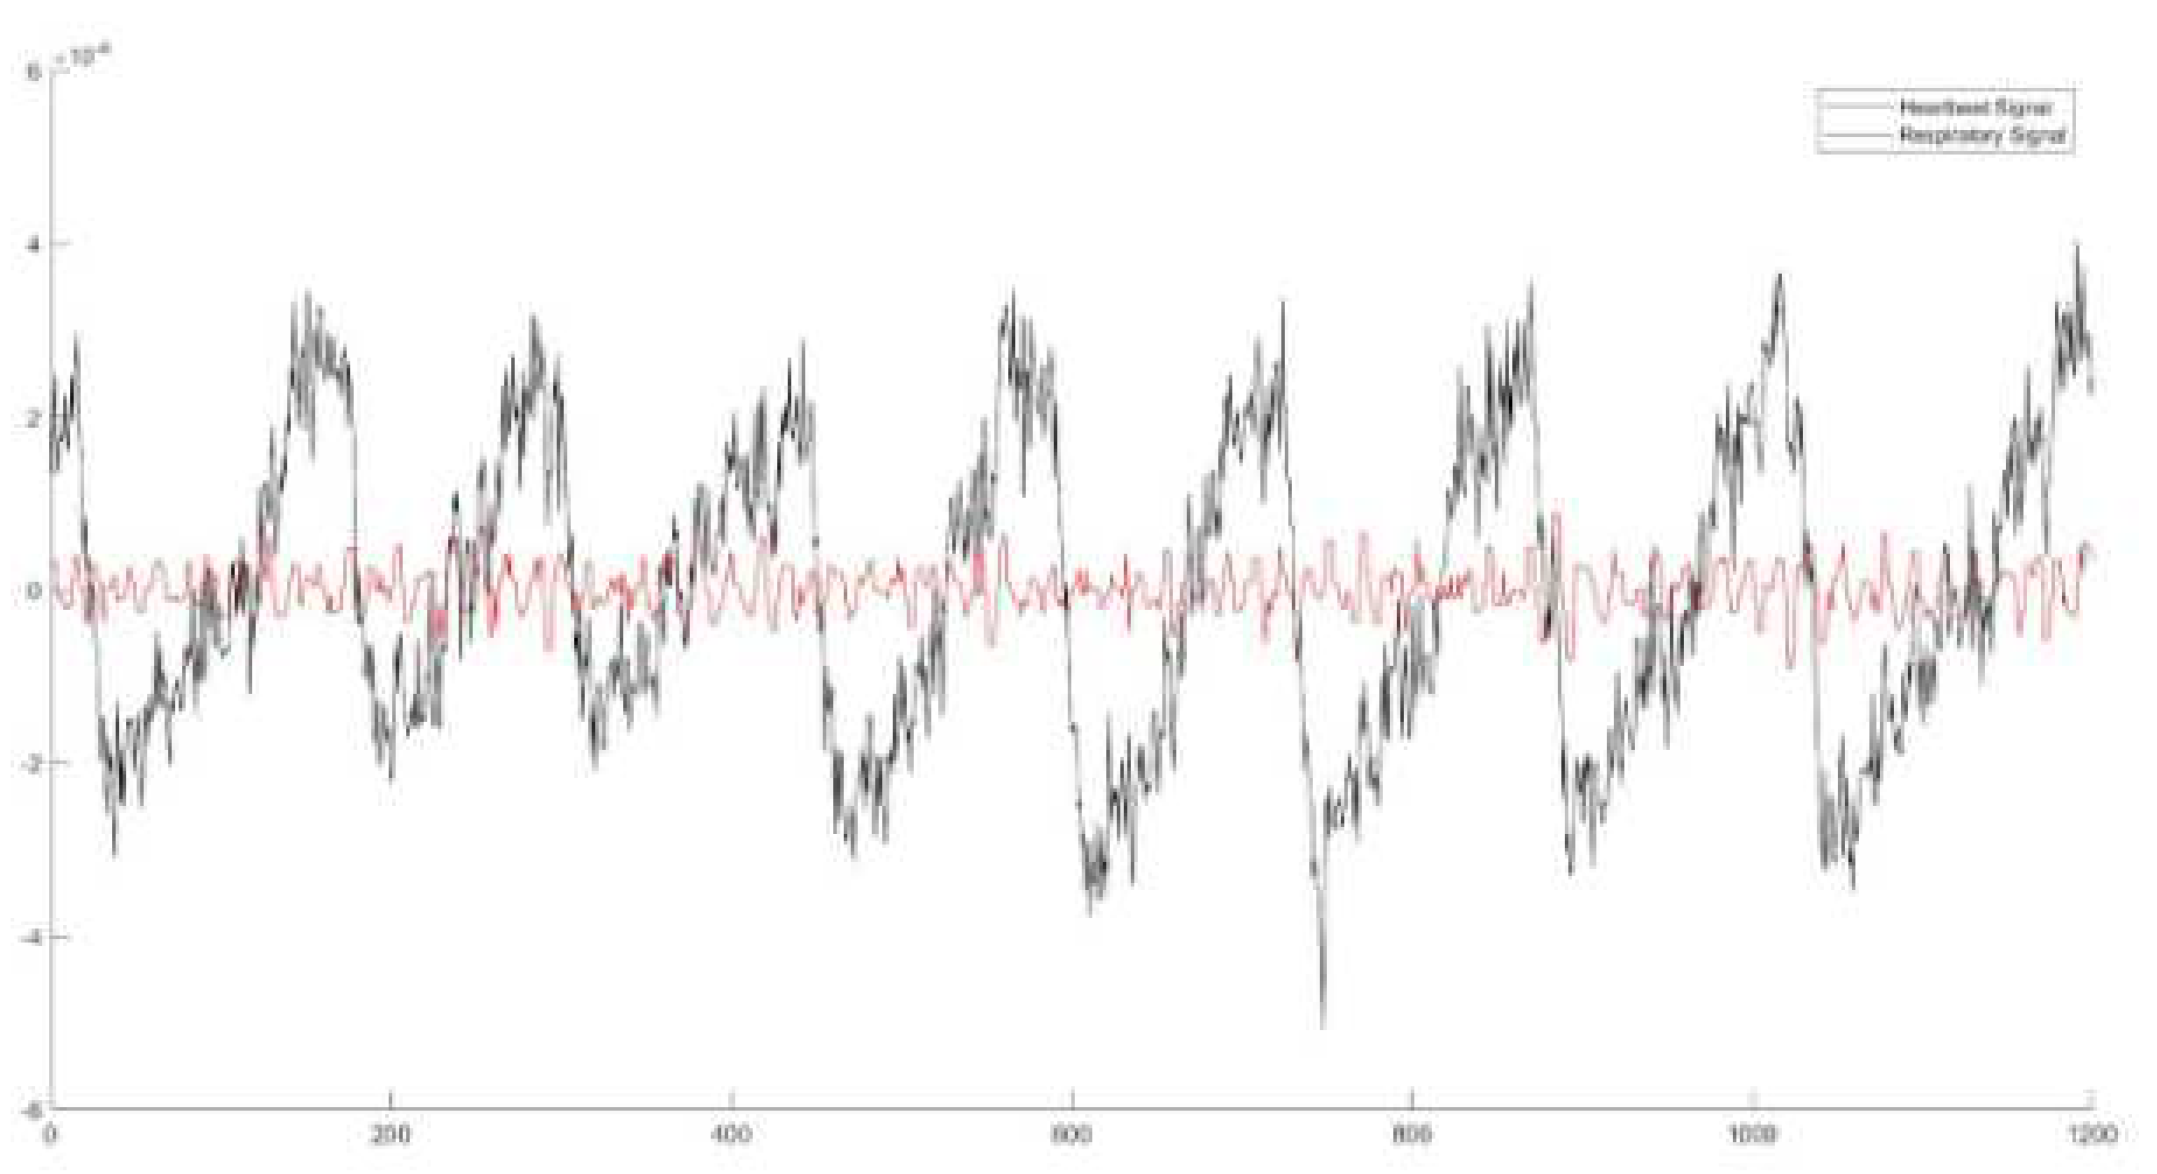
Figure 5.
Block diagram of our proposed methodology. From radar-based recordings to the extraction of the respiration and heartbeat signals.
Figure 5.
Block diagram of our proposed methodology. From radar-based recordings to the extraction of the respiration and heartbeat signals.
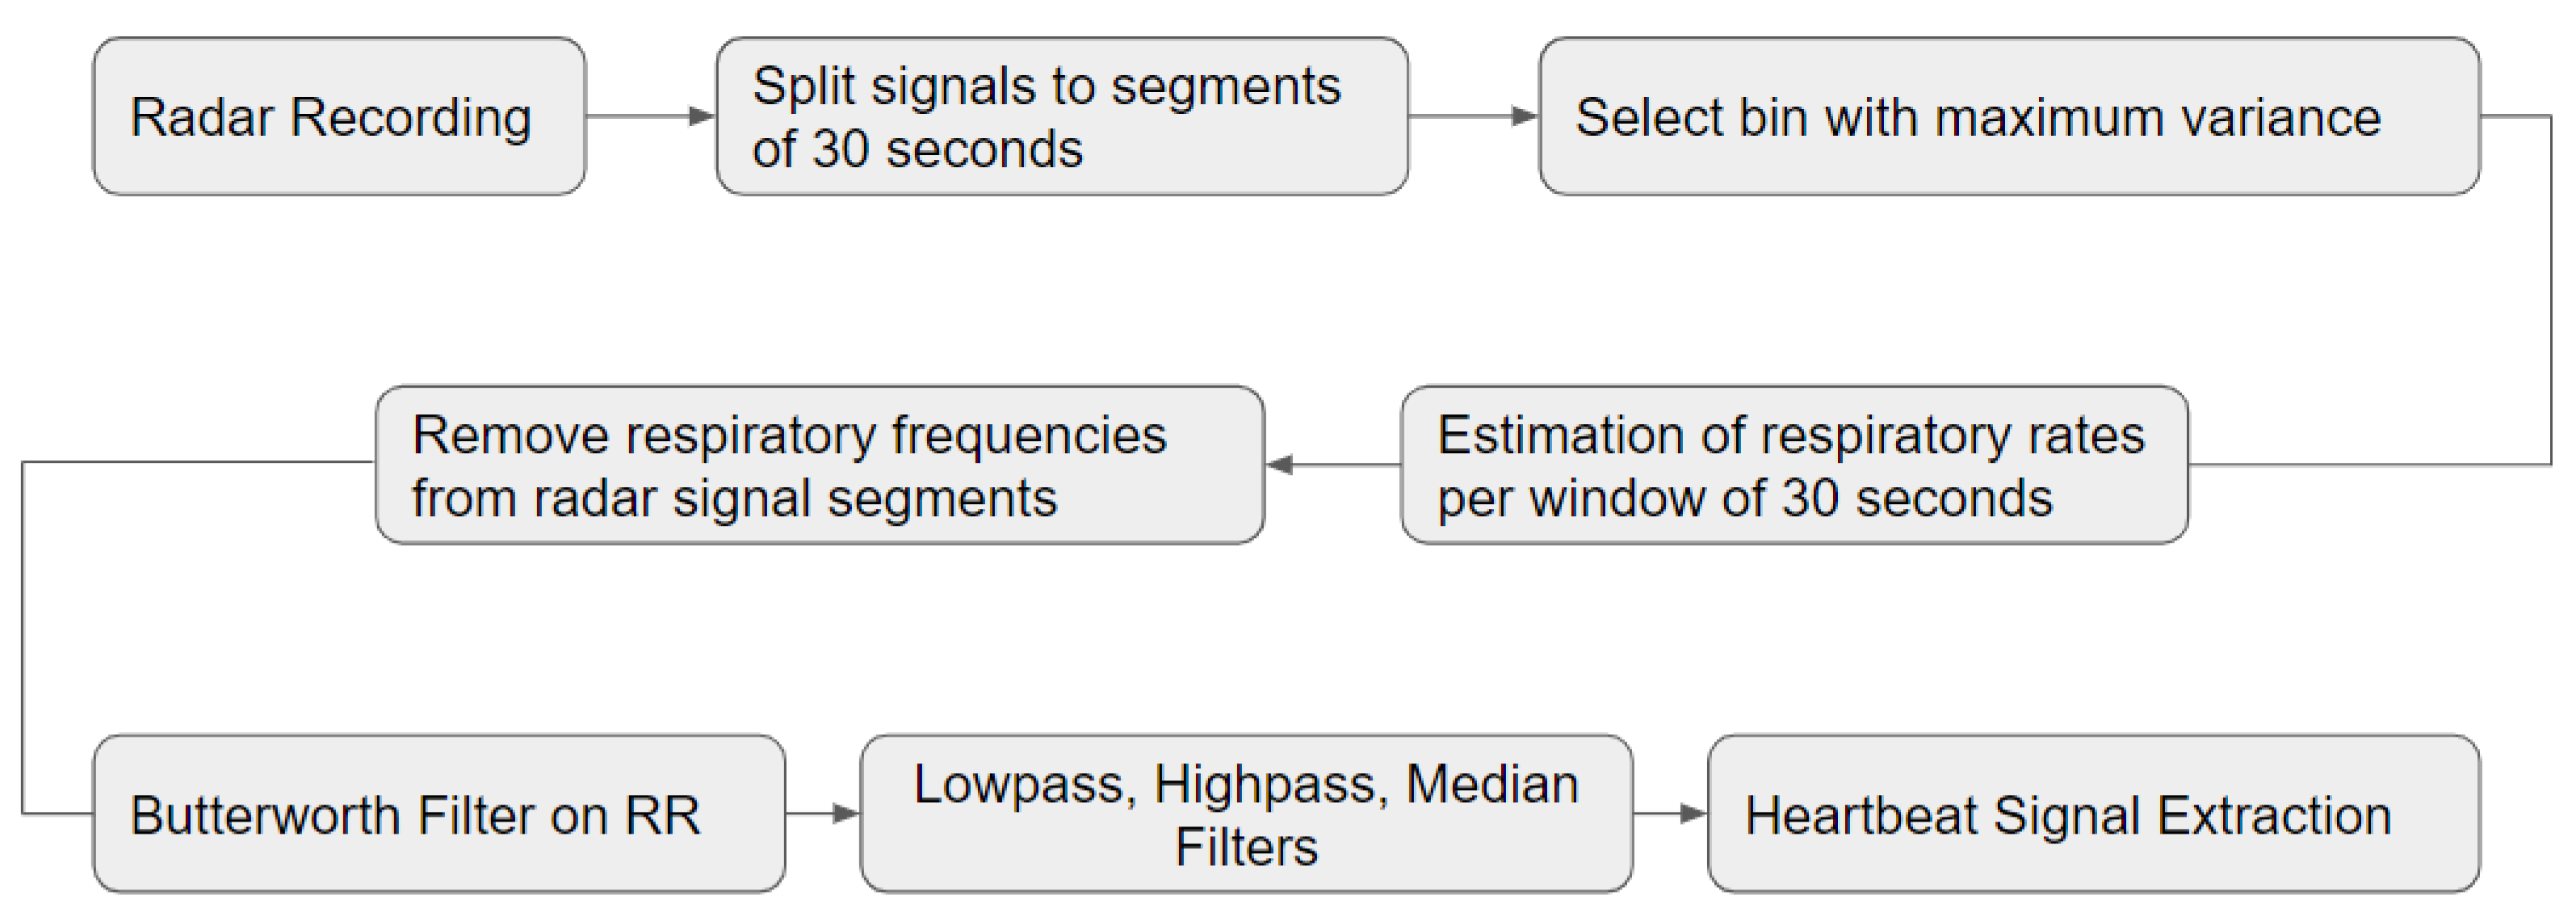
Figure 6.
The total number of RR values for all examinations. The window duration is 120 seconds. Comparison between the radar- and the PSG-extracted rates.
Figure 6.
The total number of RR values for all examinations. The window duration is 120 seconds. Comparison between the radar- and the PSG-extracted rates.
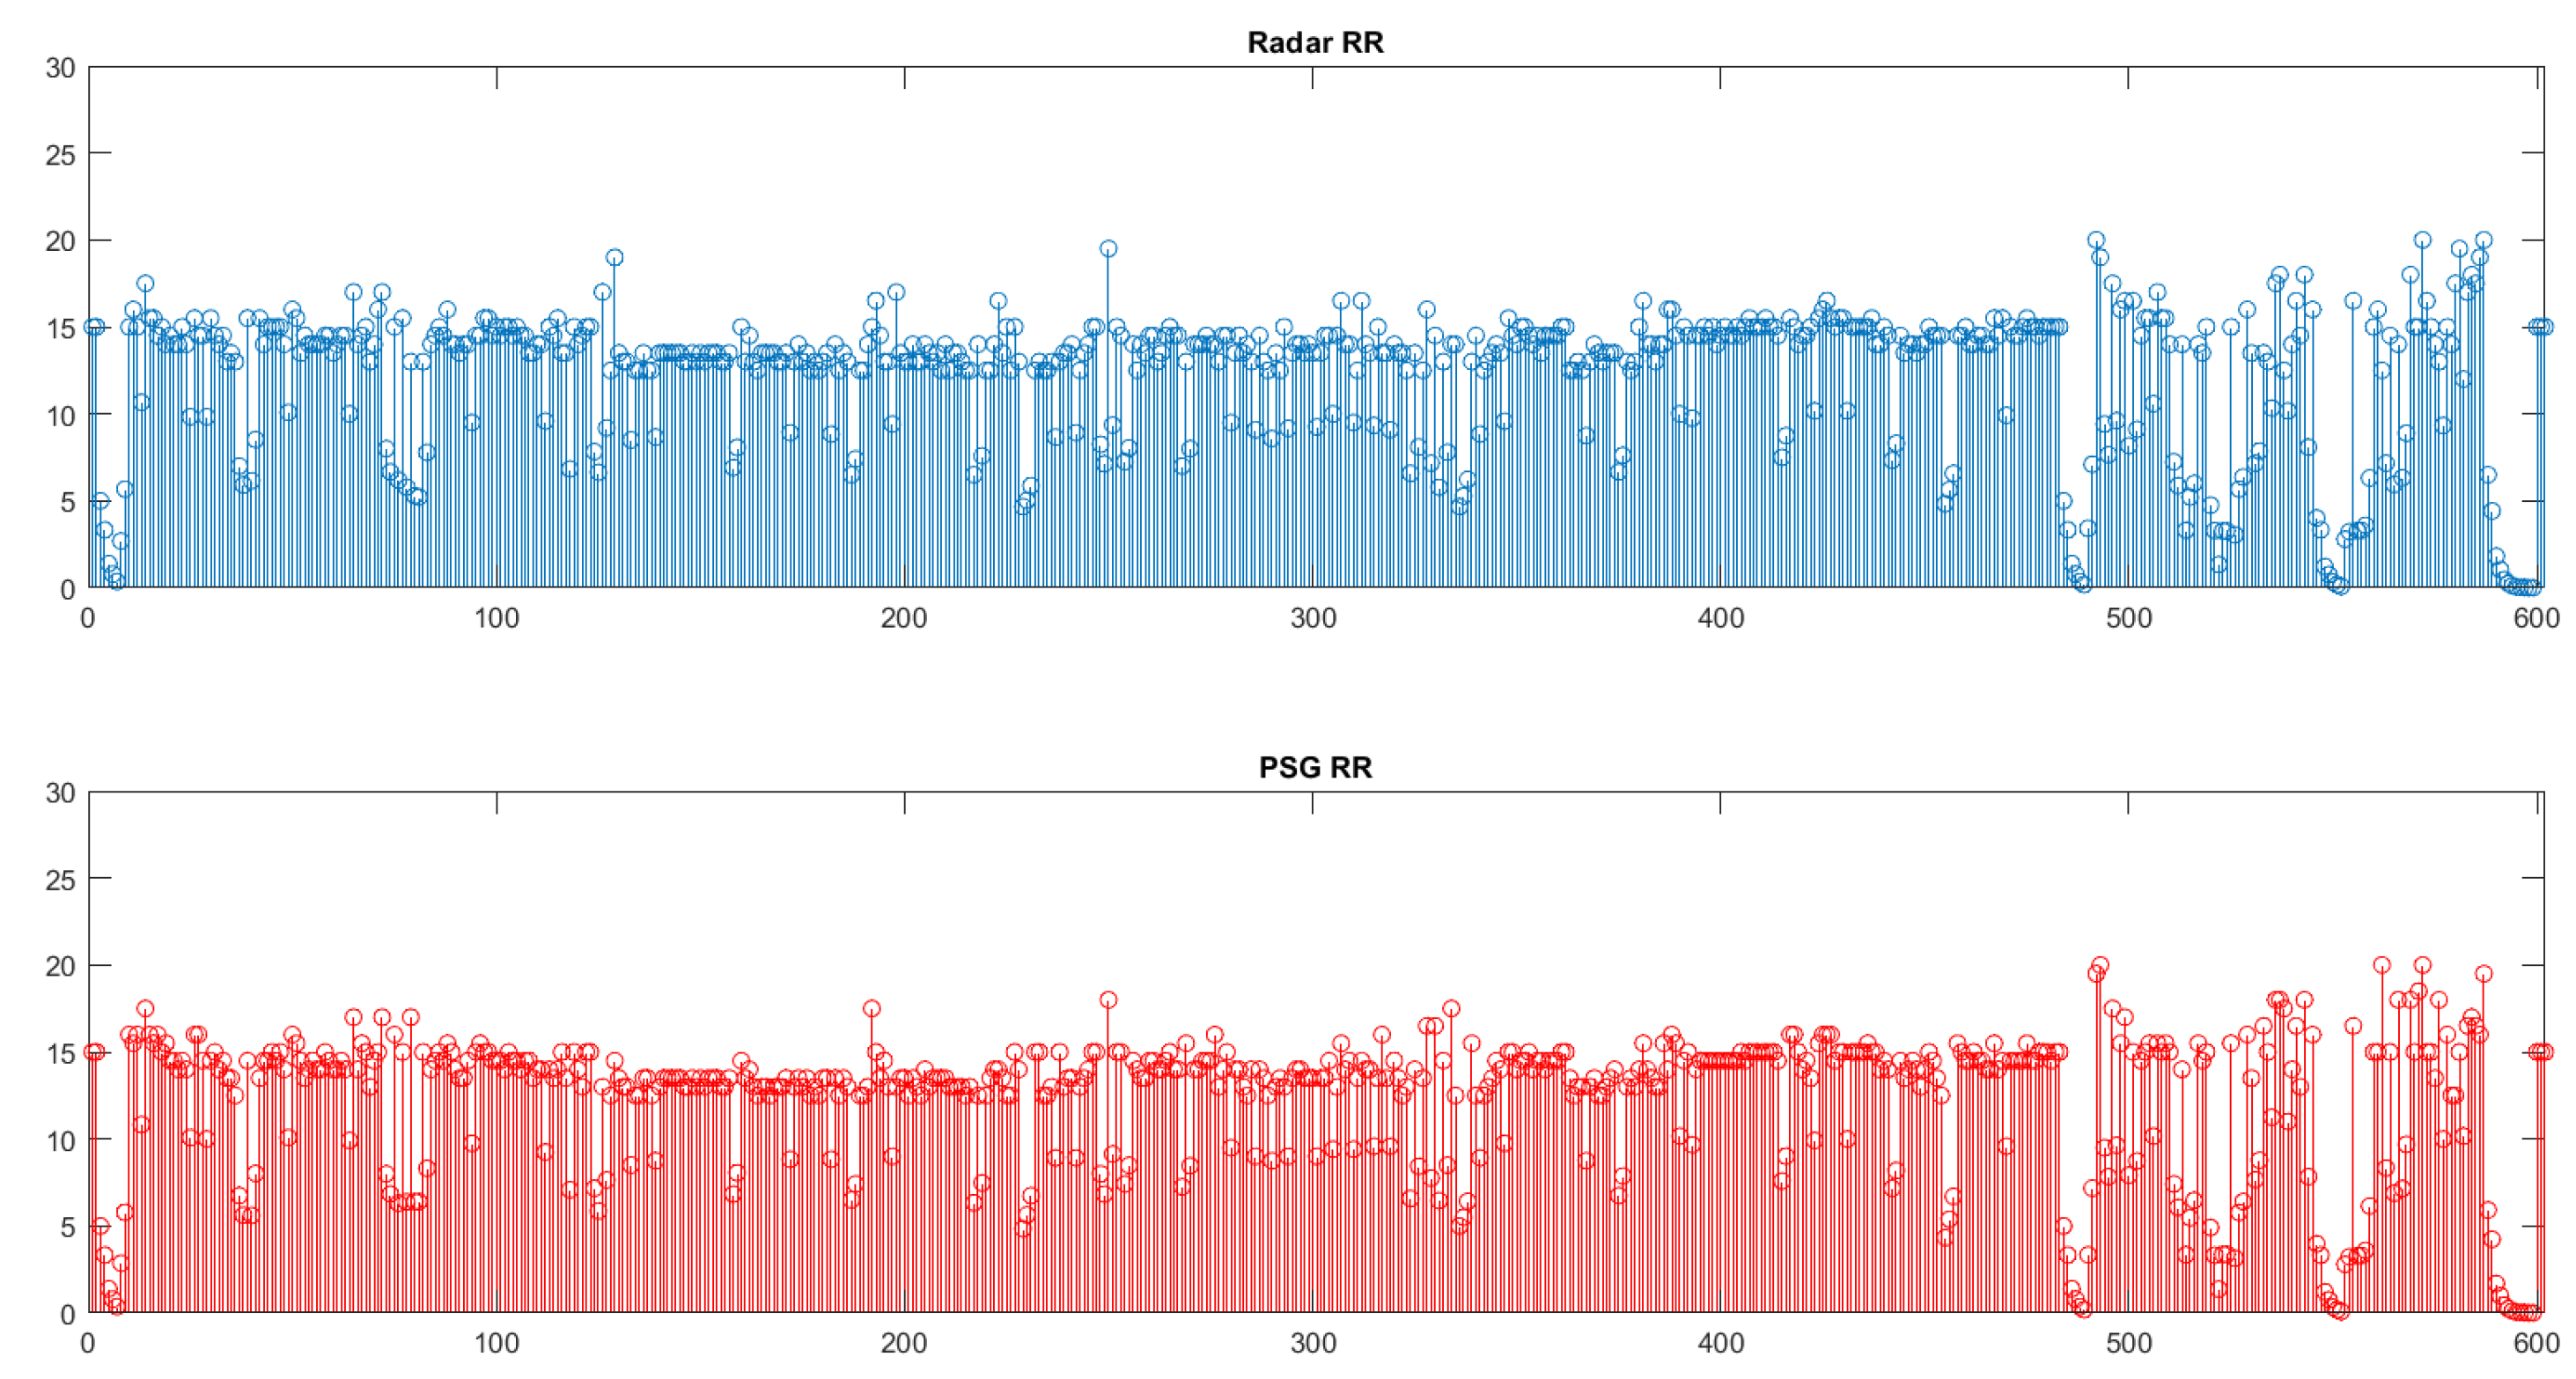
Figure 7.
The total number of HR values for all examinations. The window duration is 120 seconds. Comparison between the radar- and the PSG-extracted rates.
Figure 7.
The total number of HR values for all examinations. The window duration is 120 seconds. Comparison between the radar- and the PSG-extracted rates.
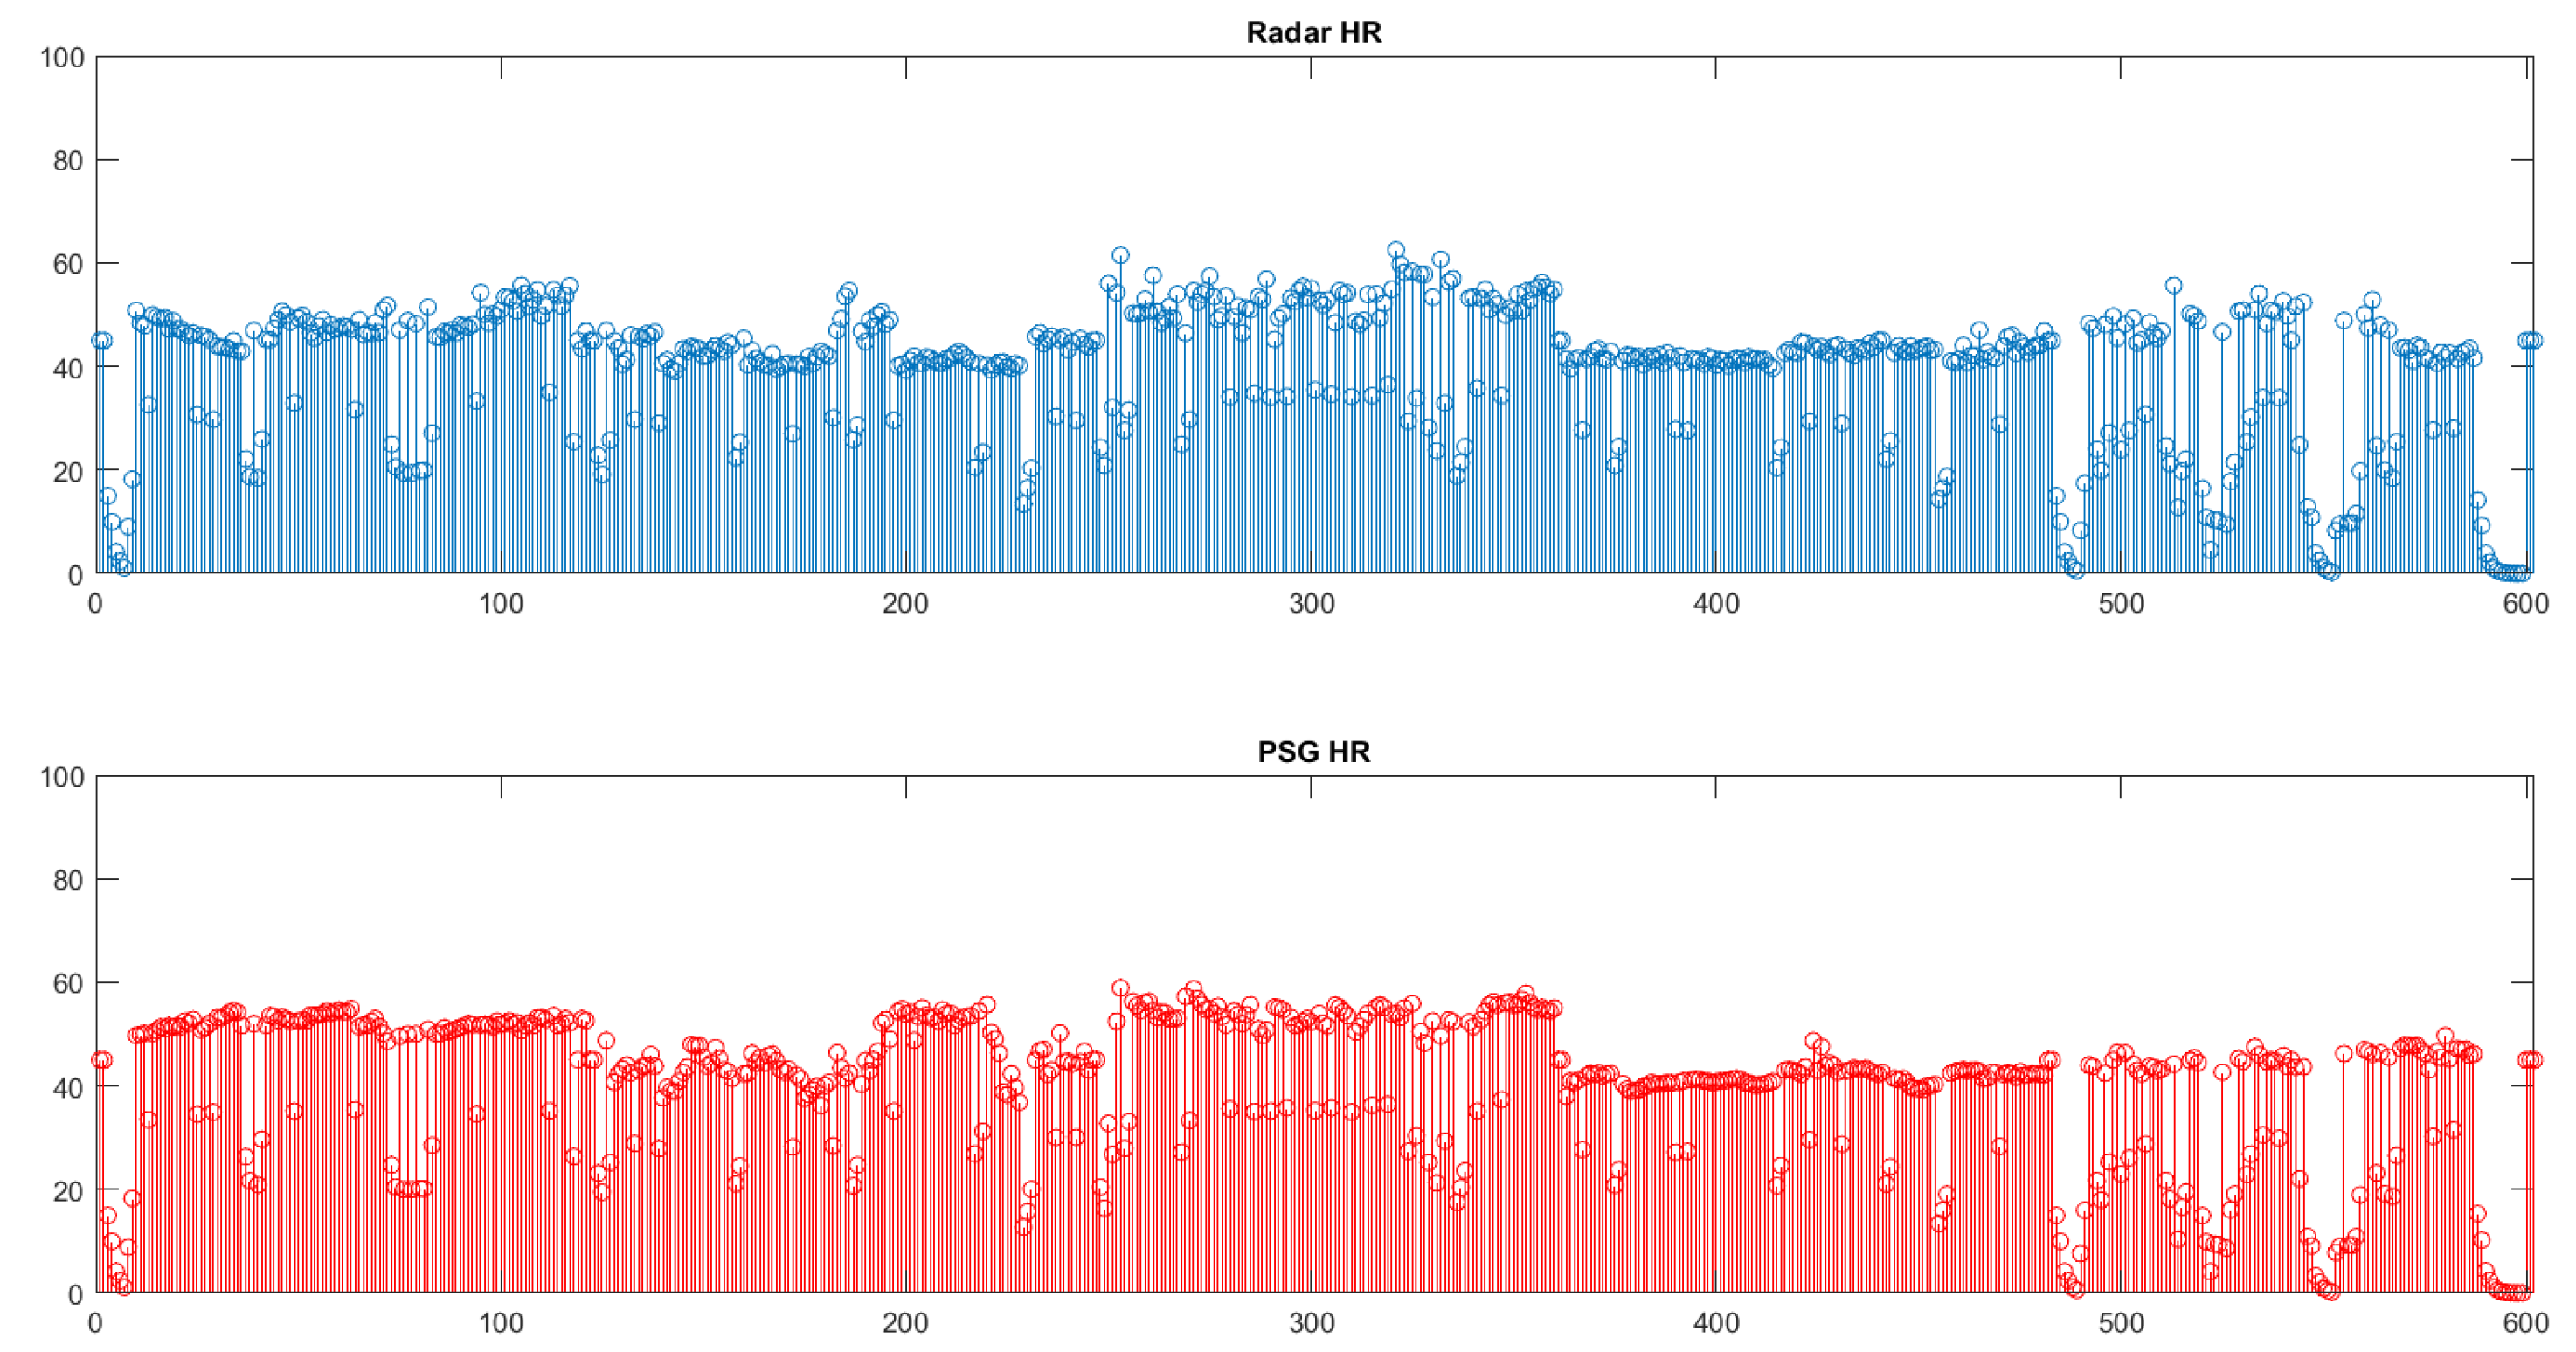

Table 1.
General IR-UWB radar specifications.
| Specification | Value |
|---|---|
| Maximum detection range | 10 m |
| Maximum power consumption | 500 mW |
| Operating frequency | 6.5 GHz to 8.5 GHz |
| Integrated antenna | Aperture ± 60 by ± 60 |
| Communication interfaces | USB full speed, SPI, UART |
| Dimensions | 36 mm × 68 mm |
Table 2.
Demographic information of the study participants.
| Parameter | HealthSonar Protocol |
|---|---|
| Participants | 5 |
| Gender | 2/3 (F/M) |
| Age | 23-68 years |
| Weight | 55-155 kg |
Table 3.
Performance evaluation of RR.
| Patient ID | Relative Error (%) | Pearson’s Correlation | ICC |
|---|---|---|---|
| 1 | 3.3 | 0.98 | 0.99 |
| 2 | 3.6 | 0.92 | 0.95 |
| 3 | 4.2 | 0.95 | 0.97 |
| 4 | 2.8 | 0.97 | 0.99 |
| 5 | 5.3 | 0.98 | 0.99 |
| Average value | 3.7 | 0.96 | 0.98 |
Table 4.
Performance evaluations of HR.
| Patient ID | Relative Error (%) | Pearson’s Correlation | ICC |
|---|---|---|---|
| 1 | 7.2 | 0.97 | 0.98 |
| 2 | 9.6 | 0.77 | 0.86 |
| 3 | 6.9 | 0.92 | 0.96 |
| 4 | 3.2 | 0.97 | 0.99 |
| 5 | 9.1 | 0.99 | 0.99 |
| Average value | 7.2 | 0.92 | 0.96 |
Disclaimer/Publisher’s Note: The statements, opinions and data contained in all publications are solely those of the individual author(s) and contributor(s) and not of MDPI and/or the editor(s). MDPI and/or the editor(s) disclaim responsibility for any injury to people or property resulting from any ideas, methods, instructions or products referred to in the content. |
© 2023 by the authors. Licensee MDPI, Basel, Switzerland. This article is an open access article distributed under the terms and conditions of the Creative Commons Attribution (CC BY) license (http://creativecommons.org/licenses/by/4.0/).
Copyright: This open access article is published under a Creative Commons CC BY 4.0 license, which permit the free download, distribution, and reuse, provided that the author and preprint are cited in any reuse.


