Submitted:
20 June 2023
Posted:
21 June 2023
You are already at the latest version
Abstract
Fractures are present in hydrocarbon reservoirs of different porosity ranges. Seismic anisotropy has been widely used in fracture characterization and shown to be sensitive to background matrix porosities in theoretical studies. An understanding of the effects of background porosity on seismic anisotropy could improve seismic characterization in different fractured reservoirs. Based on synthetic rocks with controlled fractures, we conducted laboratory experiments to investigate the influence background porosity has on P wave anisotropy and shear wave splitting. A set of rocks containing the same fracture density (0.06) with varying porosities of 15.3%, 22.1%, and 30.8% were constructed. P and S wave velocities were measured at 0.5 MHz as rocks were water saturated. Results show that when porosity increased from 15.3% to 22.1%, P wave anisotropy and shear wave splitting exhibit slight fluctuations. However, when porosity continued to increase to 30.8%, P wave anisotropy declined sharply while shear wave splitting stayed nearly constant. The measured results were compared with predictions from equivalent medium theories. Qualitative agreements were found between theoretical predictions and measured results. In Eshelby-Cheng model, the increase of porosity reduces the fracture-induced perturbation in the fracture normal direction, resulting in a lower P wave anisotropy. In Gurevich(2003) model, the increase of porosity can reduce the compressional stiffness in parallel direction to a larger extent than that in perpendicular direction, thus leading to lower P wave anisotropy.
Keywords:
Anisotropy
; Fractures
; Porosity
; Rock physics
1. Introduction
Fractures are found throughout crustal rocks, and fracture detection is of critical importance for hydrocarbon exploration, water resource management, CO2 capture and storage, and geo-thermal exploitation (Fan et al., 2018; Li et al., 2022). Aligned fractures can cause seismic anisotropy, making it possible to obtain fracture information from seismic data. Fracture-induced anisotropy is an integrated result of fracture parameters (fracture density, scale, aspect ratio, etc.), fluid properties (fluid modulus and viscosities), and background properties (modulus, porosity, and permeability). Background matrix porosity has been thought to greatly influence P wave velocity anisotropy (Gurevich et al., 2003; Sil et al., 2011). Because fractures are present in low, mid, and high porosity hydrocarbon reservoirs, understanding the effect of background porosity on seismic anisotropy could further improve seismic fracture characterization in reservoirs of different porosities.
To date, theoretical and experimental studies have been conducted to relate rock physical properties to seismic velocity and anisotropy, and various equivalent medium theories have been proposed (Eshelby et al., 1953; Schoenberg et al., 1988; Cheng et al., 1993; Gurevich et al., 2003). These theories were based on different assumptions and derived with different methods, resulting in different predictions. Thus, there is a desire to verify and calibrate these theoretical models through laboratory experiments. Laboratory experiments typically use synthetic samples with controlled and known rock physical properties and fracture parameters. A number of experimental studies have been conducted to observe elastic wave velocity and anisotropy in fractured rocks (Rathor et al., 1995; Ass’ad et al., 1996; Wei & Di, 2008; Tillotson et al., 2012, 2014; Amalokwu et al., 2014, 2015a, 2015b, 2016, 2017; Ding et al., 2014a, 2014b, 2016, 2017, 2018, 2020, 2021;). These studies have investigated how parameters (such as fracture density, scale, and aspect ratio) can influence elastic wave velocity and anisotropy, providing significant insights into the physical mechanisms for elastic wave propagation in fractured rocks. However, despite the variations in the background porosity of fractured reservoirs, few studies have focused on the effect of background porosity on seismic anisotropy in these reservoirs.
Gurevich (2003) discussed the P wave anisotropy variation with background porosity in water saturated rocks with aligned fractures in low frequency range using numerical simulations. When there is no background porosity, P wave anisotropy ε is very small. In the absence of background porosity, fluid is ‘isolated’ in fractures. The ‘isolated’ fluid acts to ‘stiffen’ the fractures and reduce fracture compliance. This results in a relatively low P wave anisotropy for the overall fractured rock. With the increase to characteristic porosity, P wave anisotropy exhibits a sharp increase. When surrounded by pores, the fluid in fractures can escape during compression, therefore, the fracture is more compliant than in the ‘isolated’ condition. As porosity continues to increase, P wave anisotropy flattens and decreases gradually. Other theoretical studies have also discussed the influence of porosity on anisotropic parameters (Sil et al., 2011; Huang et al., 2015). However, no experimental studies have been conducted to test and verify this owing to difficulties in manufacturing artificial fractured rocks with low porosity.
This study experimentally examined the influence of background porosity on P-wave anisotropy in fractured rocks under water saturation conditions. A set of artificial fractured sandstone samples with the same fracture density (0.06), but different porosities (ranging from 15.3% to 30.8%) were built. Laboratory ultrasonic measurements were conducted to obtain the P and S wave velocities and anisotropy. We analysed the P wave anisotropy and shear wave splitting (SWS) variation with background porosity. Results were compared with theoretical models and causes of the P wave anisotropy and shear wave splitting variation with porosity were discussed.
2. Equivalent Medium Theories
2.1. High frequency (unrelaxed) moduli
High frequency theories have modelled fractures as “isolated” inclusions; thus, there was no fluid exchange between inclusions and the background medium. They assumed that if the frequency was higher than the squirt characteristic frequency, f >> fc, the fluid pressure does not have time to equilibrate between stiff and compliant pores during the half-wave cycle, or so-called “unrelaxed” state. Cheng (1978, 1993) derived the elastic stiffness tensor of a fractured medium at high frequency (unrelaxed) conditions based on Eshelby inclusion theory. Mathematically, the Eshelby—Cheng model is given by:
where is the background matrix stiffness tensor, is fracture porosity, and:
where relates applied strain to “stress-free” strain of the inclusion:
2.2. Low frequency (relaxed) moduli
In contrast to high frequency theories, low frequency theories considered the fluid exchange between fractures and the surrounding pores and micro-cracks. They assumed that if the frequency was lower than the squirt characteristic frequency, the fluid pressure can equilibrate locally between cracks and adjacent pores. By combining linear-slip theory and the anisotropic Gassmann equation, Gurevich (2003) derived expressions for a fluid saturated cracked porous medium in the low frequency condition in the form:
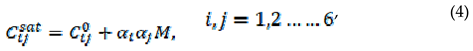
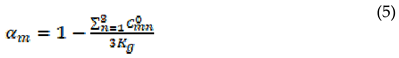
where is the dry modulus of the fractured medium, and αm is Biot’s coefficient:
for i=1,2, and 3, α4 = α5 = α6 = 0. Scalar M is the direct analog of Gassmann’s pore space modulus:
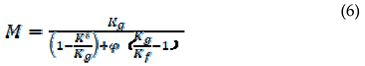
where and is the bulk modulus of mineral grains and pore fluid respectively.
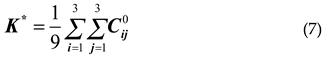
φ is the overall porosity of the fractured rock. denotes the so-called generalized drained bulk modulus, which is defined as:
3. Sample Preparation
The method of Ding (2014) was adapted to build artificial porous sandstones which have similar mineral components, pore structure, and cementation to natural rocks. In this method, powders of silica sand, feldspar, and kaolinite, were mixed in a ball mill for 24h to ensure homogeneity. Then these mineral powders were mixed with sodium silicate solution. The mixture was then paved into a mold layer by layer. In order to make the “meso-scale” fractures, touch paper discs were spread on the surface of mineral powder mixtures when layering the mixture in the mold. Touch paper is a special kind of paper which has been soaked in saltpeter. At high temperature touch paper would be decomposed into gas and leave nearly no remain.
In order to pave the mixture in the mould in layers, a special tool was made (Figure 1). The tool is consisted of a frame, a glass plate and a threaded rod. By rotating the threaded rod, the glass plate can be moved vertically. The procedure of paving the mixture is shown is Figure 2. Afterwards a predetermined number of discs were carefully placed on top of each mixture layer. Then the next mixture layer is paved , and the same number of discs were placed on it(except the top layer).
After that, a uniaxial compressing pressure was applied in the mold for 10 minutes to make mineral grains packed compactly. The compressing direction is perpendicular to fractures and layers. During this process, the pressure was adjusted to control the porosity of samples. During the next 10 hours the sodium silicate in the mixture became consolidated. In this way a block was formed and consolidated sodium silicate can give the block initial mechanical strength. Next the block was demolded, and then sintered in a muffle oven at 900℃. During sintering,touch paper discs were decomposed, leaving penny-shaped voids as fractures. The final step is to polish the sample surface for the convenience of ultrasonic velocity measurement. The size of all cuboid-shaped samples are 69.9±0.1mm in the two directions parallel to fractures, and 49.9 ±0.1mm in the direction perpendicular to fractures.
In order to produce artificial rocks with the same fracture densities but different porosities, we made the following modifications to the method of Ding (2014a): (1) Different amounts of mineral material mixture were layered in the mould (70 mm × 70 mm) in 37 layers when building the different porosity samples. (2) The mixture of different samples was compressed into the same thickness (50±0.3 mm) by adjusting the applied pressure, thus to form blocks of the same volume. Therefore, blocks made using more mixture would experience higher loading pressure and have lower porosity. (3) 126 touch paper discs were spread on the surface of each layer (except the top) in all blocks. Fracture density is unitless and calculated by:
Where N is the number of fractures, a is the radius of fractures, V is the total volume of the sample. Thus, all blocks would have the same volume (70mm×70mm×50 mm) and contain the same number of fractures(36 layers×126 fractures/layer),making fracture density practically identical for different porosities.
For each fractured sample, a blank sample (containing no penny-shaped fractures) was made as a reference sample to provide background properties. The blank samples were created using the same method as the fractured samples, excluding the introduction of fractures.
Four groups of artificial rocks with different porosities were constructed (Figure 3a). Each group consisted of two samples, one fractured sample containing penny shaped fractures with fracture density of 0.06 and a corresponding unfractured sample. Fracture diameter was set at 3 mm, and fracture thickness was 0.06 mm. Table 1 lists main parameters of all samples. The porosity was measured using helium porosimetry. In fractured samples, the fracture porosity was calculated to be 0.75%, but the porosity difference between the fractured and blank (unfractured) samples within each group varied from 0.4% to 1.5%, larger or smaller than the fracture porosity, indicating a small difference in background porosity between fractured and blank samples. This was caused by tiny errors in the manufacturing process. A section obtained by cutting a fractured sample is shown in Figure 3b and parallelly distributed fractures can be observed. A scanning electron microscope (SEM) image of the sectoin is shown in Figure 3c-d, pore and fracture structures with controlled geometry are clearly shown.
4. Ultrasonic Measurement
P- and S-wave velocity measurements were conducted on an ultrasonic bench-top pulse transmission system at room temperature and atmosphere pressure for water saturated conditions. The measurement was based on test standard DZ/T0276.24-2015. The ultrasonic transducers, heavily damped with a central frequency of 500 kHz, were excited by a voltage spike, giving rise to broadband ultrasonic pulses. The transmitted P- and S-wave signals were recorded with a digital oscilloscope and a desktop computer, time sampling interval for all experiments was 0.04 μs for both P- and S-wave signals. The measurement error was about 0.5% for P wave velocity and 0.8% for S wave velocity. Water saturation was obtained by immersing samples in a water filled container, the container was placed in a sealed bin to extract the air. To ensure full water saturation, the saturation rate is calculated by:
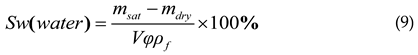
Where msat and mdry is the wet and dry mass of the sample, V and φ is the volume and helium porosimetry measured porosity of the sample, ρf is bulk density of water. P-wave velocities were measured both parallel (90°) and perpendicular (0°) to the fractures. S-wave velocities were measured parallel to the fractures, and for polarization parallel (S1 wave) and perpendicular (S2 wave) to the fractures by rotating the transducers. Then Thomsen parameter ε which represents the difference in P-wave velocity between the parallel and perpendicular directions can be calculated by:
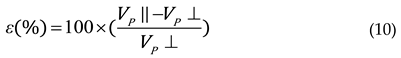
Where Vp ‖ and Vp ⊥ are P wave velocities in parallel and perpendicular direction respectively. Shear wave splitting (SWS) in the parallel direction can be calculated as:
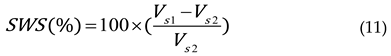
Where Vs1 and Vs2 are fast and slow shear wave velocities. The numerical modelling experiment of wave propagation in anisotropic media by Dellinger & Vernik (1994) showed that if the wave front is propagating parallel or perpendicular to the layering(or in this case fractures), a true phase velocity is measured in laboratory ultrasonic experiments. Therefore, in this study, P and S wave phase velocities were measured in both parallel and perpendicular direction. The transmitted signals of blank samples were analysed by Fourier transform to obtain the dominant frequency and calculate the wavelength (Figure 4). The ratio of wavelength to fracture diameter (λ/d ratio) was between 5.2 and 10.8 for the P wave and between 3.9 and 12 for the S wave. Based on experimental and numerical studies (Ding et al., 2020), for this λ/d ratio, both P and S wave may exhibit Rayleigh scattering. This is undesirable because the equivalent medium criteria are violated. This problem has been frequently encountered in previous experimental studies (Rathor, 1995; Tillotson, 2014). However, similar to previous studies, we also found some interesting correlations between experimental results and theoretical predictions.
5. Results and Discussions
5.1. Laboratory results
Table 2 gives the P and S wave velocities in the blank samples. The P wave velocity in the parallel direction is slightly higher than that in the perpendicular direction, and the S1 velocity (polarized parallel to fractures) is slightly higher than the S2 velocity (polarized perpendicular to fractures). This is due to layering and uniaxial loading during the manufacturing process.
Figure 5 shows the measured P and S wave velocities in water saturated fractured samples. Significant velocity anisotropy was evident in all fractured samples with the faster P wave being measured parallel and the slower one perpendicular. Measured velocity anisotropy is discussed further in the following paragraphs. When the porosity increased from 15.3% to 22.1%, the P wave velocities, both parallel and perpendicular, dropped sharply. However, as the porosity continued to increase, the decreasing trend in the perpendicular direction is slower than that in the parallel direction, narrowing the difference between the parallel and perpendicular directions and indicating a decrease in anisotropy. However, when porosity increased from 15.1% to 30.8%, the decrease of both S1 and S2 wave velocities were generally similar.
Figure 6 shows the P wave anisotropy parameter ε and SWS in all blank samples. Both ε parameter and SWS decreased with the increase of porosity in the blank samples. Because higher porosity samples suffered lower uniaxial loading (Table 1), thus exhibited weaker anisotropy.
We aimed to investigate the effect of background porosity on the fracture-induced P wave anisotropy and SWS. Because blank samples exhibited transverse isotropy, so we inferred that the background matrix in the fractured samples had the same anisotropy as blank samples. In fractured samples, the measured anisotropy was a superposition of background matrix anisotropy and fracture induced anisotropy. To model the anisotropy caused by fractures, the anisotropy of the background matrix have to be considered. Therefore, we approximately represented the fracture-induced P wave anisotropy and SWS by subtracting the measured ε parameter and SWS of the blank samples from that of the fractured ones. Figure 7 and Figure 8 depicted the measured results of fracture-induced ε parameter and SWS as well as theoretical predictions. When porosity increased from 15.3% to 22.1%, both measured ε parameter and SWS exhibited small fluctuations. In this porosity range, both ε parameter and SWS are not so sensitive to porosity change. However, when porosity increased to 26.1%, P wave anisotropy showed a dramatic decline, from 4.5% to 3.5%, while SWS remained fairly constant. Afterwards,as porosity increased to 30.8% ,the decline trend of P wave anisotropy continued , from 3.5%to 2.2%, but SWS fluctuated very slightly.
5.2. Modelling insights and discussions
Inputs for equivalent medium theories are given in Table 1 and Table 3. Eshelby-Cheng (1993) theory (high frequency) predicted P wave anisotropy to be close to the measured results. Although expressions of Eshelby-Cheng theory do not contain background porosity, its predicted P wave anisotropy showed a decreasing trend with increasing background porosity. Eshelby-Cheng theory can be expressed by Equations (1) and (2). Note that in Equation (1), refers to the fracture occupied porosity, not the background porosity, and in all fractured samples the fracture porosity are practically identical. Predicted P wave anisotropy fluctuation is mainly dominated by parameter in Equation (2), which relates the applied strain to the “stress-free” strain of the inclusion. is expressed by:
Where:
Where b and b is lame constant of the background medium, and is the lame constant of the inclusion material (water). is the Eshelby S tensor, which relates the strain field due to an ellipsoidal inclusion to the “stress-free” strain in the inclusion. For very thin fractures (small aspect ratio), can be simplified as:
Where is the fracture aspect ratio and:
In the fracture normal direction (direction 3), since is so small(), so and . Because the shear modulus of inclusion material(water) is zero, therefore and . With the increase of porosity, decreases while stays nearly constant. This leads to the decrease of . As a result, the fracture induced perturbation in the fracture normal direction decreases with the increase of porosity. However, as the aspect ratio of fractures was extremely small in this study, the fracture induced perturbation was nearly negligible in the parallel direction of the fractured samples. As the fracture induced perturbations decreased with increasing porosity in the perpendicular direction, the stiffness difference between the parallel and perpendicular directions also decreased. This leads to the declining trend of the predicted P wave anisotropy with increasing porosity.
In Figure 8, we can see that the Eshelby-Cheng predicted SWS is higher than measured results. The shear moduli of the S1 () and S2 () in Eshelby-Cheng theory are:
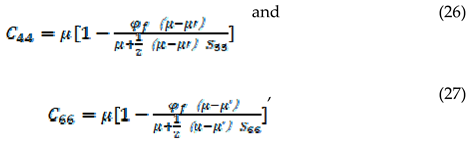
As in our study, therefore SWS can be approximately expressed by:
where is fracture density, and φf = 2παe. As the value of R in four rocks is close (between 0.25 and 0.3), SWS prediction is similar and not sensitive to porosity change.
In theoretical predictions of Gurevich (2003), with the increase of porosity, P wave anisotropy showed a decreasing trend while SWS remained practically constant. This trend is similar to the measured results. However, theoretical predictions are higher than the measured results. For water saturated conditions, the theoretically predicted P wave anisotropy of Gurevich (2003) was:
where direction 3 is the fracture normal direction. and are the P-wave modulus of the parallel and perpendicular directions in water saturated condition, respectively. Meanwhile and are the P-wave modulus of the parallel and perpendicular directions in dry condition, and:
Where λ and μ are Lame parameters of the dry background matrix.So Equation (29) can be rewritten as :
Firstly, with the increase of porosity, the value of increases from 0.62 to 0.75. Meanwhile, according to Equation (6), when the porosity increases, scalar M decreases greatly. Since α1 is larger than α3 (Equation (5)), so term decreases more than term. As a result, with the increase of porosity these two factors make the decreases more than , making P wave anisotropy decrease. Predicted P wave anisotropy is higher than the measured results. Potential explanations for this phenomenon include: (i) Under experiment frequency (0.5 MHz), fluid didn’t have enough time to flow between pores and fractures, thus the system didn’t reach pressure equilibrium in pore space,and the equilibrium is assumed by Gurevich (2003) theory. This can cause a “stiffening” effect on fractures, reducing P wave anisotropy and making measured results lower than theoretical predictions. (ii) Interactions between fractures were not included in the theory of Gurevich (2003), which has been shown to reduce the overall anisotropy in a fractured medium in theoretical studies (Cheng, 1993).
In Gurevich (2003), the expression of SWS is:
Where:
Combining equations from (32) to (36) can obtain:
where is fracture density. The term was extremely small in the four fractured samples (less than 0.077), therefore,  . Compared with P wave anisotropy, SWS prediction is relatively close to the measured results.
. Compared with P wave anisotropy, SWS prediction is relatively close to the measured results.Conclusions
In this study, we investigated the effects of background porosity on seismic anisotropy in fractured rocks by conducting laboratory experiments. P and S wave velocities were measured on a set of synthetic samples with the same fracture density but different porosities (ranging from 15.1% to 30.8%) under water saturated conditions. Results exhibited a significant effect of background porosity on P wave anisotropy for the measured porosity range. P wave anisotropy fluctuated slightly when porosity increased from 15.1% to 22.1%, then declined sharply when porosity continued to increase to 30.8%. However, SWS stayed fairly constant for the entire porosity range. The results were compared with predictions from equivalent medium theories. In both the Eshelby-Cheng model and Gurevich(2003) model, the increase of porosity can reduce P wave anisotropy but had little influence on SWS. Experimental results show good qualitative agreement with theoretical predictions.
Understanding the influence of background porosity on seismic anisotropy could improve the characterization of different fractured reservoirs. Findings of this study have potential applications for fracture detection in different areas with different reservoir physical properties. However, further studies concerning this topic are required for broader porosity and frequency ranges.
Author Contributions
sample manufacturing, ultrasonic measurement, data analysis, Zhang. Y.;Supervision, Di. B. All authors have read and agreed to the published version of the manuscript.
Funding
This research received no external funding.
Data Availability Statement
The data that support the findings of this study are available from the corresponding author upon reasonable request.
Conflicts of Interest
The authors declare no conflict of interest.
References
- Amalokwu, K. , Best,A.I., Sothcott, J., Chapman, M., Minshull, T., Li, X.-Y., (2014), Water saturation effects on elastic wave attenuation in porous rocks with aligned fractures. Geophys. J. Int. 197 (2), 943–947. [CrossRef]
- Amalokwu, K. , Chapman, M., Best, A.I., Minshull, T.A., Li, X.-Y., (2015a), Water saturation effects on P-wave anisotropy in synthetic sandstone with aligned fractures. Geophys. J. Int. 202, 1088–1095. [CrossRef]
- Amalokwu, K. , Chapman, M., Best, A.I., Sothcott, J., Minshull, T.A., Li, X.-Y., (2015b), Experimental observation of water saturation effects on shear wave splitting in synthetic rock with fractures aligned at oblique angles. Geophys. J. Int. 200, 17–24. [CrossRef]
- Amalokwu, K. , Best, A.I., Chapman, M., (2016), Effects of aligned fractures on the response of velocity and attenuation ratios to water saturation variation: a laboratory study using synthetic sandstones. Geophys. Prospect. 64, 942–957. [CrossRef]
- Amalokwu, K. Papageorgiou, G., Chapman, M., K., Best, A.I,, (2017), Modelling ultrasonic laboratory measurements of the saturation dependence of elastic modulus: New insights and implications for wave propagation mechanisms. International Journal of Greenhouse Gas Control. 59,148–159.
- Ass' Ad, J.M. , Tatham, R.H., McDonald, J.A., (1992), A physical model study of microcrack-induced anisotropy. Geophysics 57, 1562–1570. [CrossRef]
- Cheng, C.H., Seismic Velocities in Porous Rocks: Direct and In-verse Problems. Sc.D. Thesis, Mass. Inst. of Technol., Cam-bridge, 1978.
- Cheng, C. H. , (1993), Crack models for a transversely isotropic medium: Journal of Geophysical Research: Solid Earth, 98, 675–684.
- Dellinger, J. and Vernik, L. (1994), Do travel times in pulse-transmission experiments yield anisotropic group or phase velocities. Geophysics. 59, 1774–1779.
- Ding, P. , Di, B., Wang, D., Wei, J. and Li, X. (2014a), P and S wave anisotropy in fractured media: Experimental research using synthetic samples. Journal of Applied Geophysics, 109, 1–6. [CrossRef]
- Ding, P. , Di, B., Wei, J., Li, X. & Deng, Y. (2014b), Fluid-dependent anisotropy and experimental measurements in synthetic porous rocks with controlled fracture parameters[J], Journal of Geophysics and Engineering, 11, 015002.
- Ding, P., Di, B., Wang, D., Wei, J. and Li, X. Measurements of seismic anisotropy in synthetic rocks with controlled crack geometry and different crack densities. Pure and Applied Geophysics 2017, 174, 1907–1922. [CrossRef]
- Ding,P., Wang,D., Di,G. and Li,X. (2019), Investigation of the effects of fracture orientation and saturation on the Vp/Vs ratio and their implications. Rock Mechanics and Rock Engineering, 52, 3293–3304. [CrossRef]
- Ding, P. , Wang, D. and Li, X.-Y. (2020), An experimental study on scale-dependent velocity and anisotropy in fractured media based on artificial rocks with controlled fracture geometries. Rock Mechanics and Rock Engineering, 53, 3149–3159. [CrossRef]
- Ding, P., Wei, J., Di, B., Li,X., Zeng, L. Observation and theoretical calibration of the fluid flow mechanism of artificial porous rocks with various size fractures. Geophysical Prospecting 2021, 69, 1235–1247. [CrossRef]
- Eshelby, J. D. (1957), The determination of the elastic field of an ellipsoidal inclusion, and related problems Proc. R. Soc. A 241 376–96. [CrossRef]
- Gassmann, F. (1951), Elastic waves through a packing of spheres. Geophysics 16 673–85. [CrossRef]
- Gurevich, B. (2003), Elastic properties of saturated porous rocks with aligned fractures: Journal of Applied Geophysics, 54, 203–218.
- Huang, L., R. R. Stewart, S. Sil, and N, Dyaur. Fluid substitution effects on seismic anisotropy. J. Geophys. Res. Solid Earth 2015, 120, 850–863. [CrossRef]
- Rathore J S, Fjaer E, Holt R M and Renlie, L. 1995. P- and S-wave anisotropy of a synthetic sandstone with controlled crack geometry. Geophys. Prospect. 43 711–28.
- Schoenberg, M., & Sayers, C. M. Seismic anisotropy of fractured rock. Geophysics 1995, 60, 204–211. [CrossRef]
- Sil, S., M. Sen., and B, Gurevich. Analysis of fluid substitution in a porous and fractured medium. Geophysics 2011, 76(3), WA157–WA166. [CrossRef]
- Tillotson, P. , Sothcott, J., Best, A.I., Chapman, M., Li, X.-Y. (2012) Experimental verification of the fracture density and shear-wave splitting relationship using synthetic silica cemented sandstones with a controlled fracture geometry. Geophys. Prospect. 60, 516–525. [CrossRef]
- Tillotson, P. , Chapman, M., Sothcott, J., Best, A.I., Li, X.-Y. (2014) Pore fluid viscosity effects on P- and S-wave anisotropy in synthetic silica-cemented sandstone with aligned fractures. Geophysics Prospect. 62, 1238–1252. [CrossRef]
- Wei, J., Di, B. A physical model study of effect of fracture aperture on seismic wave. Sci. China Ser. D Earth Sci. 2008, 38, 211–218. [CrossRef]
Figure 1.
(a) A tool used to strickle mineral mixture in the mold; (b) Structural representation.
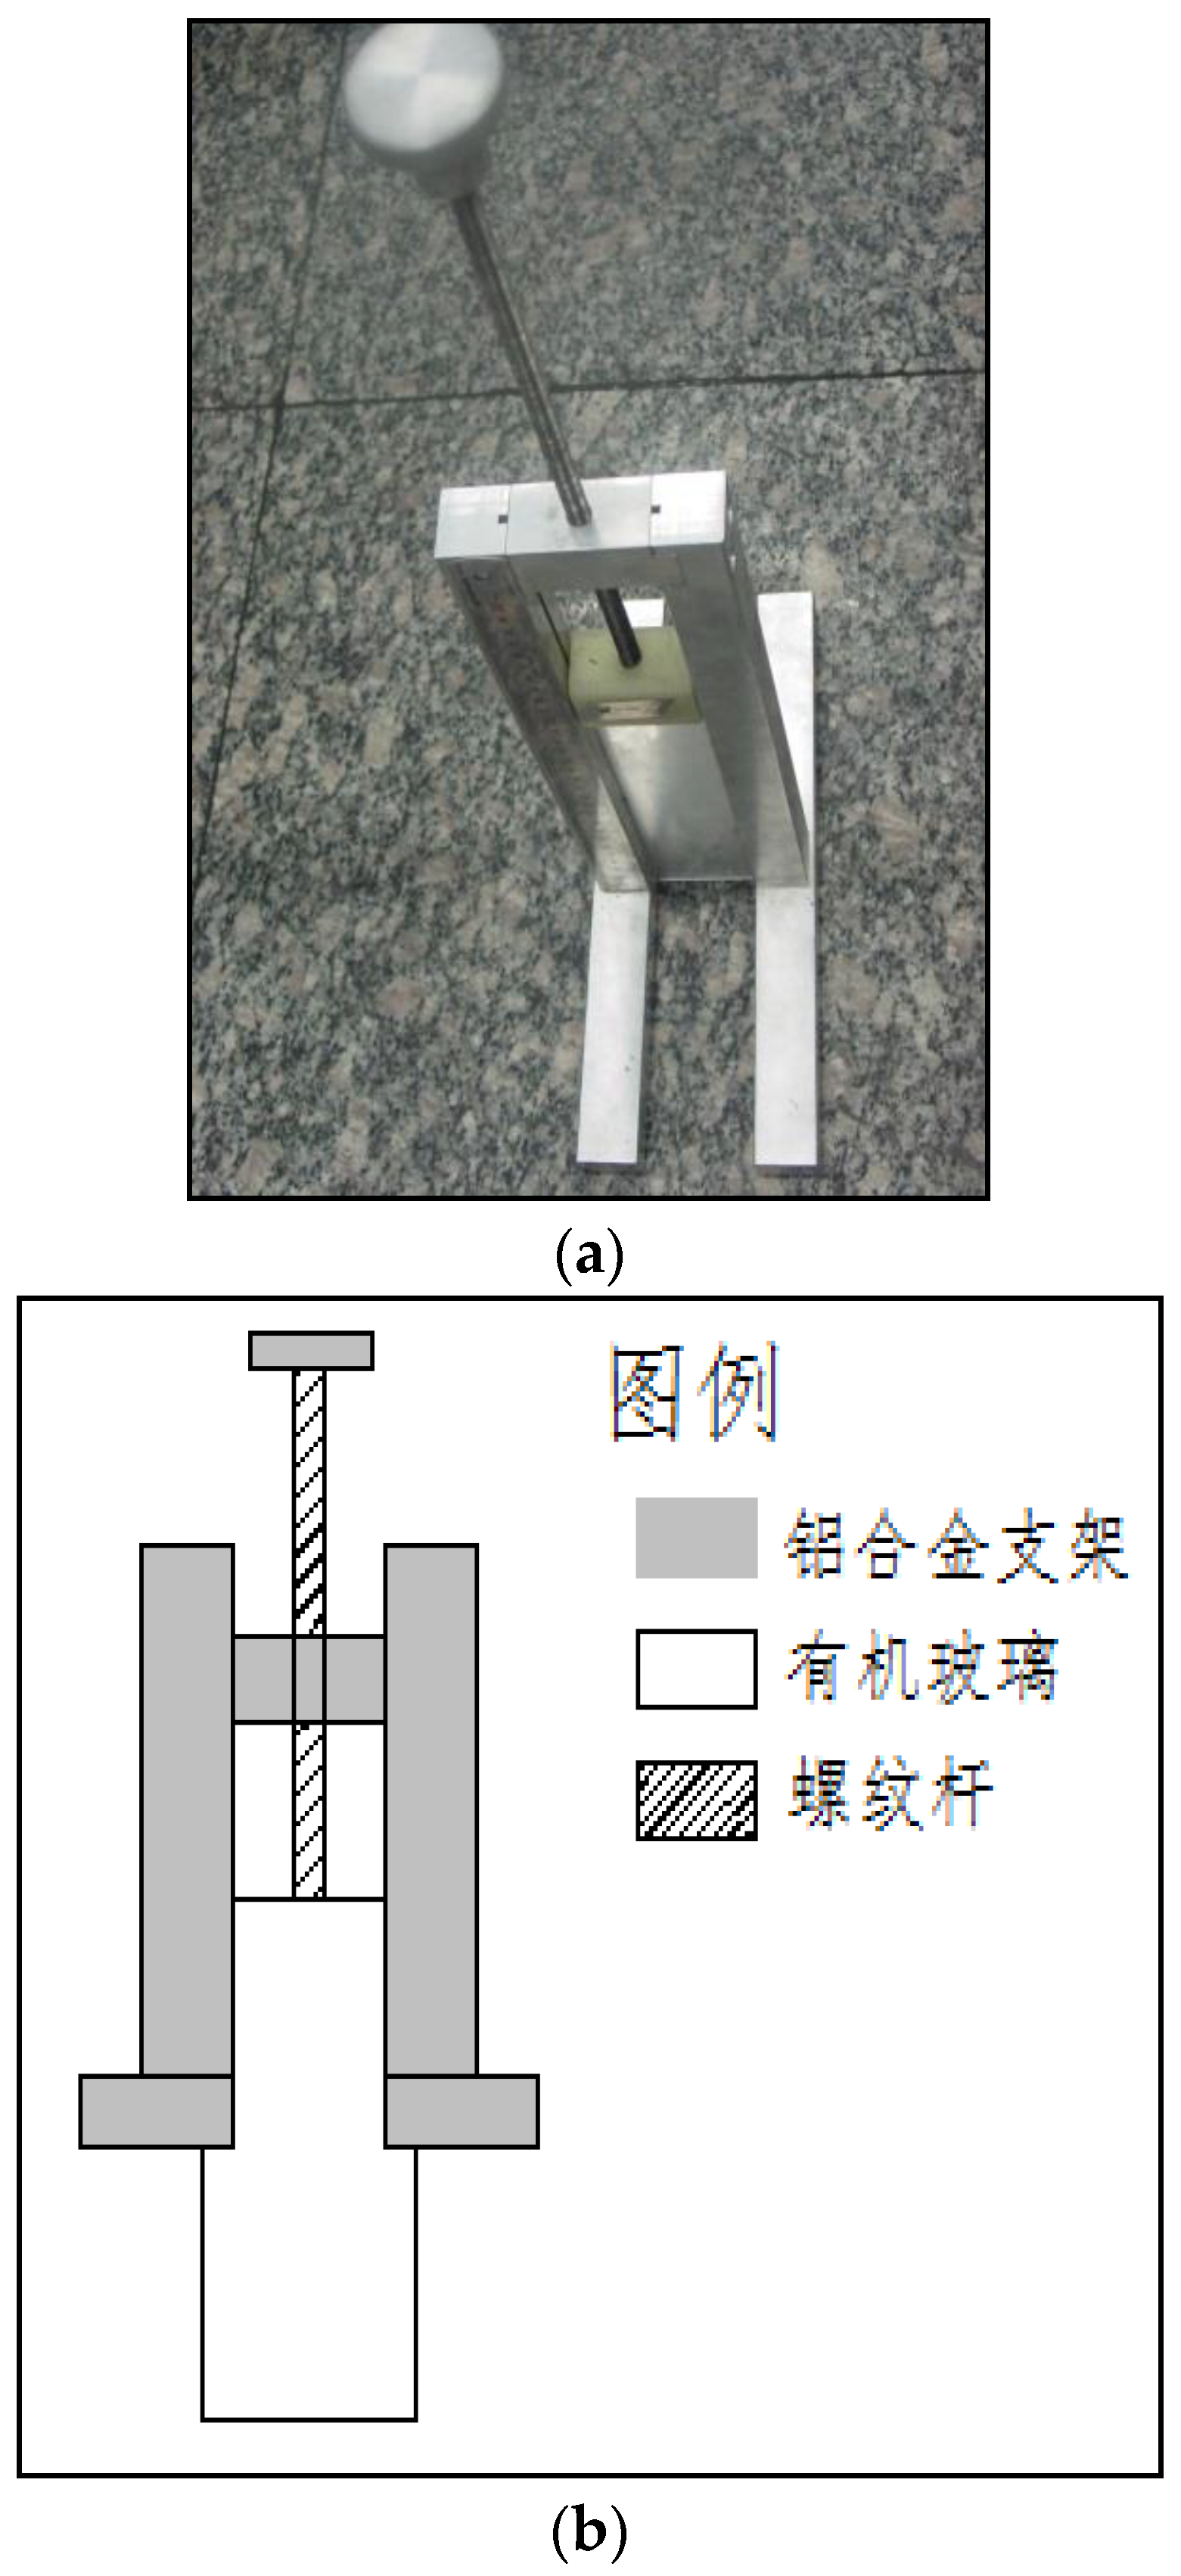
Figure 2.
(a)Pouring the mixture into the mold; (b)setting the tool on the mold, vertically adjust the glass plate by rotating the threaded rod and horizontally remove the tool, so that the glass plate can ‘flatten’ the mixture;(c)the mixture is paved flatly in the mold.
Figure 2.
(a)Pouring the mixture into the mold; (b)setting the tool on the mold, vertically adjust the glass plate by rotating the threaded rod and horizontally remove the tool, so that the glass plate can ‘flatten’ the mixture;(c)the mixture is paved flatly in the mold.
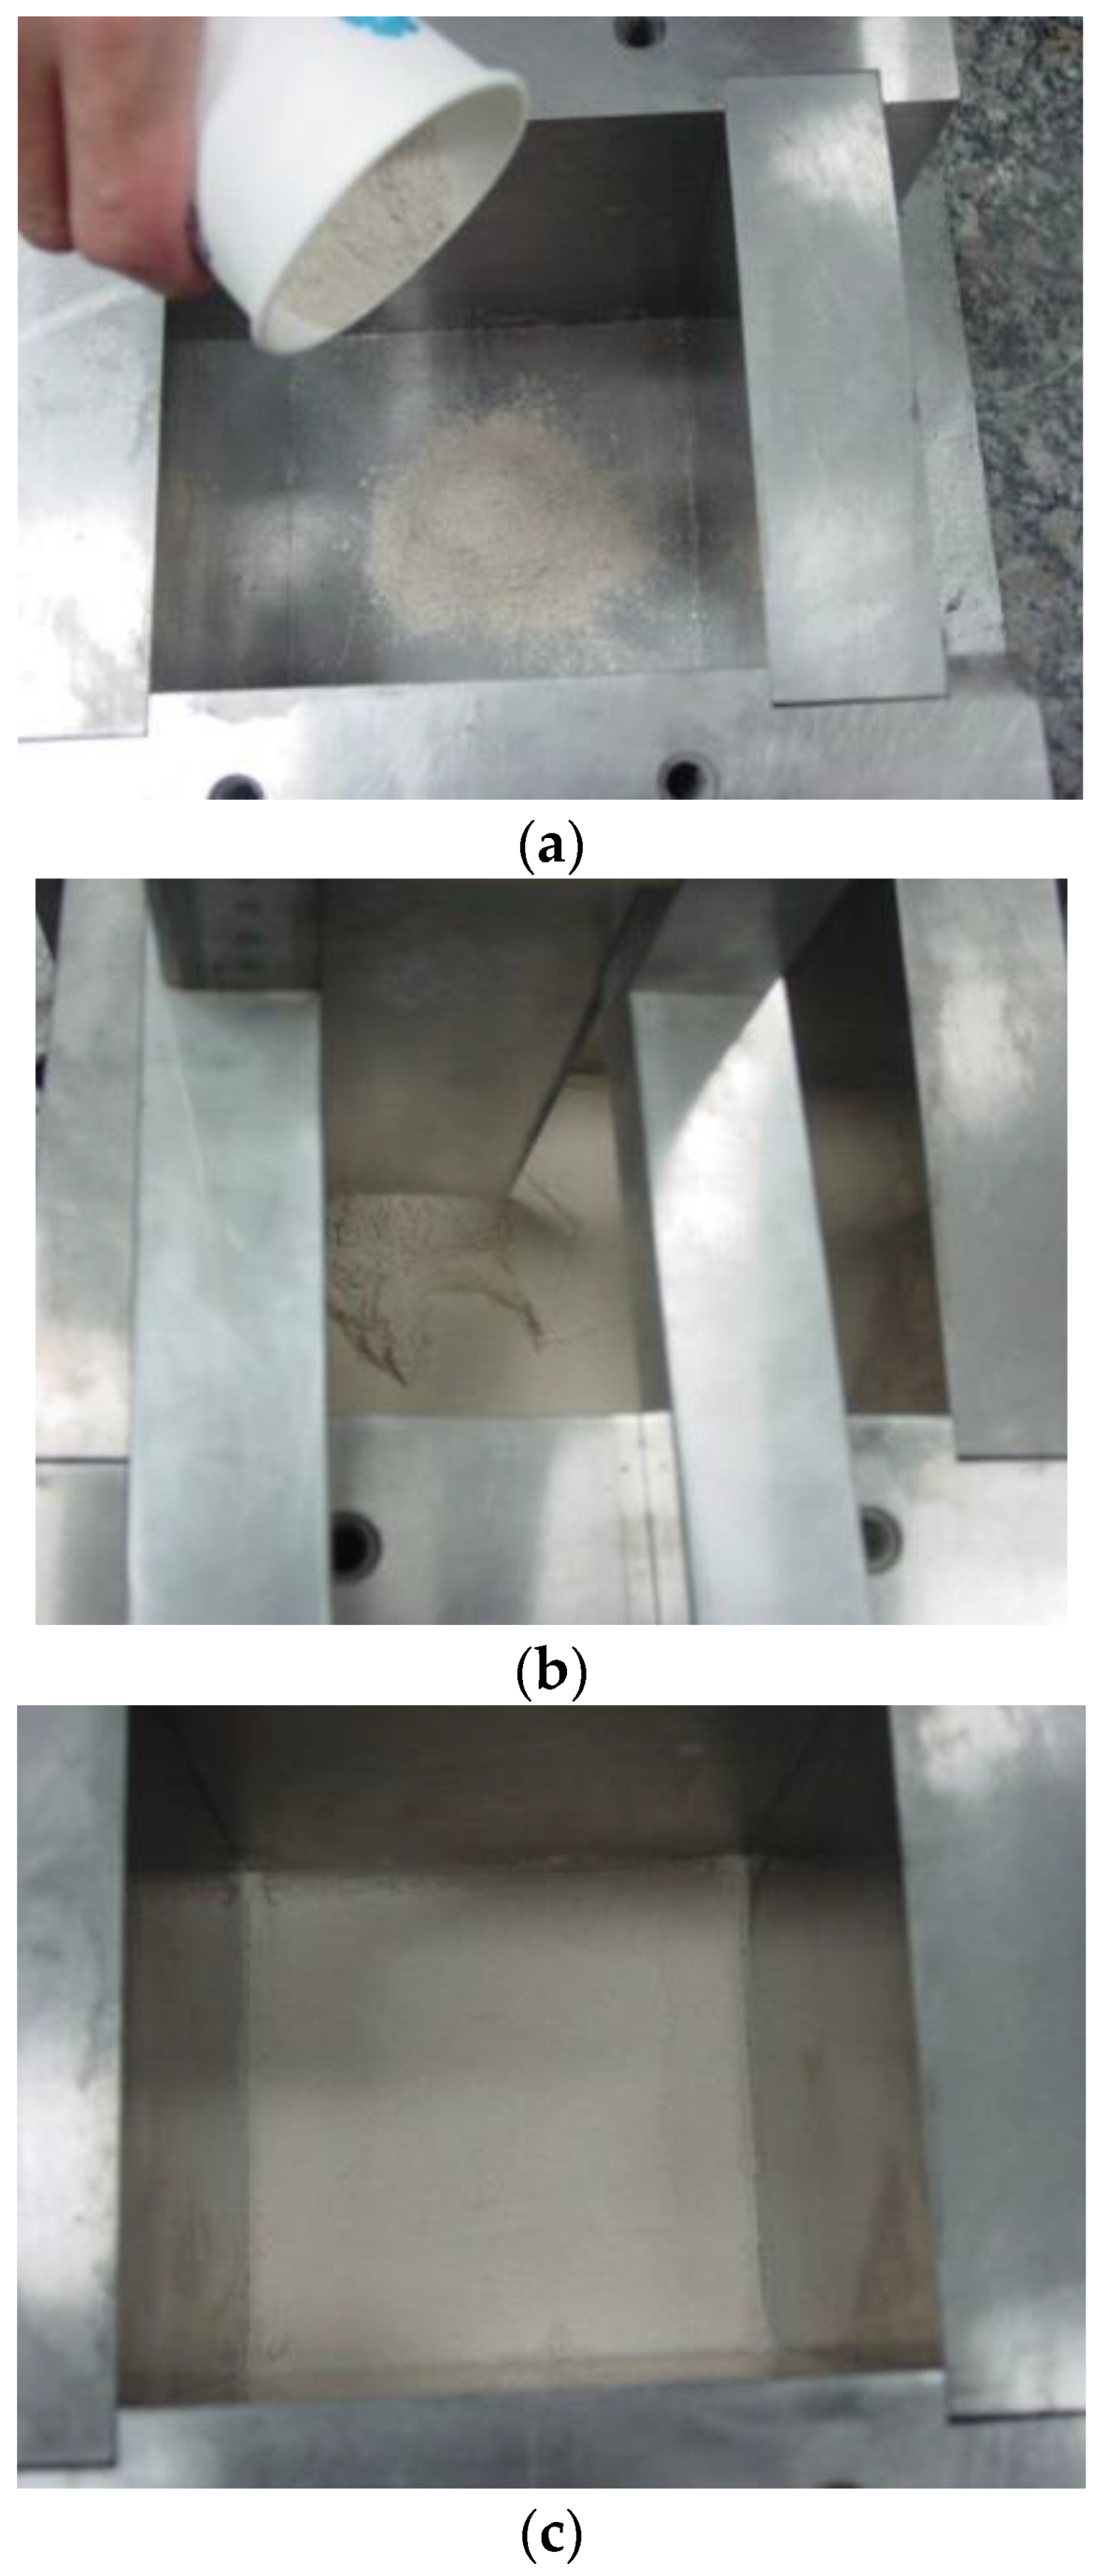
Figure 3.
(a)Four groups of samples with different porosities, (b) A section of the fractured sample, (c) SEM image of the pore structure in the section, (d) SEM image of the fracture structure in the section.
Figure 3.
(a)Four groups of samples with different porosities, (b) A section of the fractured sample, (c) SEM image of the pore structure in the section, (d) SEM image of the fracture structure in the section.
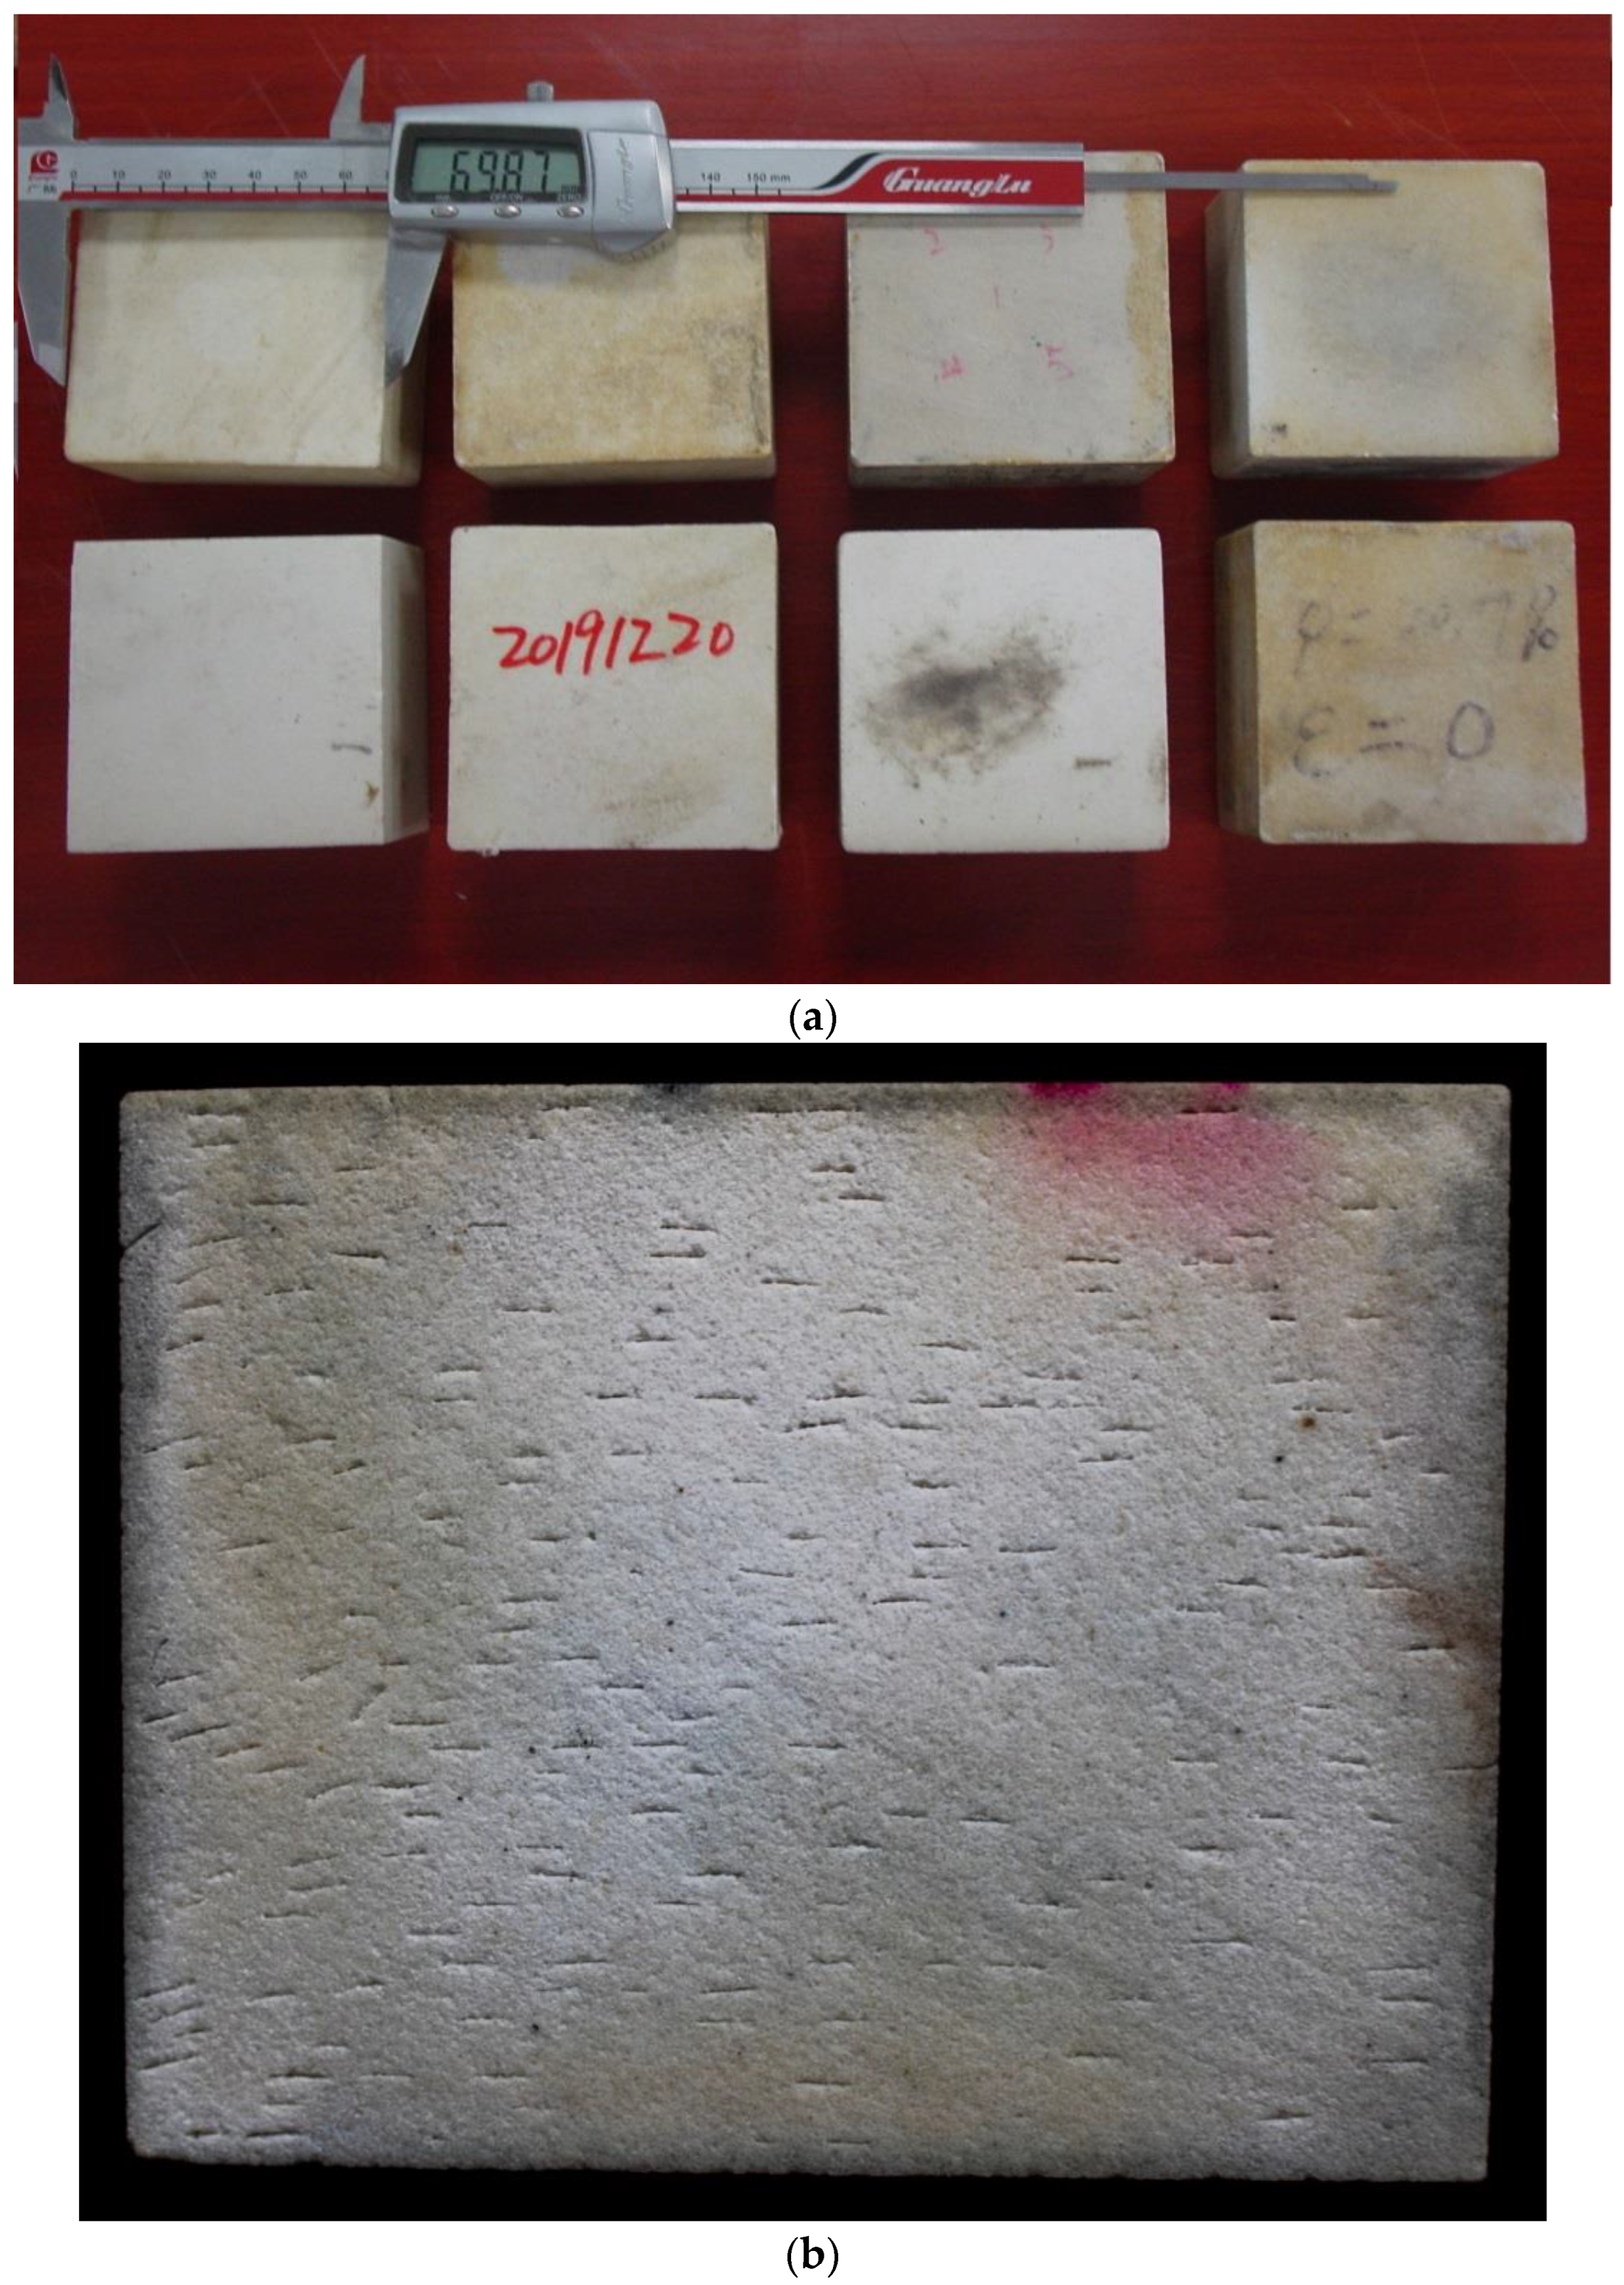
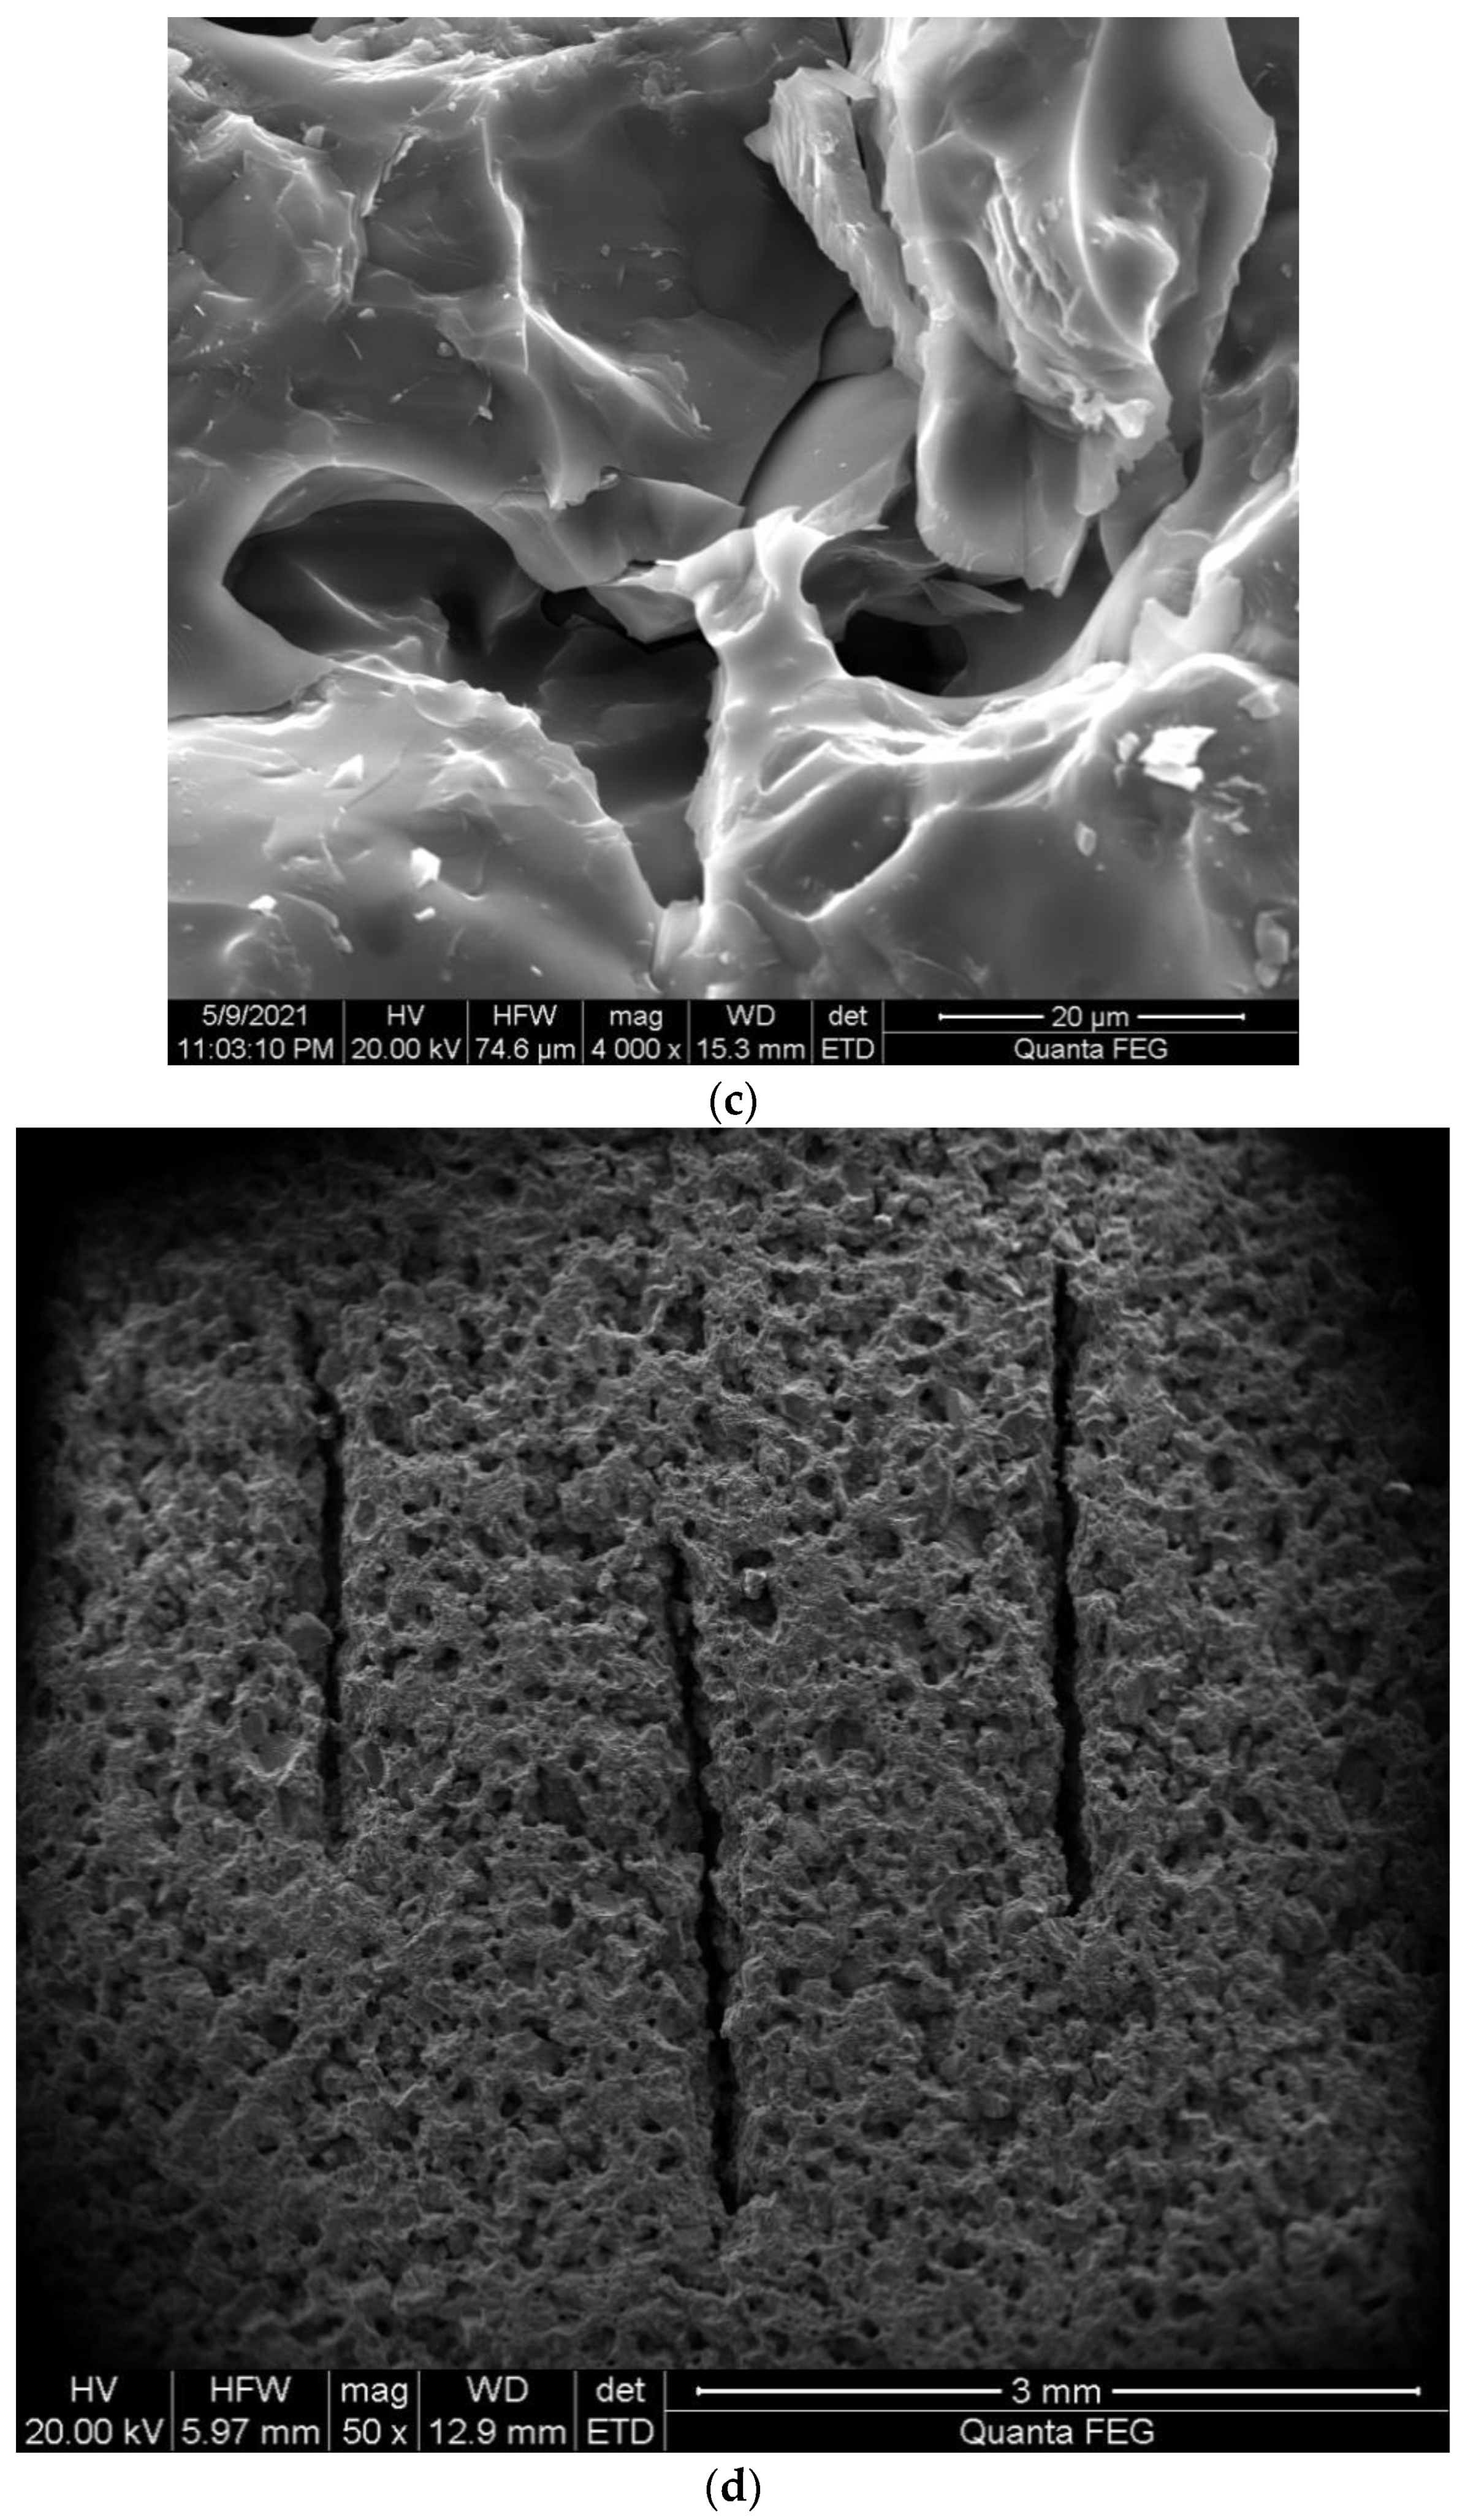
Figure 4.
P and S waveforms and amplitude spectra of blank samples. (a) P waveform, (b) P wave amplitude spectrum, (c) S waveform, and (d) S wave amplitude spectrum.
Figure 4.
P and S waveforms and amplitude spectra of blank samples. (a) P waveform, (b) P wave amplitude spectrum, (c) S waveform, and (d) S wave amplitude spectrum.

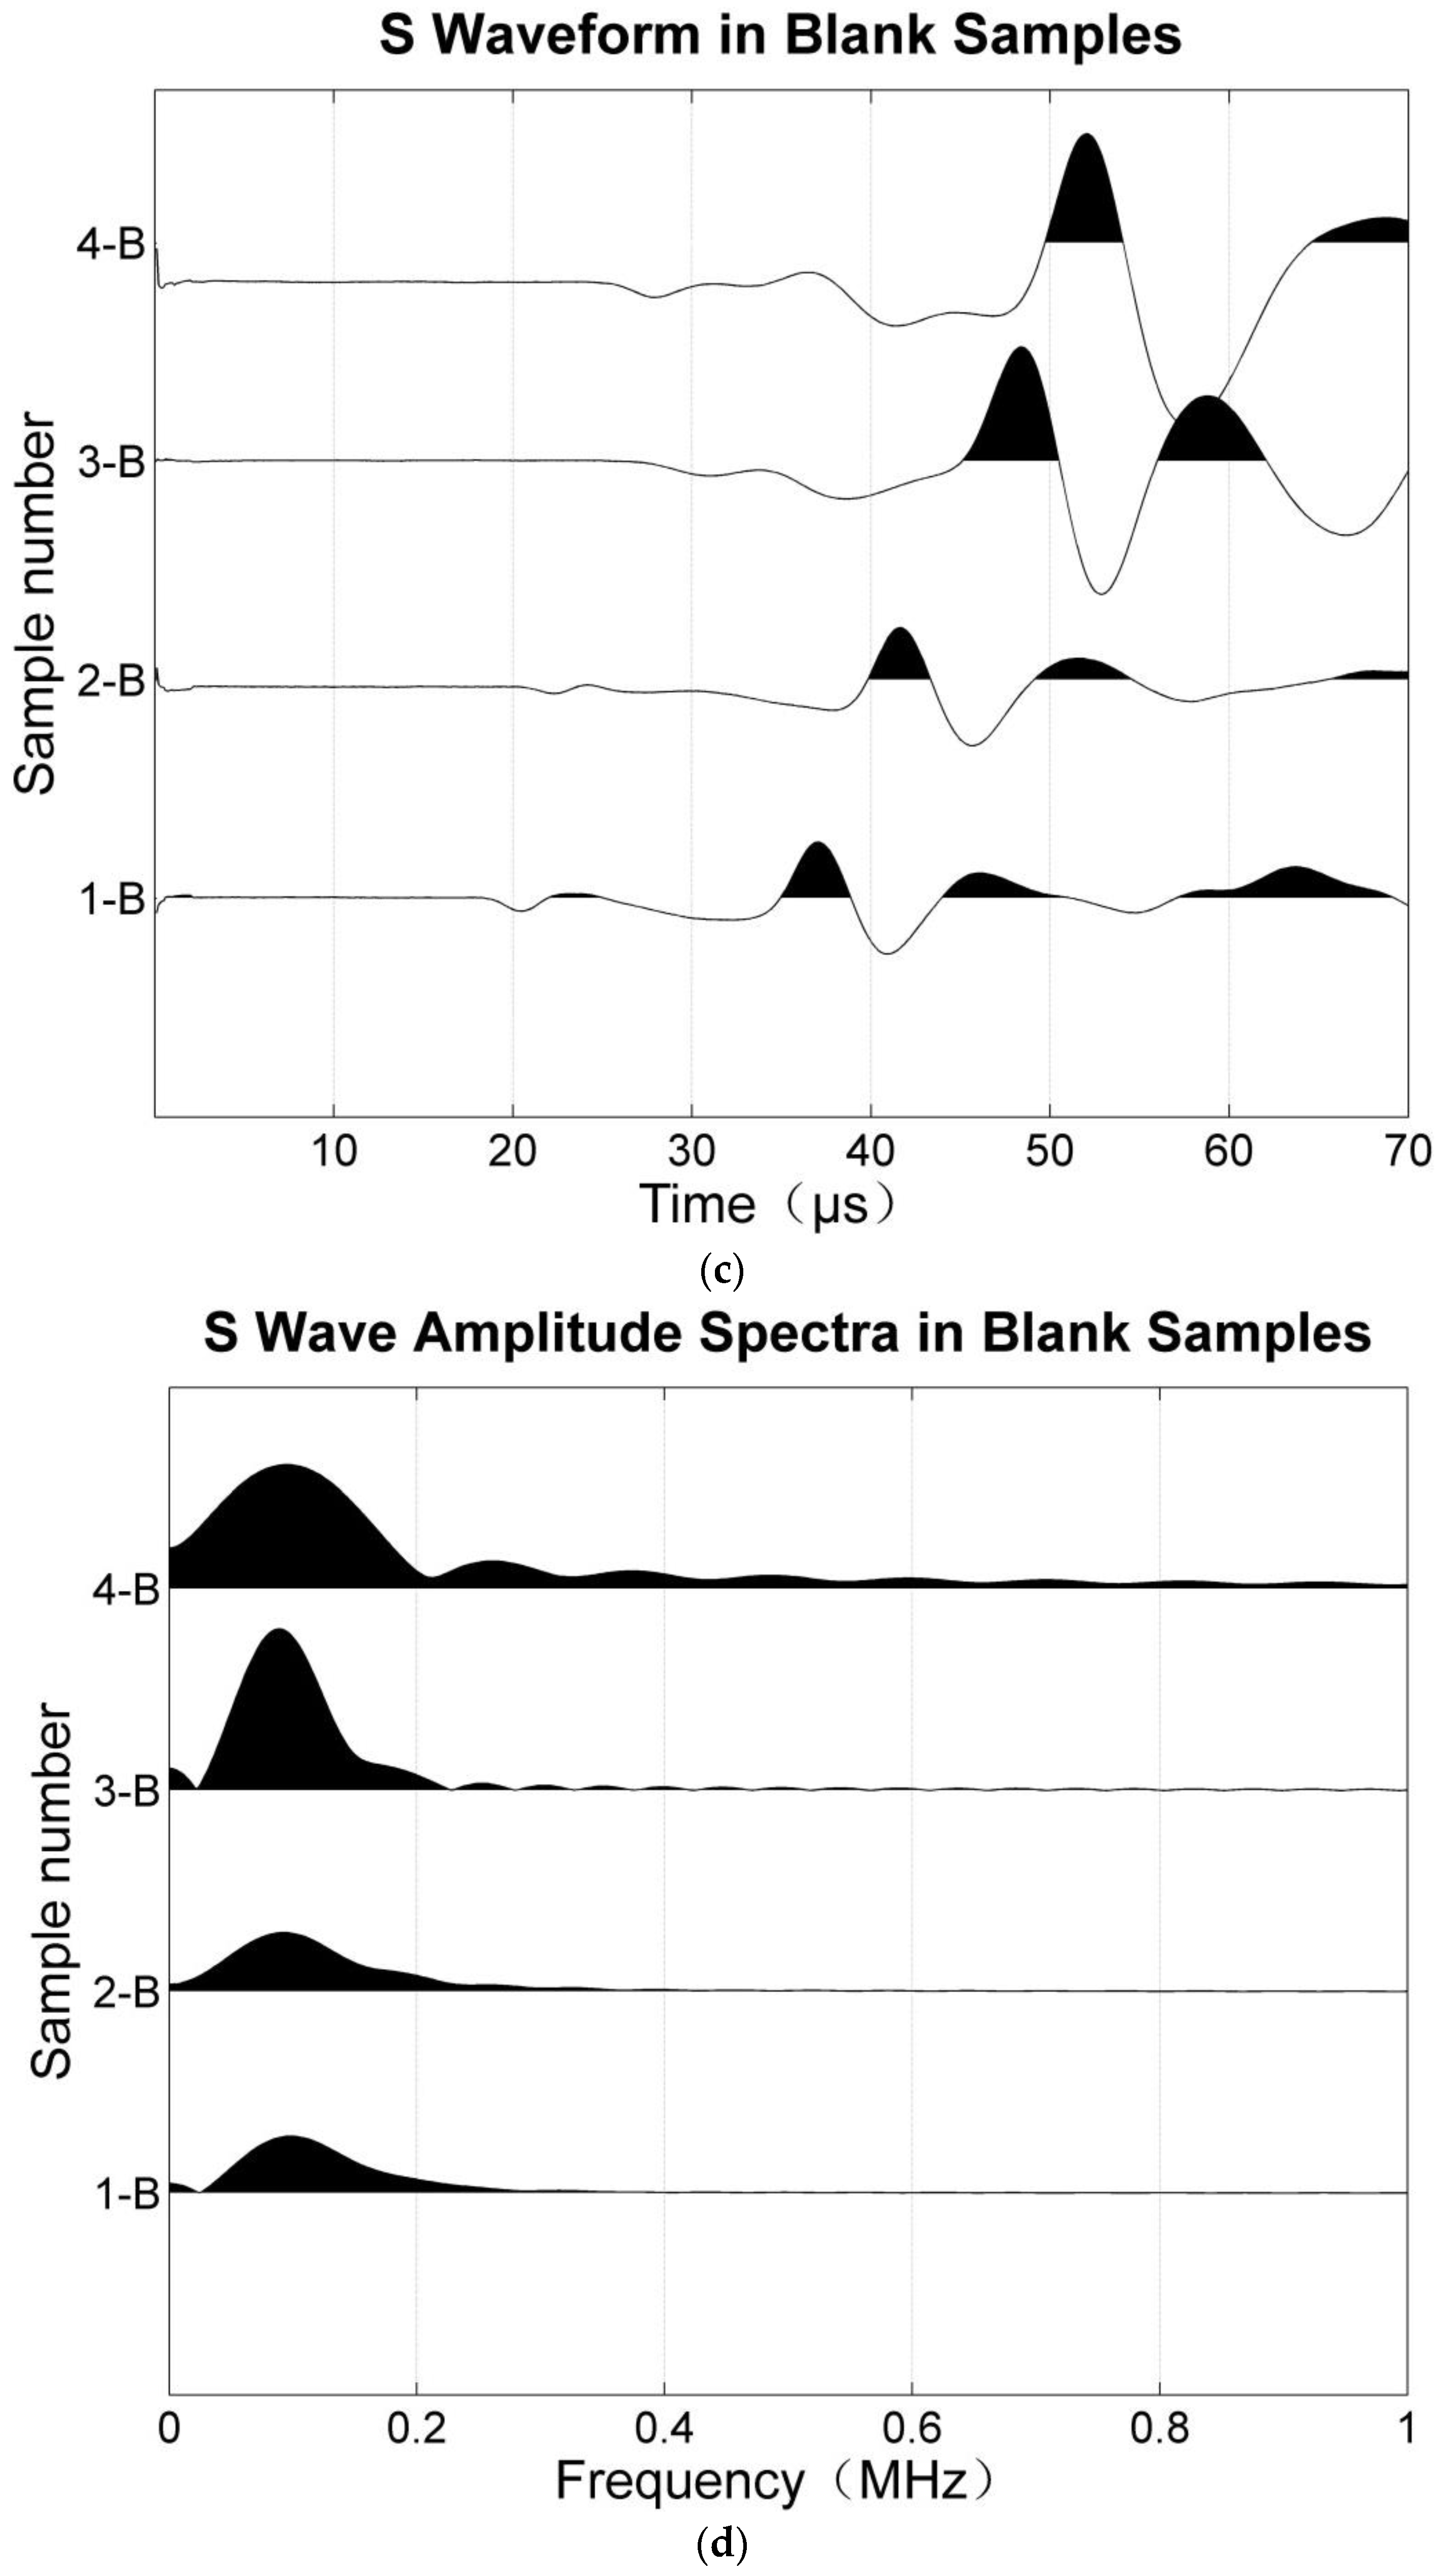
Figure 5.
P-wave (a) and shear wave (b) velocities in water saturated fractured samples(P wave velocity measurement error is smaller than the size of labels).
Figure 5.
P-wave (a) and shear wave (b) velocities in water saturated fractured samples(P wave velocity measurement error is smaller than the size of labels).
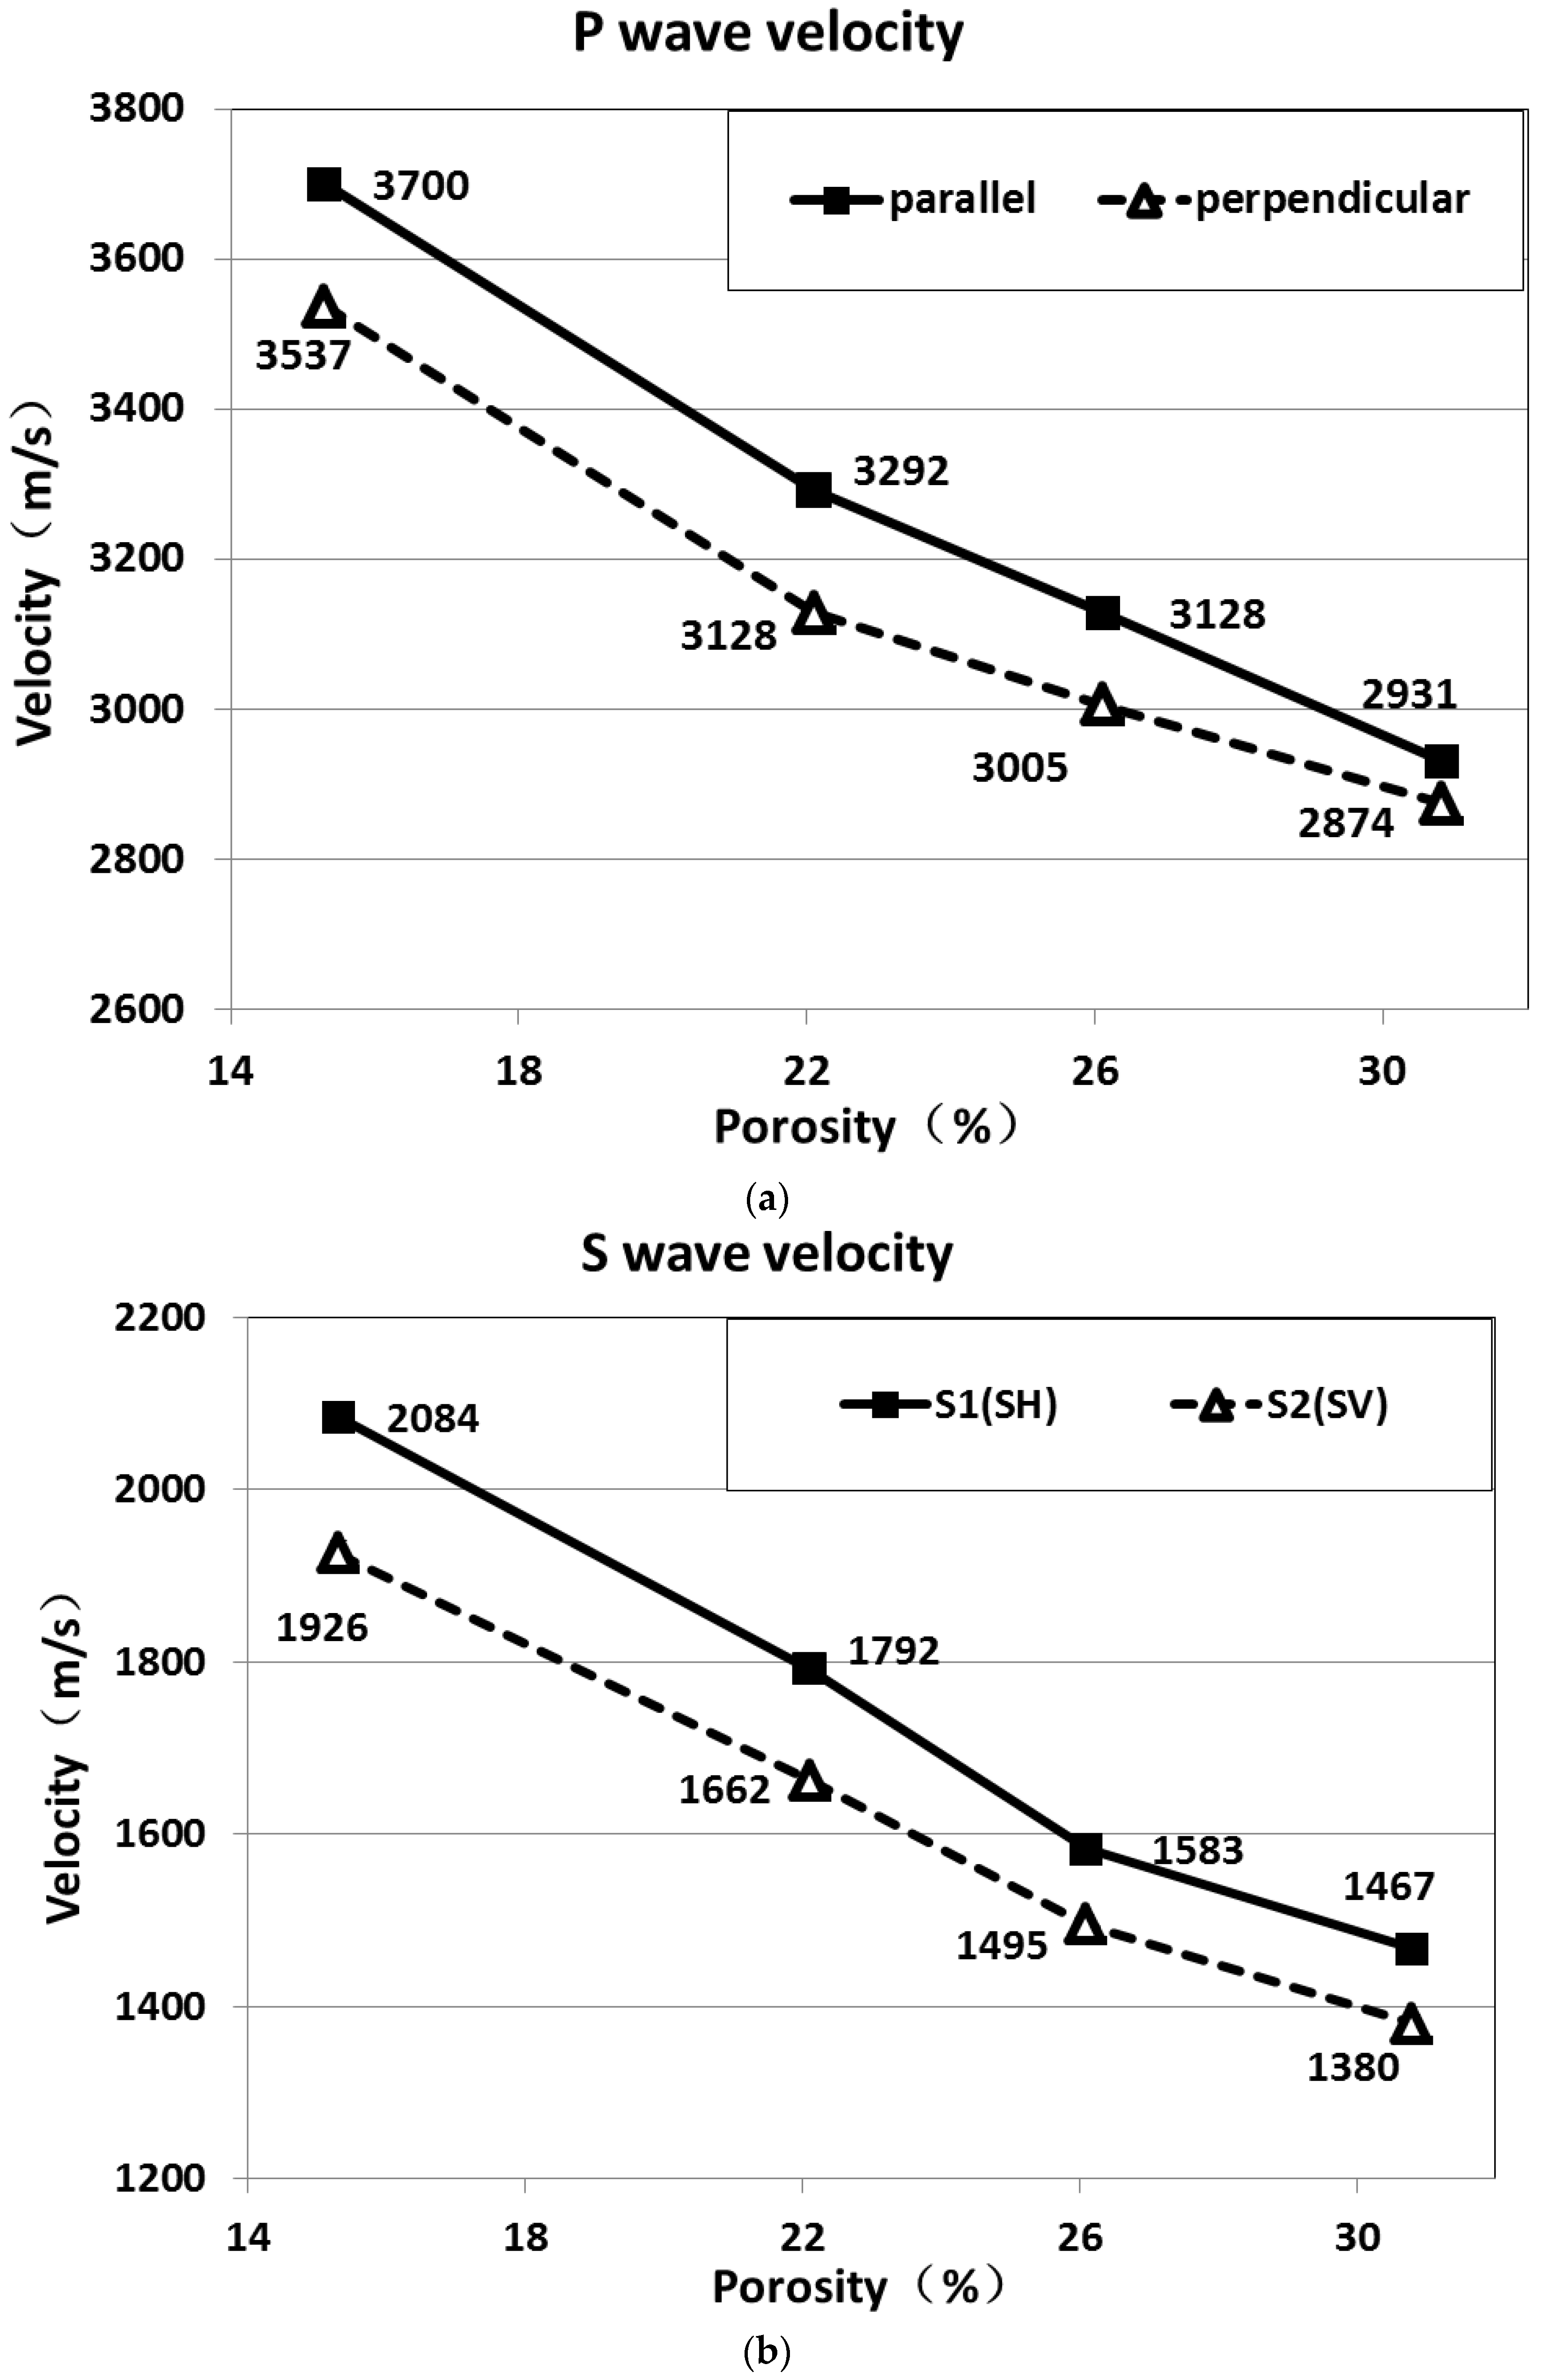
Figure 6.
P-wave anisotropy and shear wave splitting (SWS) in water saturated blank samples.
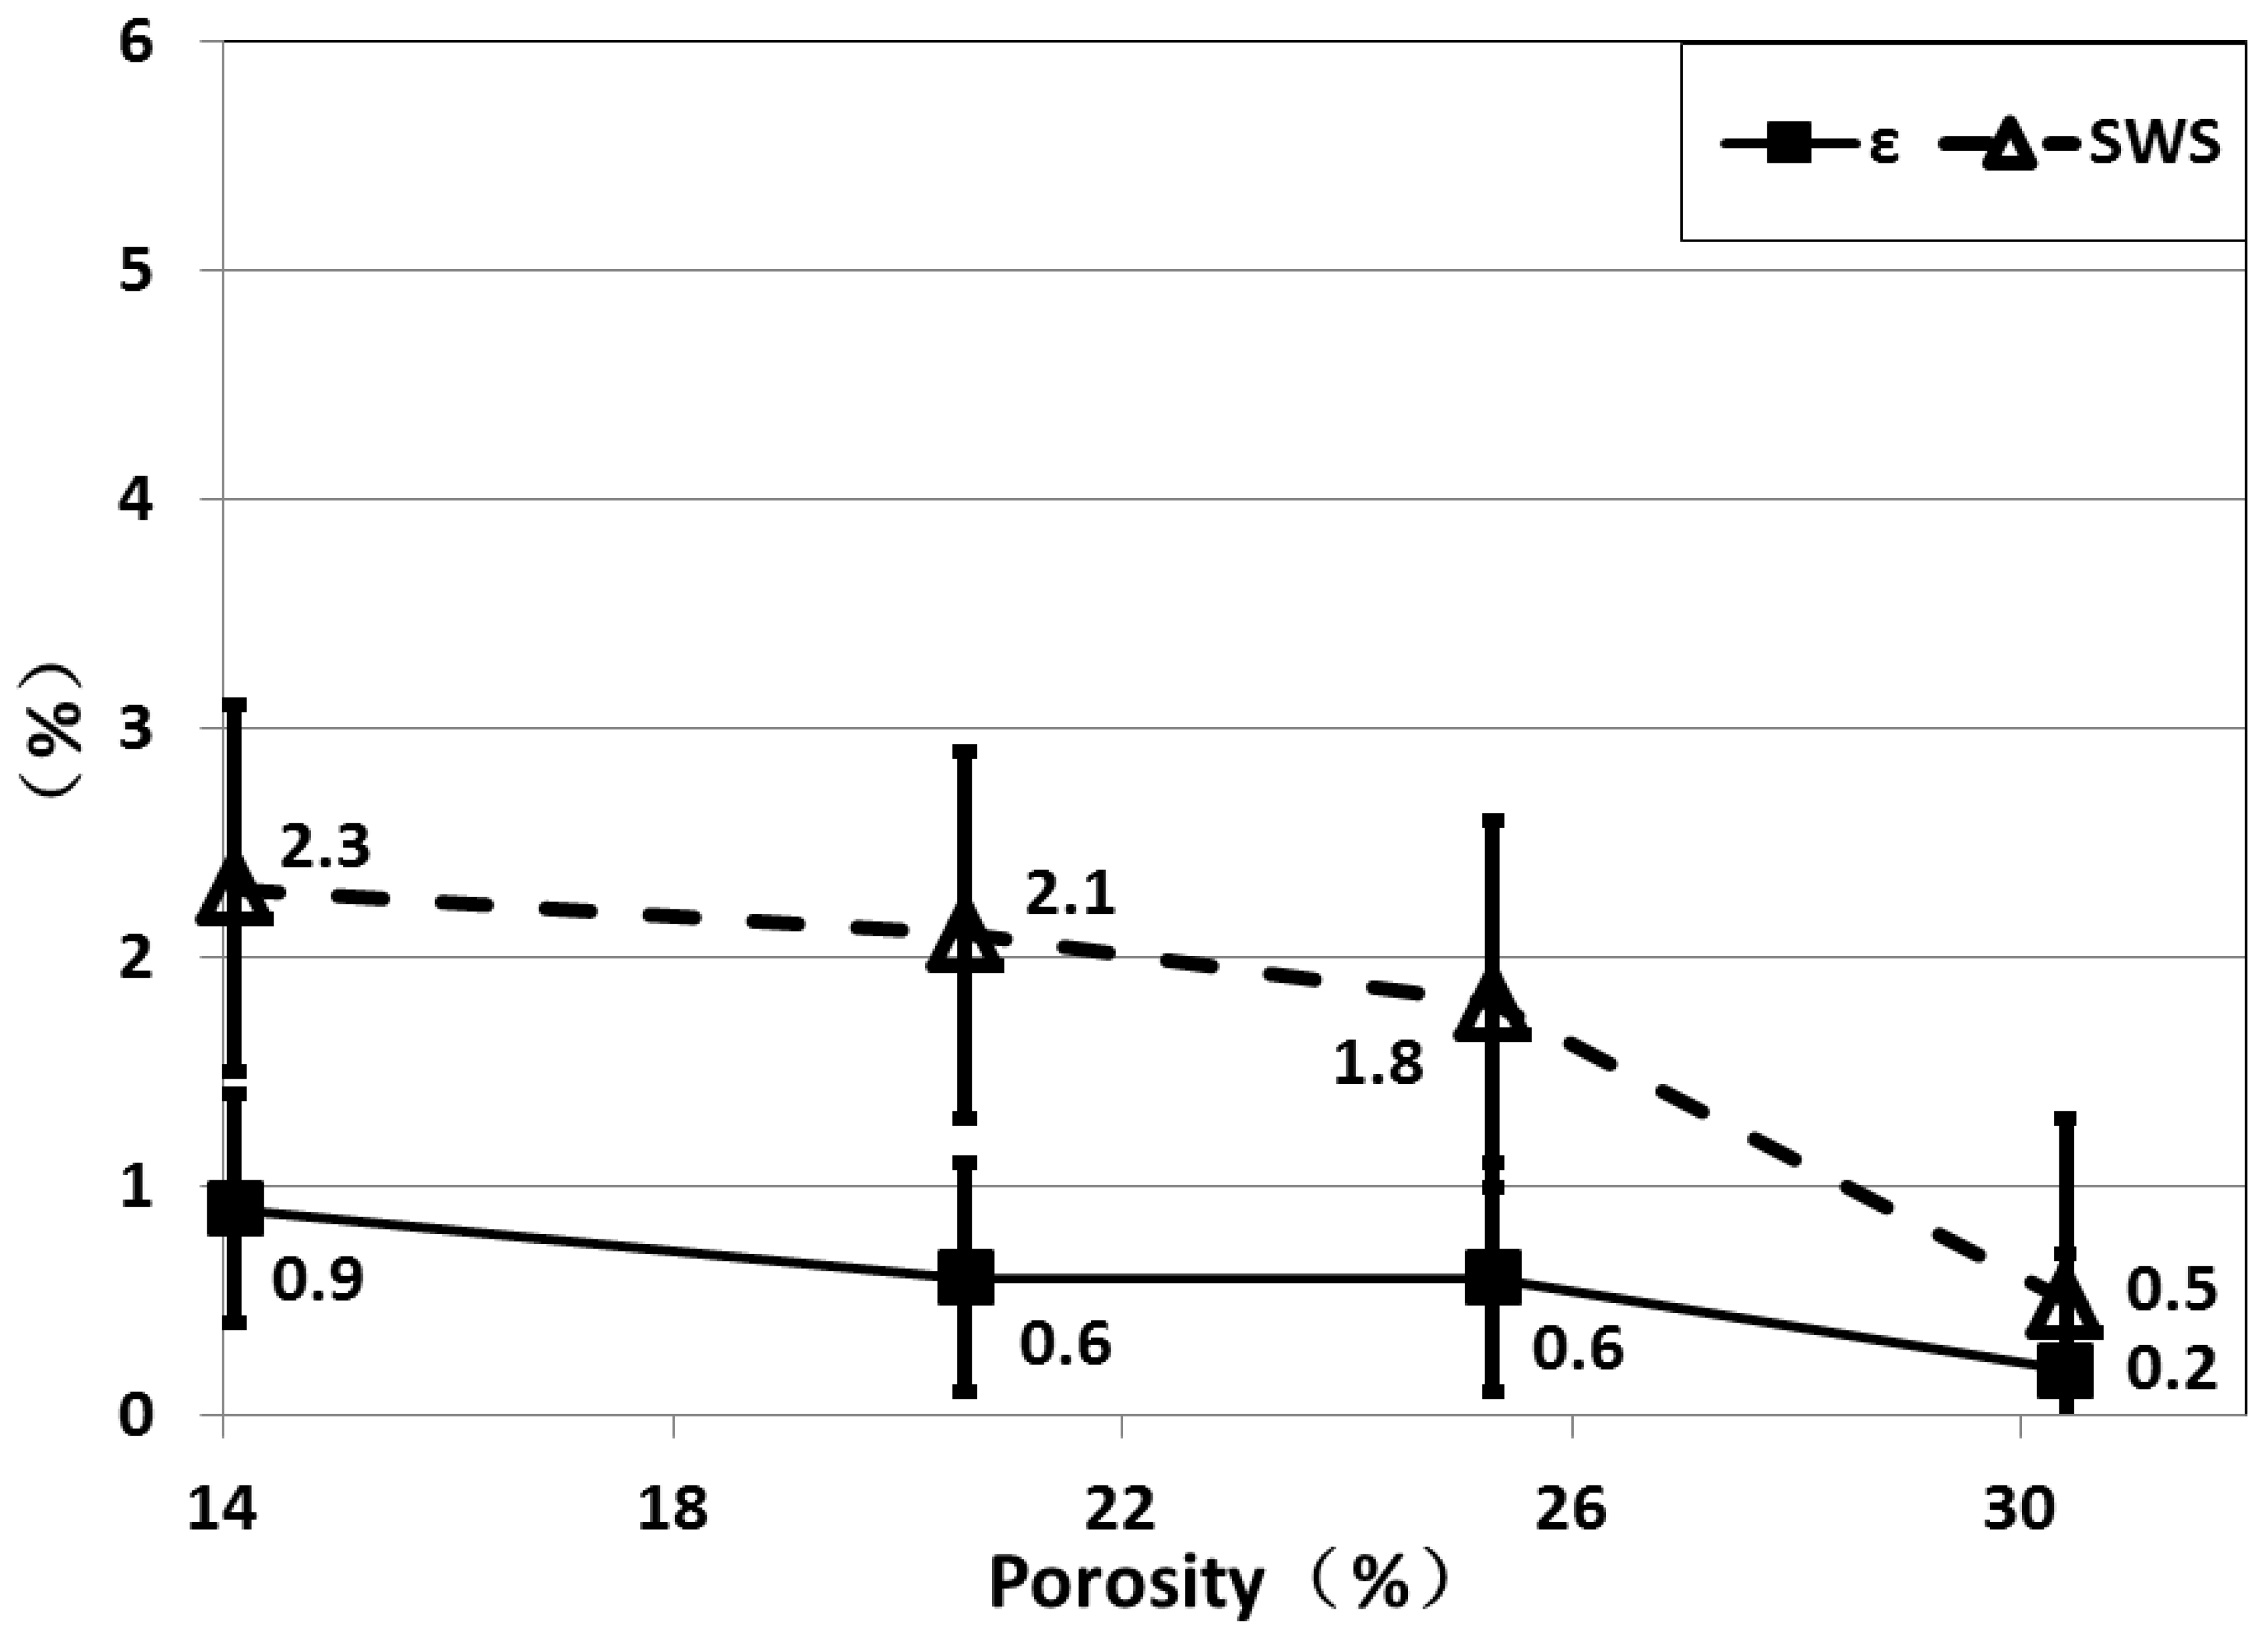
Figure 7.
Fracture induced P-wave anisotropy variation with porosity.
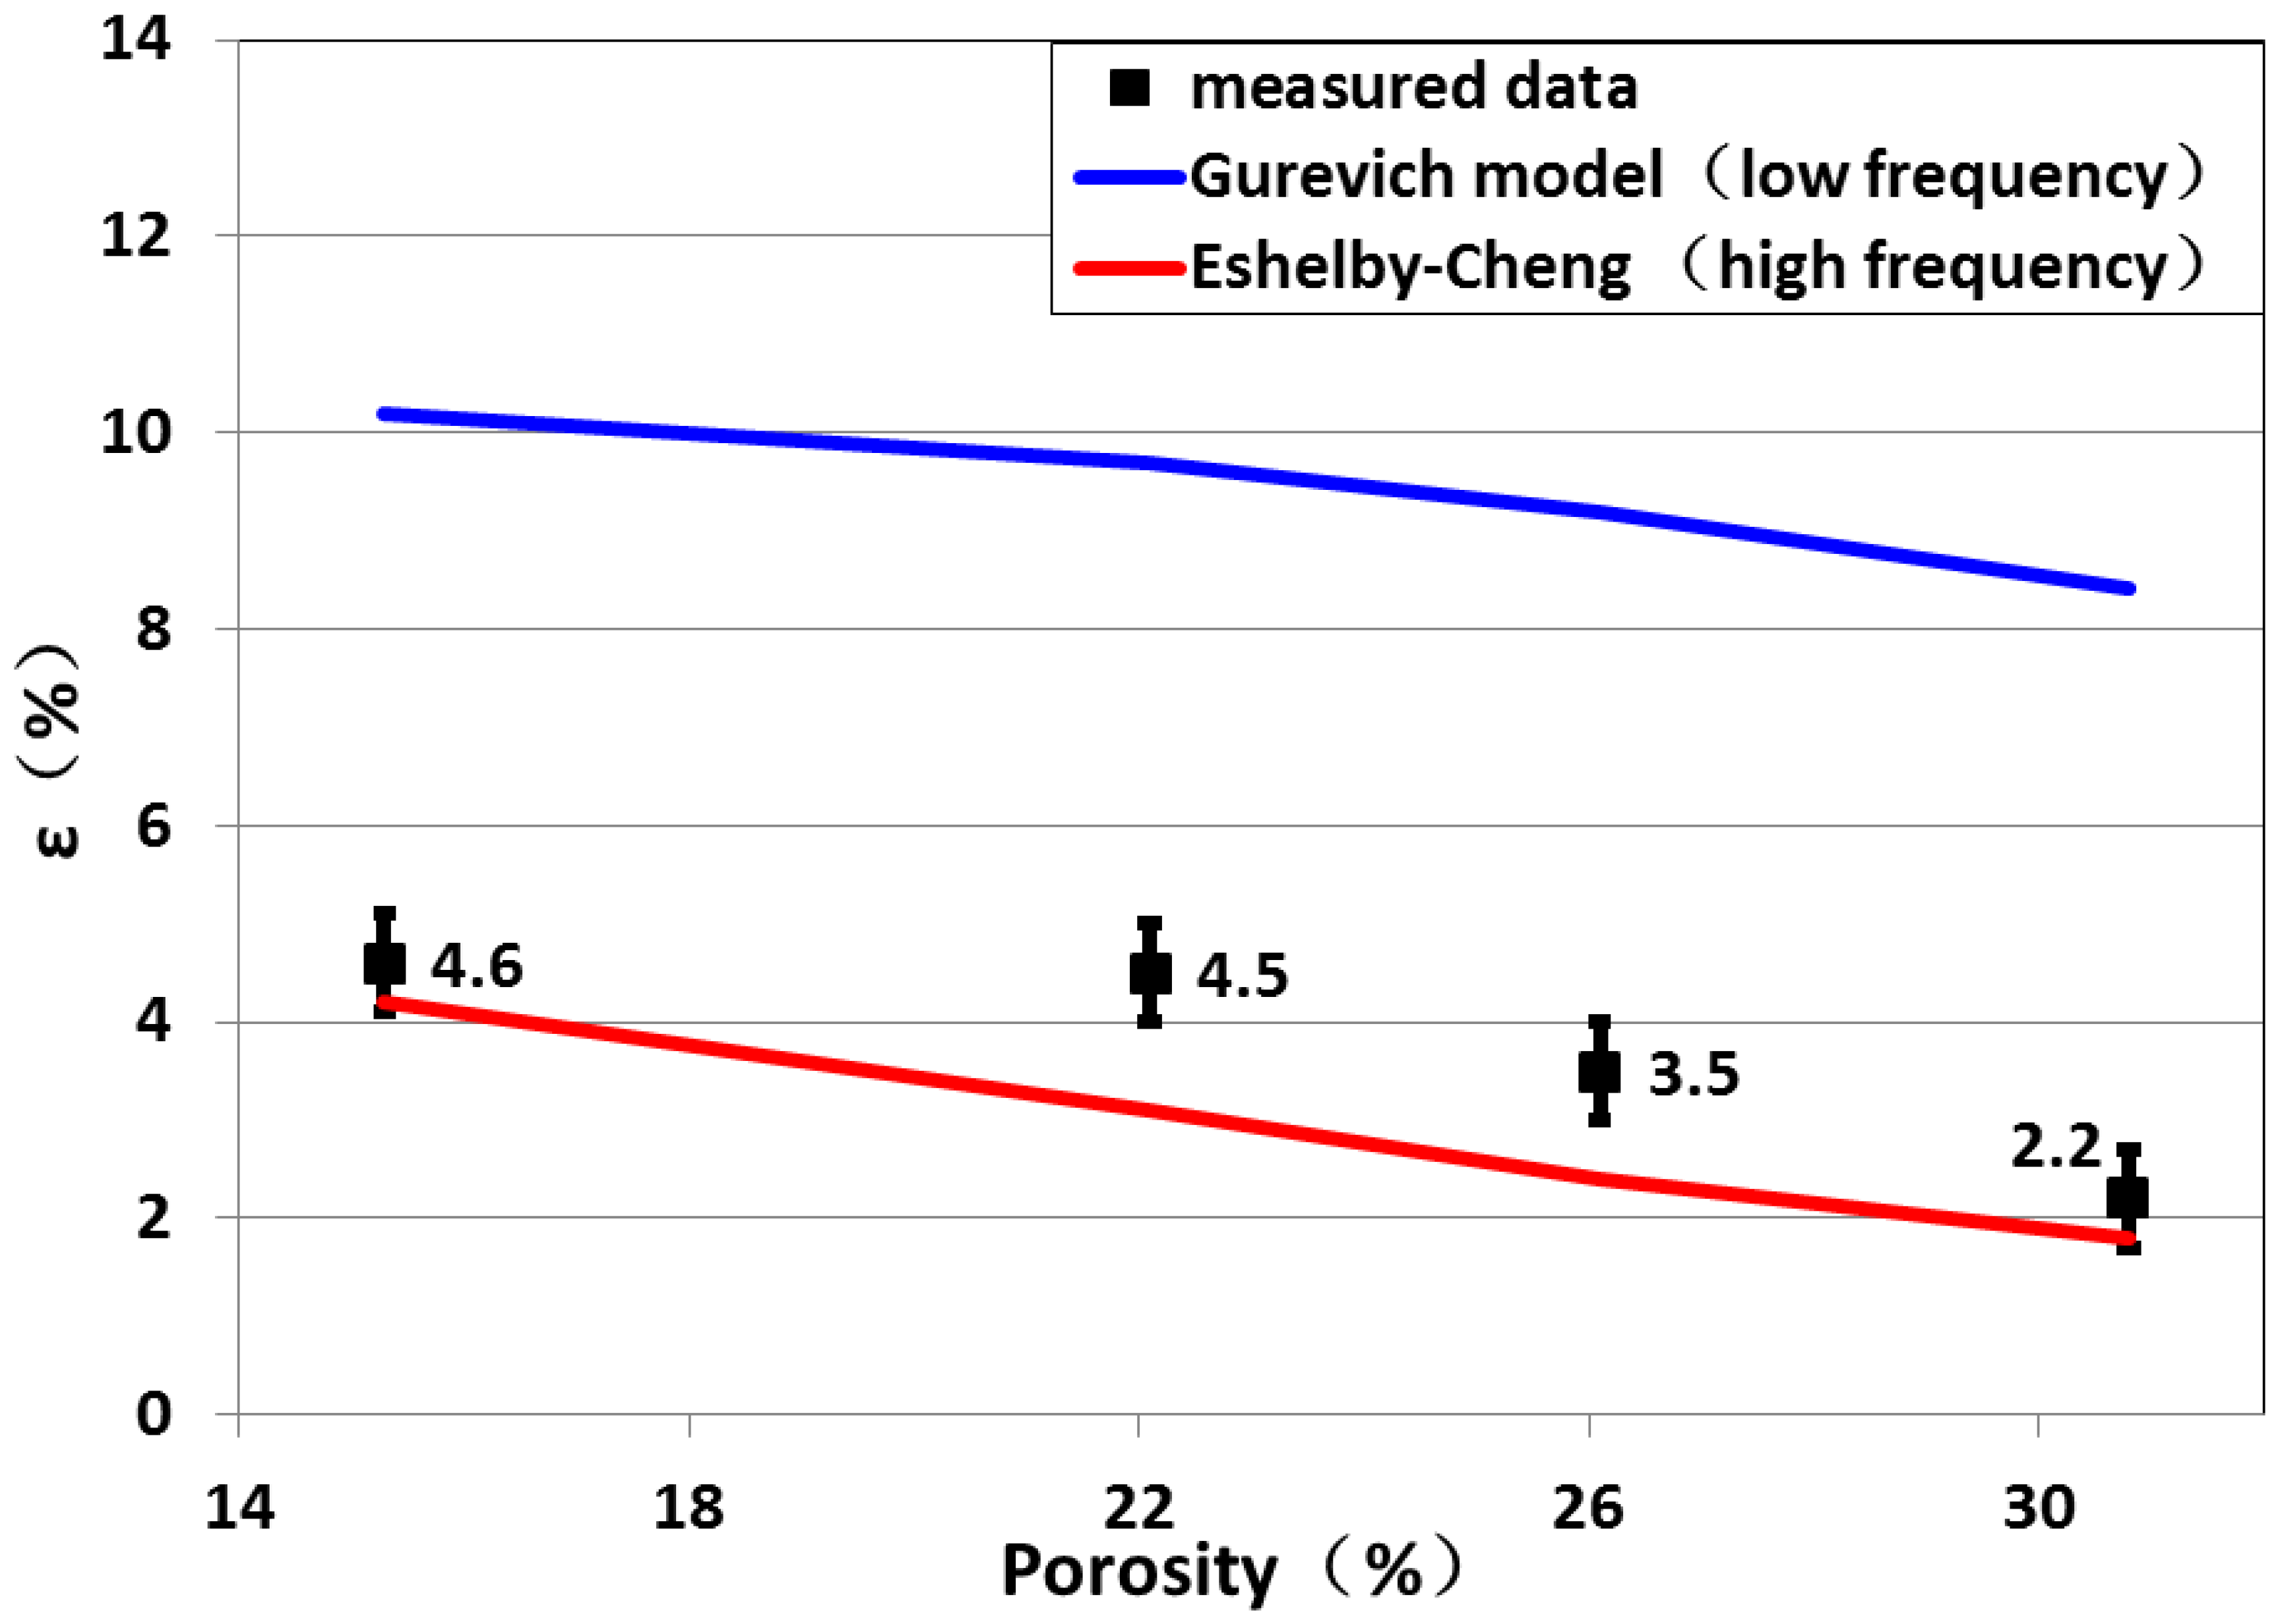
Figure 8.
Fracture induced SWS variation with porosity.
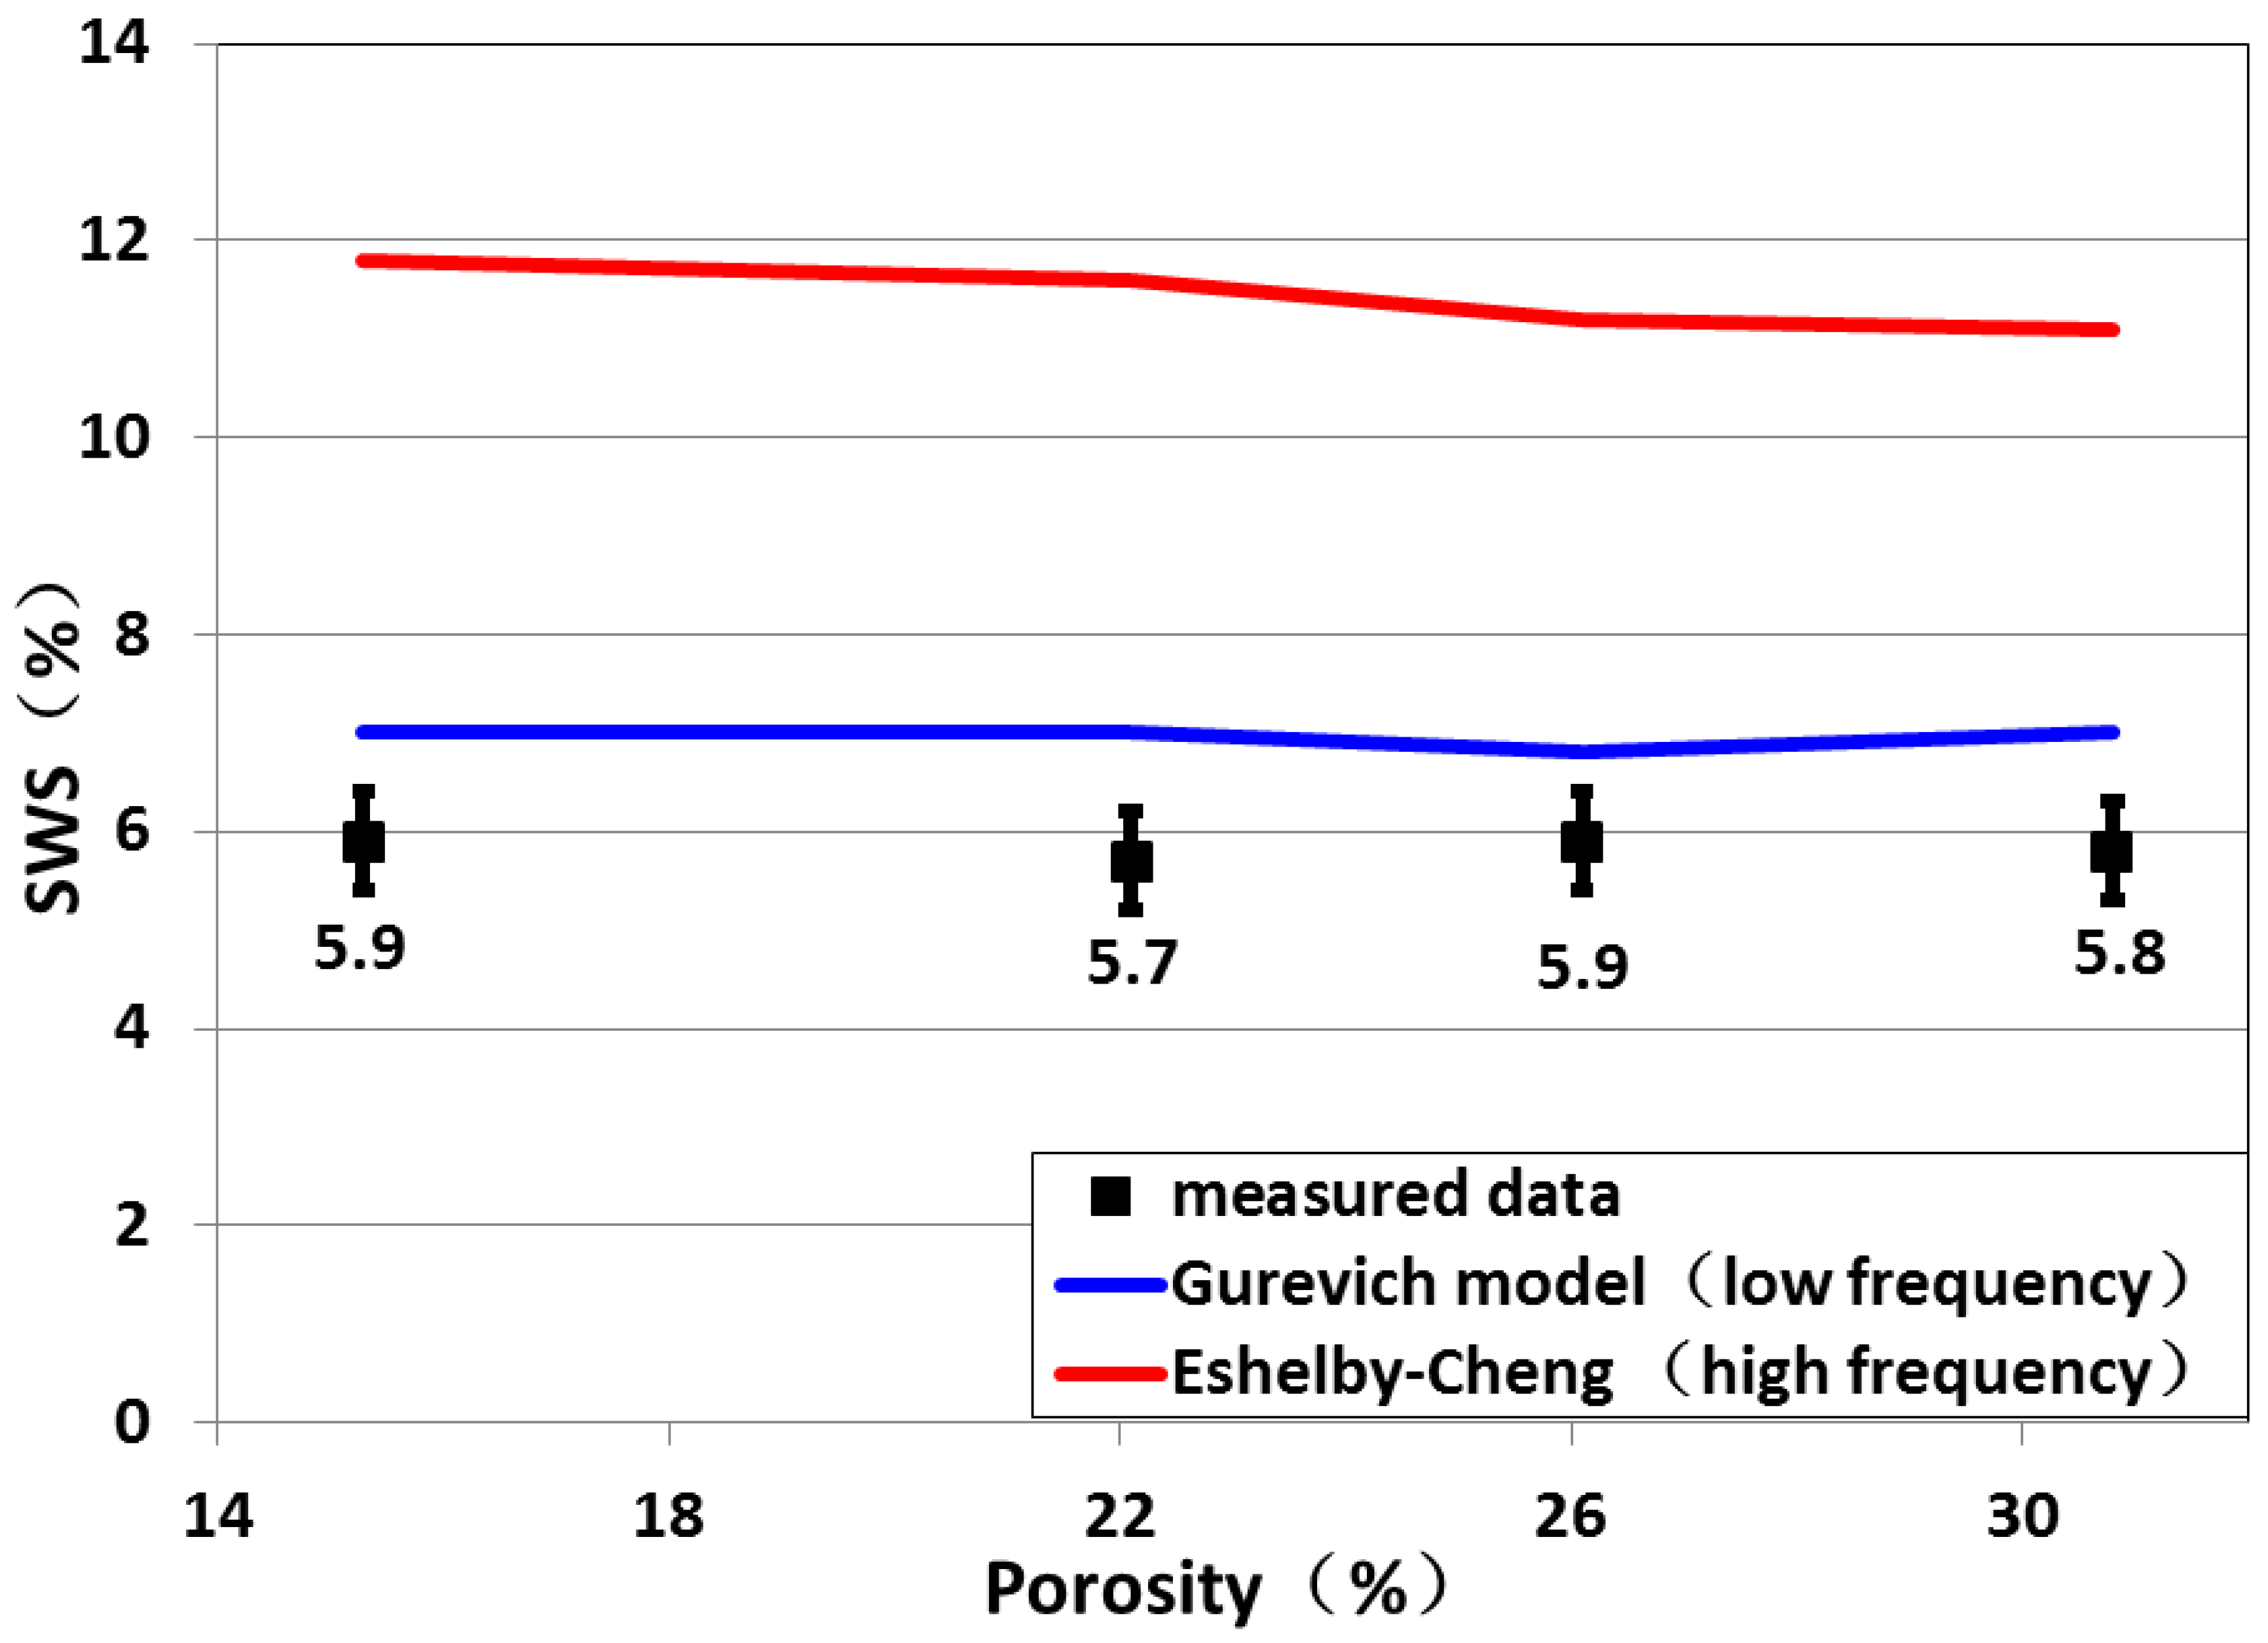

Table 1.
Physical parameters of the three sample groups (Water saturated).
| Group 1 | Group 2 | Group 3 | Group 4 | |||||
|---|---|---|---|---|---|---|---|---|
| 1-B | 1-F | 2-B | 2-F | 3-B | 3-F | 4-B | 4-F | |
| Fracture Density | 0 | 0.06 | 0 | 0.06 | 0 | 0.06 | 0 | 0.06 |
| Fracture aspect ratio | / | 0.018 | / | 0.018 | / | 0.018 | / | 0.018 |
| Porosity (%) | 14.1 | 15.3 | 20.6 | 22.1 | 25.3 | 26.1 | 30.4 | 30.8 |
| Fracture porosity (%) | / | 0.75 | / | 0.75 | / | 0.75 | / | 0.75 |
| Bulk density (g/cm3) | 2.22 | 2.21 | 2.16 | 2.15 | 2.07 | 2.05 | 2.03 | 2.03 |
| Compression pressure (MPa) | 186 | 186 | 53 | 53 | 21 | 21 | 15 | 15 |
Table 2.
P and S wave velocities in blank samples (Water saturated).
| Porosity | P wave velocity (m/s) | S wave velocity (m/s) | |||
|---|---|---|---|---|---|
| (%) | Parallel | perpendicular | S1 | S2 | |
| 1-B | 14.1 | 3930 | 3896 | 2170 | 2120 |
| 2-B | 20.6 | 3442 | 3420 | 1857 | 1820 |
| 3-B | 25.3 | 3128 | 3005 | 1583 | 1495 |
| 4-B | 30.4 | 2817 | 2811 | 1397 | 1390 |
Table 3.
Main inputs for equivalent medium theories.
| Samplenumber | Background matrix modulus (GPa) | Grain modulus(GPa) | Fluid modulus (GPa) | ||||
| 1-F | 7.05 | 7.41 | 20.36 | 10.45 | 30.6 | 24.5 | 2.15 |
| 2-F | 5.52 | 5.82 | 15.66 | 7.45 | 30.6 | 24.5 | 2.15 |
| 3-F | 4.69 | 4.14 | 13.33 | 5.19 | 30.6 | 24.5 | 2.15 |
| 4-F | 3.12 | 3.11 | 10.83 | 3.96 | 30.6 | 24.5 | 2.15 |
Disclaimer/Publisher’s Note: The statements, opinions and data contained in all publications are solely those of the individual author(s) and contributor(s) and not of MDPI and/or the editor(s). MDPI and/or the editor(s) disclaim responsibility for any injury to people or property resulting from any ideas, methods, instructions or products referred to in the content. |
© 2023 by the authors. Licensee MDPI, Basel, Switzerland. This article is an open access article distributed under the terms and conditions of the Creative Commons Attribution (CC BY) license (http://creativecommons.org/licenses/by/4.0/).
Copyright: This open access article is published under a Creative Commons CC BY 4.0 license, which permit the free download, distribution, and reuse, provided that the author and preprint are cited in any reuse.


