Submitted:
20 June 2023
Posted:
21 June 2023
Read the latest preprint version here
Abstract
Dental radiography plays a crucial role in clinical diagnosis, treatment, and prognosis. In recent years, researchers have explored cutting-edge technologies to develop automated systems that can analyze radiographic imagery and support medical practitioners. The field of Artificial Intelligence (AI) has witnessed rapid advancements, with various approaches being developed or improved upon. While Convolutional Neural Networks (CNNs) have been widely used in medical image segmentation, the U-Net architecture has emerged as a standout performer due to its exceptional segmentation capabilities. This paper presents a proof of concept for the Attention U-Net archi-tecture applied to the task of teeth segmentation. The study demonstrates the superior performance of this network in accurately segmenting teeth using a newly available benchmark dataset called Tufts Dental X-Ray Dataset. When trained and tested on 10-fold cross-validation, the model achieved an average dice coefficient of 95.01%, intersection over union of 90.6%, and pixel accuracy of 98.82%. These scores surpass those of all other networks implemented on the same dataset. By leveraging the Attention U-Net architecture, our research showcases the potential of advanced AI techniques in dental radiography. The findings contribute to the ongoing efforts in developing automated systems that can assist dental professionals in their clinical practice.
Keywords:
U-Net
; Attention-Unet
; Panoramic Radiographs
; Teeth Segmentation
; Convolutional Neural Networks
; Deep Learning
1. Introduction
In clinical practice, Radiographs are a common diagnostic tool and a standard imaging system frequently employed in treating tooth loss due to their cost-effectiveness. Another reason to use panoramic X-rays is that they capture a wide range of the maxillomandibular region, resulting in richer contextual information. In addition, it has a lower radiation rate than other methods [2]. With the help of panoramic radiographs, dentists can discover various dental problems like bone abnormalities, cavities, hidden dental structures, and post-accidental fractures that are hard or nearly impossible to detect with visual scrutiny [3]. Thus, dentists can leverage such tools to establish an appropriate treatment plan for each patient. The analysis of radiographs may be contracted to dentists in certain circumstances due to the nature of the analysis done on the panoramic X-rays being done manually. Such practice is time-consuming and requires a certain level of expertise to segregate relevant dental features from irrelevant ones like jaw bones, nasal bones, and spine bones [4]. Contradictions may occur due to the variation present in the level of expertise from one dentist to another. The agreement rate (an alternative for dentists' diagnostic performance) of professionals' analysis of radiographs seems to vary in part due to personal knowledge, biases, and skills [5,6]. The irregularity of professional dentists' abilities to interpret radiographs could cause misdiagnosis and mistreatment in some cases [7,8].
Many automated systems have been developed to overcome such complications; some systems utilized classical machine learning techniques such as active contour [9], Bayesian methods [10], and support vector machines [11] with hand-crafted features. The design of hand-crafted features has a huge negative impact on the performance of the abovementioned algorithms. On the other hand, deep learning approaches made a breakthrough in creating automated systems and, as a result, had a superior performance compared to the classical machine learning algorithms. Convolutional Neural Networks are the mainly used network in interpreting imagery data because it possesses many advantages like connectivity, weight sharing, and down-sampling, effectively reducing the number of parameters and speeding up convergence [12].
Architectures like U-Net [13] and DeepMedic [14], which are categorized as Fully Convolutional Networks [1], are specially built to handle medical images of various medical domains. One popular task in computer-aided diagnosis is medical image segmentation, which involves making anatomical or pathological structure changes more protruding in embodiments [15]. Popular medical image segmentation tasks include liver-tumour segmentation [16], brain segmentation [17], and cardiac image segmentation [18]. Many of these tasks utilize the U-Net architecture, which has shown an ideal performance in the segmentation domain. Other improvements were made to this architecture, like redesigning it to be a nested-like architecture [19] or to be self-adaptable [20] U-Net is a framework rather than an architecture due to its ample room for customization, which leaves it a good option to combine it with newly arising mechanisms [14]. The main purpose of this study is to utilize the attention module in U-Net architecture to help optimize the teeth segmentation quality on the TUFTS benchmark dataset and later be assigned as an axillary tool to aid experienced general dentists as well as novice practitioners in learning to analyze panoramic x-rays without the problem of bias or misdiagnosis that is resulted from the diversity of practitioners' domain knowledge. The rest of the paper goes as follows: 2) discusses related work of previous methods proposed in teeth segmentation, 3) material and methods, 4) experiment results, 5) discussion of the conducted study and further improvements.
2. Related Work
2.1. U-Net Approaches
Since the creation of U-Net [13] in 2015. Various studies have been conducted on it, proving its effectiveness in detecting and segmenting visual medical data. U-Net has had a lot of variations until now, with some authors using a batch normalization layer in its encoder part to get better stability or other ingenuine strategies that helped to enhance U-Net's performance in the task in question.
L. F. Machado et al. [21] solved the problem of mandible bone segmentation on panoramic X-ray images. Where in their study, they considered two datasets. The first dataset contained 393 images of radiographs and their respective segmentation mask; the second one was a publicly available third-party image dataset comprising 116 images and segmentation mask pairs. They trained four networks using U-Net and HRNet architectures without data augmentation (DA) and then used morphology refinement (MR) to enhance the model's prediction. The ensemble model comprises U-Net + MR, U-Net+DA+MR, HRNet+MR, and HRNet+DA+MR. In their individual deep learning models section, they mentioned that U-Net and U-Net+DA models achieved the highest performances after morphological refinement on both training and validation sets. The effectiveness of the morphological refinement strategy has been demonstrated in their study, and it shows that it is a good strategy to consider when training. C. Rohrer et al. [22] also used U-Net with a pre-trained encoder to investigate the problem of dental restoration segmentation. The authors' study demonstrated how models trained on small, equally cropped rectangular images (tiles) of panoramic radiographs would outperform models trained on the full image. Their dataset had a total of 1781 panoramic radiographs. They used different numbers of tiles for their experiments, concluding that with a higher number of tiles, the model's performance improved. The study's proposed approach is that the tiling strategy effectively enhances the detection performance when tailored to other applications, as it can detect less frequent features that might go missing from the bigger image. I.-S. Song et al. [23] aimed to evaluate the performance of deep learning models based on CNNs (Convolutional Neural Networks) for apical lesion segmentation from panoramic radiographs. They trained a U-Net on a dataset consisting of 1000 radiographs in total. Their study showed the potential of utilizing deep learning models to segment apical lesions and how U-Net's performance demonstrated such an incredible performance in this specific task. Rini Widyaningrum et al. [24] Used two approaches for segmenting periodontitis staging by using Multi-Label Unet and Mask R-CNN, which were previously trained to perform other tasks (I.e., transfer learning). The authors' dataset contained 100 panoramic radiographs. The Multi-Label Unet performed better than the Mask R-CNN. Later, the authors concluded that Multi-Label U-Net gave off superior segmentation performance to that of Mask R-CNN, and they further recommended using Multi-Label Unet with other techniques to develop more powerful hybrid models for automatic periodontitis detection.
2.2. Attention-Based and Transformer Based
Attention is commonly used in machine translation [25], learning on graphs [26], and visual question answering [27]. Numerous types of attention mechanisms .for example, hard attention which determines a part of the input should be considered by assigning binary weights of either 0 or 1. A weight of 1 indicates that the input element is deemed important, while a weight of 0 means it is considered unimportant. By assigning binary weights, the parameter update process becomes non-differentiable as slight weight changes do not result in smooth transitions or gradients that can be used for gradient-based optimization (e.g., Stochastic gradient descent or adaptive moment estimation). Hard attention was incorporated to focus on meaningful areas in forensic dental identification [28]. On the other hand, soft attention follows the same process with the difference of using SoftMax functions to calculate weights resulting in a differentiable and deterministic attention process.
Another type of attention, called "self-attention", allows the inputs to interact with each other "self" and determine what they should pay attention to more. Compared to other attention mechanisms, the main advantage of self-attention is the parallel computing ability for a long input, which results in much more expensive computations and more training data. Self-attention was one of the main reasons for the emergence of transformers in the Natural Language (NLP) domain which had a huge impact on benchmarking language model due to it being a cutting-edge technology that is now state-of-the-art in the NLP domain. The transformer model was primarily developed for neural machine translation by A. Vaswani et al. [25] and then later modified by A. Dosovitskiy et al. [29] to work on visual data making the idea of multi-headed self-attention possible for images without the use of convolutions. Since then, there have been numerous variations of transformer model used for computer vision applications like image classification, object detection, and image segmentation. A. Almalki and L. J. Latecki [30] utilized newly emerging self-supervised deep learning algorithms like Sim-MIM and UM-MAE to increase their model's efficiency and understating of a limited number of dental radiographs. The model they used in their study was the Swin Transformer, one of the most impactful variations of the transformer model.
Moreover, they used data augmentation and corrected the existing panoramic radiograph dataset, which contains 543 annotated examples they are using for their study. They further discuss the problems with their dataset and how they will try to overcome them by modifying and correcting the teeth instance segmentation and overlapping in all images. They also contributed to further expanding the dataset under the supervision of a dentist by developing ground truth segmentation for dental restorations, including direct and indirect restorations and root canal therapy. Their results showed that parameter tuning, including mask ratio and pre-training epochs, is useful when applying SimMIM pre-training to the dental domain. Furthermore, their correction of the dataset's annotation significantly improved their results.
Having explored the principles and some applications of self-attention and hard attention, we now turn our attention back to the concept of soft attention, as it forms the primary focus of our study. W. Li et al. [31] aimed to combine U-Net architecture's convolutional block with a channel-based attention module that uses soft attention for weight calculating. In addition, the authors designed an attention U-Net model for segmenting caries and teeth in a bite-wing radiograph. The Attention U-Net model was trained on a total of 652 images and then compared with several architectures (e.g., PSPNet, DeepLabv3+, and U-NET models), and the experimental results showed that the proposed model outperformed them all. Later they discussed the feasibility of deep learning models as an axillary tool for dentists to aid them in detecting caries. P. Harsh et al. [32] also used channel-based Attention U-Net that uses an attention block called Squeeze and excitation (SE) which is known to enhance a fully convolutional network's performance by filtering the relevant and impactful channels only, which is a similar mechanism to the one used in [31]. The proposed model was trained and tested on the UFBA-UESC dental image dataset containing 1500 dental X-ray images. The performance of the model was superior when compared to other methods.
Channel-wise attention in U-Net is extendable to other applications and is sometimes mixed with spatial attention [33]. However, it collects features on a global scale for the input. Different types of attention mechanisms adapted for the U-Net architecture, such as grid-based attention gate [1], which calculates attention coefficients on a local scale allowing more fine-grained output, and it has shown great performance in tasks like pancreas segmentation [1], deforestation detection[34], and ischemic lesion segmentation in the brain [35] but has not yet been applied to any dental segmentation task as to our knowledge.
2.3. Other Approaches
In some cases, authors refer to other types of networks to achieve better segmentation results; some authors may create a novel network that best suits the discussed task. Keep in mind that the choice has a lot of key factors, ranging from the chosen framework used to develop the network to the data quality and computational resources. Some segmentation tasks in the dental domain require more complex networks with additional layers or a different training setup to achieve promising results.
Dayi et al. [36] evaluated the diagnostic performance of deep learning models for the segmentation of occlusal, proximal, and cervical caries lesions on panoramic radiographs. Their data consisted of 504 anonymous panoramic radiographs. The authors proposed a custom network for dental caries segmentation called Dental Caries Detection Network (DCDNet). As mentioned in the study, the architecture is an encoder-decoder that uses pre-trained backbone networks. The main difference between their proposed network and other segmentation networks is that the last part of the network contains a Multi-Predicted Output (MPO) structure which splits the final feature map into three different paths for detecting occlusal, proximal, and cervical caries.
On the other hand, Nafi'iyah et al. [37]. Alleviated the problem of mandibular segmentation using an ensemble of three MobileNetV2 networks trained on 106 panoramic radiographs while addressing the main drawbacks of previously existing mandibular segmentation methods (e.g., they cannot completely represent the mandible.). The authors conducted several experiments with different networks, including U-Net, MobileNetV2, ResNet18, ResNet50, Xception, InceptionResNet V2, and MobileNetV2 turned out to be better than all networks. However, its results still needed to be clarified on the coronoid and mandibular condyles, hence the use of the ensemble, which achieved an excellent result in their research. Similarly, Arora et al. [38] used a model based on an encoder-decoder architecture. Its encoder part contained several types of CNN-based models to exploit each network and combine their output to generate a fine-grained contextual feature for teeth segmentation. The authors trained and tested the model on a dataset of 1500 radiographs. Their proposed method uses fewer parameters when compared to state-of-the-art models mentioned in their study while also outperforming them.
2.3. Motivation
Much work has adopted the U-Net architecture for dental segmentation tasks due to its superiority in the segmentation task. However, teeth segmentation can be difficult due to the spatial features of the panoramic radiographs. Some works have used morphological refinement and other attention-based techniques to address this problem. While previous works in the literature of attention-based methods have only employed channel-based attention, no previous work has explored using a grid-based attention mechanism [1]. Furthermore, the variation in datasets used in previous works is due to the lack of a publicly available benchmark dataset collected with proper data collection protocols. This paper tests the attention U-Net architecture based on [1] and shows its superiority in teeth segmentation on a publicly available benchmark dataset from the TUFTS School of Dentistry. The contributions of this work can be summarized as follows:
3. Material and Methods
3.1. U-Net Architecture
U-Net is a famous architecture that was developed for biomedical image segmentation. U-Net gets its name from its U-like architecture, as shown in Figure 1. It is an encoder-decoder architecture consisting of four encoder blocks and four decoder blocks connected via a 1x1 convolution bridge (bottleneck). The encoder part is designed to extract features from the input image and learn high-level features. This process is done through a sequence of convolutional blocks. Each encoder block comprises 3x3 convolutions followed by a Rectified Linear Unit (ReLU) activation function. After each convolution and ReLU activation, a maximum pooling layer of 2x2 is applied to the output channels in which the dimensions of the channels are reduced by half. The maximum pooling process reduces the computational cost required by the network by reducing the number of trainable parameters. Each decoder block performs a 2x2 transposed convolution (up-sampling) on the channels that came from the encoder through the bottleneck and then concatenates each of the outputted channels from the encoder blocks with the up-sampled channels that come from each block of the up-sampling convolutions. This process helps restore lost information because of the network's depth. Finally, at the last up-sampling convolution, the model applies a sigmoid activation function to the output logits to yield a binary segmentation or a SoftMax in the case of multi-class segmentation.
3.2 Attention U-Net
Attention U-Net [1] was introduced in 2018. Attention U-Net is nothing but a regular U-Net model, but with the so-called Attention Gate (AG) shown in Figure 3, between each skip connection and up-sampling layer in the U-Net model shown in Figure 2. The initial task for the proposed model was the segmentation of CT images of the pancreas, which was considered difficult due to low tissue contrast and large variance in the organ's shape and size. The paper's main contribution was a modification of the attention proposed in [40], which involved changing the calculation for the attention coefficients from a global feature vector to a grid-based vector. The grid-based attention module computes attention maps that capture the importance of different spatial locations. This change made the attention coefficients target more local regions and better enhance the performance of any Fully Convolutional Network that implements this type of attention. The authors then showcased their proposed Attention Module on the U-Net architecture, which resulted in this novel architecture which was an impactful change in the U-Net architecture. We adopt the same model but with a slightly different modification on the hyperparameters and training setup (e.g. data split and training criterion).
3.2.1. Attention Module Analysis
Attention helps identify crucial regions in the image and reduce the feature responses to only preserve the important features relevant to the segmentation task (see Figure 4d). Figure 3 shows the whole process of the attention gate proposed in [14], but for a 2D input, the process involves a linear transformation which is a convolution on the gating signal coming from the up-sample layer which is used to determine the focus region and contains more representative contextual information; this process is done in conjunction with linear transformation which is convolution on the feature maps coming from the skip-connection layer from the encoder, which has a better spatial feature representation, the output of this operation will leave us with two intermediate vectors from the linear transformation and from the linear transformation .
The preceding step, which involves the element-wise addition of the two vectors and Namely additive attention. The result of the addition is then passed through a non-linearity activation function (ReLU) and another convolution is done on the output of the non-linearity to obtain the attention coefficients, but its values are bounded between and so it is passed through a sigmoid activation function which scales the values between 0 and 1. The reason for using sigmoid instead of SoftMax, which is normally used in soft attention, is that SoftMax yields sparse activations at the output. The scaled values of are the final attention coefficients α. A bilinear then upsamples the coefficients to match the original size of and multiplied elementwise with to obtain Which represents the incoming skip connection that is concatenated with the up-sampling layer in the context of a standard U-Net. The attention coefficients are calculated channel-wise and updated each time the network backpropagates learning which features to suppress and which features to pay attention to. Figure 4 visualizes the attention layer preceding the last attention layer within the network. As can be seen, the attention gate filters out irrelevant information when trained for enough epochs.
3.3. Dataset Collection and Description
The TUFTS university dataset [39] is a multimodal dataset consisting of 1000 de-identified images of panoramic radiographs shown in Figure 5b and five other major components such as 1) teeth masks in Figure 4c. ,2) maxillomandibular masks shown in Figure 5d, 3) eye tracker generated maps (grey and quantized ), 4) text information containing the description of each radiograph, and 5) masks outlining the abnormalities. Each abnormality segmentation mask and the radiograph description are further split into expert and student-level annotations. The classification of the radiographs is based on five categories: peripheral characteristics, anatomical location, radiodensity, effects on the surrounding structure, and the abnormality category, making it a multimodal dataset. The folder structure of the dataset is shown in Figure 4a.
3.4. Data Preprocessing
The preprocessing process is as follows: Contrast Limited Adaptive Histogram Equalization (CLAHE) [41] was applied to the images to enhance the image features. The contrast enhancement process had a major impact on the visibility of the images. Figure 6b and Figure 6a show the original and enhanced image, respectively. To further yield better performance from the model, the maxillomandibular mask shown in Figure 6c was used by applying an AND operation to the maxillomandibular mask with the preprocessed image to get only the ROI that includes the teeth shown in Figure 6d. Finally, the processed radiograph shown in Figure 6d and its corresponding ground truth mask shown in Figure 5d were resized to 512
256. The preprocessing was applied to all examples in the dataset.
3.5. Training Setup
The model was implemented in Pytorch framework and trained on an NVIDIA RTX 3050 GPU with 4GB RAM. Adam optimizer was used with a learning rate of and. The model was trained on 100 epochs, ten epochs for each fold. The number of learnable kernels was reduced for computational resource limitations, the batch size was set to 8, and mixed precision strategy was used for training; this allows for less RAM usage as it scales the loss from a number that has 64-bit precision to 16-bit precision, making it viable to train on a low RAM. The preprocessed radiographs and teeth mask pairs were split randomly into ten folds for training and validation.
3.5.1. Loss Function
The segmentation of teeth can be considered a pixel-wise classification problem where the model tries to classify whether the given pixel belongs to the background or teeth class. When dealing with medical image segmentation, some approaches use the standard Cross Entropy (CE) [42, 38]. In contrast, others use metric-sensitive, minority-class penalizing losses, or a mixture between metric-sensitive and Cross Entropy losses [1, 43,19,20] which have shown significant performance in dealing with hard-to-segment regions. For this reason, dice loss is the most appropriate loss function for this specific task, as its main goal is to make the segmented region overlap with the ground truth as much as possible. The negative logarithm value of the dice loss is taken to further alleviate the problem of small misclassifications by penalizing the small errors with the logarithmic operator. This specific loss function was chosen due to the major presence of black pixels (background), which is not interesting in the segmentation task and could hinder performance.
3.5.2. Evaluation Metrics
Pixel Accuracy (PA), Intersection over Union (IoU), and Dice Coefficient (Dice) are employed as the evaluation metric for this study. While pixel accuracy is not a reliable metric to measure the real performance of a segmentation model, it is still used as a generic metric. The pixel accuracy is calculated as the number of correctly classified pixels over the total number of pixels as shown in formula (2); the resultant value is with 1 indicating a high number of correctly classified pixels and 0 indicating no correctly classified pixels. On the other hand, dice coefficient (also known as dice score) and IoU are two of the most popular metrics used to evaluate the performance of segmentation models. The dice coefficient shown in formula (3) measures the similarity between predicted and ground truth segmentation masks, and it is calculated as twice the intersection of the predicted and ground truth masks divided by the sum of their areas; the resultant value is with 1 indicating a perfect match between the ground truth and the predicted mask and 0 indicating no overlap. Similarly, intersection over union (IoU) shown in formula (4) measures the extent to which the segmentation aligns with the ground truth. It is calculated as the ratio of the intersection of the predicted and ground truth masks to their union, and the resultant value is with 1 indicating a perfect match between the ground truth and the predicted mask and 0 indicating no overlap.
4. Experimental Results
Table 1 demonstrates the results obtained after training the model on the 10-fold cross-validation sets. Fold one had a moderately good result with 90.18%,82.12%, and 97.66% for the dice score, IoU, and PA, respectively. The next fold improves by 2%, 3%, and 1%; the next fold improves by 1%,2%, and 0.20%. The model performance keeps improving throughout the training phase, yielding an average score of 95%,90.6%, and 98% for dice score, IoU, and PA, respectively. Figure 7 shows the testing curve for each pixel accuracy, dice score, and IoU. The model was tested after each training epoch. It could be noticed that the evaluation was turbulent for each metric; this is because some examples in the dataset had no teeth, which means that the masks are just black pixels. The presence of such examples in the batches has resulted in an unstable convergence, but despite the instability, the model could accurately segment teeth. To further validate our results and visualize the model's performance, two random samples were taken from the test set and visualized w.r.t the predicted images (refer to Figure 8); the model had a superior performance (refer to Figure 8b,d for the model's predictions) in segmenting the two samples with minor imperfections yet great details quite like the ground truth masks (refer to Figure 8a,c for the ground truths). The trained model was also compared to other baselines tested on the dataset [39], and it is clear that attention U-Net has a better segmentation performance than different baselines trained for a much longer time with an already pre-trained backbone, as shown in Table 2.
5. Conclusions
In this study, we explored and improved an attention-based network called "Attention U-Net" [1] with reduced parameters for teeth segmentation on panoramic radiographs. The model demonstrated exceptional performance through training and testing on the TUFTS benchmark dataset using 10-fold cross-validation. The results of our evaluation showed that our proposed improvement achieved remarkable accuracy, with an average dice coefficient of 95.01%, intersection over union of 90.6%, and pixel accuracy of 98.82%. These scores surpass those obtained by other networks evaluated in the original paper for the dataset, underscoring the effectiveness of our approach. By leveraging Artificial Intelligence systems in dentistry, our research aims to contribute to the field and encourage dental practitioners at all levels of expertise to incorporate these systems as auxiliary tools in their diagnostic and post-operative screening phases. The utilization of such systems has the potential to enhance the accuracy and efficiency of dental diagnoses, leading to improved patient care and outcomes. Our findings highlight the promise of attention-based networks and their potential to revolutionize the field of dentistry. We hope our work will inspire further exploration and adoption of Artificial Intelligence technologies in dental practices, ultimately benefiting practitioners and patients alike.
Author Contributions
Conceptualization, A.M., and WH; methodology, A.M., SS, and WH; software, A.M.; validation, SS and WH; formal analysis, SS; investigation, A.M., SS,and WH; resources, SS; data curation, SS; writing—original draft preparation, A.M. and WH; writing—review and editing, A.M. and WH; visualization, WH; supervision, WH and SS; project administration, WH and SS All authors have read and agreed to the published version of the manuscript.
Funding
This research received no external funding.
Data Availability Statement
The information on gaining access to a copy of the TDD can be found on their project website (http://tdd.ece.tufts.edu/).
References
- Oktay et al., "Attention U-Net: Learning Where to Look for the Pancreas, arXiv 2018, arXiv:1804.03999.
- Z. Kong et al., "Automated Maxillofacial Segmentation in Panoramic Dental X-Ray Images Using an Efficient Encoder-Decoder Network," IEEE Access, vol. 8, pp. 207822–207833, 2020. [CrossRef]
- 3. C.-W. Wang et al., "A benchmark for comparison of dental radiography analysis algorithms," Medical Image Analysis, vol. 31, pp. 63–76, Jul. 2016. [CrossRef]
- Wirtz, A. , Mirashi, S.G. and Wesarg, S. (2018) 'Automatic teeth segmentation in panoramic X-ray images using a coupled shape model in combination with a neural network', Medical Image Computing and Computer Assisted Intervention – MICCAI 2018, pp. 712–719. [CrossRef]
- Sabarudin, Akmal, and Yu Jin Tiau. "Image Quality Assessment in Panoramic Dental Radiography: A Comparative Study between Conventional and Digital Systems." Quantitative Imaging in Medicine and Surgery, vol. 3, no. 1, 1 Feb. 2013, pp. 43–48, www.ncbi.nlm.nih.gov/pubmed/23483085. Available online: www.ncbi.nlm.nih.gov/pubmed/23483085 (accessed on 24 November 2022). [CrossRef]
- M. L. Kantor, A. B. Reiskin, and A. G. Lurie, "A clinical comparison of X-ray films for detection of proximal surface caries," The Journal of the American Dental Association, vol. 111, no. 6, pp. 967–969, Dec. 1985. [CrossRef]
- R. Fitzgerald, "Error in Radiology," Clinical Radiology, vol. 56, no. 12, pp. 938–946, Dec. 2001. [CrossRef]
- Brady, R. Ó. Laoide, P. McCarthy, and R. McDermott, "Discrepancy and error in radiology: concepts, causes and consequences," The Ulster medical journal, vol. 81, no. 1, pp. 3–9, 2012. Available online: https://www.ncbi.nlm.nih.gov/pmc/articles/PMC3609674/.
- P. L. Lin, Y. H. Lai, and P. W. Huang, "An effective classification and numbering system for dental bite-wing radiographs using teeth region and contour information," Pattern Recognition, vol. 43, no. 4, pp. 1380–1392, Apr. 2010. [CrossRef]
- M. H. Mahoor and M. Abdel-Mottaleb, "Classification and numbering of teeth in dental bite-wing images," Pattern Recognition, vol. 38, no. 4, pp. 577–586, Apr. 2005. [CrossRef]
- Yuniarti, A. S. Nugroho, B. Amaliah, and A. Z. Arifin, "Classification and Numbering of Dental Radiographs for an Automated Human Identification System," TELKOMNIKA (Telecommunication Computing Electronics and Control), vol. 10, no. 1, p. 137, Mar. 2012. [CrossRef]
- Z. Li, W. Yang, S. Peng, and F. Liu, "A Survey of Convolutional Neural Networks: Analysis, Applications, and Prospects,". arXiv 2020, arXiv:2004.02806.
- Ronneberger, P. Fischer, and T. Brox, "U-Net: Convolutional Networks for Biomedical Image Segmentation," arXiv.org, , 2015. https://arxiv.org/abs/1505. 18 May 0459. [Google Scholar]
- K. Kamnitsas et al., "Efficient multi-scale 3D CNN with fully connected CRF for accurate brain lesion segmentation," Medical Image Analysis, vol. 36, pp. 61–78, Feb. 2017. [CrossRef]
- R. Wang, T. Lei, R. Cui, B. Zhang, H. Meng, and A. K. Nandi, "Medical image segmentation using deep learning: A survey," IET Image Processing, Jan. 2022. [CrossRef]
- W. Li, F. Jia, and Q. Hu, "Automatic Segmentation of Liver Tumor in CT Images with Deep Convolutional Neural Networks," Journal of Computer and Communications, vol. 03, no. 11, pp. 146–151, 2015. [CrossRef]
- V. Cherukuri, P. Ssenyonga, B. Warf, A. Kulkarni, V. Monga, and S. Schiff, "Learning Based Segmentation of CT Brain Images: Application to Post-operative Hydrocephalic Scans," IEEE Transactions on Biomedical Engineering, 2017. Available online: https://www.semanticscholar.org/paper/Learning-Based-Segmentation-of-CT-Brain-Images%3A-to-Cherukuri-Ssenyonga/f4c38fca0d2df65278e222f535b08e66830b03df (accessed on 29 May 2023).
- Y. Liu, S. Chen, L. Wee, A. Dekker, and I. Bermejo, "Deep learning based unpaired image-to-image translation applications for medical physics: a systematic review," vol. 68, no. 5, pp. 05TR01–05TR01, Feb. 2023. [CrossRef]
- Z. Zhou, M. Rahman, N. Tajbakhsh, and J. Liang, "UNet++: A Nested U-Net Architecture for Medical Image Segmentation. arXiv 2018, arXiv:1807.1016.
- F. Isensee et al., "nnU-Net: Self-adapting Framework for U-Net-Based Medical Image Segmentation, arXiv 2018, arXiv:1809.10486.
- L. F. Machado, P. C. A. Watanabe, G. A. Rodrigues, and L. O. M. Junior, "Deep learning for automatic mandible segmentation on dental panoramic x-ray images," Biomedical Physics & Engineering Express, vol. 9, no. 3, p. 035015, Mar. 2023. [CrossRef]
- C. Rohrer, J. Krois, J. Patel, H. Meyer-Lueckel, J. A. Rodrigues, and F. Schwendicke, "Segmentation of Dental Restorations on Panoramic Radiographs Using Deep Learning," Diagnostics, vol. 12, no. 6, p. 1316, 22. 20 May. [CrossRef]
- I.-S. Song et al., "Deep learning-based apical lesion segmentation from panoramic radiographs," Imaging Science in Dentistry, vol. 52, 2022. [CrossRef]
- Rini Widyaningrum, Ika Candradewi, A. Seno, and Rizki Aulianisa, "Comparison of Multi-Label U-Net and Mask R-CNN for panoramic radiograph segmentation to detect periodontitis," vol. 52, no. 4, pp. 383–383, Jan. 2022. [CrossRef]
- Vaswani et al., "Attention Is All You Need,". arXiv 2017, arXiv:1706.03762.
- Y. Zhang, X. Wang, X. Jiang, C. Shi, and Y. Ye, "Hyperbolic Graph Attention Network,". arXiv 2019, arXiv:1912.03046.
- D.-K. Nguyen and T. Okatani, "Improved Fusion of Visual and Language Representations by Dense Symmetric Co-Attention for Visual Question Answering,". arXiv 2018, arXiv:1804.00775.
- Y. Liang et al., "Exploring Forensic Dental Identification with Deep Learning," 2021. Accessed: Jun. 02, 2023. [Online]. Available online: https://proceedings.neurips.cc/paper_files/paper/2021/file/1a423f7c07a179ec243e82b0c017a034-Paper.pdf.
- W. Li et al., "Segmentation and accurate identification of large carious lesions on high quality x-ray images based on Attentional U-Net model. A proof of concept study," Journal of Applied Physics 132, 033103 (2022), vol. 132, no. 3, pp. 033103–033103, Jul. 2022. [CrossRef]
- Dosovitskiy et al., "An Image is Worth 16x16 Words: Transformers for Image Recognition at Scale,". arXiv 2020, arXiv:2010.11929.
- Almalki and L. J. Latecki, "Self-Supervised Learning with Masked Image Modeling for Teeth Numbering, Detection of Dental Restorations, and Instance Segmentation in Dental Panoramic Radiographs, arXiv 2022, arXiv:2210.11404.
- P. Harsh, R. Chakraborty, S. Tripathi, and K. Sharma, "Attention U-Net Architecture for Dental Image Segmentation," IEEE Xplore, Jun. 01, 2021. Available online: https://ieeexplore.ieee.org/document/9498422 (accessed on 11 May 2022).
- M. Biswas, R. Pramanik, S. Sen, A. Sinitca, D. Kaplun, and R. Sarkar, "Microstructural segmentation using a union of attention guided U-Net models with different color transformed images," Scientific Reports, vol. 13, no. 1, Apr. 2023. [CrossRef]
- D. John and C. Zhang, "An attention-based U-Net for detecting deforestation within satellite sensor imagery," International Journal of Applied Earth Observation and Geoinformation, vol. 107, p. 102685, Mar. 2022. [CrossRef]
- R. Karthik, M. Radhakrishnan, R. Rajalakshmi, and J. Raymann, "Delineation of ischemic lesion from brain MRI using attention gated fully convolutional network," Biomedical Engineering Letters, vol. 11, no. 1, pp. 3–13, Nov. 2020. [CrossRef]
- Dayı, H. Üzen, İ. B. Çiçek, and Ş. B. Duman, "A Novel Deep Learning-Based Approach for Segmentation of Different Type Caries Lesions on Panoramic Radiographs," Diagnostics, vol. 13, no. 2, p. 202, Jan. 2023. [CrossRef]
- N. Nafi'iyah, C. Fatichah, D. Herumurti, E. Renwi Astuti, and R. Hardani Putra, "MobileNetV2 Ensemble Segmentation for Mandibular on Panoramic Radiography," Intelligent Engineering & Systems, vol. 16, no. 2, pp. 546–560, Feb. 2023. [CrossRef]
- S. Arora, S. K. Tripathy, R. Gupta, and R. Srivastava, "Exploiting multimodal CNN architecture for automated teeth segmentation on dental panoramic X-ray images," Proceedings of the Institution of Mechanical Engineers, Part H: Journal of Engineering in Medicine, p. 095441192311571, Feb. 2023. [CrossRef]
- K. Panetta, R. Rajendran, A. Ramesh, S. Rao, and S. Agaian, "Tufts Dental Database: A Multimodal Panoramic X-Ray Dataset for Benchmarking Diagnostic Systems," IEEE journal of biomedical and health informatics, vol. 26, no. 4, pp. 1650–1659, Apr. 2022. [CrossRef]
- Saumya Jetley, N. A. Lord, N. Lee, and Philip, "Learn to Pay Attention," OpenReview, , 2023. Available online: https://openreview.net/forum?id=HyzbhfWRW (accessed on 27 May 2023).
- Y. Yoshimi et al., "Image preprocessing with contrast-limited adaptive histogram equalization improves the segmentation performance of deep learning for the articular disk of the temporomandibular joint on magnetic resonance images," Apr. 2023. [CrossRef]
- Z.-L. Ni et al., "RAUNet: Residual Attention U-Net for Semantic Segmentation of Cataract Surgical Instruments," pp. 139–149, Dec. 2019. [CrossRef]
- F. Oztekin et al., "Automatic semantic segmentation for dental restorations in panoramic radiography images using U-Net model," International Journal of Imaging Systems and Technology, vol. 32, no. 6, pp. 1990–2001, Sep. 2022. [CrossRef]
Figure 1.
The U-Net architecture was developed for biomedical segmentation in 2015 [13].
Figure 1.
The U-Net architecture was developed for biomedical segmentation in 2015 [13].
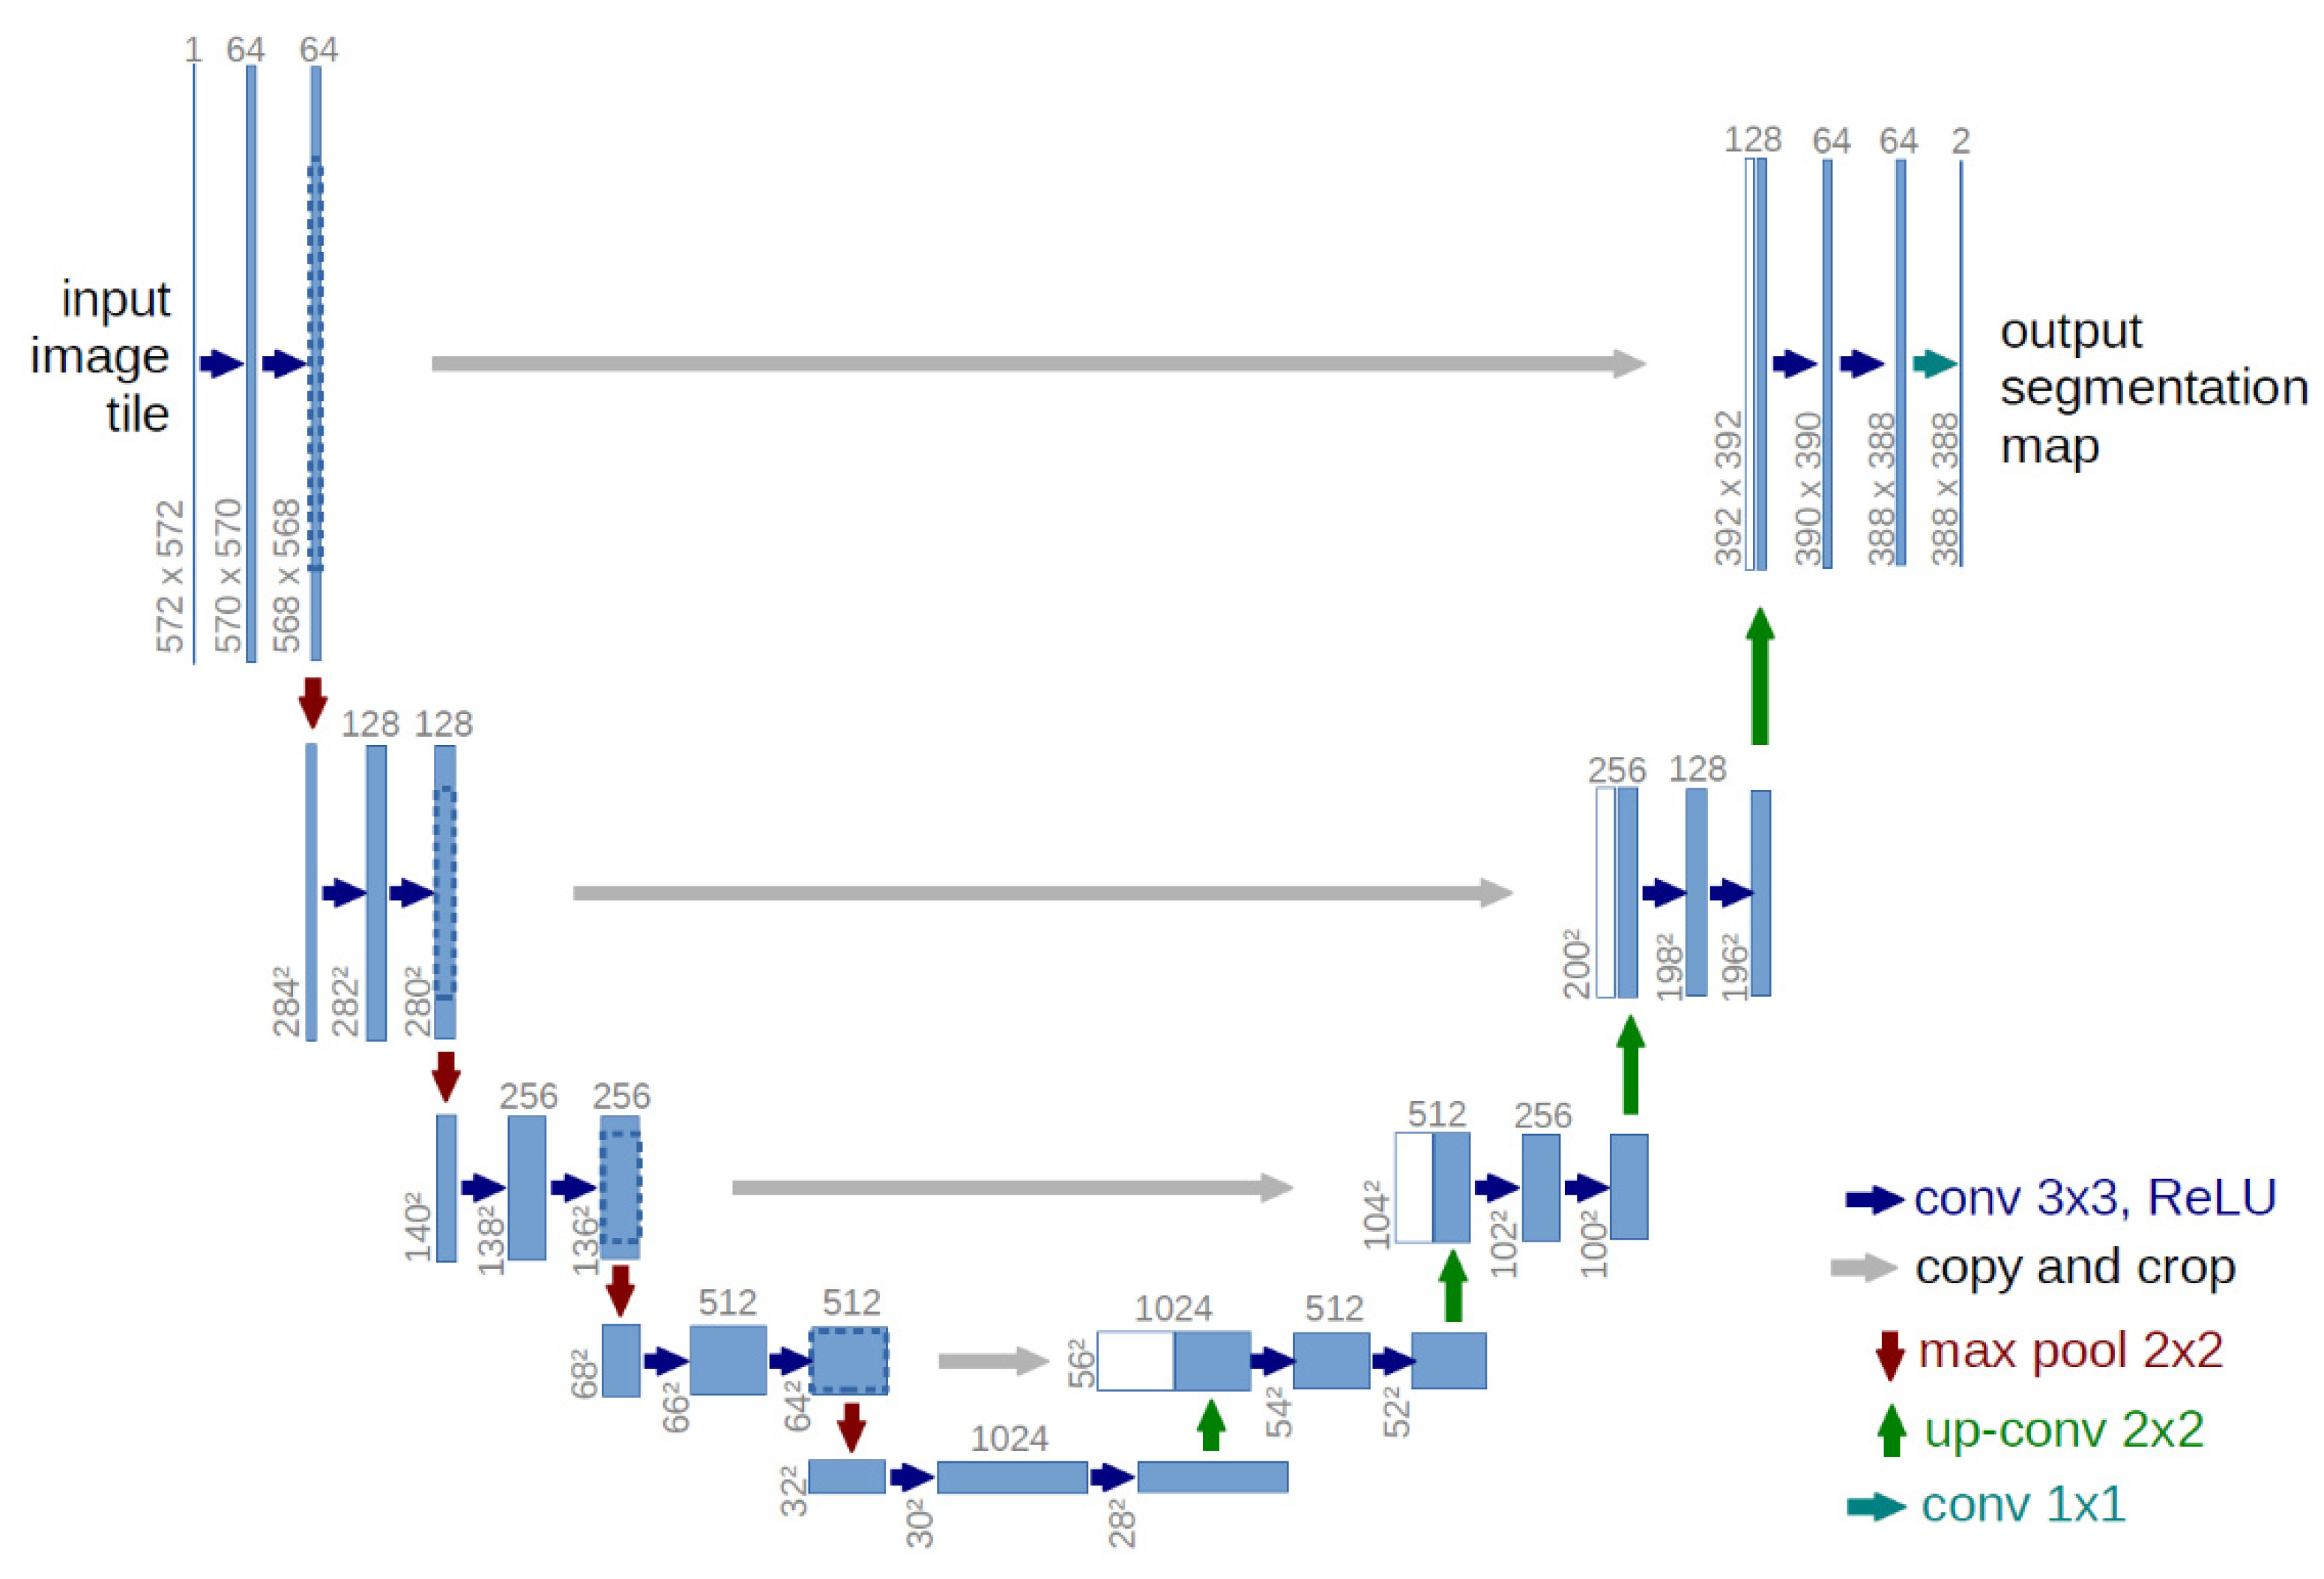
Figure 2.
Attention U-Net proposed in [14].
Figure 2.
Attention U-Net proposed in [14].
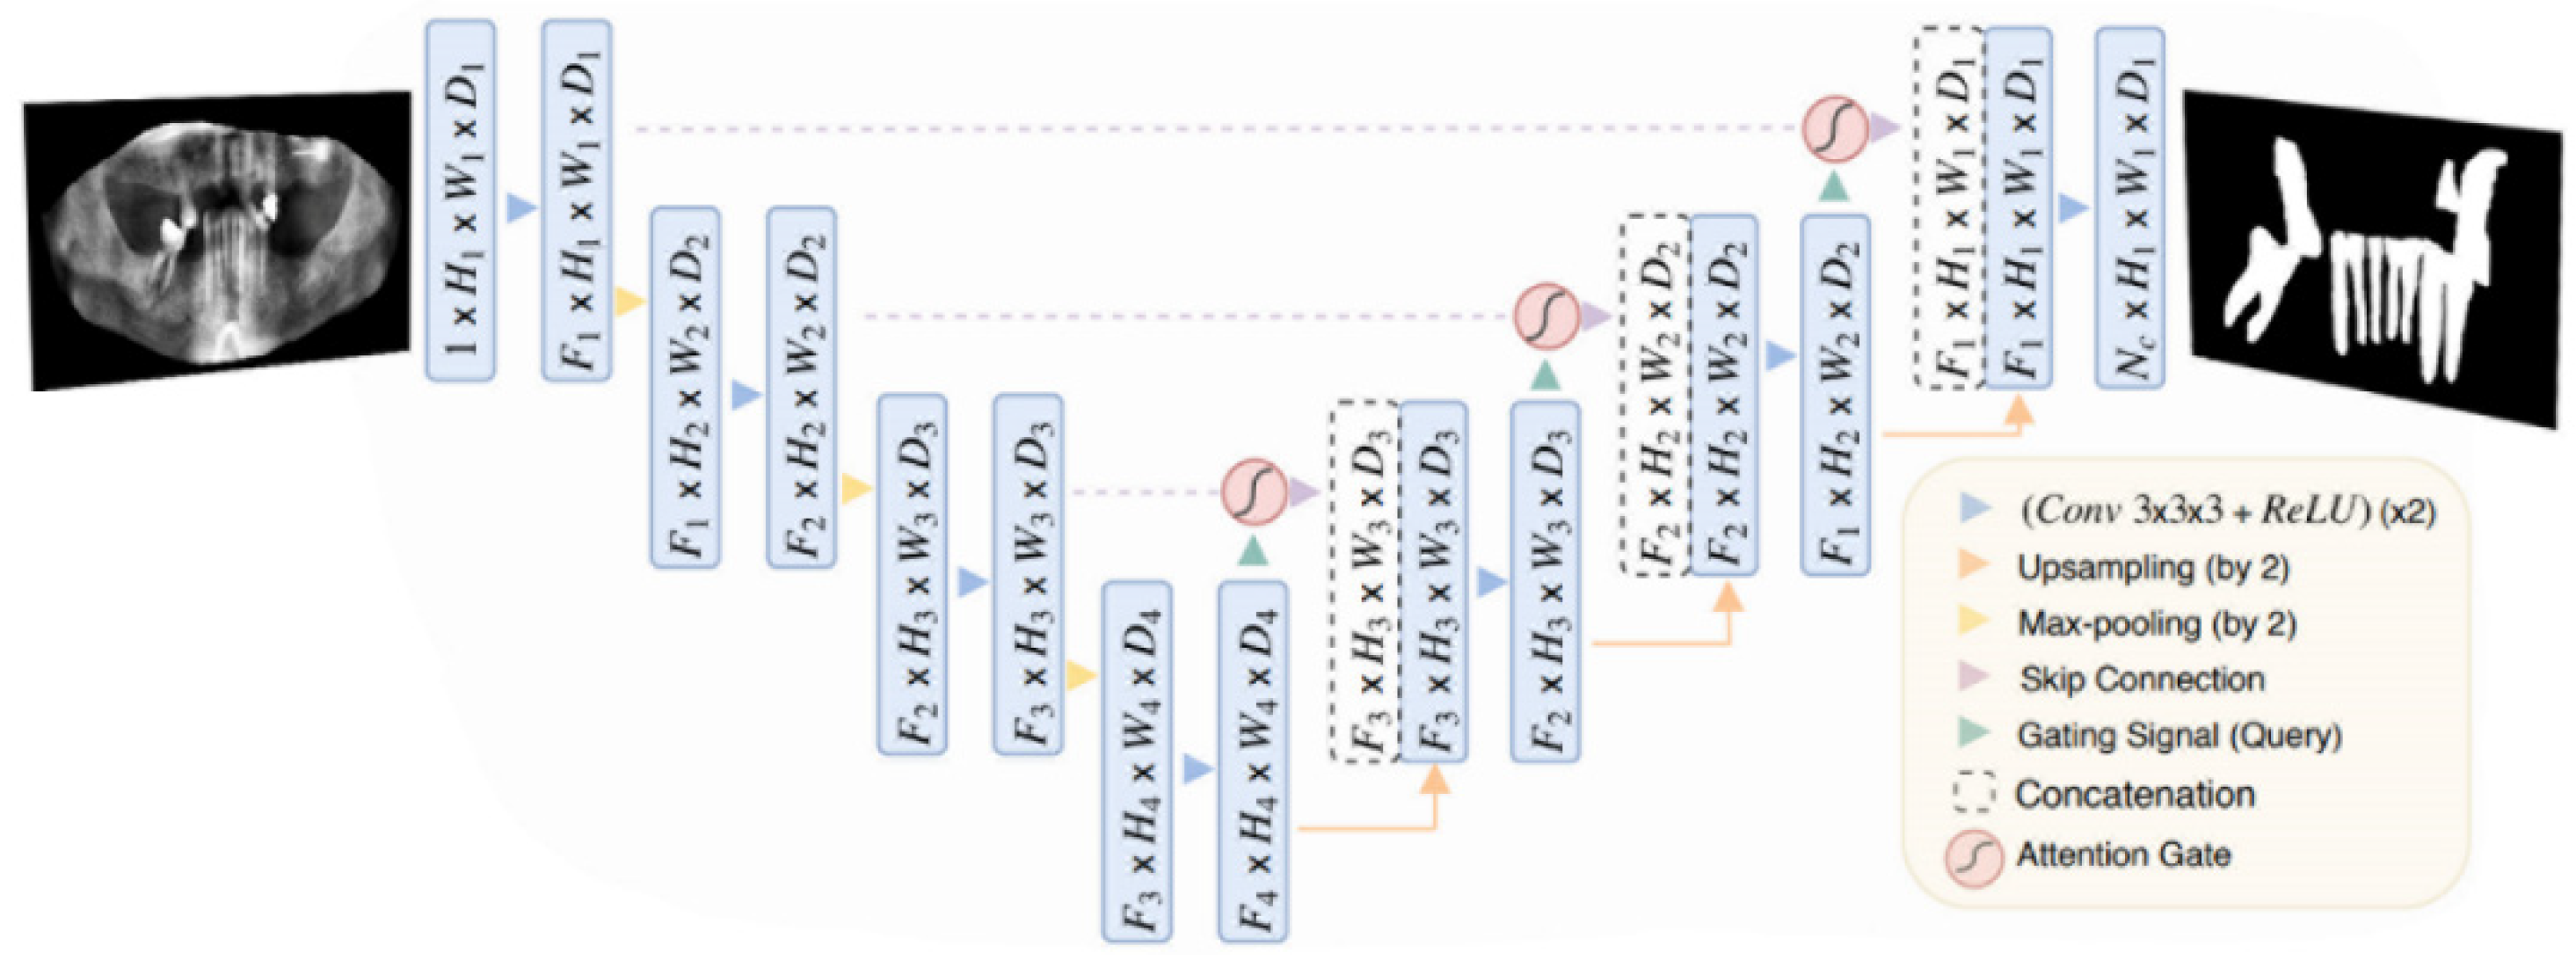
Figure 3.
A schematic showing the proposed attention gate [1]. Input features coming from the skip connection () are scaled with the attention coefficients(α). Relevant spatial regions are selected by looking at both activations and visual context provided by (g), which is collected from a larger granularity.
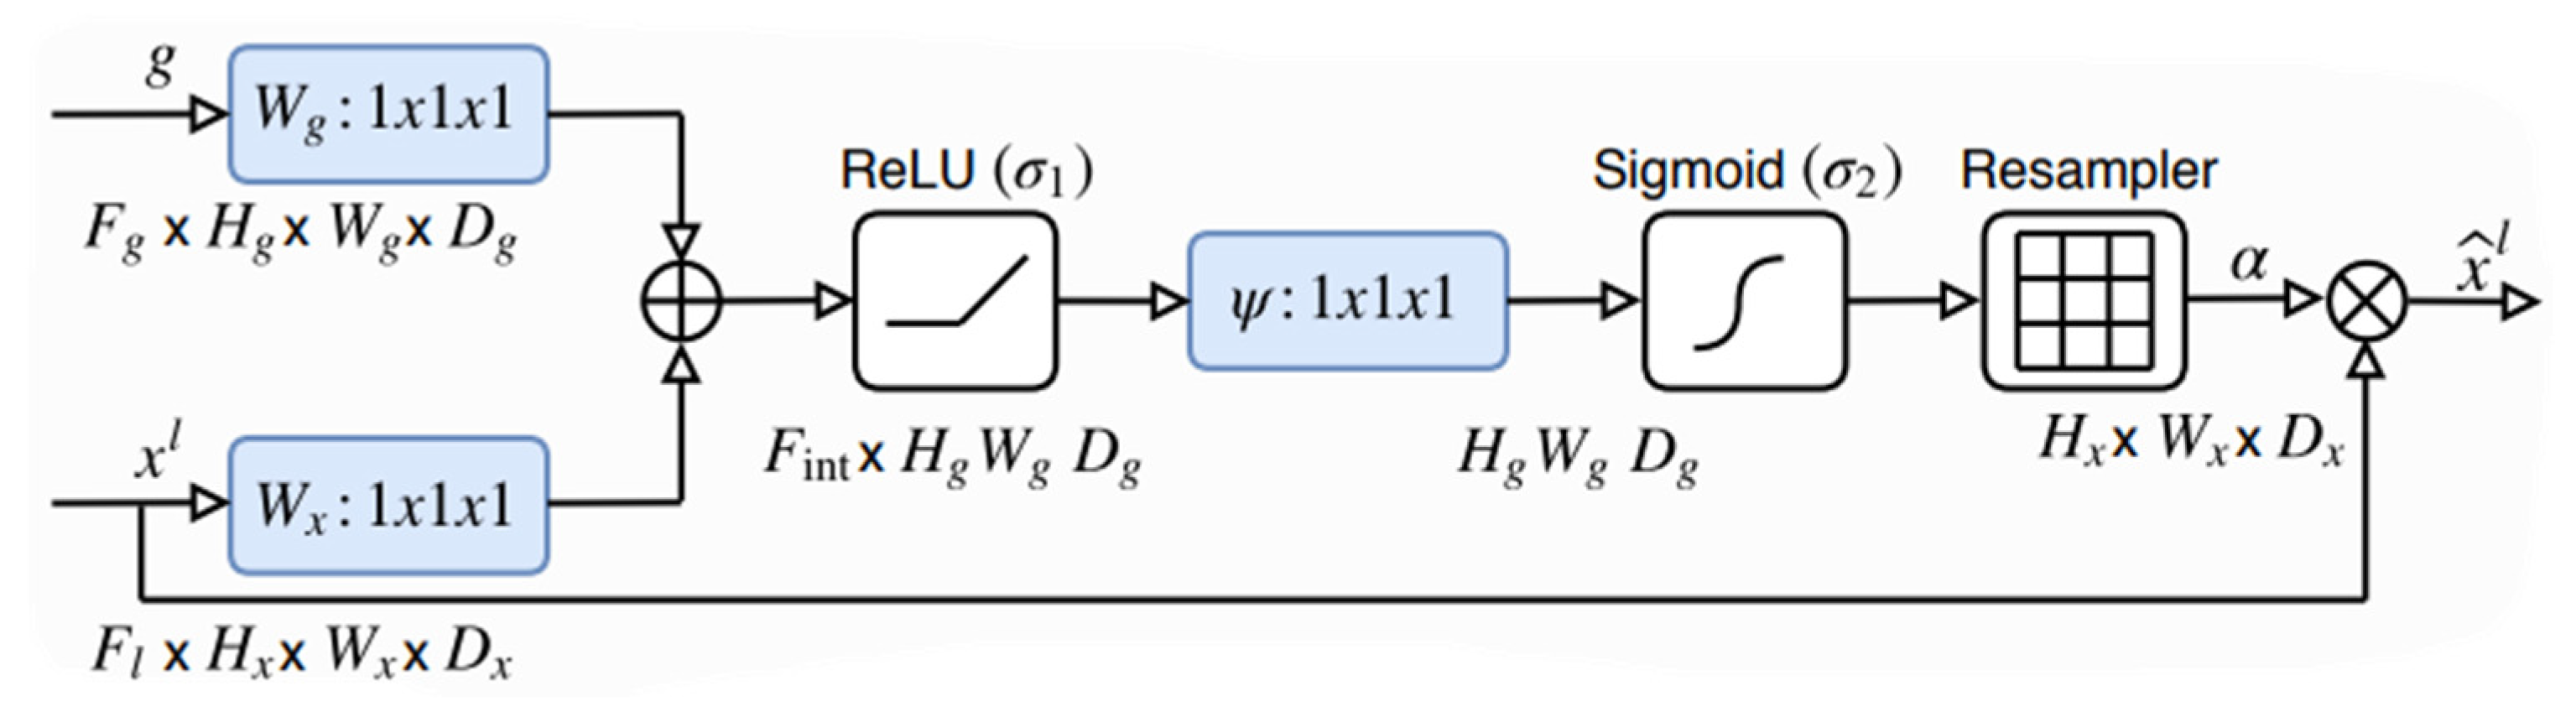
Figure 4.
shows testing epochs 1,5,17, and 52 of the attention coefficients preceding the final attention coefficients within the network 1(a), 5(b), 17(c), and 52(d).
Figure 4.
shows testing epochs 1,5,17, and 52 of the attention coefficients preceding the final attention coefficients within the network 1(a), 5(b), 17(c), and 52(d).
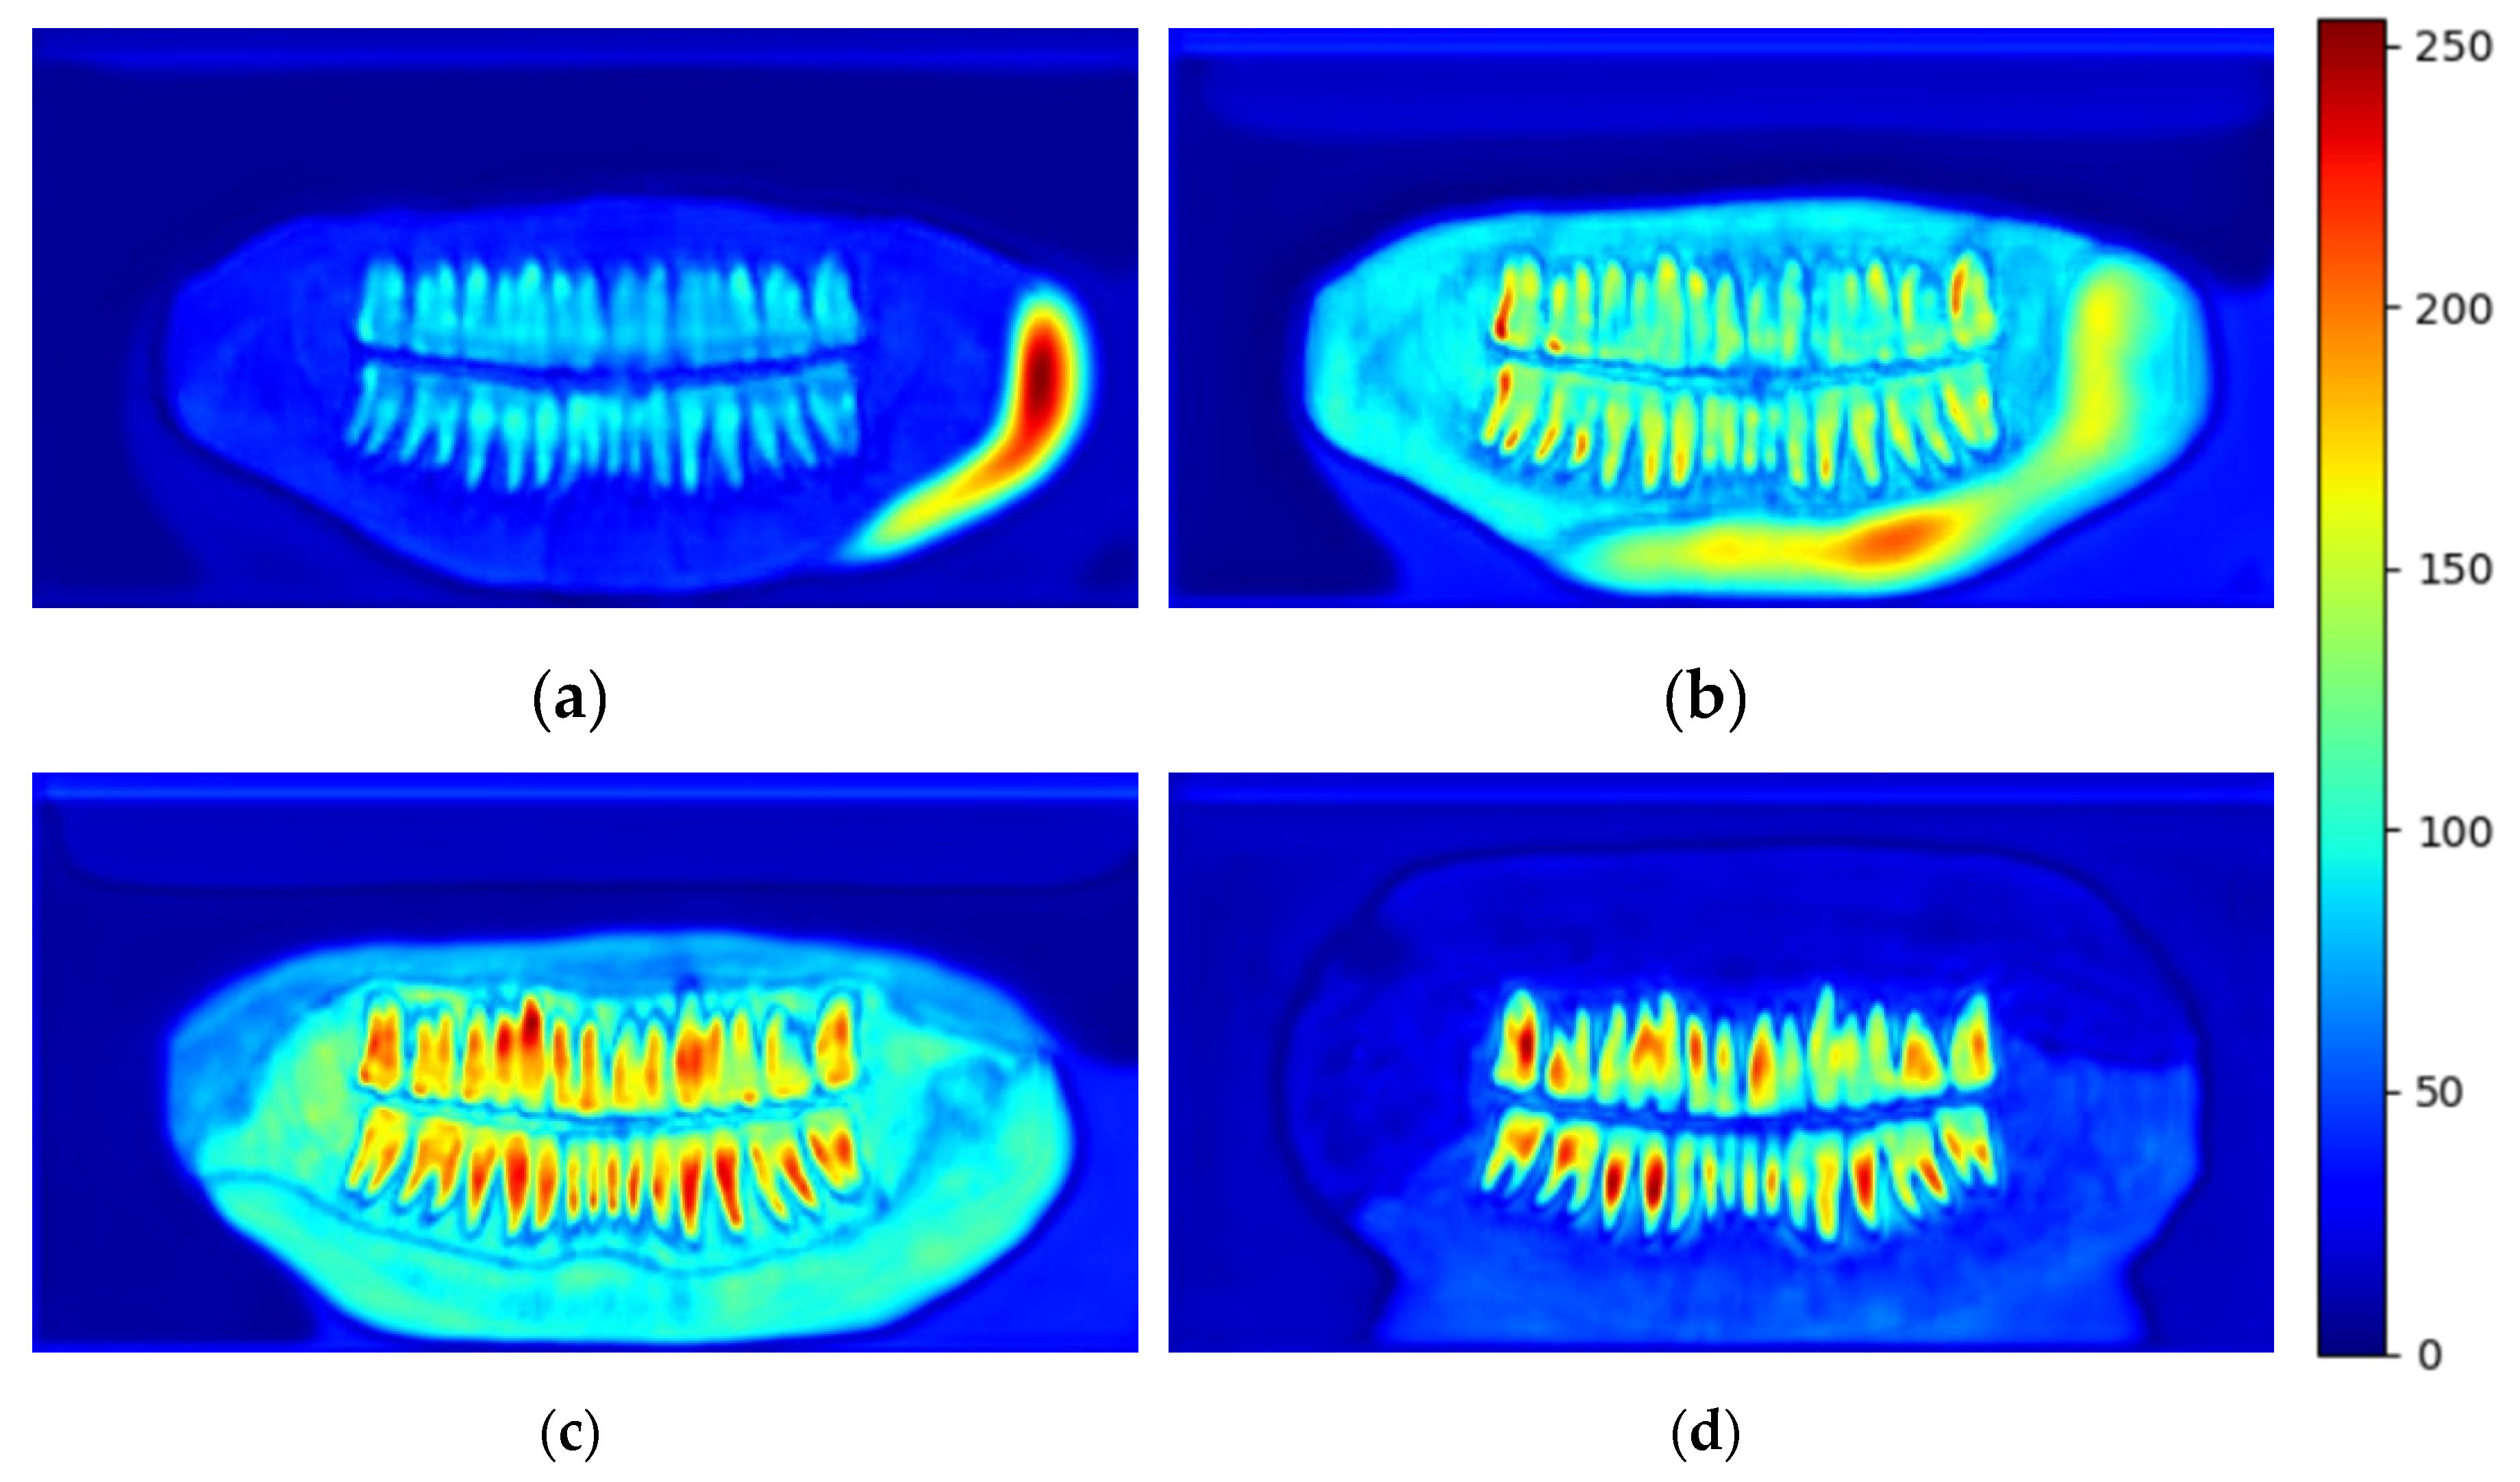
Figure 5.
(a) Description of the folder structure of the TUFTS dataset. The “Radiographs” folder contains images like the one shown in (b), the folder “maxillomandibular” includes images like the one shown in (c), and the folder named “teeth_mask” contains images like the one shown in (d).
Figure 5.
(a) Description of the folder structure of the TUFTS dataset. The “Radiographs” folder contains images like the one shown in (b), the folder “maxillomandibular” includes images like the one shown in (c), and the folder named “teeth_mask” contains images like the one shown in (d).
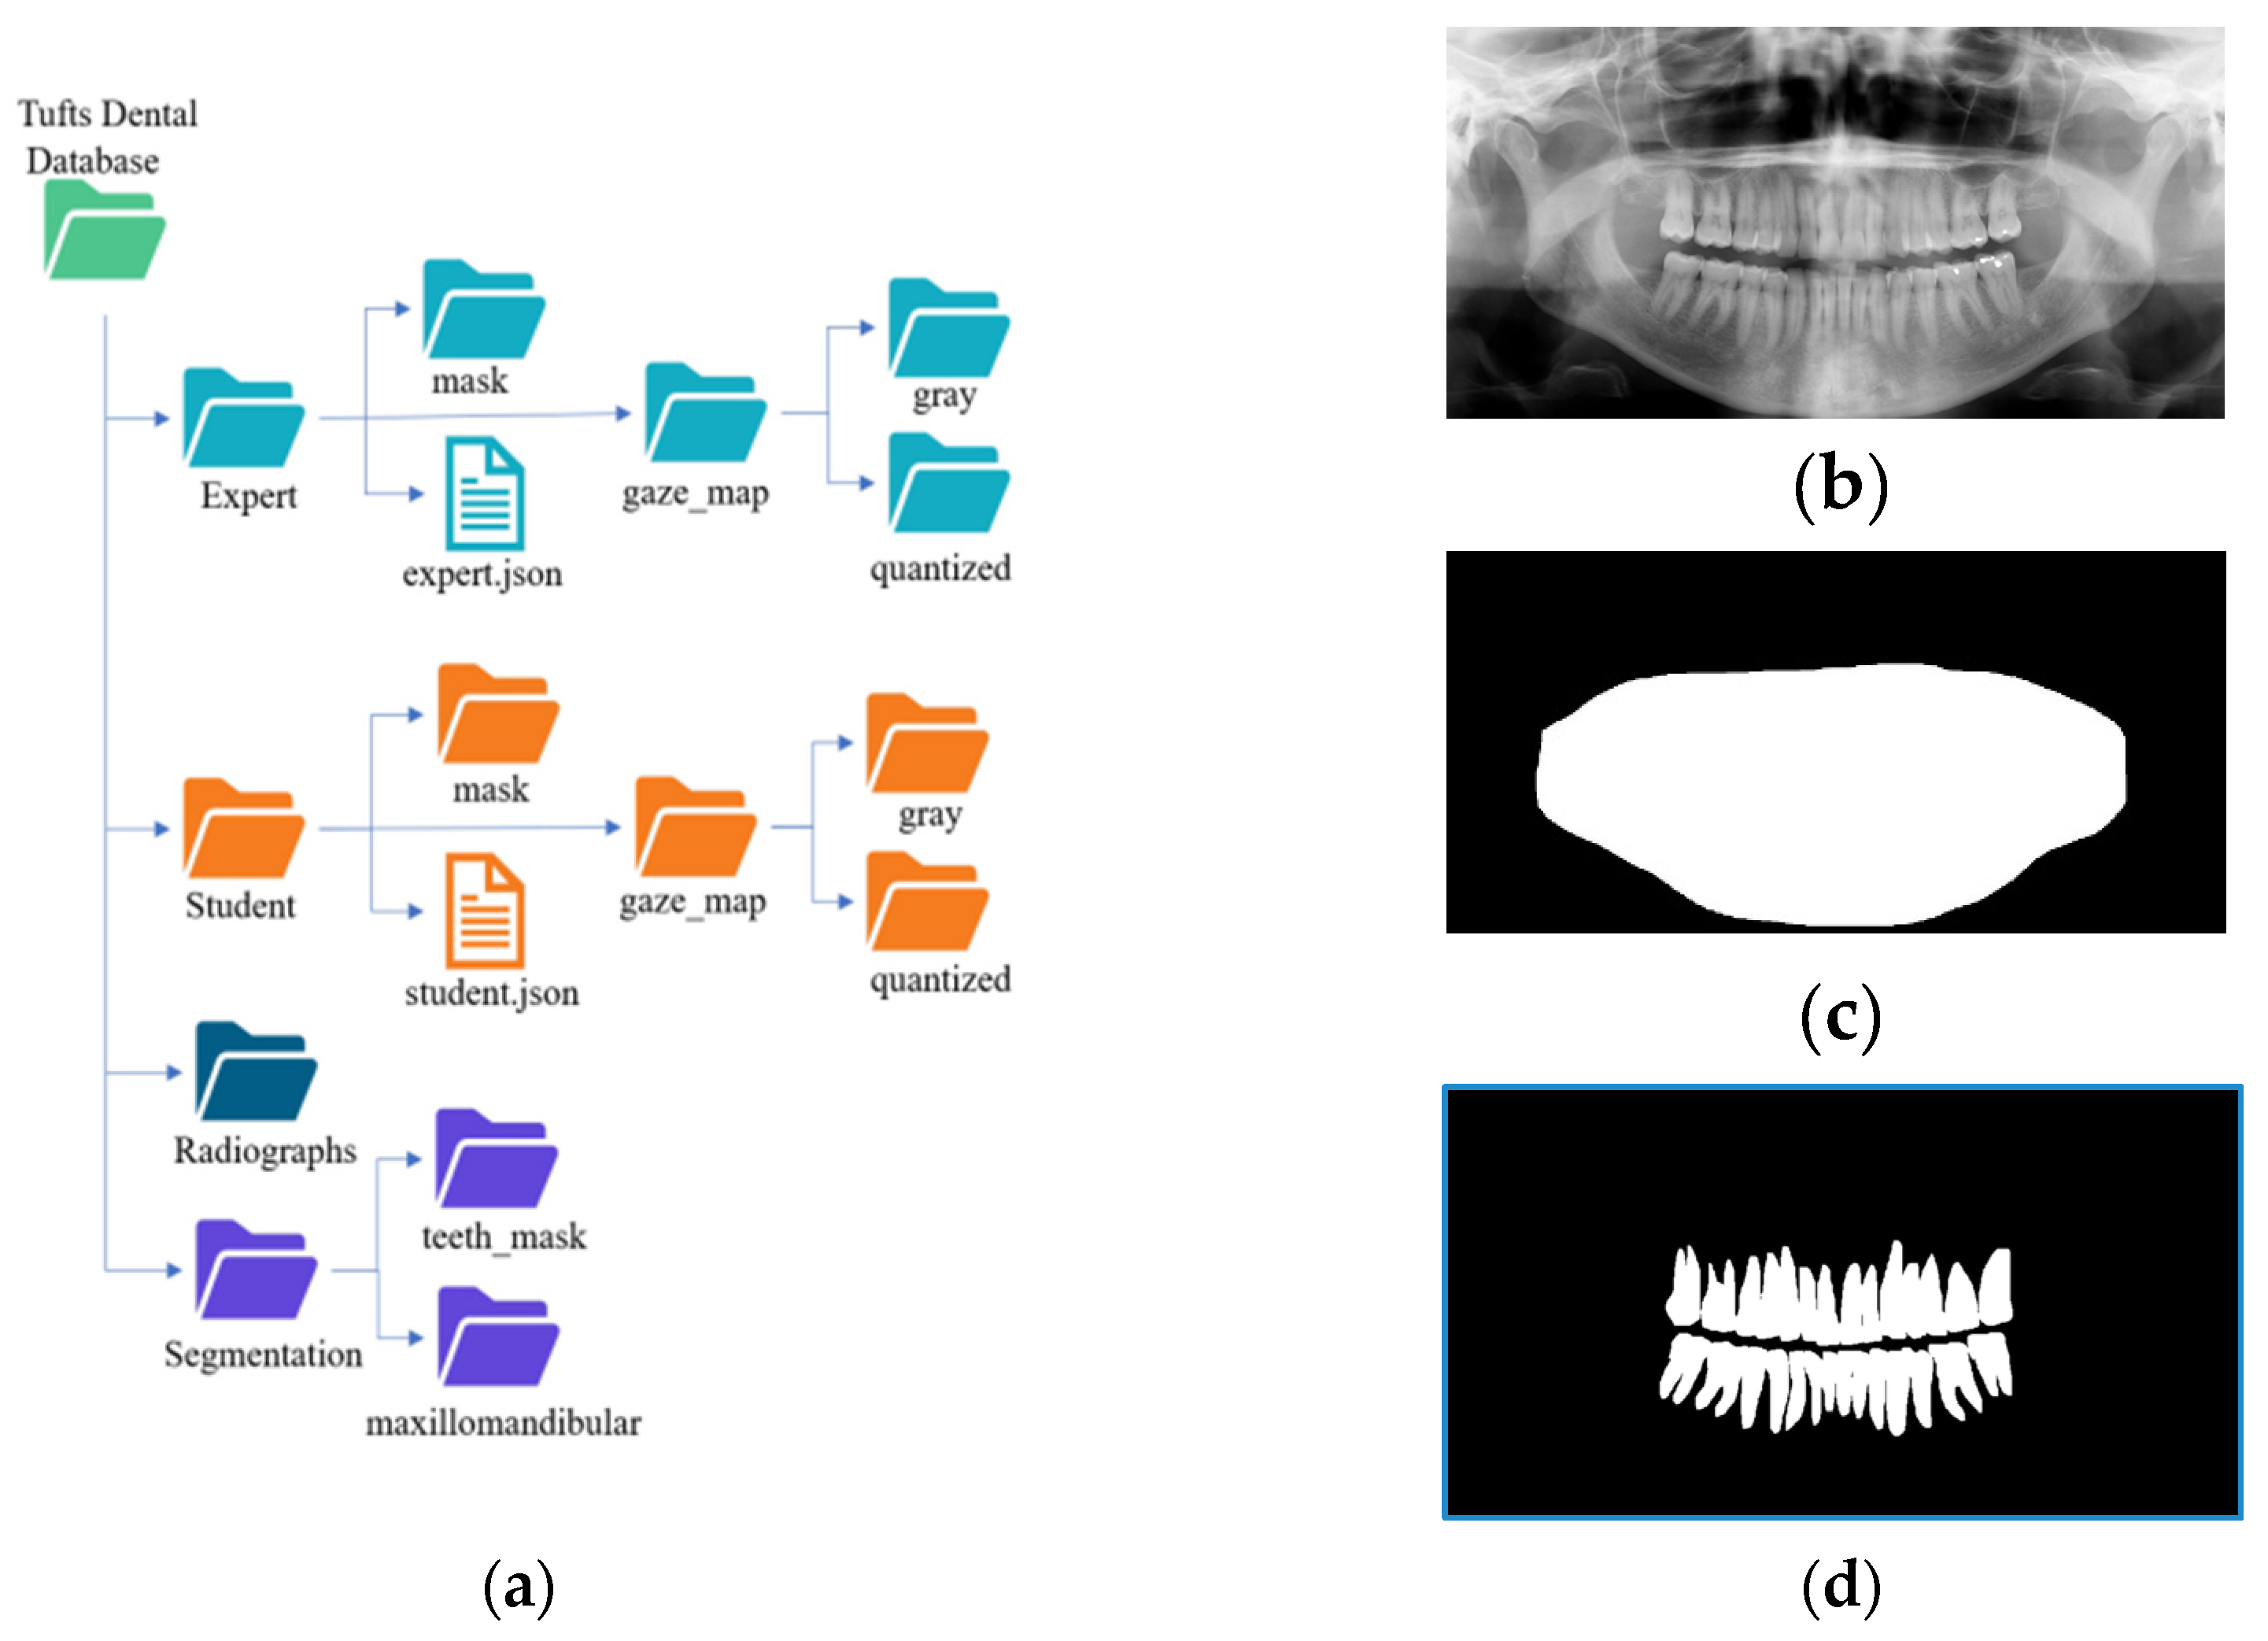
Figure 6.
The preprocessing steps for the dataset. (a) is the original image, (b) after applying the Contrast Limited Adaptive Histogram Equalization. (c) is the maxillomandibular mask highlighting the ROI, and (d) is the final image after doing an AND operation on (b) with (c).
Figure 6.
The preprocessing steps for the dataset. (a) is the original image, (b) after applying the Contrast Limited Adaptive Histogram Equalization. (c) is the maxillomandibular mask highlighting the ROI, and (d) is the final image after doing an AND operation on (b) with (c).
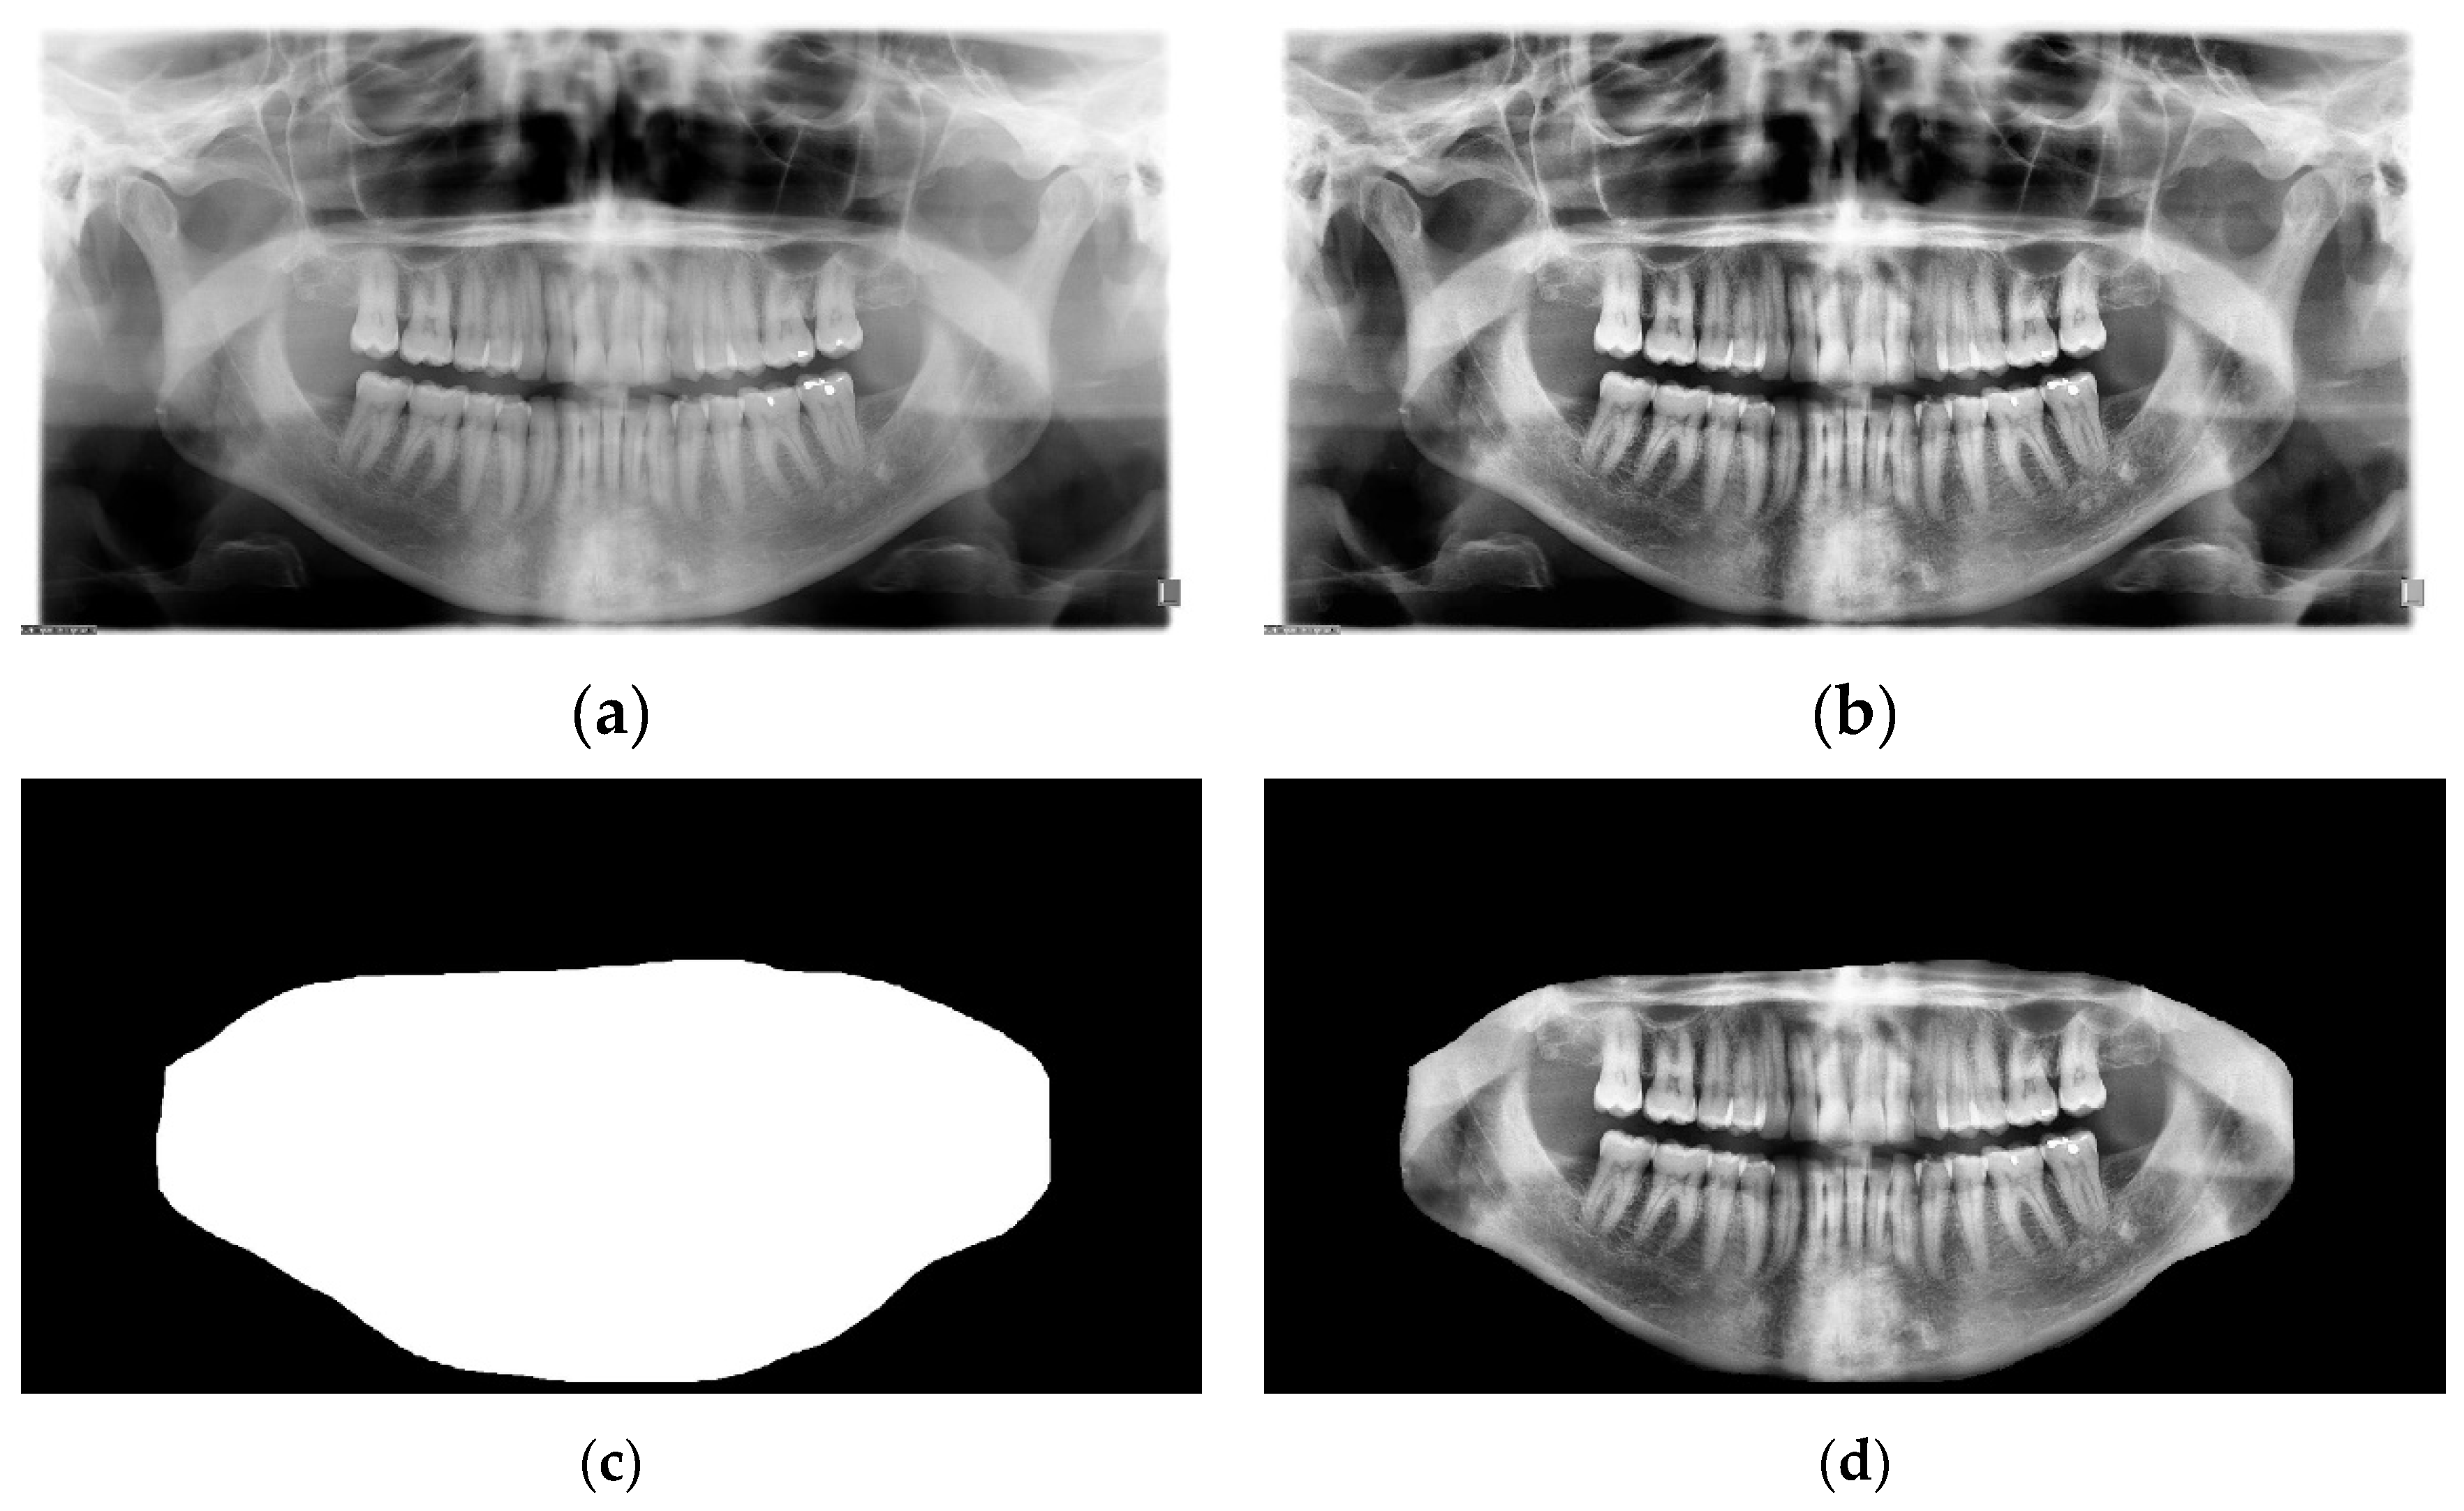
Figure 7.
Figure 7. A plot of the three metrics used to evaluate the proposed study  is the pixel accuracy,
  is the IoU, and
  is the dice score.
is the pixel accuracy, is the IoU, and is the dice score.
Figure 7.
Figure 7. A plot of the three metrics used to evaluate the proposed study is the pixel accuracy, is the IoU, and is the dice score.
is the pixel accuracy, is the IoU, and is the dice score.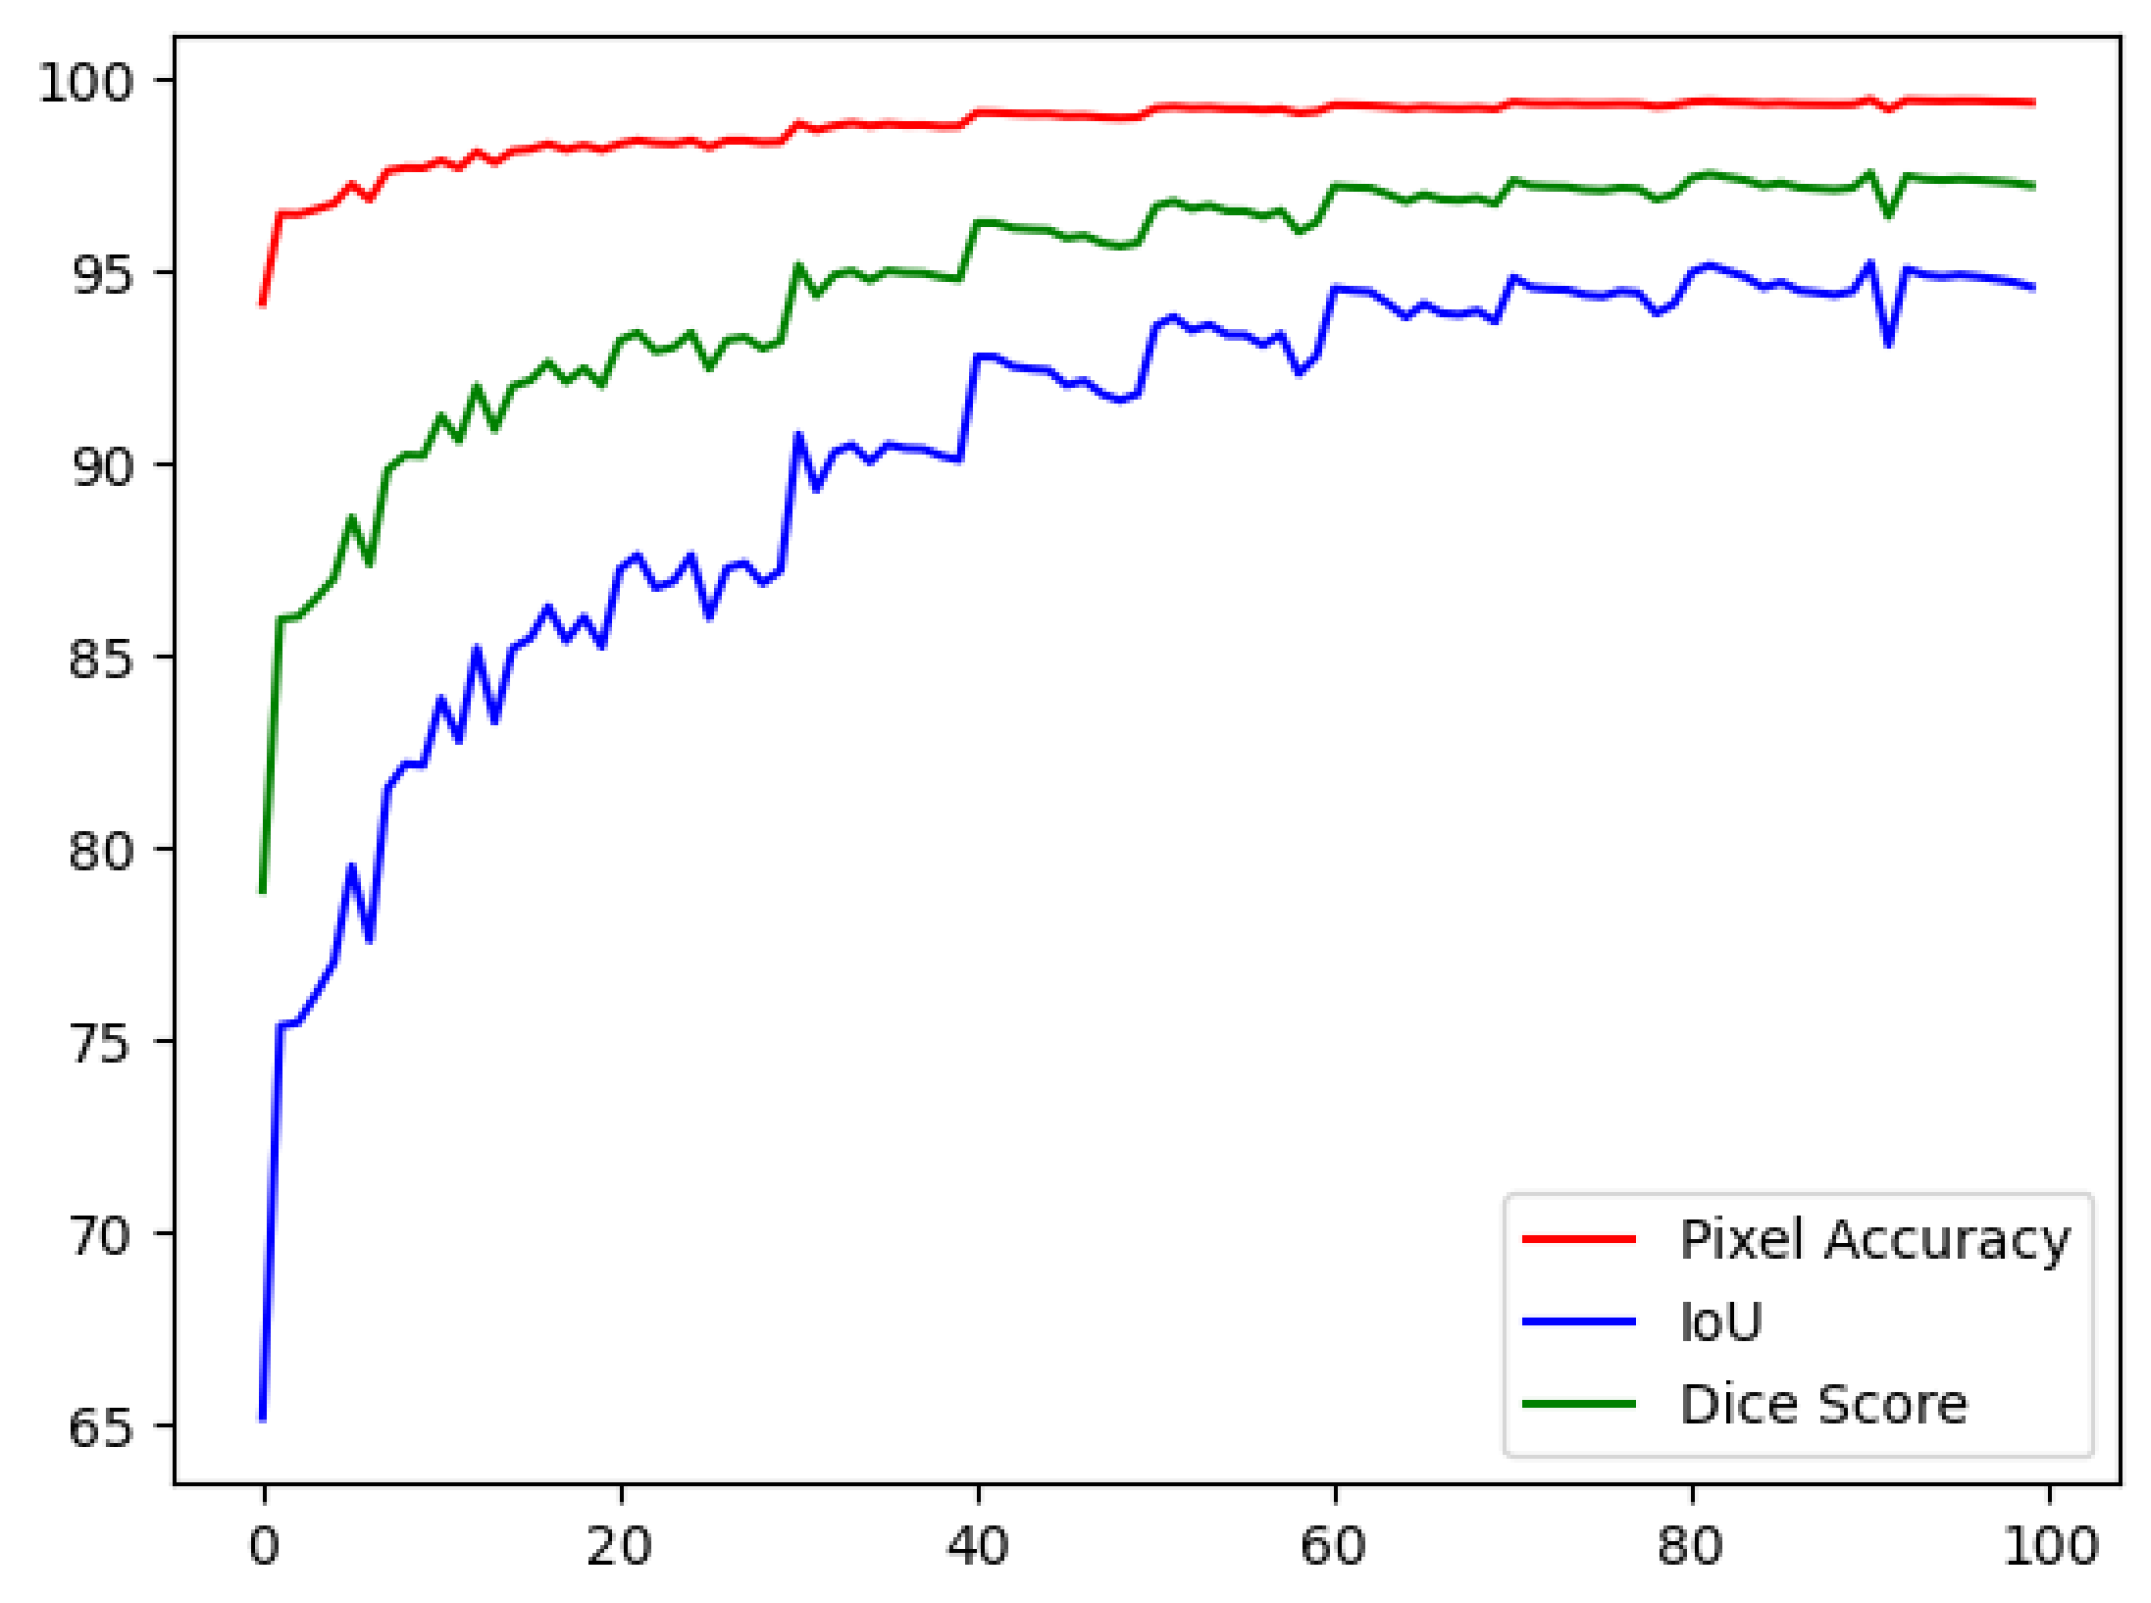
Figure 8.
A sample of the predictions done on the test set. The first example is (a) (ground truth), and (b) is the model's prediction. The second example is (c) (ground truth), and (d) is the model's prediction.
Figure 8.
A sample of the predictions done on the test set. The first example is (a) (ground truth), and (b) is the model's prediction. The second example is (c) (ground truth), and (d) is the model's prediction.
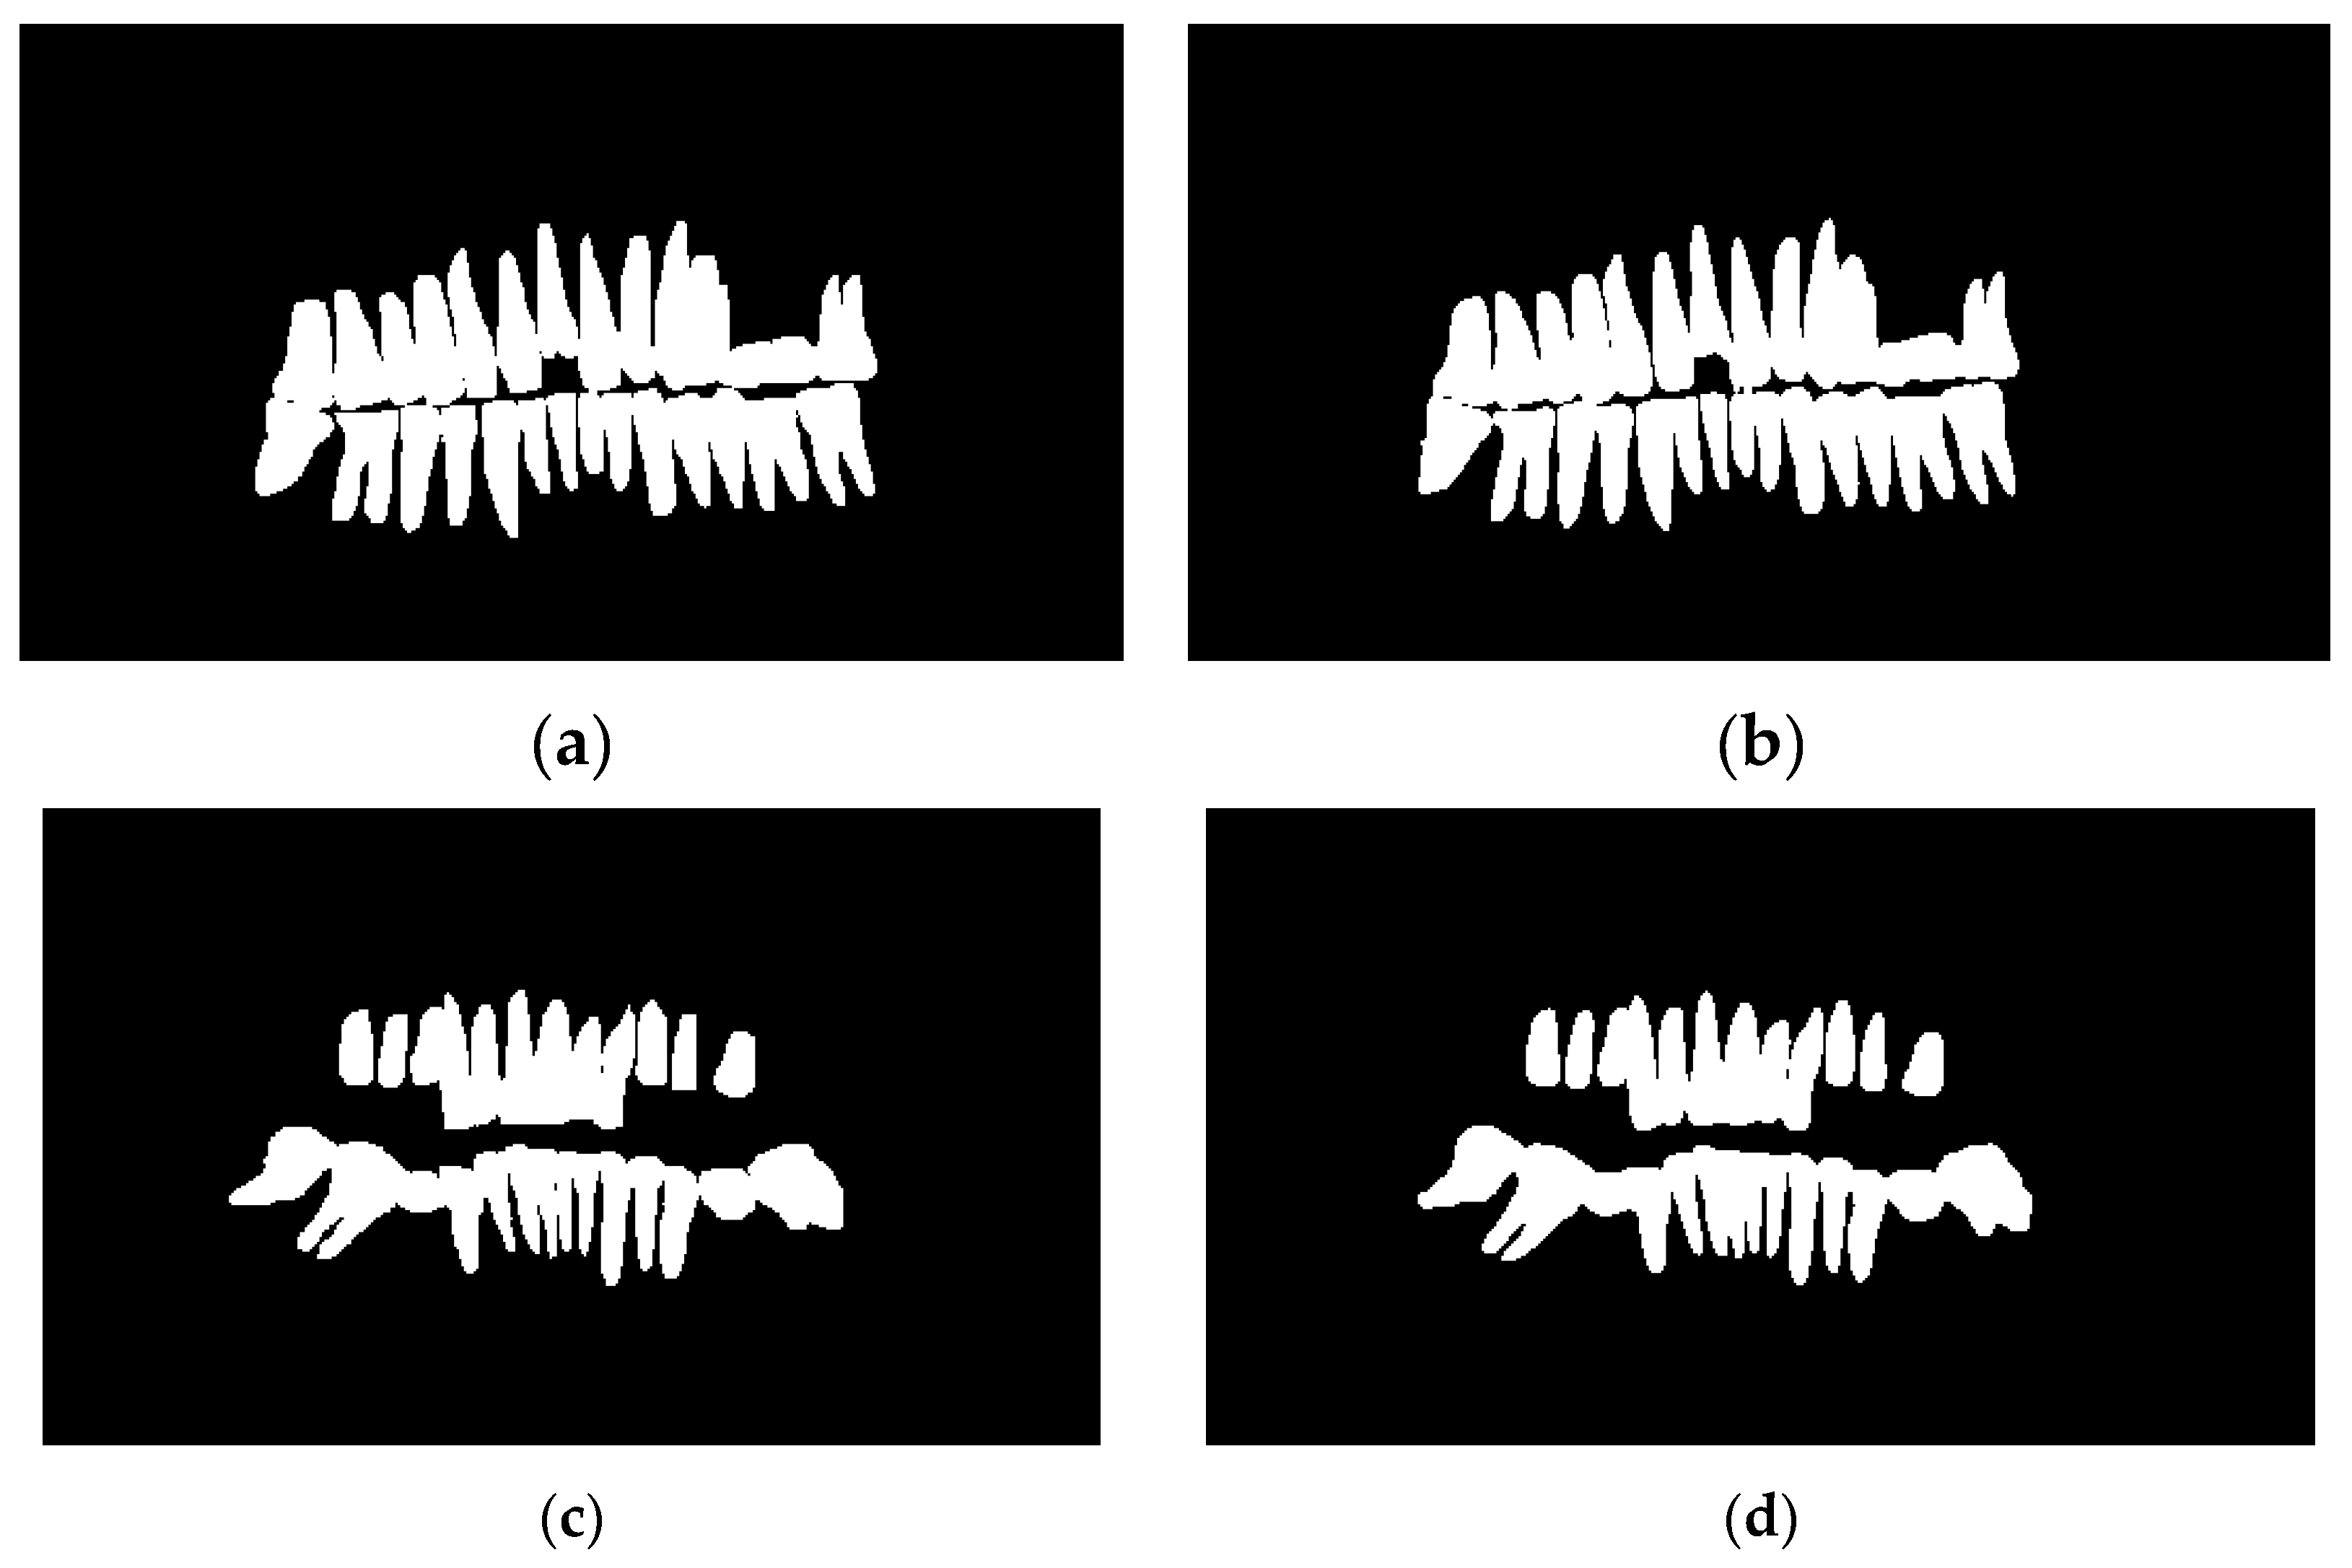

Table 1.
The model's metrics on the ten folds and the average across all folds, fold 10 had the highest metrics.
Table 1.
The model's metrics on the ten folds and the average across all folds, fold 10 had the highest metrics.
| Fold | Metrics (%) | ||
| Dice | IoU | PA | |
| 1 | 90.18 | 82.12 | 97.66 |
| 2 | 92.01 | 85.2 | 98.13 |
| 3 | 93.16 | 87.2 | 98.34 |
| 4 | 94.77 | 90.06 | 98.76 |
| 5 | 95.71 | 91.78 | 98.99 |
| 6 | 96.25 | 92.78 | 99.14 |
| 7 | 96.73 | 93.66 | 99.2 |
| 8 | 96.98 | 94.13 | 99.3 |
| 9 | 97.15 | 94.45 | 99.32 |
| 10 | 97.21 | 94.56 | 99.37 |
| Average | 95.01 | 90.6 | 98.82 |
Table 2.
Comparison between the proposed model and other models tested on the dataset.
| ` | Backbone | Metrics (%) | Data Split | Epochs | Batch Size | Learning Rate | Weight Decay | |||
| Dice | IoU | PA | Train | Test | ||||||
| FPN [39] | ResNet18 | 92.24 | 86.37 | 95.17 | 85% | 15% | 150 | 16 | ||
| U-Net [39] | ResNet18 | 92.27 | 86.42 | 95.11 | 85% | 15% | 150 | 16 | ||
| U-Net++ [39] | ResNet18 | 92.43 | 86.54 | 95.15 | 85% | 15% | 150 | 16 | ||
| PSPNet [39] | ResNet18 | 91.49 | 85.66 | 94.76 | 85% | 15% | 150 | 16 | ||
| DeepLabV3 [39] | ResNet18 | 91.87 | 86.02 | 94.91 | 85% | 15% | 150 | 16 | ||
| DeepLabV3+ [39] | ResNet18 | 91.80 | 86.41 | 95.13 | 85% | 15% | 150 | 16 | ||
| nnU-Net [39] | -- | 90.86 | 86.11 | 94.91 | 85% | 15% | 150 | 16 | ||
| CE-Net [39] | -- | 86.62 | 81.64 | 92.67 | 85% | 15% | 400 | 16 | ||
| Attention U-Net | -- | 95.01 | 90.6 | 98.82 | 10-Fold | 100 | 8 | -- | ||
Disclaimer/Publisher’s Note: The statements, opinions and data contained in all publications are solely those of the individual author(s) and contributor(s) and not of MDPI and/or the editor(s). MDPI and/or the editor(s) disclaim responsibility for any injury to people or property resulting from any ideas, methods, instructions or products referred to in the content. |
© 2023 by the authors. Licensee MDPI, Basel, Switzerland. This article is an open access article distributed under the terms and conditions of the Creative Commons Attribution (CC BY) license (http://creativecommons.org/licenses/by/4.0/).
Copyright: This open access article is published under a Creative Commons CC BY 4.0 license, which permit the free download, distribution, and reuse, provided that the author and preprint are cited in any reuse.


