Submitted:
15 June 2023
Posted:
16 June 2023
You are already at the latest version
Preprints on COVID-19 and SARS-CoV-2
Abstract
Through the ACE2, a main enzyme of the renin-angiotensin system (RAS), the SARS-CoV2 gains access into the cell, resulting in different complications which may extend beyond the RAS and impact the Arachidonic Acid (ArA) pathway. The contribution of the RAS through ArA pathways metabolites in the pathogenesis of COVID-19 is unknown. We investigated whether RAS components and ArA metabolites can be considered biomarkers of COVID-19. We measured the plasma levels of RAS and ArA metabolites using an LC-MS/MS. Results indicate that Ang1-7 levels were significantly lower, whereas Ang II levels were higher in the COVID-19 patients than healthy control individuals. The ratio of Ang1-7/Ang II as an indicator of the RAS classical and protective arms balance was dramatically lower in COVID-19 patients. There was no significant increase in inflammatory 19-HETE and 20-HETE lev-els. The concentration of EETs was significantly increased in COVID-19 patients, whereas the DHETs concentration was repressed. Their plasma levels were correlated with Ang II concentration in COVID-19 patients. In conclusion, evaluating the RAS and ArA pathway biomarkers could provide helpful information for the early detection of high-risk groups, avoid delayed medical attention, facilitate resource allocation and improve patient clinical outcomes to prevent long COVID incidence.
Keywords:
Renin-Angiotensin System
; Arachidonic Acid
; COVID-19
; Biomarkers
1. Introduction
COVID-19, a highly contagious disease caused by SARS-CoV-2, is associated with clinical manifestations ranging from asymptomatic to severely diseased states such as pneumonia, acute respiratory distress syndrome (ARDS) and acute lung injury (ALI), multi-organ failure and even death. COVID-19 has infected over 600 million people during the pandemic resulting in more than 6 million deaths.
The virus enters the cell by binding viral spike protein (S1) to the epithelial cells’ angiotensin-converting enzyme 2 (ACE2), one of the main components of the Renin-Angiotensin System (RAS) [1]. ACE2 converts the pro-inflammatory peptide Angiotensin II (Ang II) to the anti-inflammatory peptide Angiotensin 1-7 (Ang 1-7) [2]. Ang II, initially produced by the enzymatic action of ACE on Ang I, plays a pivotal role in regulating blood pressure, electrolyte and fluid balance and inflammatory pathogenesis. The balance between ACE and ACE2 controls the ratio of Ang II/Ang1-7. The binding of the virus to ACE2 leads to its internalization, causing an imbalance between ACE/ACE2 and consequently resulting in an unopposed Ang II (Figure 1). This results in the accumulation of Ang II, which activates the angiotensin 1 receptor (AT1R), initiating an inflammatory process that leads to a so-called cytokine storm [3]. Treatment with ACE inhibitors (ACEi) and Ang II receptor blockers (ARB) may have the potential to prevent and treat ALI and ARDS resulting from COVID-19 infection [4].
Arachidonic Acid (ArA) is released during an inflammatory response by action of phospholipase 2 (PLA2) and then metabolized by different CYP450 enzymes (ω-hydroxylase and Epoxygenase) to convert into eicosanoids such as hydroxyeicosatetraenoic acids (HETEs) and epoxyeicosatrienoic acids (EETs), respectively (Figure 2). These eicosanoids function in diverse physiological systems associated with inflammation processes [5,6,7]. For instance, 20-HETE, a potent vasoconstrictor, regulates vascular tone, blood flow to specific organs, and sodium and fluid transport to the kidneys [8]. EETs act as an endothelium-derived hyperpolarizing factor and present with potent vasodilatory and anti-inflammatory effects [9].
Like ACE/ACE2 and Ang II/Ang1-7 ratios, the balance between 20-HETE/EETs is critical for the body’s physiological homeostasis. Results from adjuvant arthritis animal studies demonstrate that the RAS and ArA pathways are affected, and the balance between their pro and anti-inflammatory axes is disturbed [10,11]. The two pathways are interrelated and directly correlated, demonstrating their significance in the inflammatory response process. Ang II up-regulates phospholipase A, causing ArA release from the cell membrane, propagating the inflammatory cascade furthermore through the ArA pathway [12]. An imbalance between the vasoconstrictor and vasodilator ArA metabolites occurs due to inflammation impacting the RAS and increasing Ang II levels [13]. COVID-19’s inflammatory response affects the RAS and ArA pathways [14]. Given the systemic and local RAS and ArA pathways play essential roles in the homeostasis of vital organs such as lungs, heart, liver, and kidneys, we expect that the understanding and knowledge of the RAS and ArA pathways biomarkers’ status and their association with patient demographic variables (such as gender, age, body mass index (BMI) and underlying co-morbidities) could help physicians to predict future complications in these organs and plan for better intervention.
Gender disparity is one of the unique traits seen in COVID-19 infections. Recent studies have shown that males are more affected by the disease than females, with higher mortality and hospitalization rate [15,16]. Although the mechanism for this discrepancy has not been elucidated, recent communication reports attributed it to an infectivity mechanism of COVID-19 involving the ACE2 receptor, Type II transmembrane Serine Protease (TMPRSS 2) and androgen receptor [17]. TMPRSS 2 is vital in activating viral spike protein, a crucial step in viral entry. The androgen receptor is a known promoter of TMPRSS2 gene expression [18]. The upregulation of this gene by the androgenic stimulation could explain the higher infectivity in males [19]. In addition, lesser infectivity in children could be explained by the lower expression of the androgen receptors due to underdeveloped sex organs. The phenomenon has been reported for sex hormones’ influence on ACE2 expression and activity in the mouse adipose tissue, kidneys, and myocardium [20,21,22]. While speculation, it seems reasonable that if the sex hormone modulator 17β-Oestradiol affects the expression and activity of the ACE2 receptor and increases Ang1-7 levels; thus, hormone therapy offers a potential supportive treatment for female COVID-19 patients [23].
Based on the data provided by the U.S. Centers for Disease Control (CDC), hospitalization and death increase with age. Compared to the age group of 18-29 years, the hospitalization rate was 5x higher in the 65-74 and 9.1x more in the 75-84 age groups. Similarly, the mortality rate increased by 25x in the 50-64, 65x in the 65-74 and 140x in the 75-84 age groups [24]. COVID-19 hospitalizations rate could also be correlated with obesity and BMI. A study from Johns Hopkins showed that the hospitalization rate increased in adults with obesity and underweight relative to the normal weight [25]. Obesity is also linked to impaired immune function and reduction in lung capacity, thereby increasing the risk of infection and impairing ventilation. As reported by CDC, increased BMI could be related to an increased risk of ICU admission, invasive mechanical ventilation and death [26].
This study aims to analyze the effector RAS peptides (Ang II and Ang 1-7) and relate them with the metabolites of the CYP450-mediated ArA pathway. Additionally, we correlated these metabolites with the demographic variables known to worsen the prognosis of COVID-19 to understand how these variables play a role at the molecular level in the infection. The results of this study help explain how variability in biomarkers combined with individuals’ demographics and co-morbidities correlate with COVID-19 disease intensity. Such knowledge could allow healthcare providers to predict future complications and plan for better interventions.
2. Materials and Methods
2.1. Materials
Ang 1-7 (Anaspec, AS-61039) and Ang II (Anaspec, AS-20633) were purchased from Anaspec Inc. (Fremont, CA, USA). (Asn1, Val5)-Ang II (IS) (Sigma-Aldrich A6402-1MG) was obtained from Sigma Aldrich (St. Louis, MO, USA). Waters C18 SPE cartridges (SepPak WAT020805) were purchased from Waters (Milford, MA, USA). The Ara metabolites reference standards were purchased from Cayman Chemical Company (Ann Arbor, MI): 19-(R)-hydroxyeicosatetraenoic acid (19-HETE) (P/N,10007767), 20-hydroxyeicosatetraenoic acid (20-HETE) (P/N,90030), (±)-5,6-epoxyeicosatrienoic acid (5,6-EET)(P/N,50211), (±)8,9-epoxyeicosatrienoic acid (8,9-EET) (P/N,50351), (±)11,12-epoxyeicosatrienoic acid (11,12-EET)(P/N,50511), (±)14,15-epoxyeicosatrienoic Acid (14,15-EET) (P/N,50651), (±)-5,6-dihydroxyeicosatrienoic acid (5,6-DHET) (P/N, 51211), (±)8,9-dihydroxyeicosatrienoic acid (8,9-DiHT)(P/N,51351), (±)11,12-dihydroxyeicosatrienoic acid (11,12-DHET) (P/N,51511), and (±)14,15-dihydroxyeicosatrienoic acid (14,15-DHET) (P/N,51651). Additionally, the following deuterated internal standards (IS) were also obtained from Cayman: 8,9-EET-d11(deuterium atoms at the 16,16,17,17,18,18,19,19,20,20, and 20 positions; isotopic purity of ≥ 99%). LC-MS grade water, acetonitrile, and formic acid were purchased from Fisher Scientific (Fair Lawn, NJ, USA).
2.2. LC-MS/MS system
LC-MS/MS system comprised of liquid chromatography (Shimadzu, MD, USA) with a binary pump (LC-30AD), an autosampler (SIL-30AC), a controller (CBM-20A), a degasser (DGU-20A5R), a column oven (CTO-20A) and an ABSciex QTRAP 5500 mass spectrometer (SCIEX, Foster City, CA, USA) with electron spray ionization (ESI) source. The chromatograms were monitored using Analyst 1.7 software, and the data were analyzed in MultiQuant 3.0 software (SCIEX, Foster City, CA, USA). The analytes were separated using Synergi™ Fusion-RP column (2.5 µm, 100 x 2 mm) obtained from Phenomenex (Torrance, CA, USA). All the analyses were done in positive ion mode.
2.3. Human subject
The Institutional Review Board approved this study through the IRB-FY2020-273 protocol to analyze de-identified COVID-19 patients’ plasma samples that he will receive from Dr. Elizabeth Middleton, University of Utah, under a signed Material Transfer Agreement. The University of Utah IRB also reviewed and approved all study recruitment materials, educational information, participant instructions for self-collection of specimens, surveys, and the informed consent documents (IRB-00102638) and (IRB-00093575).
The University of Utah research group inclusion criteria for healthy volunteers were: consenting male and female subjects of any self-identified race/ethnicity without acute or chronic illnesses aged 18 and older, and exclusion criteria were the use of any prescription medication, pregnancy, suffering from any acute or chronic medical condition or disease, been hospitalized or had surgery within the preceding 6 weeks or have any prior history of stroke. The inclusion criteria for COVID patients were; ICU admission with confirmed infection and organ dysfunction as defined by a Sequential Organ Failure Assessment (SOFA) ≥ 2 above baseline (if baseline data is unavailable, baseline SOFA is assumed to be 0). All patients have been enrolled in the study within 72 hours of ICU admission. Additionally, individuals diagnosed with COVID and hospitalized with acute COVID infection were enrolled in the study. The exclusion criteria were; admission to the ICU for longer than 72 hours, hemoglobin level < 7gm/dl or clinically significant bleeding.
After the patient has met inclusion criteria and no exclusion criteria are indicated, subjects provide consent using approved IRB protocols. Once subjects have consented, a whole blood sample is drawn within 48 (± 24) hours (study day 0) of a COVID-19 diagnosis. Antiquated blood samples were mixed with a protease inhibitor cocktail solution containing 1.0 mM p-hydroxy mercury benzoate, 30 mM 1,10-phenanthroline, 1.0 mM phenylmethylsulphonyl fluoride, 1.0 mM Pepstatin A and 7.5% EDTA (all from Sigma Aldrich, St. Louis, MO, USA) and treated with 1% Triton X (to inactivate the virus). Plasma was harvested after centrifugation for 10 min at 2500×g and 4 °C and stored at − 80 °C until assayed.
2.4. Sample preparation procedures
2.4.1. Solid-phase extraction (SPE)
Angiotensin peptides (Ang 1-7 and Ang II) were extracted from the plasma samples using solid phase extraction (SPE). SPE was carried out based on a previously established method by Cui et al. with minor changes in the process [27]. Briefly, 200 μL of plasma samples were mixed with 100 μL of the internal standard (50 ng/mL). Then, 1.5 μL of formic Acid was added to make the final concentration of 0.5%. The samples were mixed and loaded onto the Waters C18 SPE cartridges previously preconditioned with 3 ml ethanol and 3 ml deionized water. Samples were then loaded onto the cartridge and allowed to interact with the column by application of a positive nitrogen flow from a positive pressure manifold (Agilent Technologies Inc., Santa Clara, CA, USA). It was then washed with 3 mL of deionized water and eluted with 3 mL of methanol containing 5% formic acid. The eluted solutions were collected and dried using a Savant 200 SpeedVac system (Thermo Fisher Scientific, Waltham, MA, USA). The dried samples were reconstituted in 100 µL of acidified water containing 0.1% formic acid, and 10 µL of samples were injected into the LC-MS/MS to quantify the Ang peptides concentrations.
2.4.2. Liquid-liquid extraction (LLE)
A liquid-liquid extraction (LLE) method using ethyl acetate was utilized to extract the ArA metabolites from the plasma samples. This method was previously validated in our lab [28]. Briefly, 300 µL of plasma sample was mixed with 100 µL of 10,11-EET d11 (IS, 100 ng/mL), and 2 µL of FA was added. The samples were vortexed, and 500 µL of ethyl acetate was added. The resulting biphasic solutions were mixed thoroughly by vortexing for 1 minute and centrifuged at 15,000×g, 4°C, for 15 mins. After centrifugation, 400 µL of the supernatant layer was taken, and for a second extraction step, 500 µL of the ethyl acetate was added again. The organic supernatant phase was mixed with the previous step extract, dried under nitrogen gas, and reconstituted in methanol for LC-MS/MS analysis. 30 µL of the sample was injected into the LC-MS/MS.
2.4.3. LC-MS/MS method for Ang peptides
The patients’ plasma samples were analyzed for Ang 1-7 and Ang II levels by the published LC-MS/MS method [28]. The method was applied for plasma sample analysis after minor modification and validation. Ang peptides were separated by Synergi RP (2 X 100 mm) column with a 2.5 μm particle size (Phenomenex, CA, USA) at ambient temperature. The mobile phase comprised 0.1% formic acid in water (A) and ACN (B).
The gradient time program started from 5% ACN to 30% ACN over 4 min, and the composition was kept constant for 4 to 8 min, lowered to 5% ACN for 9 min, and ran for 10 min. The flow rate was 0.3 mL/min, and the injection volume was 30 μL. Electrospray ionization was used, and analytes were detected using multiple reaction monitoring (MRM) in the positive mode. The optimized source/gas parameters were as follows: curtain gas, 30; collision gas, medium; ion spray voltage, 5500 V; temperature, 300 °C; ion source gas 1 (nebulizer gas), 20 psi; and ion source gas 2 (turbo gas), 25 psi. LC-MS analysis was performed with the single ion recording (SIR) mode, in which the m/z 300.5, 349.6, and 516.6 were used for Ang 1-7, Ang II, and IS, respectively. LC-MS/MS was performed with MRM transitions of m/z 300.6→136 (Ang 1-7), m/z 349.6→136 (Ang II), and m/z 516→769.4 (IS).
2.4.4. LC-MS/MS method for ArA metabolites
The experimental protocol and assay condition were followed with slight optimization to analyze ArA metabolites as previously described [28]. Briefly, eicosanoids were separated using a Synergi RP (2 x 100 mm) column with a 2.5 μm particle size (Phenomenex, CA, USA) at ambient temperature. The mobile phase comprised 0.1% formic acid in water (A) and CAN (B). The mobile phase gradient time program started from 5% ACN to 20% ACN over 2 min, then increased to 55% ACN, kept constant for 2.5 to 6 min, increased to 100% ACN to 8 min, and ran until 9 min. Then, it was subsequently reduced to 5% of ACN over a 10.5 min total run. The flow rate was 0.3 mL/min, and the injection volume was 10 μL. The mass spectrometric condition consists of a triple quadrupole that monitors the m/z transitions by Analyst software. The electrospray ionization technique was used, and analytes’ ion fragments were detected using MRM in the negative mode. The optimized source/gas parameters were as follows: curtain gas, 20 psi; collision gas, medium; ion spray voltage, ~4500 V; temperature, 400 °C; ion source gas 1 (nebulizer gas), 20 psi; and the ion source gas 2 (turbo gas), 25 psi.
2.5. Statistical Analysis
Patients’ demographic data are presented as mean ± standard deviation (SD). The biomarkers data are expressed as mean ± standard error of means (SEM) and analyzed by a standard computer program, GraphPad Prism Software PC software, version 9.3.1, and Statistical Package for Social Sciences (SPSS) version 28 for Windows (SPSS Inc., Chicago, IL, USA). The plasma concentrations of some of the ArA metabolites in some patients were lower than the detection limit; therefore, those patients were excluded in the statistical comparison case by case. Data were tested for normal distribution using the Kolmogorov-Smirnov test and homogeneity of variance using Levene’s test before proceeding with the non-parametric statistical tests. Group comparisons were made using the Mann-Whitney U test, and the correlation for the continuous variables was analyzed using Pearson’s correlation coefficient. The confidence interval was set at 95%, and p < 0.05 was considered statistically significant.
3. Results
3.1. Characteristics of healthy and COVID-19 infected cohort
This study analyzed de-identified plasma samples from 6 healthy subjects and 27 COVID-19 patients. The demographic variables assessed were gender, age, and obesity, and the medication use, as well as a diagnosis of diabetes, hypertension, respiratory co-morbidities, and SOFA score, were considered (Table 1).
The gender composition of the control group was 33% male, and COVID-19 patients were 57.14% male. The higher percentage of males in the patient group can indicate that males are more affected than females; however, in this study, it was only a slight difference between the numbers of male and female participants. The average age for the control group was 34.67 ± 16.23 years, with one participant above the age of 65. Nine of the 27 (33.3 %) patients were older or equal to 65 years old. Most participants (66.7%) in this study were younger than 65. Participants were categorized into five categories based on their BMI. The first was underweight participants with a BMI <18.5, including 1 (3.70%) participant. The second category consists of participants with a normal BMI, or 18.5-24.9, including 4 (14.81%) participants. The third category was overweight, with a BMI of 25-29.9, including 10 (37.04%) participants. The fourth category had a BMI of 30-34.9 and was labeled obese, including 5 (18.52%) participants. The fifth category, with a BMI > 35, the highly obese, including 8 (29.63%) participants. Most participants fell into the category of overweight or above.
Participants reported cardiovascular 22 (81.48%) and respiratory 10 (37.04%) co-morbidities. The major cardiovascular co-morbidities cases were diabetes 15 (55.56%), hypertension 13 (48.15%) and cardiac arrhythmia 4 (14.81%). Regarding respiratory disease, 6 (22.22%) participants had asthma, 2 (7.41%) had COPD, and 2 (7.41%) suffered from other lung diseases. There were 10 (37.04%) current or post-smoker patients. Participants’ medical use history indicates that they were taking statins (10, 37.04%), NSAIDs (5, 18.52%), Aspirin (4, 14.81%) and corticosteroids (2, 7.41%). The SOFA score of the participants was 5.29 ± 2.91, while their platelets count, total bilirubin, serum creatinine and hemoglobin levels were in the normal range. The average WBC (per μl) (10.45 ± 5.52 x10³) was above the normal values (Table 1).
3.2. Effect of COVID-19 infection on the RAS components levels
The plasma levels of Ang 1-7 and Ang II and their ratio in healthy individuals and COVID-19 patients are presented in Figure 3 and Table 2. The Ang 1-7 level was significantly (p < 0.0001) reduced in the patients infected with COVID-19 (1.37 ± 0.20 ng/ml) compared to the control (23.00 ± 5.69 ng/ml) group (Figure 3A). The Ang II concentration, on the other hand, was significantly (p = 0.0002) elevated in the COVID-19 patients (4.61 ± 0.92 ng/ml) compared to the control group (0.29 ± 0.09 ng/ml) (Figure 3B). The Ang 1-7/ II ratio as an indicator of RAS imbalance was also significantly (p < 0.0001) lower in COVID-19 patients (0.96 ± 0.26) than in healthy control individuals (85.81 ± 17.90) (Figure 3C).
3.3. Effect of COVID-19 infection on ArA metabolites
The CYP450-mediated ArA pathway metabolites profiles in healthy control and COVID-19 patients are presented in Table 2. This study measured ten metabolic products of this pathway ( two HETEs, four EETs and four DHETs metabolites). COVID-19 patients did not present with a significant increase in 19-HETE and 20-HETE pro-inflammatory metabolites, but there was a considerable change in anti-inflammatory EETs and DHETs metabolites’ profiles. The level of EETs was dramatically increased in COVID-19 patients, whereas the DHETs concentration was repressed. The total EETs were significantly (p < 0.0001) elevated in the patients’ group (71.05 ± 12.64 ng/ml) compared to the control group (9.83 ± 0.84 ng/ml). The most prevalent EET in the patients’ group was 11,12-EET (41.93 ± 7.79 ng/ml), which was a significantly higher (p < 0.0001) than that of the control group (1.96 ± 0.47 ng/ml). Similarly, concentrations of 8,9-EET (p < 0.05) and 14,15-EET (p < 0.01) were significantly increased in the patients, whereas the 5,6-EET level was comparable between groups (p > 0.05).
The concentration of total-DHETs, as metabolites of EETs, was suppressed due to the COVID-19 infection. In the patients’ cohort, the total-DHETs level was reduced to 5.25 ± 0.58 ng/ml from 19.55 ± 1.78 ng/ml in the control. All four analyzed DHET metabolites were significantly lower in the patients’ group than in the control group (Table 2).
3.4. Correlation of the RAS components and ArA pathway metabolites
The correlation of RAS metabolites level with the ArA metabolites tested to explain how dysregulated RAS affects the ArA pathway status (Table 3, Table 4 and Table 5). In the healthy control group, there was no significant correlation between RAS components and ArA metabolites other than in a few cases. The total-EETs level positively correlated Ang 1-7 (r = 0.8559, p = 0.0296) (Table 3. A similar positive correlation was observed between Ang II with 5,6-DHET (r = 0.8401, p = 0.0363) (Table 4) and Ang 1-7/Ang II with 8,9-EET (r = 0.8589, p = 0.0285) (Table 5). In the case of the COVID-19 patients, the Ang 1-7 levels were negatively correlated with 20-HETE (r = -0.4089, p = 0.0489), while it was not associated with other metabolites. On the other hand, the Ang II level was positively correlated with 19-HETE (r = 0.5052, p = 0.0195), total-HETE (r = 0.5317, p = 0.0131), 5,6-EET (r = 0.6805, p = 0.0007), 14,15-EET (r = 0.6721, p = 0.0008), total-EEts (r = 0.5998, p = 0.0041), 8,9-DHET (r = 0.6290, p = 0.0068) and total-DHETs (r = 0.4661, p = 0.0332). In the case of the Ang 1-7/ang II ratio, there was a trend of negative correlations with ArA metabolites; however, it did not reach a significant level.
Regardless of their disease status, all participants’ Ang 1-7 level was negatively correlated with 11,12-EET (r = -0.3899, p = 0.0597) and total-EET (r = -0.3874, p = 0.0557). It was posetively correlations with 5,6-DHET (r = 0.7496, p = 0.0002), 11,12-DHET (r = 0.6704, p = 0.0122), 14,15-DHET (r = 0.5930, p = 0.0018) and total-DHETs (r = 0.7612, p < 0.0001). Although there was a positive correlation trend between Ang 1-7 and 8,9-DHET (r = 0.4141), it did not reach a significant level (p = 0.0695). Interestingly, the Ang II level did not correlate significantly with any ArA metabolites. The ratio of Ang 1-7/Ang II was strongly correlated with all DHETs and followed a similar trend as of Ang 1-7 (Table 6).
3.5. Effect of biological variables on the RAS Components and ArA metabolites level
Based on the age of the patients, they were divided into geriatric (>=65) and non-geriatric (<65). Ang 1-7 was not affected by the age of the patients, but the Ang II level was higher in the senior group. However, the difference was insignificant (p = 0.4921). The ratio of Ang 1-7/Ang II also seems to be unaffected by age (p = 0.8705) (Figure 4, upper panel). The male patients (5.36 ± 1.44) present insignificantly higher Ang II levels than females (3.00 ± 0.83, p = 0.3758). The Ang 1-7 level was similar in both groups, while the ratio of Ang 1-7/Ang II had an elevated trend in females (Figure 4, middle panel). Body weight differences in COVID-19 patients did not impact the Ang 1-7 level. Although there was a trend in increasing Ang II levels and a decrease in Ang 1-7/ Ang II ratio in patients with BMI > 30, such differences were not significantly different (Figure 4, lower panel).
The COVID-19 patients’ age, gender and BMI impacts on ArA metabolites follow similar patterns to the RAS components, which did not reach statistically significant differences (data not shown).
Finally, the correlation of the Sequential Organ Failure Assessment (SOFA) score, a scoring system used to assess the performance of several organ systems in the body, was tested in COVID-19 patients. The higher the SOFA score, the higher the likely mortality. The SOFA score was positively correlated with Ang II (r = 0.41717, p = 0.0426). The sign of such correlation was negative with the 19-HETE ( r = -0.4842, p = 0.0165) and total-HETE ( r = -0.4828, p = 0.0169), and total DHET level (r = -0.5737, p = 0.0034). The EET levels did not present any correlations (Table 7).
4. Discussion
In this study, we evaluated and compared the RAS components (Ang1-7, Ang II plasma levels, Ang1-7/Ang II ratio) and ArA metabolites (HETEs, EETs and DHETs) between healthy controls and COVID-19 patients to determine whether the RAS axes were unbalanced in COVID-19 patients and impacted on the ArA pathway and its metabolites profiles.
Our results indicate that Ang1-7 levels were significantly lower, whereas Ang II levels were prominently higher in the COVID-19 patients than in the healthy control individuals (Figure 3 and Table 2). The ratio of Ang1-7/Ang II as an indicator of the balance between the RAS classical and protective arms was dramatically lower in COVID-19 patients. Such imbalance is attributed to the deactivation of the ACE2 enzyme by the SARS-CoV-2 virus and corresponded with measured higher Ang II plasma levels in these patients. It is worth mentioning the observed results indicate that both arms of the RAS are affected by this viral infection. The binding of the virus to ACE2 leads to its down-regulation, causing an imbalance between ACE/ACE2 and consequently resulting in a lower Ang1-7/Ang II ratio and a surge of an unopposed Ang II and cytokine storm to impose tissue injury depicted in Figure 1, signifying the lung as a typically impacted primary tissue by the virus. The RAS is closely linked to cardiovascular function, and its dysregulation in COVID-19 can have cardiovascular implications. Ang II can promote vasoconstriction, oxidative stress, and prothrombotic effects, increasing the risk of cardiovascular complications reported in infected individuals. The inflammatory response triggered by the dysregulated RAS can damage endothelial cells, disrupt the integrity of blood vessels, and contribute to cardiovascular dysfunction. Such phenomenon has been supported by an animal model of arthritis, where an imbalance of the cardiac and renal RAS components explains the cardio-renal toxicity [10]. Treatment with ACE inhibitors (ACEi) and Ang II receptor blockers (ARB), which are commonly used to manage hypertension, could be beneficial in COVID-19 by potentially mitigating the harmful effects of an imbalanced RAS [29]. However, more research is needed to fully understand the complex interactions between RAS and COVID-19 and determine the optimal therapeutic approaches.
We also observed that in COVID-19 patients, there was no significant increase in inflammatory 19-HETE and 20-HETE—however, there was a remarkable change in anti-inflammatory EETs and DHETs profiles (Table 2). The level of EETs was dramatically increased in COVID-19 patients, whereas the DHETs concentration was repressed. ArA metabolism is a complex process involving several enzymes, including CYP450 enzymes, which play a role in converting ArA into various bioactive metabolites, such as HETEs, EETs and DHETs. Research on the specific impacts of COVID-19 on ArA metabolites through CYP enzymes is limited; however, it is known that COVID-19 can lead to a dysregulated immune response and excessive inflammation in some individuals. Inflammatory processes, including the production of ArA metabolites, are tightly regulated by various factors, such as cytokines and other inflammatory mediators. It is plausible that COVID-19-induced inflammation could indirectly impact the ArA pathway by altering the expression or activity of enzymes involved in its metabolism, including CYP enzymes. It has been reported that CYP enzyme expression was affected by the excessive inflammatory response due to COVID-19 viral infection [30]. For example, CYP4A1 and CYP4A2 enzymes convert ArA to HETEs and promote the expression of inflammatory cytokines and adhesion molecules [31].
Furthermore, the CYP epoxygenase enzyme families of CYP2C and CYP2J generate EETs from ArA, resulting in anti-inflammation, vasodilation, and proangiogenic effects [32]. Multiple studies demonstrated that both EETs and HETEs play a role in lung and kidney injury [33,34,35]. These reports suggested that the dysregulation of these enzymes may contribute to the inflammatory response observed in COVID-19 patients. In the current study, the observed increase in EETs and decrease in DHETs levels could be attributed to the body’s defense mechanism in resolving the inflammation by up-regulation of CYP epoxygenase enzymes and down-regulation of the sEH. It is possible that other enzymatic mechanisms could also be responsible for this phenomenon, and the proposed claim needs further investigation to be confirmed.
Evidence elucidates that the cross-talk between the RAS and CYP-mediated ArA pathway can significantly affect inflammatory disease manifestations [11] and explain vascular complications observed in COVID-19 patients. A possible link between ArA metabolites level and ACE enzyme induction has been reported [36]. Consequently, the elevated 20-HETE level and low EETs plasma concentrations in patients associated with renal and vascular complications were correlated with plasma renin activity [37]. Additionally, investigation of the association between 20-HETE and the RAS components in the rat has shown similar patterns on increased blood pressure and over-expression of CYP4A2 cDNA, which was normalized by the administration of lisinopril, losartan, or a 20-HETE antagonist [38]. The different results on the ArA metabolites observed in this study could be explained by the activation of AT2R by the high concentration of Ang II in COVID-19 patients. It has been reported that AT2R activation favors EETs production, inhibits pro-inflammatory cytokine intracellular signaling [39], and probably helps patients to recover from this viral infection. The anti-inflammatory effects of direct AT2R stimulation have been reported using selective peptide [40] and nonpeptide [41] AT2R agonists. These anti-inflammatory effects do not counteract Ang II-induced, AT1R-mediated pro-inflammatory actions. AT2R- stimulation antagonizes the effects of TNF-α or other non-RAS stimuli, such as growth factors and has been reported previously [42,43,44]. The Ang II signaling through AT2R activation seems to interfere with other non-RAS signaling cascades coupled with harmful stimuli, and ARBs seem unable to block cytokine-induced IL-6 expression [45]. AT2R stimulation reduces TNF-α–induced IL-6 expression by activating protein phosphatases, increasing EETs synthesis and inhibiting NF-κB activity [39]. The observed higher concentration of Ang II in COVID-19 patients due to internalization and inactivation of the ACE 2 could explain the elevated EETs levels and their positive correlation with Ang II levels (Table 2, Table 3, Table 4, Table 5 and Table 6). Previous reports on the protective effects of AT2R in other inflammatory conditions support this finding [46,47].
Additionally, it has been reported that in an in vitro study, Ang 1-7, through activation of the Mas receptor, increased the release of ArA, which the Mas antagonist abolished. Neither AT1R nor AT2R antagonists could block this effect [48]. The current studies observed a negative trend of correlations between EETs and Ang1-7 or Ang1-7/Ang II in COVID-19 patients are in concert with that report (Table 3 and Table 5).
Although there were differences in the RAS component and ArA metabolites levels based on age, sex, BMI and co-morbidities, such distinctions did not reach a significant level (Figure 4 and Figure 5). The lack of detection of such differences could be related to our study’s limitation on enrolling a small number of patients. It is most likely that such a distinction could be made in more extensive studies.
It has been reported that the SOFA score can be used as a tool in combination with other disease severity scores in predicting mortality in COVID-19 patients [49]. Our observed association can explain the potential and positive correlation of the SOFA score with Ang II, 19- and total HETE and DHET, indicating that these RAS components and ArA metabolites directly or indirectly impact COVID-19 patients’ organ function.
Limitations
One significant limitation of this study was the small number of patients, limiting its potential for generalizability. This study’s findings and conclusions may not apply to a larger population or diverse demographics, as the sample size may not adequately represent the variations and complexities present in the broader population. However, increasing the study’s statistical power by enrolling a larger population could enhance the ability to detect significant correlations accurately, as some trends have already been seen.
5. Conclusion
Despite the limitations associated with the small sample size of this study, it serves as a valuable starting point for generating hypotheses and exploring preliminary trends. We identified potential associations or patterns that can later be investigated in larger, more rigorous studies. The established association of the RAS in the pathogenesis of COVID-19 and the involvement of other cross-talking pathways, such as the ArA pathway, in disease progress and their impact on the patient’s outcome highlights their importance and suggest the usefulness of assessment of their components level as diagnostic and prognostic tools. The findings of this study provide a foundation for future research and serve as a basis for designing more comprehensive studies. Overall, evaluating and including the RAS and ArA pathway biomarkers in decision strategies could provide early detection of high-risk groups, avoid delayed medical attention, facilitate resource allocation and improve clinical outcomes in COVID-19 patients.
Author Contributions
Conceptualization, A.A.-H. and MN; methodology, A.A.-H. and BG; validation, A.A.-H. and BG; formal analysis, A.A.-H., BG, and SK..P; investigation, A.A.-H., and BG; resources, A.A.-H., EM and RAC; data curation, A.A.-H. and BG; writing—original draft preparation, BG and A.A.-H.; writing—review and editing, A.A.-H. and BG; visualization, A.A.-H. and BG; supervision, A.A.-H.; project administration, A.A.-H.; funding acquisition, A.A.-H. and MN All authors have read and agreed to the published version of the manuscript.
Funding
This research received no external funding and was supported by the ISU’s Office for Research Internal Small Grant Program.
Institutional Review Board Statement
The study was conducted in accordance with the Declaration of Helsinki and approved by the Institutional Review Boards of Idaho State University (IRB- FY2020-273) and the University of Utah (IRB-00102638 and IRB-00093575).
Informed Consent Statement
Informed consent was obtained from all subjects involved in the study at the University of Utah, and de-identified the patients’ samples were sent to ISU for analysis.
Data Availability Statement
The data presented in this study are available on request from the corresponding author.
Conflicts of Interest
The authors declare no conflict of interest.
References
- Jackson, C.B.; Farzan, M.; Chen, B.; Choe, H. Mechanisms of SARS-CoV-2 entry into cells. Nature Reviews Molecular Cell Biology 2022, 23, 3–20. [Google Scholar] [CrossRef] [PubMed]
- Coto, E.; Avanzas, P.; Gómez, J. The Renin–Angiotensin–Aldosterone System and Coronavirus Disease 2019. European Cardiology Review 2021, 16, e07. [Google Scholar] [CrossRef] [PubMed]
- Mahmudpour, M.; Roozbeh, J.; Keshavarz, M.; Farrokhi, S.; Nabipour, I. COVID-19 cytokine storm: The anger of inflammation. Cytokine 2020, 133, 155151. [Google Scholar] [CrossRef] [PubMed]
- South, A.M.; Brady, T.M.; Flynn, J.T. ACE2 (Angiotensin-Converting Enzyme 2), COVID-19, and ACE Inhibitor and Ang II (Angiotensin II) Receptor Blocker Use During the Pandemic. Hypertension 2020, 76, 16–22. [Google Scholar] [CrossRef] [PubMed]
- Das, U.N. Arachidonic acid in health and disease with focus on hypertension and diabetes mellitus: A review. J Adv Res 2018, 11, 43–55. [Google Scholar] [CrossRef]
- Samuelsson, B. Arachidonic acid metabolism: role in inflammation. Z Rheumatol 1991, 50, 3–6. [Google Scholar] [PubMed]
- Panigrahy, D.; Kaipainen, A.; Greene, E.R.; Huang, S. Cytochrome P450-derived eicosanoids: the neglected pathway in cancer. Cancer and Metastasis Reviews 2010, 29, 723–735. [Google Scholar] [CrossRef]
- Waldman, M.; Peterson, S.J.; Arad, M.; Hochhauser, E. The role of 20-HETE in cardiovascular diseases and its risk factors. Prostaglandins Other Lipid Mediat 2016, 125, 108–117. [Google Scholar] [CrossRef] [PubMed]
- Gross, G.J.; Hsu, A.; Falck, J.R.; Nithipatikom, K. Mechanisms by which epoxyeicosatrienoic acids (EETs) elicit cardioprotection in rat hearts. J Mol Cell Cardiol 2007, 42, 687–691. [Google Scholar] [CrossRef]
- Asghar, W.; Aghazadeh-Habashi, A.; Jamali, F. Cardiovascular effect of inflammation and nonsteroidal anti-inflammatory drugs on renin-angiotensin system in experimental arthritis. Inflammopharmacology 2017. [Google Scholar] [CrossRef]
- Aghazadeh-Habashi, A.; Asghar, W.; Jamali, F. Drug-Disease Interaction: Effect of Inflammation and Nonsteroidal Anti-Inflammatory Drugs on Cytochrome P450 Metabolites of Arachidonic Acid. J Pharm Sci 2018, 107, 756–763. [Google Scholar] [CrossRef]
- Touyz, R.M.; Berry, C. Recent advances in angiotensin II signaling. Brazilian Journal of Medical and Biological Research 2002, 35. [Google Scholar] [CrossRef] [PubMed]
- Wu, C.C.; Gupta, T.; Garcia, V.; Ding, Y.; Schwartzman, M.L. 20-HETE and blood pressure regulation: clinical implications. Cardiol Rev 2014, 22, 1–12. [Google Scholar] [CrossRef]
- Hoxha, M. What about COVID-19 and arachidonic acid pathway? Eur J Clin Pharmacol 2020, 76, 1501–1504. [Google Scholar] [CrossRef] [PubMed]
- La Vignera, S.; Cannarella, R.; Condorelli, R.A.; Torre, F.; Aversa, A.; Calogero, A.E. Sex-Specific SARS-CoV-2 Mortality: Among Hormone-Modulated ACE2 Expression, Risk of Venous Thromboembolism and Hypovitaminosis D. International Journal of Molecular Sciences 2020, 21, 2948. [Google Scholar] [CrossRef] [PubMed]
- Gebhard, C.; Regitz-Zagrosek, V.; Neuhauser, H.K.; Morgan, R.; Klein, S.L. Impact of sex and gender on COVID-19 outcomes in Europe. Biology of Sex Differences 2020, 11, 29. [Google Scholar] [CrossRef]
- Mjaess, G.; Karam, A.; Aoun, F.; Albisinni, S.; Roumeguère, T. COVID-19 and the male susceptibility: the role of ACE2, TMPRSS2 and the androgen receptor. Progrès en Urologie 2020, 30, 484–487. [Google Scholar] [CrossRef]
- Lin, B.; Ferguson, C.; White, J.T.; Wang, S.; Vessella, R.; True, LD; Hood, L. ; Nelson, P.S. Prostate-localized and Androgen-regulated Expression of the Membrane-bound Serine Protease TMPRSS21. Cancer Research 1999, 59, 4180–4184. [Google Scholar]
- Song, H.; Seddighzadeh, B.; Cooperberg, M.R.; Huang, F.W. Expression of ACE2, the SARS-CoV-2 Receptor, and TMPRSS2 in Prostate Epithelial Cells. Eur Urol 2020, 78, 296–298. [Google Scholar] [CrossRef]
- Dalpiaz, P.L.; Lamas, A.Z.; Caliman, I.F.; Ribeiro, R.F., Jr.; Abreu, G.R.; Moyses, M.R.; Andrade, T.U.; Gouvea, S.A.; Alves, M.F.; Carmona, A.K.; et al. Sex Hormones Promote Opposite Effects on ACE and ACE2 Activity, Hypertrophy and Cardiac Contractility in Spontaneously Hypertensive Rats. PLoS One 2015, 10, e0127515. [Google Scholar] [CrossRef]
- Gupte, M.; Thatcher, S.E.; Boustany-Kari, C.M.; Shoemaker, R.; Yiannikouris, F.; Zhang, X.; Karounos, M.; Cassis, L.A. Angiotensin converting enzyme 2 contributes to sex differences in the development of obesity hypertension in C57BL/6 mice. Arterioscler Thromb Vasc Biol 2012, 32, 1392–1399. [Google Scholar] [CrossRef]
- Gupte, M.; Boustany-Kari, C.M.; Bharadwaj, K.; Police, S.; Thatcher, S.; Gong, M.C.; English, VL; Cassis, L. A. ACE2 is expressed in mouse adipocytes and regulated by a high-fat diet. Am J Physiol Regul Integr Comp Physiol 2008, 295, R781–788. [Google Scholar] [CrossRef] [PubMed]
- Ji, H.; Menini, S.; Zheng, W.; Pesce, C.; Wu, X.; Sandberg, K. Role of angiotensin-converting enzyme 2 and angiotensin(1-7) in 17beta-oestradiol regulation of renal pathology in renal wrap hypertension in rats. Exp Physiol 2008, 93, 648–657. [Google Scholar] [CrossRef]
- Risk for COVID-19 Infection, Hospitalization, and Death By Age Group. Available online: https://www.cdc.gov/coronavirus/2019-ncov/covid-data/investigations-discovery/hospitalization-death-by-age.html (accessed on 14 June, 2023).
- Body Mass Index and Risk for COVID-19-Related Hospitalization, Intensive Care Unit Admission, Invasive Mechanical Ventilation, and Death – United States, March-20; Johns Hopkins. 20 December.
- Obesity, Race/Ethnicity, and COVID-19. Available online: https://www.cdc.gov/obesity/data/obesity-and-covid-19.html (accessed on June 14, 2023).
- Cui, L.; Nithipatikom, K.; Campbell, W.B. Simultaneous analysis of angiotensin peptides by LC–MS and LC–MS/MS: Metabolism by bovine adrenal endothelial cells. Analytical Biochemistry 2007, 369, 27–33. [Google Scholar] [CrossRef] [PubMed]
- Ranjit, A.; Khajeh pour, S.; Aghazadeh-Habashi, A. Bone-Targeted Delivery of Novokinin as an Alternative Treatment Option for Rheumatoid Arthritis. Pharmaceutics 2022, 14, 1681. [Google Scholar] [CrossRef]
- South, A.M.; Brady, T.M.; Flynn, J.T. ACE2 (Angiotensin-Converting Enzyme 2), COVID-19, and ACE Inhibitor and Ang II (Angiotensin II) Receptor Blocker Use During the Pandemic: The Pediatric Perspective. Hypertension 2020, 76, 16–22. [Google Scholar] [CrossRef] [PubMed]
- Wang, G.; Xiao, B.; Deng, J.; Gong, L.; Li, Y.; Li, J.; Zhong, Y. The Role of Cytochrome P450 Enzymes in COVID-19 Pathogenesis and Therapy. Front Pharmacol 2022, 13, 791922. [Google Scholar] [CrossRef] [PubMed]
- Imig, J.D. Epoxyeicosatrienoic Acids and 20-Hydroxyeicosatetraenoic Acid on Endothelial and Vascular Function. Adv Pharmacol 2016, 77, 105–141. [Google Scholar] [CrossRef]
- Zhang, G.; Kodani, S.; Hammock, B.D. Stabilized epoxygenated fatty acids regulate inflammation, pain, angiogenesis and cancer. Progress in Lipid Research 2014, 53, 108–123. [Google Scholar] [CrossRef] [PubMed]
- Stading, R.; Couroucli, X.; Lingappan, K.; Moorthy, B. The role of cytochrome P450 (CYP) enzymes in hyperoxic lung injury. Expert Opin Drug Metab Toxicol 2021, 17, 171–178. [Google Scholar] [CrossRef] [PubMed]
- Hoff, U.; Bubalo, G.; Fechner, M.; Blum, M.; Zhu, Y.; Pohlmann, A.; Hentschel, J.; Arakelyan, K.; Seeliger, E.; Flemming, B.; et al. A synthetic epoxyeicosatrienoic acid analogue prevents the initiation of ischemic acute kidney injury. Acta Physiologica 2019, 227, e13297. [Google Scholar] [CrossRef] [PubMed]
- Zhu, Y.; Ding, A.; Yang, D.; Cui, T.; Yang, H.; Zhang, H.; Wang, C. CYP2J2-produced epoxyeicosatrienoic acids attenuate ischemia/reperfusion-induced acute kidney injury by activating the SIRT1-FoxO3a pathway. Life Sci 2020, 246, 117327. [Google Scholar] [CrossRef] [PubMed]
- Cheng, J.; Garcia, V.; Ding, Y.; Wu, C.-C.; Thakar, K.; Falck, J.R.; Ramu, E.; Schwartzman, M.L. Induction of Angiotensin-Converting Enzyme and Activation of the Renin–Angiotensin System Contribute to 20-Hydroxyeicosatetraenoic Acid–Mediated Endothelial Dysfunction. Arteriosclerosis, Thrombosis, and Vascular Biology 2012, 32, 1917–1924. [Google Scholar] [CrossRef] [PubMed]
- Minuz, P.; Jiang, H.; Fava, C.; Turolo, L.; Tacconelli, S.; Ricci, M.; Patrignani, P.; Morganti, A.; Lechi, A.; McGiff, J.C. Altered release of cytochrome p450 metabolites of arachidonic acid in renovascular disease. Hypertension 2008, 51, 1379–1385. [Google Scholar] [CrossRef]
- Sodhi, K.; Wu, C.-C.; Cheng, J.; Gotlinger, K.; Inoue, K.; Goli, M.; Falck, J.R.; Abraham, N.G.; Schwartzman, M.L. CYP4A2-Induced Hypertension Is 20-Hydroxyeicosatetraenoic Acid– and Angiotensin II–Dependent. Hypertension 2010, 56, 871–878. [Google Scholar] [CrossRef] [PubMed]
- Rompe, F.; Artuc, M.; Hallberg, A.; Alterman, M.; Ströder, K.; Thöne-Reineke, C.; Reichenbach, A.; Schacherl, J.; Dahlöf, B.; Bader, M.; et al. Direct angiotensin II type 2 receptor stimulation acts anti-inflammatory through epoxyeicosatrienoic acid and inhibition of nuclear factor kappaB. Hypertension 2010, 55, 924–931. [Google Scholar] [CrossRef] [PubMed]
- Ranjit, A.; Khajeh Pour, S.; Aghazadeh-Habashi, A. Bone-Targeted Delivery of Novokinin as an Alternative Treatment Option for Rheumatoid Arthritis. Pharmaceutics 2022, 14. [Google Scholar] [CrossRef]
- Wan, Y.; Wallinder, C.; Plouffe, B.; Beaudry, H.; Mahalingam, A.K.; Wu, X.; Johansson, B.; Holm, M.; Botoros, M.; Karlén, A.; et al. Design, synthesis, and biological evaluation of the first selective nonpeptide AT2 receptor agonist. J Med Chem 2004, 47, 5995–6008. [Google Scholar] [CrossRef] [PubMed]
- Wu, L.; Iwai, M.; Li, Z.; Shiuchi, T.; Min, L.J.; Cui, T.X.; Li, J.M.; Okumura, M.; Nahmias, C.; Horiuchi, M. Regulation of inhibitory protein-kappaB and monocyte chemoattractant protein-1 by angiotensin II type 2 receptor-activated Src homology protein tyrosine phosphatase-1 in fetal vascular smooth muscle cells. Mol Endocrinol 2004, 18, 666–678. [Google Scholar] [CrossRef]
- Stoll, M.; Steckelings, U.M.; Paul, M.; Bottari, S.P.; Metzger, R.; Unger, T. The angiotensin AT2-receptor mediates inhibition of cell proliferation in coronary endothelial cells. J Clin Invest 1995, 95, 651–657. [Google Scholar] [CrossRef]
- Tsuzuki, S.; Matoba, T.; Eguchi, S.; Inagami, T. Angiotensin II Type 2 Receptor Inhibits Cell Proliferation and Activates Tyrosine Phosphatase. Hypertension 1996, 28, 916–918. [Google Scholar] [CrossRef] [PubMed]
- Tian, Q.; Miyazaki, R.; Ichiki, T.; Imayama, I.; Inanaga, K.; Ohtsubo, H.; Yano, K.; Takeda, K.; Sunagawa, K. Inhibition of tumor necrosis factor-alpha-induced interleukin-6 expression by telmisartan through cross-talk of peroxisome proliferator-activated receptor-gamma with nuclear factor kappaB and CCAAT/enhancer-binding protein-beta. Hypertension 2009, 53, 798–804. [Google Scholar] [CrossRef]
- de Gasparo, M.; Catt, K.J.; Inagami, T.; Wright, J.W.; Unger, T. International union of pharmacology. XXIII. The angiotensin II receptors. Pharmacol Rev 2000, 52, 415–472. [Google Scholar] [PubMed]
- Steckelings, U.M.; Kaschina, E.; Unger, T. The AT2 receptor--a matter of love and hate. Peptides 2005, 26, 1401–1409. [Google Scholar] [CrossRef] [PubMed]
- Santos, R.A.S.; e Silva, A.C.S.; Maric, C.; Silva, D.M.R.; Machado, R.P.; de Buhr, I.; Heringer-Walther, S.; Pinheiro, S.V.B.; Lopes, M.T.; Bader, M.; et al. Angiotensin-(1–7) is an endogenous ligand for the G protein-coupled receptor Mas. Proceedings of the National Academy of Sciences 2003, 100, 8258–8263. [Google Scholar] [CrossRef] [PubMed]
- Fayed, M.; Patel, N.; Angappan, S.; Nowak, K.; Vasconcelos Torres, F.; Penning, D.H.; Chhina, A.K. Sequential Organ Failure Assessment (SOFA) Score and Mortality Prediction in Patients With Severe Respiratory Distress Secondary to COVID-19. Cureus 2022, 14, e26911. [Google Scholar] [CrossRef]
Figure 1.
Impact of COVID-19 on the RAS imbalance (A) and effect of ACEi and ARB treatment (B). Adopted and modified with permission from reference [4].
Figure 1.
Impact of COVID-19 on the RAS imbalance (A) and effect of ACEi and ARB treatment (B). Adopted and modified with permission from reference [4].
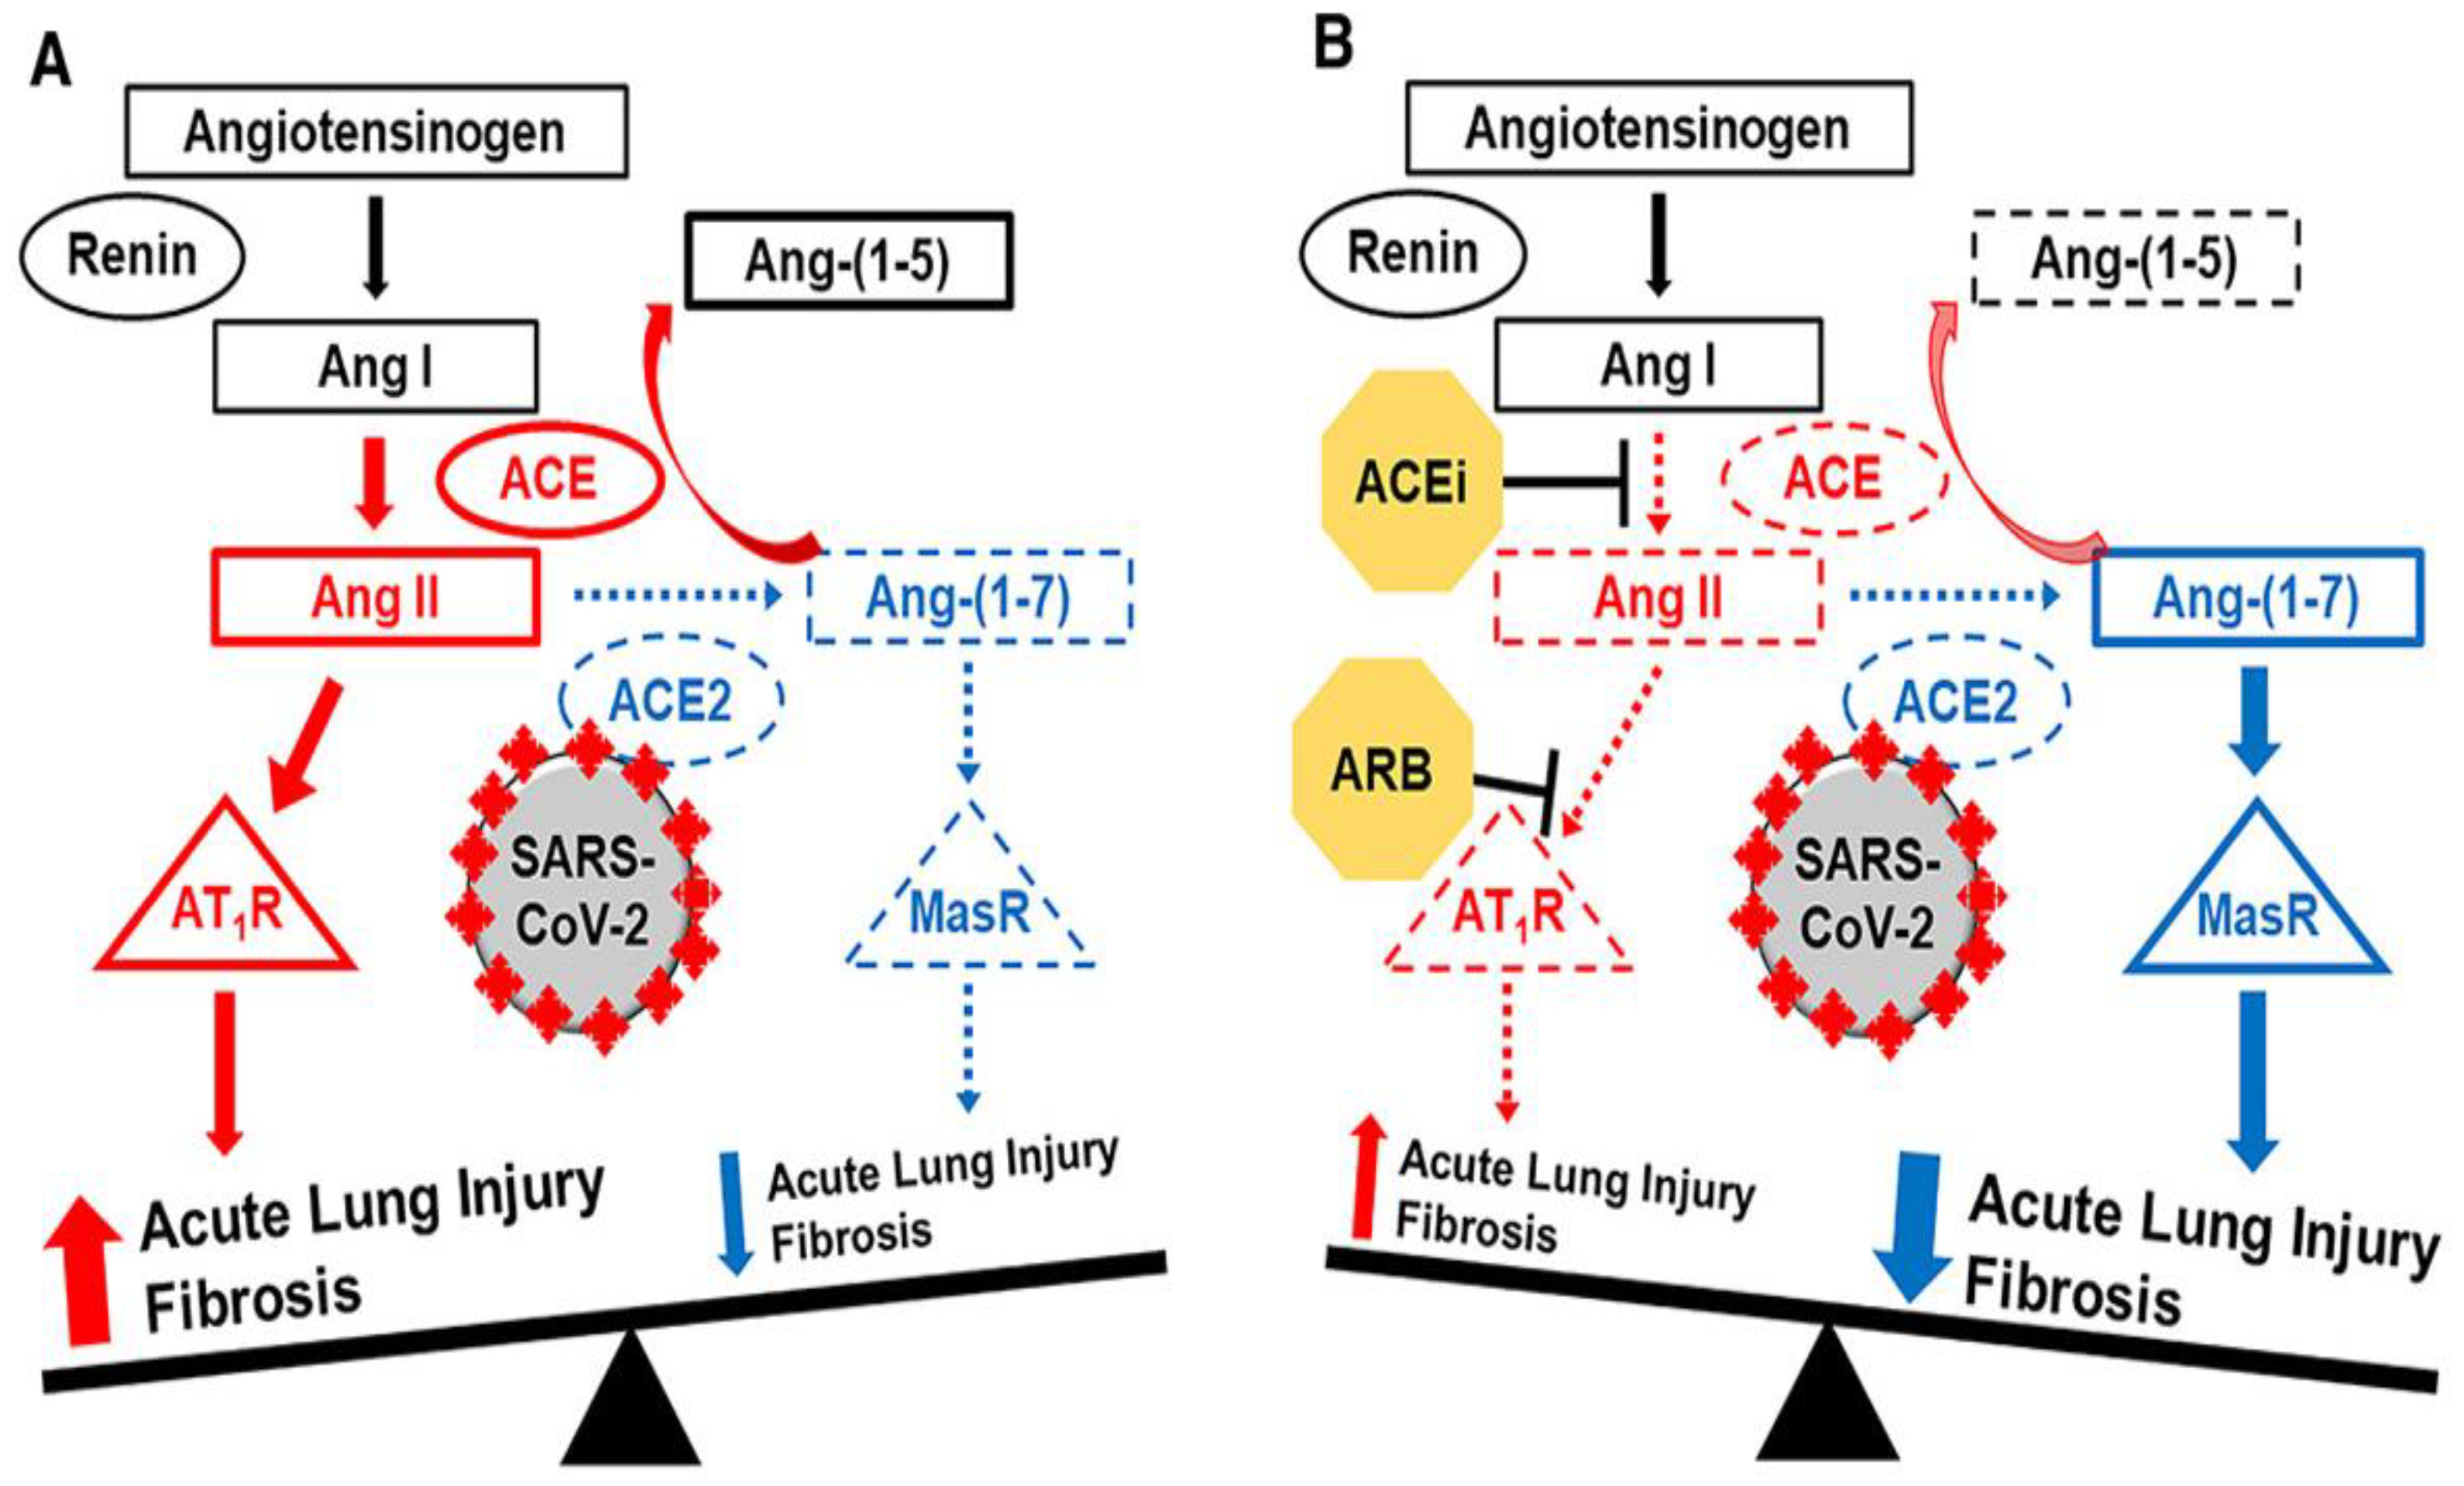
Figure 2.
Liberation of ArA and its metabolism by CYP 450 enzymes to hydroxyeicosatetraenoic acids (HETEs), epoxyeicosatrienoic acids (EETs) and dihydroxyeicosatrienoic acids (DHET).
Figure 2.
Liberation of ArA and its metabolism by CYP 450 enzymes to hydroxyeicosatetraenoic acids (HETEs), epoxyeicosatrienoic acids (EETs) and dihydroxyeicosatrienoic acids (DHET).
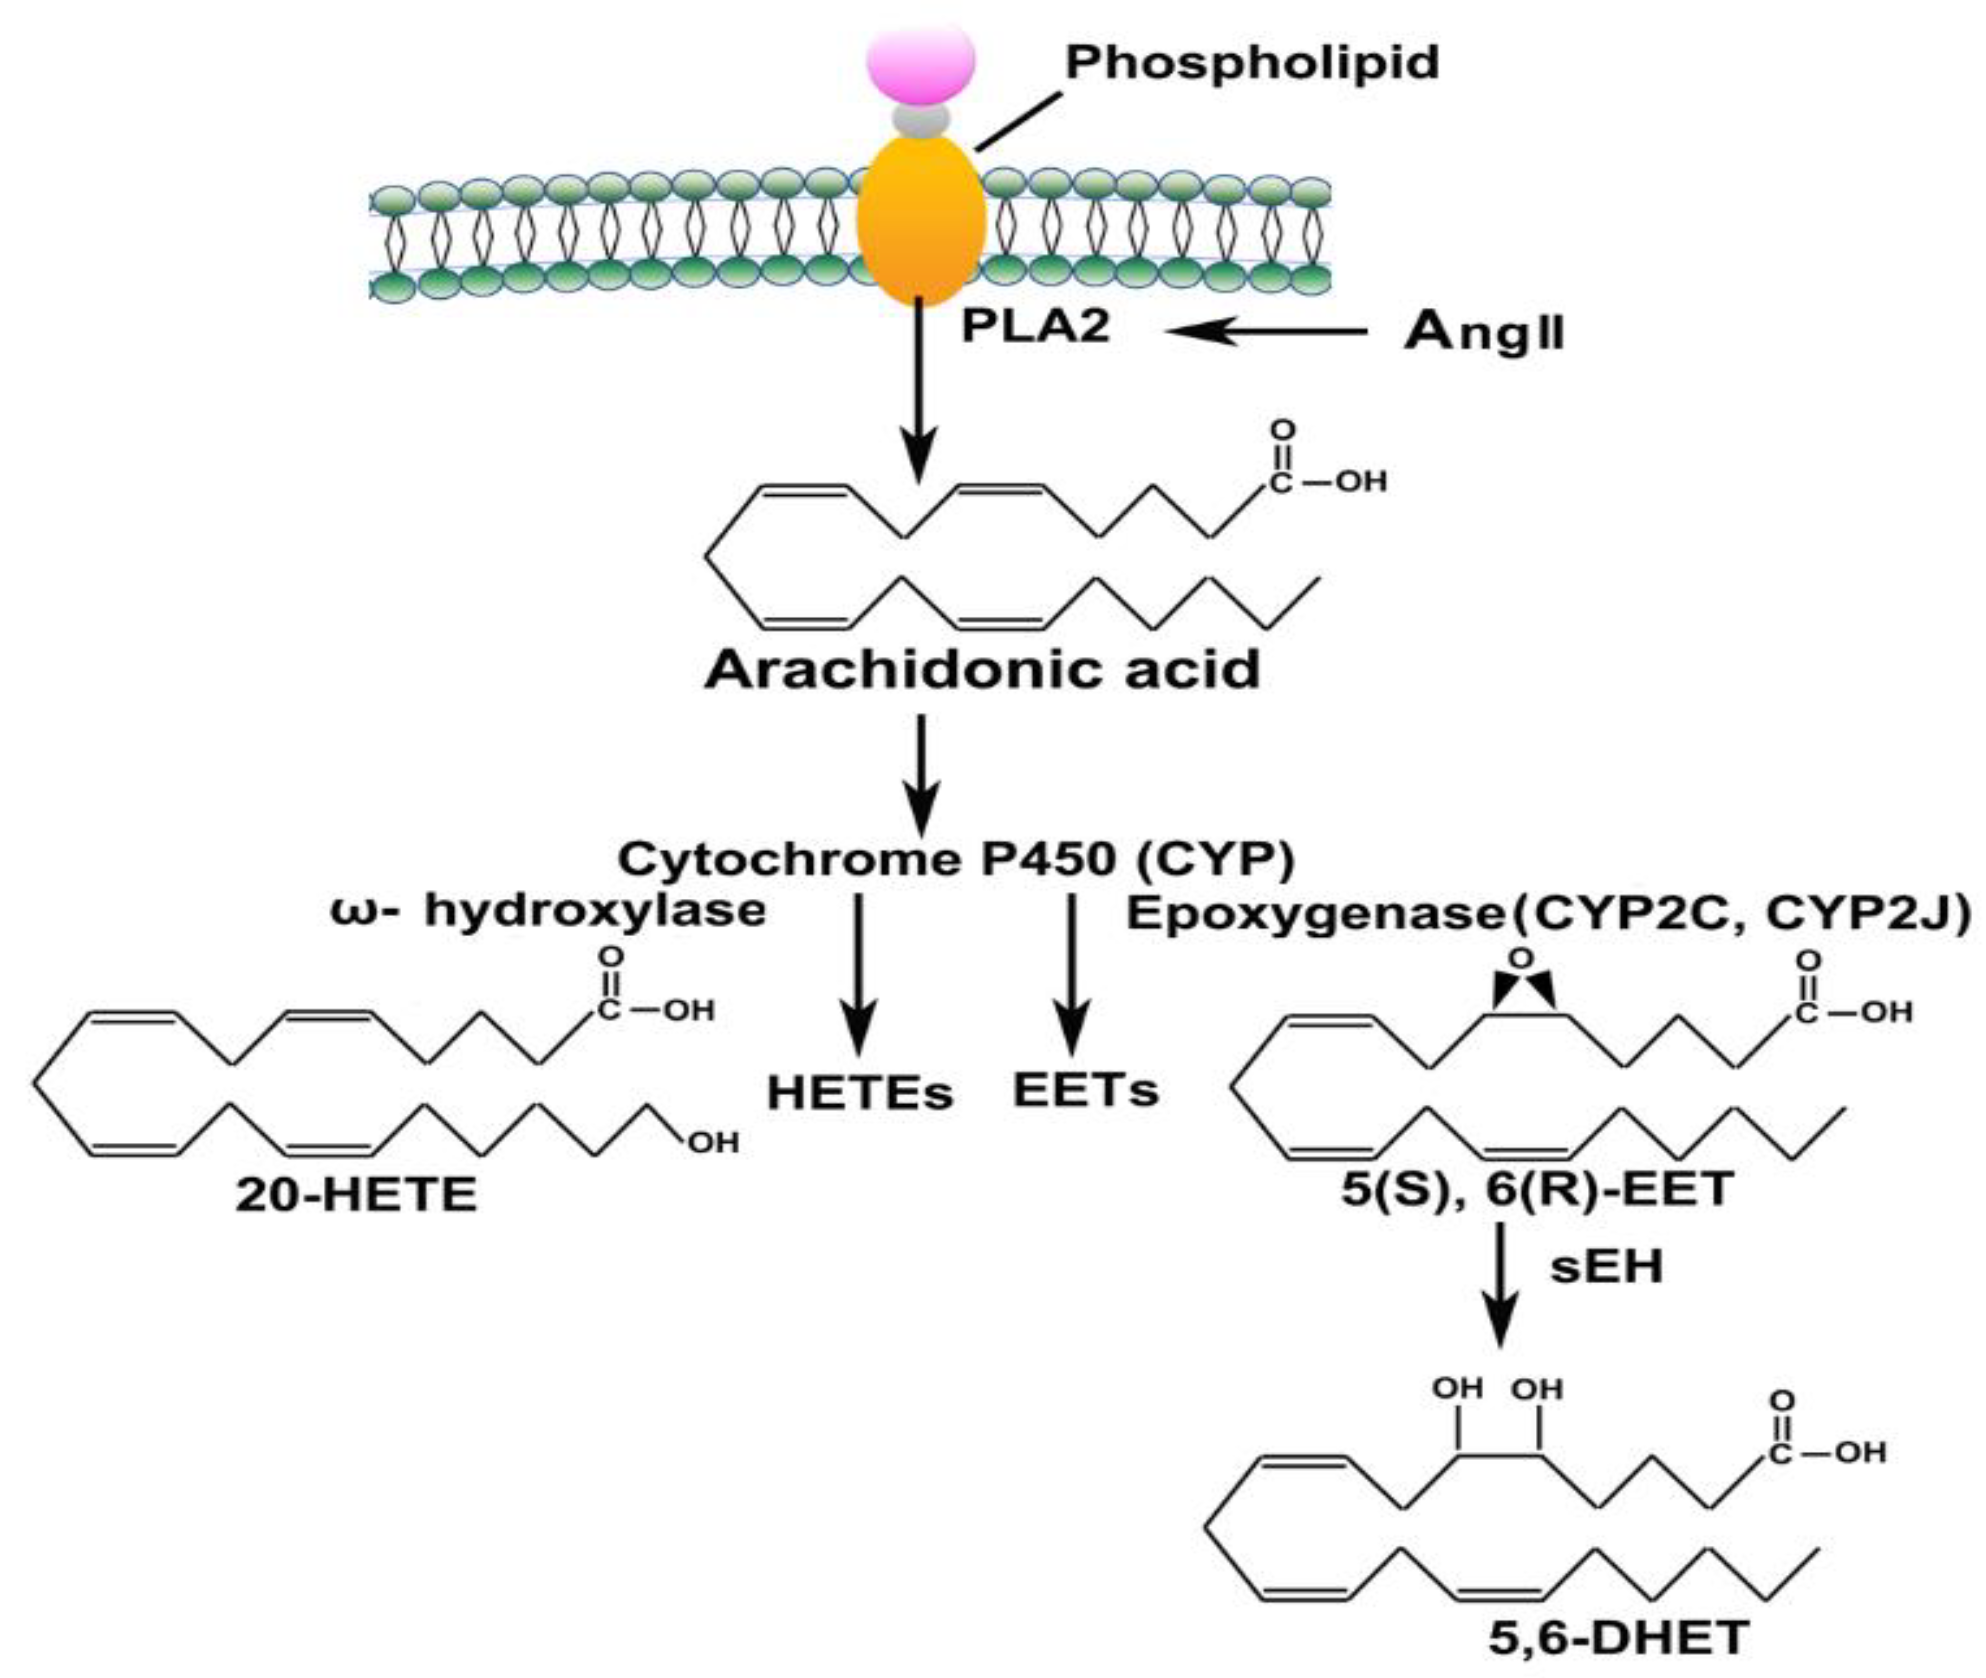
Figure 3.
The plasma concentration of Ang 1-7 (A), Ang II (B), and their ratio (C) in control (n = 6) and COVID-19 (n = 27). The values are reported as mean ± SEM, and statistical analysis was done using Mann Whitney U test, significantly different at ***p < 0.001 and ****p < 0.0001.
Figure 3.
The plasma concentration of Ang 1-7 (A), Ang II (B), and their ratio (C) in control (n = 6) and COVID-19 (n = 27). The values are reported as mean ± SEM, and statistical analysis was done using Mann Whitney U test, significantly different at ***p < 0.001 and ****p < 0.0001.
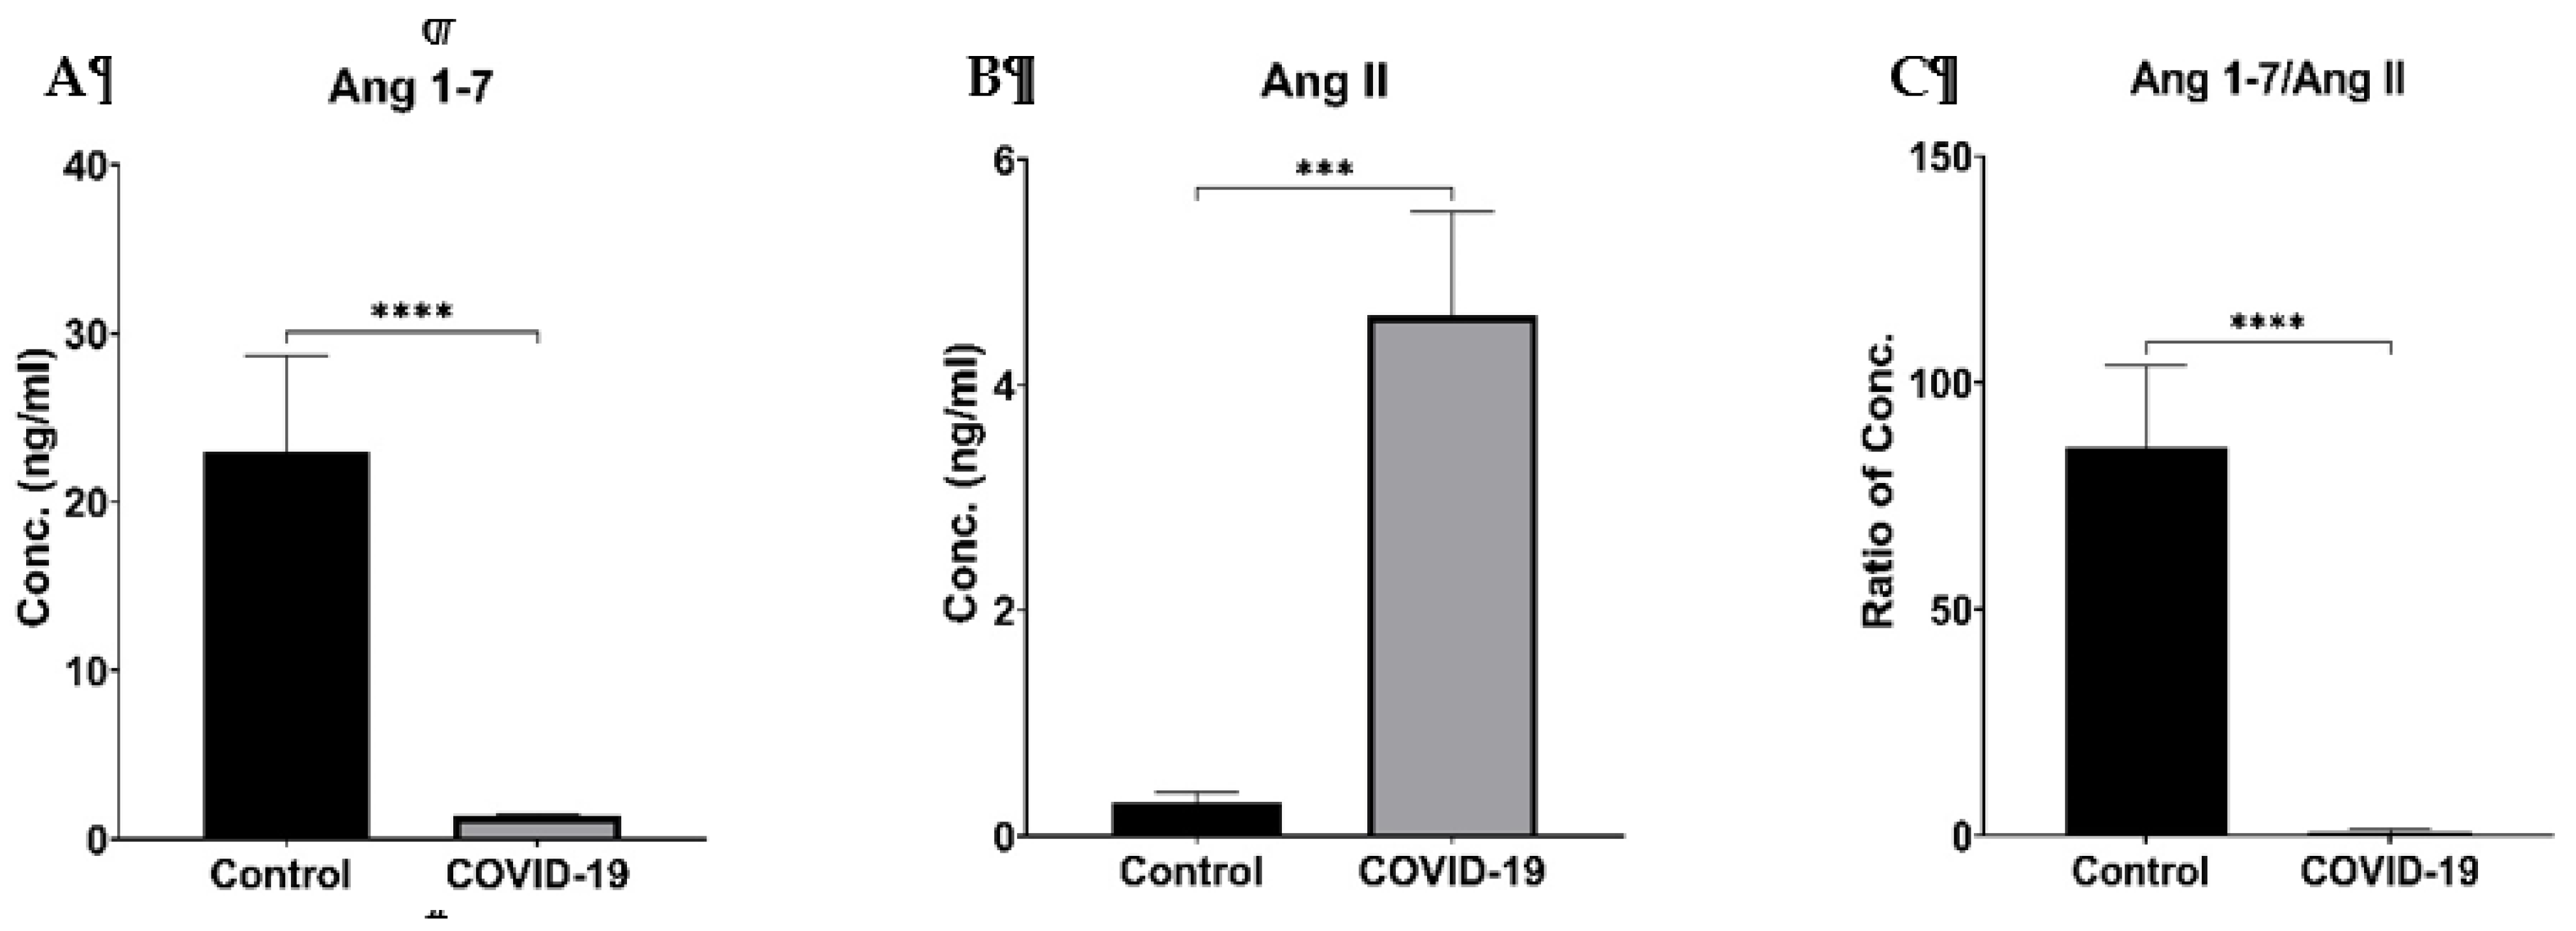
Figure 5.
The impact of co-morbidities (respiratory, cardiovascular, hypertension or diabetes) on the plasma concentration of Ang 1-7 (A), Ang II (B) and their ratio (Ang 1-7/ Ang II) (C). Data are presented as Mean ± SEM. Statistical analysis was done using the Mann-Whitney U test.
Figure 5.
The impact of co-morbidities (respiratory, cardiovascular, hypertension or diabetes) on the plasma concentration of Ang 1-7 (A), Ang II (B) and their ratio (Ang 1-7/ Ang II) (C). Data are presented as Mean ± SEM. Statistical analysis was done using the Mann-Whitney U test.
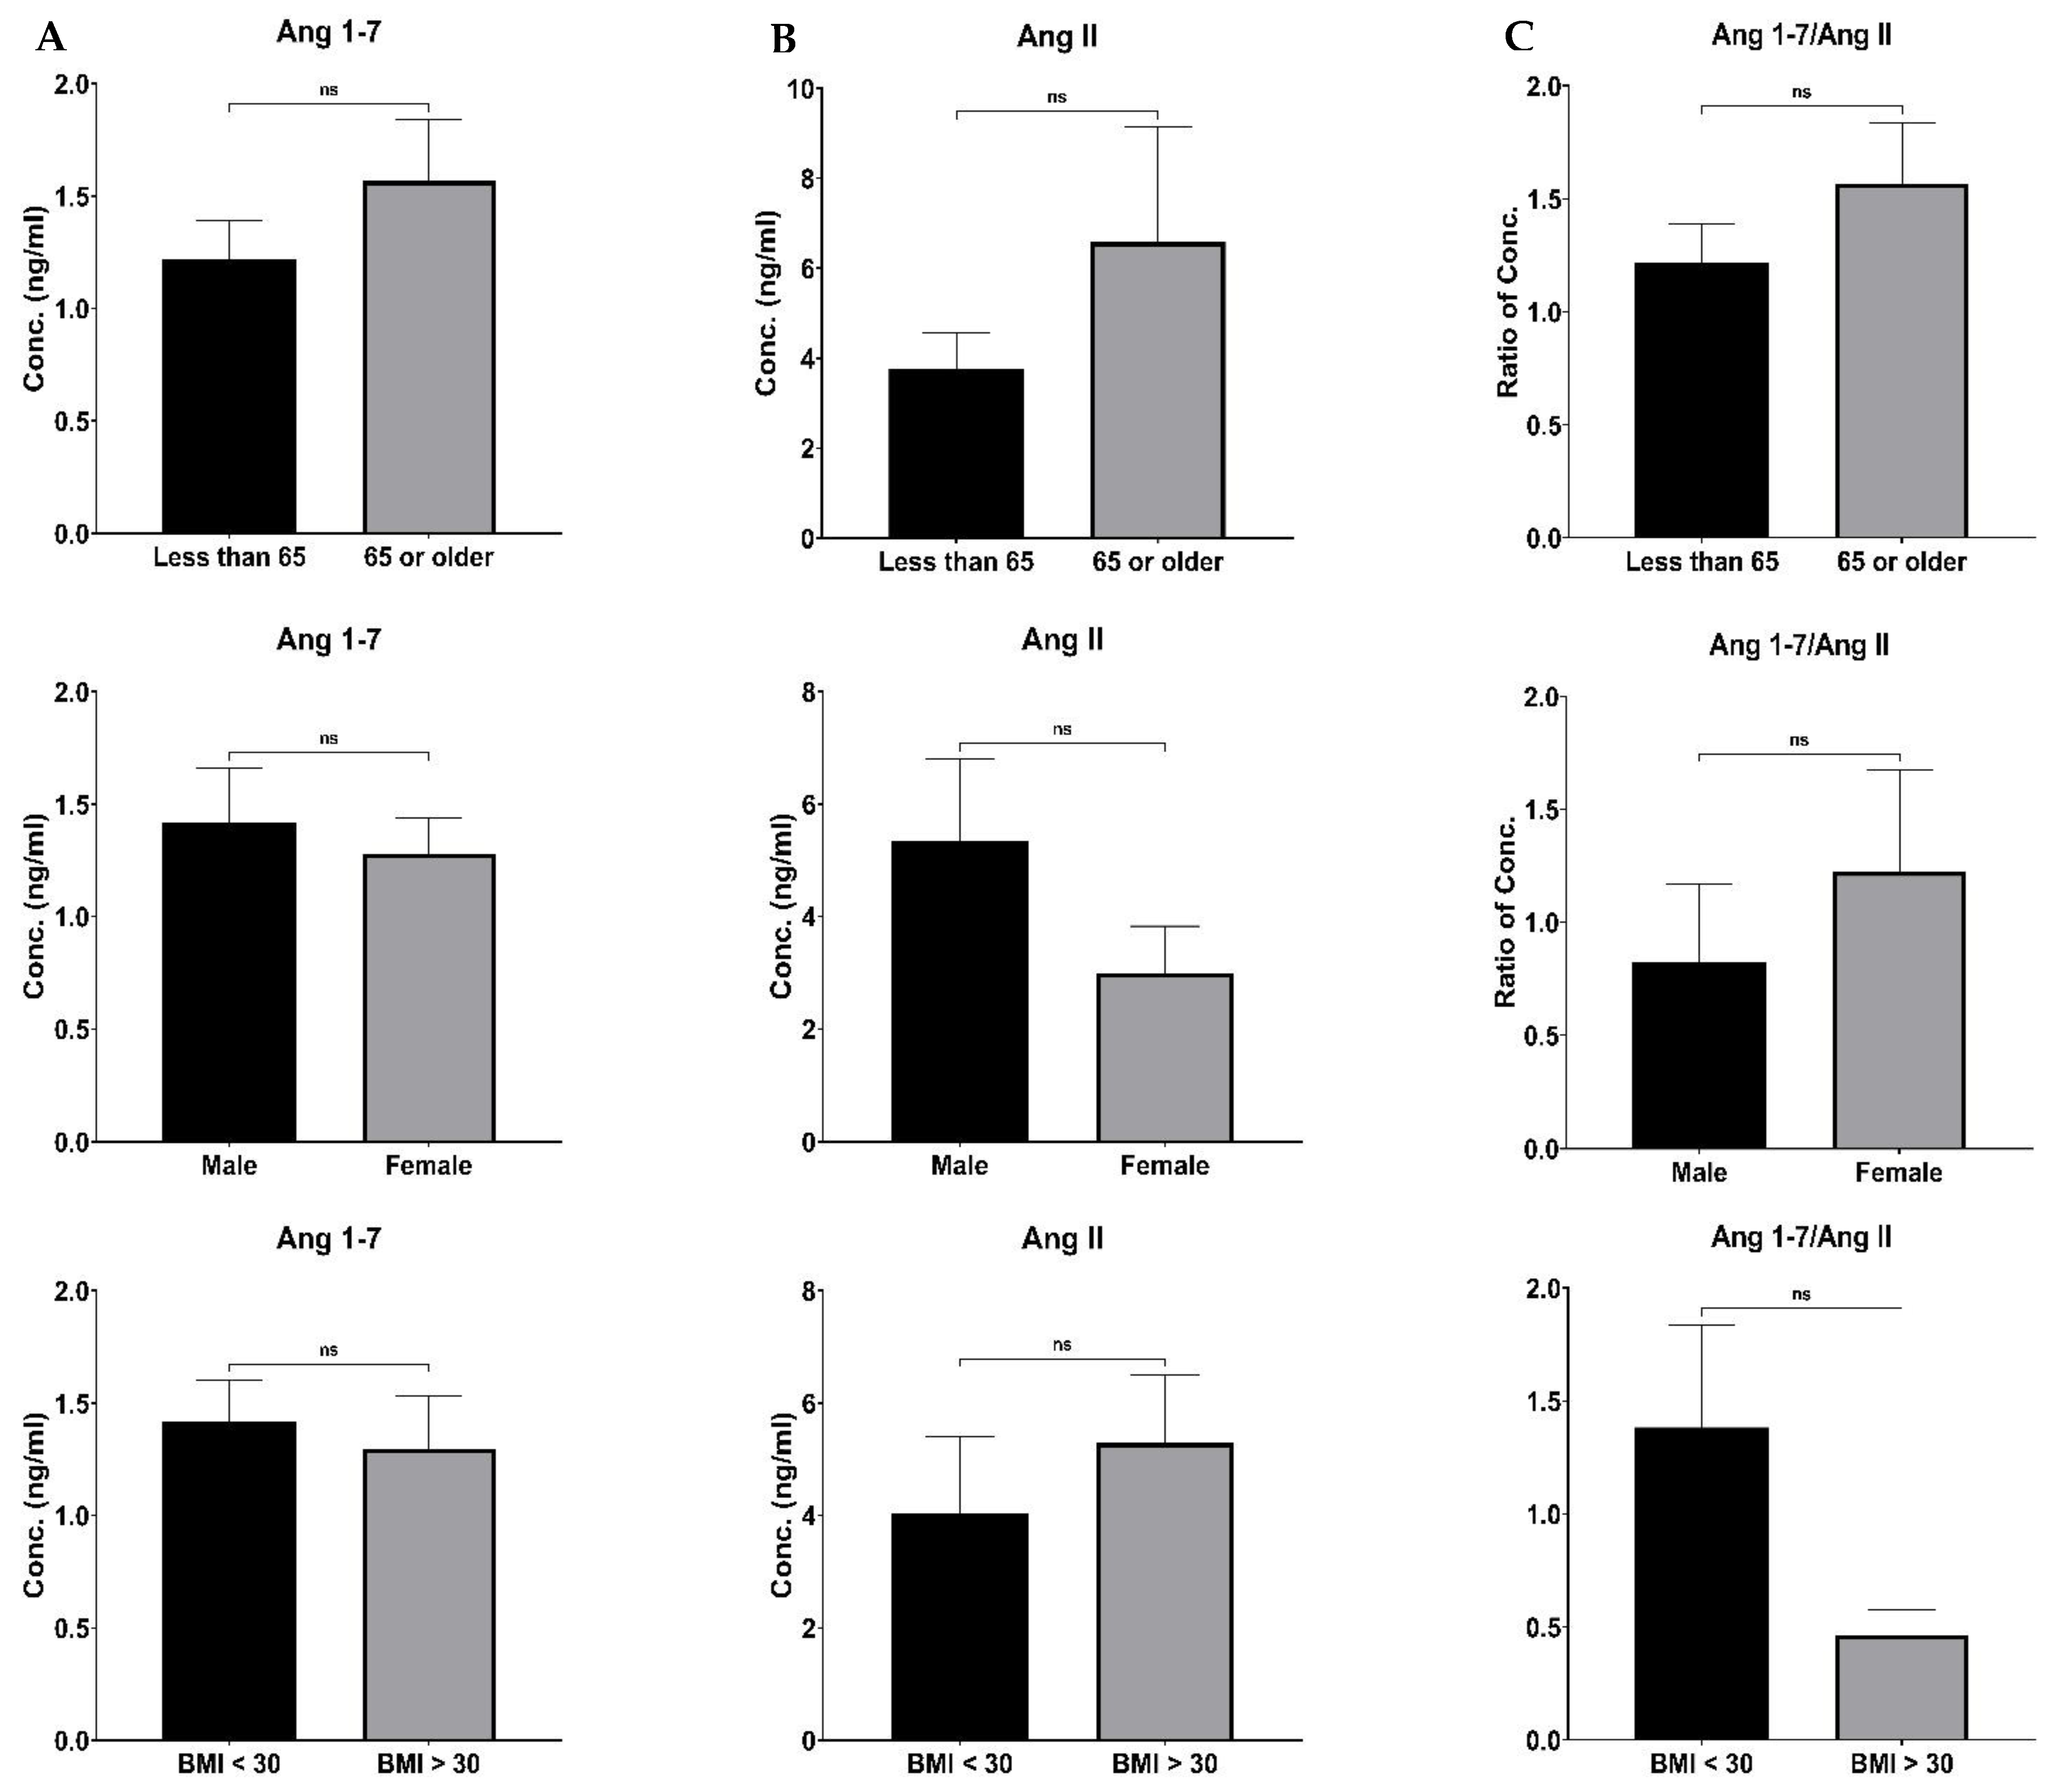

Table 1.
Clinical characteristics, co-morbidities, and medication history of COVID-19 patients.
| Clinical characteristics | |
|---|---|
| Age (years), Mean ± SD | 58.74 ± 12.15 |
| Male (%) | 16 (56.26) |
| BMI, mean ± SD | 31.92 ± 8.39 |
| Co-morbidities | |
|
22 (81.48) |
| - Diabetes (Type I or II) | 15 (55.56) |
| - Ischemic Heart Disease | 1 (3.70) |
| - History of MI | 1 (3.70) |
| - Cardiac Arrhythmia | 4 (14.81) |
| - Hypertension | 13 (48.15) |
| - Valvular Heart Disease | 1 (3.70) |
| - Cerebrovascular disease (Stroke or TIA) | 2 (7.41) |
|
|
| - COPD | 2 (7.41) |
| - Asthma | 6 (22.22) |
| - Other Chronic lung diseases | 2 (7.41) |
| Medication History | |
| Aspirin (any dose) | 4 (14.81) |
| NSAIDs | 5 (18.52) |
| Statin | 10 (37.04) |
| Corticosteroids | 2 (7.41) |
| SOFA, Mean ± SD | 5.29 ± 2.91 |
| Platelets (per μl), Mean ± SD | 241.80 ± 73.41 x 10³ |
| Total Bilirubin (mg/dl), Mean ± SD | 0.93 ± 0.63 |
| Serum Creatinine (mg/dl), Mean ± SD | 1.03 ± 0.61 |
| WBC (per μl), mean ± SD | 10.45 ± 5.52 x 10³ |
| Hemoglobin (g/dl), Mean ± SD | 13.94 ± 1.84 |
| BMI; body mass index, MI; myocardial infarction, TIA, transient ischemic attack, COPD; Chronic obstructive pulmonary disease, NSAID; non-steroidal anti-inflammatory drugs, SOFA; sequential organ failure assessment | |
Table 2.
The RAS components and ArA metabolites levels in healthy control and COVID-19 patients.
| Metabolites | Control | N | COVID-19 | p | N |
|---|---|---|---|---|---|
| Ang 1-7 | 23.00 ± 5.69 | 6 | 1.37 ± 0.20 | < 0.0001 | 27 |
| Ang II | 0.29 ± 0.09 | 6 | 4.61 ± 0.92 | 0.0002 | 24 |
| Ang 1-7/ Ang II | 85.81 ± 17.90 | 6 | 0.96 ± 0.26 | < 0.0001 | 24 |
| 19-HETE | 2.68 ± 0.89 | 6 | 6.35 ± 1.52 | 0.5605 | 24 |
| 20-HETE | 0.99 ± 0.30 | 6 | 1.13 ± 0.14 | 0.5953 | 24 |
| Total HETE | 3.67 ± 1.11 | 6 | 7.49 ± 1.47 | 0.1286 | 24 |
| 5,6-EET | 3.05 ± 0.55 | 6 | 13.78 ± 8.06 | 0.2962 | 24 |
| 8,9-EET | 2.87 ± 0.85 | 6 | 14.25 ± 2.36 | 0.0108 | 24 |
| 11,12-EET | 1.96 ± 0.47 | 6 | 41.93 ± 7.79 | < 0.0001 | 24 |
| 14,15-EET | 1.95 ± 0.13 | 6 | 13.74 ± 8.05 | 0.0034 | 24 |
| Total EET | 9.83 ± 0.84 | 6 | 71.05 ± 12.64 | 0.0004 | 24 |
| 5,6-DHET | 7.84 ± 0.90 | 6 | 1.98 ± 0.39 | < 0.0001 | 16 |
| 8,9-DHET | 3.85 ± 0.36 | 6 | 3.04 ± 0.43 | 0.0252 | 19 |
| 11,12-DHET | 3.58 ± 0.63 | 6 | 0.74 ± 0.21 | 0.0004 | 9 |
| 14,15-DHET | 4.28 ± 0.48 | 6 | 1.42 ± 0.18 | 0.0001 | 24 |
| Total DHET | 19.55 ± 1.78 | 6 | 5.25 ± 0.58 | < 0.0001 | 24 |
| Data are presented as Mean ± SEM and expressed in ng/ml. Statistical analysis was done using the Mann-Whitney U test. | |||||
Table 3.
The correlation of Ang 1-7 with ArA metabolites in control and COVID-19 patients.
| Metabolites | Ang 1-7 | |||||
|---|---|---|---|---|---|---|
| Control | COVID-19 | |||||
| r | p | N | r | p | N | |
| 19-HETE | 0.4294 | 0.3955 | 6 | -0.1773 | 0.4071 | 24 |
| 20-HETE | 0.5718 | 0.2358 | 6 | -0.4089 | 0.0473 | 24 |
| Total HETE | 0.3417 | 0.5075 | 6 | -0.2231 | 0.2947 | 24 |
| 5,6-EET | 0.2850 | 0.5841 | 6 | -0.0391 | 0.8560 | 24 |
| 8,9-EET | 0.7324 | 0.0978 | 6 | -0.1328 | 0.5362 | 24 |
| 11,12-EET | -0.1309 | 0.8048 | 6 | -0.1765 | 0.4094 | 24 |
| 14,15-EET | 0.0110 | 0.9836 | 6 | -0.0507 | 0.8141 | 24 |
| Total EET | 0.8559 | 0.0296 | 6 | -0.1854 | 0.3858 | 24 |
| 5,6-DHET | 0.2511 | 0.6312 | 6 | -0.3823 | 0.1439 | 16 |
| 8,9-DHET | -0.4195 | 0.4077 | 6 | -0.0314 | 0.8985 | 19 |
| 11,12-DHET | 0.1751 | 0.7401 | 6 | -0.4462 | 0.2286 | 9 |
| 14,15-DHET | -0.1969 | 0.7085 | 6 | -0.2836 | 0.1793 | 24 |
| Total DHET | 0.0519 | 0.9222 | 6 | -0.3679 | 0.0769 | 24 |
| Statistical analysis was done using the Pearson correlation coefficient (r) computation. | ||||||
Table 4.
The correlation of Ang II with ArA metabolites in control and COVID-19 patients.
| Metabolites | Ang II | |||||
|---|---|---|---|---|---|---|
| Control | COVID-19 | |||||
| r | p | N | r | p | N | |
| 19-HETE | 0.6614 | 0.1525 | 6 | 0.5052 | 0.0195 | 21 |
| 20-HETE | 0.5550 | 0.2530 | 6 | 0.2871 | 0.2333 | 19 |
| Total-HETE | 0.6797 | 0.1375 | 6 | 0.5317 | 0.0131 | 21 |
| 5,6-EET | 0.7516 | 0.0849 | 6 | 0.6805 | 0.0007 | 21 |
| 8,9-EET | -0.0180 | 0.9729 | 6 | 0.1021 | 0.6595 | 21 |
| 11,12-EET | -0.5656 | 0.2421 | 6 | 0.0377 | 0.8712 | 21 |
| 14,15-EET | 0.5736 | 0.2339 | 6 | 0.6721 | 0.0008 | 21 |
| Total-EET | 0.2392 | 0.6481 | 6 | 0.5998 | 0.0041 | 21 |
| 5,6-DHET | 0.8401 | 0.0363 | 6 | -0.0191 | 0.9843 | 14 |
| 8,9-DHET | -0.0445 | 0.9333 | 6 | 0.6290 | 0.0068 | 17 |
| 11,12-DHET | 0.5164 | 0.2943 | 6 | 0.2578 | 0.5376 | 8 |
| 14,15-DHET | 0.0947 | 0.8584 | 6 | 0.0244 | 0.9165 | 21 |
| Total-DHET | 0.6267 | 0.1830 | 6 | 0.4661 | 0.0332 | 21 |
| Statistical analysis was done using the Pearson correlation coefficient (r) computation. | ||||||
Table 5.
The correlation of Ang1-7/Ang II with ArA metabolites in control and COVID-19 patients.
| Metabolites | Ang 1-7/Ang II | |||||
|---|---|---|---|---|---|---|
| Control | COVID-19 | |||||
| r | p | N | r | p | N | |
| 19-HETE | 0.0626 | 0.9062 | 6 | -0.2539 | 0.2668 | 21 |
| 20-HETE | 0.1606 | 0.7612 | 6 | -0.3434 | 0.1275 | 21 |
| Total-HETE | 0.0934 | 0.8603 | 6 | -0.2959 | 0.1928 | 21 |
| 5,6-EET | -0.4236 | 0.4027 | 6 | -0.1546 | 0.5034 | 21 |
| 8,9-EET | 0.8589 | 0.0285 | 6 | -0.1683 | 0.4659 | 21 |
| 11,12-EET | 0.2500 | 0.6328 | 6 | -0.0802 | 0.7298 | 21 |
| 14,15-EET | -0.4992 | 0.3134 | 6 | -0.1552 | 0.5019 | 21 |
| Total-EET | 0.6601 | 0.1537 | 6 | -0.1943 | 0.3987 | 21 |
| 5,6-DHET | -0.5780 | 0.2296 | 6 | -0.2551 | 0.3788 | 14 |
| 8,9-DHET | -0.3861 | 0.4497 | 6 | -0.1421 | 0.5863 | 17 |
| 11,12-DHET | -0.0865 | 0.8706 | 6 | -0.4886 | 0.2192 | 8 |
| 14,15-DHET | -0.0757 | 0.8867 | 6 | -0.2089 | 0.3635 | 21 |
| Total-DHET | -0.4224 | 0.4040 | 6 | -0.1903 | 0.4087 | 21 |
| Statistical analysis was done using the Pearson correlation coefficient (r) computation. | ||||||
Table 6.
The correlation of the RAS components with ArA metabolites levels in all participants.
| Metabolites | Ang 1-7 | Ang II | Ang 1-7/Ang II | |||
|---|---|---|---|---|---|---|
| r | p | r | p¶ | r | p | |
| 19-HETE | -0.1764 | 0.3989 | -0.1652 | 0.3919 | -0.2130 | 0.3067 |
| 20-HETE | 0.0558 | 0.7912 | 0.1931 | 0.3156 | -0.0391 | 0.8528 |
| Total-HETE | -0.1689 | 0.4195 | -0.1380 | 0.4753 | -0.2181 | 0.2950 |
| 5,6-EET | -0.1398 | 0.5051 | -0.0812 | 0.6753 | -0.1652 | 0.4301 |
| 8,9-EET | -0.2475 | 0.2794 | 0.0406 | 0.8472 | -0.2469 | 0.2807 |
| 11,12-EET | -0.3899 | 0.0597 | -0.0526 | 0.7902 | -0.3855 | 0.0628 |
| 14,15-EET | -0.2764 | 0.1810 | -0.1143 | 0.5550 | -0.2651 | 0.2003 |
| Total-EET | -0.3874 | 0.0557 | -0.0874 | 0.6523 | -0.3805 | 0.0606 |
| 5,6-DHET | 0.7496 | 0.0002 | -0.3568 | 0.1124 | 0.6617 | 0.0020 |
| 8,9-DHET | 0.4141 | 0.0695 | 0.2052 | 0.3476 | 0.4651 | 0.0388 |
| 11,12-DHET | 0.6704 | 0.0122 | -0.2438 | 0.4010 | 0.6368 | 0.0192 |
| 14,15-DHET | 0.5930 | 0.0018 | -0.1370 | 0.4786 | 0.6684 | 0.0003 |
| Total-DHET | 0.7612 | <0.0001 | -0.2434 | 0.2033 | 0.7550 | <0.0001 |
| Statistical analysis was done using the Pearson correlation coefficient (r) computation. | ||||||
Table 7.
The correlation of the SOFA score with the RAS components and ArA metabolites levels in COVID-19 patients.
Table 7.
The correlation of the SOFA score with the RAS components and ArA metabolites levels in COVID-19 patients.
| SOFA Score | ||
|---|---|---|
| Metabolites | r | p |
| Ang 1-7 | 0.1825 | 0.3723 |
| Ang II | 0.4171 | 0.0426 |
| Ang 1-7/Ang II | 0.2814 | 0.1933 |
| 19-HETE | -0.4842 | 0.0165 |
| 20-HETE | 0.1967 | 0.3568 |
| Total HETE | -0.4828 | 0.0169 |
| 5,6-EET | -0.2872 | 0.1735 |
| 8,9-EET | -0.0410 | 0.8492 |
| 11,12-EET | -0.2100 | 0.3247 |
| 14,15-EET | -0.2758 | 0.1920 |
| Total EET | -0.3882 | 0.0646 |
| 5,6-DHET | -0.3095 | 0.2435 |
| 8,9-DHET | -0.3773 | 0.1112 |
| 11,12-DHET | -0.4211 | 0.2590 |
| 14,15-DHET | -0.0515 | 0.8111 |
| Total DHET | -0.5737 | 0.0034 |
| Statistical analysis was done using the Pearson correlation coefficient (r) computation. | ||
There was no significant correlation between other clinical characteristics (platelet count, total bilirubin, serum creatinine, WBC and hemoglobin) with the RAS components and ArA metabolites level (Data not shown).
Disclaimer/Publisher’s Note: The statements, opinions and data contained in all publications are solely those of the individual author(s) and contributor(s) and not of MDPI and/or the editor(s). MDPI and/or the editor(s) disclaim responsibility for any injury to people or property resulting from any ideas, methods, instructions or products referred to in the content. |
© 2023 by the authors. Licensee MDPI, Basel, Switzerland. This article is an open access article distributed under the terms and conditions of the Creative Commons Attribution (CC BY) license (http://creativecommons.org/licenses/by/4.0/).
Copyright: This open access article is published under a Creative Commons CC BY 4.0 license, which permit the free download, distribution, and reuse, provided that the author and preprint are cited in any reuse.


