
Submitted:
15 June 2023
Posted:
16 June 2023
You are already at the latest version
Abstract
Attention Deficit/Hyperactivity Disorder (ADHD) is a neurodevelopmental disorder that affects attention and behavioral control, characterized by constant presence of inattention and hyperactivity. This article describes a study that used a database with results from tests of voluntary and automatic attentional orientation activity in a complex network of ADHD patients, in order to understand the characteristics of the elements and attentional variability of patients. Centrality metrics and the Louvain method were applied to obtain the network communities. The most important elements of the network were identified and differences in reaction times of the activities were observed in the identified communities. The study provides useful information to understand of deficit hyperactivity disorder spectrum in patients with ADHD.
Keywords:
attention deficit/hyperactivity disorder
; attentional variability
; network communities
; deficit hyperactivity disorder spectrum
1. Introduction
Attention-Deficit/Hyperactivity Disorder (ADHD) is a complex neurodevelopmental disorder characterized by chronic patterns of inattention and/or hyperactivity-impulsivity, which can significantly impede a child’s social, personal, and cognitive functioning, as well as their overall development [7]. To warrant a diagnosis of ADHD, it is crucial that symptoms are observable across multiple environments, indicating a consistent presence of ADHD-related behaviors in various contexts. Inattention symptoms encompass persistent difficulties in task engagement, lack of sustained focus, challenges with organization, and diminished responsiveness when addressed by others. On the other hand, hyperactivity is manifested through excessive and inappropriate motor activity, an inability to engage in leisure activities calmly, and difficulties with turn-taking during conversations. In adulthood, the presentation of ADHD symptoms may differ, characterized by a sense of inner restlessness and racing thoughts. Although ADHD predominantly emerges in childhood, it often persists into adulthood, affecting approximately 5% of children and 2.5% of adults [7].
ADHD exhibits a range of manifestations and is influenced by multiple factors, lacking a specific biological marker for definitive diagnosis. Consequently, the diagnostic process for ADHD entails a comprehensive and meticulous evaluation of the patient’s condition [11]. In order to attain a comprehensive understanding of ADHD, it is imperative to delve into the intricate nuances of attention development across its diverse presentations and discern how deficits in this process contribute to the attention-related difficulties associated with ADHD [12]. Thus, inattention assumes a central role in the assessment of ADHD symptoms, impairing the individual’s task performance and precipitating impulsive behaviors [7,13,14]. Researchers investigating ADHD ought to consider these factors as they conduct their empirical investigations.
However, it is crucial to acknowledge that there exists considerable variability in the level of attention among patients diagnosed with attention deficit hyperactivity disorder (ADHD), rendering a uniform treatment approach less than ideal (Araujo, 2009; Mirella). Consequently, it becomes imperative to employ computational techniques to discern the distinctive characteristics of these variations and identify specific patient subgroups.
Among the potential methodologies, Complex Networks, with a particular focus on community detection, offer a promising avenue for exploring the nuances of attention variations [1,2,3,15]. This article proposes as objective an approach centered on the detection of community networks within cohorts of individuals diagnosed with ADHD. Within each identified community, an exhaustive analysis of individual patient attributes will be undertaken to gain a comprehensive understanding of the degree to which a given community demonstrates either milder or more severe symptom profiles. This, in turn, facilitates the establishment of an ADHD spectrum, encompassing the diverse symptomatic manifestations.
To accomplish this objective, the application of centrality measures is paramount, as they enable the identification of patients exerting the most significant influence within the network structure, thereby illuminating the attention variations exhibited by individuals diagnosed with ADHD.
In addition to the introduction that presents the context and objective of the work, the article is organized in: Section 2, a review of the works related to the theme of this article is presented; Section 3 brings specific information about the data used in the study and we present the methodology adopted for the analysis of the collected data; the results found are detailed in Section 4; finally, in Section 5, it is presented the conclusion and future work.
2. Related Works
The detection of communities in complex networks is a widely employed technique across various domains, serving to tackle diverse problems, such as discerning interest groups in social networks or uncovering clusters within health data. Given its promising versatility, numerous studies have focused on enhancing and implementing community detection algorithms for complex networks. In a study conducted by [22], a complex network was utilized to identify influential entities via centrality measures. To accomplish this, the Louvain algorithm [10] was employed, successfully identifying over 4 communities associated with the accusations arising from the Lava Jato operation conducted by the Brazilian Federal Police. Similarly, in the work carried out by [21] on the same subject, a complex network incorporating textual data from Twitter and YouTube was employed. The author employed the Louvain algorithm to detect communities.
In the area of health, particularly within the field of psychology, researchers have increasingly turned to the use of complex networks to gain insights into various psychopathologies. A notable study conducted by [30] sheds light on the application of complex networks in psychological research, particularly in the study of mental disorders. The study elucidates the fundamental concepts of networks, which consist of interconnected nodes (such as symptoms) connected by edges that signify associations between these nodes. Furthermore, the study highlights the application of statistical procedures for analyzing network structures. It also explores several visualization methods for networks, including multidimensional scaling, principal component plotting, and self-model networks. The author emphasizes the growing importance of understanding the intricacies of network analysis within psychology. Additionally, the article acknowledges the successful application of network analysis in studying personality and attitudes and suggests its potential for analyzing other psychological constructs in future research.
The study conducted by Mendes [20] introduces a sophisticated network methodology for automated classification of CT images displaying patterns of Interstitial Lung Disease (ILD). This study is specifically aimed at researchers in the field who are interested in utilizing advanced techniques for image analysis and classification. The authors transform the CT images into complex networks and apply the Closeness centrality measure to extract information from the image texture. They generate histograms for each network, which are then concatenated to form a vector of texture attributes. The data is further sorted using the K nearest neighbors algorithm. This research provides valuable insights into the application of complex network methods for image classification, particularly in the context of Interstitial Lung Disease.
In a separate study by Sato [31], functional magnetic resonance imaging (fMRI) data is utilized to examine brain connectivity networks in individuals with Autism Spectrum Disorders (ASD) compared to healthy controls. This study targets researchers in the field of neuroimaging and autism research. The study employs graph analysis to investigate the modular organization of brain networks in individuals with ASD. The findings reveal differences in graph centrality and entropy measures between ASD patients and healthy subjects in various networks, including the default mode, frontoparietal, somatomotor, and cerebellar networks. These results contribute to understanding of brain connectivity in ASD and provide insights into the specific brain networks associated with different aspects of the disorder. The study highlights the potential of utilizing graph analysis techniques to uncover biomarkers and develop diagnostic and therapeutic interventions for ASD.
Both studies provide valuable contributions to their respective fields and are targeted towards researchers who are interested in advancing knowledge and exploring innovative approaches within their areas of expertise.
The related works have demonstrated the practicality and efficacy of community detection in complex networks across diverse scenarios, ranging from analyzing textual data to identifying diseases in computed tomography images. Detecting communities in complex networks holds significant potential as a valuable tool in numerous fields, particularly in situations that require identifying and understanding groups or clusters, as is the case of this paper.
3. Materials and Methods
This study involved a survey conducted to collect information on the performance of 60 children in a computerized test. The children were divided into two groups: one with ADHD and another control group. The ADHD group comprised 30 children (8 girls and 22 boys), aged 6 to 12, who had been diagnosed with ADHD. The control group consisted of 30 children (8 girls and 22 boys), aged 6 to 11, who exhibited no signs of ADHD or any other neurodevelopmental disorder. The test was specifically designed to measure voluntary and automatic attentional orientation, based on the reaction time between target indication and pressing the space bar on the keyboard, with time being measured in milliseconds. The purpose of collecting these data was to investigate potential differences in attentional performance between the two groups of children.
For the voluntary orientation task, participants were instructed to focus on a central fixation point displayed on a computer screen. Two boxes were positioned on the right and left sides of the screen. Following a randomly determined time interval (ranging from 800 to 1800 ), an arrow pointing either left or right appeared adjacent to the fixation point. Subsequently, after a specific duration (300 to 800 ), a target appeared within one of the two boxes and persisted until the participant pressed the spacebar on a keyboard or until 1500 ms elapsed. The target could manifest in the position indicated by the arrow, referred to as the valid condition (70% of presentations), or in the opposite position indicated by the arrow, known as the invalid condition (30% of presentations). Participants were explicitly instructed to maintain their focus on the fixation point and swiftly direct their attention to the arrow-indicated position, responding as quickly as possible, irrespective of the target’s actual location.
In the automatic orientation task, a central fixation point is presented on the screen along with two boxes positioned on the left and right sides. Following a 700 delay, one of the boxes is illuminated with a 50% probability. After a subsequent interval ranging from 100 to 800 , a target (in the form of an illuminated square) is displayed within one of the two boxes. The target remains visible until the participant initiates a response by pressing the space bar on the keyboard or until a maximum time limit of 1500 is reached. In the ipsilateral condition, the target is presented in the same spatial position as the initial stimulus, while in the contralateral condition, it is presented in the opposite position. Participants are instructed to maintain fixation on the central point, disregard the first stimulus, and provide a rapid response to the target, regardless of its specific location.
Based on the test results of the aforementioned activities, a dataset comprising eight attributes has been generated. These attributes are as follows. AutomContra100 is a millisecond-based indicator utilized to assess the processing speed of attention during an automatic orientation task. It measures the time it takes for the space bar to activate from the moment the target appears at the fixation point, within a 100 interval, specifically in the contralateral condition. AutomContra800 is a metric that quantifies reaction time in automatic attention guidance tasks, specifically measuring the duration between target display at the fixation point and participant activation of the space bar within an 800 interval in the contralateral condition. AutomIpso100 accurately measures attention processing speed in automatic orientation tasks, providing precise timing in milliseconds. It evaluates the duration from the target’s display at the fixation point to the activation of the space bar within a 100 ms interval, specifically in the ipsilateral condition.AutomIpso800 measures the reaction time in automatic attention guidance tasks, specifically focusing on the ipsilateral condition within a precise 800 ms timeframe, providing results in milliseconds. VoluntInvalida300 is a precise metric employed in research studies to evaluate reaction time during a voluntary attention-guiding task. It quantifies the duration between the target being presented at the fixation point and the subsequent pressing of the space bar, specifically within a 300ms interval when the target is incorrectly indicated on the opposing side. VoluntInvalida800 is a metric used to evaluate reaction time in voluntary attention-guiding tasks. It represents the time elapsed from the presentation of the target at the fixation point until the activation of the spacebar, specifically within an 800 ms window after the target is indicated on the incorrect side. Voluntvalida300 is a metric, expressed in milliseconds, employed for evaluating reaction time within a voluntary attention guidance task. It quantifies the duration from when the target appears at the fixation point until the spacebar is pressed, specifically within a 300 ms window following the target’s indication on the relevant side. VoluntValida800 is a performance metric expressed in milliseconds (ms) that quantifies the duration between the display of the target on the fixation point during a voluntary attention orientation task and the subsequent pressing of the spacebar by the user. It specifically captures the reaction time within an 800 ms timeframe, starting from the indication of the target to its presentation on the designated side.
Therefore, within the scope of this research, every child will be evaluated based on these eight attributes. The primary objective of this study is to identify distinct ranges of values that can delineate various manifestations of ADHD, ultimately contributing to the characterization of a comprehensive attention spectrum.
3.1. Proposed Work
This subsection provides a detailed presentation of the procedures and strategies employed to achieve the objective proposed in this study. The general methodology, based on validated scientific assumptions and methods found in the literature, is visually represented in a simplified form in Figure 1. The process includes various steps such as data collection, analysis, and interpretation, each of which will be described in depth. Additionally, the techniques and tools utilized will be discussed. Data collection and pre-processing tasks are performed using the R language, while Python is employed for graph analysis. The graph analysis step specifically utilizes the Gephi tool 1.
It is important to emphasize that, in accordance with the objectives of this research proposal, our analysis will solely focus on the dataset of children diagnosed with ADHD. This deliberate approach aims to contribute to the overall understanding of the subject matter by exploring a spectrum within this specific group.
The process (refer to Figure 1) begins by organizing the dataset in a manner where children, identified solely by their attributes, are arranged in rows, and each column represents one of the eight attributes. This arrangement generates a collection of 30 objects, each having eight attributes.
The initial step in processing the dataset involves normalizing the attributes using the z-score method [29]. This is a common practice in data analysis, particularly in psychology research, where the goal is to standardize attributes across various scales based on standard deviation units [28]. To accomplish this, we utilized the function, which is a built-in component of the R programming language’s standard library.
The second procedure involves analyzing the similarity among the children themselves. To accomplish this, a matrix is generated wherein each child is compared to the entire dataset, resulting in a 30 × 30 similarity matrix for each group (ADHD and control). Each element of the matrix represents the similarity calculated using the Euclidean distance, which can be computed in R using the ’dist()’ function. Since the objective of this process is to create a graph where each child is a vertex and the edge represents the distance, it is desired to express the similarity inversely in graphs, meaning that stronger relationships are indicated by smaller values. Therefore, the following operation on the similarity matrix becomes necessary:
where rel is the relationship between any two children x and y of the dataset.
The data from the similarity matrix is exported to the desired Gephi format for research purposes using the function "gephi_write_edges_from_df()" from the Gephi library in the R language [26]. The resulting file includes essential information on the connection strength between the nodes, represented by the weights.
By importing the adjacency matrix into Gephi, researchers can effectively manipulate and explore the network, visualize and spatialize it, apply filters, and export the results [26] for further analysis. However, initial visualizations might appear chaotic and lack meaningful insights. To address this, the graph distribution algorithm called Force Atlas 2 [6] was employed. This algorithm employs a physical simulation approach, simulating the behavior of charged particles that repel each other like nodes, while edges act as attractive springs. The outcome is a visually enhanced and comprehensible graphical representation of the network.
After modeling the graph, we apply centrality measures such as intermediation, degree, and proximity, followed by the application of modularity to effectively detect communities.
The degree centrality measure determines the significance of a node based on the number of direct connections it has with other nodes in the graph [27]. It is represented mathematically by the following equation:
where is the degree centrality of vertex v, is the degree of vertex v, and n is the number total number of vertices in the graph [17].
Betweenness centrality, also referred to as flow centrality, is a measure that relies on the transmission of information through nodes. Its calculation assumes that information always traverses the shortest paths. By quantifying the frequency with which a vertex acts as a bridge along the shortest path connecting two other vertices, the betweenness measure provides valuable insights into network dynamics [16].
To determine the betweenness centrality of a vertex in a graph G with n vertices, one must aggregate the individual partial betweenness scores of within G. This cumulative value is represented as , which quantifies the betweenness centrality of within the graph G, and can be computed using the following formula:
where is the betweenness centrality of vertex , is the number of shortest paths between vertices s and t, and is the number of shortest paths between s and t that pass through vertex .
Proximity centrality, as defined by Freeman [27], measures the closeness between two vertices in a graph. Specifically, for a vertex in a graph G, its proximity centrality is determined by calculating the reciprocal of the sum of the shortest distances from to all other vertices within G.
where is the proximity centrality of vertex v and is the distance between vertices u and v.
After computing the centrality measures, we employ the modularity algorithm to assess the connectivity of graph partitions based on their configuration (degree, betweeness, betweenness) [9]. This algorithm facilitates the identification of communities [15]. For community detection, we utilize Gephi’s implementation of the Louvain method [10], a heuristic algorithm that relies on modularity. The Louvain method automatically identifies communities characterized by vertices with stronger interactions among themselves compared to vertices outside the community.
The Louvain algorithm (Algorithm 1) is an iterative method that enhances the overall modularity of a graph [10]. By maximizing the internal structure and minimizing connections between communities, it produces a final modularity value that signifies the division of the graph into distinct communities. This algorithm efficiently detects communities in graphs by optimizing graph modularity through iterative vertex movements between communities. Its ability to identify high-quality communities in large graphs makes it an invaluable tool for analyzing complex networks across diverse fields of research.
| Algorithm 1:Louvain Algorithm |
|
4. Experimental Results
In the current study, we generated a network consisting of 30 elements that represent positive cases of ADHD, as mentioned earlier. Figure 2 visually presents this network. It is essential to note that the colors used in the figure are purely illustrative and hold no significance beyond the analyses conducted in each experimental procedure.
The degree centrality measure was applied to the network of patients with ADHD, depicted in Figure 3, it was discovered that 80% of the nodes in the network are connected to all other 29 nodes. Conversely, the remaining 20% of nodes, specifically nodes 6, 14, 15, 19, 25, and 29, are only connected to 28 nodes, as shown in Figure 3. The substantial interconnectivity observed among the 80% of network nodes suggests a propensity for extensive social interactions or a greater dissemination of information within this group. Moreover, this connectivity also implies that patients who connect to the network share similar characteristics in terms of voluntary and automatic attention activities.
However, it is noteworthy that the subgroup of ADHD patients exhibiting a slightly lower degree of connections indicates a reduced level of interconnectedness within this specific group. This finding may imply a diminished inclination towards intense social interactions or a limited spread of information. It is crucial to highlight that these conclusions are drawn from the degree centrality measure, offering valuable insights into the network structure and dynamics of connections among the analyzed ADHD patients, thus enhancing our understanding in this area of research.
In relation to the measurement of betweenness in the network, an intriguing observation was made: 80% of the nodes with the highest degree exhibited a frequency of 0.10 in terms of their appearance on the shortest paths between the graph’s vertices. In contrast, the remaining 20% (nodes 6, 14, 15, 19, 25, and 29) displayed a rate of 0.07. This notable difference highlights the crucial role played by nodes identified through the betweenness measure in facilitating the flow of information within the network.
In addition, the proximity measure assigns equal importance to nodes based on their degree and intermediation measures. These nodes exhibit the shortest distances between graph vertices compared to the remaining 20% of nodes, indicating their higher proximity and potential significance for overall network connectivity.
These findings emphasize the relevance of nodes with high intermediation and proximity in shaping the network’s structure and dynamics. They play a crucial role in efficient information transfer and maintaining connectivity between graph vertices.
Consequently, the analysis reveals the presence of a distinct community within the network. By employing the modularity algorithm, two clearly separate communities were identified in the graph.
In this study, the discovered communities are defined as follows: The communities identified as the ADHD group are classified into Moderate and Severe groups, as shown in Figure 4. The classification is based on an analysis of the attributes that constitute the dataset, representing each node.
The results of the exploratory analysis revealed that the Moderate ADHD group exhibited significantly lower reaction times on both automatic and voluntary attention-oriented tasks compared to the Severe ADHD group. Conversely, the Severe ADHD group demonstrated prolonged attention processing time across all tested activities.
The discovered communities within the network are subjected to an exploratory analysis, focusing on the attributes of each subset, specifically children. The analysis outcomes are visually presented in the histograms depicted in Figure 5. These results can be utilized by specialists to establish attribute ranges for different diagnostic categories (moderate or severe). It should be noted that instances of overlapping values exist, indicating areas of uncertainty. To facilitate comprehension, Table 1 provides a comprehensive overview of the value ranges, with minimum and maximum limits clearly defined.
The obtained findings indicate that there are behavioral distinctions in attention processing capacity between the Moderate ADHD and Severe ADHD groups. Such insights carry significant implications for comprehending individual variations in cognitive performance and contribute to the advancement of personalized treatment approaches for patients diagnosed with Attention Deficit Hyperactivity Disorder (ADHD).
5. Conclusions and Future Work
The article presented a proposal to identify variations in values resulting from tests in ADHD patients by utilizing community detection in complex networks. The aim of the study was to explore the possibility of defining profiles of different attentional impairments, which could contribute to characterizing the ADHD spectrum. To achieve this, a methodology was introduced where the tests represented the children (individuals), and their relationships were revealed through a similarity matrix. The matrix was structured to enable the exploration of a complex network using Gephi.
The findings indicated that 80% of the vertices exhibited similar betweenness rate and proximity values. Moreover, employing the modularity algorithm, two distinct communities were identified in the analyzed graph, namely the moderate and severe groups. These results suggest that the groups display behavioral differences in attention processing capacity. These findings have significant implications for comprehending inter-individual variation in attentional performance and may assist in the development of personalized treatment approaches for ADHD patients, thereby opening avenues for further research in the field of attention deficit hyperactivity disorder (ADHD).
For future research, the inclusion of patients from control groups is intended to investigate the separation of value ranges. Additionally, by incorporating the control group, the significance of each attribute can be assessed to differentiate between positive (ADHD) and negative cases. Another approach involves exploring centrality, betweenness, and degree measures more comprehensively in terms of their relationship with attribute values. For instance, examining whether attributes of the highest degree node can serve as a diagnostic reference or marker. Lastly, comparing the attention guidance networks of individuals with ADHD before and after treatment using centrality measures and community detection could shed light on potential changes in network organization and its association with improved ADHD symptom outcomes.
References
- Sah, P.; Singh, L.O.; Clauset, A.; Bansal, S. Exploring community structure in biological networks with random graphs. BMC Bioinformatics 2014, 15, 220. [Google Scholar] [CrossRef]
- Yassine, S.; Kadry, S.; Sicilia, M.-A. Application of community detection algorithms on learning networks. The case of Khan Academy repository. Computer Applications in Engineering Education 2020, 29, 411–424. [Google Scholar] [CrossRef]
- Betzel, R. Community detection in network neuroscience. MDPI Complexity 2020, 2020, 1–15. [Google Scholar] [CrossRef]
- Boulic, R.; Renault, O. 3D Hierarchies for Animation. In New Trends in Animation and Visualization; Magnenat-Thalmann, N., Thalmann, D., Eds.; John Wiley & Sons ltd.: 1991; pp. 1–10.
- Smith, A.; Jones, B. On the Complexity of Computing. In Advances in Computer Science; Smith-Jones, A.B., Ed.; Publishing Press: 1999; pp. 555–566.
- Jacomy, M.; Venturini, T.; Heymann, S.; Bastian, M. ForceAtlas2, a Continuous Graph Layout Algorithm for Handy Network Visualization Designed for the Gephi Software. PloS One 2014, 9, e98679. [Google Scholar] [CrossRef] [PubMed]
- American Psychiatric Association. Manual diagnóstico e estatístico de transtornos mentais: DSM-5, 5th ed.; Autor: Washington, DC, USA, 2013. [Google Scholar]
- Piaget, J. A linguagem e o pensamento da criança, 7th ed.; Martins Fontes: São Paulo, SP, Brazil, 1999. [Google Scholar]
- Girvan, M.; Newman, M.E.J. Community structure in social and biological networks. Proc. Natl. Acad. Sci. USA 2002, 99, 7821–7826. [Google Scholar] [CrossRef] [PubMed]
- Blondel, V.D.; Guillaume, J.-L.; Lambiotte, R.; Lefebvre, E. Fast unfolding of communities in large networks. J. Stat. Mech.: Theory Exp. 2008, 2008, P10008. [Google Scholar] [CrossRef]
- Al-Ansari, A. Measurement of Impairment among Children with Attention Deficit Hyperactivity Disorder as Part of Evaluating Treatment Outcome. Sultan Qaboos Univ. Med. J. 2013, 13, 296–300. [Google Scholar] [CrossRef] [PubMed]
- Leite, H.A.; Tuleski, S.C. Psicologia Histórico-Cultural e desenvolvimento da atenção voluntária: novo entendimento para o TDAH. Rev. FapUNIFESP 2011, 15, 111–119. [Google Scholar] [CrossRef]
- Araujo, R.R.; Carreiro, L.R.R. Orientação voluntária e automática da atenção e indicadores de desatenção e hiperatividade em adultos. Avaliação Psicológica 2009, 8, 325–336. [Google Scholar]
- Cuvillier, A. ABC de Psicologia, 1935; Companhia Editorial Nacional: São Paulo, Brazil.
- Newman, M.E.J.; Girvan, M. Finding and evaluating community structure in networks. Phys. Rev. E 2004, 69. [Google Scholar] [CrossRef] [PubMed]
- Newman, M.E.J. A measure of betweenness centrality based on random walks. Soc. Networks 2005, 27, 39–54. [Google Scholar] [CrossRef]
- Newman, M. Networks: An Introduction; Oxford University Press, Inc.: USA, 2010. [Google Scholar] [CrossRef]
- Mariani, M.; Rocha Reis Lellis, V.; Novaes, R.; Schwartzman, J.; Triguero Veloz Teixeira, M.C.; Carreiro, L.R. Voluntary and Automatic Orienting of Attention in Children with Attention Deficit Hyperactivity Disorder. Arch. Clin. Psychiatry 2021, 48. [Google Scholar] [CrossRef]
- Dalgalarrondo, P. Psicopatologia e Semiologia dos Transtornos Mentais; Artmed Editora, 2018. Available online: https://books.google.com.br/books?id=8R5vDwAAQBAJ.
- Mendes, Y.; Almeida, E.; Cabral, R.; Queiroz, F. Uso de Redes Complexas para Classificação de Doenças Pulmonares Intersticiais em Imagens de Tomografia Computadorizada. In Proceedings of the Anais Principais do Simpósio Brasileiro de Computação Aplicada à Saúde (SBCAS 2020); Sociedade Brasileira de Computação - SBC: Porto Alegre, RS, Brasil; 2020. [Google Scholar] [CrossRef]
- Kido, G.S.; Igawa, R.A.; Barbon Jr., S. Topic Modeling based on Louvain method in Online Social Networks. In Proceedings of the Anais do Simpósio Brasileiro de Sistemas de Informação (SBSI); Sociedade Brasileira de Computação: Porto Alegre, RS, Brasil; 2016. [Google Scholar] [CrossRef]
- Almeida, T.; Nakamura, F.; Nakamura, E. Uma Abordagem Baseada em Redes Complexas para Análise de Depoimentos Legais. In Proceedings of the Anais do XXXVI Concurso de Trabalhos de Iniciação Científica da SBC; Sociedade Brasileira de Computação - SBC: Porto Alegre, RS, Brasil; 2017. Available online: https: //sol.sbc.org.br/index.php/ctic/article/view/3240.
- Caminha, C.; Furtado, V.; Pinheiro, V.; Ponte, C. Detecção de comunidades em redes complexas para identificar gargalos e desperdício de recursos em sistemas de ônibus. Anais do VI Brazilian Workshop on Social Network Analysis and Mining 2017, São Paulo. ISSN 2595-6094. Available online: https://sol.sbc.org.br/index.php/brasnam/article/view/3262. [CrossRef]
- Bastian, M.; Heymann, S.; Jacomy, M. Gephi: An Open Source Software for Exploring and Manipulating Networks. In International AAAI Conference on Weblogs and Social Media 2009, Keywords: network; network science; visualization; graph exploration; open source; free software; dynamic network; interactive interface; graph; force vector; java; OpenGL; 3-D visualization; user-centric; graph layout; complex graph rendering; network analysis; webatlas. Abstract: Gephi is an open source software for graph and network analysis. It uses a 3D render engine to display large networks in real-time and to speed up the exploration. A flexible and multi-task architecture brings new possibilities to work with complex data sets and produce valuable visual results. We present several key features of Gephi in the context of interactive exploration and interpretation of networks. It provides easy and broad access to network data and allows for spatializing, filtering, navigating, manipulating and clustering. Finally, by presenting dynamic features of Gephi, we highlight key aspects of dynamic network visualization. Available online: http://www.aaai.org/ocs/index.php/ICWSM/09/paper/view/154.
- Freeman, L.C. Centrality in social networks conceptual clarification. Social Networks 1978, 1, 215–239. [Google Scholar] [CrossRef]
- Bastian, M.; Heymann, S.; Jacomy, M. Gephi: An Open Source Software for Exploring and Manipulating Networks. International AAAI Conference on Weblogs and Social Media, 2009. Available online: http://www.aaai.org/ocs/index.php/ICWSM/09/paper/view/154.
- Freeman, L.C. Centrality in social networks conceptual clarification. Social Networks, 1978; 1, 215–239ISSN 0378-8733. Available online: https://www.sciencedirect.com/science/article/pii/0378873378900217.
- Lloyd-Smith, P. Kuhn-Tucker and Multiple Discrete-Continuous Extreme Value Model Estimation and Simulation in R: The rmdcev Package. The R Journal 2021, 12, 251–265. [Google Scholar] [CrossRef]
- Curtis, A.; Smith, T.; Ziganshin, B.; Elefteriades, J. The Mystery of the Z-Score. AORTA 2016, 4, 124–130. [Google Scholar] [CrossRef] [PubMed]
- Jones, P.J.; Mair, P.; McNally, R.J. Visualizing Psychological Networks: A Tutorial in R. Frontiers in Psychology 2018, 9. [Google Scholar] [CrossRef] [PubMed]
- Sato, J.R.; Vidal, M.C.; Santos, S.d.S.; Massirer, K.B.; Fujita, A. Complex network measures in autism spectrum disorders. IEEE/ACM Trans. Comput. Biol. Bioinform. 2018, 15, 581–587. [Google Scholar] [CrossRef] [PubMed]
| 1 |
Figure 1.
Flow Diagram of the Methodology Used in Research on Complex Networks of Attention Orientation Tests.
Figure 1.
Flow Diagram of the Methodology Used in Research on Complex Networks of Attention Orientation Tests.
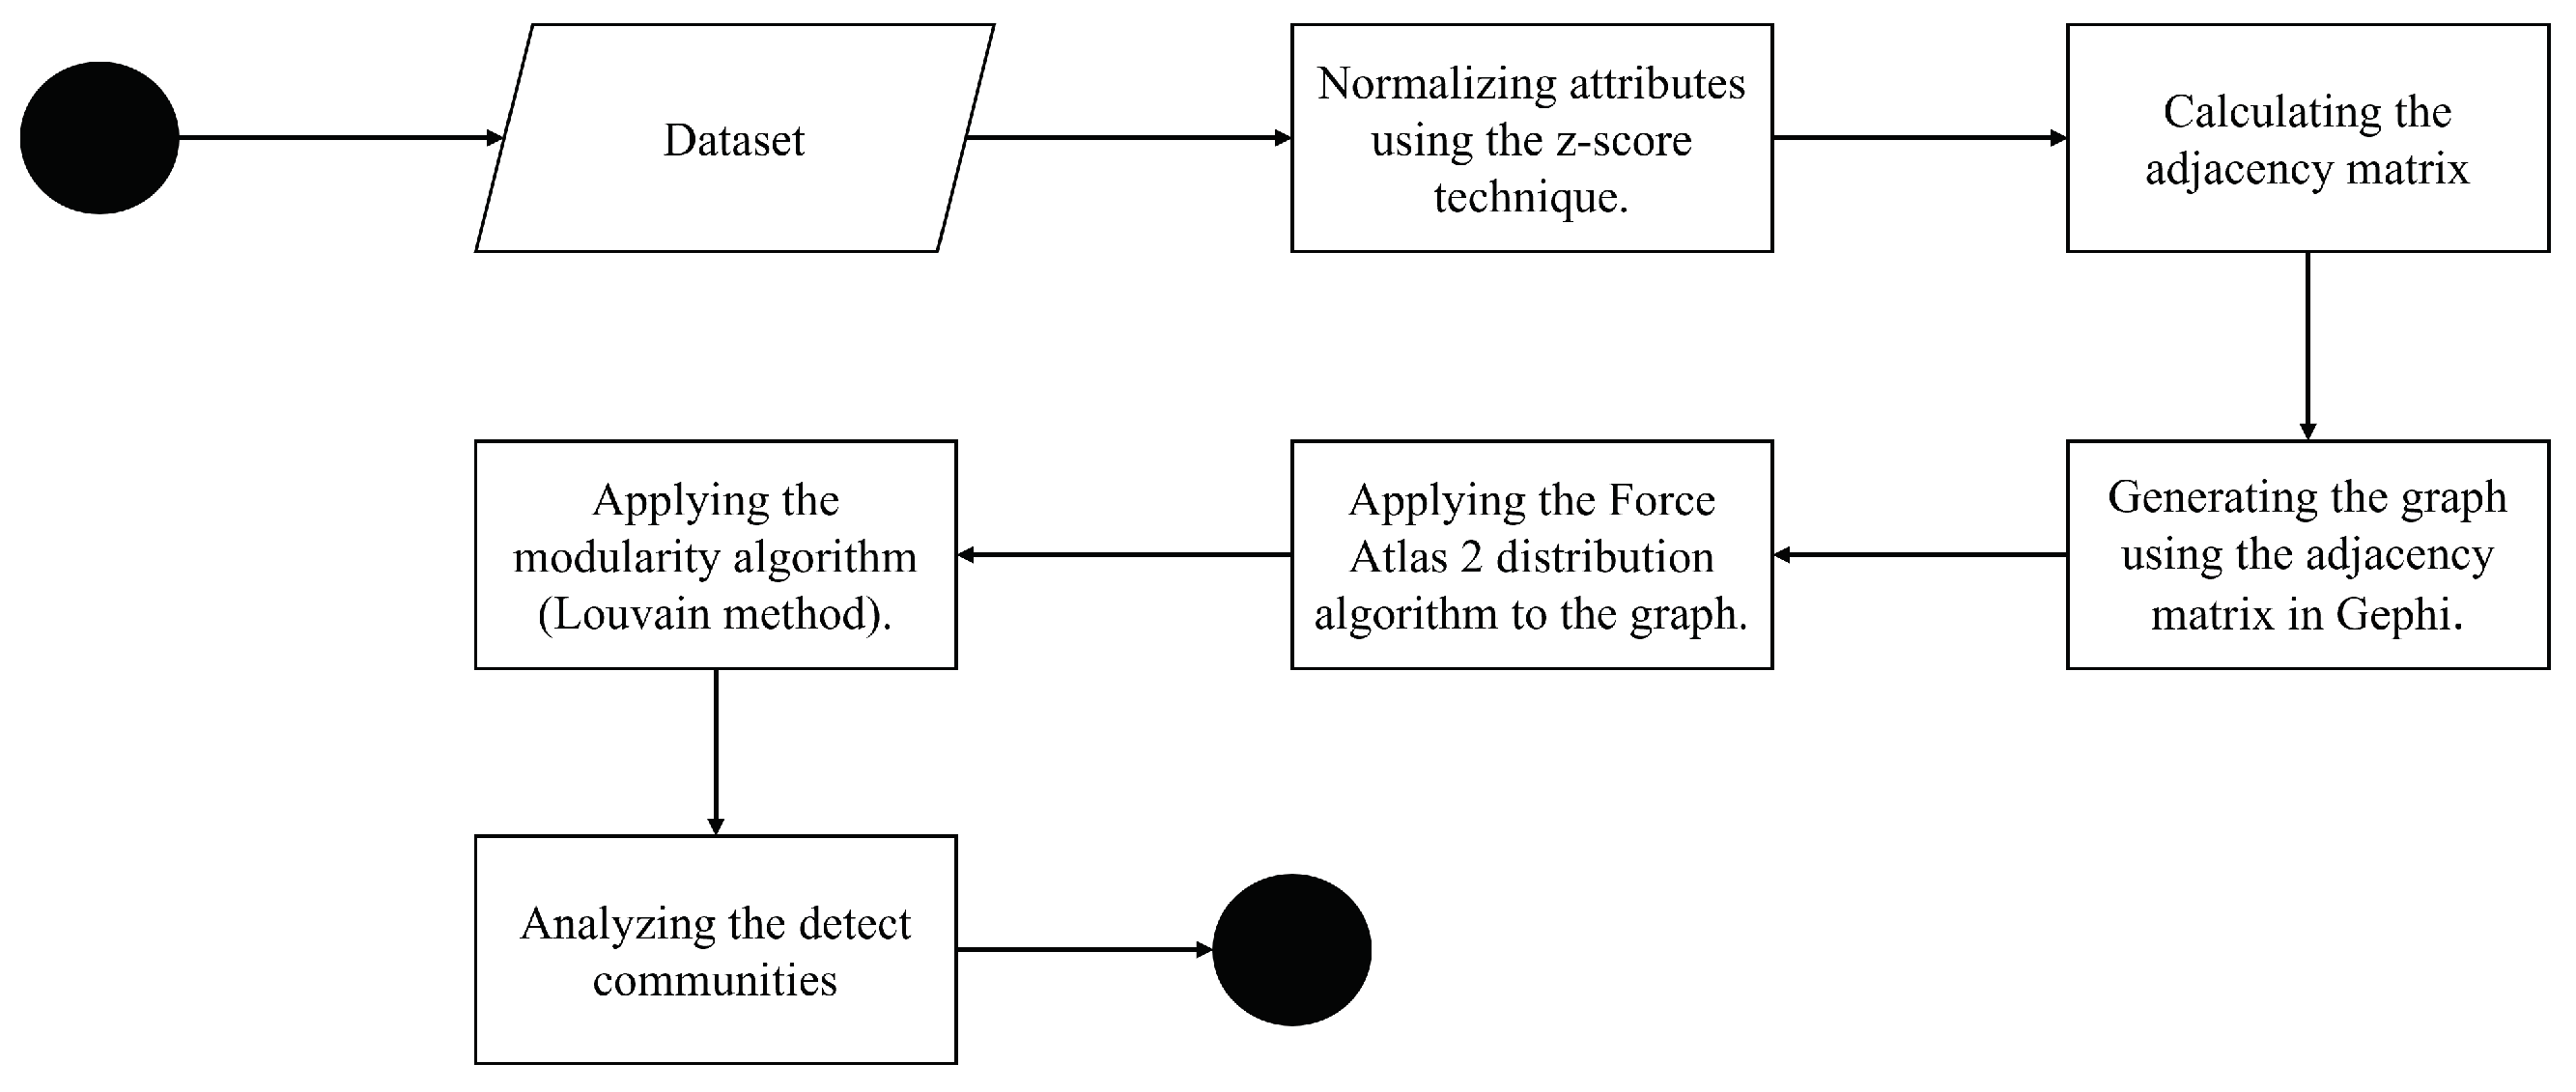
Figure 2.
Network with elements (patients) with ADHD.
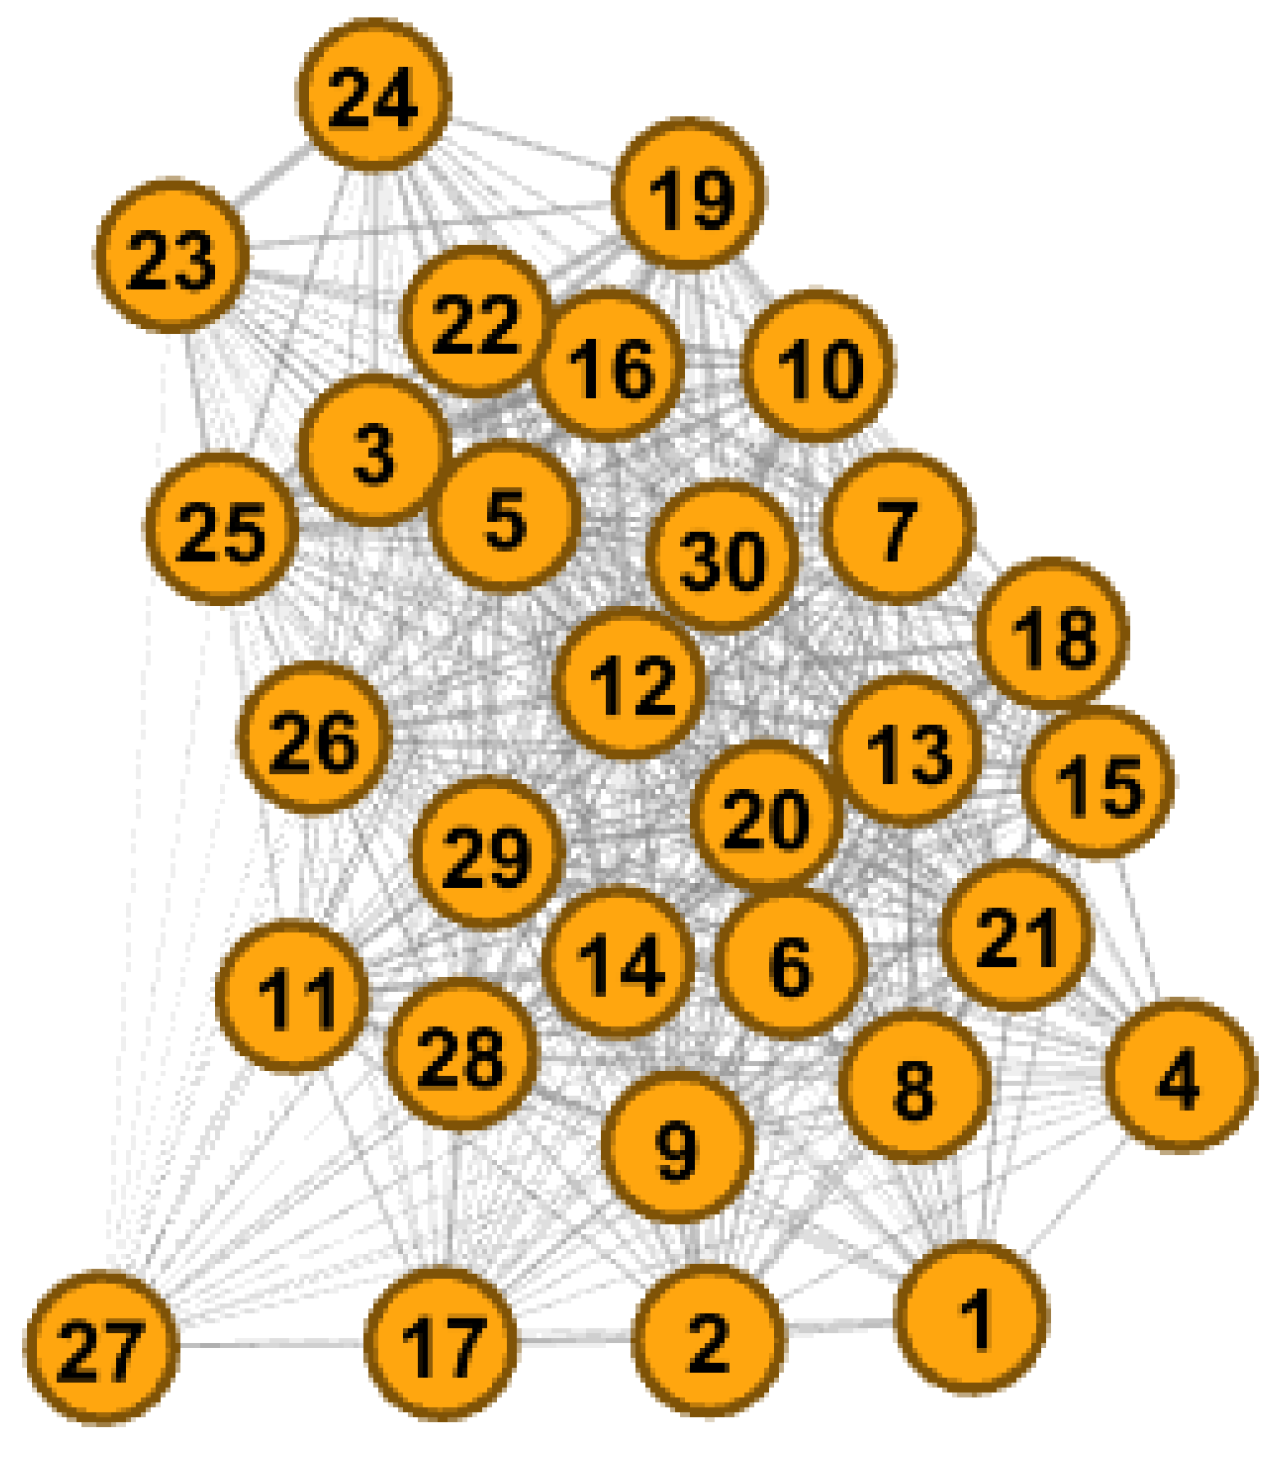
Figure 3.
Centrality Results.
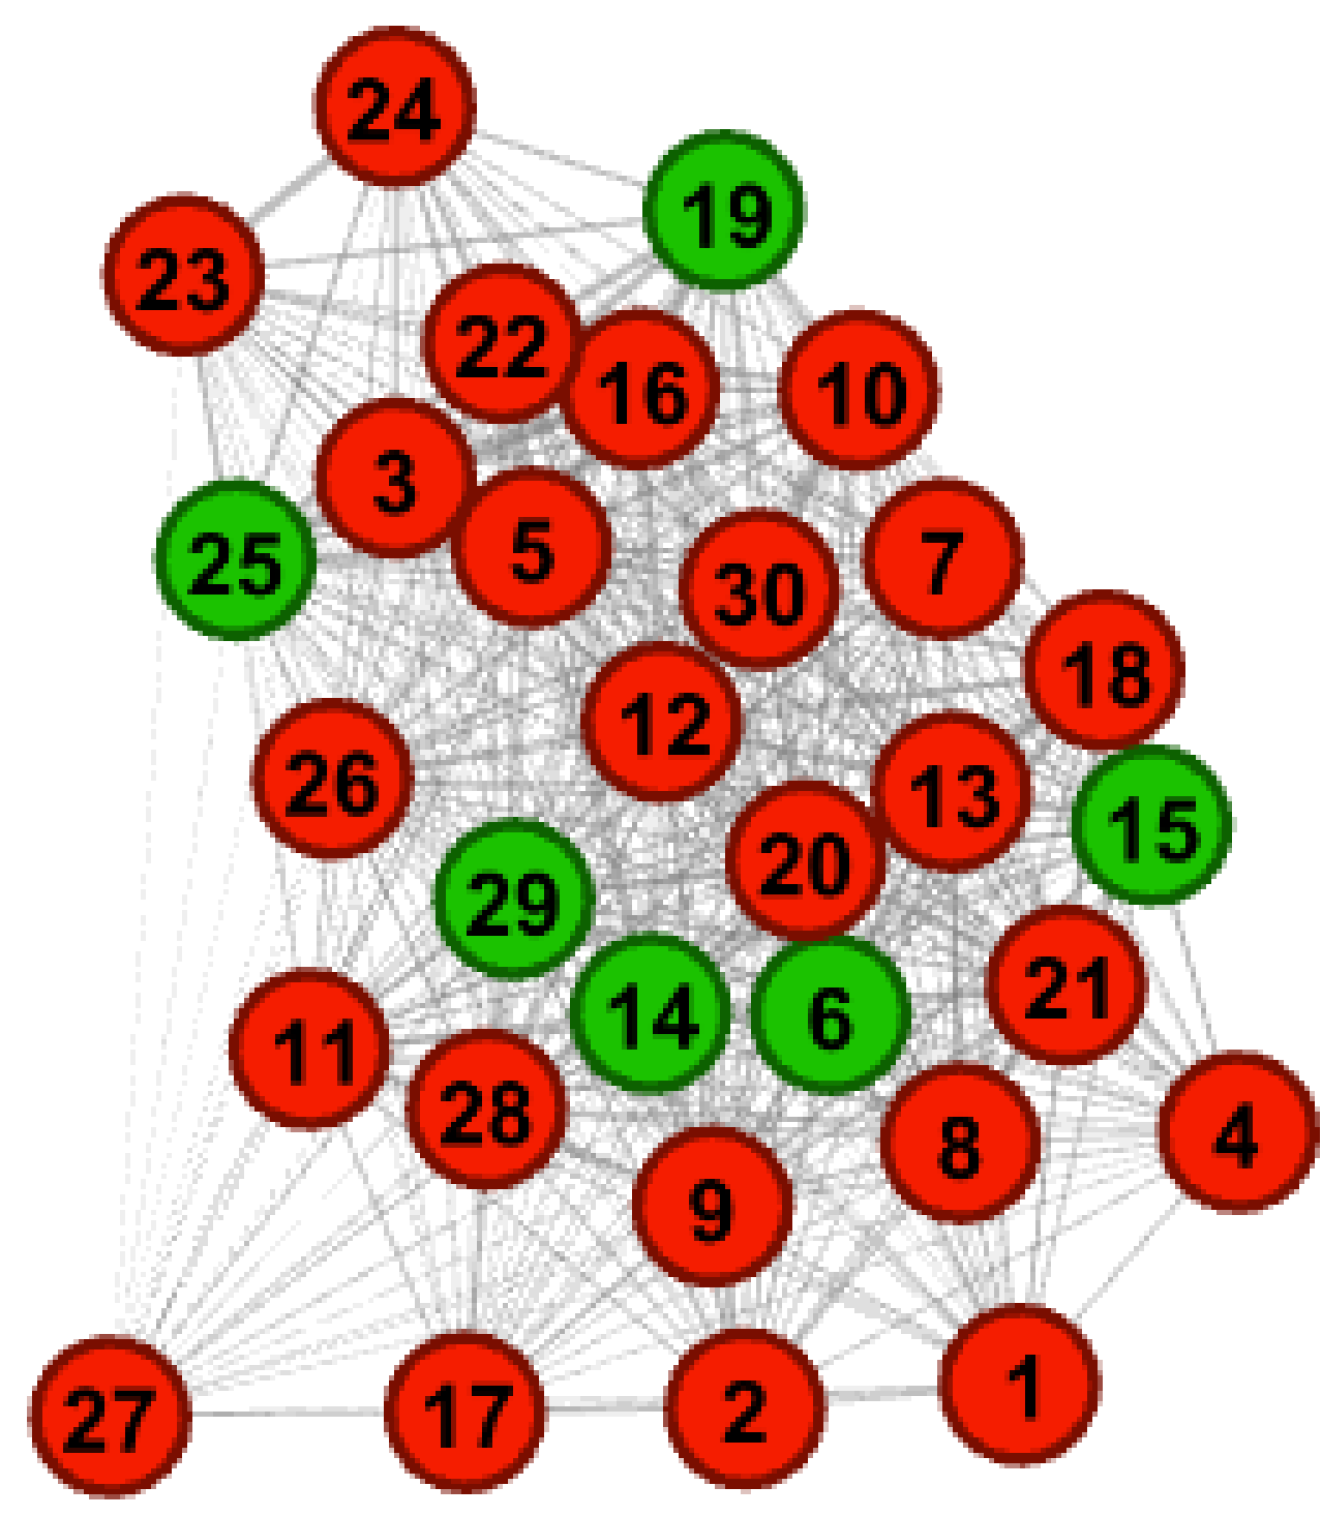
Figure 4.
Discovered Communities.
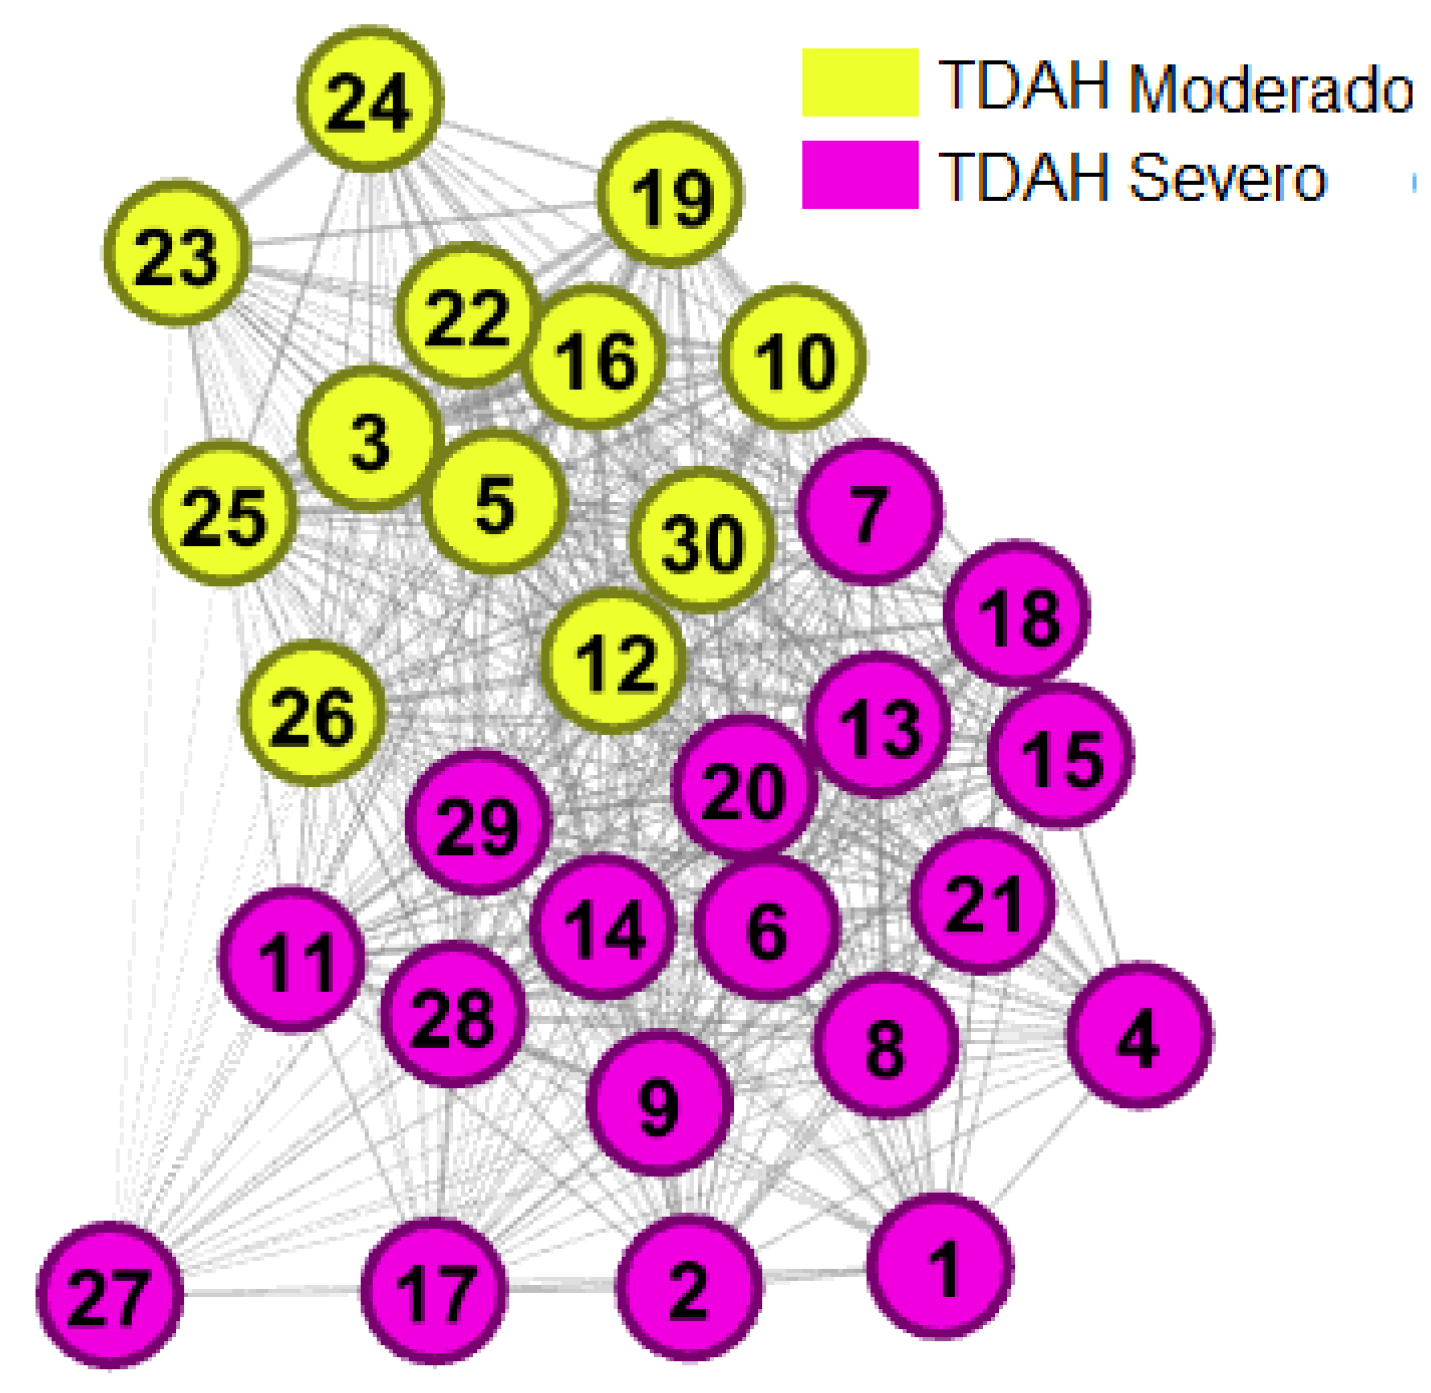
Figure 5.
Graphical Analysis of Database Attributes.
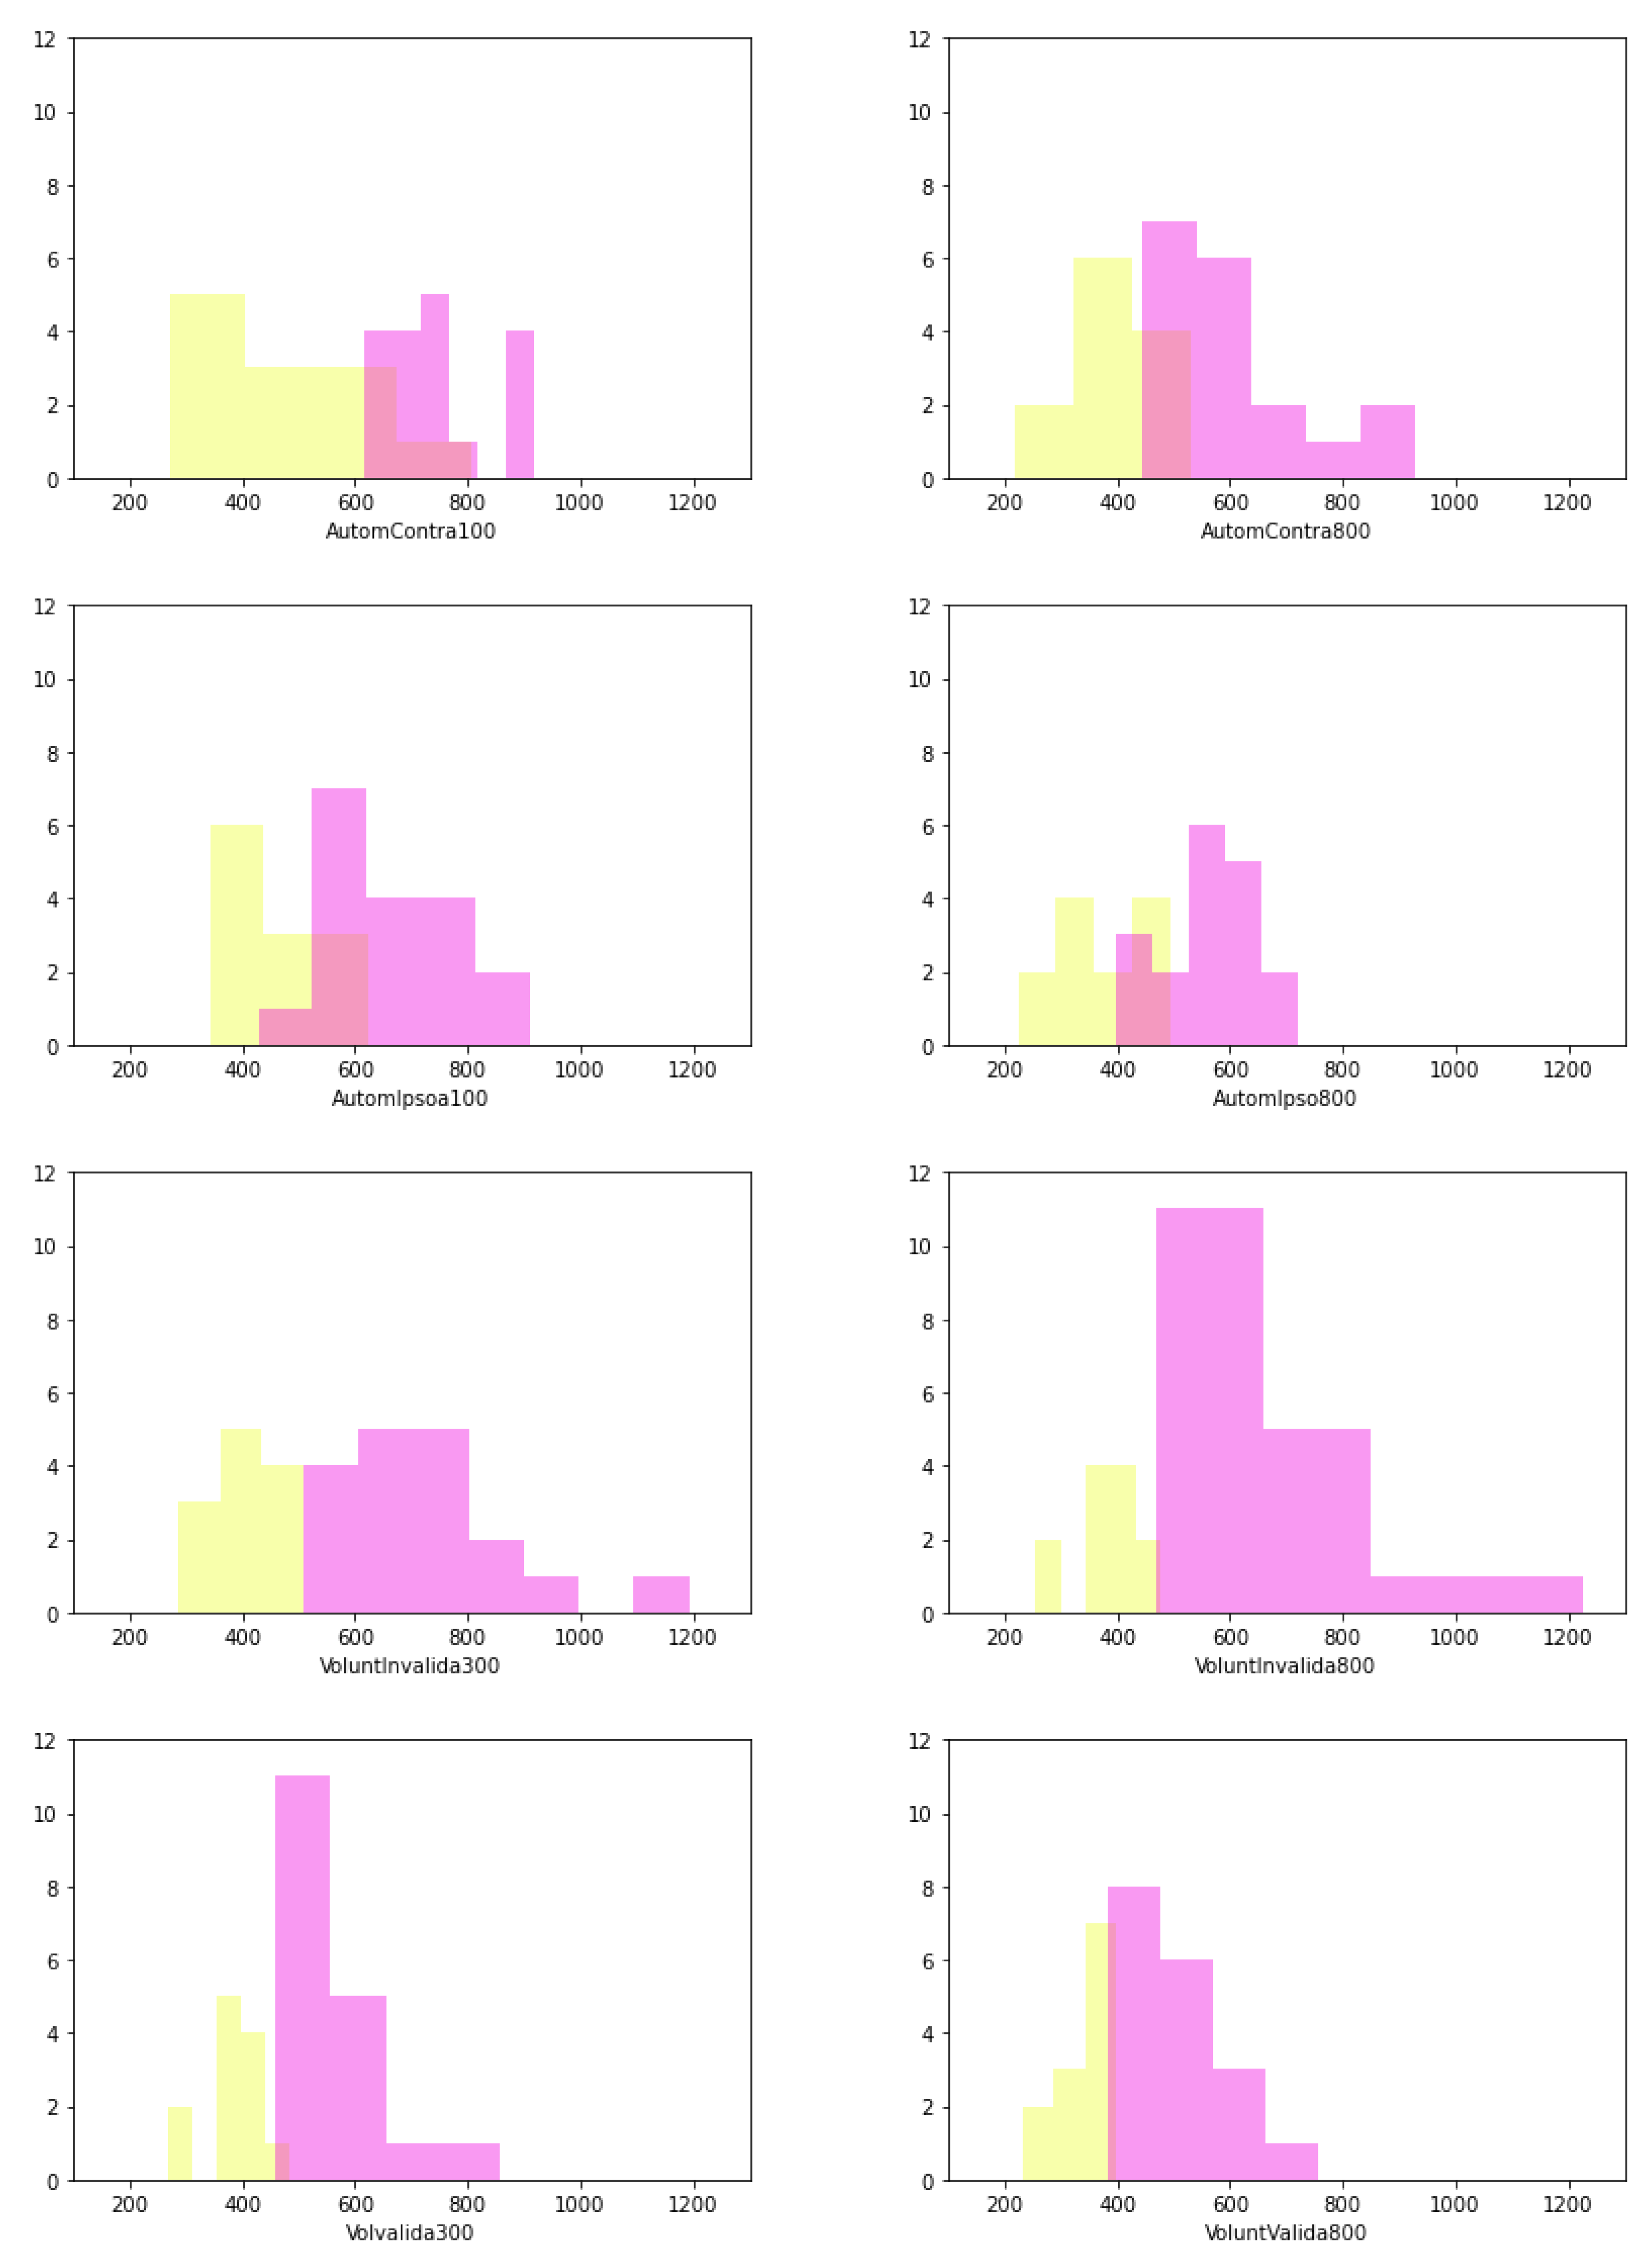

Table 1.
Minimum and maximum values of the attributes of the identified communities: a comparative analysis. Metrics expressed in milliseconds.
Table 1.
Minimum and maximum values of the attributes of the identified communities: a comparative analysis. Metrics expressed in milliseconds.
| Atributo | TDAH Moderado | TDAH Severo |
|---|---|---|
| AutomContra100 | 272 - 807 | 615 - 915,50 |
| AutomContra800 | 220 - 529,80 | 445,50 - 927,50 |
| AutomIpsoa100 | 343,50 - 622,95 | 545,25 - 910 |
| AutomIpso800 | 224,50 - 494,15 | 404 - 717,70 |
| VoluntInvalida300 | 287,50 - 630,50 | 509 - 1192 |
| VoluntInvalida800 | 255,50 - 653 | 471 - 1226 |
| Volunvalida300 | 270 - 495,50 | 457 - 857,50 |
| VoluntValida800 | 232 - 456,50 | 384,50 - 757 |
Disclaimer/Publisher’s Note: The statements, opinions and data contained in all publications are solely those of the individual author(s) and contributor(s) and not of MDPI and/or the editor(s). MDPI and/or the editor(s) disclaim responsibility for any injury to people or property resulting from any ideas, methods, instructions or products referred to in the content. |
© 2023 by the authors. Licensee MDPI, Basel, Switzerland. This article is an open access article distributed under the terms and conditions of the Creative Commons Attribution (CC BY) license (https://creativecommons.org/licenses/by/4.0/).
Copyright: This open access article is published under a Creative Commons CC BY 4.0 license, which permit the free download, distribution, and reuse, provided that the author and preprint are cited in any reuse.


