
Submitted:
15 June 2023
Posted:
16 June 2023
You are already at the latest version
Abstract
Machining titanium alloy (Ti6Al4V) used in orthopedic implants by conventional metal cutting processes is challenging due to excessive cutting forces, low surface integrity and tool wear. To overcome these difficulties and for ensuring high-quality products, various industries employ wire electrical discharge machining (WEDM) for precise machining of intricate shapes in titanium alloy. The objective is to make WEDM machining parameters as efficient as possible for machining the bio-compatible alloy Ti6Al4V using box-behnken design (BBD) and Non-dominated Sorting Genetic Algorithm II (NSGA II). A quadratic mathematical model is created to represent the productivity and the quality factor (MRR and surface roughness) in terms of varying input parameters, such as pulse active (Ton) time, pulse inactive (Toff) time, peak amplitude (A) current and applied servo (V) voltage. The established regression models and related prediction plots provide a reliable approach for predicting how the process variables affect the two responses viz MRR and SR. The effects of four process variables on both the responses were examined, and the findings revealed that the pulse duration and voltage has a major influence on the rate at which material is removed (MRR) whereas pulse duration influence quality (SR). The trade-off between MRR and SR, when significant process factors are included emphasizes the need for a reliable multi-objective optimization method. The intelligent metaheuristic optimization method named non-dominated sorting genetic algorithm II (NSGA II) is utilized to provide pareto optimum solutions in order to achieve high material removal rate (MRR) and low surface roughness (SR).
Keywords:
WEDM
; Box-behnken design
; NSGA-II
; material removal rate
; surface roughness
; Titanium alloy.
1. Introduction
The Ti6Al4V or Titanium Grade 5 is biocompatible, meaning it is well-tolerated by the human body and makes it suitable for medical implants like orthopedic implants, dental implants and prosthetics [1,2,3]. The superior corrosion resistance, formability and weldability makes titanium alloys to be used extensively in a wide range of industries like aerospace, automotive, chemical, and marine industries [4,5,6,7,8]. Titanium and its alloys are difficult to machine/process and expensive when utilized in conventional machining methods because of their high chemical reactivity (cause tool deformation) and poor thermal conductivity [9,10,11,12]. In several industries, wire electric discharge machining (WEDM) which utilizes thermo-mechanical energy can process with excellent accuracy and provide a good surface finish, is often employed to deal with such high-strength materials [13,14,15]. In the WEDM process, a conductive wire (electrode) that travels continually and the heat results in an electric spark which erodes the conductive work material [16,17]. During the process, dielectric fluid is utilized as a medium for ionization to create the electrical arc across the workpiece and the wire (electrode). The steady flow of dielectric fluid acts as cooling agent and helps in flushing the removed material away. The heat energy from these electrical sparks removes material in the form of micro debris. An illustration of the WEDM cutting concept is shown in Figure 1.
The WEDM equipment’s conservative technical data or the operator’s expertise were traditionally used to choose the appropriate parameters for the maximum material removal rate and minimum surface roughness during the EDM process, which resulted in inconsistent machining performance. Devarasiddappa et al. [18] focused on reducing surface roughness of Ti6Al4V alloy processed using WEDM. They obtained 2.6% reduction in SR for ideal process variables of the WEDM process. Muhammad Umar Farooq et al. [19] manufacture convex and concave shapes in Ti6Al4V using the WEDM technique and found that servo voltage, wire feed, pulse-on-time and pulse-off-time affects the precision of geometrical profiles and the diameter of corners. The pulse duration were shown to be the most important variables driving overcut in convex profiles. Chaudhari et al. [20] employed Taguchi’s L9 array to machine Ti6Al4V alloy using WEDM technique and found that pulse duration and current have impact on MRR and SR. Lin et al. [21] emphasized the benefits of using the grey-Taguchi technique to optimize a number of quality variables like electrode depletion, MRR, and overcut for micro-EDM finish quality of the Ti6Al4V alloy. According to the experimental findings, the peak current and pulse duration play a key role in the micro-EDM of Ti6Al4V alloy. Priyadarshini et al. [22] studied the use of Ti6Al4V alloy using EDM for various pulse parameters and chosen MRR, SR, and TWR (tool wear rate) as output factors utilizing taguchi orthogonal array for the experiment.
Material removal rate and surface roughness were the output parameters utilised by Gupta et al. [23] while using the WEDM process to machine a Ti6Al4V alloy, whereas the process parameters were pulse duration, wire speed, servo voltage, wire tension, pulse current, and feed rate. They observed that pulse duration has significant effect on MRR and SR. When using the WEDM method to cut Ti6Al4V alloy, Mouralova et al. [24] evaluated the current, voltage, pulse duration and wire speed as the process parameters. They determined using experiments that a quicker pulse-on time and longer pulse-off time resulted in a better surface quality. Ti6Al4V was studied as a work material by Pramanik et al. [25] and machined utilising the WEDM method while taking the effect of wire tension, pulse-on time, and pulse-off time as process parameters into consideration. They reached the conclusion that shorter pulse-on times and longer pulse-off times produced better results. Bisaria and Shandilya [26] studied the influence of pulse duration and spark gap voltage on MRR (material removal rate) and SR (surface roughness). They discovered that although MRR and SR values decreased with a rise in voltage and pulse off time, they increased drastically with a rise in pulse on time. Many experimental investigations have sought to investigate the impact of various process factors on the performance of the WEDM machining. The majority of the experiments, however, had limitations on the variety of process variables they were able to investigate or the range of values they can investigate and it can be suggested that there is still scope for improvement in terms of collecting data by piloting an in-depth and comprehensive investigation of the impact of a wide variety of WEDM process variables and their levels on the productivity and surface quality generated when processing Ti6Al4V alloy.
The selection of the appropriate process parameters is vital for sustainable production and the parameters associated with WEDM for the machining of the Ti6Al4V alloy have been optimised by a number of researchers. To collect data from experiments with the least amount of waste of time, money, raw materials, etc., systematic experiment design is crucial. Among the tools for designing experiments are taguchi techniques employing an orthogonal array, response surface methodology (RSM) and fractional factorial. A comprehensive review of the literature revealed that several researchers from all over the the world have contributed to the process parameter optimisation of the WEDM method for the machining of titanium-based alloys. WEDM is a process with multiple inputs and multiple outputs that has complex relationships on each parameter and how they interact with each other. When multiple objectives are dealt with, many conflicting circumstances develop that demand a solution. The best representation of this tradeoff is optimum pareto points obtained through evolutionary optimization which finds the solution near global optimum with less time and computing effort. So there arises a need for multi-response optimization which includes grey relational analysis (GRA) [27,28,29], heat transfer search (HTS) algorithm [30,31], teacher learning-based algorithm [32], particle swarm algorithm [33], genetic algorithm [34], artificial neural networks [35], etc., has been tested in order to find the tread-off solution in terms of optimized process parameters.
Deb et al. [36] implemented NSGA-II (Non sorted genetic algorithm II), a newly developed approach that was designed to handle multi-objective problems and search for a variety of solutions that efficiently reflect the trade-off between contrasting objectives. NSGA II can effectively explore the solution space, maintain diversity and provide optimum or near-optimal solutions for the optimization of two conflicting objectives viz. maximum material removal rate (MRR) and minimal surface roughness in WEDM. AISI 5160 steel [37], high-speed steel [38], and AISI D3 tool steel [39,40] are a few materials that are being processed in WEDM and their results are optimized using NSGA-II. Based on the literature, it has been found that limited study has been done to minimize SR and maximize MRR in WEDM of Ti6Al4V alloy using the NSGA II algorithm which can select the most dominant solution.
The goal of this study was to optimize the machining settings in order to maximize MRR whereas minimizing SR. Therefore, the entire study may be broken into three sections. The first section involves conducting experiments based on box–behnken design and collecting data regarding the responses, namely MRR and SR, to various input parameters, including pulse active (Ton) time, pulse inactive (Toff) time, peak amplitude of current (A), and applied servo voltage (V). In the second section, the effect and influence of the parameters on the responses are examined and discussed. The third section is to develop the multi-objective metaheuristics algorithm NSGA-II, which can search for the most optimal parameter for the conflicting objective i.e. maximize MRR and minimize SR. Comparisons are made between the results obtained by using these different methods, and validation is carried out via the use of confirmation tests.
2. Materials and Methods
In this work, CNC wire cut EDM DK7732 with 3kVA power and BMW 3000 controller shown in Figure 2 was used to cut the profile shown in Figure 3 on the commercial titanium Ti6Al4V alloy of 5 mm thickness. Table 1 presents a list of the chemical components of the titanium Ti6Al4V alloy that was utilized in this investigation. Deionized water was utilized to eject away the waste particles produced during the machining process, and a Ф 0.25 mm zinc-coated brass wire was utilized as the electrode for cutting purposes.
RSM is an abbreviation for response surface methodology, which is a powerful mathematical and statistical tool that can investigate and optimize complicated systems. Researchers have utilized extensive use of the box–behnken design (BBD), which is a method of response surface methodology (RSM), in order to optimize experimental trials [41]. The box-behnken design is advantageous since it does not contain any points at the extremities of the cubic region produced by the two-level factorial combinations that are either costly to test or difficult to test due to physical restrictions in experimentation [42]. It is widely used in a variety of sectors, including agrochemicals, pharmaceuticals, bioprocessing and others [43].
The experiments used a two-level design with four parameters viz. pulse active time (Ton) ranging from 110 to 120 µs, pulse inactive time (Toff) ranging from 50 to 60 µs, applied servo voltage (V) ranging from 40 to 50 V and peak amplitude of current (A) ranging from 40 to 42 A. The box-behnken design was employed to generate a total of 29 experiments, and the corresponding values of the response characteristics were determined. Table 2 depicts the range of input parameters that were chosen based on preliminary pilot experiments and an extensive investigation of the literature.
The response characteristics evaluated in the present study are the MRR and average SR. After cleaning roughness tester with acetone, it was used to measure the SR at three different locations. The average of all three values was then selected. Equation (1) was used to determine the MRR after the machining time was measured using a stopwatch [44,45].
where,
L—Cutting length
H—Workpiece thickness and
t—Machining time (in mins).
3. Results and discussion
3.1. Response surface methodology (RSM)
A statistical and mathematical approach called response surface methodology (RSM) is used to optimise and investigate the interaction between a number of input variables (factors) and one or more output variables (responses). It is commonly used in the field of experimental design and process optimization which is particularly useful when the association between the input variables and the response variables is intricate and nonlinear. By systematically varying the levels of the input variables and measuring the corresponding response, RSM helps to model and understand the relationship, and subsequently, determine the optimal values of the input variables to achieve desirable responses.
3.1.1. Multivariate analysis (ANOVA)
Table 3 depicts the BBD and experimental findings of the WEDM process’s machining capabilities. For a 5% significance level (α = 0.05), the "P value" must be less than or equal to 0.05 to be stated significant and the backward elimination method excludes irrelevant factors. The model’s potential for predicting an optimal response value for correlation coefficient R has been evaluated in the most favorable conditions possible. Regression analysis was used to determine the optimum region to investigate the responses under study by fitting mathematical models to the experimental data. The data from the experiment runs was analyzed and obtained with the use of Design expert software V 13.0 and the list of significance of each coefficient’s for MRR and SR is depicted in Table 4 and Table 5.
An experimental relationship expressed by an equation of second-order polynomial with interaction terms was utilized to fit the data from the BBD model. Following is the final (equation 2 and 3) result in coded factors:
Analysis of variance (ANOVA) was implemented to analyze the data, and Table 4 and Table 5 shows the significance of the experimental findings to different models along with the related p-values. Four linear correlation coefficients (A, B, C and D), six interaction coefficients (AB, AC, AD, BC, BD and CD) and four quadratic coefficients (A2, B2, C2 and D2) were found to be substantial. The p-values of each model term is investigated to depict the interaction patterns between the variables, for p < 0.0001, the model’s F-value of 18.5 for MRR and 10.02 for SR showed that it was very significant. Due to the relative pure error, the lack of fit F value of 0.8983 for MRR and 0.5147 for SR was not significant (p = 0.0702). Overall, unless the model is adequately fit to make validating its suitability for use needed, inadequate or inaccurate results may be obtained through the investigation and optimization of the fitted response surface [46]. The P-value is used to determine the significance of each coefficient and the degree of the interaction between variables. Effects that are less than 0.05 are considered significant. The degree of correlation between the values observed and predicted is better when the significance level is greater [47]. The "Pred R-Squared" of 0.9175 and the "Adj R-Squared" of 0.9342 for MRR and The "Pred R-Squared" of 0.9021 and the "Adj R-Squared" of 0.9278 for SR are reasonably in compatible in the current examination. In addition, a correlation coefficient with a high value (R2 for MRR is 0.9687 and SR is 0.9542) showed a significant relationship between the values of the anticipated and experimental responses. The low CV value (5.42% for MRR and 4.52% for SR) made it evident that there were minor deviations between the predicted and experimental, and it also demonstrated that the experiments were very precise and reliable. The adequate precision ratio in the current investigation was determined to be 14.91 for MRR and 12.13 for SR, indicating a sufficient indicator and the present model may be utilized to move about the design space.
3.1.2. Diagnostic graphs
The data statistics are shown in (Figure 4 and Figure 5) in which analyzing the experimental and the model observation diagnostic plots enabled the determination of the models’ accuracy. The Figure 4A & Figure 5A is the residual plot for the response which exhibits a normal% probability distribution, the points are logically closer to to the straight line, with no significant deviations, the current model significantly improved the interaction between the response and the process variables.
The predicted values were extremely similar to that of the observed values, as shown in Figure 4B & Figure 5B. By establishing a satisfactory fit of the model, the externally studentized residuals vs experimental runs were examined and the results show that all of the data points fit inside the limits (Figure 3C & Figure 4C). For each run, the values of the predicted and actual responses were regularly distributed and almost straight lines shown in Figure 4D & Figure 5D. The Figure 4E, Figure 5E and Figure 4F, Figure 5F shows the box-cox plots (for power transforms of variables), which indicate the perturbation of variables are within the specified range.
3.1.3. 3D Response surface plot
In order to understand the major impacts of two variables as well as their interactions, it is useful to compare the effects of the two components using 3D surface plots.
The Figure 6 illustrates the 3D response surface plot for the MRR, from which it was observed that the maximum MRR (6.62 mm3/min) was observed for maximum Ton (120 µs) and Toff (60 µs) whereas medium voltage (45 V) and current (41 A). When the titanium (Ti6Al4V) alloy was processed using WEDM, the combined effects of the Ton with Toff, Ton with current and Ton with servo voltage (Figure 6A–C) resulted in better spark creation and improved characteristics, which increased workpiece vaporization and melting thereby resulted in increased MRR. Therefore combination of higher values for these combination of input parameters results in increase in the EDM process’s overall productivity. Whereas in case of the interaction of Toff with current and Toff with voltage (Figure 6D,E), it was evident that there was little variation with these two factors and there is a gradual increase in MRR. The interaction of current and voltage (Figure 6F) has negligible impact on the WEDM productivity.
From the 3D response surface plot of SR (Figure 6) it was observed that the surface roughness is minimum (3.18 µm) is observed for maximum voltage (50 V), minimum Toff (50 µs) and Medium Ton (115 µs) and current (41 A). In general, it can be observed that interactions between the various machining parameters are much simpler than the simple rule of thumb, and their combined impact on the process response is quite ambiguous. Figure 7A–C shows how roughness varies with Ton & Toff, Ton & current and Ton & servo voltage. According to the Figure, superior quality (i.e., smaller SR values) may essentially be achieved by combining lower values of Ton and Toff, Ton & current and Ton & servo voltage in contrast to their impact on process productivity (MRR). Whereas in case of the interaction of Toff with current and Toff with voltage (Figure 7D,E), it was evident that there was little variation with these two factors and there is a gradual decrease in SR for decreasing inputs. The interaction of current and voltage (Figure 7F) has negligible impact on the roughness.
3.2. Multi-Objective Optimization using Non-Dominated Sorting Generic Algorithm-II (NSGA-II)
NSGA II is a powerful multi-objective optimization algorithm that uses non-dominated sorting to find the optimal solutions that satisfy multiple objectives simultaneously. In this case, the objectives are to maximize MRR and minimize Ra for WEDM parameters, which are dependent on Ton, Toff, V, and A. However, MRR and Ra are conflicting objectives, and optimizing one may lead to the degradation of the other. To address this issue, NSGA II practices elitist non-dominated selection to obtain a non-dominated set of solutions. The selection of the non-dominated is done based on the ranking of the non-dominated level, which is done using the crowd comparing operator and crowd distance. These methods help to maintain population diversity and prevent the algorithm from premature convergence to a local optimum.
NSGA-II procedure:
Step 1: Based on the maximum and minimum values of the input parameters, initialize the population (N);
Step 2: Determine the fitness functions for every individual, including MRR and surface roughness;
Step 3: Sort the initialized population using non-dominated criteria;
Step 4: Choose the individuals based on crowding distance and ranking, then produce offspring by doing cross-over operations with a factor of 0.95 and mutation operations with a factor of 0.01;
Step 5: Add the populations of the parents and offspring together and determine who belongs in the next generation based on ranking and crowding distance;
Step 6: If the maximum generation (500) has been achieved, stop; if not, go to Step 4.
Since the nature of MRR and Ra conflicts and the dependence on Ton, Toff, PC and SV, is resolved by assigning a negative sign (indicating minimization) to MRR.
So, Maximize MRR = Minimize (-MRR) = f(Ton, Toff, SV, PC) and minimize Ra = f(Ton, Toff, V, A)
Subjected to:
110 ≤ Ton ≤ 120 µs;
50 ≤ Toff ≤ 60 µs;
40 ≤ SV ≤ 50 V and
40 ≤ PC ≤ 42 A
Once ANOVA was performed using Equation (2) and Equation (3) to obtain objective functions for MRR and SR, The Table 4 represents the Pareto optimal solutions obtained in a study aimed at achieving superior surface finish and increased material removal rate (MRR). The study was conducted by varying four machining parameters, namely pulse active (Ton) time, pulse inactive (Toff) time, servo voltage and peak amplitude of current, using pareto fraction of 0.1 and a population size of 1000. The table includes 23 solution sets, with the optimal solution being solution number 2. Each solution set is characterized by its corresponding values of Ton, Toff, Servo Voltage, Peak Current, MRR (in mm3/min), and Ra (surface roughness in μm). The MRR and Ra are the two objective functions obtained after conducting ANOVA. The table shows that the values of Ton, Toff, Servo Voltage, and Peak Current vary across the solution sets, leading to different values of MRR and SR. The Figure 8 illustrates the 23 results of pareto optimum frontal, which illustrates the better convergence of the results. Depending on the specific product requirements, any solution from the set in Table 4 is acceptable. The most desirable set, on the other hand, is chosen with the primary goal of achieving superior Productivity factor and quality factor (MRR and roughness) and in this case, solution 2 is preferable to other Pareto optimal solution sets. To validate the findings of the NSGA II, a confirmation experiment was performed on the optimal solution set 2 in Table 6. MRR and Ra had 1.06% and 1.24% deviations between experimental and predicted results, respectively.
4. Conclusions
The current study utilized BBD-NSGA II, to optimize MRR and Ra in WEDM of Ti6Al4V alloy. Mathematical equations, which were quadratic in nature, were obtained as a function of WEDM parameters for MRR and SR. Based on the results of the study, the following conclusions can be drawn:
- This study provides valuable insights into the optimization of the WEDM process for biocompatible titanium alloy Ti6Al4V.
- The non-linear behavior in the responses MRR and SR in WEDM of Ti6Al4V alloy was found to be suitable for modelling and characterized by a quadratic model.
- The models developed for MRR and SR were adequate as it has high F-value and reasonably decent association with trial results, accounting R2 for MRR is 96.87% and for SR is 95.42%.
- Pulse active (Ton) time was identified as the foremost WEDM parameter affecting MRR and SR with a maximum percentage, followed by pulse inactive time (Toff).
- The confirmation experiments used to evaluate the optimization result generated by NSGA II show good agreement between the experimental value and the predicted value, with absolute errors of 1.06% and 1.24% for MRR and SR, respectively.
- The NSGA II optimization technique proved to be a more effective method for optimizing multiple objectives and the technique NSGA II provided pareto-optimal solutions that offered most favorable balance between surface characteristics and material removal rate.
Author Contributions
Conceptualization, methodology, validation, investigation, resources, data curation, writing—original draft preparation done by AN; software, formal analysis, writing—review and editing done by VS; visualization, project administration, supervision done by GJ. All authors have read and agreed to the published version of the manuscript.
Funding
This research received no external funding.
Institutional Review Board Statement
Not applicable.
Informed Consent Statement
Not applicable.
Data Availability Statement
The study did not report any data.
Conflicts of Interest
The authors herewith declare that they have no conflict of interest to the publication of this article.
References
- Gogolewski, D.; Kozior, T.; Zmarzły, P.; Mathia, T.G. Morphology of Models Manufactured by SLM Technology and the Ti6Al4V Titanium Alloy Designed for Medical Applications. Materials 2021, 14, 6249. [Google Scholar] [CrossRef]
- Meto, A.; Conserva, E.; Liccardi, F.; Colombari, B.; Consolo, U.; Blasi, E. Differential efficacy of two dental implant decontamination techniques in reducing microbial biofilm and re-growth onto titanium disks in vitro. Appl. Sci. 2019, 9, 3191. [Google Scholar] [CrossRef]
- Jhong, Y.T.; Chao, C.Y.; Hung, W.C.; Du, J.K. Effects of Various Polishing Techniques on the Surface Characteristics of the Ti-6Al-4V Alloy and on Bacterial Adhesion. Coatings 2020, 10, 1057. [Google Scholar] [CrossRef]
- Li, S.; Zhang, D.; Liu, C.; Shao, Z.; Ren, L. Influence of dynamic angles and cutting strain on chip morphology and cutting forces during titanium alloy Ti-6Al-4V vibration-assisted drilling. J. Mater. Process. Technol. 2021, 288, 116898. [Google Scholar] [CrossRef]
- Lui, E.W.; Medvedev, A.E.; Edwards, D.; Qian, M.; Leary, M.; Brandt, M. Microstructure modification of additive manufactured Ti-6Al-4V plates for improved ballistic performance properties. J. Mater. Process. Technol. 2021, 301, 117436. [Google Scholar] [CrossRef]
- Liu, C.; Liu, D.; Zhang, X.; Yu, S.; Zhao, W. Effect of the ultrasonic surface rolling process on the fretting fatigue behavior of Ti-6Al-4V alloy. Materials 2017, 10, 833. [Google Scholar] [CrossRef] [PubMed]
- Somani, N.; Tyagi, Y.K.; Kumar, P.; Srivastava, V.; Bhowmick, H. Enhanced tribological properties of SiC reinforced copper metal matrix composites. Mater. Res. Express 2019, 6, 016549. [Google Scholar] [CrossRef]
- Kumar, A.; Kumar, V.; Kumar, J. Investigation of machining characterization for wire wear ratio & MRR on pure titanium in WEDM process through response surface methodology. Proc. Inst. Mech. Eng. Part E J. Process. Mech. Eng. 2018, 232, 108–126. [Google Scholar]
- Sarıkaya, M.; Gupta, M.K.; Tomaz, I.; Pimenov, D.Y.; Kuntoğlu, M.; Khanna, N.; Yıldırım, Ç.V.; Krolczyk, G.M. A State-of-the-Art Review on Tool Wear and Surface Integrity Characteristics in Machining of Superalloys. CIRP J. Manuf. Sci. Technol. 2021, 35, 624–658. [Google Scholar] [CrossRef]
- Revuru, R.S.; Zhang, J.Z.; Posinasetti, N.R.; Kidd, T. Optimization of titanium alloys turning operation in varied cutting fluid conditions with multiple machining performance characteristics. Int. J. Adv. Manuf. Technol. 2018, 95, 1451–1463. [Google Scholar] [CrossRef]
- Saketi, S.; Odelros, S.; Östby, J.; Olsson, M. Experimental Study of Wear Mechanisms of Cemented Carbide in the Turning of Ti6Al4V. Materials 2019, 12, 2822. [Google Scholar] [CrossRef]
- García-Martínez, E.; Miguel, V.; Martínez-Martínez, A.; Manjabacas, M.C.; Coello, J. Sustainable Lubrication Methods for the Machining of Titanium Alloys: An Overview. Materials 2019, 12, 3852. [Google Scholar] [CrossRef]
- Maurya, R.; Porwal, R.K.; Singh, R. Concerning drifts to optimization techniques of wire-EDM process for titanium based super alloys: A review. Mater. Today Proc. 2019, 18, 4509–4514. [Google Scholar] [CrossRef]
- Chaudhari, R.; Vora, J.J.; Mani Prabu, S.; Palani, I.; Patel, V.K.; Parikh, D.; de Lacalle, L.N.L. Multi-response optimization of WEDM process parameters for machining of superelastic nitinol shape-memory alloy using a heat-transfer search algorithm. Materials 2019, 12, 1277. [Google Scholar] [CrossRef] [PubMed]
- Wu, C.; Cao, S.; Zhao, Y.J.; Qi, H.; Liu, X.; Liu, G.; Guo, J.; Li, H.N. Preheating assisted wire EDM of semi-conductive CFRPs: Principle and anisotropy. J. Mater. Process. Technol. 2021, 288, 116915. [Google Scholar] [CrossRef]
- Rathi, P.; Ghiya, R.; Shah, H.; Srivastava, P.; Patel, S.; Chaudhari, R.; Vora, J. Multi-response optimization of Ni55.8Ti shape memory alloy using taguchi–grey relational analysis approach. In Recent Advances in Mechanical Infrastructure: Proceedings of the ICRAM 2019, Ahmedabad, India, 20–21 April 2019; Springer: Singapore, 2019; pp. 13–23. [Google Scholar]
- Chaudhari, R.; Ayesta, I.; Doshi, M.; Khanna, S.; Patel, V.K.; Vora, J.; De Lacalle, L.N.L. Effect of Multi-walled carbon nanotubes on the performance evaluation of Nickel-based super-alloy–Udimet 720 machined using WEDM process. Int. J. Adv. Manuf. Technol. 2022, 123, 2087–2105. [Google Scholar] [CrossRef]
- Devarasiddappa, D.; Chandrasekaran, M.; Arunachalam, R. Experimental investigation and parametric optimization for minimizing surface roughness during WEDM of Ti6Al4V alloy using modified TLBO algorithm. J. Braz. Soc. Mech. Sci. Eng. 2020, 42, 128. [Google Scholar] [CrossRef]
- Farooq, M.U.; Ali, M.A.; He, Y.; Khan, A.M.; Pruncu, C.I.; Kashif, M.; Ahmed, N.; Asif, N. Curved profiles machining of Ti6Al4V alloy through WEDM: Investigations on geometrical errors. J. Mater. Res. Technol. 2020, 9, 16186–16201. [Google Scholar] [CrossRef]
- Vora, J.; Prajapati, N.; Patel, S.; Sheth, S.; Patel, A.; Khanna, S.; Ayesta, I.; de Lacalle, L.L.; Chaudhari, R. Multi-response optimization and effect of alumina mixed with dielectric fluid on WEDM process of Ti6Al4V. In Recent Advances in Mechanical Infrastructure: Proceedings of the ICRAM 2021; Springer: Singapore, 2022; pp. 277–287. [Google Scholar]
- Lin, M.; Tsao, C.; Huang, H.; Wu, C.; Hsu, C. Use of the grey-Taguchi method to optimise the micro-electrical discharge machining (micro-EDM) of Ti-6Al-4V alloy. Int. J. Comput. Integr. Manuf. 2015, 28, 569–576. [Google Scholar] [CrossRef]
- Priyadarshini, M.; Pal, K. Multi-objective optimisation of EDM process using hybrid Taguchi-based methodologies for Ti-6Al-4V alloy. Int. J. Manuf. Res. 2016, 11, 144–166. [Google Scholar] [CrossRef]
- Gupta, N.K.; Pandey, P.; Mehta, S.; Swati, S.; Mishra, S.K.; Tom, K.J. Characterization of ABS Material in Hybrid Composites: A Review. In Advances in Engineering Design; Lecture Notes in Mechanical Engineering; Prasad, A., Gupta, S., Tyagi, R., Eds.; Springer: Singapore, 2019. [Google Scholar]
- Mouralova, K.; Kovar, J.; Karpisek, Z.; Kousa, P. Optimization Machining of Titanium Alloy Ti-6Al-4V by WEDM with Emphasis on the Quality of the Machined Surface. J. Manuf. Technol. 2016, 16, 1326–1331. [Google Scholar] [CrossRef]
- Pramanik, A.; Basak, A.K. Effect of wire electric discharge machining (EDM) parameters on fatigue life of Ti-6Al-4V alloy. Int. J. Fatigue 2019, 128, 105186. [Google Scholar] [CrossRef]
- Bisaria, H.; Shandilya, P. Experimental studies on electrical discharge wire cutting of Ni-rich NiTi shape memory alloy. Mater. Manuf. Process. 2018, 33, 977–985. [Google Scholar] [CrossRef]
- Sheth, M.; Gajjar, K.; Jain, A.; Shah, V.; Patel, H.; Chaudhari, R.; Vora, J. Multi-objective optimization of inconel 718 using Combined approach of taguchi—Grey relational analysis. In Advances in Mechanical Engineering; Springer: Singapore, 2021; pp. 229–235. [Google Scholar]
- Rathi, P.; Ghiya, R.; Shah, H.; Srivastava, P.; Patel, S.; Chaudhari, R.; Vora, J. Multi-Response Optimization of Ni55.8Ti Shape Memory Alloy Using Taguchi–Grey Relational Analysis Approach. In Recent Advances in Mechanical Infrastructure; Springer: Singapore, 2020; pp. 13–23. [Google Scholar]
- Patel, S.; Fuse, K.; Gangvekar, K.; Badheka, V. Multi-response optimization of dissimilar Al-Ti alloy FSW using Taguchi-Grey relational analysis. In Key Engineering Materials; Trans Tech Publications Ltd.: Bäch, Switzerland, 2020. [Google Scholar]
- Chaudhari, R.; Vora, J.J.; Prabu, S.M.; Palani, I.; Patel, V.K.; Parikh, D. Pareto optimization of WEDM process parameters for machining a NiTi shape memory alloy using a combined approach of RSM and heat transfer search algorithm. Adv. Manuf. 2019, 9, 64. [Google Scholar] [CrossRef]
- Vora, J.; Patel, V.K.; Srinivasan, S.; Chaudhari, R.; Pimenov, D.Y.; Giasin, K.; Sharma, S. Optimization of Activated Tungsten Inert Gas Welding Process Parameters Using Heat Transfer Search Algorithm: With Experimental Validation Using Case Studies. Metals 2021, 11, 981. [Google Scholar] [CrossRef]
- Chaudhari, R.; Khanna, S.; Vora, J.; Patel, V.K.; Paneliya, S.; Pimenov, D.Y.; Wojciechowski, S. Experimental investigations and optimization of MWCNTs-mixed WEDM process parameters of nitinol shape memory alloy. J. Mater. Res. Technol. 2021, 15, 2152–2169. [Google Scholar] [CrossRef]
- Nain, S.S.; Garg, D.; Kumar, S. Investigation for obtaining the optimal solution for improving the performance of WEDM of super alloy Udimet-L605 using particle swarm optimization. Eng. Sci. Technol. Int. J. 2018, 21, 261–273. [Google Scholar] [CrossRef]
- Sharma, N.; Khanna, R.; Gupta, R.D. WEDM process variables investigation for HSLA by response surface methodology and genetic algorithm. Eng. Sci. Technol. Int. J. 2015, 18, 171–177. [Google Scholar] [CrossRef]
- Phate, M.R.; Toney, S.B. Modeling and prediction of WEDM performance parameters for Al/SiCp MMC using dimensional analysis and artificial neural network. Eng. Sci. Technol. Int. J. 2019, 22, 468–476. [Google Scholar] [CrossRef]
- Deb, K.; Member, A.; Pratap, A.; Agarwal, S.; Meyarivan, T. A Fast and Elitist Multiobjective Genetic Algorithm: NSGA-II. IEEE Trans. Evol. Comput. 2002, 6, 182–197. [Google Scholar] [CrossRef]
- Khullar, V.R.; Sharma, N.; Kishore, S.; Sharma, R. RSM- and NSGA-II-Based Multiple Performance Characteristics Optimization of EDM Parameters for AISI 5160. Arab. J. Sci. Eng. 2017, 42, 1917–1928. [Google Scholar] [CrossRef]
- Kumar, K.; Agarwal, S. Multi-objective parametric optimization on machining with wire electric discharge machining. Int. J. Adv. Manuf. Technol. 2012, 62, 617–633. [Google Scholar] [CrossRef]
- Krishnan, S.A.; Samuel, G.L. Multi-objective optimization of material removal rate and surface roughness in wire electrical discharge turning. Int. J. Adv. Manuf. Technol. 2012, 67, 2021–2032. [Google Scholar] [CrossRef]
- Golshan, A.; Gohari, S.; Ayob, A. Modeling and optimization of cylindrical wire electro discharge machining of AISI D3 tool steel using non-dominated sorting genetic algorithm. In Proceedings of the 2011 International Conference on Graphic and Image Processing, Cairo, Egypt, 1–2 October 2011. [Google Scholar]
- Bezerra, M.A.; Santelli, R.E.; Oliveira, E.P.; Villar, L.S.; Escaleira, L.A. Response surface methodology (RSM) as a tool for optimization in analytical chemistry. Talanta 2008, 76, 965–977. [Google Scholar] [CrossRef] [PubMed]
- Maruyama, S.A.; Palombini, S.V.; Claus, T.; Carbonera, F.; Montanher, P.F.; de Souza, N.E.; Visentainer, J.V.; Gomes, S.T.M.; Matsushita, M. Application of Box-Behnken design to the study of fatty acids and antioxidant activity from enriched white bread. J. Braz. Chem. Soc. 2013, 24, 1520–1529. [Google Scholar] [CrossRef]
- Ahmad, A.; Alkharfy, K.M.; Wani, T.A.; Raish, M. Application of Box-Behnken design for ultrasonic-assisted extraction of polysaccharides from Paeonia emodi. Int. J. Biol. Macromol. 2015, 72, 990–997. [Google Scholar] [CrossRef]
- Zhang, G.; Li, W.; Zhang, Y.; Huang, Y.; Zhang, Z.; Chen, Z. Analysis and reduction of process energy consumption and thermal deformation in a micro-structure wire electrode electric discharge machining thin-wall component. Journal of Cleaner Production 2020, 244, 18763. [Google Scholar] [CrossRef]
- Chen, Z.; Zhou, H.; Wu, C.; Zhang, G.; Yan, H. A New Wire Electrode for Improving the Machining Characteristics of High-Volume Fraction SiCp/Al Composite in WEDM. Materials 2022, 15, 4098. [Google Scholar] [CrossRef]
- Chen, F.; Peng, J.; Lei, D.; Liu, J.; Zhao, G. Optimization of genistein solubilization by κ-carrageenan hydrogel using response surface methodology. Food Sci. Hum. Well 2013, 2, 124–131. [Google Scholar] [CrossRef]
- Morelli, L.L.; Prado, M.A. Extraction optimization for antioxidant phenolic compounds in red grape jam using ultrasound with a response surface methodology. Ultrason. Sonochem. 2012, 19, 1144–1149. [Google Scholar] [CrossRef]
Figure 1.
WEDM cutting concept.
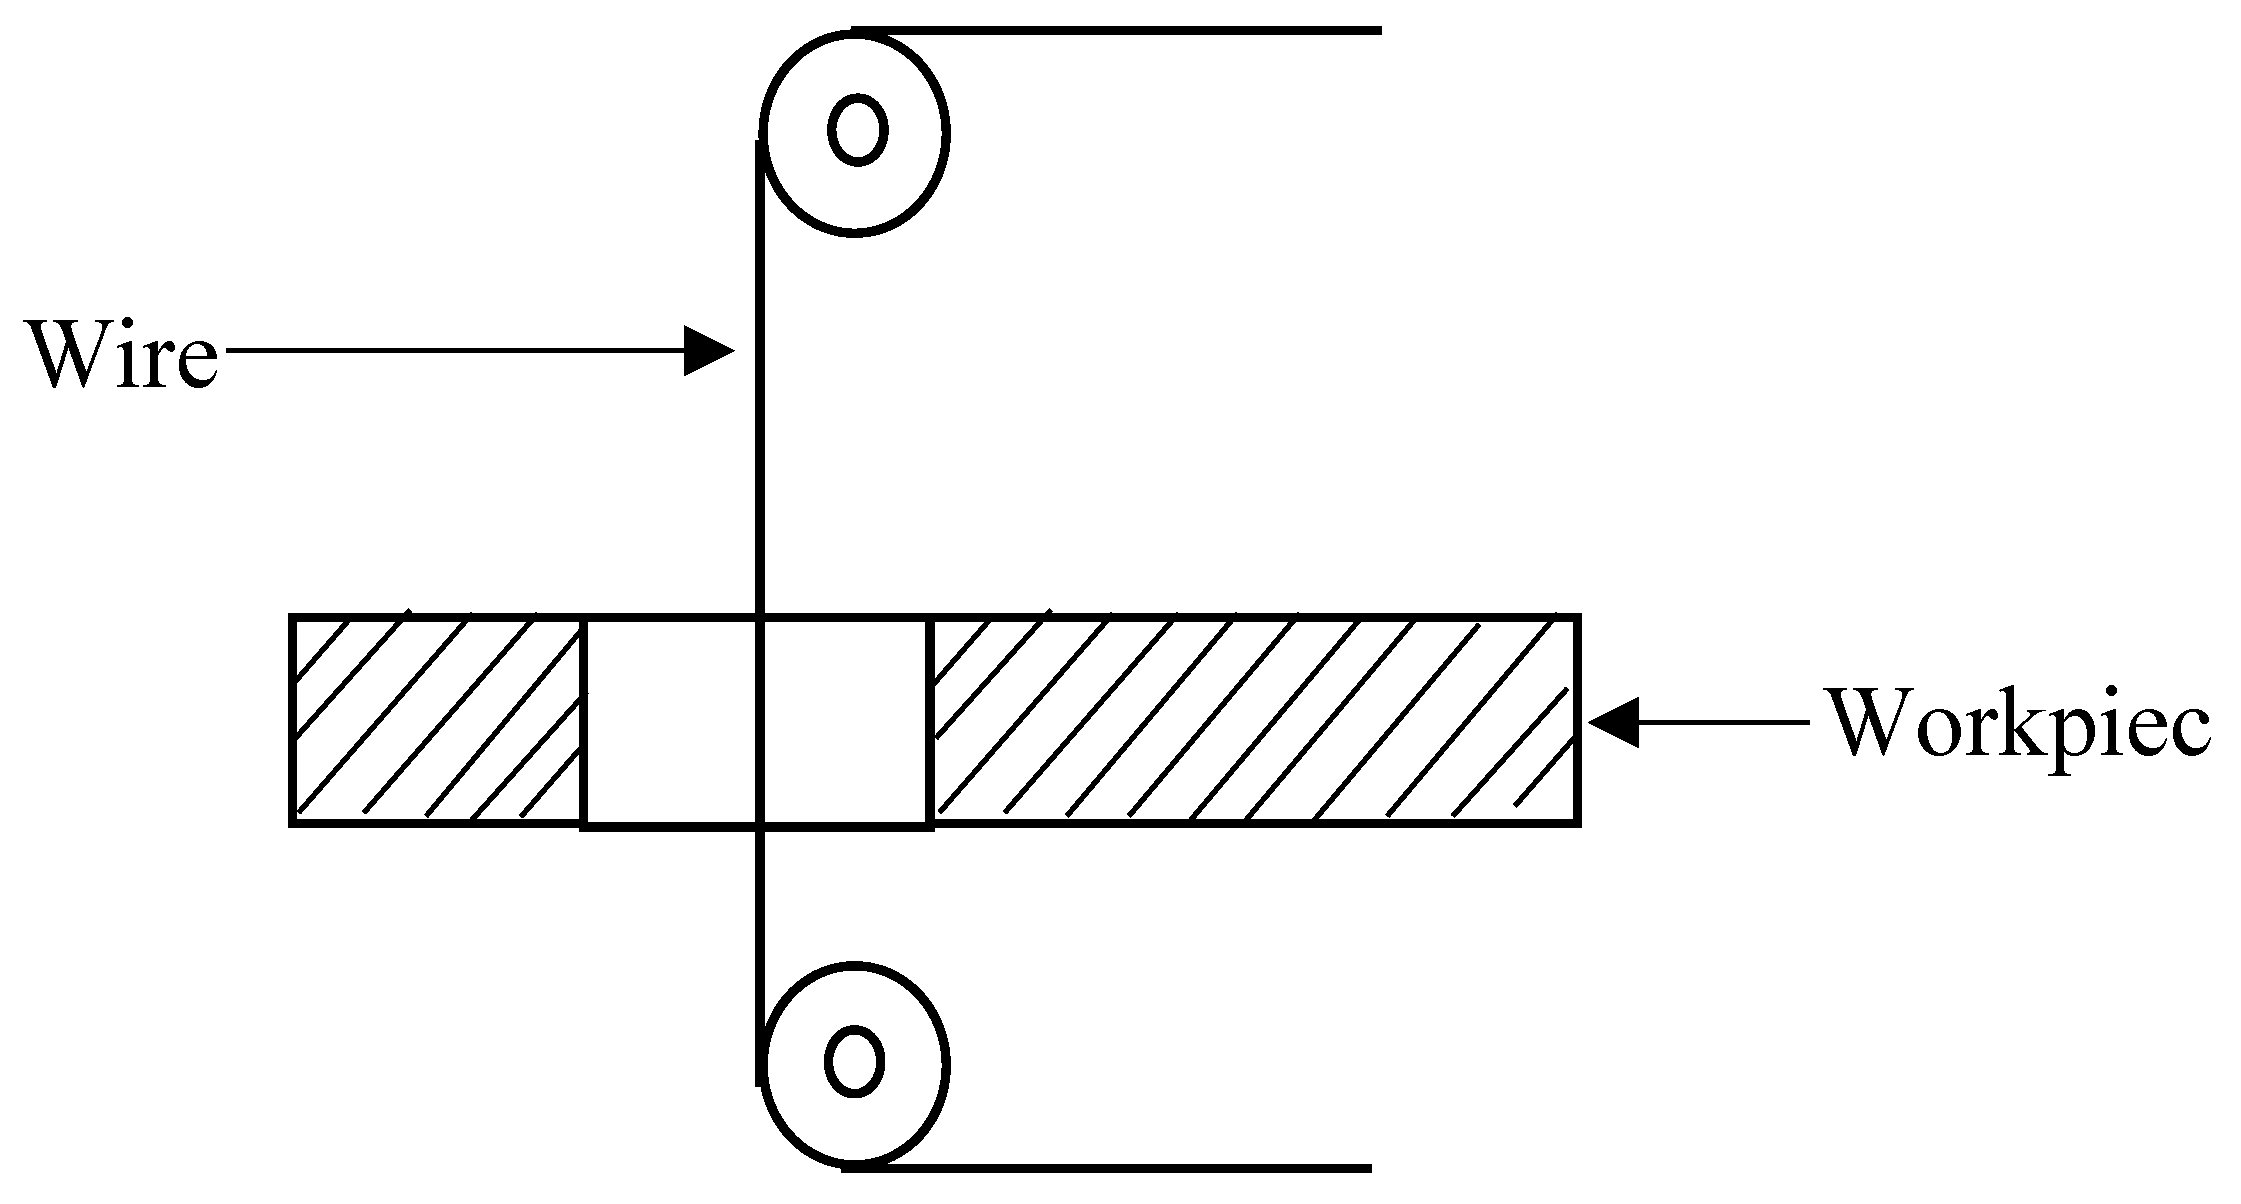
Figure 2.
DK7732 wire-cut electro-discharge machine.
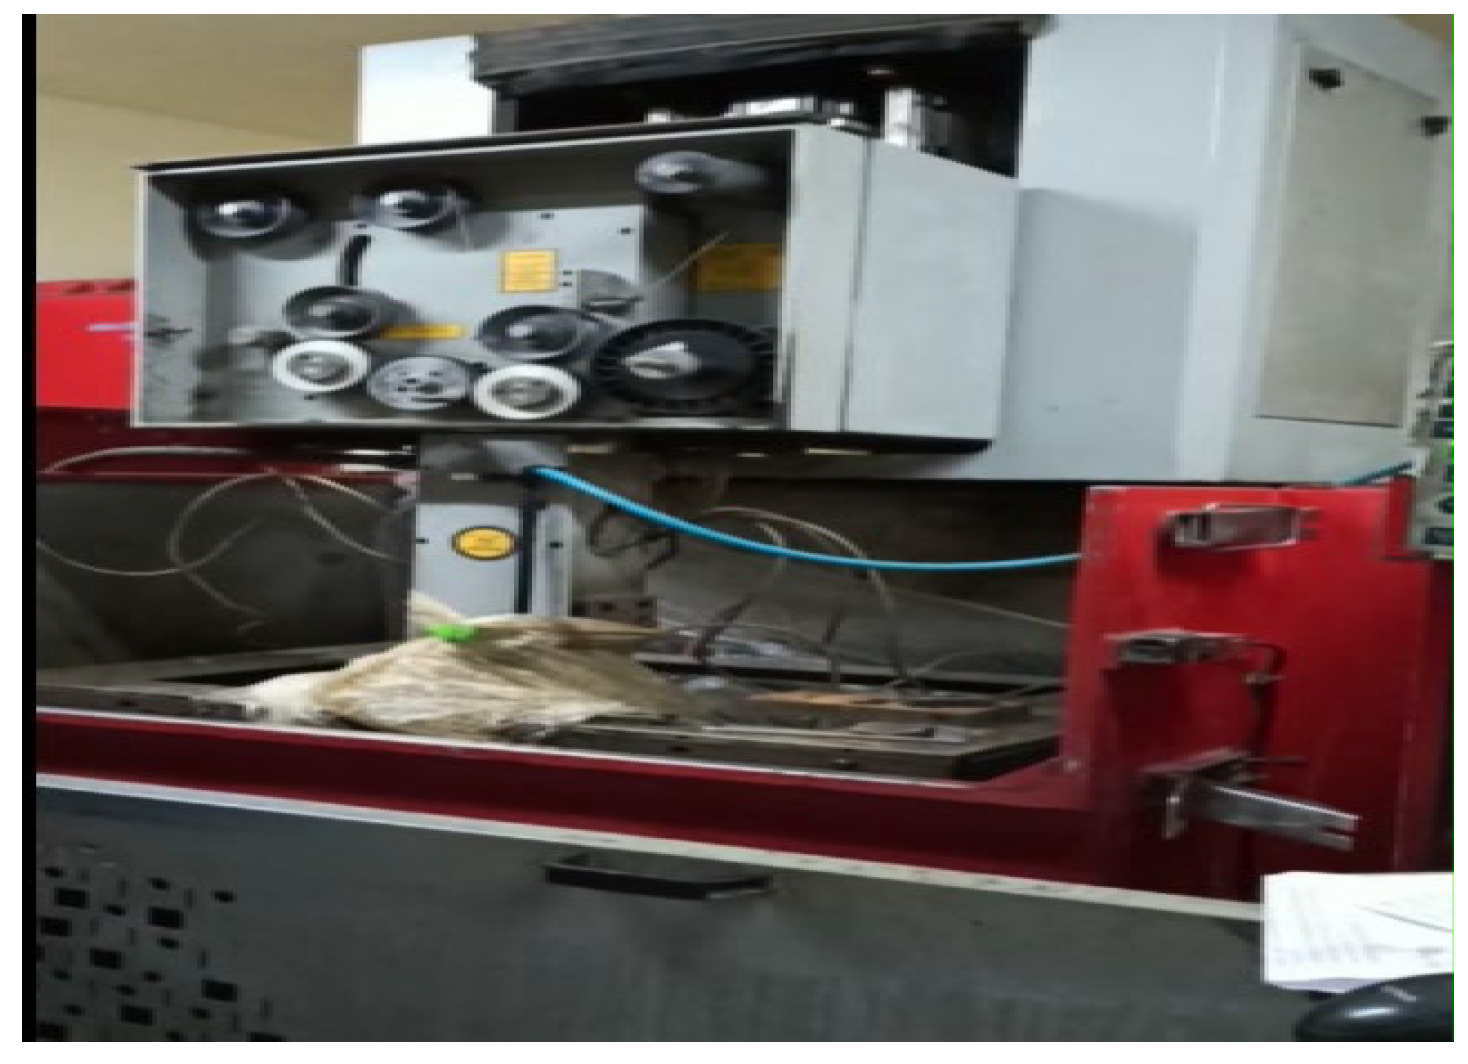
Figure 3.
Profile.
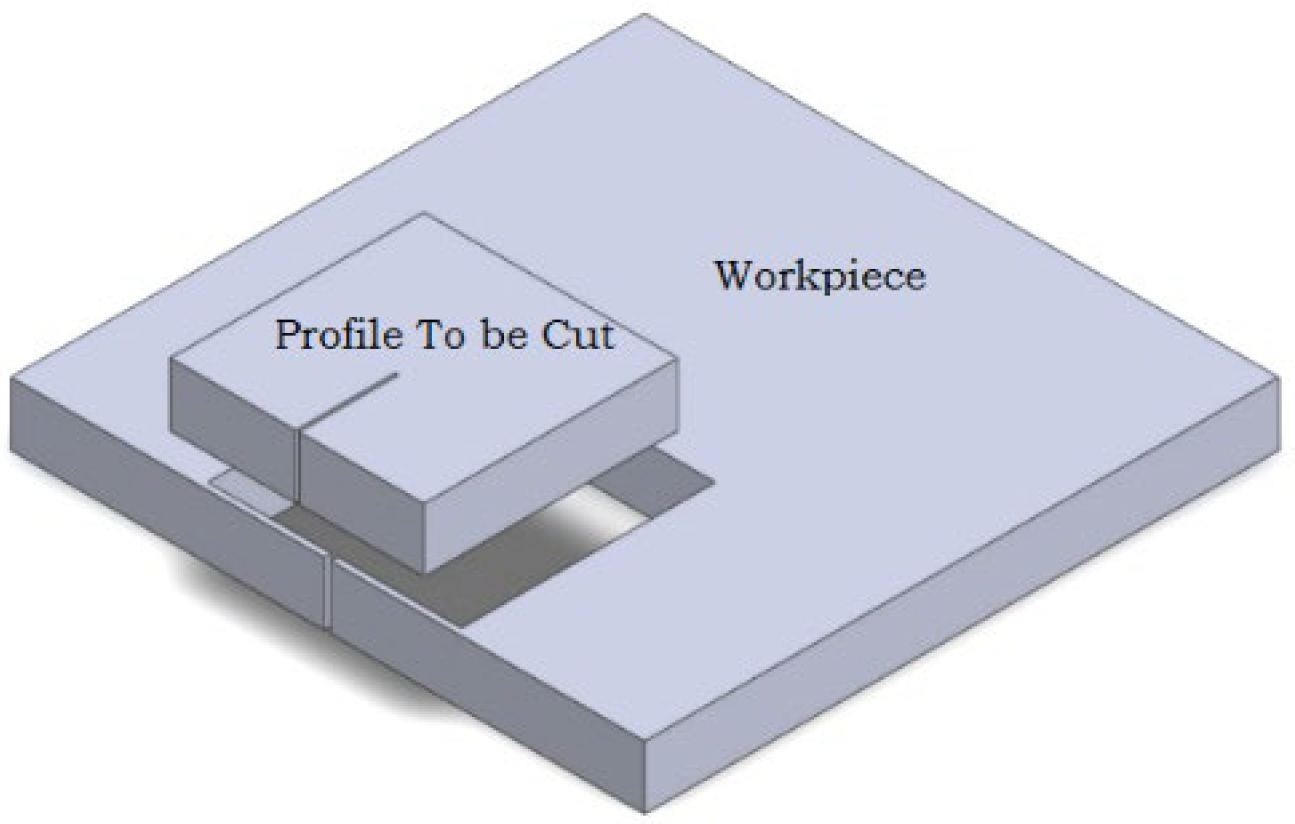
Figure 4.
Diagnostic graphs for the Box-Behnken model for MRR (A) Normal plot of residuals; (B) Residuals (versus) Predicted; (C) Residuals (versus) Run; (D) Predicted (versus) Actual; (E) Box-Cox plot–power transformations; (F) Perturbation.
Figure 4.
Diagnostic graphs for the Box-Behnken model for MRR (A) Normal plot of residuals; (B) Residuals (versus) Predicted; (C) Residuals (versus) Run; (D) Predicted (versus) Actual; (E) Box-Cox plot–power transformations; (F) Perturbation.
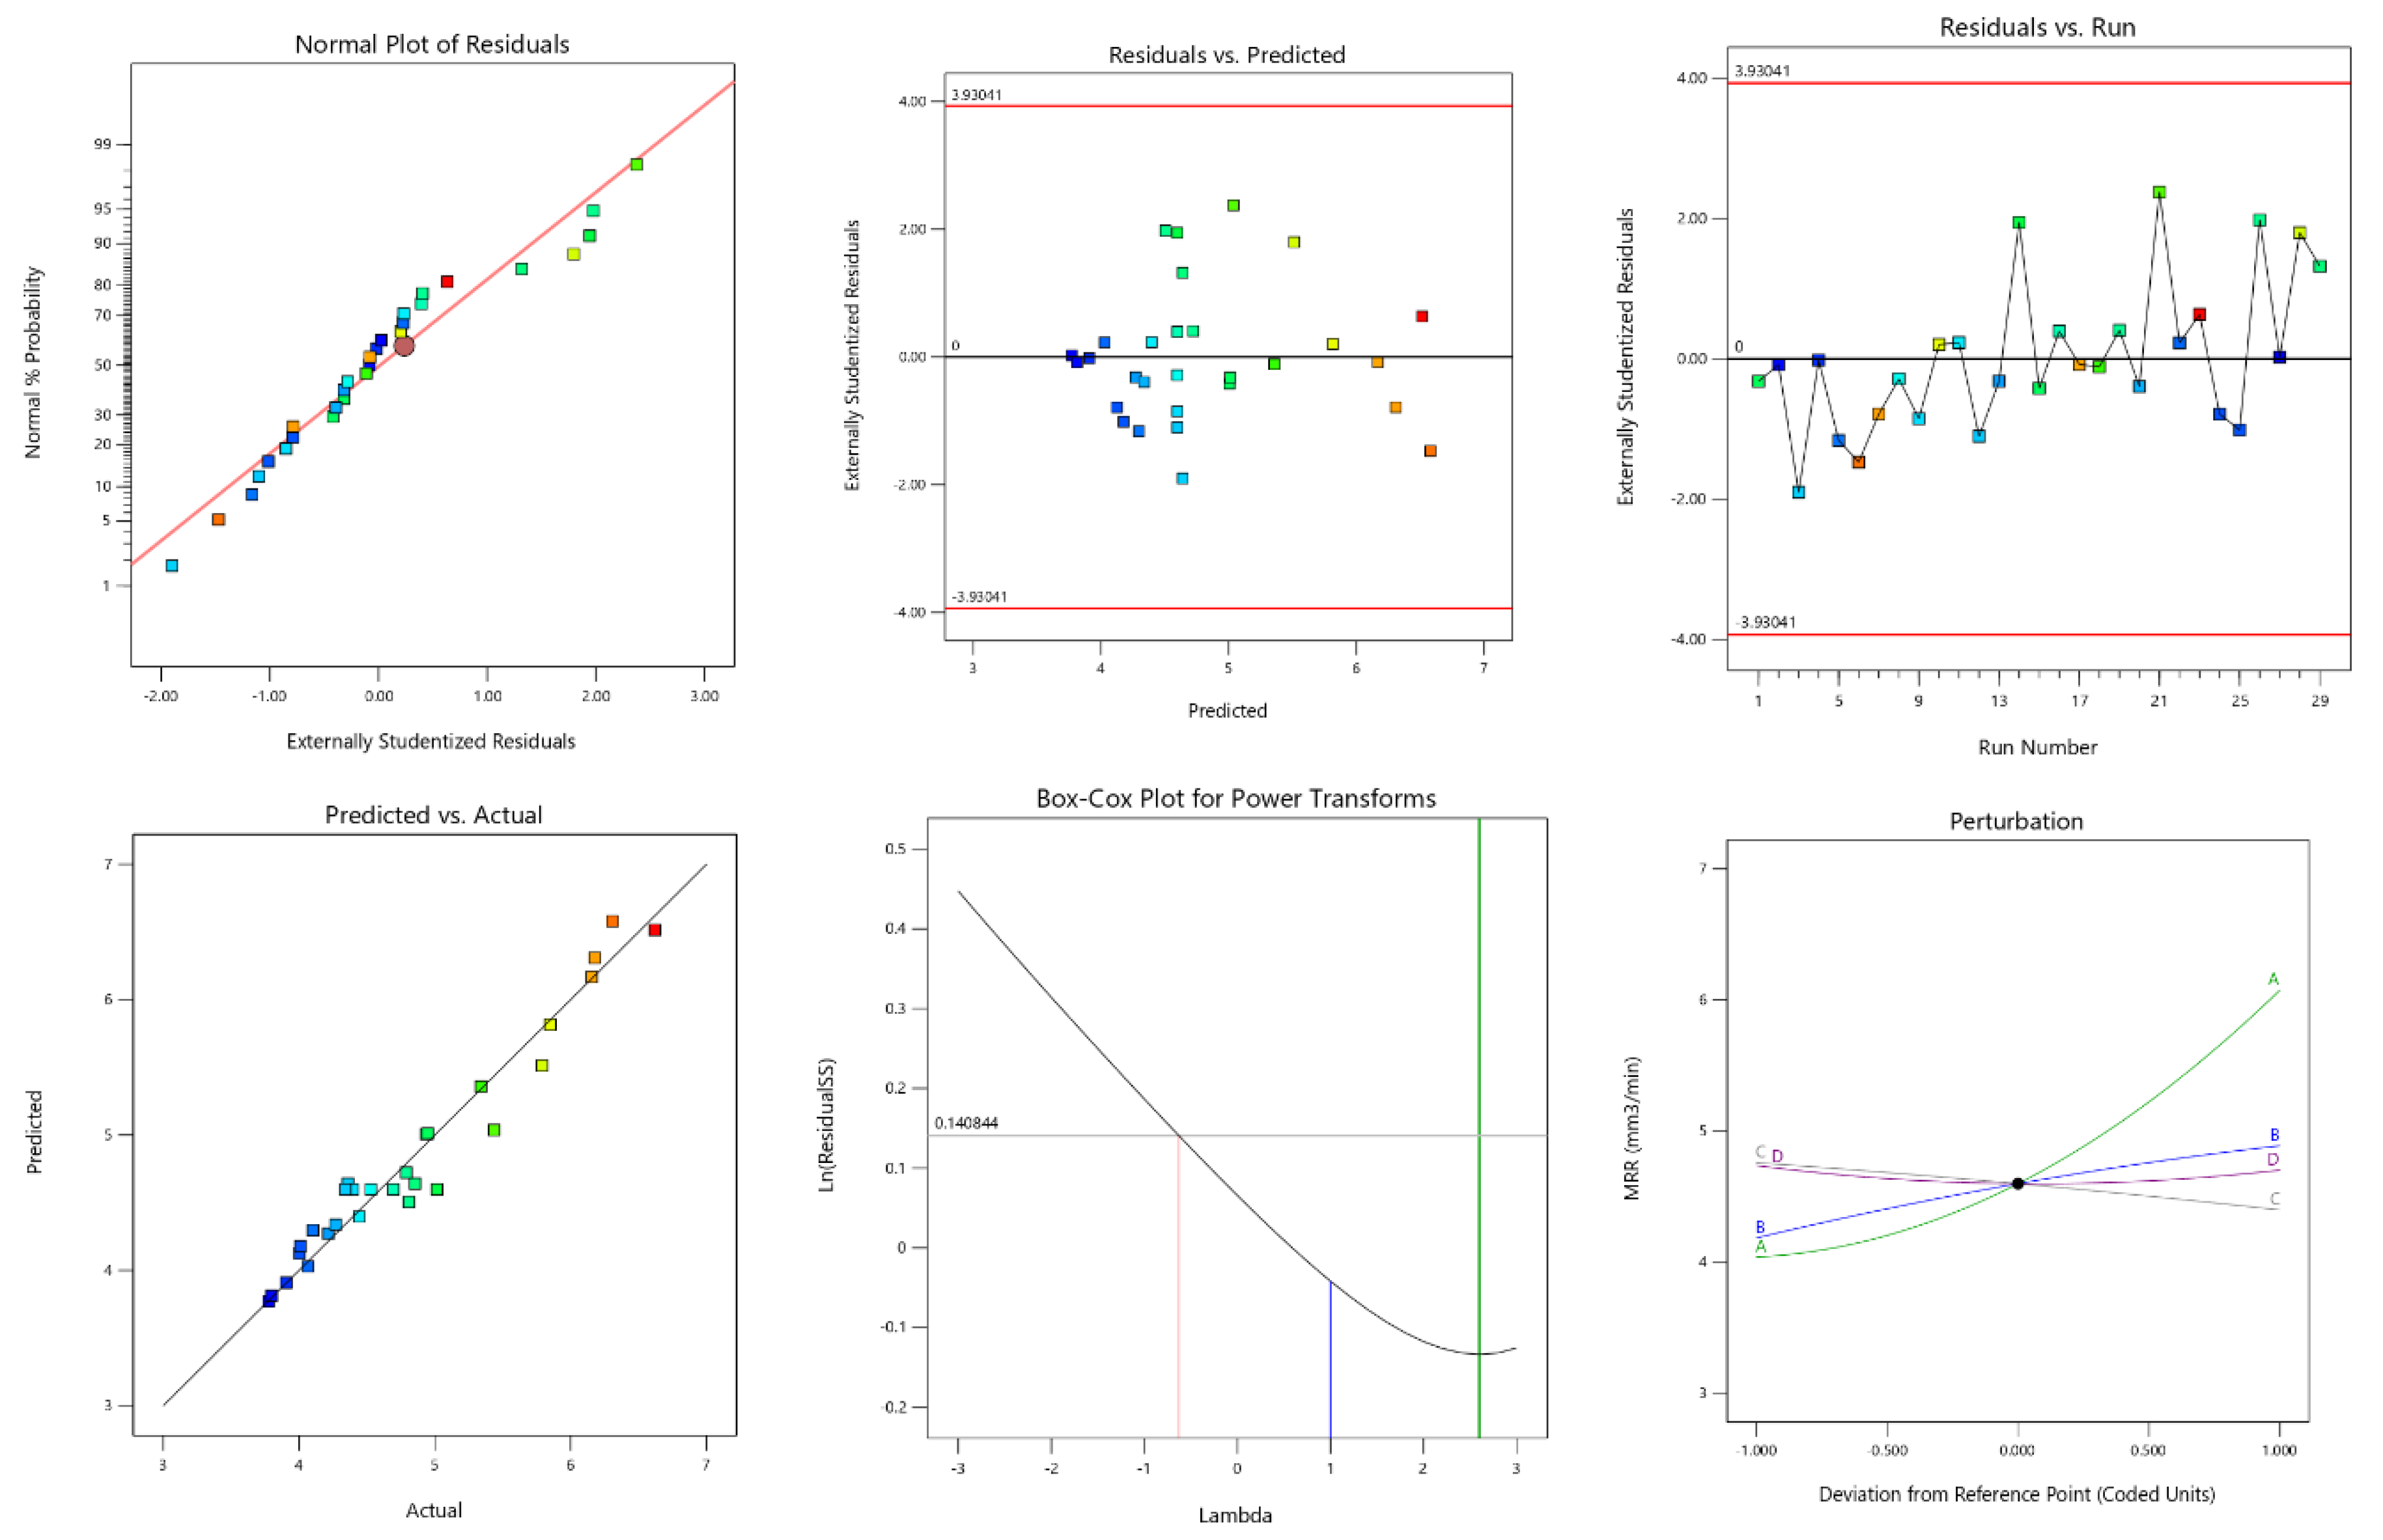
Figure 5.
Diagnostic graphs for the Box-Behnken model for SR (A) Normal plot of residuals; (B) Residuals (versus) Predicted; (C) Residuals (versus) Run; (D) Predicted (versus) Actual; (E) Box-Cox plot–power transformations; (F) Perturbation.
Figure 5.
Diagnostic graphs for the Box-Behnken model for SR (A) Normal plot of residuals; (B) Residuals (versus) Predicted; (C) Residuals (versus) Run; (D) Predicted (versus) Actual; (E) Box-Cox plot–power transformations; (F) Perturbation.
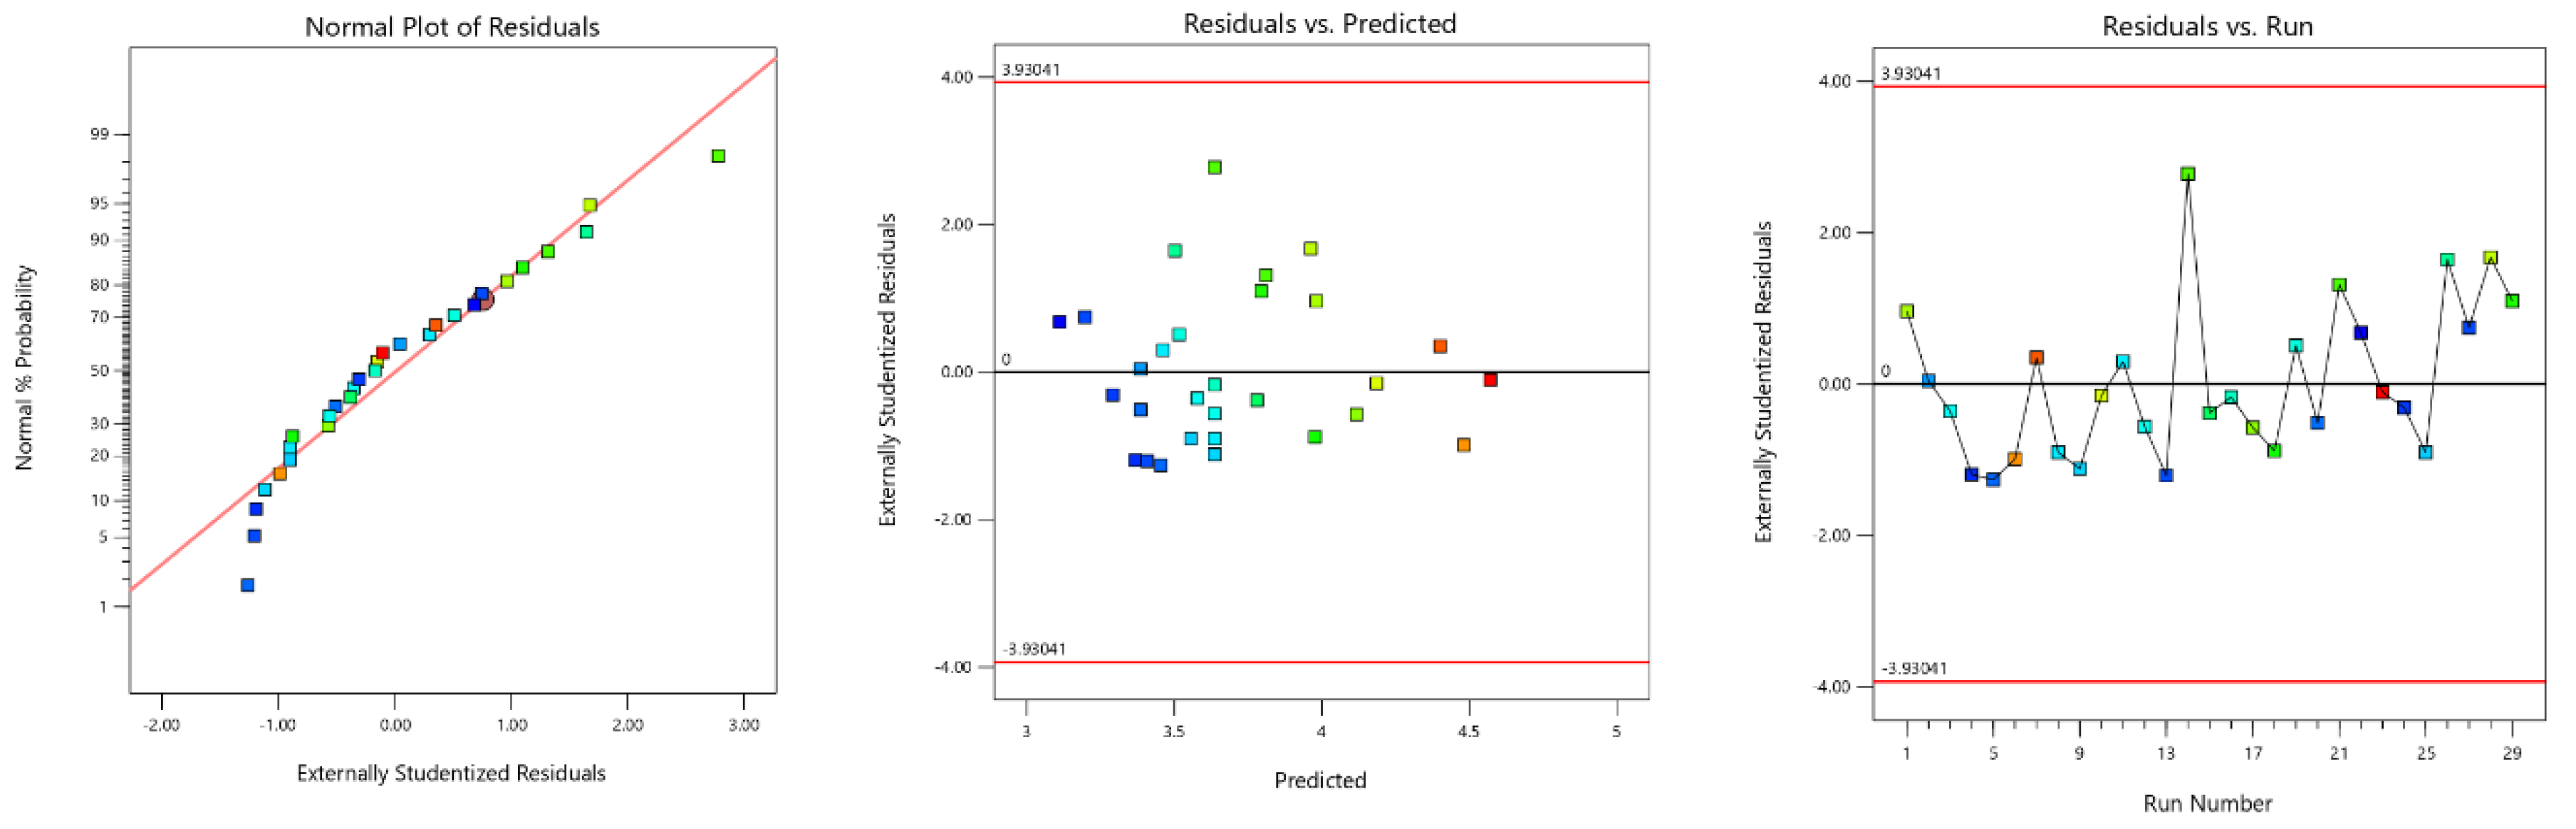
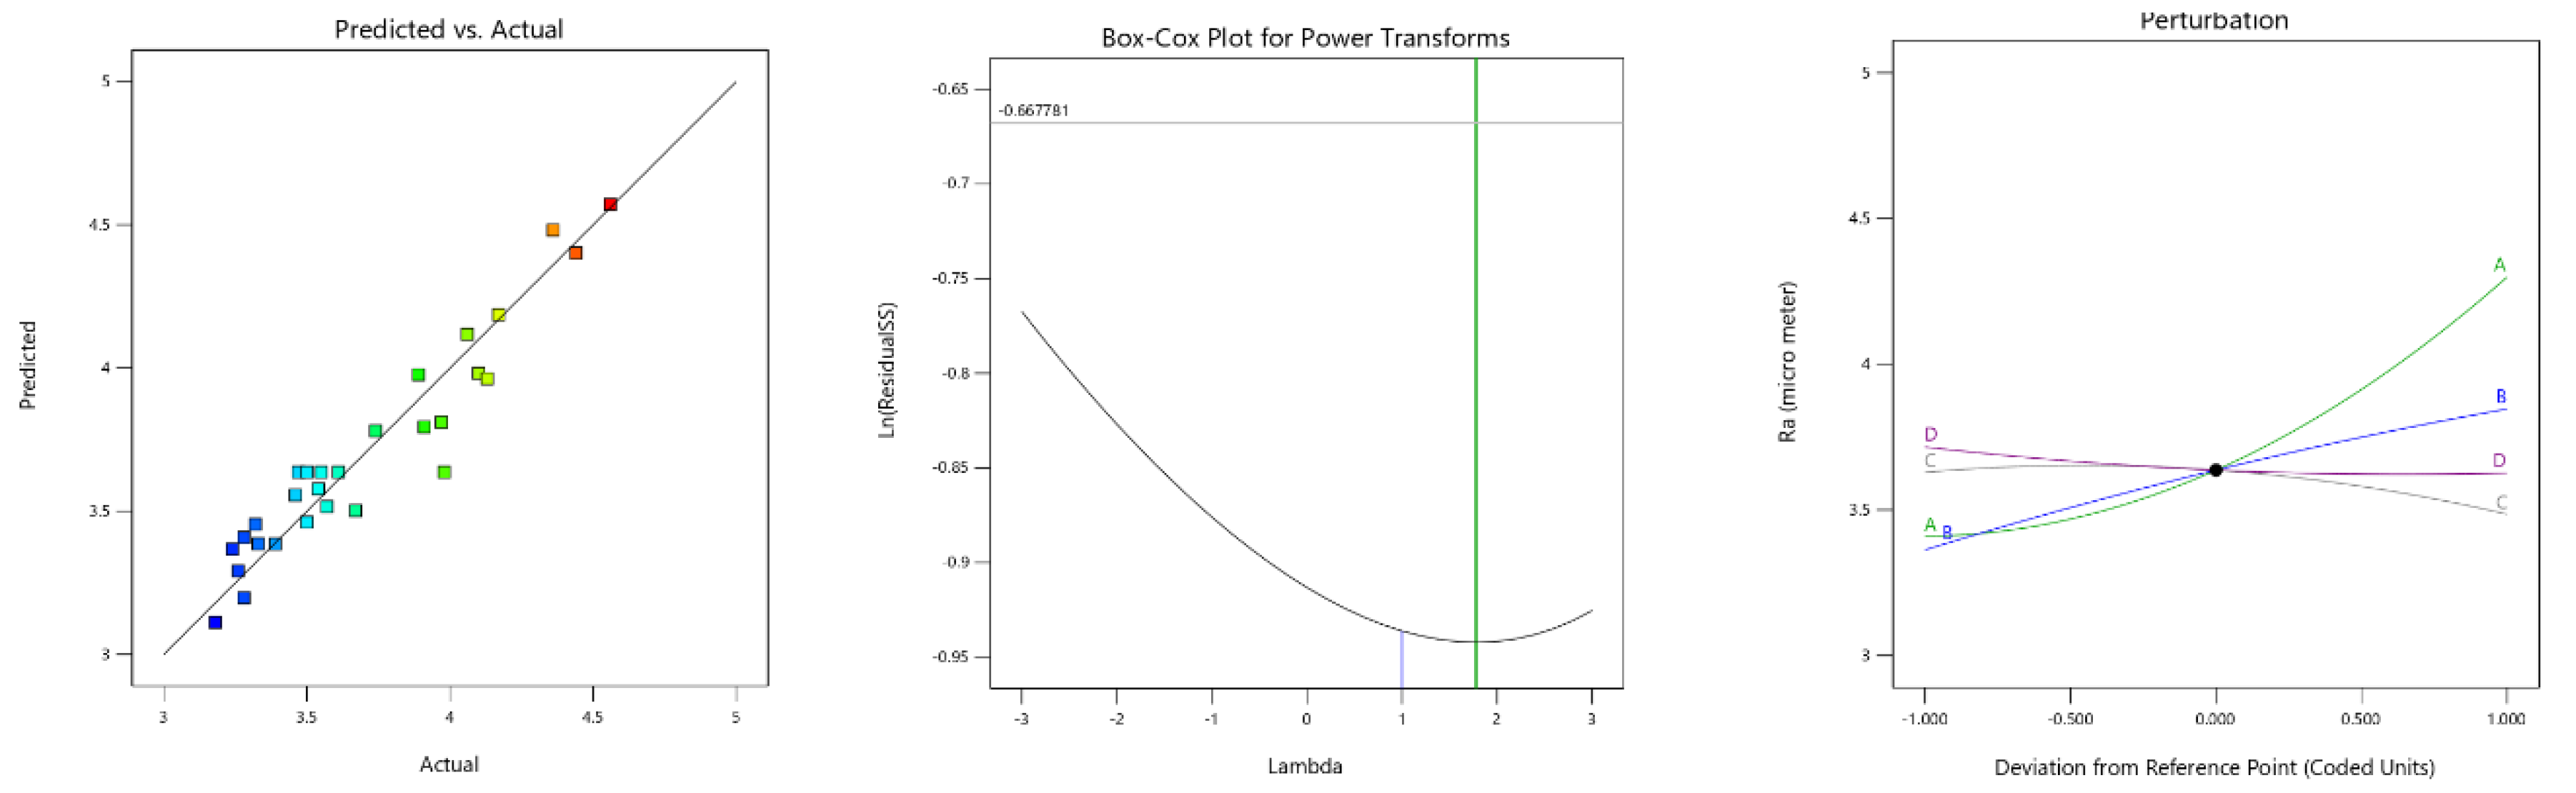
Figure 6.
3D Response surface plot for MRR vs (A) Ton and Toff; (B) servo voltage and Ton; (C) peak current and Ton; (D) servo voltage and Toff; (E) peak current and Toff; (F) peak current and servo voltage.
Figure 6.
3D Response surface plot for MRR vs (A) Ton and Toff; (B) servo voltage and Ton; (C) peak current and Ton; (D) servo voltage and Toff; (E) peak current and Toff; (F) peak current and servo voltage.
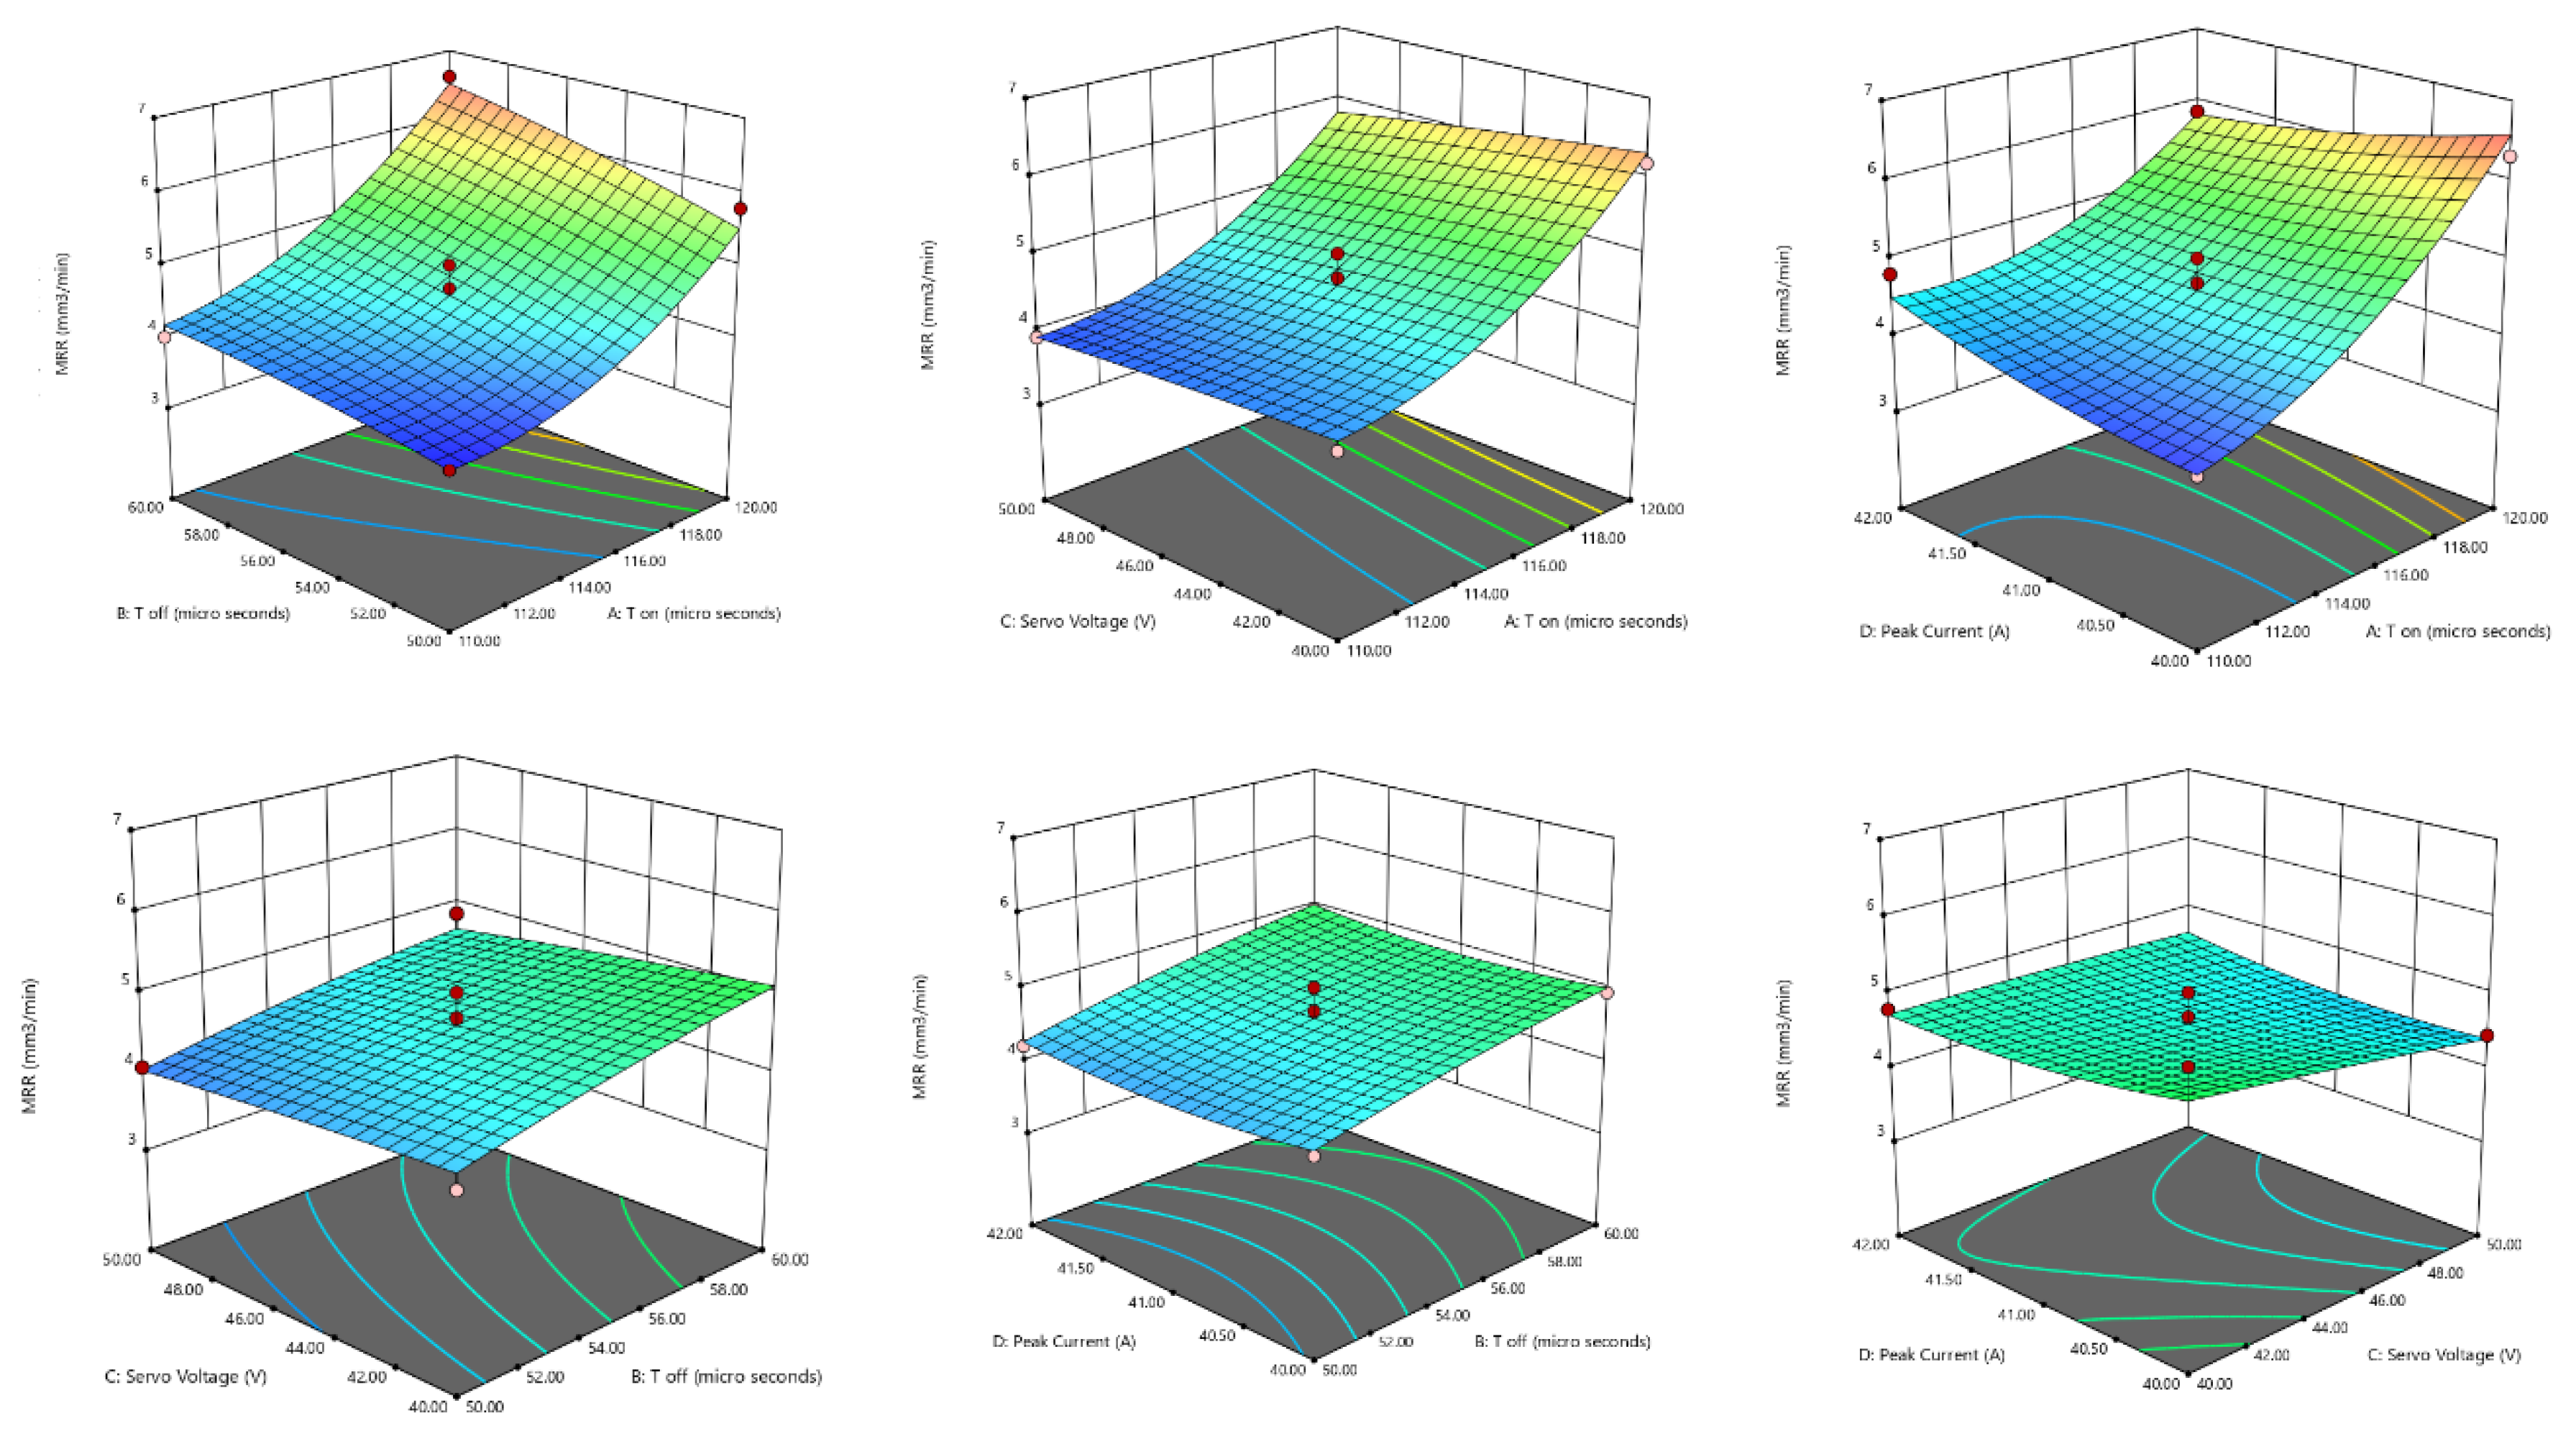
Figure 7.
3D Response surface plot for SR vs (A) Ton and Toff; (B) servo voltage and Ton; (C) peak current and Ton; (D) servo voltage and Toff; (E) peak current and Toff; (F) peak current and servo voltage.
Figure 7.
3D Response surface plot for SR vs (A) Ton and Toff; (B) servo voltage and Ton; (C) peak current and Ton; (D) servo voltage and Toff; (E) peak current and Toff; (F) peak current and servo voltage.
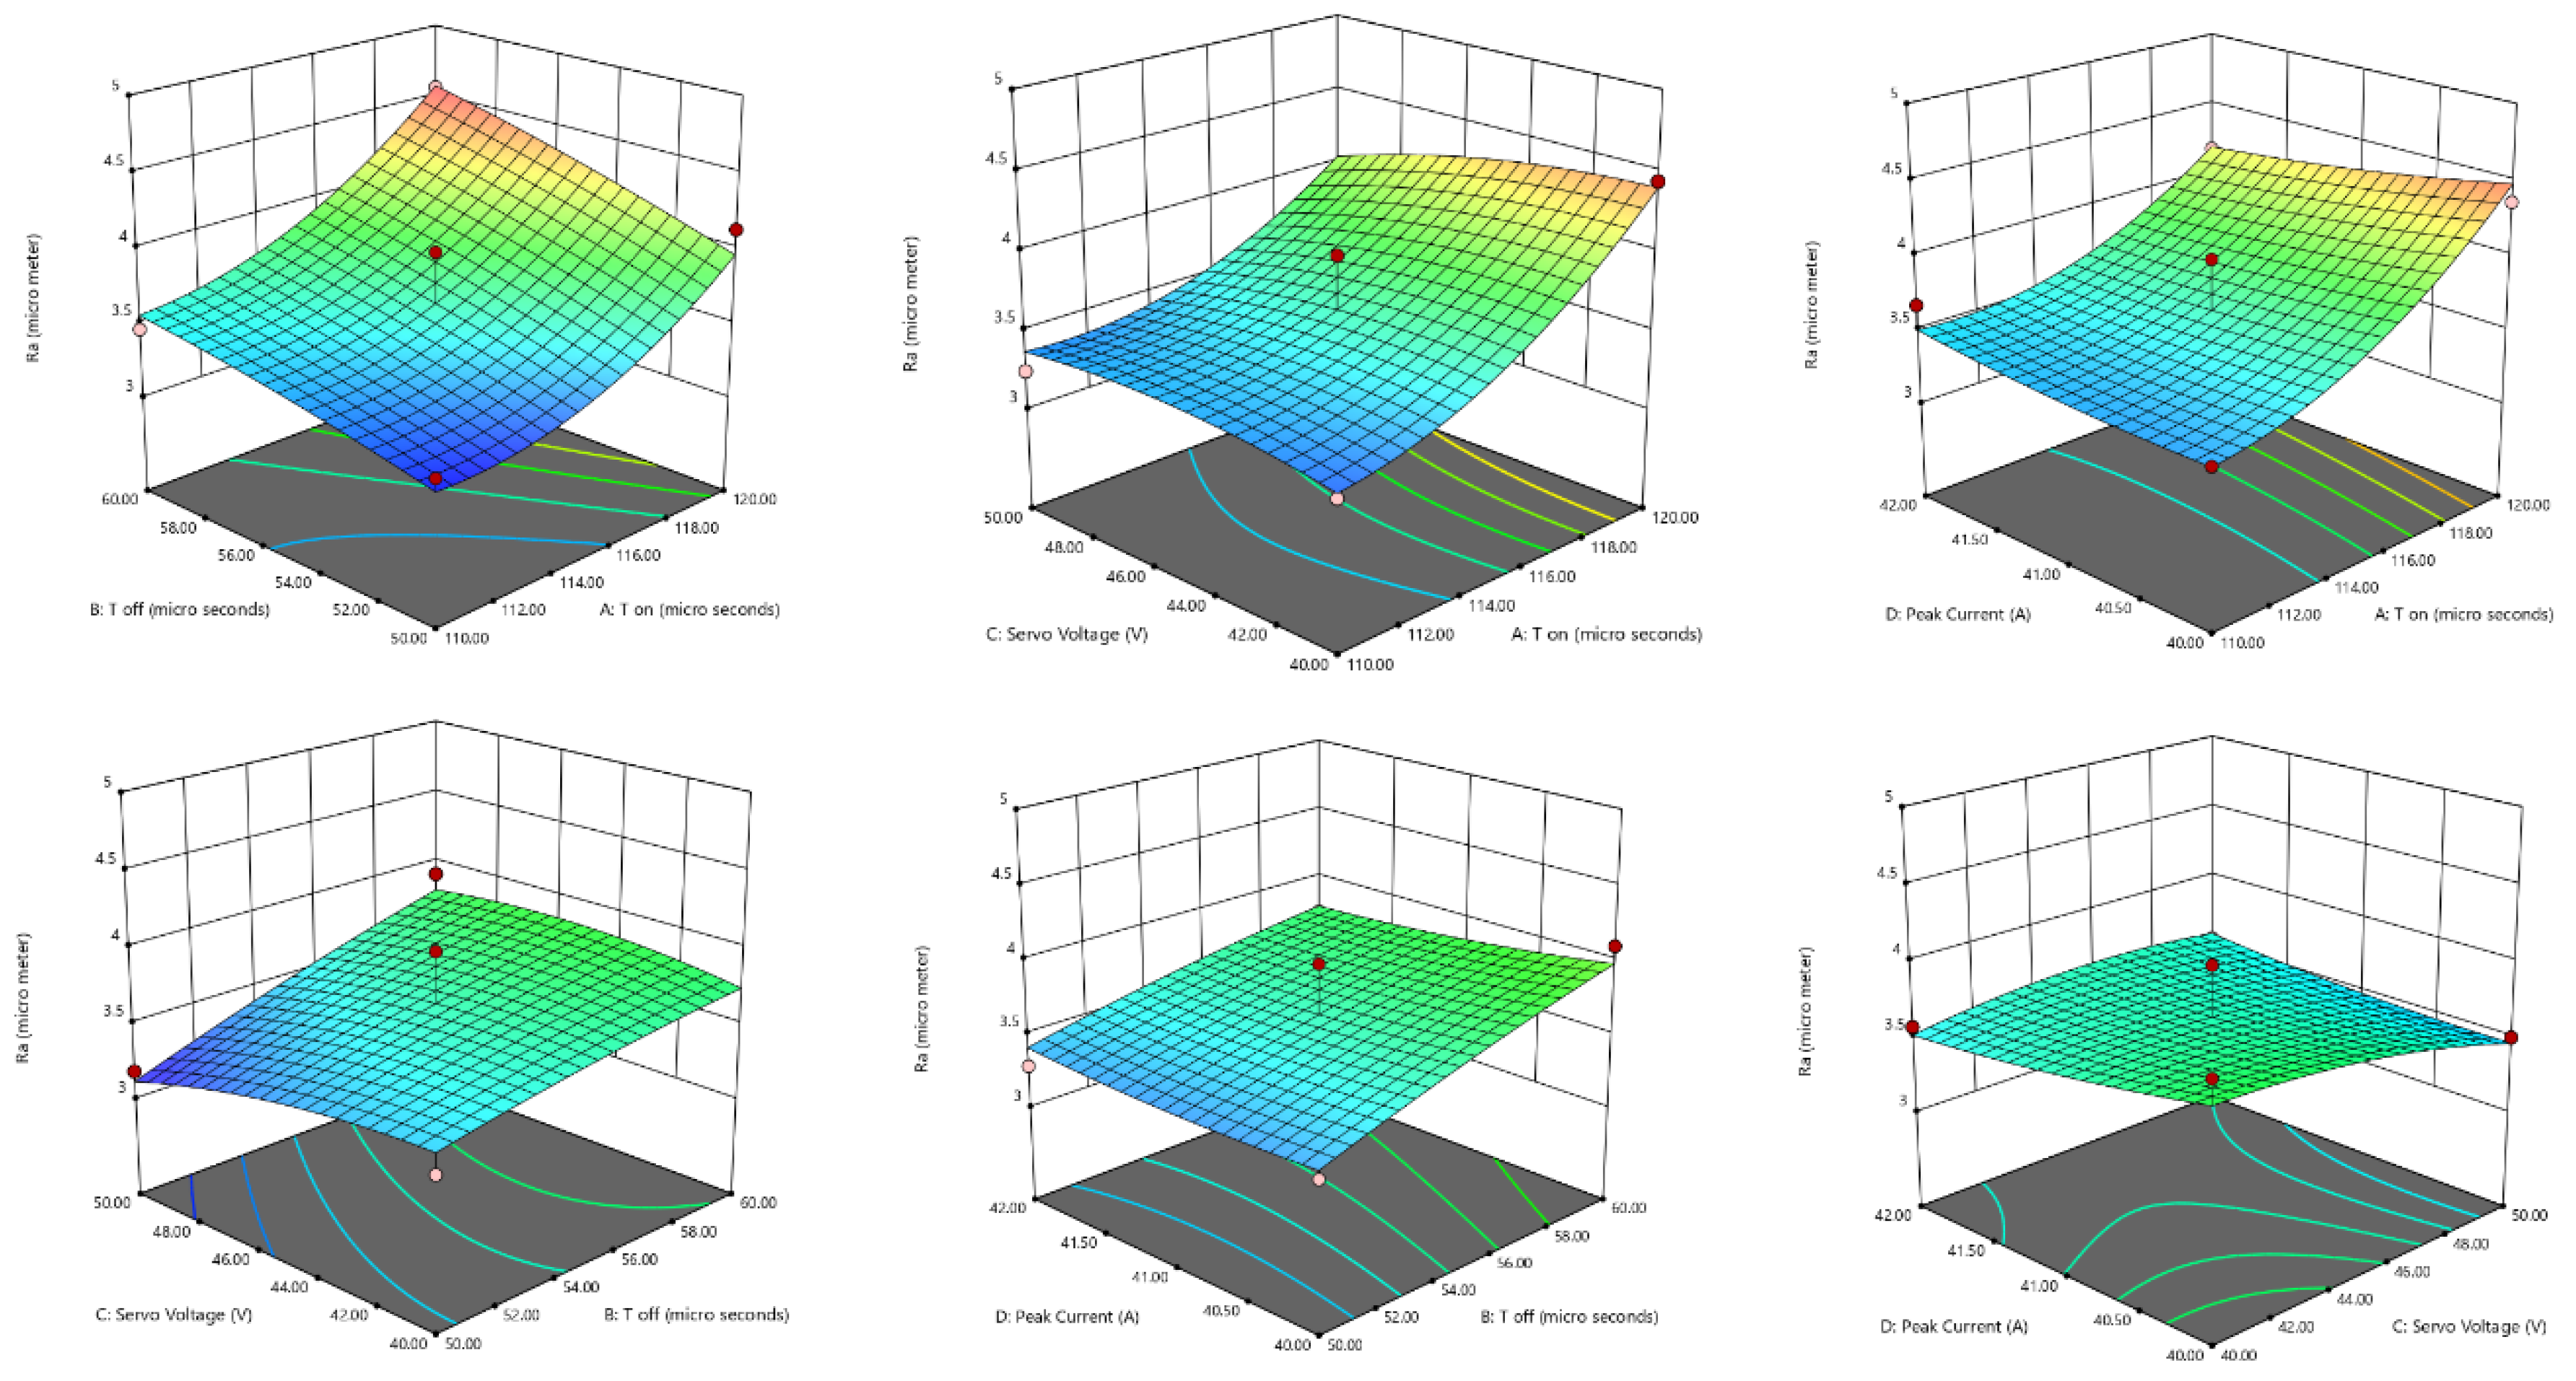
Figure 8.
Pareto optimal front.
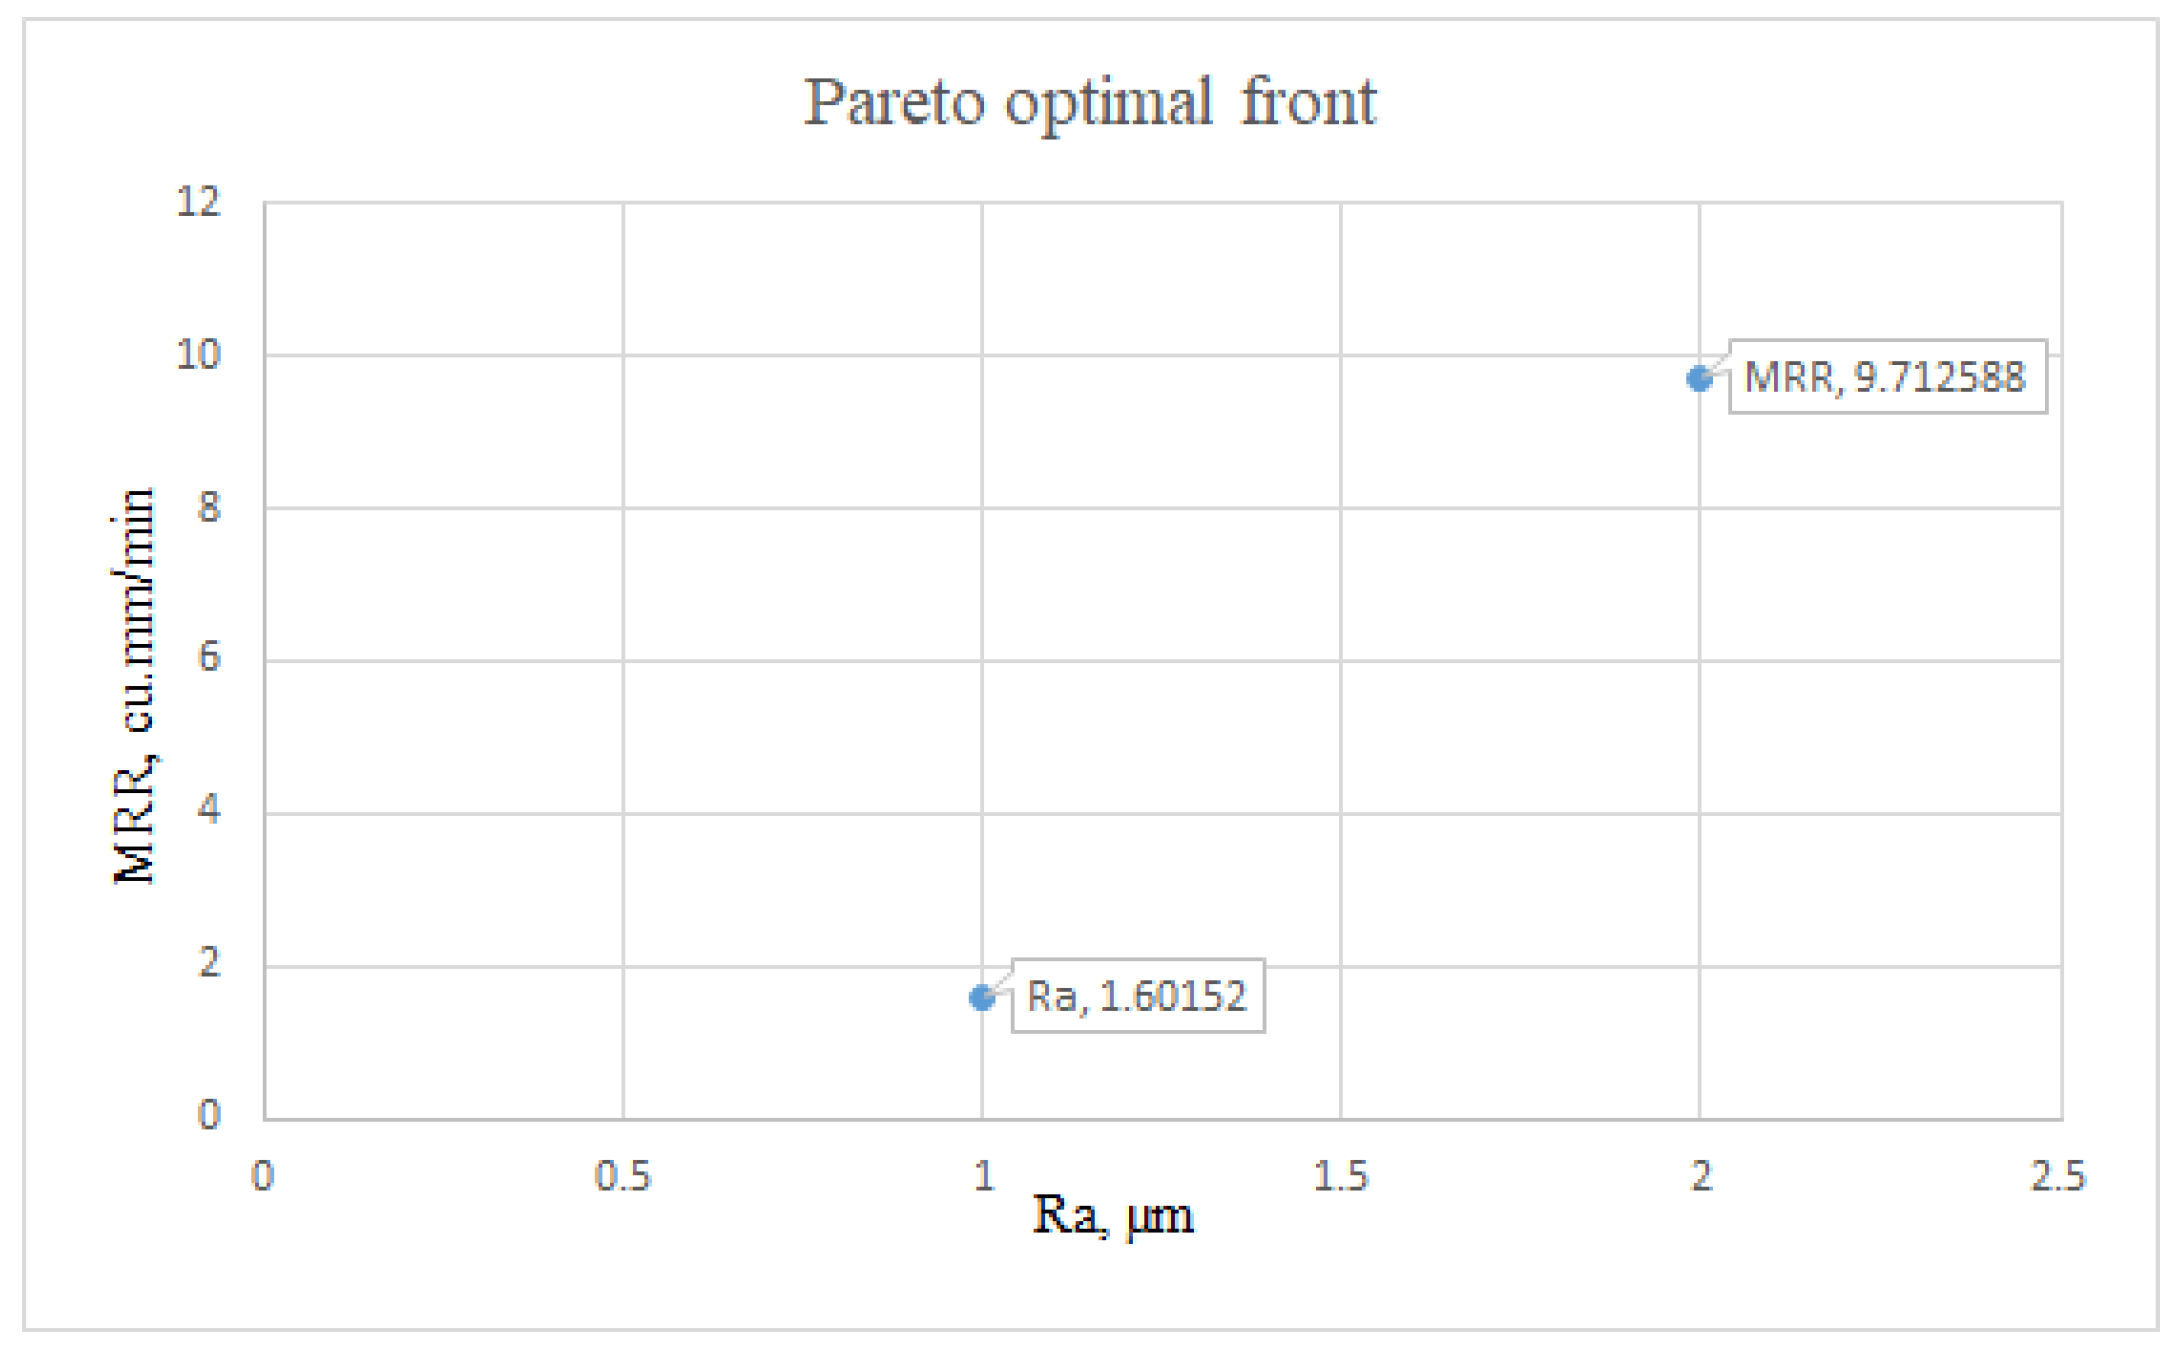

Table 1.
Chemical constituents of Ti6Al4V alloy.
| Element | Ti | Al | V | Fe | O |
|---|---|---|---|---|---|
| Weight (%) | 90 | 6 | 4 | 0.25 | 0.2 |
Table 2.
Control factors and its levels.
| Parameters and their levels | −1 level | +1 level |
|---|---|---|
| Pulse active (Ton) time (µs) | 110 | 120 |
| Pulse inactive (Toff) time (µs) | 50 | 60 |
| Servo Voltage (SV) (v) | 40 | 50 |
| Peak amplitude of current (PC) (A) | 40 | 42 |
Table 3.
Box-Behnken design and response values.
| Expt No. | Input Parameters | Responses | ||||
|---|---|---|---|---|---|---|
| A-Ton µs | B-Toff µs | C-SV (V) | D-PC (A) | MRR mm3/min | Ra µm | |
| 1. | 115 | 60 | 45 | 40 | 5.011 | 2.48 |
| 2. | 110 | 55 | 45 | 40 | 3.849 | 1.92 |
| 3. | 115 | 55 | 50 | 42 | 4.41 | 2.30 |
| 4. | 110 | 55 | 50 | 41 | 3.957 | 1.79 |
| 5. | 115 | 50 | 40 | 41 | 4.103 | 2.09 |
| 6. | 120 | 55 | 45 | 40 | 6.423 | 2.98 |
| 7. | 120 | 55 | 40 | 41 | 6.345 | 2.88 |
| 8. | 115 | 55 | 45 | 41 | 4.51 | 2.29 |
| 9. | 115 | 55 | 45 | 41 | 4.423 | 2.13 |
| 10. | 120 | 55 | 45 | 42 | 5.873 | 2.77 |
| 11. | 115 | 55 | 50 | 40 | 4.484 | 2.00 |
| 12. | 115 | 55 | 45 | 41 | 4.429 | 2.04 |
| 13. | 115 | 50 | 45 | 42 | 4.327 | 1.85 |
| 14. | 115 | 55 | 45 | 41 | 5.173 | 2.34 |
| 15. | 115 | 60 | 45 | 42 | 4.956 | 2.42 |
| 16. | 115 | 55 | 45 | 41 | 4.792 | 2.31 |
| 17. | 120 | 55 | 50 | 40 | 6.145 | 2.88 |
| 18. | 115 | 60 | 40 | 40 | 5.446 | 2.57 |
| 19. | 115 | 55 | 40 | 42 | 4.805 | 2.25 |
| 20. | 115 | 50 | 45 | 40 | 4.36 | 2.11 |
| 21. | 115 | 55 | 40 | 40 | 5.512 | 2.60 |
| 22. | 115 | 50 | 50 | 41 | 4.209 | 1.85 |
| 23. | 120 | 60 | 45 | 41 | 6.639 | 3.23 |
| 24. | 110 | 55 | 40 | 41 | 4.087 | 1.84 |
| 25. | 110 | 60 | 45 | 41 | 4.041 | 1.94 |
| 26. | 110 | 55 | 45 | 42 | 4.808 | 2.38 |
| 27. | 110 | 50 | 45 | 41 | 3.916 | 1.75 |
| 28. | 120 | 50 | 45 | 41 | 5.838 | 2.60 |
| 29. | 115 | 60 | 50 | 41 | 5.006 | 2.35 |
Table 4.
ANOVA results for MRR.
| Source | Sum of Squares | Df | Mean Square | F Value | p-Value |
|---|---|---|---|---|---|
| Model | 17.75 | 14 | 1.27 | 18.5 | < 0.0001 |
| A-T on | 11.88 | 1 | 11.88 | 173.37 | < 0.0001 |
| B-T off | 1.42 | 1 | 1.42 | 20.68 | 0.0005 |
| C-SV | 0.3557 | 1 | 0.3557 | 5.19 | 0.0589 |
| D-PC | 0.004 | 1 | 0.004 | 0.0588 | 0.8119 |
| AB | 0.0888 | 1 | 0.0888 | 1.3 | 0.274 |
| AC | 0.0181 | 1 | 0.0181 | 0.264 | 0.6154 |
| AD | 0.5798 | 1 | 0.5798 | 8.46 | 0.0114 |
| BC | 0.0076 | 1 | 0.0076 | 0.1108 | 0.7441 |
| BD | 0.001 | 1 | 0.001 | 0.0148 | 0.905 |
| CD | 0.0911 | 1 | 0.0911 | 1.33 | 0.2681 |
| A2 | 1.34 | 1 | 1.34 | 19.61 | 0.0006 |
| B2 | 0.0251 | 1 | 0.0251 | 0.3664 | 0.5546 |
| C2 | 0.0026 | 1 | 0.0026 | 0.0379 | 0.8484 |
| D2 | 0.0929 | 1 | 0.0929 | 1.36 | 0.2636 |
| Residual | 0.9591 | 14 | 0.0685 | ||
| Lack of Fit | 0.6636 | 10 | 0.0664 | 0.8983 | 0.5972 |
| Pure Error | 0.2955 | 4 | 0.0739 | ||
| Cor Total | 18.71 | 28 |
Table 5.
ANOVA results for SR.
| Source | Sum of Squares | Df | Mean Square | F Value | p-Value |
|---|---|---|---|---|---|
| Model | 3.93 | 14 | 0.2806 | 10.02 | < 0.0001 |
| A-T on | 2.26 | 1 | 2.26 | 80.8 | < 0.0001 |
| B-T off | 0.6684 | 1 | 0.6684 | 23.86 | 0.0002 |
| C-SV | 0.0564 | 1 | 0.0564 | 2.01 | 0.1777 |
| D-PC | 0.0256 | 1 | 0.0256 | 0.9138 | 0.3553 |
| AB | 0.0156 | 1 | 0.0156 | 0.5579 | 0.4675 |
| AC | 0.042 | 1 | 0.042 | 1.5 | 0.2409 |
| AD | 0.0465 | 1 | 0.0465 | 1.66 | 0.2183 |
| BC | 0.0344 | 1 | 0.0344 | 1.23 | 0.2866 |
| BD | 0.0136 | 1 | 0.0136 | 0.4866 | 0.4969 |
| CD | 0.0494 | 1 | 0.0494 | 1.76 | 0.2054 |
| A2 | 0.3023 | 1 | 0.3023 | 10.79 | 0.0054 |
| B2 | 0.0066 | 1 | 0.0066 | 0.2349 | 0.6354 |
| C2 | 0.041 | 1 | 0.041 | 1.46 | 0.2464 |
| D2 | 0.0076 | 1 | 0.0076 | 0.2706 | 0.6111 |
| Residual | 0.3921 | 14 | 0.028 | ||
| Lack of Fit | 0.2206 | 10 | 0.0221 | 0.5147 | 0.8203 |
| Pure Error | 0.1715 | 4 | 0.0429 | ||
| Cor Total | 4.32 | 28 |
Table 6.
Pareto optimum frontal solutions.
| S. No. | Ton | T off | Servo Voltage | Peak Current | MRR | Ra |
|---|---|---|---|---|---|---|
| 1. | 120.0412 | 58.77586 | 49.96319 | 40.06579 | 8.995111 | 1.789038 |
| 2. | 120.1492 | 56.58296 | 49.99996 | 40.05555 | 9.712588 | 1.60152 |
| 3. | 120.1389 | 56.93179 | 49.9999 | 40.0267 | 9.630805 | 1.608884 |
| 4. | 120.0575 | 59.71887 | 49.97326 | 40.07279 | 8.612424 | 1.987299 |
| 5. | 120.0313 | 59.75359 | 49.97836 | 40.00503 | 8.573463 | 1.99937 |
| 6. | 120.0153 | 58.25391 | 49.97986 | 40.03768 | 9.160236 | 1.714015 |
| 7. | 120.0785 | 57.06381 | 49.99911 | 40.08462 | 9.553325 | 1.61439 |
| 8. | 120.028 | 58.49976 | 49.97089 | 40.02401 | 9.085653 | 1.746697 |
| 9. | 120.0645 | 56.61391 | 49.98191 | 40.01006 | 9.643118 | 1.60284 |
| 10. | 120.0774 | 58.73727 | 49.99318 | 40.06843 | 9.037575 | 1.77747 |
| 11. | 120.0865 | 59.6101 | 49.98075 | 40.07363 | 8.686113 | 1.954955 |
| 12. | 120.0275 | 59.98092 | 49.96993 | 40.02472 | 8.463633 | 2.066013 |
| 13. | 120.0422 | 59.18336 | 49.94574 | 40.05737 | 8.835108 | 1.866152 |
| 14. | 120.0161 | 59.90732 | 49.96901 | 40.08943 | 8.488892 | 2.045831 |
| 15. | 120.043 | 57.81518 | 49.98133 | 40.06418 | 9.323258 | 1.665676 |
| 16. | 120.015 | 59.38865 | 49.96638 | 40.00027 | 8.7235 | 1.911485 |
| 17. | 120.0272 | 57.20975 | 49.97581 | 40.07966 | 9.479039 | 1.623467 |
| 18. | 120.0219 | 59.24189 | 49.96685 | 40.01432 | 8.791831 | 1.87836 |
| 19. | 120.0211 | 59.46681 | 49.97204 | 40.07836 | 8.694218 | 1.928456 |
| 20. | 120.021 | 58.60729 | 49.97019 | 40.07 | 9.040872 | 1.76309 |
| 21. | 120.0088 | 59.85303 | 49.96829 | 40.04466 | 8.508329 | 2.03119 |
| 22. | 120.0741 | 57.62292 | 49.99341 | 40.09495 | 9.403723 | 1.647672 |
| 23. | 120.0081 | 59.99954 | 49.9693 | 40.02337 | 8.43774 | 2.074575 |
Disclaimer/Publisher’s Note: The statements, opinions and data contained in all publications are solely those of the individual author(s) and contributor(s) and not of MDPI and/or the editor(s). MDPI and/or the editor(s) disclaim responsibility for any injury to people or property resulting from any ideas, methods, instructions or products referred to in the content. |
© 2023 by the authors. Licensee MDPI, Basel, Switzerland. This article is an open access article distributed under the terms and conditions of the Creative Commons Attribution (CC BY) license (http://creativecommons.org/licenses/by/4.0/).
Copyright: This open access article is published under a Creative Commons CC BY 4.0 license, which permit the free download, distribution, and reuse, provided that the author and preprint are cited in any reuse.


