
Submitted:
15 June 2023
Posted:
15 June 2023
You are already at the latest version
Abstract
This research investigates the impact of oil price fluctuations on food prices in Saudi Arabia between 1979 and 2020 using Nonlinear Autoregressive Distributed Lags (NARDL) methodology. The study employs Augmented Dickey-Fuller (ADF) and Phillip Perron (PP) tests to determine the integration order of the variables and Bounds testing to confirm the existence of long-run cointegration relationships between each variable. The results indicate that oil shocks influence food prices through several mechanisms. Firstly, the cost of energy increases due to the rise in oil prices, affecting the agricultural commodity market, including farm equipment, food processing, packaging, and distribution costs. Secondly, the demand for agricultural commodities to produce biofuels affects food availability and, thus, food prices. Thirdly, as an oil-based economy, the oil price shock affects food prices through its impact on government spending, which affects aggregate demand and liquidity. Therefore, Saudi Arabia should adopt appropriate policies to mitigate the impact of oil price shocks on food prices, including investing in renewable energy sources, diversifying its economy, and improving food production and supply chain efficiency. Additionally, implementing appropriate fiscal policies to ensure sufficient budget allocation for food support programs is crucial. However, investing in groundwater exploration can contribute significantly to the development of Saudi agriculture and to gradually achieving food self-sufficiency.
Keywords:
Food prices
; Oil prices
; Real GDP
; Nonlinear ARDL
; Saudi Arabia
1. Introduction
After almost three decades of price stability and some periods of deflation, inflationary pressures reemerged in Saudi Arabia in the middle of 2000s following the increase in global oil prices, reduction of subsidies, and exchange rate weaknesses. Even though Saudi Arabia's local oil prices and many other necessities are still subsidized, prices of imported goods especially foodstuffs are affected by the increase in global oil prices. In 2008, the inflation reached its highest level in three decades, even though eased in 2008; inflation remained at a relatively high level during 2009-2021 period compared to the levels in the 1980s, 1990s and early 2000s. The rise was due partly to the increase in the price level of foodstuff, which constitute the largest share of the cost-of-living index. For example, from 2005 to 2012, the price index for meat and poultry increased from 106 to 167, fresh fruits increased from 123 to 218 and 127 to 260 for fish and crustaceans. The implications of the increase to the welfare of the Saudis have stimulated extensive discussions and obliged the Saudi government to review its socio- economic policy (Yousif and Al-Kahtani, 2014).
About 80% of foodstuffs is imported, thus it is expected changes in Saudi Arabia food prices to be driven by changes in global food prices which in turn is affected by changes in global oil prices. Indeed, the correlation between food prices in Saudi Arabia and global food prices is about 70% (Khan, 2012). Global food prices and oil prices have been moving in tandem. Changes in oil price are transmitted to food prices via several channels. Modern agriculture uses oil products to fuel farm machineries and for transportation. An increase in oil price raises the cost of farm equipment’s and the costs of food processing, packaging, and distribution (Baumeister and Kilian, 2012). It is also input for agricultural chemicals such as pesticides and fertilizers. Additionally, demand for biofuels, often made from corn and other agricultural products increase as oil prices rise as it is the only non-fossil liquid fuels to replace petroleum products in combustion engines and motor vehicles. In the case of a food importing country, this leads to an increase in its import bills (Alghalith, 2010; Ibrahim, 2013, 2015). In addition, in oil- based economy, the aggregate demand built mainly by oil revenue forms a potentially important channel for oil price pass through into food prices.
In the case of Saudi Arabia, the increase in global oil prices is advantageous on the revenue side as it led to greater revenue, however the increase in oil price led to increase in the prices of foodstuffs, the increase in economic activities due to higher oil prices also put a pressure on the price level. Accordingly, this paper examines the effect of oil price on the price of foodstuffs. The general consumer price index is not sufficient to reflect the behavior of the prices of specific commodities, such as foodstuffs, response to the changes in oil prices. Examining the relationship between oil prices on food prices help to examine the external pressures that oil price has on the food prices even though price of oil is heavily subsidized. The findings from this study contribute to the current debate about the pass-through effect of oil prices into food prices. In particular, it shows how the reliance of Saudi government on oil revenue results in high response of this factor to the fluctuation of oil prices. In addition, as the analysis also test for asymmetric relationship between oil price and food prices, this study is beneficial to show the extent of the market power's effect on the food prices as the latter respond to negative oil price shocks.
2. Background
Saudi Arabia is the second largest producer of crude oil behind Russia, and the second largest producer of petroleum liquids behind the USA. The average of total petroleum liquids in 2020 was 10.8 million b/d of which 9.2 million b/d was crude oil production and 1.6 million b/d was non-crude liquids production. (British Petroleum, 2015; Energy information Administration, 2014). The production of oil has been increasing from 2340.5 million barrels in 1990 to 3573.4 million barrels in 2012, and accounting for more than 10% of world production of crude oil during the period. Beside the production of crude oil, Saudi Arabia has expanded its natural gas, refining products such as gasoline and Naphta, gasoline oil and fuel oil. Domestic consumption of crude oil is also trending upward. Saudi Arabia is the 11th largest consumer of total primary energy in 2019 (Energy Information Administration, 2021). The high level of domestic consumption despite the dramatic increase in global oil prices is due to the high oil revenue and large fuel subsidies. Saudi subsides have registered an increase from US$2 billion and US$3 billion in gasoline and diesel in 2004 to US$14 billion and US$15 billion in 2012 (Charles, Moerenhout, & Bridle, 2014). As a result of the large fuel subsides, the domestic prices of fuel have for long time been of the lowest in the world. The Gasoline and Diesel prices were between US$ 0.24 to 0.16 per litter for Gasoline, and 0.07 to 0.1 for Diesel. While lowering fuel prices has long been an important measure to achieve economic and social goals, it has led to domestic over-consumption of hydrocarbons and the absence of incentives to achieve energy efficiency in the economy.
Saudi Arabia inflation rate was relatively low from 1964-1972, averaging about 2.5% per annum. However, during the period 1973-1976, inflation increased and peaked at 34.6% in 1975. The high level of inflation was accompanied by a drastic rise in oil revenue which stimulated growth in government spending. In addition, supply bottlenecks, increase in the wage levels and non-wage income are thought to be among the main causes of inflationary pressure during this period (SAMA, 1976). Nevertheless, Saudi Arabia initiatives to reduce the inflation such as elimination of taxes for certain products, subsidization of the imports of foodstuffs and reduction in the cost of electricity have helped to reduce inflation in addition to changes in global oil price. In January 1974, the government introduced subsidy programs for rice, flour, sugar, milk products, frozen meat, and vegetable oil (ibid). The decrease in government spending and the Saudi Riyal appreciation against US dollar, control inflationary pressure. Inflation decreased considerably from 31.6% in 1975 to 4.2% in 1980. The downward trend of inflation continued over the period 1982-1987 due to improvements of infrastructure facilities and development of competitive market as well as reduction of oil price which contributed to the reduction of production costs and thus decline of imported inflation. In fact between 1983 and 1987, Saudi economy experienced deflation averaged at -2.35%. Inflation was around 4.9% in both 1991 and 1995; the average of inflation rates during 1988-1992 and 1993-1997 were 1.76% and 1.58%, respectively. This trajectory of inflation was attributed to moderate economic activity, availability of cheap imports, elastic labor market, full capital mobility, and low inflationary expectations because of the fixed exchange rate policy (Savard et al., 2010). In fact for a long period if price of foodstuffs is not included in CPI, Saudi Arabia was experiencing deflation.
In 2007, the second inflationary episode began to emerge, where CPI increased from 2.4% in 2006 to 4.2% and continued to rise reaching a peak of approximately 10% in 2008. Even though these rates are relatively low compared with many countries, relative to Saudi Arabia historical inflation. Inflation moderated since then but remains relatively high compared to previous decades; averaged around 5% during the period 2009 to 2020. The later spike in inflation despite tighten monetary policy undertaken by Saudi Arabia Monetary Authority (SAMA), advocated a considerable debate about the main causes of inflation. The pegging of Saudi riyals to US dollar was claimed to generate imported inflation. The devaluation of the US dollar against most major currencies put upward pressure on Saudi import prices. Furthermore, the fixed exchange rate constrained SAMA (Saudi Arabia Monetary Authority) influence over money supply, i.e., it limits its ability to adjust interest rate and control credit growth. This constraint was noticeable since bank loans to private sector expanded dramatically, reaching 35% in the middle of 2008 (SAMA, 2010). However, with many deposits are placed on an Islamic basis, even if Saudi Arabia Monetary Authority (SAMA) was freely able to adjust interest rates, this would have only a limited effect on inflationary pressure in Saudi economy.

Table 1.
Saudi Arabia: Index for Food Prices (2005-2012).
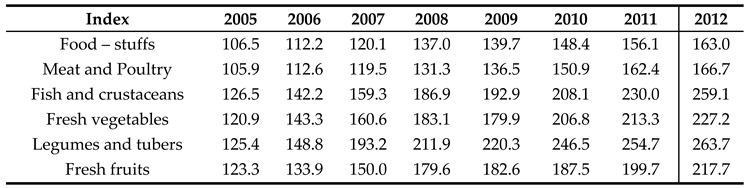
Source: SAMA annual report, different issues.
Since the foodstuffs group carries the largest weight of the cost-of-living index (between one quarter and one third) the rise in this category was one of the major driving forces of inflation. In 2007, there was a considerable rise in the agricultural commodities such as fresh vegetables and fish (12%), cereals (7%) and meat and poultry (6%). The transportation cost of food has also increased due to the increase in oil price in this period.
At the disaggregated level, the symmetric and asymmetric pass-through effect of oil price to food prices have been examined in the recent literature due to the recent volatile trends of world oil and food prices. As the agricultural sector is energy- intensive, it has been shown oil price is the main force behind food price hikes in recent years (Dancy, 2012). The price of oil affects inflation through the cost of mechanized farm equipment and the cost of food processing, food packaging and distribution (Baumeister and Kilian, 2012). However, empirical findings about the pass-through effect of oil price on food prices varied depending on the country, methodology and data period.
Alghalith (2010) investigated the effect of oil price uncertainty on food prices and concludes that in an oil-producing country like Trinidad and Tobago, a higher oil price positively and significantly affects food price. Moreover, higher oil price volatility results in higher food price. Similarly, Esmaeili and Shokoohi (2011) examined the effect of macroeconomic variables including oil price on world food prices. The results showed that oil price has a significant effect on the food price. Chen and al. (2010) analyzed the effect of oil price on world grain prices for corn, wheat and soybean. The results indicate the existence of the same relationship.
Ibrahim and Said (2012), Ibrahim (2015), Karimi and al. (2014) examined the asymmetric response of food prices to the fluctuations in oil price. According to Ibrahim (2015), the presence of market power and the role of public policy such as price ceiling and price subsidies for some kinds of foodstuffs have normally been held responsible for this asymmetry. Ibrahim and Said (2012) studied the effect of oil price fluctuations on the indexes of aggregate and disaggregate consumer prices in Malaysia. Their findings from the cointegration technique indicate that long run association among the variables exists only in the case where the food price index and the aggregate price index are used as the dependent variables. Based on these results, they concluded that the effect of oil price on inflation in the long run stems from its effect on the food prices. The test for asymmetric behavior of consumer price indexes showed that the food prices tend to exhibit a downward rigidity in the short run. In contrast, the upward movement of oil price would immediately raise food prices. Using the NARDL, Ibrahim (2015) also showed the existence of a long run asymmetric response of food prices to changes in oil prices where an increase in oil prices have a higher effect on food prices than a decrease.
Karimi and al. (2014) analyzed the asymmetric effects of world oil prices on the inflation of US food price. Using MTAR technique, the results indicated the existence of an asymmetric cointegration between oil price and food prices. In addition, the result of asymmetric error correction model indicate that food prices adjust faster to an increase in oil price compared to a decrease in oil price.
In contrast, Nazlioglu and Soytas (2010), Ibrahim and Chancharoenchai (2014), Baumeister and Kilian (2014) found no evidence of a relationship between oil price and food prices. Nazlioglu and Soytas examined the short and long run relations between world oil prices, exchange rate and the price of a number of agricultural commodities in Turkey: wheat, maize, cotton, soybeans and sunflower. The exchange rate was included to examine the indirect effect of oil price increase on the prices of agricultural commodities. According to them, beside its effect on the cost of production, the increase on oil prices in USD would depreciate the local currency value and thus increase the price of foods. They used a linear causality approach; namely; the Toda-Yamamoto causality method, and monthly data from January 1994 to March 2010. However, they concluded that the agricultural commodity markets in Turkey are neutral to fluctuations of oil price and exchange rate.
Ibrahim and Chancharoenchai (2014) used symmetric and asymmetric cointegration techniques and quarterly data over the period 1993 to 2010 to examine the long run relationship between oil price and different components of consumer price index in Thailand. The findings revealed that, the food and beverage price and raw food price indexes have no cointegration with oil prices. However, in the short run the results indicated significant effect of oil price shocks on the indexes of aggregate consumer prices and its components. The findings of Baumeister and Kilian (2014) based on US data also indicate that there is no evidence that oil price shocks are associated with an increase in US food prices. According to them, even though increases in the real prices of some foodstuffs can be linked positively to increases in the real price of oil, that link is driven by common macroeconomic determinants of the prices of oil and agricultural commodities.
Overall, these contrasting findings have continued to motivate further research to question the effect of oil prices on food prices. Obviously, understanding the pass through effect of oil prices on domestic food prices for a country is important for continuous welfare assessment. In the case of a small open economy like Saudi Arabia, the subject is of intense interest for at least two reasons. First, Saudi Arabia is a net food-importing country where the major types of foodstuffs are all imported. As a result, Saudi Arabia is particularly vulnerable to oil and global food crises. Secondly, since Saudi economy is an oil-based economy, the rise in oil price is assumed to stimulate strong inflationary pressure through the increase in oil revenue, money liquidity and excess demand. Combined, the factors put Saudi Arabia at a higher inflationary risk when exposed to oil price shocks. In light of these facts and the recent experience of food price surge, a study on food price dynamics and its response to oil price movements is urgently needed. The potential asymmetric adjustment of food prices to oil price fluctuations is often attributed to factors such as the presence of market power and the role of public policy schemes such as price floor and price ceiling. Hence, in this study, we attempt to analyze the asymmetric effect of oil price on inflation in the case of Saudi Arabia.
3. Empirical Method
The pass-through effect of oil price as a supply shock on inflation is often examined using the Gordon’s Triangle Phillips Curve (Gordon, 1982). The "triangle model of inflation" indicates inflation is a function of three determinants; built in inflation or lagged rate of inflation, demand-pull or excess demand measured by output gap or unemployment gap, and the cost-push or supply shocks. Based on the model, an extensive body of literature about the effect of oil price shocks on inflation has been established (see, Hooker 2002; Gregorio and al.,2007; Chen, 2009; Cavallo, 2008; Clark and Terry, 2009; Herrera and Pesavento, 2009; Blanhard and Gali, 2010).
The empirical model used in this study is based on Gordon (1982, 1990) triangle model of inflation. Since supply shocks can create positive correlation between inflation and unemployment, the failure of including supply shocks in conventional Phillips curve is likely to lead to unreliable conclusion regarding the secular change in price stickiness (Gordon, 1990; 1997 and Debdatta Pal and al, 2020). The triangle Phillips curve model is presented as the following equation:
where is the indicator of supply shocks, πt is inflation, Yt is GDP which indicates the actual output and YNt is the potential output. Equation (1) is expanded as a framework to estimate the effect of oil price on food prices in both long and short run (see, for example, Gregorio et al., 2007; Cavallo, 2008; Chou and Tseng, 2011; Ibrahim and Said, 2012; Ibrahim, 2015). Oil price shock indicators in several studies have also included exchange rate. Exchange rate is expected to be a channel of oil price pass through into inflation. Since oil is mainly traded in US dollars, changes in oil prices have direct impact on local currency which in return affects the prices of its imports/exports of goods and thus its consumer price index (Scheibe amd Vines, 2005; Nazlioglu and Soytas, 2011; Ibrahim and Chancharoenchai, 2013).
However, the effect of oil price on exchange rate depends on whether a country is exporter or importer of oil. In the case of oil-exporting countries, an increase in oil price is expected to lead to an appreciation in the local currency. Consequently, the costs of imported goods would decline. In contrast, for oil-importing countries, an increase in oil price will lead to a depreciation in local currency hence raise the cost of imports (Ibrahim and Said, 2012). In order to account for such channel, studies such as Cunado and Gracia (2004), Ibrahim and Said (2012) and Ibrahim (2014) chose to convert the oil price in US dollar to the prices in domestic currency. However, as Ibrahim and Chancharoenchai (2013) argued, while oil price fluctuations could affect the value of domestic currency vis-à-vis dollar, changes in the domestic currency value can also be caused by a host of other factors such as productivity differentials, capital flows and financial uncertainties. Thus, to distinguish between the effect of oil price and the exchange rate on inflation they choose to include the exchange rate of domestic currency against US dollar separately in the inflation equation.
In the case of Saudi Arabia, the exchange rate is pegged to the US dollar. Thus, the appreciation and depreciation of Saudi Riyal would be affected by the impact of oil prices fluctuations on US dollar. According to Lizardo and Andre (2010), there is a negative correlation between oil price and US exchange rate. If so, it can be expected that increase in oil prices will lead to US dollar depreciation and through the dollar peg, this would increase Saudi’s cost of its imports. In order to maintain the exchange rate peg to the U.S. dollar, Saudi Arabia Monetary Authority (SAMA) followed the Federal Reserve by cutting its policy rate and devaluating the Saudi Riyal against other currencies, which led to double digit inflation rates in mid-2008 (Westelius, 2013).
Another important reason for the inclusion of exchange rate in inflation modeling is due to the share of import items in the consumer price index (Scheibe and Vines, 2005). Since imports of foodstuffs account for 80% of the total food supply in the country, the inclusion of exchange rate is important in modeling Saudi Arabia food inflation. We can express the equation of food prices as:
Equation (2) indicate the short run and long run determinants of food prices, where opt is oil price, ert is exchange rate and fpt is food prices, and ygap is output gap.
Different methods have been developed to estimate output gap i.e. the difference between the actual and potential level of output, such as Hodrick and Prescott filter, Paxter and King's filter, and Kalman filter. Hodrick and Prescott filter is the most common method to measure the output gap in the literature of inflation and oil price (Gregorio, 2007; Ibrahim and Chancharoenchai, 2013; Ibrahim and Said, 2012). This measure, therefore, will be applied in this study to measure the output gap using both gross domestic products (GDP) and non-oil gross domestic products (NOGDP). Oil GDP accounts for considerable part of GDP and that the oil revenue is directly generated by the government and does not have a direct impact on private sector or investment. In contrast, NOGDP. This is because, accrues to the private sector directly through payments of wages and other income sources (Alsahafi, 2009; Basher and Elsamadisy, 2011; Basher and Fachin, 2014). Therefore, non-oil output is expected to have higher impact on food prices.
Similarly, different indicators have been used to measure the world oil price; Brent spot crude oil price in the US dollars (Ibrahim and Chancharoenchai, 2013), West Texas Intermediate (Ibrahim and Said, 2011), Brent, and Dubai Fateh’s calculation of the weighted average spot price (Chou, 2011), the producer price index for crude oil (Cunado and Gracia, 2004). Following Ibrahim and Chanchroenchai (2013) and due to limited availability of annual data on oil prices for the period 1970-2013, we use the Brent spot crude oil price in the US dollar.
To proxy exchange rate, we follow Scheibe and Vines (2005) in using the nominal effective exchange rate (NEER). The advantage of using NEER as an indicator of exchange rate variable is that it comprise several exchange rates and thus reduces the risk of erroneous generalizations that may result from measuring the domestic currency in terms of a specific single currency. Since NEER is measured as foreign currency price per local currency an increase in NEER represents an appreciation of the local currency. Thus, the changes of NEER are expected to have negative effect on food prices.
Different econometric techniques such as Threshold Autoregressive (TAR), Momentum Threshold Autoregressive (MTAR), and non-linear autoregressive distributed lag (NADEL) have been used to test the existence of asymmetrical cointegration and causalities between oil price and food prices variables. TAR and MTAR techniques are limited to examining only the long-run cointegration between the variables. In contrast, the NARDL model developed by Shin and al. (2014) has the capability of modeling both the long-run and short-run asymmetric relation between the variables simultaneously. In the NARDL model, the short-run and long-run nonlinearities are introduced via positive and negative partial sum decompositions of the explanatory variables. By doing this, the model becomes linear in the parameters of these decompositions and becomes easy to estimate by the standard ordinarily least square method (OLS). Due to these advantages, NARDL is the preferred method to investigate the relationship (Shin and al. 2014).
The model of oil price and food prices based on the NARDL model is written as:
where and are the partial sums of positive and negative changes in log oil price:
Equation (3) is derived to examine the cointegration between the food prices, exchange rate and the partial sum of negative and positive changes in oil prices; where the null hypothesis of cointegration is.1 In addition, the long and short run coefficients will be estimated; whereas: , are the long run coefficients of explanatory variables. It is assumed that and > 0 while 0. The short run coefficients of explanatory variables are, . It is assumed that; , > 0 while < 0. The study uses annual data over the period 1979-2021 to estimate the model.
4. Analysis
This paper aims to analyze the interrelationship between global oil prices and food prices in Saudi Arabia during 1979-2020 periods. In our case, the NARDL approach developed by Pesaran et al. (2001) was utilized to conduct the cointegration test and to detect how global oil prices impact the food prices in short and long term. This method follows the bounds testing approach to cointegration that was introduced by Pesaran and Shin (1999) and subsequently improved upon by Pesaran et al. (2001). As suggested by Alimi, R. S. (2014), the NARDL approach to cointegration is more dependable for small sample sizes, which is relevant to our study.
Table 2.
Descriptive analysis.
| Fp | Op | Er | Ygap | noygap | |
|---|---|---|---|---|---|
| Average | 3.996636 | 2.028182 | 6.984909 | 6.248818 | 1.341545 |
| Median | 4.000000 | 2.000000 | 6.000000 | 6.000000 | 1.000000 |
| Maximum | 5.000000 | 3.000000 | 11.00000 | 10.00000 | 2.000000 |
| Minimum | 1.000000 | 1.000000 | 1.000000 | 1.000000 | 1.000000 |
| Skewness | -0.553517 | -0.055178 | -0.178764 | 0.077581 | 0.668263 |
| Kurtosis | 2.533002 | 1.251490 | 1.939327 | 3.578400 | 1.446576 |
| Jarque-Bera | 661.6548 | 1406.838 | 574.2245 | 164.3683 | 1924.739 |
| P-value | 0.000000 | 0.000000 | 0.000000 | 0.000000 | 0.000000 |
| Observations | 205 | 205 | 205 | 205 | 205 |
The given table reports descriptive statistics for five variables: Fp, OP, Er, Ygap, and noygap. The Fp variable has an average of 3.996636 and a median of 4, indicating a somewhat symmetrical distribution around the center. The minimum value is 1 and the maximum is 5, suggesting a relatively narrow range of values. The data appears to be slightly negatively skewed, with heavier tails than a normal distribution. The OP variable has an average of 2.028182 and a median of 2, indicating a relatively symmetrical distribution. The range of values is from 1 to 3, suggesting little variation in values. The OP variable is relatively symmetric with lighter tails than normal. The Er variable has an average of 6.984909 and a median of 6, indicating a slightly positively skewed distribution. The range of values is from 1 to 11, suggesting moderate variation in values. The Er variable is slightly positively skewed with heavier tails and a more peaked distribution than normal. The Ygap variable has an average of 6.248818 and a median of 6, indicating an approximately symmetrical distribution. The range of values is from 1 to 10, suggesting moderate variation in values. The Ygap variable appears to be approximately symmetric with heavier tails and a more peaked distribution than normal.
The noygap variable has an average of 1.341545 and a median of 1, indicating a right-skewed distribution. The range of values is from 1 to 2, suggesting little variation in values. The noygap variable is skewed to the right, with a longer tail to the right of the mean but is otherwise close to a normal distribution. All five variables were found to be non-normally distributed according to the Jarque-Bera test, indicating the presence of outliers or other non-normal factors. The range of values varies across the variables, with some showing moderate variation and others showing very little.
In order to detect the order of integration of each variable, we have used the ADF (Augmented Dickey-Fuller) test and PP (Phillips-Perron) test. The results indicated in Table 3 show that all variables are stationary in first difference.
Table 3.
Unit root test for dependent and independent variables in food price model.
| ADF | PP | |||
|---|---|---|---|---|
| Level | Intercept | Trend& intercept | Intercept | Trend& intercept |
| Fp | 1.049 | -0.986 | 1.150 | -0.410 |
| op+ | 1.046 | -1.796 | 1.077 | -1.761 |
| op− | -1.238 | -1.982 | -1.521 | -1.919 |
| Er | -1.558 | -1.714 | -1.774 | -2.120 |
| Ygap | -2.532 | -2.547 | -2.524 | -2.673 |
| noygap | -3.108** | -3.022 | -1.868 | -2.077 |
| First difference | ||||
| Fp | -3.125** | -3.728** | -3.137** | -3.668** |
| op+ | -4.296*** | -4.769*** | -4.566*** | -4.701*** |
| op− | -6.675*** | -6.801*** | -6.760*** | -8.225*** |
| Er | -4.068*** | -4.008** | -4.015*** | -3.937** |
| Ygap | -5.481*** | -5.428*** | -5.498*** | -5.454*** |
| noygap | -3.887*** | -3.868** | -3.887*** | -3.868*** |
NARDL results are reported in Table 4. To test the null hypothesis of no cointegration among the variables, the F-statistic was computed using the Wald test for coefficient restrictions. The critical values generated by Narayan (2005) with restricted intercept and no trend are used. The result shows that the F bound statistic of the estimated model is significant at even 1% level which implies that the dependent and independent variables are associated in the long run.
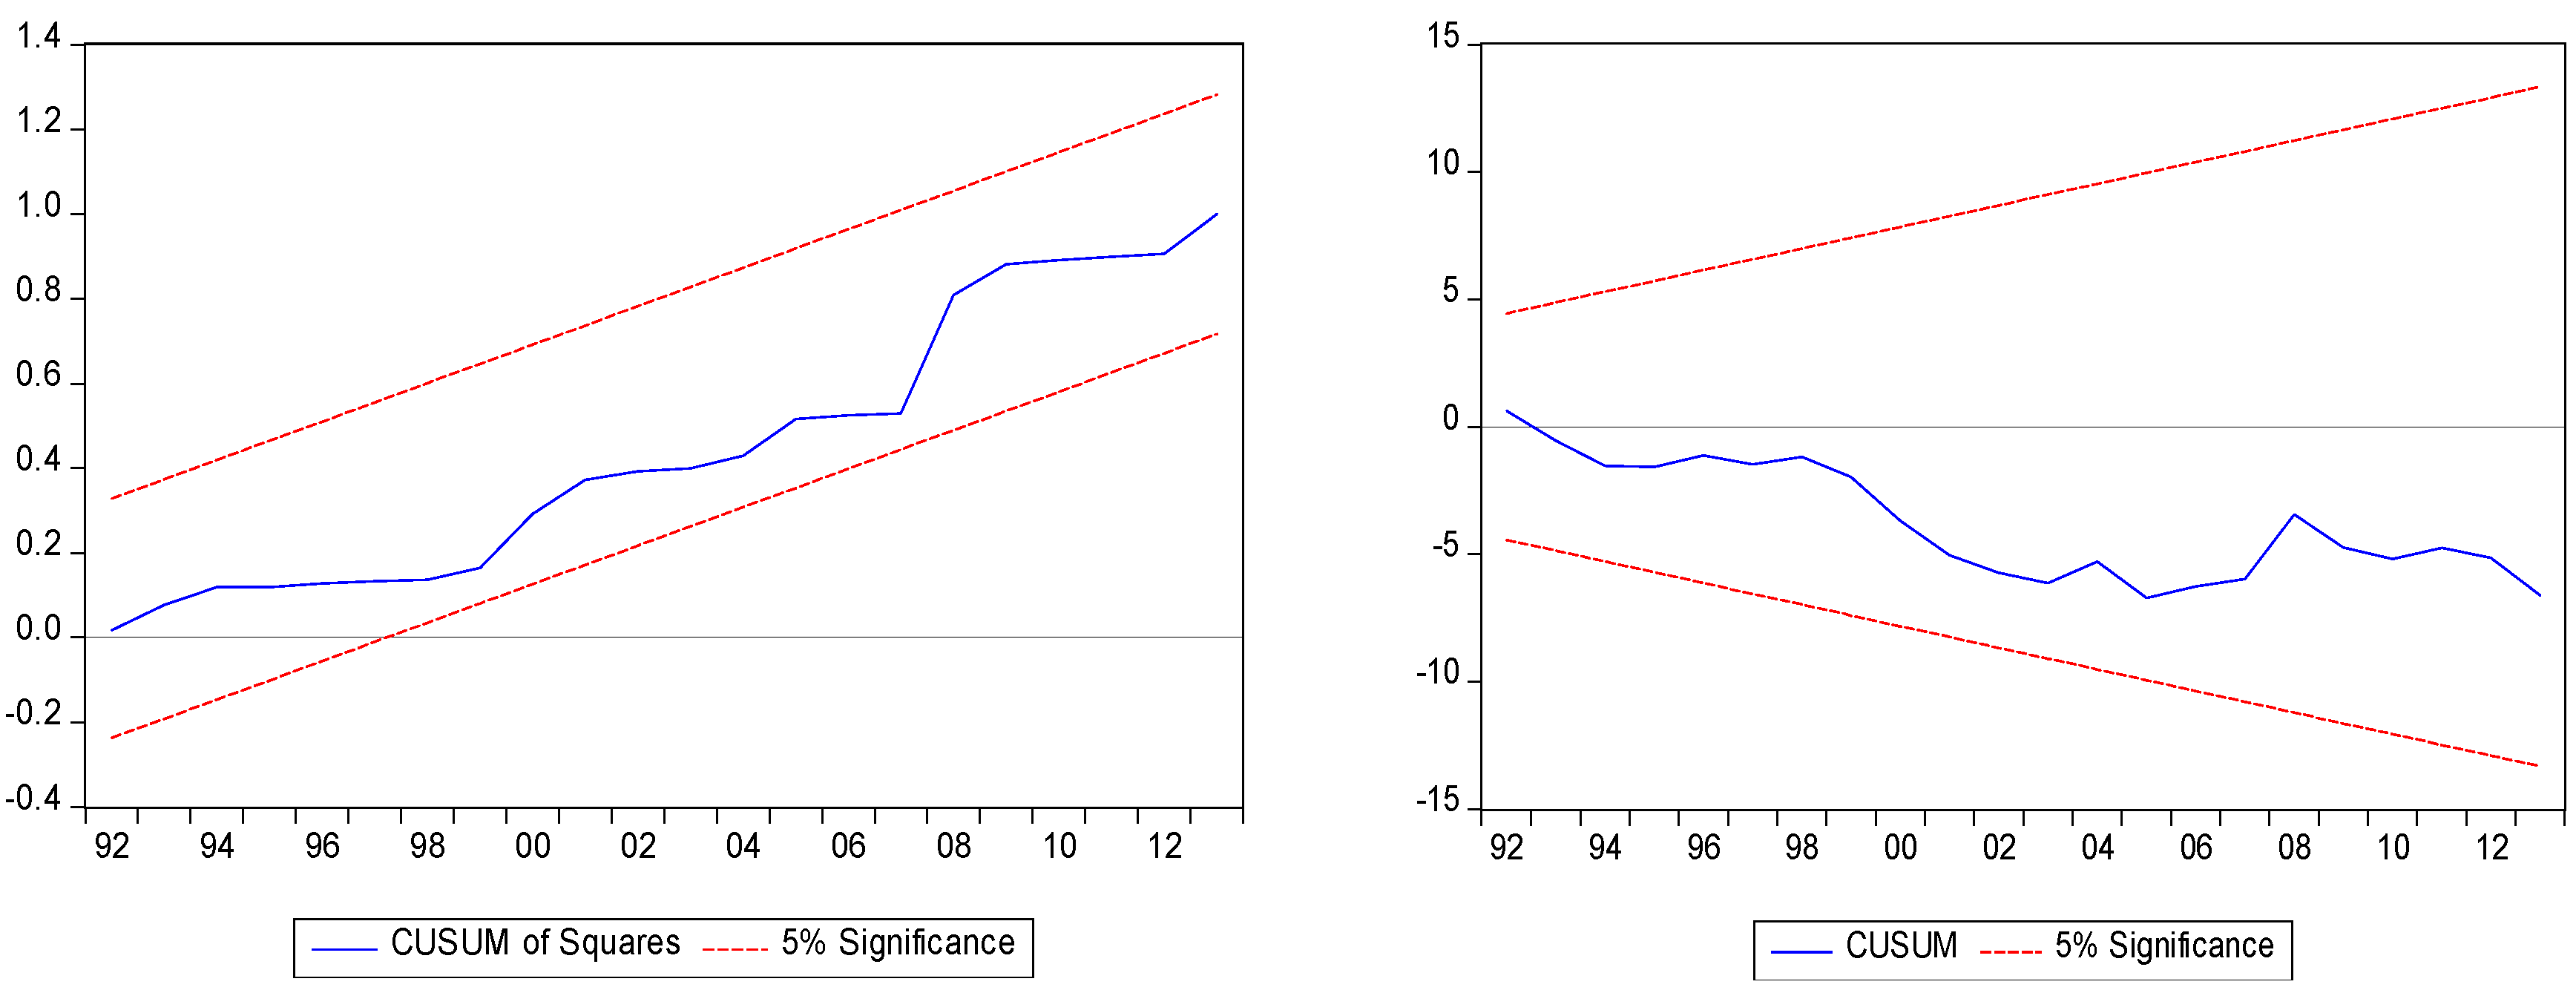
Diagnostic tests of the dynamic model of food prices are also reported in Table 3. Results of J-B, LM, and ARCH enhance that the estimated models are well specified and that error terms are independent, homoscedastic, normally distributed and linear. In addition, the plotted charts of the cumulative sum (CUSUM) and cumulative sum of squares (CUSUMSQ) of recursive residuals at 5% shows that the data is structurally stable (Figure 2 and Figure 3).
Table 4.
The nonlinear ARDL Estimation results.
| Variable | Model(1) | Model(2) |
|---|---|---|
| C | 2.292*** (0.288) | 1.760*** (0.258) |
| -0.310*** (0.048) | -0.269*** (0.041) | |
| 0.098*** (0.012) | 0.088*** (0.010) | |
| 0.077*** (0.012) | 0.068*** (0.010) | |
| -0.237*** (0.034) | -0.190*** (0.028) | |
| -0.188 (0.119) | -0.191 (0.112) | |
| -0.143 (0.291) | ----- | |
| 0.034 (0.023) | 0.031 (0.021) | |
| -0.082*** (0.023) | -0.102*** (0.022) | |
| -0.017 (0.022) | -0.025 (0.022) | |
| -0.014 (0.023) | 0.058 (0.048) | |
| 0.159** (0.072) | 0.064*** (0.029) | |
| 0.044 (0.055) | 0.058 (0.048) | |
| R2 | 0.8957 | 0.894 |
| F | 13.602 | 18.716 |
| DW | 1.9684 | 1.970 |
| F-Bound | 19.279*** | 18.716*** |
| J. B | 2.2815 (0.319) | 0.813 (0.665) |
| LM (1) | 0.148 (0.704) | 0.245 (0.784) |
| LM (2) | 0.07366 (0.929) | 1.085 (0.306) |
| ARCH (1) | 0.04948 (0.825) | 1.085 (0.306) |
| ARCH (2) | 0.43926 (0.649) | 1.600 (0.219) |
| WLR | 0.069*** | 0.075*** |
| WSR | 0.071*** | 0.069*** |
Note: output gap (Ygap) is measured by NOGDP in the first model, and GDP in the second. ***, * indicate the significance at 1%, 5% and 10% respectively. The number between the brackets under the coefficients is the values of standard error. The results of LM, ARCH are shown up to lag between the brackets. The reported values in front LM, ARCH are for F statistics, and the numbers between the brackets are the associated p values. WLR and WSR is the Wald test of the null hypothesis of symmetry in the long and short run, respectively.
Figure 1.
:CUSUM and CUSUMQ of model (1).
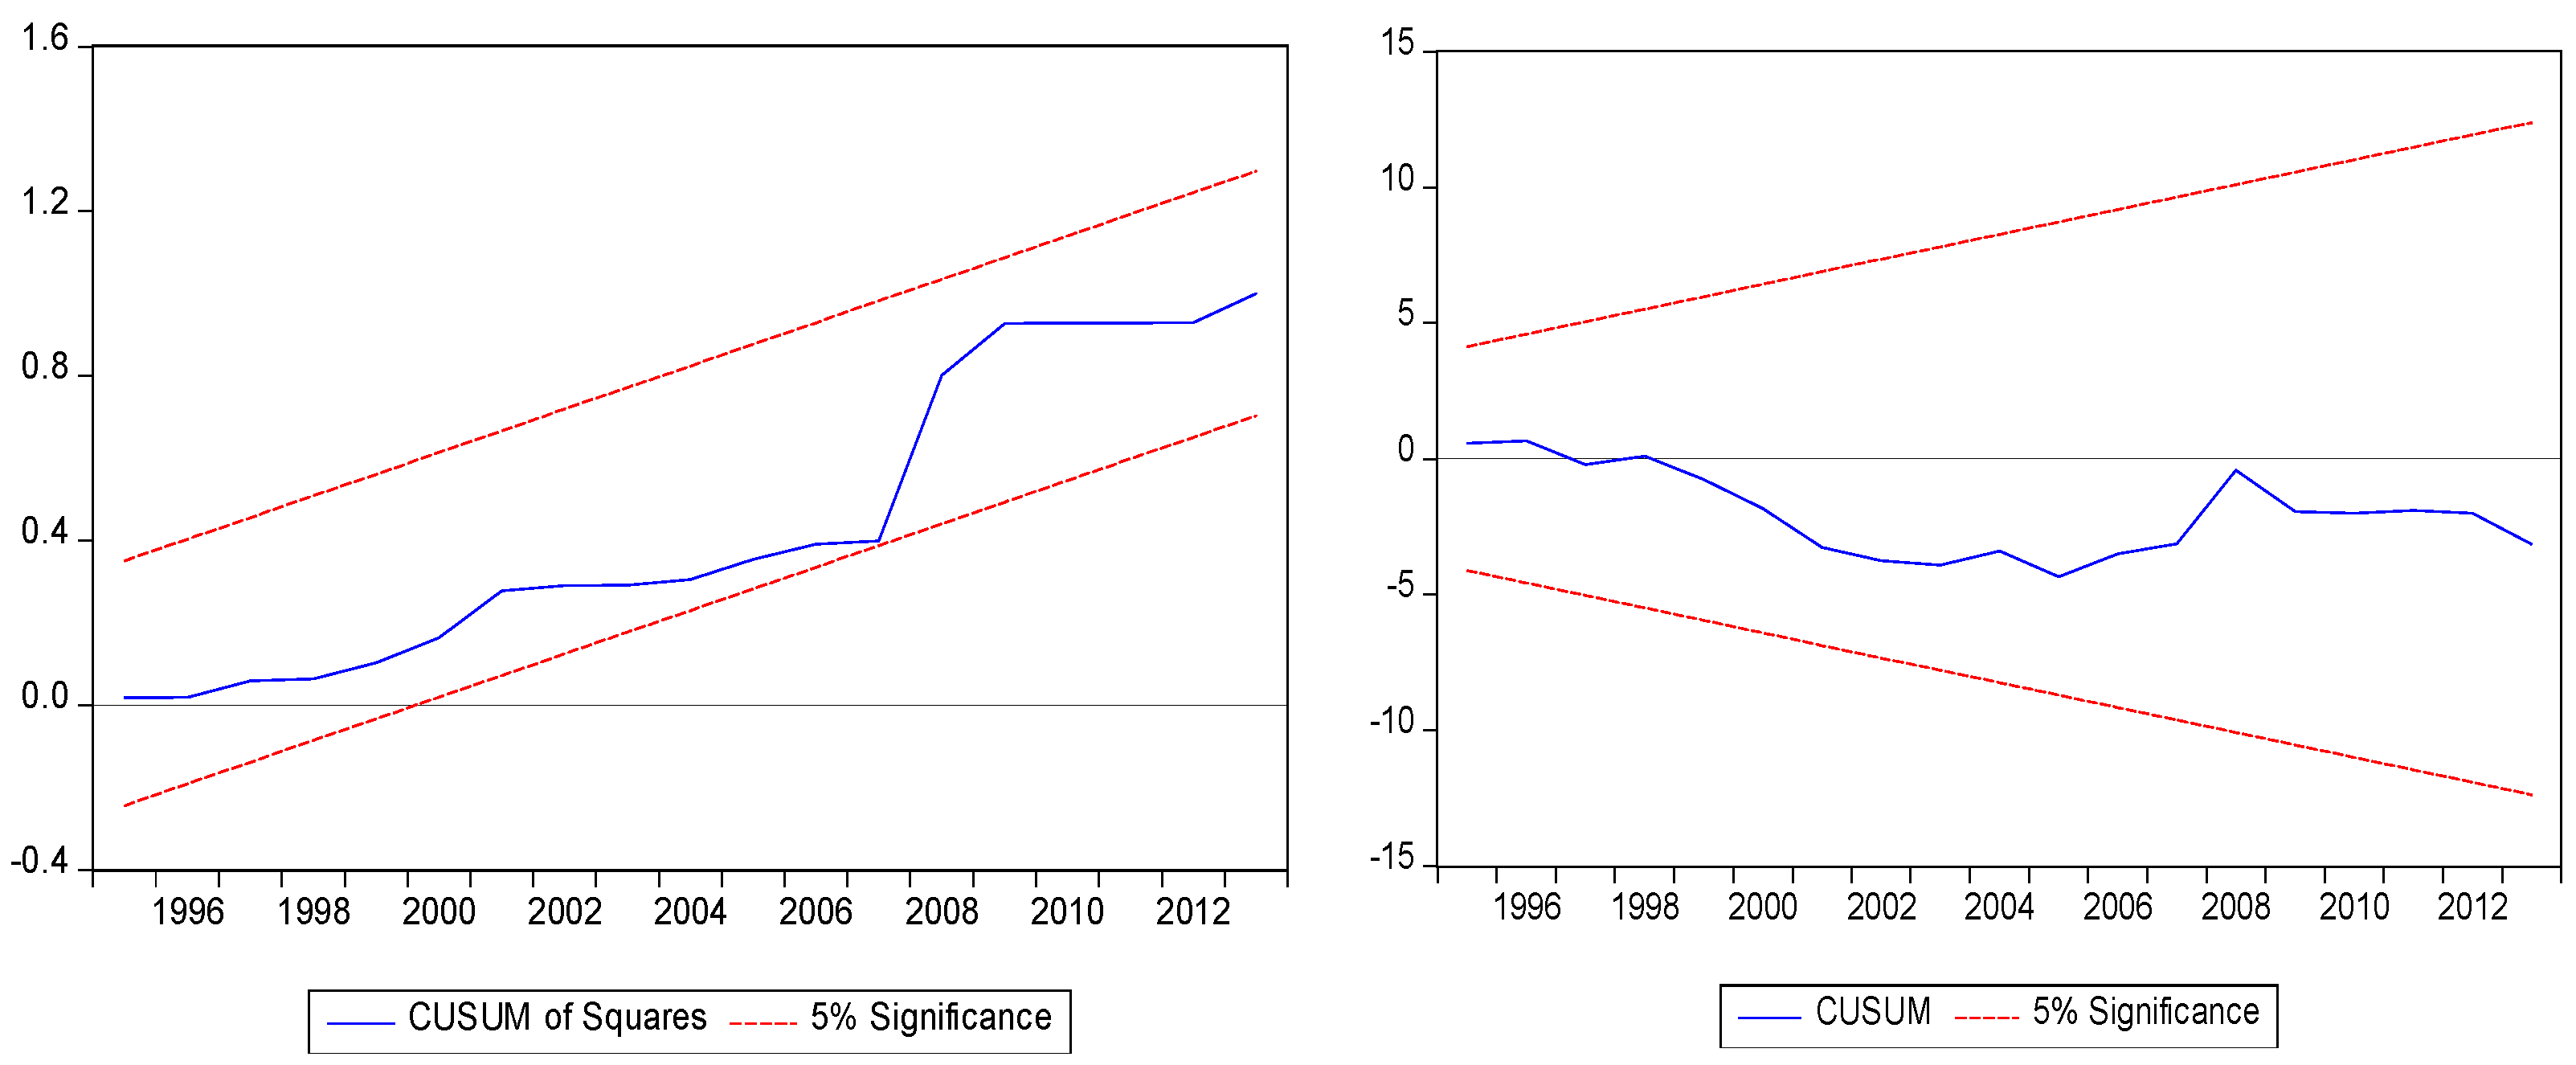
Figure 2.
CUSUM and CUSUMQ of model (2).
The long run equation of the food price in Saudi Arabia is generated and reported in Table 4. In the first model the NOGDP is used to generate the output gap, while the GDP gap was used in the second model. All the coefficients of potential explanatory variables in the long run have the expected sign. Both partial sums of positive and negative changes of oil price has statistically significant effect on food prices. The long run effect of oil price on food prices is in consistent with findings of Alghalith (2010), Baffes (2007) Ibrahim and Said (2012) and Ibrahim (2014). However, the results of our analysis indicate that this effect is economically important and higher in the case of Saudi Arabia compared to those conducted on other countries at (?) %. For example, the long run effect of oil price on food prices in Malaysia according to the study of Ibrahim and Said (2012) is 0.05%. In addition, the study of Ibrahim (2014) indicates the absence of oil price decline effect on food prices in Malaysia and the effect of oil price increases was only 0.06% for every 1% increase in global oil prices. Furthermore, the oil price pass through effect into world food prices is about 0.18% according to Baffes (2007). On the other hand, the studies of Alom et al. (2011), Esmaeili and Shokoohi (2011) and Zhang et al. (2010) found no evidence of long run effect of oil prices on food prices. This important effect of oil prices on food prices in Saudi has very important implication. It indicates that, being one of the top exporters of oil in the world, the pass through effect of oil price into Saudi food price stems not only from increasing the cost of imports but also from the Saudi economy’s heavy reliance on oil revenue. As we show previously the current expenditure is highly driven by the oil revenue which boosts consumer confidence and spending (Westelius, 2013). These results indicate the potential risks from oil price shocks on Saudi economy. Expenditure on foodstuffs accounts for substantial proportion of households' income and rising oil price have the ability to deteriorate their purchasing power.
The results show statistically significant asymmetry of oil price pass through into food prices, even though moderate in magnitude. It is shown that the increase in oil prices affect food prices more than oil prices' decreases. In other words, food prices display relatively rigid downward movements to the changes of oil prices. While a 1% increase of oil prices results in almost 0.32% increase on food prices, a 1% decline in oil prices results in 0.25% decline in food prices. This could indicate that there is some form of market power resistance which encourage food companies to be reluctant to transmit the decline of food prices to retail market (Chatham house, 2013; Ibrahim, 2014). However, it should be noted that the significant effect of negative oil price shocks on food prices indicate that the existence of market power is not strong enough to stop entirely the pass-through of negative changes in oil price to the food price in Saudi. Another potential reason for asymmetric oil price pass through is the asymmetric effect of oil revenue to current expenditure which is more related to the personal income.
Table 5.
The short run equations of food prices in Saudi Arabia.
| Variable | Model(1) | Model(2) |
|---|---|---|
| C | 7.391*** (0.613) | 7.087*** (0.611) |
| 0.317*** (0.032) | 0.326*** (0.032) | |
| 0.248*** (0.047) | 0.251*** (0.047) | |
| -0.764*** (0.135) | -0.705*** (0.168) |
Note: The numbers between the brackets are the values of standard error. The asterisks ***, ** and * denote the significance 1%, 5% and 10%, respectively.
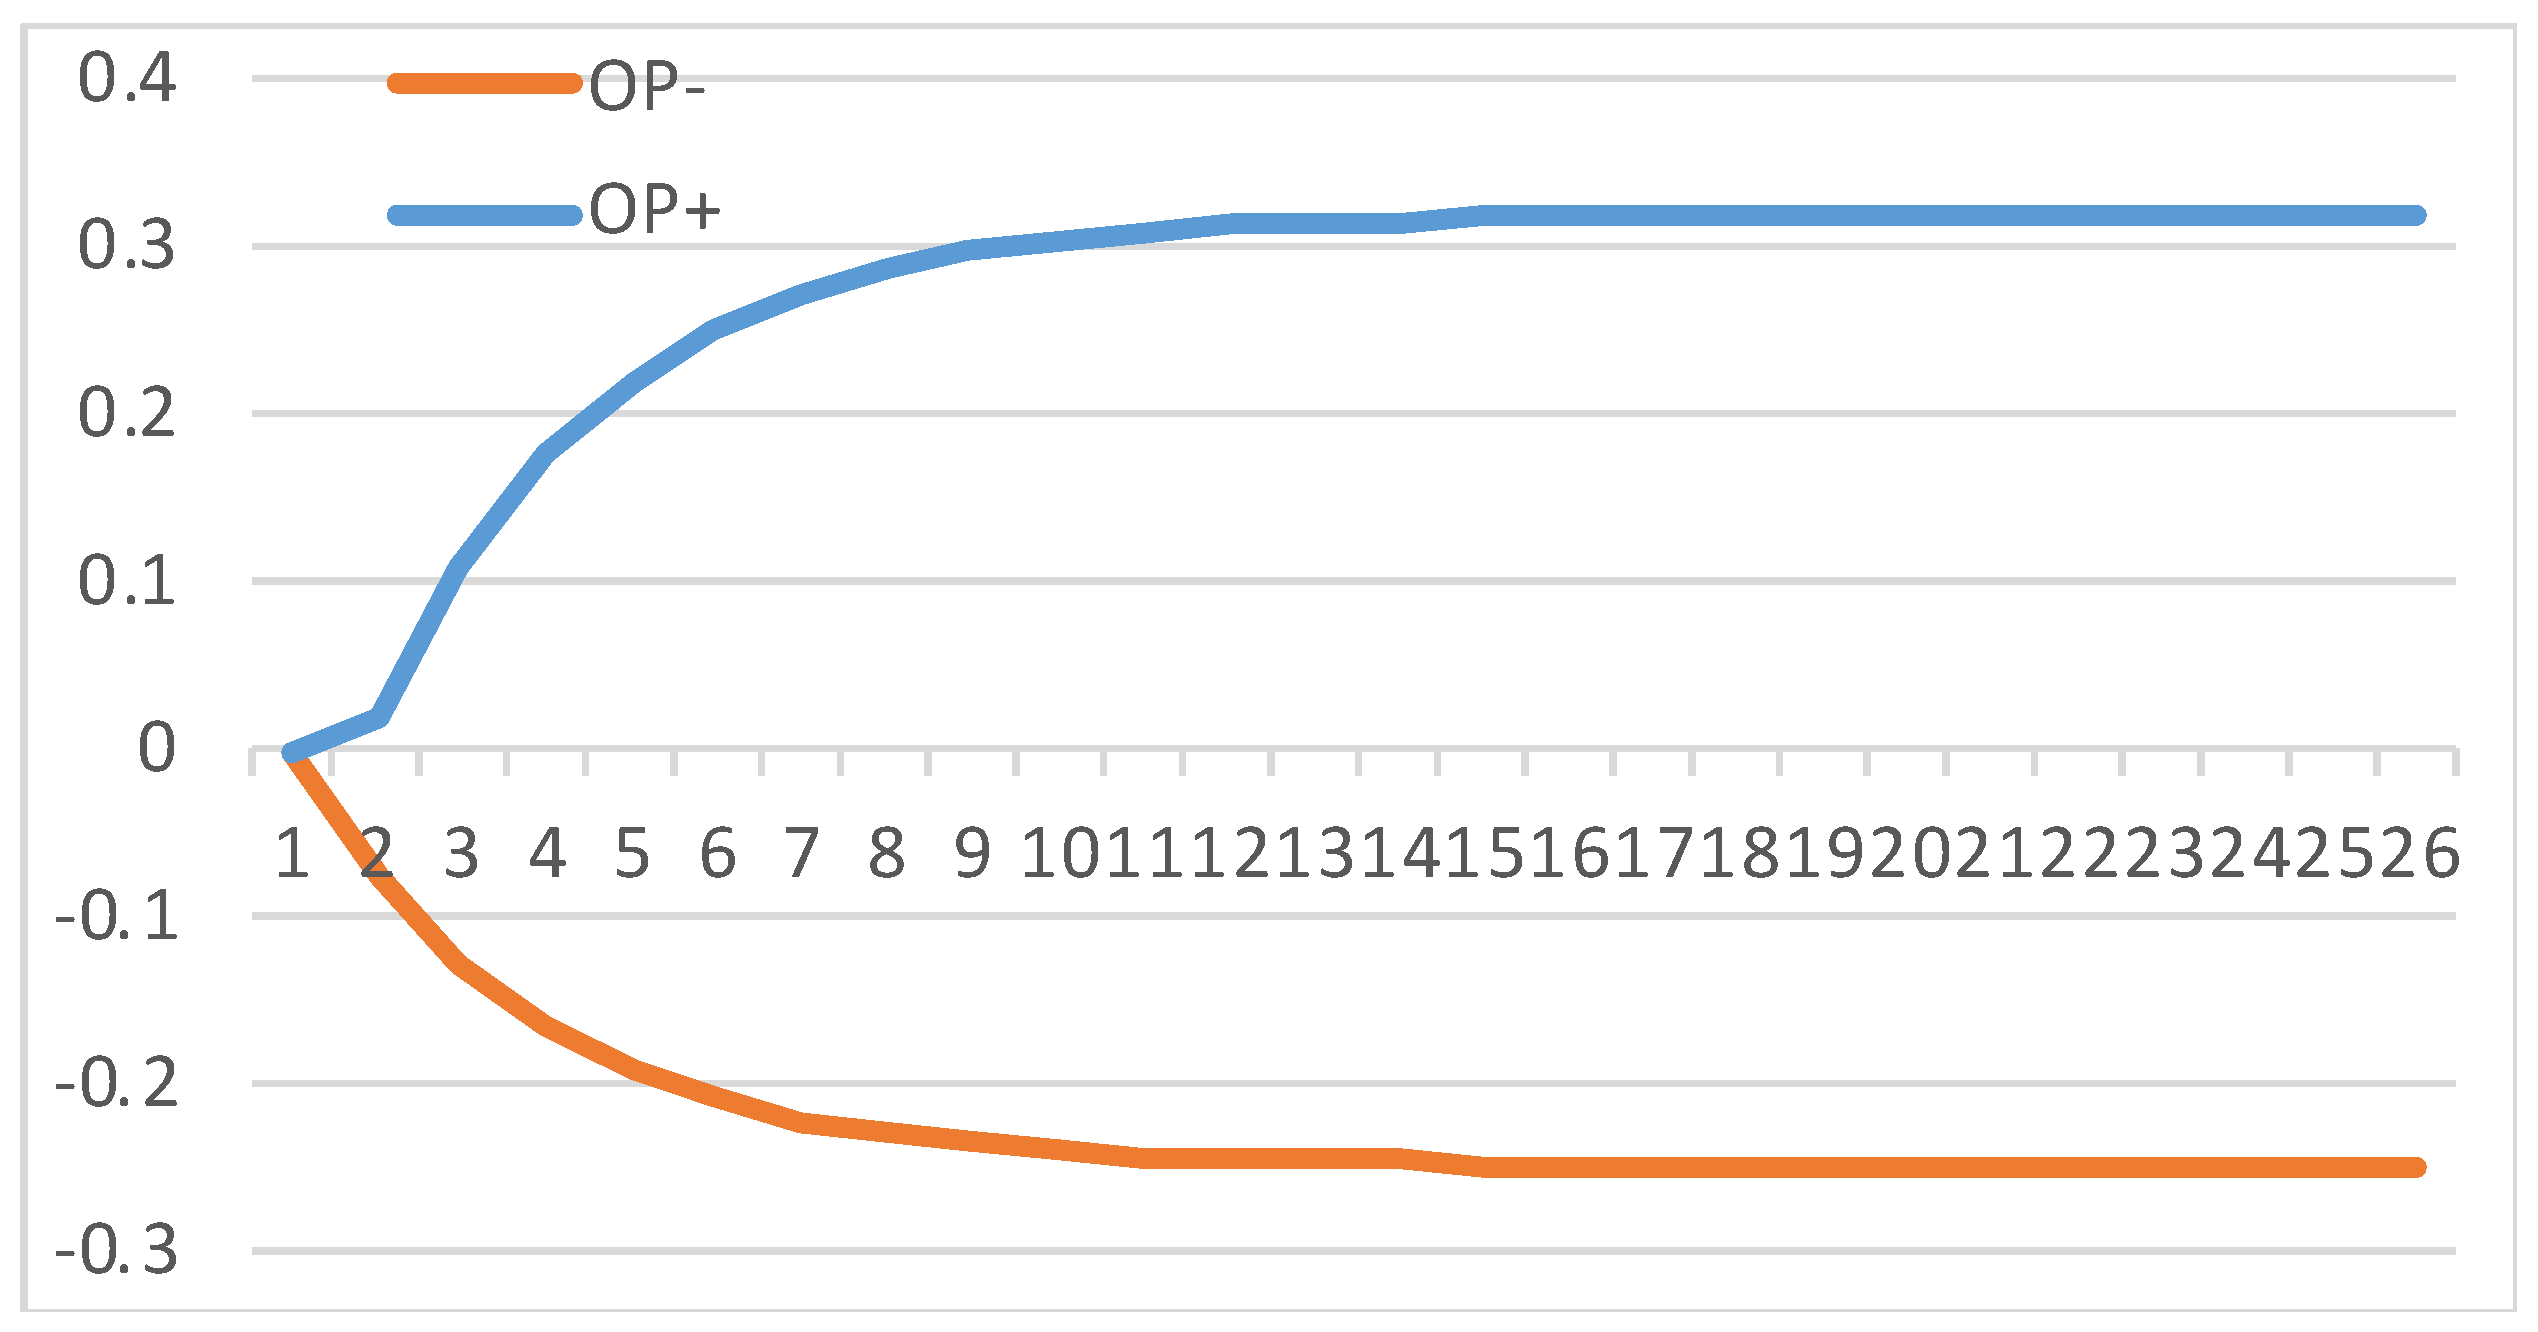
The dynamic multiplier of positive and negative oil price changes on food prices in Figure 4 also demonstrates this long run and short run asymmetric food prices' response to the changes of oil prices. While the prices of food after a positive shock in oil prices picks up from the second year according to model 1, the complete effect of oil price positive shock is felt between the eleventh to thirteenth year. Food prices also seem to respond immediately to the negative shock of oil prices. However, this response is relatively smaller than that in case of positive shocks.
The results of our study also show high pass through effect of exchange rate into food prices. In both models, the effect of this variable is significant and considerably high where 1% appreciation of Saudi Riyal generates an increase in food prices by almost 0.7% to 0.76%. This corresponds to the fact that the bulk of foodstuffs in Saudi markets are imported. The effect of exchange rate could also reflect the indirect effect of oil prices on movements in food prices (Nazlioglu and Soytas, 2011; Ibrahim and Chancharoenchai, 2013). There is negative correlation between oil price and US exchange rate (Lizardo and André, 2010). As Saudi Riyal is begged to US dollar an increase in oil price will lead to decrease the nominal effective exchange rate and thus increase the cost of importing foodstuffs. In fact, since most of the foodstuffs are final products, the high direct effect of exchange rate on these commodities not unexpected.
Figure 2.
The dynamic multiplier of positive and negative shocks of oil price on food prices.
As regards to the short run determinants of food prices, Table 5, demonstrates that output gap either measured by NOGDP or GDP has immediate positive impact on food prices. However, the effects of non-oil output gap and output gap for Saudi Arabia seems to differ in their magnitudes. Whilst 1% increases in non-oil output gap results in almost 0.16% immediate increase in domestic prices, 1% increases in output gap results in almost 0.064% increase in food prices. Giving that oil GDP accounts for considerable part of total GDP, the smaller than expected effect of GDP could be due to that oil GDP does not have a direct impact on private sector and has less impact on the food prices. Overall, the positive effect of output gap underlines the important role that large excess demand plays in food prices' instability and the existence of output-inflation trade off in the case of Saudi Arabia.
The absence of the persistence in food inflation is indicated by the insignificant effect of first lag difference of food prices. This may represents the Saudi government effort to secure food imports and subsidizes essential food commodities in order to mitigate the burden of the food price inflation. This effort is most notable in 2008 when the food markets witnessed dramatic increase in prices of food commodities (Chatham house, 2013). This argument is enhanced by the negative effect of oil price on food prices in the short run as the one year lagged difference of oil price as seen in Table 4.
In general, the results of food price analysis showed that oil price, devaluation of exchange rate and rise in excess demand have important role in explaining the recent hikes of food prices in Saudi Arabia. Given that these problems inflict real hardships on Saudi households, limit their ability to save and hence their ability to overcome other problems such as house ownership, our findings could be of high interest for policy makers.
5. Conclusions and Policy Implication
The objective of this study is to identify the relationship between oil price and food prices in Saudi Arabia in the context of the Phillips curve using annual data over the period 1979 -2020. To examine the potential effect of market power and public policy schemes on the asymmetric behavior of food prices in its response to the oil price, the NARDL model is used in this study. Despite government subsidies for fuel and foodstuffs, the results show the significant and asymmetric effect of oil prices on food prices. In addition, comparing the results of our study to the studies conducted on other economies, it is shown that this effect is high and significant in both cases downward and upward movement of oil prices. This indicates that while higher oil prices are beneficial on the revenue side as they led to greater revenue, they also entail a challenge for the Saudis economic welfare. This is primarily because Saudi Arabia imports the bulk of its food products and thus the domestic food price is vulnerable to the global food prices' sensitivity to the changes in oil price. Another factor to be considered is the effect of expansionary fiscal policy associated with an increase in oil prices and consequently, the aggregate demand.
In addition, with the Saudi riyal peg to the US dollar, the effect of oil prices increase on the US dollar infuses more pressure on food prices to rise during the increase in oil price. As the results show, the nominal effective exchange rate is an important factor in the food price equation. These results enhance the external channel of oil price's effect on food prices. Assuming that Saudi would keep maintaining its fixed exchange rate system, the capability of monetary policy to mitigate the inflationary pressure on food prices during the oil price increase is highly limited. In this case, the call is for the policy makers' attention to increase domestic food supply capabilities through the enhancement of agricultural productivity. Increasing domestic production of foodstuffs is expected to reduce the effect of external effect of oil prices on domestic food prices. In addition, to mitigate internal inflationary pressures associated with oil price shocks, the Saudi government should reassess its expansionary policy. The use of subsidies to contain inflation of essential foods must be balanced with the fiscal and efficient cost of subsidies. The evidence of asymmetric behavior of food prices in its response to oil prices; specifically, the downward rigidity of food prices, points towards the effect of market power on the behavior of retail food prices. This enhances the need for policy attention to contain market power.
Acknowledgments
This work was supported through the Annual Funding track by the Deanship of Scientific Research, Vice Presidency for Graduate Studies and Scientific Research, King Faisal University, Saudi Arabia [Project No……].
References
- Alghalith, M. (2010). The Interaction between Food Prices and Oil Prices. Energy Economics, 32 (6): 1520–1522. [CrossRef]
- Alsahafi, M. (2009), Linear and Non-Linear Techniques for Estimating the Money Demand Function: the Case of Saudi Arabia. Ph.D dissertation, University of Kansas.
- Baffes, J. (2007). Oil spills on other commodities. Resources Policy, 32(3), 126-134. [CrossRef]
- Basher, S. and Elsamadisy, E. (2011). Country Heterogeneity and Long-Run Determinants of Inflation in the Gulf Arab States, OPEC Energy Review, 36(2), 170-203.
- Basher, S., and Fachin, S. (2014). Investigating Long-Run Demand for Broad Money in the Gulf Arab Countries. DSS-E3 WP. [CrossRef]
- Baumeister, C., and Kilian, L. (2013). Do Oil Price Increases Cause Higher Food Prices? 59th Panel Meeting of Economic Policy, 1–66.
- British Petroleum. (2015). BP Statistical Review of World Energy June 2015, (June), 48.
- Cavallo, M. (2008). Oil Price and Inflation. FRBSF Economic Letter, 1–6.
- Cecchetti, S. G. (2000). Making Monetary Policy: Objectives and Rules. Oxford Review of Economic Policy, 16(4), 43–59. [CrossRef]
- Chatham House (2013), Global Food Insecurity and Implications for Saudi Arabia, Energy, Environment and Resources summary. A Chatham House report,April.
- Chen, S. (2009), Oil Price Pass-through into Inflation, Energy Economics, 31(1), 126- 133. [CrossRef]
- Clark, T. E., and Terry, S. J. (2010). Time Variation in the Inflation Pass through of Energy Prices. Journal of Money, Credit and Banking, 42(7), 1419–1433.
- Cunado, J., and Gracia, F. P, (2004). Oil Prices, Economic Activity and Inflation : Evidence for Some Asian Countries. Working Paper no 06 / 04.
- Dancy, J. (2012), Food Prices Mirror Oil Prices: The Crude Oil-FAO Food Price Index Price Correlation, Financial Sense, May 14. Edelstein.
- Delatte, A. L., and López-Villavicencio, A. (2012). Asymmetric exchange rate pass-through: Evidence from major countries. Journal of Macroeconomics, 34(3), 833-844. [CrossRef]
- Energy Information Administration. (2014). Country Analysis Brief : Saudi Arabia. http://www.eia.gov/beta/international/analysis_includes/countries_long/Saudi_Arabia/saudi_arabia.pdf, 1–19.
- Esmaeili, A., and Shokoohi, Z. (2011). Assessing the Effect of Oil Price on World Food Prices: Application of Principal Component Analysis. Energy Policy, 39(2), 1022-1025. [CrossRef]
- Gordon, Robert J. 1982. “Inflation, Flexible Exchange Rates, and the Natural Rate of Unemployment.” In Workers, Jobs and Inflation, ed. Martin N. Baily,89–158. Washington, DC: The Brookings Institution.
- Gordon, Robert J. 1990. “U.S. Inflation, Labor’s Share, and the Natural Rate of Unemployment.” In Economics of Wage Determination, ed. Heinz Konig, 1–34. New York: Springer-Verlag.
- Gregorio, J., Landerretche, O., and Neilson, C. (2007). Another Pass-Through Bites the Dust? Oil Prices and Inflation. Economía, 7, 155–196. [CrossRef]
- Hooker, M. A. (2002). Are Oil Shocks Inflationary? Asymmetric and Non-linear Specifications versus Changes in Regime, Journal of Money, Credit and Banking, 34(2), pp. 540-561.
- Ibrahim, M. H. (2015). Oil and Food Prices in Malaysia: a Nonlinear ARDL Analysis. Agricultural and Food Economics, 3. [CrossRef]
- Ibrahim, M. H., and Chancharoenchai, K. (2013). How Inflationary are Oil Price Hikes? A Disaggregated look at Thailand Using Symmetric and Asymmetric Cointegration Models. Journal of the Asia Pacific Economy, 19, 409–422. [CrossRef]
- Ibrahim, M. H., and Said, R. (2012). Disaggregated Consumer Prices and Oil Price Pass-through: Evidence from Malaysia. China Agricultural Economic Review, 4, 514–529. [CrossRef]
- Karimi, M., Kaliappan, S. & Matemilola, B. (2014). World Oil Price and Food Prices in US : Evidence from the Threshold Cointegration Models. The Empirical Economics Letters, 13(10).
- Lizardo, R. A., and Mollick, A. V. (2010). Oil price fluctuations and US dollar exchange rates. Energy Economics, 32(2), 399-408. [CrossRef]
- Lucas, R.E. Jr (1973), Some International Evidence on Output–Inflation Tradeoffs, American Economic Review, June.
- Nazlioglu, S., and Soytas, U. (2011). World Oil Prices and Agricultural Commodity Prices: Evidence from an Emerging Market. Energy Economics, 33(3), 488–496. [CrossRef]
- Pal, D., & Mitra, S. K. (2020). Time-frequency dynamics of return spillover from crude oil to agricultural commodities. Applied Economics, 52(49), 5426-5445. [CrossRef]
- Savard, K., and al (2010). Inflation in Saudi Arabia : Drivers , Trends , and Outlook (Vol. 1820).
- Scheibe, J., and Vines, D. (2005). A Phillips curve for China. CAMA Working Paper Series (No. 2/2005). Retrieved from http://economics.ouls.ox.ac. Uk.
- Shin, Y., Yu, B., and Greenwood-Nimmo, M. (2014). Modelling asymmetric cointegration and dynamic multipliers in a nonlinear ARDL framework. In Festschrift in Honor of Peter Schmidt (pp. 281-314). Springer New York.
- Wei. C, and Heng. Y, (2011). Oil Price Pass-through into CPI inflation in Asian Emerging Countries: the Discussion of Dramatic Oil Price Shocks and High Oil Price Periods. British Journal of Economics, Finance and Management Sciences, 2(1), 1–13.
- Yousif, I. A. K., and Al-Kahtani, S. (2013). Effects of high food prices on consumption pattern of Saudi consumers: A case study of Al Riyadh city. Journal of the Saudi Society of …, (November). [CrossRef]
| 1 | In the case of output gap we follow the study of Delatte and López-Villavicencio (2012) by treating output
gap as only short run determinant of food prices and include only the level and lagged level of this variable into
the equation. |
Disclaimer/Publisher’s Note: The statements, opinions and data contained in all publications are solely those of the individual author(s) and contributor(s) and not of MDPI and/or the editor(s). MDPI and/or the editor(s) disclaim responsibility for any injury to people or property resulting from any ideas, methods, instructions or products referred to in the content. |
© 2023 by the authors. Licensee MDPI, Basel, Switzerland. This article is an open access article distributed under the terms and conditions of the Creative Commons Attribution (CC BY) license (http://creativecommons.org/licenses/by/4.0/).
Copyright: This open access article is published under a Creative Commons CC BY 4.0 license, which permit the free download, distribution, and reuse, provided that the author and preprint are cited in any reuse.


