
Submitted:
14 June 2023
Posted:
15 June 2023
You are already at the latest version
Abstract
The Metropolitan Economic Freedom Index (MEFI) ranks cities based on their support of free market enterprise. In its current state, MEFI purports to measure three constructs (government spending, taxation, and labor market freedom) with three equally weighted variables for each one, assuming perfect substitutability of variables. This study investigates the statistical consistency of MEFI through Confirmatory Factor Analysis. Multiple models investigate current variable selection by providing a potentially better indicator of labor market freedom, aggregation assumptions by removing the requirements for fixed and equal weights, and statistical consistency by evaluating the fit between the data and models. Results indicate that the current MEFI model is not statistically consistent with the data, that weighting of variables should not be equal, that variable selection should be investigated, and that constructs should be re-imagined. The models investigated provide an initial starting point for redefining MEFI.
Keywords:
economic freedom
; factor analysis
; MEFI
; labor market
; government spending
; taxation
1. Introduction
Economic Freedom is largely thought to have a significant impact on economic growth and has been a staple of neo-classical policies, especially since the demise of the Soviet Union. However, economic freedom is not directly observable nor is it unidimensional. In a 1994 effort to measure economic freedom, the Heritage Foundation proposed the Index of Economic Freedom (IEF) as a function of four equally-weighted constructs: rule of law, government size, regulatory efficiency, open markets [1]. Each of these constructs were measured by three variables on a scale of 0 to 100. For ‘rule of law,’ measures include property rights, government integrity, and judicial effectiveness. ‘Government size’ is composed of government spending, tax burden, and fiscal health. ‘Regulatory efficiency’ includes business freedom, labor freedom, monetary freedom. Finally, ‘open markets’ measures trade freedom, investment freedom, and financial freedom [1].
A similar index, the Economic Freedom of the World (EFW) produced by the Fraser Institute [2] and has been in existence since 1996. This index measures size of the government, legal systems and property rights, sound money, freedom to trade internationally, and regulation but also uses a gender disparity adjustment [3].
These indices have promulgated to the state and province level with the introduction of the Economic Freedom of North America (EFNA) in 2002 [4]. This index measures government spending, taxes, regulation, legal system and property rights, sound money, and freedom to trade internationally using multiple subcomponents. Each area is equally weighted [5].
In 2012, Stansel (2012) proffered and economic freedom index for metropolitan areas (Metropolitan Economic Freedom Index-MEFI). This index now includes three areas (1. government spending, 2. taxation, 3. labor market freedom) with three variables each. Government spending is composed of general consumption expenditures by government, transfers and subsidies, and insurance and retirement payments (all as a percentage of personal income). Taxation includes income and payroll tax revenue, sales tax revenue, and revenue from property tax (again, all as a percentage of personal income). Finally, labor market freedom consists of minimum wage as a percentage of per capita income, government employment as a percentage of total employment, and private union density as a percentage of total employment [7]. All variables are equally weighted and scaled between 0 and 10. The mean of the variables produces a score for the metropolitan area. The advantage of the analysis at the metropolitan level is that the entirety of a local economy (including commuting zones) can be assessed.
All measures are focused on which variables to include but they seldom, if ever, test for consistency of the measures. In this paper, we examine different weighting methods, and examine one possible improvement in the measure of labor market freedom.
1.1. Index Validity
About half of the studies from 1966 through early 2022 associated with the EFW index show a positive correlation with positive outcomes such as economic growth, while 45% show no correlation. Roughly 5% found relationships with negative outcomes such as corruption [8]. The validity of this index is unestablished.
The utility of the Index of Economic Freedom (IEF) is also uncertain. IEF’s relationship with Foreign Direct Investments (FDI) is mixed [9,10]. It also appears to have heterogenous effects on economic growth [11,12,13,14].
All indices (IEF, EFW, EFNA, and MEFI) assume equally weighted components build measures of the constructs (e.g., government spending, taxation, labor market freedom). This assumption would suggest that each variable measuring each construct is a perfect substitute for each other. Yet, the weighting of the components should be evaluated rather than assumed [15]. Every part of any composite indicator (CI or index in this case) should be questioned, as there exists no panacea [16]. The basic formulation of a CI should include 1) defining the phenomenon to be measured, 2) selecting indicators, 3) normalizing the indicators, 4) aggregating the indicators, and 5) validating the composite indicator [17,18,19]. Steps 3 and 5 are missing from the literature for all measures of economic freedom mentioned in this study.
The IEF and EFW require validation and assessment of internal consistency with the data. Unfortunately, little effort to validate IEF and EFW measures appears in the literature. One study attempted to establish internal statistical consistency of the IEF using principal components and ‘benefit of the doubt’ methods. Principal components analysis (PCA); a method that generates linear combinations of the existing data to form a new set of orthogonal columns with the first column accounting for the majority of the variability, the second column accounting for the second most, etc.; suggested the existence of two constructs (rather than one measuring economic freedom) based on the IEF data [20]. The study found results that ‘differed dramatically with the baseline’ when PCA was applied. No confirmatory techniques such as Confirmatory Factor Analysis (CFA) were applied, and only existing variables were used. Variable selection and aggregation must be supported by the data to have a valid index.
1.2. Modeling Composite Indices
Development of composite score indices like the IEF, EFW, EFNA, and MEFI may be supported via exploratory factor analysis [23,24] or even structural equation modeling-confirmatory factor analysis (SEM-CFA) as recommended by [21]. SEM evaluates a model for economic freedom (a construct) as a function of latent and observed variables using a combination of confirmatory factor analysis (CFA) and regression (path analysis).
Indices for government corruption [25], economic performance [26], economic freedom and stock market development in Malaysia [27] have all been assessed by modeling using SEM. The 2019 EFW included an assessment of innovative entrepreneurship and the EFW latent and observed measures using ordinary least squares, two-stage least squares, and SEM [28]. Equally weighted and additive measures do not assess the validity of the selected measures and their consistency with construct measurement or the weights associated with the selected measures.
1.3. Purpose & Significance
This purpose of this study is to evaluate MEFI’s current construction and the consistency of that construction in terms of indicator selection, aggregation, and validation, items 2, 3, and 5 in index development [17,18,19]. Multiple models are investigated and compared based on these four criteria.
1.3.1. Indicator Selection & Appropriateness
The study proposes a replacement indicator for minimum wage restrictiveness factor of labor market freedom as part of model refinement. Instead of measuring minimum wage as a percentage of per capita income, we substitute the minimum hourly wage in the MSA divided by the 10th percentile wage for all occupations in the MSA, which should reflect binding effects of minimum wage better [29]. First, personal income includes sources other than hourly wages (or labor income at all, for that matter). Second, it is the lowest 10th percentile of wage earners that are earning the closest to the minimum wage and are the ones that would possibly earn at below minimum wage in absence of it. Thus, our measure of minimum wage restrictiveness should better reflect the impact on the local labor market than minimum wage as percentage of per-capita income. This study then investigates the indicator appropriateness of minimum wage as percentage of the 10th percentile hourly wage vs. minimum wage as percentage of per-capita income under the hypothesis that the former measure would also be more consistent in measuring the construct of labor market freedom.
1.3.2. Aggregation
Further, the research investigates aggregations that are additive linear (e.g., original MEFI) and weighted linear (e.g., factor analysis). The indicators for each area (government spending, taxation, and labor market freedom) are unlikely to be perfect substitutes for each other, so different methods of aggregation are required.
1.3.3. Validation
Data must be consistent with the models. This study investigates the validity of multiple MEFI models and compares them for appropriateness using factor analysis.
This is the first study of its type to formally investigate the construction of the MEFI. The results are used to re-rank the MSAs, conduct comparisons, and highlight the need for robust index development.
2. Materials and Methods
2.1. Data & Variables
We used the Stansel [7] dataset for 2017 MEFI data and joined the hourly percentile wage data from the Bureau of Labor Statistics (BLS) Occupational Employment and Wage Statistics [30] for the matching period as well as the state and federal minimum wage data scraped from the U.S. Department of Labor [31]. We also joined data from the American Community Survey (ACS) [32] as well as the Census Bureau shapefile [33] for mapping. For multistate MSAs, we simply merged across wages of the primary state in the MSA. Also, we joined regional personal income tables (Economic Profiles) by MSAs from the Bureau of Economic Analysis [34], labor employment statistics data (Table S2301) from the American Community Survey (ACS) [32], as well as the Census Bureau shapefile [35] for mapping. Matches were based on identical 5-digit Federal Information Processing Series (FIPS) codes. We mapped “Dayton, OH MSA” and “Prescott, AZ MSA” to “Dayton-Kettering, OH MSA” and “Prescott Valley-Prescott, AZ MSA,” respectively when merging EFI and BEA data as the FIPS codes were different.
Out of the 383 MSAs that were ranked by Stansel (2019), we matched 382 MSAs across the three key datasets with one exception, Twin Falls, Idaho. This MSA did not exist in BLS OEWS dataset and was therefore excluded from the analysis. Thirteen MSA names were the same across the three datasets, but FIPS codes were different in BLS OEWS, namely Bangor ME, Barnstable Town MA, Bridgeport-Stamford-Norwalk CT, Burlington-South Burlington VT, Hartford-West Hartford-East Hartford CT, Lewiston-Auburn ME, New Haven CT, Norwich-New London-Westerly CT-RI, Pittsfield MA, Portland-South Portland ME, Providence-Warwick RI-MA, Springfield, MA-CT and Worcester MA-CT. FIPS code were manually corrected to allow for matching between EFI-BEA dataset and BLS OEWS dataset. Furthermore, 2 MSAs in EFI and BEA datasets were called NECTA divisions in BLS OEWS, which we manually corrected also, namely Boston-Cambridge-Newton, MA NECTA Division and Nashua, NH-MA NECTA Division.
All standardized and raw measures from MEFI, as estimated by [7], were part of the dataset as well as population, population rank, and annual and hourly per wage estimates. One variable that we can construct from the merged data is the bindingness of minimum wage, measured by the effective minimum hourly wage in the MSA divided by the 10th percentile wage for all occupations in the MSA (which is the higher of federal or state minimum wage in which the MSA lies).
2.2. Software.
Some preprocessing of the data was performed in Stata Release 17 [36]. Exploratory data analysis (EDA), data cleaning, and variable creation were performed in R [37], and that code is available online [38]. SEM analysis of the MEFI and the alternative model were performed in JASP [39], which leverages the lavaan package in R [40].
2.3. Exploratory Analysis and Descriptives
EDA checked missing by both columns and then by row, removing only one observation, Twin Falls, Idaho, which had no direct match across data sets. Descriptive statistics and correlations were run. Repetitive variables (e.g., annual wage percentiles) were removed. Descriptive heat maps of the MEFI rankings as well as the lowest 10% wage income were generated.
2.4. Models
We compare six separate models of MEFI in this paper, M1 through M6.
- M1 is the baseline model (fixed, identical weights) proposed by [7].
- M2 is the baseline model substituting effective minimum wage divided by the 10th percentile of income for M1’s effective minimum wage as a percentage of per capita income
- M3 is M1 but with non-additive weights estimated by CFA.
- M4 is M2 with non-additive weights estimated by CFA.
- M5 is a new model built with constructs and indicators suggested by EFA.
- M6 is a new model built with constructs and indicators suggested by EFA.
2.5. Methods.
In this study, we estimate the baseline MEFI (M1) and the baseline MEFI with the effective minimum wage divided by the 10% hourly wage (M2) directly via aggregation, the current method used. This method assumes perfect substitutability of indicator variables and is unlikely to be consistent with the data.
M3 (optimized weights) and M4 (optimized weights with the effective minimum wage divided by the 10% hourly income) are then estimated via CFA using lavaan [40]. Since these models were built based on expert selection of the indicators, the data are likely to support the constructs to some extent but not perfectly
M5 and M6 (non-additive weights, different variable combinations per construct) are then built based on EFA of the data and reordering of the indicators into constructs based on that analysis. The construction of the new MEFI indicators is likely to improve fit consistency.
2.6. Factor Analysis
Both EFA and CFA are used in this research. Factor Analysis (FA) estimates the combination of each set of the three variables (e.g., S1A to S1C) to produce a single latent variable (e.g., P1). Equations 1-4 provide the FA optimization problem.
In Equation 1, X is the original data matrix (e.g., the three variables S1A through S1C), and M is the matrix of means for the original data set (each column has one repeated value that is the mean of the original matrix). Subtracting the two will center the data at zero. L is the loading matrix, the weights to be applied to the columns. F is the factor matrix, the new data formed by the weights, and the epsilon is the error matrix. Equation 2 specifies that the factor matrix must be independent of the errors, while Equation 3 requires the expected value (mean) of F to be zero, a constraint to prevent bias. Finally, equation 4 specifies that each column of the next matrix F must be orthogonal, although rotations may be oblique. The idea behind the rotations is to build simple groupings which build logical constructs.
3. Results
All analyses are available online (https://rpubs.com/R-Minator/1022322).
3.1. Descriptive Statistics
The cleaned data set included n=382 observations. Table 1 provides descriptive statistics for the directionally scaled and transformed primary variables of interest. The variables were scaled between 0 and 10 with 10 being indicative of more economic freedom.
The ‘average’ population of the MSA’s in 2017 was about 730,000 ± 1,653,812 with a 10th percentile hourly wage of $9.36 ± 0.85. The typical MSA earned a score of 6.74 ± 0.87 on the MEFI as a grand mean of the means of government spending (6.67 ± 1.08), taxation (6.16 ± 0.88), and labor market freedom (7.39 ± 1.20). Insurance and retirement payments earned the lowest average score (4.24 ± 2.02) in the government spending category, while payroll tax revenue (4.81 ± 2.81) and private union density (6.37 ± 2.76) recorded the lowest scores for taxation and labor market categories, respectively.
Each of the measures associated with MEFI theoretically exists on the domain [0,10]; however, a quick view of some of the variable ranges indicates that transfers & subsidies, insurance & retirement payments, and sales tax revenue have truncated ranges. Transfers & subsidies exist on the smallest range, between 5.56 and 9.74, providing less discrimination due to the additive weights of MEFI.
3.2. Correlations
Figure 1 depicts a hierarchically-clustered correlogram for the primary variables of interest.
In Figure 1, the ‘X’ in the blocks indicate no statistically significant correlation (p≥0.05). The intensity of the green and red indicate the degree of correlation, positive and negative, respectively. From this correlogram, one can see that the MEFI scores (higher = better) are scaled in the same direction. Union density has the strongest relationship with the MEFI score (r=0.74, p<.05), followed closely by government insurance and retirement payments (r=0.70, p<.05). Interestingly, minimum wage per capita and the 10th percentile hourly wage share the same correlation magnitude and direction with the MEFI score (r=-0.46, p<.05). These two variables have a slightly positive correlation between themselves (r=0.20, p<.05).
3.3. Heat Maps
Heat maps of the MSAs for MEFI-ranking were generated in leaflet [41] and posted online. Figure 2 depicts the original MEFI rankings.
The figure depicts that the MSAs on the West coast and the Northcentral and Northeastern United States hold lower rankings in general than the Southcentral and Southeastern United States.
3.4. M1 (MEFI) and M2 (MEFI with 10% Hourly Wage)
As a simple first investigation, we evaluate the original MEFI scores (M1) and the MEFI scores after replacing minimum wage as percentage of per-capita income (scored between 0 and 10) with minimum wage as percentage of 10% hourly wage income (scored between 0 and 10). The reason for this substitution is again that the minimum wage is binding only in low-wage metropolitan areas [29]. M1 and M2 both assume equal weights of the variables. This substitution points to the issue of underlying variable selection associated with index creation. The selection of variables for indices is one of the most essential elements, and improvements based on theory should be investigated. Figure 3 depicts the original Stansel model for MEFI with fixed weights. Table 2 provides the rankings produced from both M1 and M2.
In Table 2, 9 of the 10 top-rated municipalities are identified by both models with slightly different ordering. In M1, North Port Sarasota-Bradenton, Florida, appears whereas M2 lists Manchester-Nashua, New Hampshire. The bottom 10 have more differentiation. M1 includes Glens Falls, New York; Kahului-Wailuku-Lahaina, Hawaii; and Binghamton, New York; while M2 includes Yuba City, California; Modesto, California; and Fresno, California. Both models rank Naples-Immokalee-Marco Island, Florida, as the freest and El Centro, California as the least free. However, both models assume additive scores.
The problem with both M1 and M2 is that there is no determination of the congruence of the data with the model. Each list provides information that likely measures certain elements of economic freedom; however, which variables are most congruent with measuring the proposed constructs of government spending, taxation, and labor market freedom.
To address the issue of model specification and its congruence with the data, CFA was performed. CFA for M1 and M2 (fixing the weights as illustrated in Figure 4) suggested that neither model was an appropriate fit for the data (the null is that the model is specified correctly, p<0.001 for both Chi Square tests after scaling). More fit metrics for these models are discussed later.
3.5. Confirmatory Factor Analysis (CFA) for M3 and M4
Models 3 and 4 (M3 and M4) were identical to M1 and M2 respectively with the exception that weights were not fixed but rather derived from the data. Models for M3 and M4 are shown in Figure 4.
In Figure 4, government spending, taxation, and labor market freedom are endogenous latent variables. The individual variables composing each one of these latent variables are X1A through X3C. X1A through X1C include general consumption expenditures by the government, transfers and subsidies, and insurance and retirement payments, all measured as a percentage of income. X2A through X2C consists of income and payroll tax revenue, sales tax revenue, and revenue from property tax, also measured as a percentage of income.
Figure 4.
Models M3 (top) and M4 (bottom).
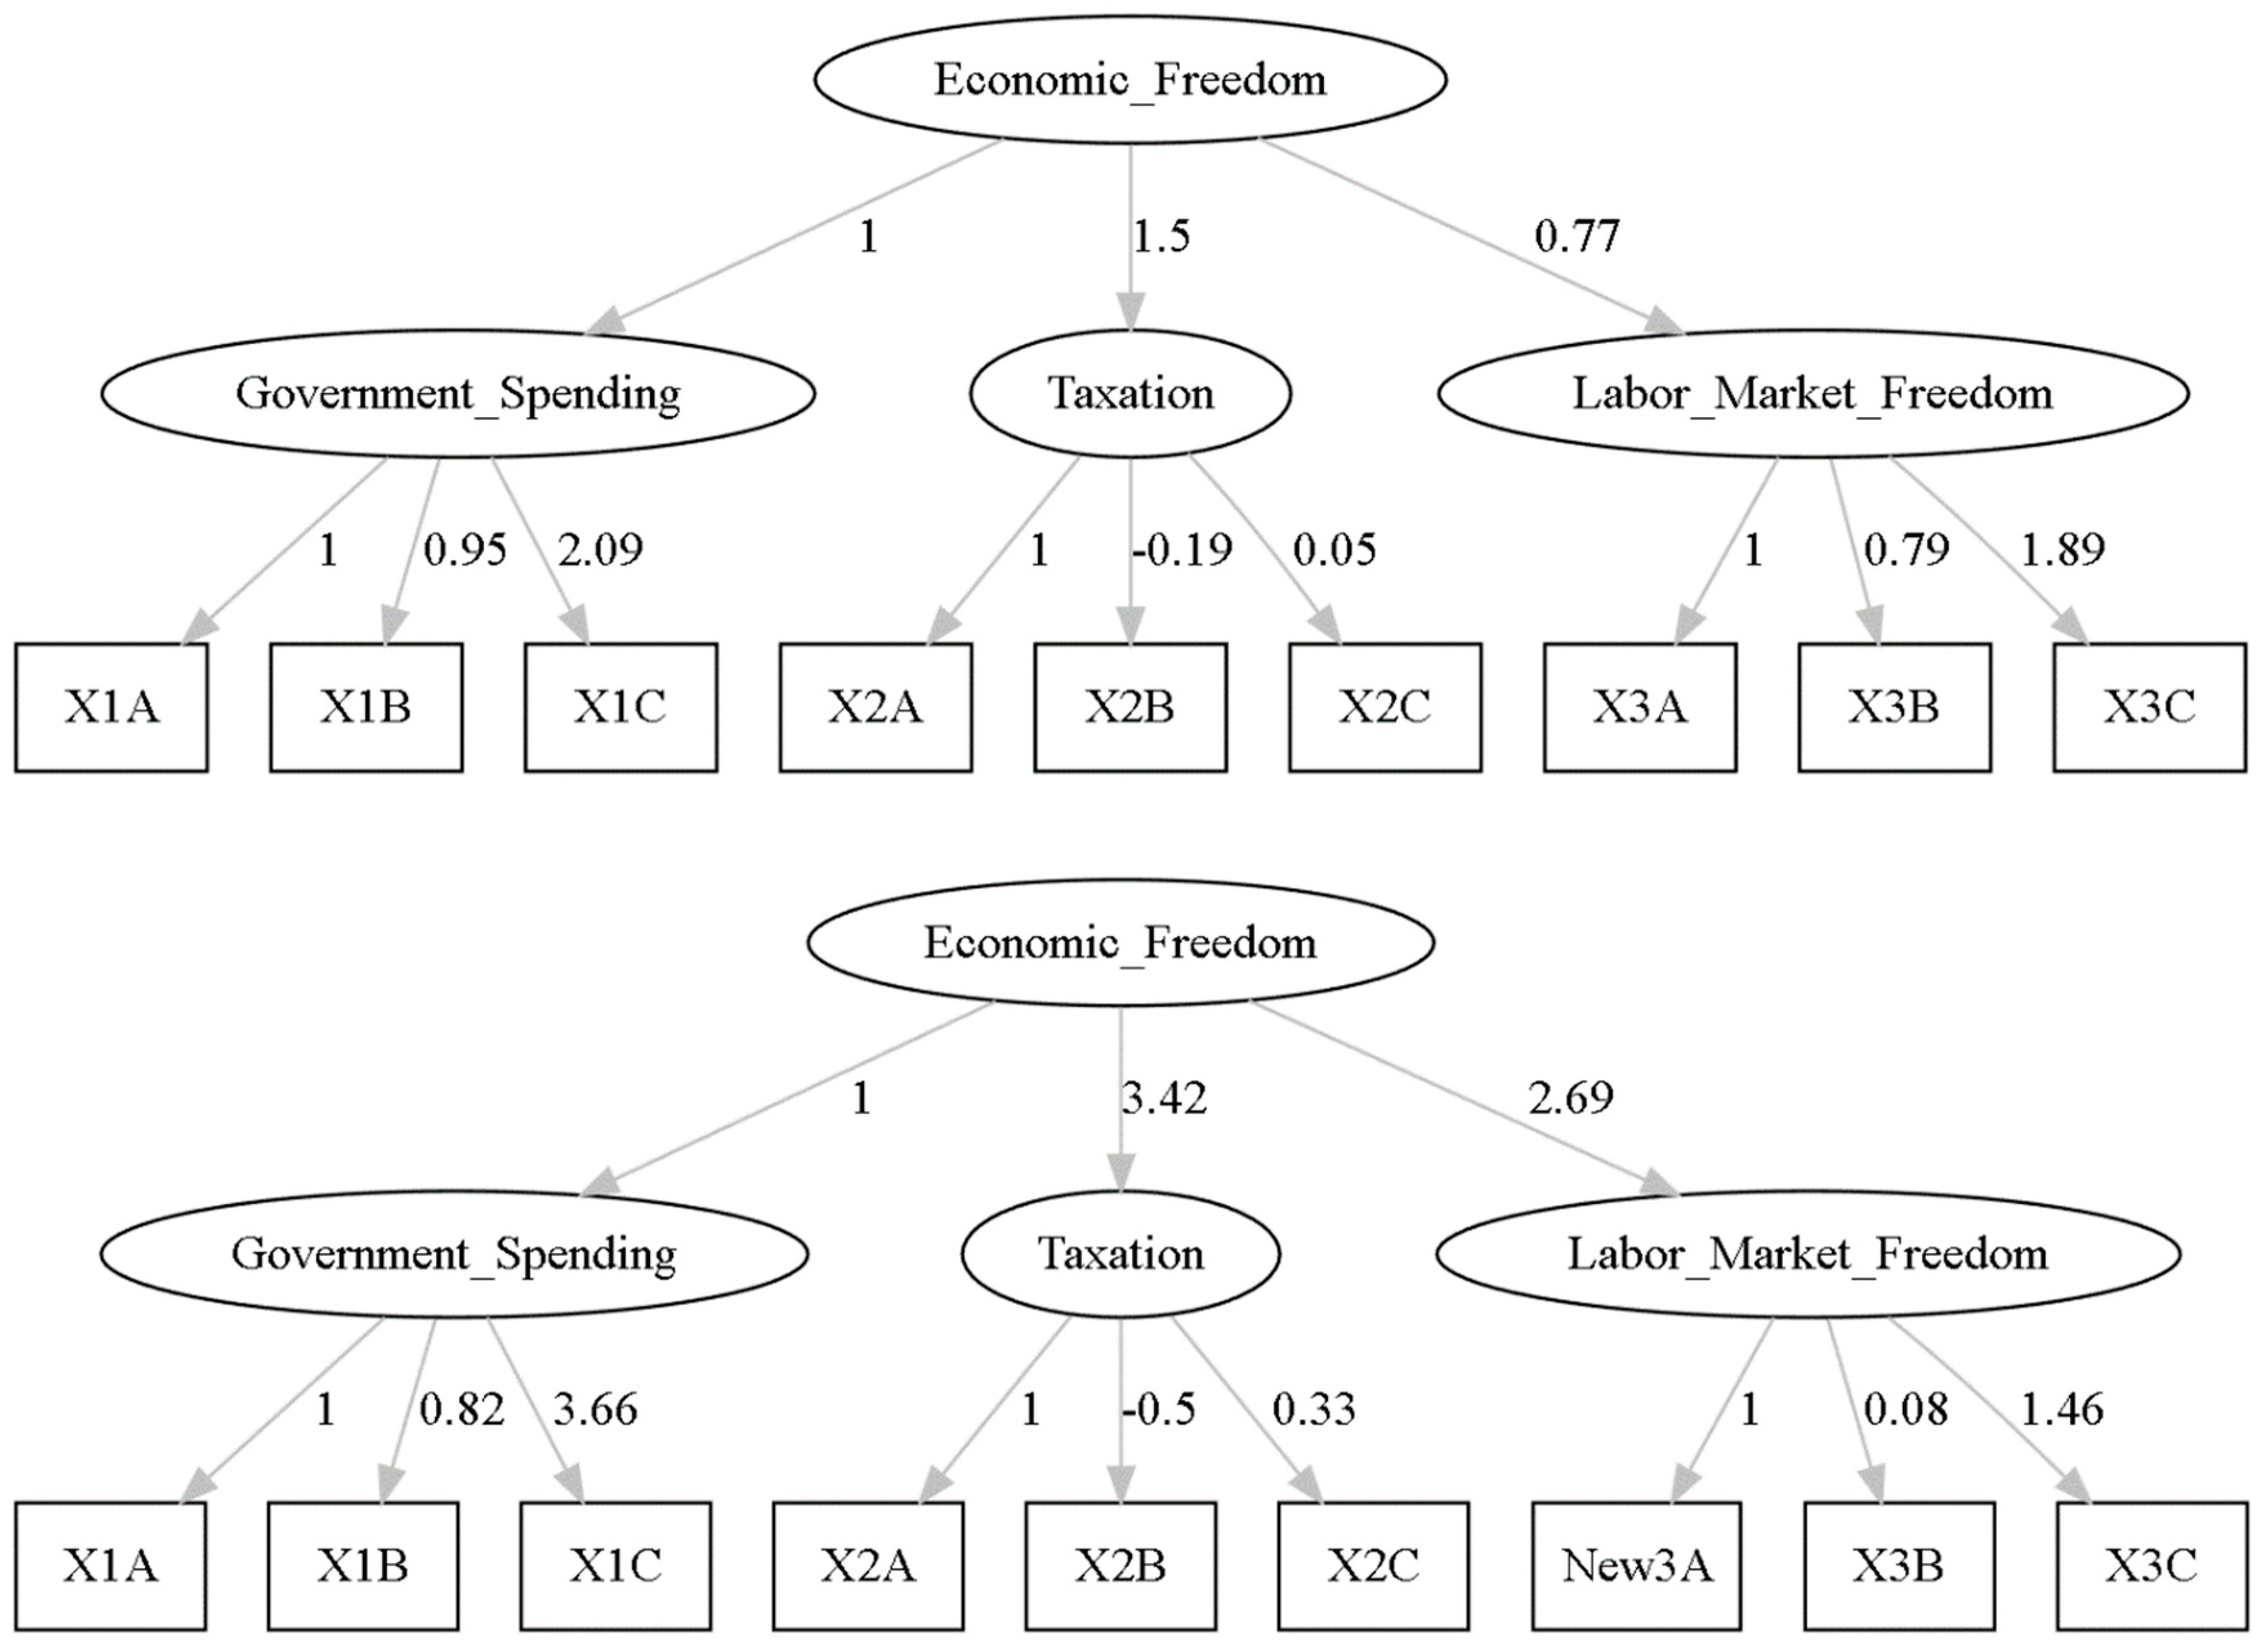
For M3, X3A through X3C includes minimum wage as a percentage of per capita income, government employment as a percentage of total employment, and private union density as a percentage of total employment. The only difference for M4 is that X3A is substituted with New3A, defined as the minimum wage as a percentage of the 10th hourly wage.
Again, neither model specification is consistent with the data (p<0.001 for both Chi Square tests). Allowing only for weight optimization did not fix the model specification issue. Additional fit metrics are again forthcoming.
3.6. Exploratory Factor Analysis (EFA)
While both M3 and M4 fail in terms of expected performance, they point towards the need to redefine the model specification, as weighting alone did not fix the problem. Exploratory Factor Analysis (EFA) with orthogonal, varimax rotations were performed to regroup the existing data based on where they congruently measured the underlying constructs of government spending, taxation, and labor market freedom. The varimax rotation assigns variables to factor such that the largest sum of the variance of the squared loadings is captured while still retaining orthogonality [42]. EFA varimax rotations for 1) the original MEFI variables and then 2) the MEFI variables with minimum wage divided by per capita income substituted with minimum wage divided by the 10th percentile income were performed to evaluate construct redefinition associated with the data.
3.6.1. EFA for the Original Variables.
For the original MEFI variables, EFA with varimax rotation found three primary factors (accounting for 50.7% of the variability of the data. Table 3 provides the factor loadings greater than 0.4.
From Table 3, the original grouping of variables from MEFI does not seem to support the proposed constructs. Factor 1 includes government employment, government consumption expenditures, state minimum wage, and transfers and subsidies into a single partitioned construct which reflects government involvement. Factor 2 includes the variables of income/payroll and sales tax, which reflects taxation. The trade-off between income/payroll tax and sales tax is reflected by their different directionalities. Factor 3 may reflect private and government worker and retiree protections with two variables: union density and government and insurance/retirement programs. Revenue from property tax appears to be superfluous.
3.6.2. EFA for the Modified Variable Set (per capita income replaced with 10th percentile Hourly Wage Income)
Table 4 provides the EFA factor loadings (greater than 0.4, varimax rotation) for the modified MEFI. The three factors accounted for 54.2% of the variance of the data.
In Table 4, Factor 1 includes government consumption expenditures, government employment, and government transfers and subsidies. This construct seems to be one associated with government involvement. Factor 2 includes income/wage tax revenue and sales tax revenue and logically represents taxation. Factor 3 includes union density, 10th percentile of hourly wage, and government insurance and retirement payments. These logically group under working and retired wage/income factors. Again, revenue from property tax is not in the model and income/wage tax revenue and sales tax are of opposite directions.
Overall, both the MEFI and the modified MEFI EFA suggest different groupings of the MEFI variables. Further, the analysis suggests that the inclusion of sales tax may not be needed.
3.7. M5 and M6 CFA
Using the recommendations from the EFA, two additional models were built and evaluated. M5 was based on the original variables, regrouped to represent different constructs, and M6 was based on the modified MEFI, also regrouped. Figure 5 depicts both M3 and M4.
Both M5 and M6 model specifications still suggest model mis-specification (p<0.001 for both); however, an investigation of fit metrics showed much improvement (forthcoming). Nonetheless, the implication is that one or measure selection requires additional effort.
3.8. Fit Metrics for all Models
All models were compared for fit based on multiple metrics. These metrics are shown in Table 5 and include the Comparative Fit Index (CFI), the Tucker-Lewis Index (TLI), and the Root Mean Squared Error of Approximation (RMSEA). None of the models as specified meets the benchmarks; however, M5 and M6 provide vast improvements in consistency.
The Comparative Fit Index (CFI) measures the fit of the model from 0 to 1 (perfect fit) based on assessing the ratio of misspecification for the model (e.g., M3 or M4) versus a baseline model (all observed variables are uncorrelated). A reasonable value for CFI is (at a minimum) above 0.90 depending on the data and the model. Both M5 and M6 meet the benchmark. Equation 5 provides the CFI calculation [43]. In this equation, and represent the mis-specification for the model (index m) and the baseline model (index b which assumes uncorrelated variables), respectively, as , and so the comparative difference should be zero. The mis-specification ratio is then subtracted from 1 to generate an estimate of the model fit.
The Tucker-Lewis Index (TLI) is shown in Equation 6 [44]. In Equation 6, the Chi-Squared Distribution for either model divided by its degrees of freedom is at most equal to one for a perfect fitting model given . Thus, a perfect alternative model versus a baseline model with would result in a numerator of (k-1)/(k-1) = 1. Target values should be at least better than 0.9 [45]. Only M5 meets this benchmark.
The Root Mean Squared Error of Approximation (RMSEA) is estimated via Equation 7 [46]. In this equation, the numerator becomes zero for well=fitting models based on the definition of expectation for the Chi Squared random variable. Values below 0.08 are often sought [47]. M5 meets this benchmark.
The Standardized Root Mean Squared Residual (SRMSR) is square root of the average of the squared standardized residual variances and covariances as shown in Equation 8 [48]. In this equation, the represents the standardized residual variances and covariances, which is the number of non-redundant variances and covariances, and the inner product thus produces the sum of squares. A perfect model would result in the SRMSR equal to 0. Values under 0.08 are generally considered to represent a good model fit [49]. M5 meets this metric.
Tests of the null hypothesis that the model specification fit the data universally fail for all models. This finding would suggest that additional exploration of variables, rotations, etc. are necessary to improve the MEFI. The best performing models, M5 and M6, still fall short of meeting benchmark expectations.
3.9. Ranked Scores
All models are used to rank each of the 382 municipalities in this study. The top 10 and bottom 10 rankings are shown in Table 6 and Table 7, respectively.
The 60 top-10 ranked municipalities in Table 6 represent only 23 unique municipalities, implying possible significant rank correlation. Of those 23 unique municipalities, 2 are from Alaska (frequency=2 rankings), 11 from Florida (41 rankings), 1 from New Hampshire (4 rankings), 1 from Tennessee (1 ranking), and 8 from Texas (12 rankings).
The 60 bottom-10 ranked municipalities in Table 7 represent only 30 unique municipalities, again suggesting significant rank correlation. Of these unique municipalities, 11 are from California (37 rankings), 2 from Hawaii (3 rankings), 1 from Kentucky (1 ranking), 3 from Minnesota (3 rankings), 1 from Minnesota/Wisconsin (1 ranking), 1 from New Mexico (1 ranking), 4 from New York (4 rankings), 1 from New York/New Jersey/Pennsylvania (3 rankings), 5 from Oregeon (5 rankings), and 1 from South Dakota (2 rankings).
Spearman’s rank correlation of all rankings illustrated positive and statistically significant correlations (p<-.01 correlated with r-values between 0.6 and 0.97). Figure 6 provides the correlogram.
4. Discussion
Modeling indices for economic freedom of municipalities might be improved by using index development methods that include 1) defining the phenomenon to be measured, 2) selecting indicators, 3) normalizing the indicators, 4) aggregating the indicators, and 5) validating the composite indicator [17,18,19]. Using a variety of methods, we conclude that while MEFI provides a reasonable starting point for categorizing economic freedom, better data and models might be developed.
In this study, we evaluated six different structural equation models for generating MEFI rankings given the definition of economic freedom established by Stansel [7]. M1 and M2 were built to be aggregate models that summed indicators scaled between 0 and 10. This method assumes that all variables are perfect substitutes for each other, yet the entirety of the range was not used for some variables, which reduces their contribution to the score.
M2’s substitution of the effective minimum wage divided by the 10th percentile of income was theoretically an improvement, but evidence of such an improvement without mathematical investigation did not exist. Still, indicator selection requires both expert input and theoretical knowledge, and theory would indicate that this variable was an improvement over using the minimum wage itself. Measuring minimum wage as a percentage of per capita income may not be binding for some localities due to labor shortages since wages may already exceed the minimum. The 10th percentile of hourly wage is a logical substitute [29].
M3 and M4 removed the equal weighting restriction of M1 and M2 and investigated the underlying model specification using CFA. Neither one of these models performed up to benchmark standards.
M5 and M6 leveraged EFA to find out logical variable groupings (constructs) and modified the original constructs of the MEFI to be congruent with measurement. Using the re-grouped indicators resulted in models that were closer to benchmark scores but that still required refinement.
Comparing all models revealed statistically significant score correlations of the same direction. Further rankings of the models were congruent, identifying only 23 unique, top-10 municipalities and 30 unique bottom-10 municipalities. Florida and Texas were most represented in the 23 unique, top-10 municipalities (18 out of 21), while California, Oregon, and New York ruled the bottom-10 list (21 out of 30).
5. Conclusions
Index generation requires statistical rigor. MEFI might be improved with scrutiny, selection, normalization, weighting, aggregation of variables, and the addition of new measures. Validation of any index is an important part of the process. Knowing whether the constructs selected are being measured congruently is vital.
This research demonstrates an algorithmic method for improving the MEFI. More time should be spent on defining constructs and variables as well as selecting the best measures for inclusion. Still, the research suggests that given various models, the original MEFI rankings are still useful.
Supplementary Materials
None.
Author Contributions
Conceptualization, A.T. & A.S.; methodology, A.S. & L.F.; software, L.F.; validation, A.T. & A.S..; data curation, A.T. & L.F. writing—original draft preparation, L.F., A.S., A.T. All authors have read and agreed to the published version of the manuscript.
Funding
This research received no external funding.
Data Availability Statement
Data and analysis are available at https://github.com/dustoff06/Economic-Freedom and https://rpubs.com/R-Minator/lavaan.
Conflicts of Interest
The authors declare no conflict of interest.
References
- Heritage Foundation About the Index. Available online: https://www.heritage.org/index/about (accessed on 24 March 2023).
- Stansel, D.; Torra, J.; McMahon, F. Dean Stansel, José Torra & Fred McMahon-Economic Freedom Of. 2020.
- Fraser Institute Economic Freedom of the World: 2022 Annual Report; 2022;
- Karabegović, A.; McMahon, F.; Samida, D. Economic Freedom of North America; Fraser Institute Vancouver, 2002;
- Stansel, D.; Torra, J.; McMahon, F. Economic Freedom of North America 2016; Fraser Institute Vancouver, 2016;
- Stansel, D. An Economic Freedom Index for US Metropolitan Areas. Journal of Regional Analysis and Policy, Forthcoming 2012.
- Stansel, D. Economic Freedom in US Metropolitan Areas. Journal of Regional Analysis & Policy 2019, 49, 40–48. [Google Scholar]
- Lawson, R. Economic Freedom in the Literature: What Is It Good (Bad) For? Economic freedom of the world 2022, 187. [Google Scholar]
- Economou, F. Economic Freedom and Asymmetric Crisis Effects on FDI Inflows: The Case of Four South European Economies. Research in International Business and Finance 2019, 49, 114–126. [Google Scholar] [CrossRef]
- Shkiotov, S.V. The Impact of the Level of Economic Freedom on the Socio-Economic Development of National Economies: The Eurasian Economic Union Countries. JOURNAL OF REGIONAL AND INTERNATIONAL COMPETITIVENESS 2022, 3, 34–34. [Google Scholar] [CrossRef]
- Al-Katout, F.; Bakir, A. The Impact of Economic Freedom on Economic Growth. International Journal of Business and Economics Research 2019, 8, 469–477. [Google Scholar] [CrossRef]
- Brkić, I.; Gradojević, N.; Ignjatijević, S. The Impact of Economic Freedom on Economic Growth? New European Dynamic Panel Evidence. Journal of Risk and Financial Management 2020, 13, 26. [Google Scholar] [CrossRef]
- Santiago, R.; Fuinhas, J.A.; Marques, A.C. The Impact of Globalization and Economic Freedom on Economic Growth: The Case of the Latin America and Caribbean Countries. Economic Change and Restructuring 2020, 53, 61–85. [Google Scholar] [CrossRef]
- Thuy, D.T.B. Impacts of Economic Freedom on Economic Growth in Developing Countries. Global Changes and Sustainable Development in Asian Emerging Market Economies Vol. 1: Proceedings of EDESUS 2019 2022, 35–44.
- Schlossarek, M.; Syrovátka, M.; Vencálek, O. The Importance of Variables in Composite Indices: A Contribution to the Methodology and Application to Development Indices. Social Indicators Research 2019, 145, 1125–1160. [Google Scholar] [CrossRef]
- Terzi, S.; Otoiu, A.; Grimaccia, E.; Mazziotta, M.; Pareto, A. Open Issues in Composite Indicators. A starting point and a reference on some state-of-the-art issues 2021, 3. [Google Scholar]
- Commission, J.R.C.-E.; others Handbook on Constructing Composite Indicators: Methodology and User Guide; OECD publishing, 2008;
- Mazziotta, M.; Pareto, A. A Non-Compensatory Approach for the Measurement of the Quality of Life. Quality of life in italy: Research and reflections 2012, 27–40. [Google Scholar]
- Salzman, J. Methodological Choices Encountered in the Construction of Composite Indices of Economic and Social Well-Being; Centre for the study of living standards, 2003;
- Dialga, I.; Vallée, T. The Index of Economic Freedom: Methodological Matters. Studies in Economics and Finance 2021, 38, 529–561. [Google Scholar] [CrossRef]
- Cavicchia, C.; Vichi, M. Statistical Model-Based Composite Indicators for Tracking Coherent Policy Conclusions. Social Indicators Research 2021, 156, 449–479. [Google Scholar] [CrossRef]
- Otoiu, A.; Titan, E.; Dumitrescu, R. Are the Variables Used in Building Composite Indicators of Well-Being Relevant? Validating Composite Indexes of Well-Being. Ecological indicators 2014, 46, 575–585. [Google Scholar] [CrossRef]
- Cavicchia, C.; Sarnacchiaro, P.; Vichi, M. A Composite Indicator for the Waste Management in the EU via Hierarchical Disjoint Non-Negative Factor Analysis. Socio-Economic Planning Sciences 2021, 73, 100832. [Google Scholar] [CrossRef]
- Fernando, M.; Samita, S.; Abeynayake, R. Modified Factor Analysis to Construct Composite Indices: Illustration on Urbanization Index. 2012.
- Shen, C.; Williamson, J.B. Corruption, Democracy, Economic Freedom, and State Strength: A Cross-National Analysis. International Journal of Comparative Sociology 2005, 46, 327–345. [Google Scholar] [CrossRef]
- Kevser, T.Ş.; Selay, G.Y. An Evaluation on Effect of Freedoms on Economic Performance with Structural Equation Modeling. Ekoist: Journal of Econometrics and Statistics 2019, 1–20.
- Polat, A.; Satti, S.L.; others On the Causal Chain of Economic Freedom and Stock Market Development in Malaysia: Structural Equation Modeling Approach. Актуальні прoблеми екoнoміки 2013, 351–362.
- Bennett, D.L.; Nikolaev, B. Economic Freedom. Economic freedom of the world 2019, 199. [Google Scholar]
- Grimes, D.R.; Prime, P.B.; Walker, M.B. Geographical Variation in Wages of Workers in Low-Wage Service Occupations: A US Metropolitan Area Analysis. Economic Development Quarterly 2019, 33, 121–133. [Google Scholar] [CrossRef]
- BLS Occupational Employment and Wage Statistics (accessed on 24 March 2023).
- Joseph, L. US Minimum Wage by State from 1968 to 2020 Available online: https://www.kaggle.com/datasets/lislejoem/us-minimum-wage-by-state-from-1968-to-2017.
- Census American Community Survey (ACS). Available online: https://www.census.gov/programs-surveys/acs/ (accessed on 24 March 2023).
- Census Bureau Data. Available online: https://catalog.data.gov/dataset/tiger-line-shapefile-2017-nation-u-s-current-state-and-equivalent-national (accessed on 24 March 2023).
- BEA Regional GDP & Personal Income Available online: https://www.bea.gov/itable/regional-gdp-and-personal-income.
- Bureau, U.S.C. TIGER/Line Shapefiles.
- StataCorp Stata Statistical Software: Release 17. 2021.
- R Core Team. R: A Language and Environment for Statistical Computing; R Foundation for Statistical Computing: Vienna, Austria, 2023. [Google Scholar]
- Fulton, Lawrence RPubs by RStudio. Available online: https://rpubs.com/R-Minator/ASiF (accessed on 24 March 2023).
- JASP Team JASP (Version 0.17)[Computer Software] 2023.
- Rosseel, Y. Lavaan: An R Package for Structural Equation Modeling. Journal of Statistical Software 2012, 48, 1–36. [Google Scholar] [CrossRef]
- Cheng J, K. Leaflet: Create Interactive Web Maps with the JavaScript “Leaflet” Library 2022.
- Kaiser, H.F. The Varimax Criterion for Analytic Rotation in Factor Analysis. Psychometrika 1958, 23, 187–200. [Google Scholar] [CrossRef]
- Van Laar, S.; Braeken, J. Understanding the Comparative Fit Index: It’s All about the Base! Practical Assessment, Research & Evaluation 2021, 26. [Google Scholar]
- Cai, L.; Chung, S.W.; Lee, T. Incremental Model Fit Assessment in the Case of Categorical Data: Tucker–Lewis Index for Item Response Theory Modeling. Prevention Science 2021, 1–12. [Google Scholar]
- Bentler, P.M.; Bonett, D.G. Significance Tests and Goodness of Fit in the Analysis of Covariance Structures. Psychological bulletin 1980, 88, 588. [Google Scholar] [CrossRef]
- Kenny, D.A.; Kaniskan, B.; McCoach, D.B. The Performance of RMSEA in Models with Small Degrees of Freedom. Sociological methods & research 2015, 44, 486–507. [Google Scholar]
- Xia, Y.; Yang, Y. RMSEA, CFI, and TLI in Structural Equation Modeling with Ordered Categorical Data: The Story They Tell Depends on the Estimation Methods. Behavior research methods 2019, 51, 409–428. [Google Scholar]
- Pavlov, G.; Maydeu-Olivares, A.; Shi, D. Using the Standardized Root Mean Squared Residual (SRMR) to Assess Exact Fit in Structural Equation Models. Educational and Psychological Measurement 2021, 81, 110–130. [Google Scholar] [CrossRef] [PubMed]
- Hu, L.; Bentler, P.M. Cutoff Criteria for Fit Indexes in Covariance Structure Analysis: Conventional Criteria versus New Alternatives. Structural equation modeling: a multidisciplinary journal 1999, 6, 1–55. [Google Scholar]
Figure 1.
Correlogram among selected variables. Govt_Consumption: Government Consumption and Expenditures, Govt_Xfers_Subsidies: Government Transfers and Subsidies, Govt_Retirement: Government Insurance and Retirement, Cor: Correlation (Pearsons’ r).
Figure 1.
Correlogram among selected variables. Govt_Consumption: Government Consumption and Expenditures, Govt_Xfers_Subsidies: Government Transfers and Subsidies, Govt_Retirement: Government Insurance and Retirement, Cor: Correlation (Pearsons’ r).
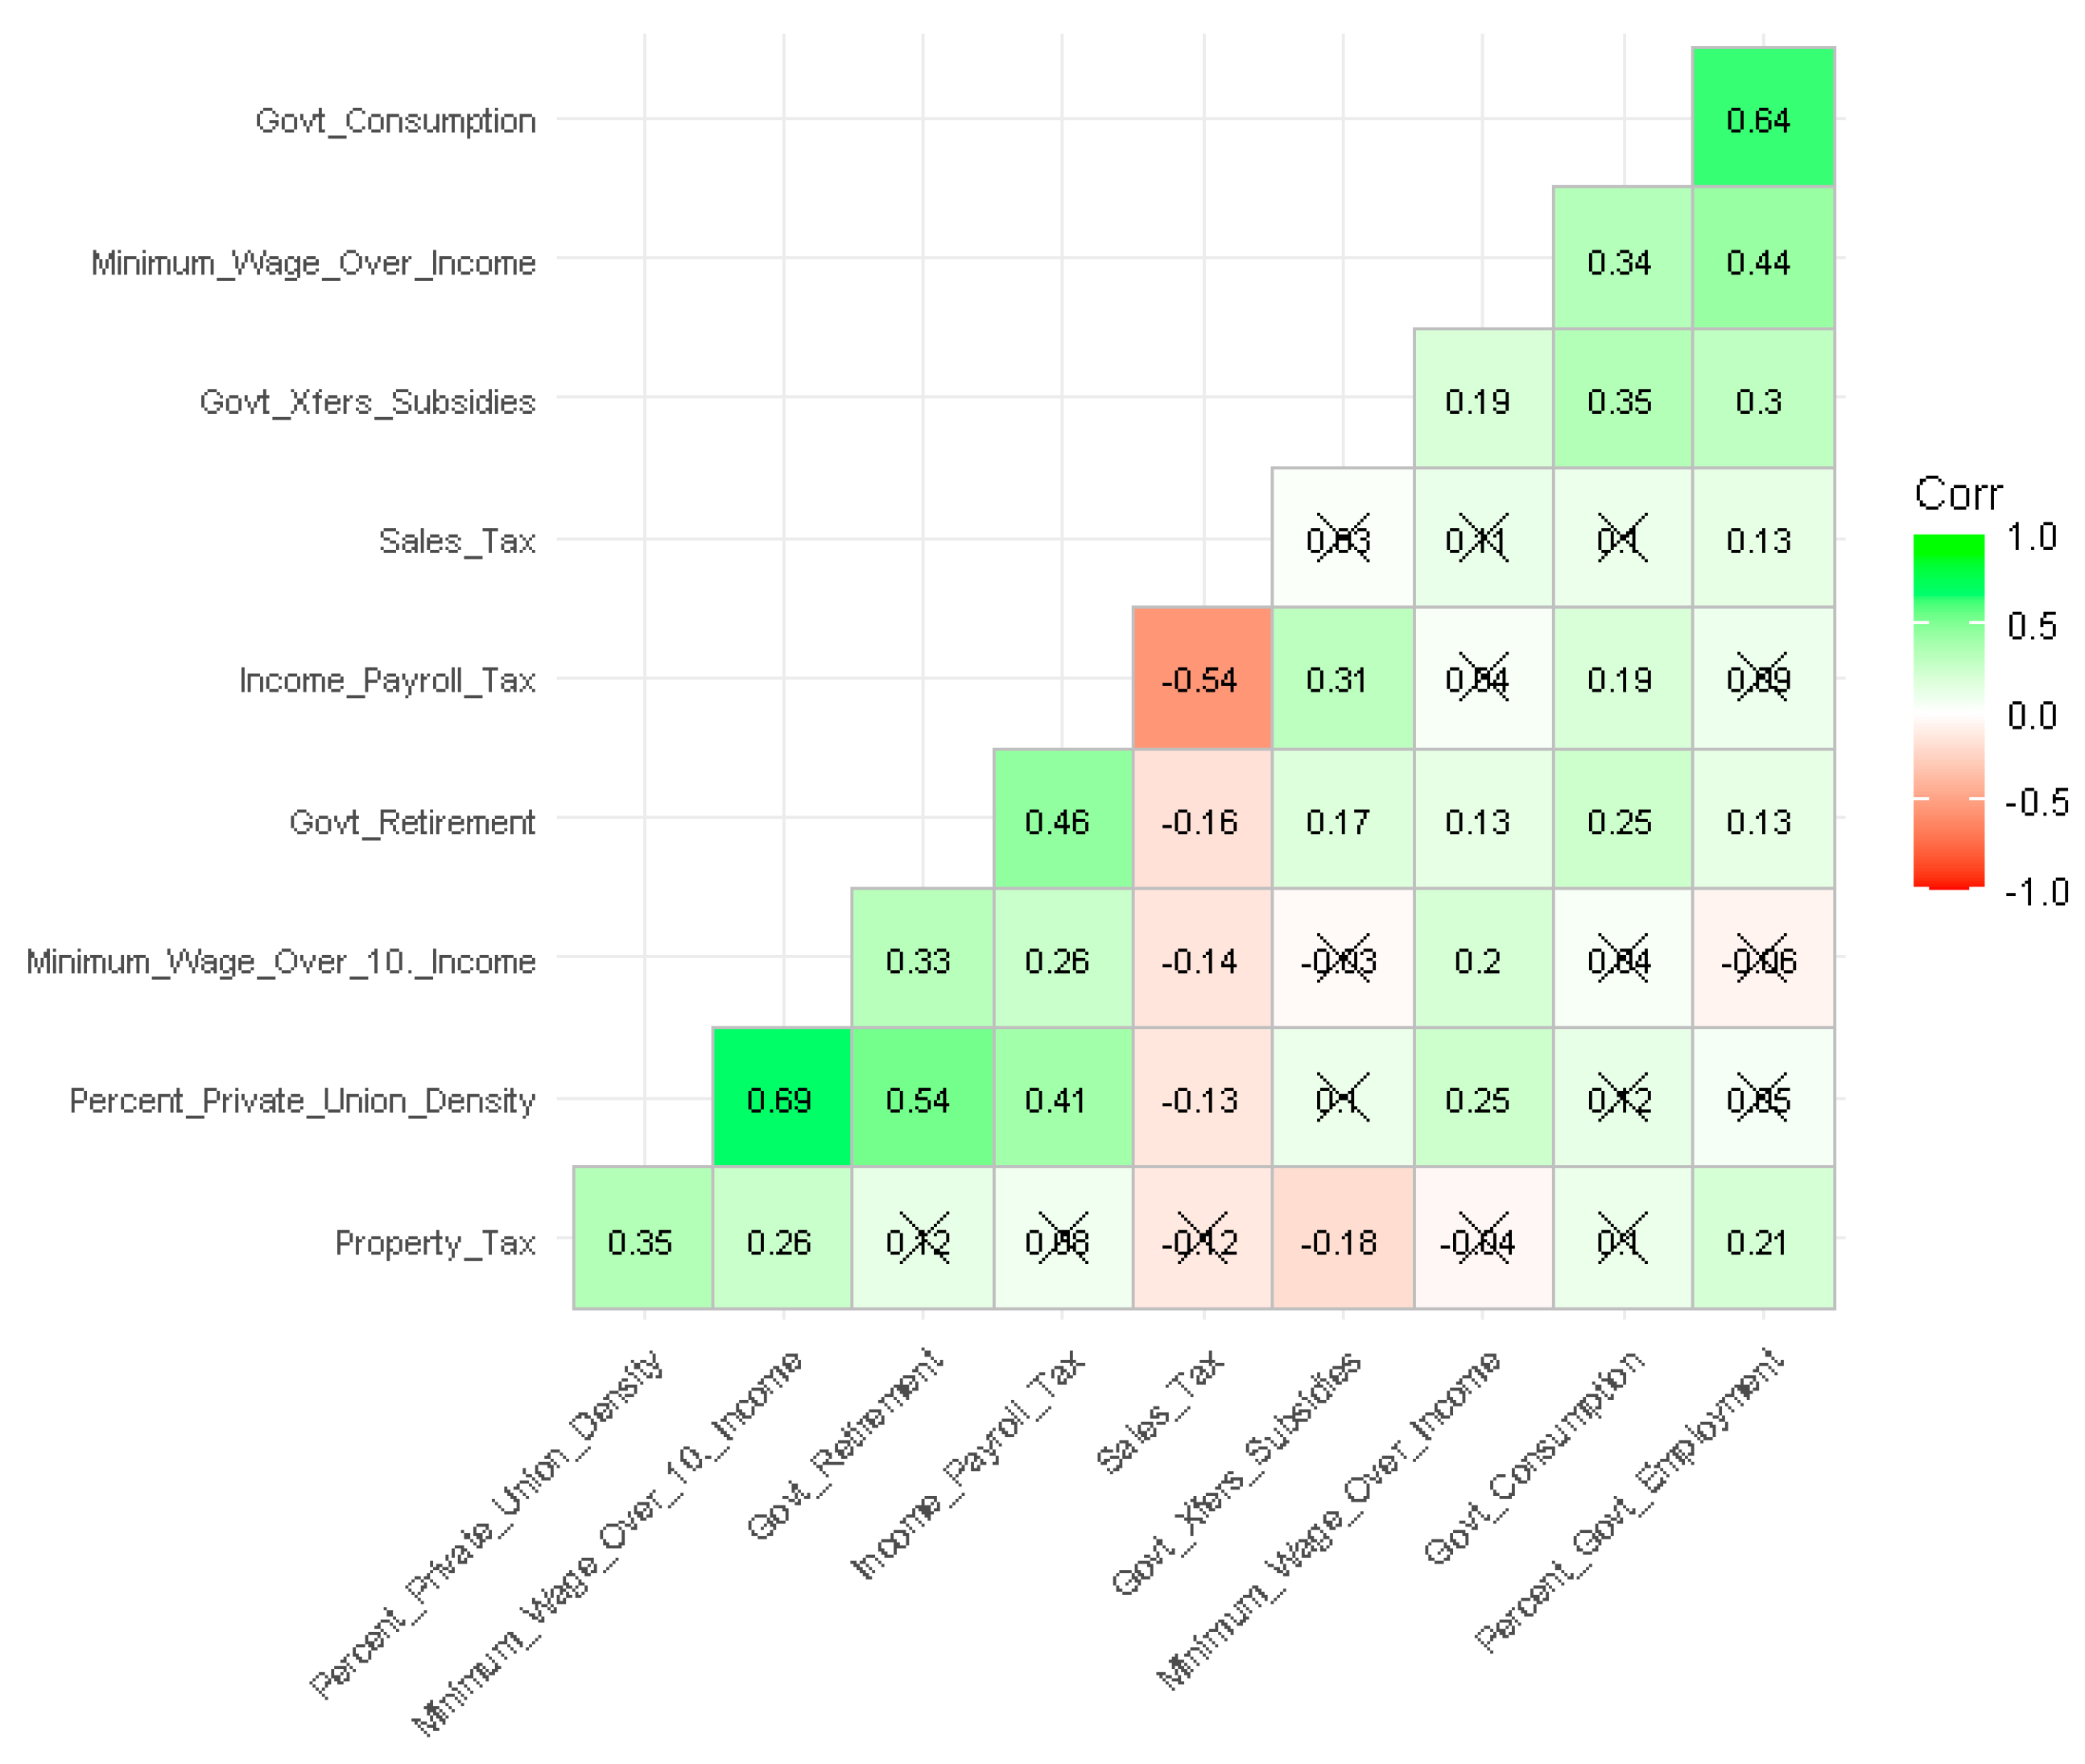
Figure 2.
MEFI rankings (lower is better).
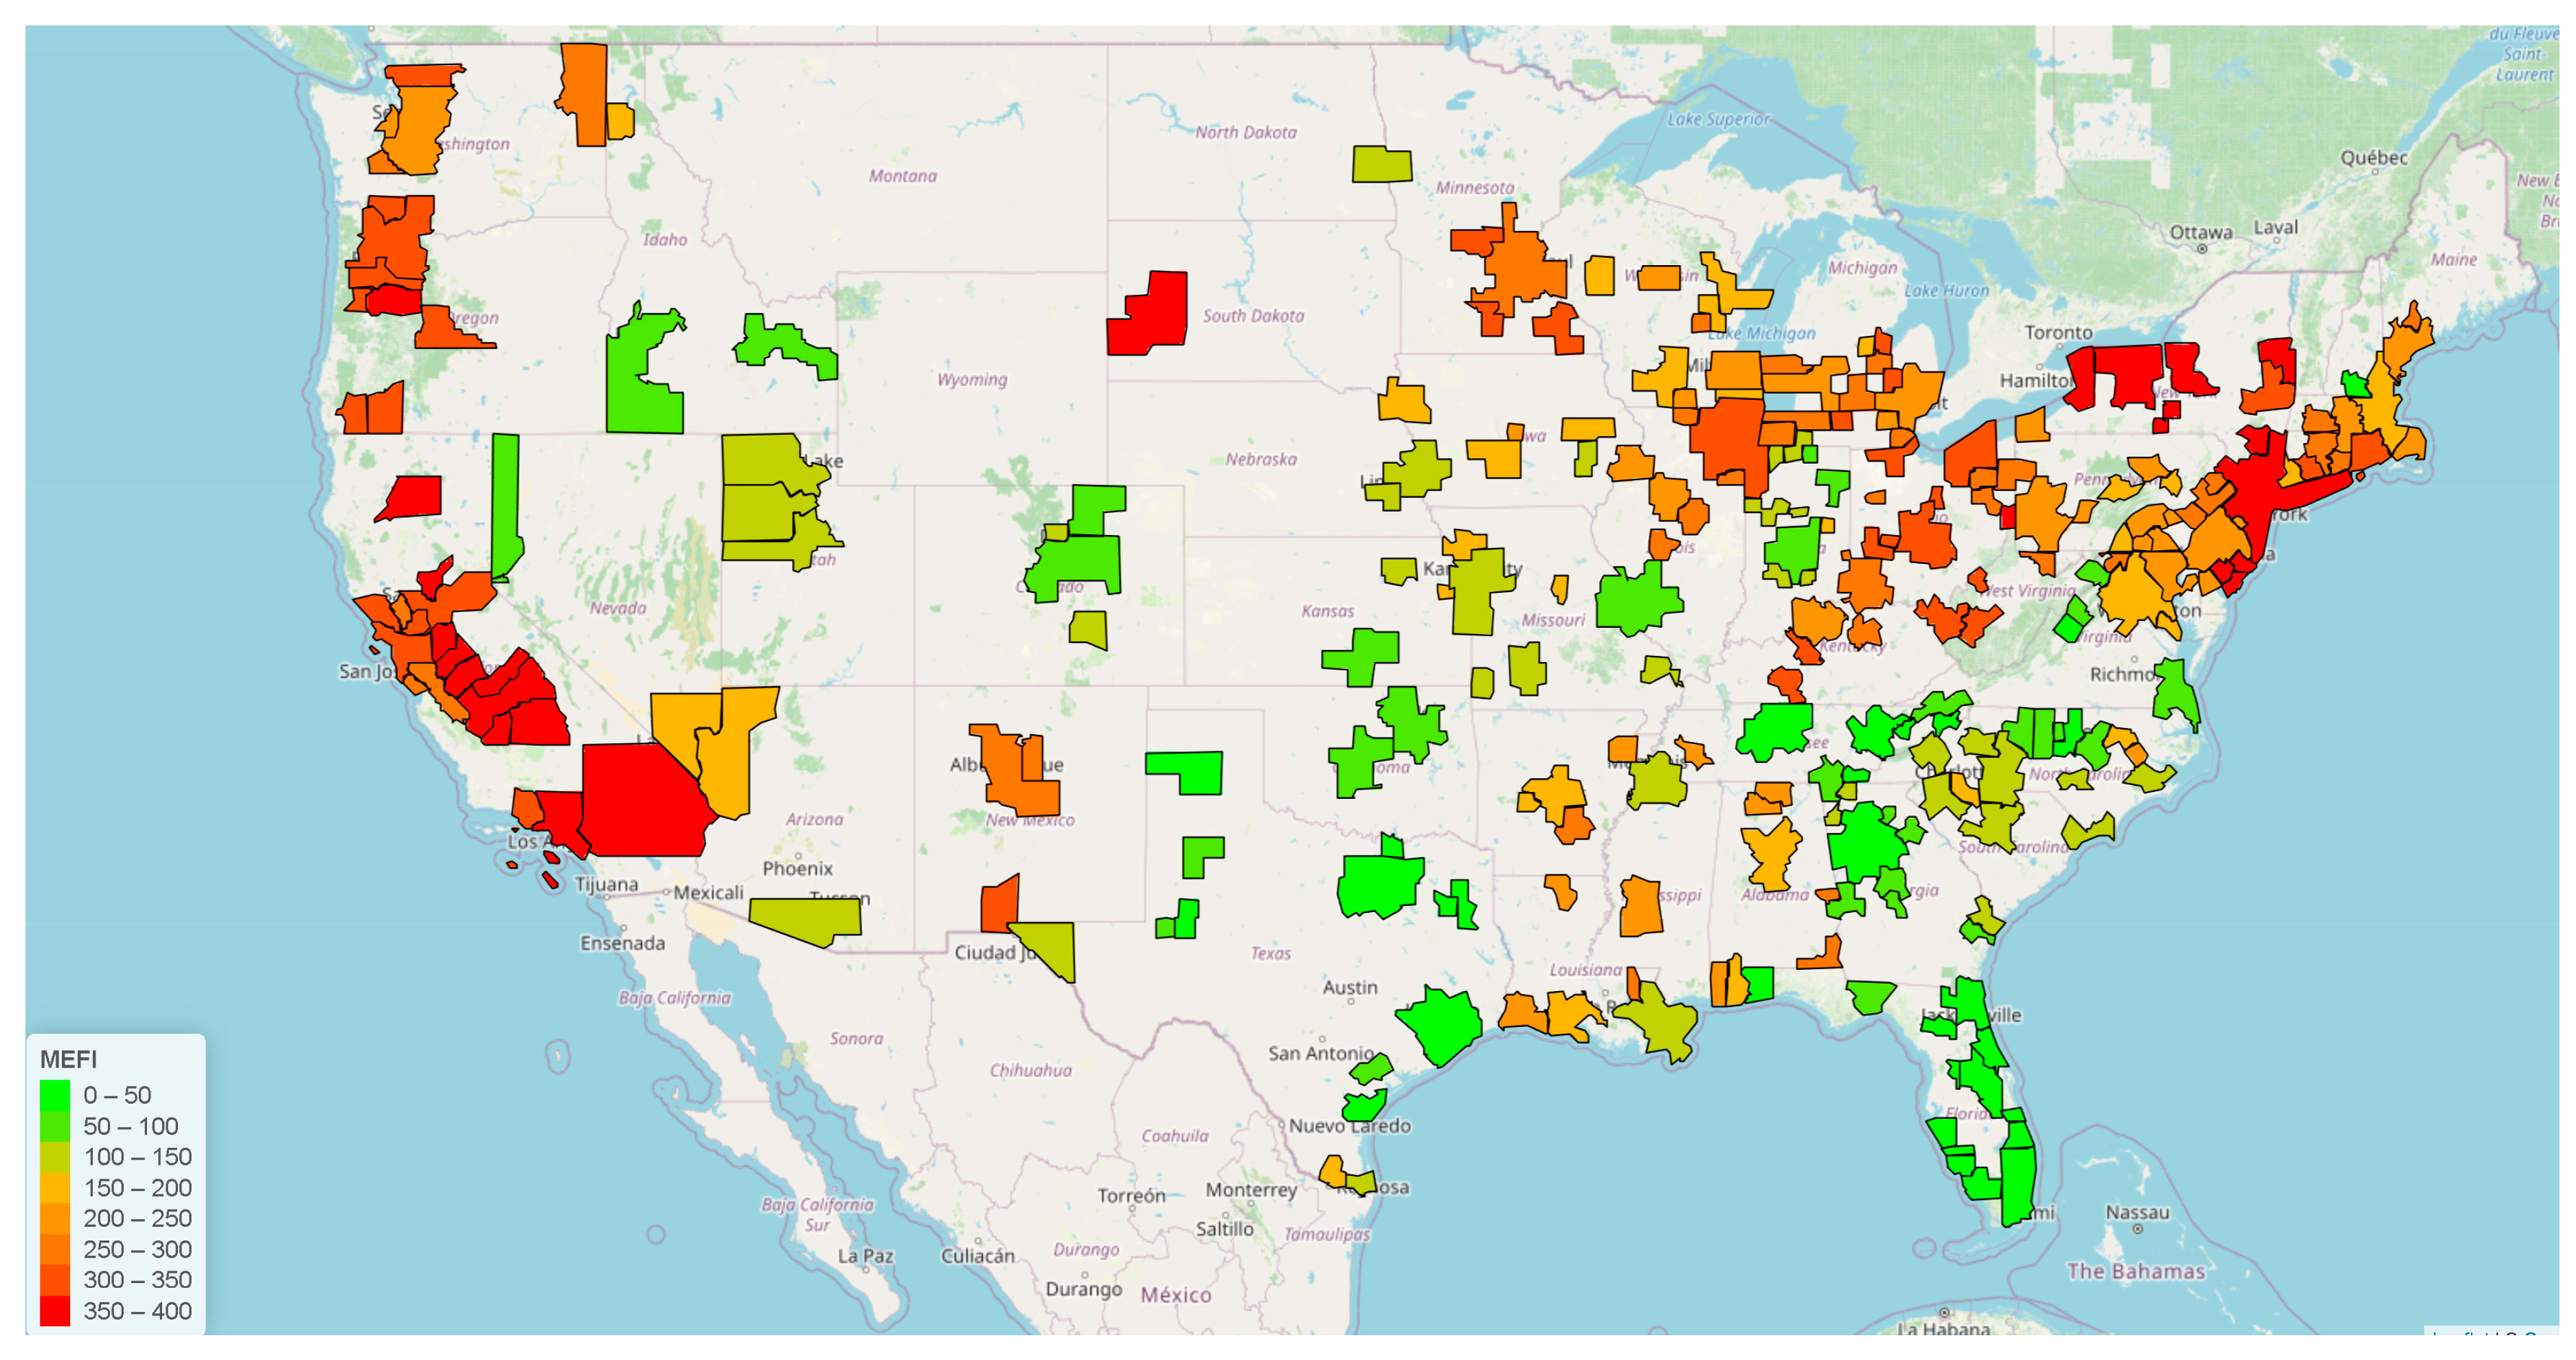
Figure 3.
The M1 Model, MEFI, as proposed by Stansel is depicted. (X1A=Government Consumption and Expenditures, X1B=Government Subsidies and Transfers, X1C=Government Insurance and Retirement, X2A=Income and Wage Tax, X2B=Sales Tax, X2C=Property Tax, X3A=Minimum Wage over per capita Income, X3B=Percent Government Employment, X3C=private union density). Replacing X3A with the effective minimum wage divided by the 10% income results in the M2 model.
Figure 3.
The M1 Model, MEFI, as proposed by Stansel is depicted. (X1A=Government Consumption and Expenditures, X1B=Government Subsidies and Transfers, X1C=Government Insurance and Retirement, X2A=Income and Wage Tax, X2B=Sales Tax, X2C=Property Tax, X3A=Minimum Wage over per capita Income, X3B=Percent Government Employment, X3C=private union density). Replacing X3A with the effective minimum wage divided by the 10% income results in the M2 model.
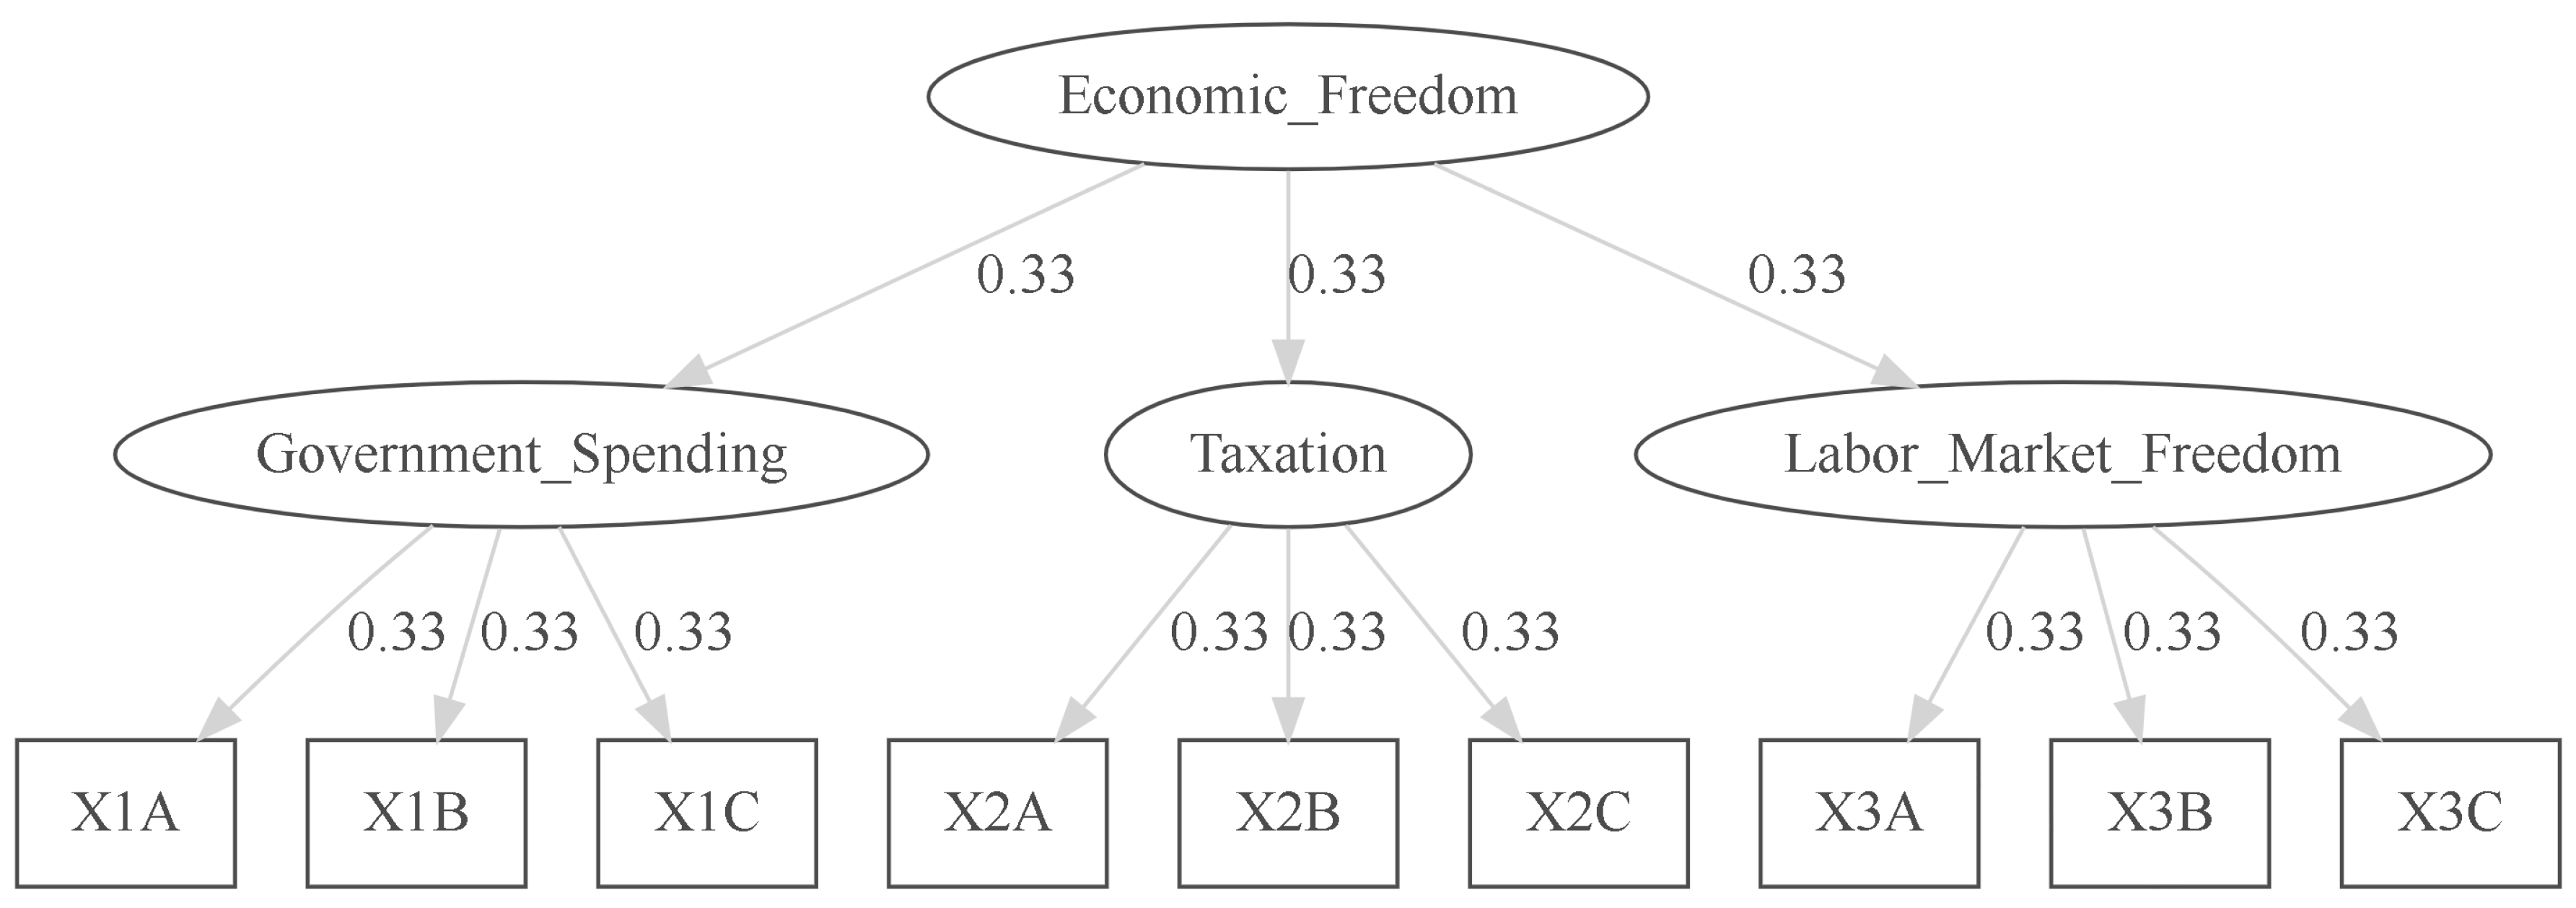
Figure 5.
Models M5 (top) and M6 (bottom). X1A=general consumption expenditures by government, Score X1B=transfers and subsidies, Score X1C=insurance and retirement payments, Score X2A=income and payroll tax revenue, Score X2B=sales tax revenue, Score X2C=revenue from property tax, X3A=minimum wage, New3A=10th percentile of hourly wage, Score X3B=government employment as a percentage of total employment, Score X3C=private union density as a percentage of total employment, F1 through F3=Constructs.
Figure 5.
Models M5 (top) and M6 (bottom). X1A=general consumption expenditures by government, Score X1B=transfers and subsidies, Score X1C=insurance and retirement payments, Score X2A=income and payroll tax revenue, Score X2B=sales tax revenue, Score X2C=revenue from property tax, X3A=minimum wage, New3A=10th percentile of hourly wage, Score X3B=government employment as a percentage of total employment, Score X3C=private union density as a percentage of total employment, F1 through F3=Constructs.
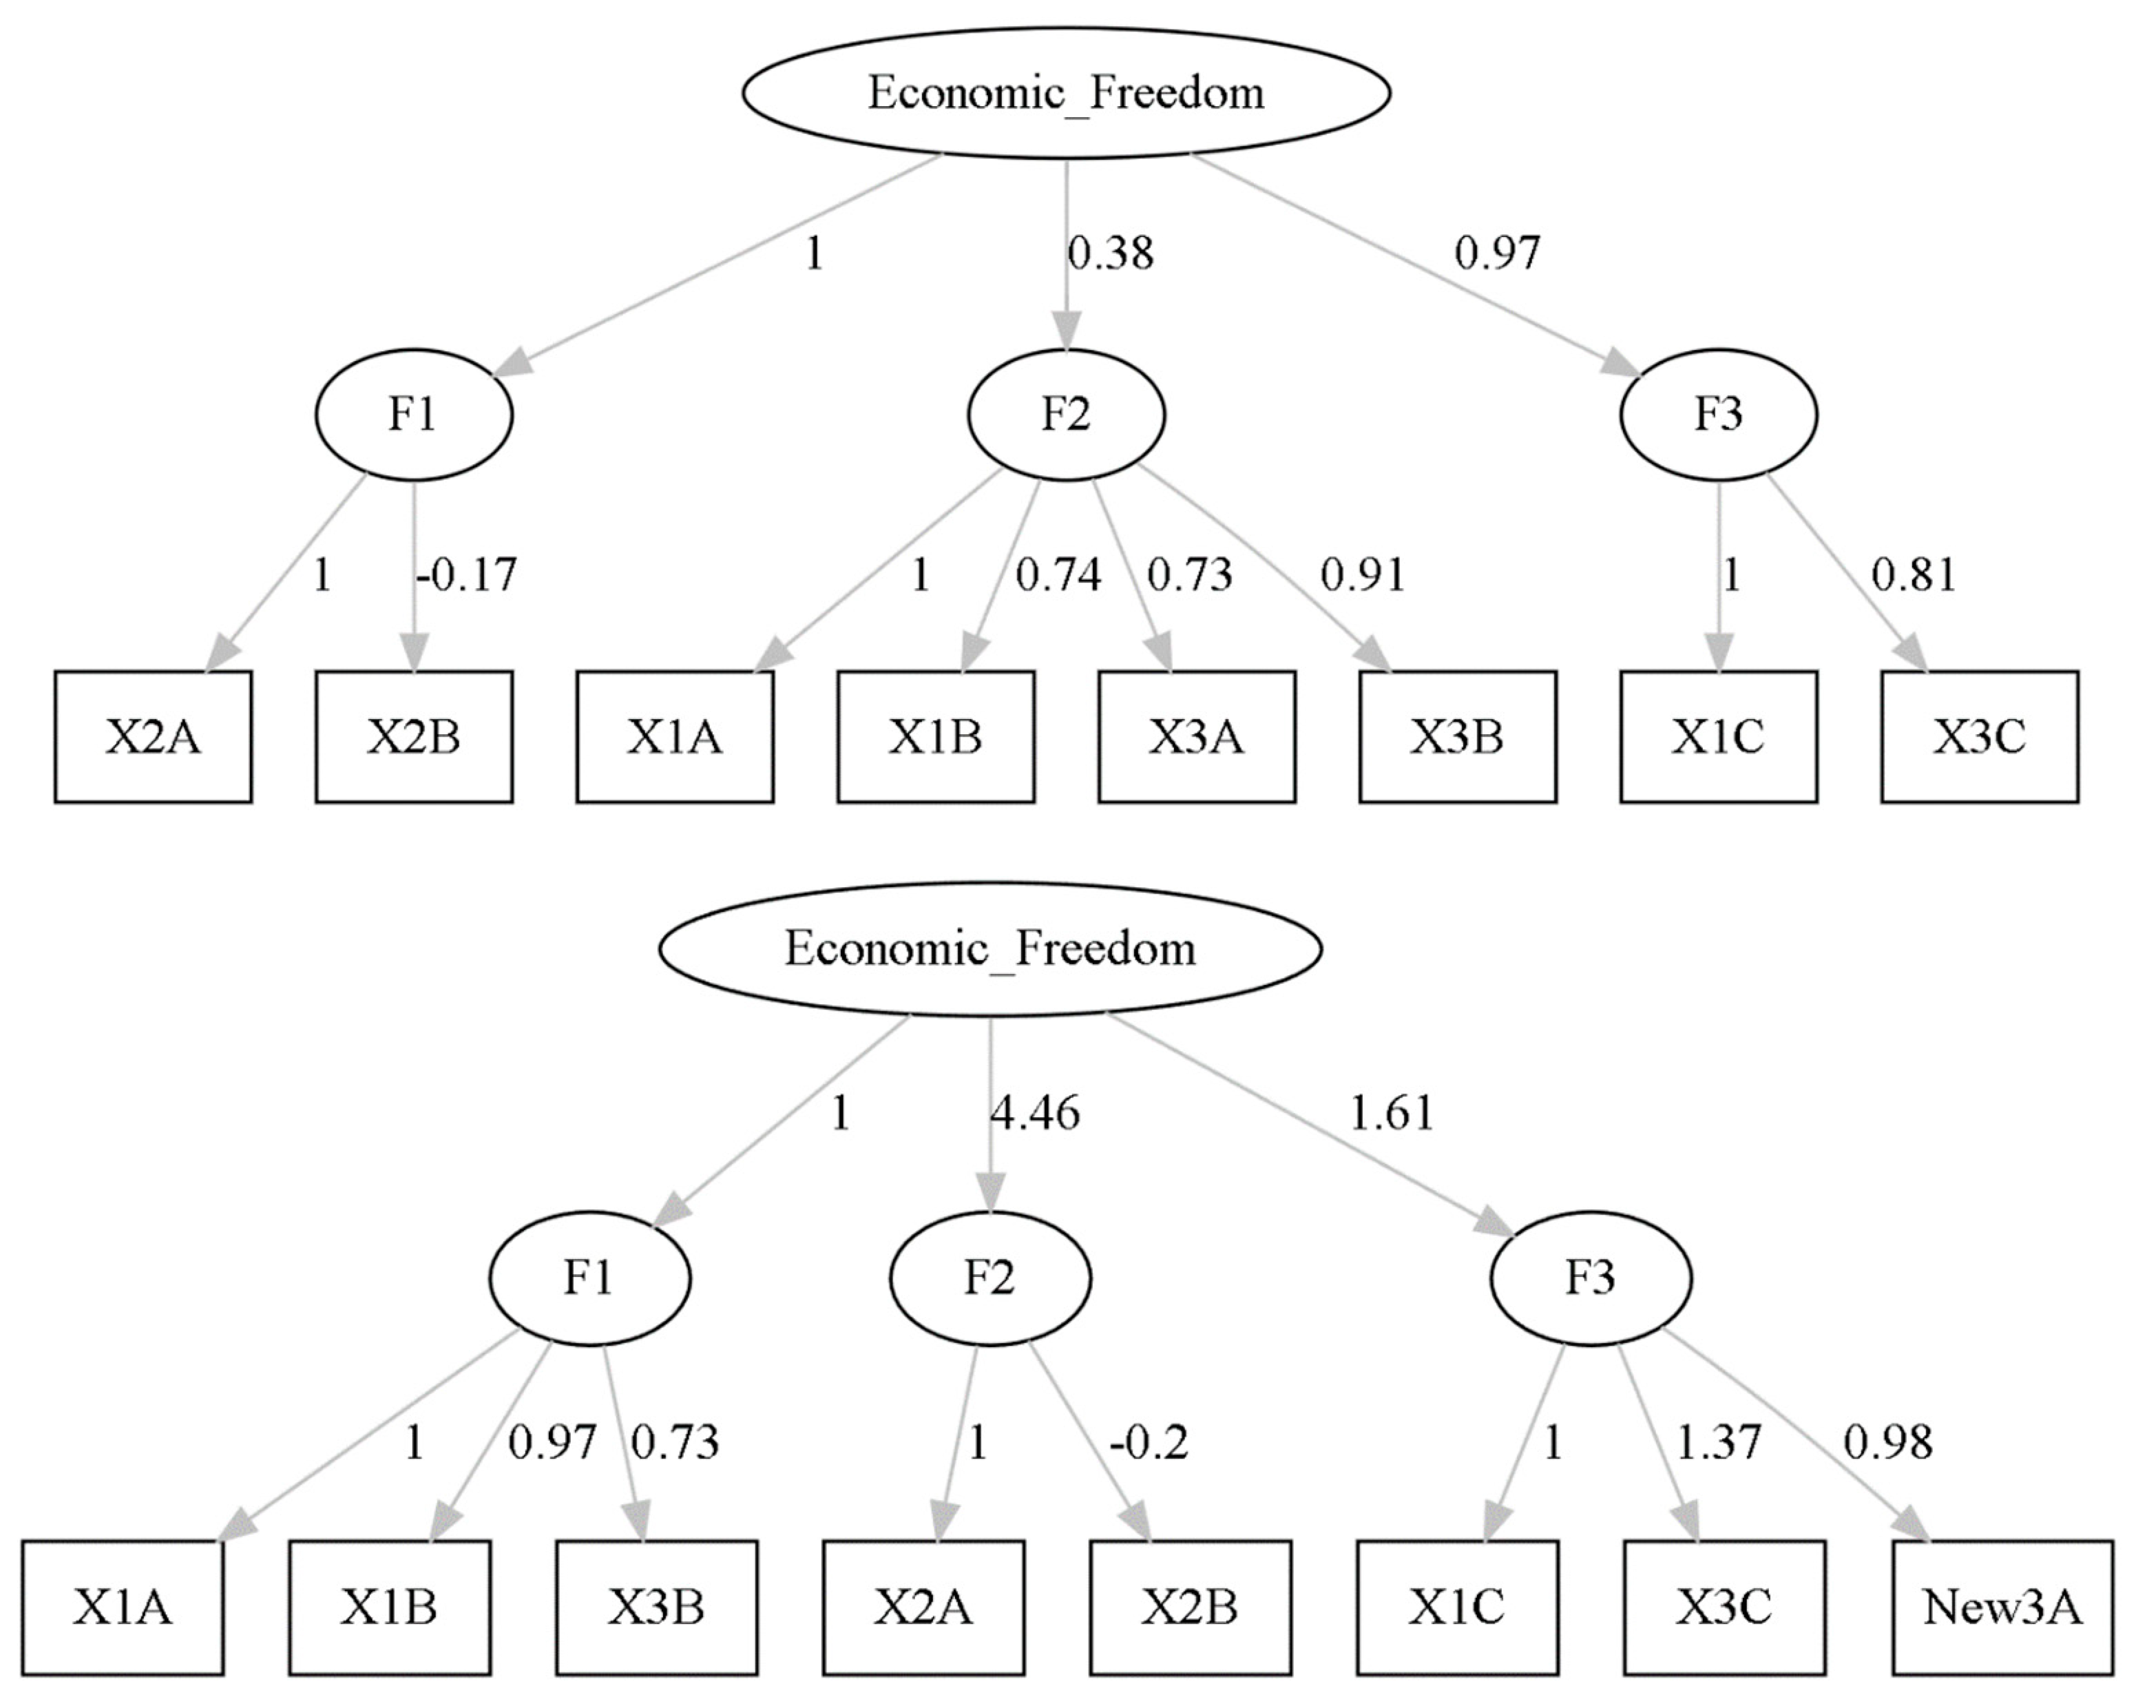
Figure 6.
Correlogram of rankings. RankOriginal=original MEFI, RankNewScore=MEFI with minimum wage as a percent of per capita income replaced by effective minimum wage divided by the 10th percentile of income, RankM3=M3 Model Rankings, RankM4=M4 Model Rankings, RankM5=M5 Model Rankings, RankM6=M6 Model Rankings.
Figure 6.
Correlogram of rankings. RankOriginal=original MEFI, RankNewScore=MEFI with minimum wage as a percent of per capita income replaced by effective minimum wage divided by the 10th percentile of income, RankM3=M3 Model Rankings, RankM4=M4 Model Rankings, RankM5=M5 Model Rankings, RankM6=M6 Model Rankings.
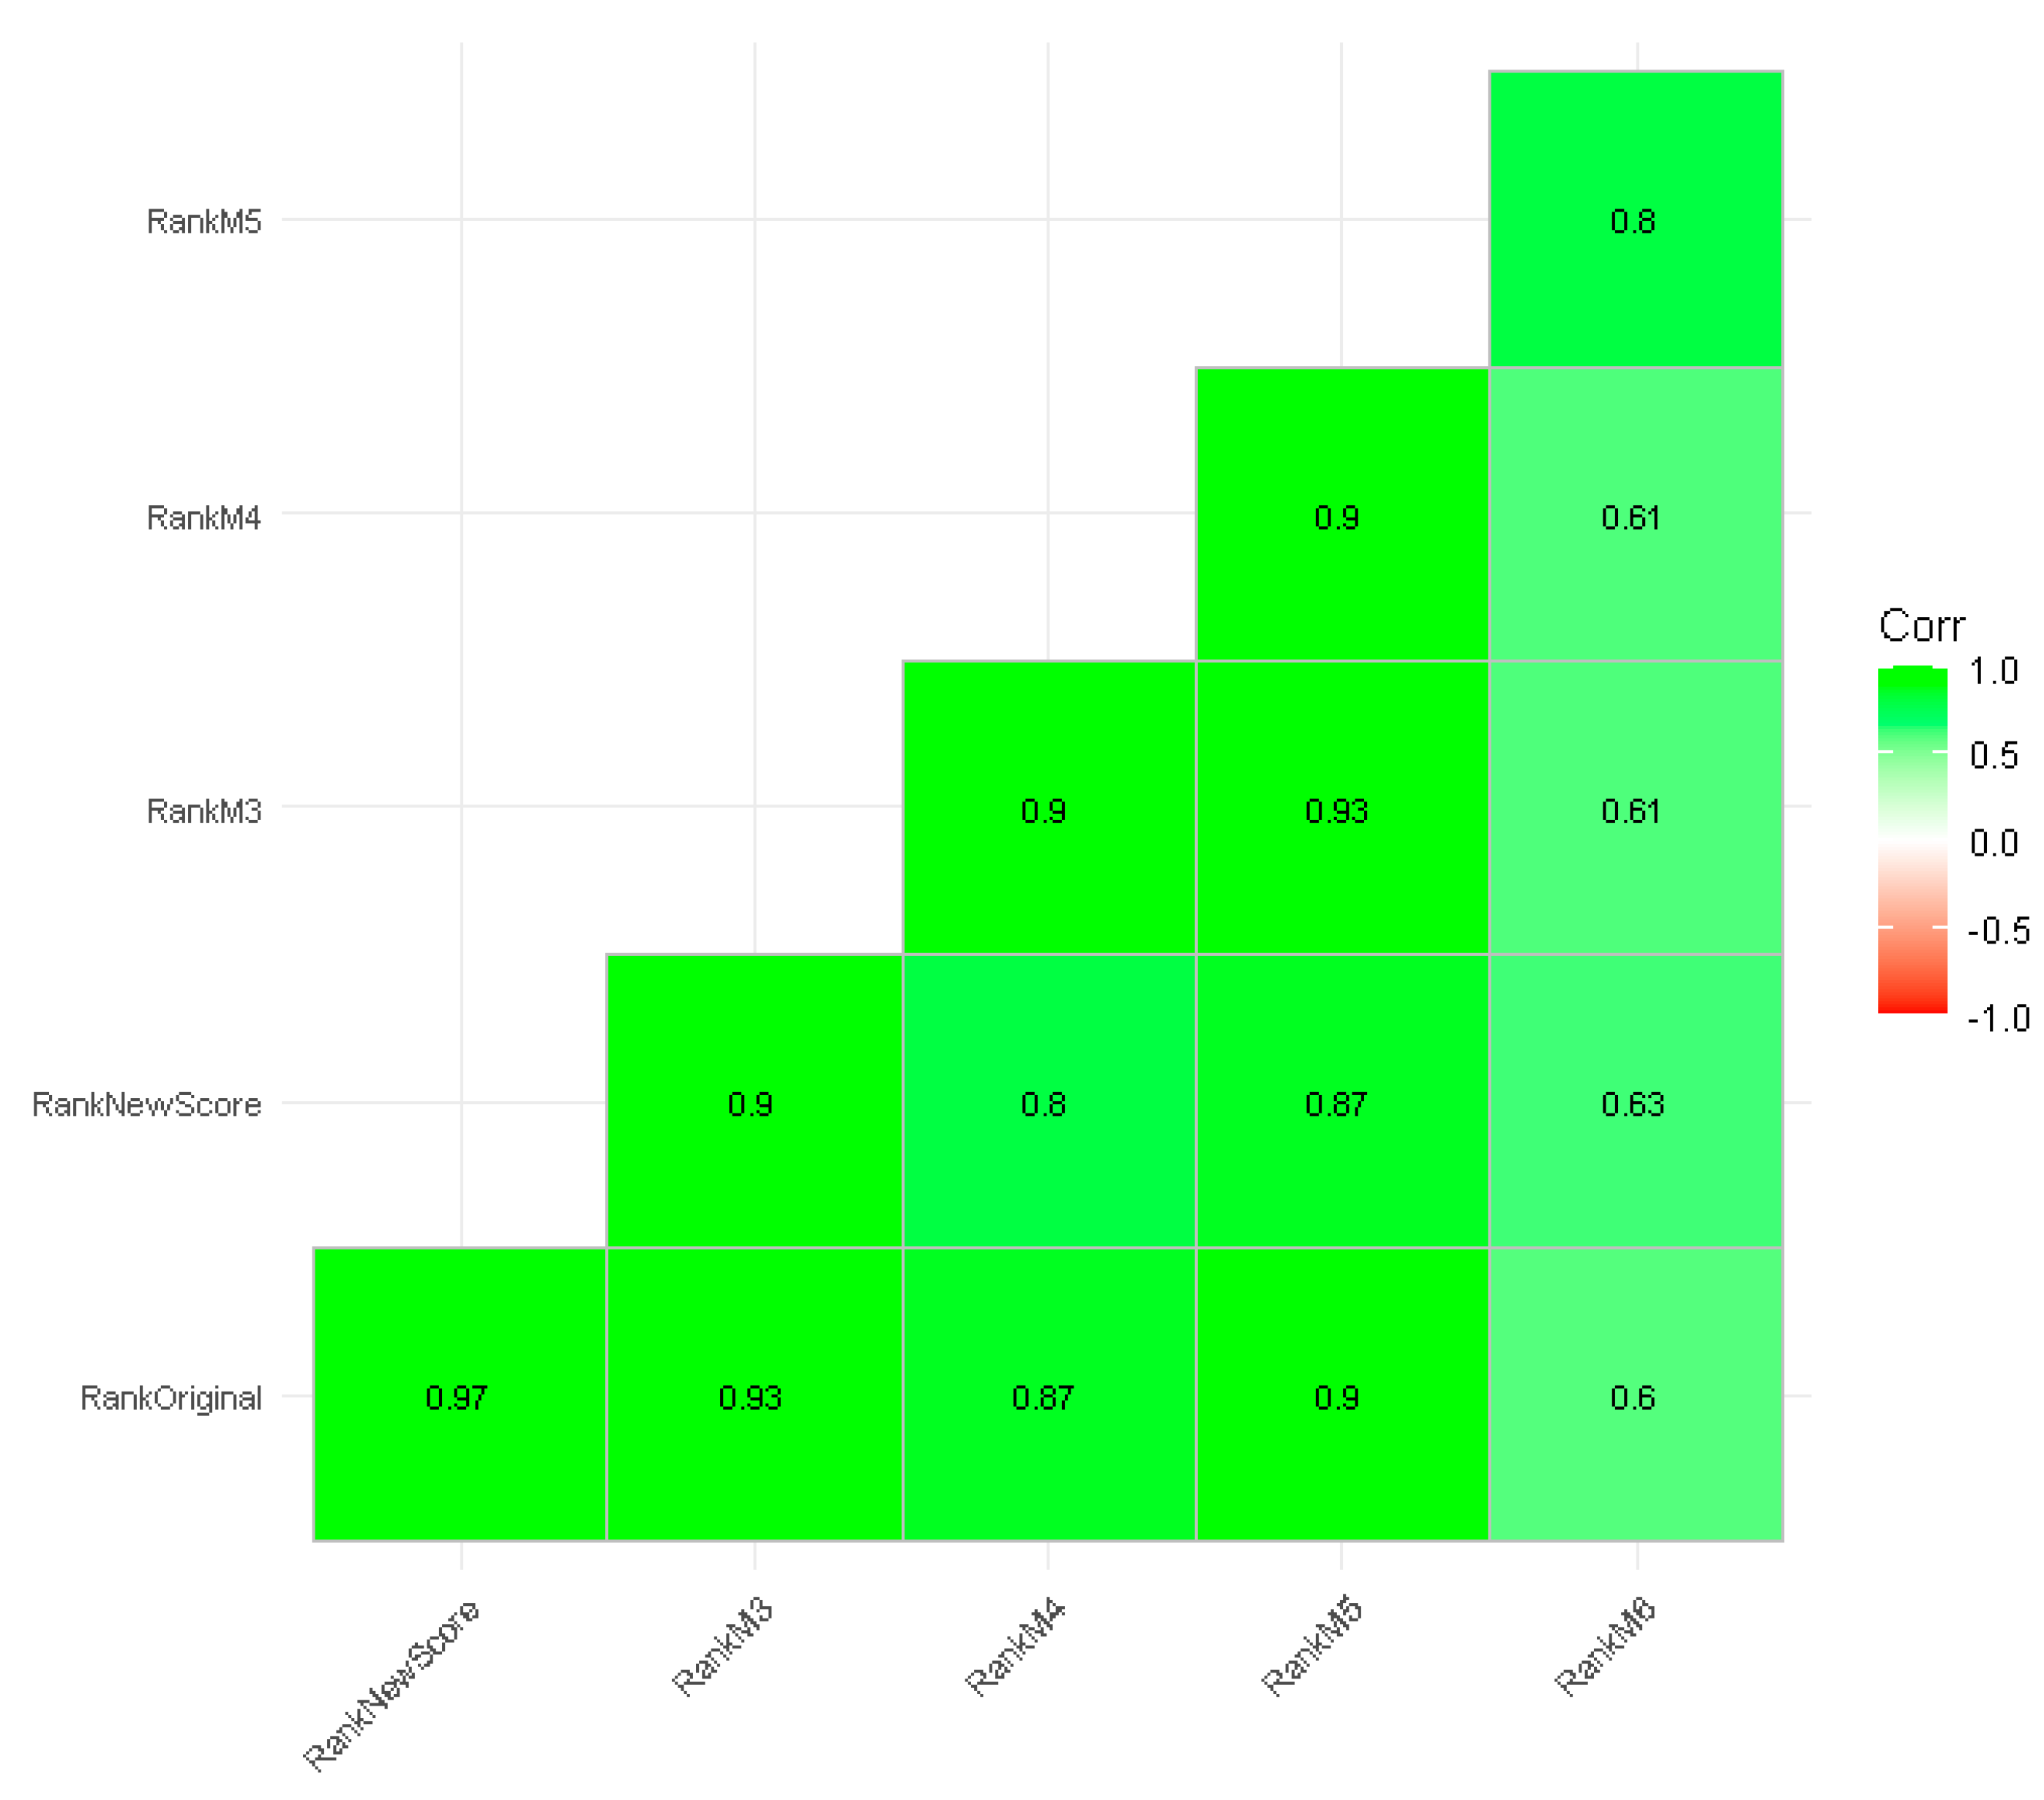

Table 1.
Descriptive Statistics. SD=standard deviation, Trimmed=10% Trimmed Mean.
| Variable | Mean | SD | Median | Trimmed | Minimum | Maximum |
|---|---|---|---|---|---|---|
| Population 2017 (in 100,000s) | 7.304 | 16.538 | 2.411 | 3.662 | 0.511 | 199.985 |
| Minimum Wage / 10% Hourly Income | 9.360 | 0.850 | 9.140 | 9.250 | 8.120 | 12.130 |
| MEFI Score 2017 | 6.740 | 0.870 | 6.760 | 6.770 | 3.820 | 8.810 |
| Government Spending | 6.670 | 1.080 | 6.790 | 6.720 | 2.110 | 9.080 |
| Consumption Expenditures | 6.930 | 1.690 | 7.180 | 7.080 | 0.000 | 10.000 |
| Transfers & Subsidies | 8.840 | 0.740 | 9.080 | 8.970 | 5.560 | 9.740 |
| Insurance & Retirement Payments | 4.240 | 2.020 | 4.530 | 4.330 | 0.000 | 8.120 |
| Taxation (as % of Personal Income) | 6.160 | 0.880 | 6.130 | 6.160 | 3.280 | 9.260 |
| Payroll Tax Revenue | 4.810 | 2.810 | 4.280 | 4.690 | 0.000 | 10.000 |
| Sales Tax Revenue | 5.390 | 1.710 | 5.440 | 5.430 | 0.000 | 9.810 |
| Property Tax Revenue | 8.270 | 1.130 | 8.400 | 8.360 | 0.000 | 10.000 |
| Labor Market Freedom | 7.390 | 1.200 | 7.640 | 7.490 | 4.070 | 9.530 |
| Minimum Wage / Per Capita Income | 7.450 | 1.230 | 7.590 | 7.530 | 2.980 | 10.000 |
| Government Employment | 8.350 | 0.910 | 8.480 | 8.430 | 0.000 | 10.000 |
| Private Union Density | 6.370 | 2.760 | 7.040 | 6.590 | 0.000 | 10.000 |
Table 2.
M1 and M2 Ranking Comparisons.
| Top 10 | Model 1 (Original) | Model 2 (New Variable) |
| 1 | Naples-Immokalee-Marco Island, FL MSA | Naples-Immokalee-Marco Island, FL MSA |
| 2 | Sebastian-Vero Beach, FL MSA | Sebastian-Vero Beach, FL MSA |
| 3 | Midland, TX MSA | The Villages, FL MSA |
| 4 | The Villages, FL MSA | Midland, TX MSA |
| 5 | Port St. Lucie, FL MSA | Tyler, TX MSA |
| 6 | Tyler, TX MSA | Port St. Lucie, FL MSA |
| 7 | Crestview-Fort Walton Beach-Destin, FL MSA | Pensacola-Ferry Pass-Brent, FL MSA |
| 8 | Pensacola-Ferry Pass-Brent, FL MSA | Crestview-Fort Walton Beach-Destin, FL MSA |
| 9 | North Port-Sarasota-Bradenton, FL MSA | Homosassa Springs, FL MSA |
| 10 | Homosassa Springs, FL MSA | Manchester-Nashua, NH MSA |
| Bottom 10 | Model 1 (Original) | Model 2 (New Variable) |
| 373 | Stockton-Lodi, CA MSA | Yuba City, CA MSA |
| 374 | Glens Falls, NY MSA | Modesto, CA MSA |
| 375 | Riverside-San Bernardino-Ontario, CA MSA | Fresno, CA MSA |
| 376 | Kahului-Wailuku-Lahaina, HI MSA | Stockton-Lodi, CA MSA |
| 377 | Binghamton, NY MSA | Riverside-San Bernardino-Ontario, CA MSA |
| 378 | Merced, CA MSA | Merced, CA MSA |
| 379 | Visalia-Porterville, CA MSA | Visalia-Porterville, CA MSA |
| 380 | Rapid City, SD MSA | Bakersfield, CA MSA |
| 381 | Bakersfield, CA MSA | Rapid City, SD MSA |
| 382 | El Centro, CA MSA | El Centro, CA MSA |
Table 4.
Exploratory Factor Analysis for the Modified MEFI.
| Factor 1 | Factor 2 | Factor 3 | |
|---|---|---|---|
| 1A Government Consumption Expenditures | 0.687 | ||
| 3B Government Employment | 0.650 | ||
| 1B Government Transfers & Subsidies | 0.557 | ||
| 2A Income & Payroll Tax Revenue | 0.926 | ||
| 2B Sales Tax Revenue | -0.599 | ||
| 3C Private Union Density | 0.978 | ||
| New 3A 10th Percentile of Hourly Wage | 0.690 | ||
| Score 1C Insurance and Retirement Payments | 0.623 | ||
| 2C Revenue from Property Tax |
Table 5.
Fit metrics for all models. CFI=Comparative Fit Index, TLI=Tucker-Lewis Index, RMSEA=Root Mean Squared Error of Approximation, SRMSR= Standardized Root Mean Squared Residual.
Table 5.
Fit metrics for all models. CFI=Comparative Fit Index, TLI=Tucker-Lewis Index, RMSEA=Root Mean Squared Error of Approximation, SRMSR= Standardized Root Mean Squared Residual.
| M1 | M2 | M3 | M4 | M5 | M6 | Benchmark | |
|---|---|---|---|---|---|---|---|
| CFI | 0.449 | 0.410 | 0.753 | 0.816 | 0.944 | 0.930 | 0.900 |
| TLI | 0.381 | 0.336 | 0.630 | 0.724 | 0.908 | 0.885 | 0.900 |
| RMSEA | 0.188 | 0.214 | 0.145 | 0.138 | 0.079 | 0.094 | 0.080 |
| SRMSR | 0.170 | 0.190 | 0.147 | 0.140 | 0.080 | 0.090 | 0.080 |
| Chi Square p-value | <0.001 | <0.001 | <0.001 | <0.001 | <0.001 | <0.001 | >0.050 |
Table 6.
Top 10 rankings by model.
| Top 10 | Original | With Variable Change | M3 | M4 | M5 | M6 |
|---|---|---|---|---|---|---|
| 1 | Naples-Immokalee-Marco Island, FL MSA | Naples-Immokalee-Marco Island, FL MSA | Naples-Immokalee-Marco Island, FL MSA | The Villages, FL MSA | Naples-Immokalee-Marco Island, FL MSA | Fairbanks, AK MSA |
| 2 | Sebastian-Vero Beach, FL MSA | Sebastian-Vero Beach, FL MSA | The Villages, FL MSA | Homosassa Springs, FL MSA | Manchester-Nashua, NH MSA | Anchorage, AK MSA |
| 3 | Midland, TX MSA | The Villages, FL MSA | Sebastian-Vero Beach, FL MSA | Naples-Immokalee-Marco Island, FL MSA | The Villages, FL MSA | Manchester-Nashua, NH MSA |
| 4 | The Villages, FL MSA | Midland, TX MSA | Homosassa Springs, FL MSA | Punta Gorda, FL MSA | Sebastian-Vero Beach, FL MSA | Killeen-Temple, TX MSA |
| 5 | Port St. Lucie, FL MSA | Tyler, TX MSA | Crestview-Fort Walton Beach-Destin, FL MSA | Crestview-Fort Walton Beach-Destin, FL MSA | Homosassa Springs, FL MSA | Sherman-Denison, TX MSA |
| 6 | Tyler, TX MSA | Port St. Lucie, FL MSA | Port St. Lucie, FL MSA | Sebring, FL MSA | Port St. Lucie, FL MSA | Wichita Falls, TX MSA |
| 7 | Crestview-Fort Walton Beach-Destin, FL MSA | Pensacola-Ferry Pass-Brent, FL MSA | Punta Gorda, FL MSA | Sebastian-Vero Beach, FL MSA | Crestview-Fort Walton Beach-Destin, FL MSA | McAllen-Edinburg-Mission, TX MSA |
| 8 | Pensacola-Ferry Pass-Brent, FL MSA | Crestview-Fort Walton Beach-Destin, FL MSA | Pensacola-Ferry Pass-Brent, FL MSA | Pensacola-Ferry Pass-Brent, FL MSA | Punta Gorda, FL MSA | Brownsville-Harlingen, TX MSA |
| 9 | North Port-Sarasota-Bradenton, FL MSA | Homosassa Springs, FL MSA | Manchester-Nashua, NH MSA | Cleveland, TN MSA | Ocala, FL MSA | Midland, TX MSA |
| 10 | Homosassa Springs, FL MSA | Manchester-Nashua, NH MSA | North Port-Sarasota-Bradenton, FL MSA | Ocala, FL MSA | Midland, TX MSA | Houston-The Woodlands-Sugar Land, TX MSA |
Table 7.
Bottom 10 rankings by model.
| Bottom 10 | Original | With Variable Change | M3 | M4 | M5 | M6 |
|---|---|---|---|---|---|---|
| 373 | Stockton-Lodi, CA MSA | Yuba City, CA MSA | Farmington, NM MSA | Medford-Ashland, OR MSA | Santa Maria-Santa Barbara, CA MSA | Buffalo-Cheektowaga-Niagara Falls, NY MSA |
| 374 | Glens Falls, NY MSA | Modesto, CA MSA | Los Angeles-Long Beach-Anaheim, CA MSA | Bend-Redmond, OR MSA | Modesto, CA MSA | Minneapolis-St. Paul-Bloomington, MN-WI MSA |
| 375 | Riverside-San Bernardino-Ontario, CA MSA | Fresno, CA MSA | Riverside-San Bernardino-Ontario, CA MSA | Albany, OR MSA | Los Angeles-Long Beach-Anaheim, CA MSA | St. Cloud, MN MSA |
| 376 | Kahului-Wailuku-Lahaina, HI MSA | Stockton-Lodi, CA MSA | Modesto, CA MSA | Merced, CA MSA | Stockton-Lodi, CA MSA | Watertown-Fort Drum, NY MSA |
| 377 | Binghamton, NY MSA | Riverside-San Bernardino-Ontario, CA MSA | Fresno, CA MSA | Salem, OR MSA | Fresno, CA MSA | New York-Newark-Jersey City, NY-NJ-PA MSA |
| 378 | Merced, CA MSA | Merced, CA MSA | Stockton-Lodi, CA MSA | Eugene, OR MSA | Merced, CA MSA | Mankato-North Mankato, MN MSA |
| 379 | Visalia-Porterville, CA MSA | Visalia-Porterville, CA MSA | Visalia-Porterville, CA MSA | Los Angeles-Long Beach-Anaheim, CA MSA | Visalia-Porterville, CA MSA | Rochester, MN MSA |
| 380 | Rapid City, SD MSA | Bakersfield, CA MSA | Merced, CA MSA | Fresno, CA MSA | New York-Newark-Jersey City, NY-NJ-PA MSA | Kahului-Wailuku-Lahaina, HI MSA |
| 381 | Bakersfield, CA MSA | Rapid City, SD MSA | Bakersfield, CA MSA | Bakersfield, CA MSA | Bakersfield, CA MSA | Lexington-Fayette, KY MSA |
| 382 | El Centro, CA MSA | El Centro, CA MSA | El Centro, CA MSA | New York-Newark-Jersey City, NY-NJ-PA MSA | El Centro, CA MSA | Urban Honolulu, HI MSA |
Disclaimer/Publisher’s Note: The statements, opinions and data contained in all publications are solely those of the individual author(s) and contributor(s) and not of MDPI and/or the editor(s). MDPI and/or the editor(s) disclaim responsibility for any injury to people or property resulting from any ideas, methods, instructions or products referred to in the content. |
© 2023 by the authors. Licensee MDPI, Basel, Switzerland. This article is an open access article distributed under the terms and conditions of the Creative Commons Attribution (CC BY) license (http://creativecommons.org/licenses/by/4.0/).
Copyright: This open access article is published under a Creative Commons CC BY 4.0 license, which permit the free download, distribution, and reuse, provided that the author and preprint are cited in any reuse.


