
Submitted:
13 June 2023
Posted:
13 June 2023
You are already at the latest version
Abstract
In this paper, particular attention is paid to an advanced variant of the plug-in hybrid engine, known as PHEV, which combines two functionalities: the vehicle's internal combustion engine (ICEV) and the electric engine (BEV). The paper also presents the assumptions of the DEVS model, which allows for the estimation of vehicle’s energy consumption. The study described herein also presents the influence of factors such as ambient temperature and constant speed on the PHEV’s energy consumption. It has been shown that the vehicle’s range estimated based on its electronic control module (ECU) is about 20% shorter per annum on average for its year-round operation in every-day driving conditions. When analyzing the energy consumption based on the vehicle’s unit energy consumption model, attention was paid to values that are strongly correlated with the traffic volume and weather conditions affecting the moving vehicle. In addition, the authors emphasized that the estimated total energy consumption of an electric (BEV) or hybrid (PHEV) vehicle, relative to the normative values arising from the type approval test cycle, deviate from the actual values arising from real driving conditions and often vary substantially. In extreme cases, the actual range of a hybrid vehicle is 75% shorter.
Keywords:
energy consumption
; road test
; energy demand
; hybrid vehicle
; traffic conditions
Introduction
It is now widely accepted that BEVs or PEHVs are the solution for sustainable transportation in the future, at least for passenger and light-duty vehicles. This is due to their zero-emission feature which reduces (and in some areas even completely removes) the emissions caused by transportation processes. It also substantially contributes to the reduction of greenhouse gas emissions, especially CO2 emissions. However, it is necessary to keep in mind that some countries are still challenged by an unresolved electric vehicle battery charging issue caused by the fact that electricity in those countries is produced in a manner that generates high levels of total CO2 emissions [1].
Thanks to technological advances, huge progress has been made in electric cars in recent years. Almost every major global car manufacturer is now starting to develop all-electric models. In addition, customers are also attracted to the idea of using an electric car. A report by Allied Market Research (AMR) [2], which provides a thorough analysis of the automotive market, reveals an exponentially growing demand for fuel-efficient, high-performance and low-emission vehicles. The report also states that the increase in demand is exacerbated by strict state regulations on exhaust emissions introduced by many countries.
The limited range of an electric vehicle leads EV users to fear that the battery will discharge while driving to such an extent that it will be impossible to cover the planned route on a single charge. Simulation tests [3] have shown that the route type significantly affects energy consumption. Admittedly, urban driving involves frequent acceleration and braking phases, which can contribute to a significant increase in energy consumption, however enables energy recovery during braking. Higher energy consumption is observed at higher driving speeds, i.e., when driving on a highway or in non-urban conditions, at a constant speed, without any opportunities for energy recovery. It was ultimately concluded that as the average speed of the driving cycle increases, energy consumption also increases, resulting in a range decrease. The difference in average energy consumption between the urban cycle and the highway cycle amounted to 16%. In addition, it was shown that an electric vehicle’s energy consumption is significantly affected by ambient temperature. The cooling down of the battery cells to 0°C may result in a 24% decrease in its capacity compared to that available at 20°C.
The driving range of BEVs or PHEVs is affected by many parameters with varying degrees of importance. Some parameters have a fixed value (e.g., vehicle type, drive unit type, number of seats, weight, battery type, road infrastructure, battery charging infrastructure availability, charging time, etc.). Variable parameters include the battery’s state of charge (SOC), state of health (SOH), behavior, the driver’s driving style, traffic flow, the vehicle’s dynamic performance, battery management system (BMS), external weather factors, etc. [4].
The variable parameters are characterized by complex non-linear relationships that affect the vehicle’s range. These issues were described in publication [5]. One issue that was successfully resolved was the real-time estimation of the discharge process of a lithium-ion battery using a radial basis function neural network (RBF NN), which was ultimately applied to estimate the residual BEV range. Experimental results confirmed that the proposed method has a good estimation accuracy [6].
The biggest unknown for the energy management system (EMS) is the driver, who can influence the vehicle’s energy consumption in various ways, mostly through their preferred driving style and use of additional energy consumers, such as heating, ventilation, air-conditioning, audio, etc. The uncertainty of the real amount of electricity needed to cover the planned route is most likely the main obstacle for many potential, yet undecided buyers of electric vehicles (BEVs). A contributing factor is the variability of the predicted range, which is presented to the driver inside the vehicle by the energy management system. An alternative solution, or a compromise, is to purchase a hybrid vehicle (PHEV) [7]. Studies have shown that electric vehicle users use "safety buffers" to ensure they stay within range, enabling them to save up to 25% of the vehicle's range [8]. The range prediction accuracy was also identified as one of the top five priorities in the research and development of ITSs in support of electromobility [9]. It is therefore important for both the vehicle user and the designer to know the factors that affect the vehicle’s range.
The instantaneous traffic conditions in which a vehicle is driven affect its actual energy demand very strongly. The issue of choosing ways to control and generate the driving force at the wheels, depending on the instantaneous load arising from traffic conditions, is the subject of scientific studies. In publication [10], the authors analyzed the driving force compensation by using a supercharging system. On the other hand, in paper [11], Mamala et al. proposed a regulated compression ratio for a spark ignition engine. The effect of the vehicle’s acceleration intensity on its energy demand was also analyzed in publications [12,13]. In many studies, authors are dealing with vehicle movement dynamics which significantly affect its energy demand. Bokare et al. [14] and Eisele et al. [15] established a classification of acceleration value ranges for different types of vehicles based on studies conducted in real traffic. It is clear from their research that the actual maximum acceleration values depend on the vehicle’s speed and type, and they range from about 0.2 - 1.5 m/s2 in the case of passenger cars. Other authors [16] have proposed methods for estimating acceleration and fuel consumption from real data recorded in traffic.
The way a specific route is covered using a particular driving style is also the subject of analysis of many researchers. In work [5], the authors estimated the residual range for various driving styles, indicating that they substantially affect the energy demand. In work [17], the authors presented study results for the driving styles of older drivers in order to accurately account for differences in lead-vehicle operations for different driver subgroups. Hu et al. [18] have shown that energy consumption is in a part related to differences in infrastructure design, traffic conditions, and personal driving styles. The authors of work [19] analyzed the impact of the driving style on energy consumption for various drive unit types. In work [20], Sentoff et al. described the impact of the driving style and road infrastructure on the estimation of energy consumption and emissions. Some authors have defined the term "aggressive driving style" and emphasized the tremendous impact of the driving style preferred by some drivers on the vehicle’s energy demand, causing it to increase by more than 100%. Kim and Choi [21] reported the results of fuel consumption for various driving styles for a Liquid Petrol Gas (LPG) vehicle. On the other hand, Thomas et. al. [22] compared the fuel consumption of conventional and hybrid vehicles. Liu et al. [23] presented results for mild hybrid vehicles, while Sharer et al. [24] focused on HEVs.
In turn, many authors have addressed the use of eco-driving strategies to reduce the vehicle’s energy demand by emphasizing the significant potential of such a strategy to reduce the energy consumption, reaching up to several tens of percent relative to a non-eco-driving style. The strategies can vary for mixed gasoline and electric vehicles [25], HEVs and PHEVs [26], US light duty vehicles [27], human drivers and autonomous vehicles [28], in the event of using real-time traffic sensing and telematics [29]. The optimization of the classic Eco-adaptive cruise control (ACC) algorithm, supplemented with the predictive control (MPC) model, also brings tangible benefits in the form of reduction in instantaneous energy demand peaks and, as a result, a reduction in energy consumption [30].
A comparison of different driving strategies and styles in real-world conditions, resulting in specific values of dynamics and speed profiles, with the values set in type approval tests analyzed in publications [31,32,33], has shown significant discrepancies between the two. In principle, this can cause significant differences in the vehicle’s energy demand.
Another factor that substantially affects the vehicle’s energy consumption is the ambient conditions and the commonly associated increased energy demand to power additional comfort-related systems/equipment (heating, cooling and ventilation in the passenger compartment) [6,34,35]. At the same time, it is necessary to take into consideration the different functioning of most of the vehicle's systems due to the impact, for example, of low ambient temperature, associated with a decrease in their efficiency [36], a decrease in the electric energy storage’s real capacity [37], other issues related to their charging-discharging parameters [38] and failure [39]. Such discrepancies affect the vehicle’s real energy demand and consequently its range. This is especially important in terms of the usually much more limited energy storage capacity of electric vehicles. In various publications, energy consumption is estimated for constant speed driving using multi-objective optimization [40], road information [41], real-world driving data [42] or on a very large amount of data for many BEVs of different groups and sizes [43].
Some publications deal with the issue of energy demand optimization by using advanced control algorithms, such as the hypotrochoid spiral optimization algorithm [44] or the fuzzy controller [45].
Smart et al. [46] analyzed the distances traveled by EV drivers in every-day operation. The predominantly declared daily range for an electric vehicle was between 15 and 45 kilometers, accounting for about 34% of all vehicles analyzed, with the next range amounting to 45-60 kilometers.
The range shown for electric vehicles is also based on an analysis of the daily mileage per annum of many vehicles with internal combustion engines. The type of propulsion has no effect on the daily range of vehicles. A report conducted by Eurostat [47] contained an analysis of the mobility of individuals on a daily basis and shown that the people who covered the greatest distances lived in Germany. In this report, people covered a range of 19 km per day on average (Figure 1).
In work [48], the authors studied the mobility of people using electric and hybrid vehicles in the US market with a daily mileage of 16 km. It can therefore be assumed that hybrid vehicles with a limited driving range will satisfy the mobility needs of people in Europe and the US thanks to their electric mode (PHEV).
Energy demand for an electric drive unit in a PHEV hybrid vehicle
The energy needed to overcome the resistance during the vehicle's motion is supplied to the wheels by the drive unit through the transmission system. Therefore, the total energy demand takes into account not only the movement resistance, but also the losses between the drive unit and the vehicle’s wheels. Energy is supplied from storage to the drive unit with varying efficiency. Combustion engines have a significant energy loss, but the energy density of the fuel consumed is very high. This is the reason for the studied drive unit’s high input energy demand relative to its electrical energy demand. Examples of energy flows within a single drive unit are illustrated in the Sankey diagram (Figure 2), which also shows the aforementioned energy recovery that supplements the electric energy storage. The operation of an internal combustion engine involves a complete chain of conversion of the energy contained in the fuel into mechanical energy, which is then supplied to the vehicle's wheels. The amount of mechanical energy supplied to the wheels depends on a number of conditions, including the internal combustion engine’s operating point which affects the engine’s efficiency, as well as the external environment, the implemented speed profile and driving dynamics. The amount of energy supplied to the wheels is significantly smaller and ranges from 9% to 28%, and is analyzed in many works. In terms of the electric engine’s efficiency, the amount of energy supplied to the wheels is significantly higher and ranges from 65-82%, which is due to the absence of thermodynamic transformations resulting from fuel combustion in internal combustion engines. The use of energy sources with varying energy density in a single drive unit creates ambiguity with regard to total energy consumption. Energy consumption measurements take into account the energy expenditure from the storage units, i.e., the fuel tank or batteries. Some researchers, such as Yuan at al. [49] presented a mathematical model that covers all flow energy components, including a detailed determination of the efficiency of individual drive unit components.
However, the main factor that determines the energy demand is the actual driving conditions, which usually vary substantially and affect the vehicle’s range. Hence, the energy consumption during daily driving in real traffic conditions differs from the parameters obtained in the type approval test cycle. This is due to the fact that the differences that occur are determined, among other things, by random factors in the interaction pattern of the driver-environment-vehicle communication system (DEVS), and which significantly alter the individual energy flows in the vehicle’s energy balance (Figure 2). For example, it is possible to note a significant increase in energy consumption in heavy urban traffic (traffic jam, intermittent driving), even for the most technically advanced drive unit. This is an important issue, because literature studies [50] have shown that the environment in a sense dictates the driving style on a given road section by increasing the driving intensity and resulting in an increased energy expenditure of several tens of percent, regardless of the energy carrier (Figure 3).
The differences in fuel consumption shown do not arise from the drive unit used or its power supply, but from the conditions in which the vehicle was driven. Similar results were obtained by the authors in [51], who evaluated the energy consumption of Audi Q4 Sportback 50 e-tron electric vehicles in a road test conducted in normal traffic conditions (Table 1).
In this paper, energy consumption was analyzed against the WLTP test, showing that consumption increases by 76% at 140 km/h. Energy consumption per distance traveled can be calculated from correlation (1), the commonly used unit of which is (kWh/100km), which is similar to fuel consumption denoted in (l/100km). Such an approach to the vehicle's energy consumption enables the comparison of the impact of environmental factors for a specific vehicle's energy consumption model. In a PHEV hybrid engine, the most important quantities are the total energy expenditure and its operation cost.
The presented mileage energy consumption QL changes after mass is taken into account. Therefore, the vehicle’s unit energy consumption enables the evaluation of energy consumption over a certain distance and at a certain mass. The vehicle’s mass is the main energy-consuming component associated with its acceleration and depends on its speed profile and driving style [24]. Taking mass into consideration in energy consumption analysis allows for an objective evaluation and a reference to the total energy consumption of vehicles with different masses.
The DEVS model’s interdependencies and external factors for a vehicle’s hybrid engine are random structures, which can be described by an ordered seven, the components of which are defined by formula (3) below, according to the Discrete Event System Specification and Modeling Structure Guidelines [18]:
where: (X) – the DEVS model’s input variables, ET - Energy Unit Vehicle state variables in the propulsion system, (QTj ) – the model’s output variables, () – energy transfer’s internal function from the storage to E→ ET , () – external transition function DEVS x X ET, with DEVS input factor states, ( λ) – output function E T → QTj , (t) – progressive time increase.
It is a model used to enable the representation of all changes by events (nodes) that affect the output value of the vehicle's unit energy consumption. A study of events in individual energy flows enables the parameterization of the factors affecting the vehicle’s unit energy consumption index.
The DEVS model’s interdependencies can be represented as shown in the diagram below (Figure 4).
DEVS input vectors can be described as variables:
- driver (D) – determines the route, speed profile, dynamics and load on the drive unit
- environment (E) – determines the movement resistance power, temperature, interference
- vehicle (V) – determines the resistance power, mass, energy, interference
- system (S) – determines the traffic flow, acceleration, travel time
All energy flows indicated in the DEVS model affect the vehicle’s unit energy consumption in varying degrees, resulting in discrepancies between the mileage energy consumption in the type approval test and energy consumption in every-day driving.
In publication [51], the authors conducted a study on the energy consumption of an electric engine in real traffic conditions, arising from varying driving speeds. The road tests demonstrated significant discrepancies in the mileage energy consumption, ranging from 9.9 kWh/100 to 33.2 kWh/100km, depending on the vehicle’s type and driving speed. The data presented in paper [49] was used by its authors to develop a drawing that showed these dependencies (Figure 5). The difference between the "eco city" minimum value and the "140 km/h" maximum value, depending on the vehicle’s type, is a maximum of 3.3 times, while depending on the given vehicle type’s speed, the maximum difference is 2.3 times. The values shown cannot be compared to each other due to their differing structures and, above all, the vehicle’s mass, which was emphasized by Kropiwnicki [52] who compared electric and internal combustion engines in terms of their unit energy consumption [13], including the unit energy consumption of a hybrid vehicle.
The differences between specific vehicles, their minimum and maximum values, were reduced significantly in terms of their unit energy consumption in the same traffic conditions. The difference between the minimum unit energy consumption for the "eco city" mode and the maximum consumption for the 140 km/h speed has changed significantly, and is now 2.4 times. The values have not changed for the same vehicle. The vehicle with the lowest unit energy consumption in urban traffic is the Hyundai Kona Electric, while the best results for the set speeds were achieved by the BMW IX3, which has a slightly higher unit energy consumption in urban traffic than the best Hyundai.
Research methodology
The vehicle’s unit energy consumption is a varying index dependent on many conditions, including the drive unit’s type, its movement parameters, dynamics, travel speed, environmental conditions or the driver’s preferences. In the case of hybrid engines, the drive units’ interoperation cannot be measured in terms of the storage unit’s energy expenditure. Therefore, the main objective of this study was to evaluate the hybrid vehicle’s energy demand expressed in the unit energy consumption index for PHEV hybrid vehicle in year-round operating conditions. The vehicle’s unit energy consumption in the TTW formula (Tank To Wheels) denotes the vehicle’s real energy performance. The vehicle's unit energy consumption index is denoted in universal units, expressing the energy [J] required to cover a distance of 1 m at 1 kg of vehicle weight. Energy consumption statistics for various conditions of every-day driving, but mainly for the electric engine, were taken into account in the evaluation.
The following assumptions were made in the research methodology:
- a driving analysis was carried out for the dominant mileage derived from the year-round mileage histogram (Figure 6). The value shown denotes a single trip in the range of 50 km, with a standard deviation of 5 km,
- the presented dominant mileage, having taken into account the standard deviation, denoted the range of approximate mileages analyzed in terms of the vehicle's unit energy consumption,
- the presented dominant mileage is within the electric engine’s driving range and the analysis only covered trips starting at 100% of the electric energy storage’s charge. The internal combustion engine only performed an auxiliary function,
- the vehicle's technical data has shown that the electric engine should enable covering the entire distance of 50 km during the road tests,
- the unit energy consumption was evaluated for constant driving speeds.
The analysis of the vehicle's unit energy consumption index was carried out for the vehicle’s actual operating conditions resulting from daily travels characterized by arbitrary route selection, including random driver choices in the standard hybrid engine control mode. A total of 297 trips were analyzed, including 120 trips analyzed in detail due to the fact that they met the adopted dominant distance criteria.
The test vehicle was a Mercedes-Benz A 250e manufactured in 2021, equipped a parallel full hybrid drive unit with two engines (a 75 kW electric engine and a 118 kW internal combustion engine) located on the front driving axle (Table.3).
The vehicle's traction and energy parameters were monitored during every-day driving with the use of vehicle-dedicated software and a TEXA diagnostic system, including simultaneous data recording.
Analysis of the test vehicle’s distance and energy indices
The authors evaluated the energy demand (especially the electricity demand) of selected hybrid vehicles (PHEVs) in every-day operating conditions in Poland for a period of 12 months. Figure 6 shows the average distance traveled by PHEVs in every-day operating conditions. The distance ranged from 45 to 55 kilometers. It was found that such a distance ensured the predominant use of the electric engine, which minimized fuel consumption.
The conversion of the average mileage fuel consumption into carbon dioxide emissions in year-round operation demonstrated that the tested vehicles’ performance was very good in terms of the 2021 EURO 6 (AP) emissions standard of around 95 g/km. The carbon dioxide emissions, both for the entire year and for individual quarters, were lower than the cited standard (Figure 7).
The carbon dioxide emissions presented in the figures refer to different operating conditions (spring, summer, autumn, winter) over a total distance of 30000 km. The evaluated trips vary in terms of traffic conditions, driving style preferences or ambient conditions, including ambient temperature and road infrastructure. The analyzed trips obviously differ in terms of energy consumption and distance traveled, but all of them involved the predominant use of the electric engine due to the distance traveled (Figure 8a), as mentioned above.
The chart presenting the distance traveled clearly shows the predominant use of the electric engine, with the annual average accounting for 80%, including individual instances when the distance traveled was approximately 600 km. For all trips, the internal combustion engine’s participation only amounted to 20% on average. The internal combustion engine was usually activated in three traffic situations:
at high driving speeds (highway - at speeds above 120 km/h),
during overtaking and dynamic acceleration (high power sections),
when the electric energy storage was depleted.
The first two situations raise no objections, as the vehicle's parallel hybrid drive unit allows both engines to operate together. According to the WLTP (Worldwide Harmonized Light-Duty Vehicles Test Procedure), the vehicle’s range while using the electric engine is supposed to ensure a distance of 75km, so the electric engine should cover 100% of the vehicle's energy demand. This is not the case however if Figure 5b is taken into account. Disregarding routes with significant ranges, e.g., holiday trips, where the energy consumption reaches 75%, the average annual energy demand for the entire drive unit is 53%. A direct comparison of the energy of the engines in a hybrid drive unit is difficult, especially since there vehicle’s deceleration process involves energy recovery which distorts the energy demand. When analyzing the energy balance of a vehicle with a hybrid drive unit, moving in road conditions, the balance’s starting value is 100% of the energy supplied from both storage units to the respective engines during the trip.
However, regardless of the engine used, the vehicle's power demand depend on the instantaneous traffic conditions. Therefore, the authors in this publication paid special attention to the assessment of the energy consumption in a PHEV’s every-day operation and to the use of its electric engine compared to an all-electric BEV described in the literature [4,7].
Energy consumption of an electric engine in a hybrid drive unit
When analyzing the results of the trips in terms of statistics, it is clear that the longer the route, the lower the share of the electric engine’s use in the hybrid drive unit, which can explained by the depletion of the energy storage unit, and the mileage indicated for the electric drive unit is a result of energy recovery from the drive unit. The energy recovery amounts to approx. 25% for longer trips, as shown in Figure 9.
Nevertheless, the beginning and end of each vehicle trip is determined in standstill, therefore the sum of kinetic energy in the drive unit is zero. It is possible to describe the input energy in the engines in the vehicle's entire drive unit chain with the following equation:
where: energy consumption in movement (EM ), i.e., energy needed to overcome the car's resistance to movement, engine energy losses (ΔEE ) and drive unit losses - from engine to wheels (ΔED ), as well as losses in energy supplied to the drive unit without transmission to the drive wheels (ΔEL ) – the vehicle’s standstill phase, among others, and energy recovery (ΔER ) during deceleration.
The energy supplied through the power transmission system to the engines is then supplied to the drive wheels only during the propulsion phase characterized by acceleration or when driving at a constant speed. This energy is needed to cover the assumed distance and is determined by the balance component (EM). Many works analyze the energy consumption by using equation (1), but this is mainly for drive units with the same engine structure. For hybrid drive units, the TTW rate is quite different and depends on the engines used and the energy storage unit’s capacity. In addition, there is the energy recovery process in the vehicle’s every-day driving, which takes places when the driving force is not applied to its wheels, during coasting or braking. This creates an opportunity to reverse the force flow and to recover energy from the wheels. The energy storage unit is thereby replenished with an additional energy input (Figure 3).
The vehicle’s unit energy consumption index
An analysis of the vehicle's unit energy consumption index was carried out according to the adopted methodology in the conditions of every-day driving throughout a year-long period, i.e., in various weather and road conditions, in urban and non-urban traffic. The distinguishing factor was the vehicle mileage for which the average road conditions were determined on a quarterly basis. Table 4 shows the traction and energy parameters for the analyzed trips at different periods throughout the year.
Periods II and III involved the predominant use of the electric engine in the hybrid drive unit, while the internal combustion engine was turned on occasionally for short periods to increase the vehicle’s instantaneous speed or to assist the vehicle’s intense acceleration on the road.
Figure 10 shows each engine’s operation times in the studied drive unit.
In terms of individual percentage shares, the internal combustion engine’s maximum share was 15% for group IV (winter period). As shown in Table 4, the average trip distances in each period did not differ much. However, the unit energy consumption of the vehicle's electric engine varied significantly from period to period throughout the year (Figure 11).
In paper [], the authors estimated the unit energy consumption’s variation with respect to temperature with an I-order equation, showing an increase of 0.0154 (J/(kg·m)) for each degree of temperature increase from -15o C to 18oC. The highest unit energy consumption occurred during the winter period (group IV). It is therefore possible to estimate the change in the DEVS model’s energy consumption, caused by a change in ambient temperature with the following function
where: T - ambient temperature, C - test vehicle’s constant of 0.5664.
In study [53], it was noted that no trip met the vehicle's unit energy consumption criterion and did not reach the limit from the WLTP test at temperatures below 5oC. In this case, for the analyzed dominant distance, the internal combustion engine was enabled to complete the trip on the assumed road section. It also resulted in a significant reduction in the vehicle’s nominal mileage estimated by its drive unit’s ECU. At the same time, the test vehicle’s average unit energy consumption is approx. 30% higher relative to all-electric vehicles (Figure 5b).
The mileage energy consumption of the test vehicle’s electric engine presented in Table 4 is summarized for a set vehicle speed and an average drive speed in urban traffic. In this case, the test vehicle achieved a significant increase in energy consumption, twice that of the all-electric drive units shown in Table 1. The energy consumption increases by as much as about 150%, as shown in Figure 12.
In this case, it is possible to estimate the variation in unit energy consumption against vehicle speed with an I-order equation, showing an increase of 0.0036 (J/(kg·m)) for each increase in speed of 1 km/h. The vehicle’s lowest unit energy consumption was measured for 60 km/h and amounted to 0.3 (J/(kg·m)), whereas the increase in the vehicle’s unit energy consumption from the speed of 60 km/h to 140 km/h was as high as 150% (Figure 13). For the vehicle's set speed, its estimated unit energy consumption in the DEVS model can be described with the following equation (10)
where: v - vehicle speed, C2 - test vehicle’s constant of 0.1176.
Figure 13 shows the impact of vehicle speed on its unit energy consumption in the context of the limit set by the WLTP cycle. After taking into account equation (2), it is clear that the energy consumption limit is not met above the vehicle speed of 90 km/h.
In summary, the analyzed factors which affect the energy demand in road conditions during every-day driving also affect the vehicle's unit energy consumption index. Its increase in a group of factors related to the environment and the vehicle parameters is clear and has a direct impact on the range estimated by the vehicle’s ECU. However, real operating conditions involve significant differences between the estimated and actual range as shown in [51]. In the case of the analyzed electric drive unit, the differences are very significant and amount to 38.6%, most likely due to the energy storage unit’s small capacity (Fig 14). Factors such as cold starting, low ambient temperature or high vehicle speed have a decisive impact on the vehicle’s unit energy consumption.
Summary
Modeling the energy demand of a passenger vehicle equipped with a hybrid drive unit in real driving conditions is not an easy task. The number of factors that affect energy consumption is substantial, making it even more difficult to compare the energy demand of different vehicles. An analysis of the unit energy consumption index for a vehicle driven at a set speed and only using its electric engine shows the disadvantage of the PHEV hybrid vehicle, as shown in Figure 15.
The changes in the vehicle's unit energy consumption at set speeds are smaller than at variable speeds despite the difference in the mass of all-electric vehicles and the studied hybrid vehicle. In this context, a change in the test vehicle’s unit energy consumption relative to external temperature generates the largest changes, which at -15oC reach nearly a 140% increase relative to the temperature derived from the WLTP cycle.
Taking into account the above conclusions, it can be summarized that a hybrid vehicle’s unit energy consumption index is higher for both environmental factors and vehicle or system parameters, as described by the DEVS model. The resulting difference causes the vehicle’s ECU to underestimate the energy demand by an average of 39%. It is a significantly larger underestimation relative to all-electric vehicles, as shown in Figure 15.
Nevertheless, the presented analysis of the vehicle’s unit energy consumption index in relation to the commonly used mileage energy consumption denoted in kWh/100km (l/100km for internal combustion engines) demonstrates that the index is reliable. It takes into account the most important energy consumption factor, i.e., the vehicle mass. The widespread use of this simple energy consumption index allows for an objective assessment of the vehicle’s energy demand, in which case its value is directly proportional to the driving dynamics and therefore the driver’s driving style, i.e., factors on which vehicle manufacturers have limited influence. This issue was presented in more detail in paper [13]. In addition, the dimension of the index represents the demand for energy required to move a vehicle with 1 kg in mass over a distance of 1 meter.
Abbreviations
λ – output function E T → QTj,
– energy consumption in the DEVS model due to changes in ambient temperature [J],
– energy consumption in the DEVS model due to changes in vehicle speed [J],
– internal function of energy transfer from storage to E→ ET ,
– external transition function DEVS x X ET with DEVS input factor states,
a – mean acceleration of profile [m/s2],
AMR – Allied Market Research,
BEV – Battery Electric Vehicle,
BMS – battery management system,
C – test vehicle constant of 0.5664,
C2 – test vehicle constant of 0.1176,
DEVS - driver-environment-vehicle communication system,
E – energy [J],
ECU – Engine Control Unit,
EE – electricity,
EM – energy consumption in motion [J],
EMS – energy management system,
ER – rolling resistance energy [J],
ET – Energy Unit Vehicle state variables in the propulsion system,
EURO6 – European Union emissions standard,
EV – Electric Vehicle,
FC – Fuel consumption during test [g],
ICE – Internal Combustion Engine,
ICEV – Internal Combustion Engine Vehicle,
L – distance [m],
Le – distance driven by electric unit [m],
LT – total distance driven [m],
M – mass [kg],
NVH – environment interference,
P – Power [W],
PHEV – Plug-in Hybrid Electric Vehicle,
Qe – distance-related electric energy consumption [kWh/100km],
Qf – distance-related fuel consumption [dm3/100km],
QL – mileage energy consumption,
QmL – mass-related energy consumption [J/kg],
QTj – total unit energy consumption [J/m·kg-1],
QTj, – total unit energy consumption [J/(kg m)],
QTje, – electric engine’s unit energy consumption [J/(kg m)],
QTjp, – combustion engine’s unit energy consumption [J/(kg m)],
RBF NN – radial basis function neural network,
SOC – battery’s state of charge,
SOH – battery’s state of health,
T – ambient temperature [oC],
t – time progression,
te – drive end time [s],
ts – drive start time [s],
tT – total drive time [min],
TTW – Tank To Wheels,
V – mean vehicle speed [m/s],
v – vehicle speed [m/s],
WLTP – Worldwide Harmonized Light-Duty Vehicles Test Procedure,
Wo – calorific value [MJ/kg],
X – Input variables from the DEVS model,
ΔED – drive unit losses – engine-to-wheels [J],
ΔEE – engine energy losses [J],
ΔEL – losses in energy supplied to the drive unit without transmission to the driving wheels [J],
ΔER – energy recovery during car deceleration [J],
ω – drive unit rotation speed [RPM].
References
- Varga, B.O.; Mariasiu, F. Indirect Environment-Related Effects of Electric Car Vehicles Use. Environ. Eng. Manag. J. 2018, 17. [Google Scholar] [CrossRef]
- Raport Electric Vehicle Market - Global Opportunity Analysis and Industry Forecast, 2020–2027. Allied Mark. Res. 2020, 256.
- Szumska, E.M.; Jurecki, R.S. Parameters Influencing on Electric Vehicle Range. Energies 2021, 14. [Google Scholar] [CrossRef]
- Varga, B.O.; Sagoian, A.; Mariasiu, F. Prediction of Electric Vehicle Range: A Comprehensive Review of Current Issues and Challenges. Energies 2019, 12. [Google Scholar] [CrossRef]
- Ceraolo, M.; Pede, G. Techniques for Estimating the Residual Range of an Electric Vehicle. IEEE Trans. Veh. Technol. 2001, 50, 109–115. [Google Scholar] [CrossRef]
- Bi, J.; Wang, Y.; Shao, S.; Cheng, Y. Residual Range Estimation for Battery Electric Vehicle Based on Radial Basis Function Neural Network. Meas. J. Int. Meas. Confed. 2018, 128. [Google Scholar] [CrossRef]
- Franke, T.; Krems, J.F. Interacting with Limited Mobility Resources: Psychological Range Levels in Electric Vehicle Use. Transp. Res. Part A Policy Pract. 2013, 48. [Google Scholar] [CrossRef]
- Birrell, S.A.; McGordon, A.; Jennings, P.A. Defining the Accuracy of Real-World Range Estimations of an Electric Vehicle. In Proceedings of the 2014 17th IEEE International Conference on Intelligent Transportation Systems, ITSC 2014; 2014. [Google Scholar]
- Hübner, Y.; Blythe, P.T.; Hill, G.A.; Neaimeh, M.; Higgins, C. ITS for Electric Vehicles - An Electromobility Roadmap. In Proceedings of the IET Conference Publications; 2012; Vol. 2012. [Google Scholar]
- Mamala, J.J. 2011.
- Mamala, J.; Graba, M.; Praznowski, K.; Hennek, K. Control of the Effective Pressure in the Cylinder of a Spark-Ignition Engine by Electromagnetic Valve Actuator. In Proceedings of the SAE Technical Papers; SAE International, April 2019; Vol. 2019-April. [Google Scholar]
- Mamala, J.; Jantos, J.; Brol, S.; Malewicz, K.; Bieniek, A. The System of Supercharging for the Spark Ignition Engine; 2007; Vol. 14;
- Graba, M.; Mamala, J.; Bieniek, A.; Sroka, Z. Impact of the Acceleration Intensity of a Passenger Car in a Road Test on Energy Consumption. Energy 2021, 226, 120429. [Google Scholar] [CrossRef]
- Bokare, P.S.; Maurya, A.K. Acceleration-Deceleration Behaviour of Various Vehicle Types. Transp. Res. Procedia 2017, 25, 4733–4749. [Google Scholar] [CrossRef]
- Eisele, W.L.; Turner, S.M.; Benz, R.J. Using Acceleration Characteristics in Air Quality and Energy Consumption Analyses Texas Transportation Institute The Texas A & M University System College Station, Texas 77843-3135 Southwest Region University Transportation Center Texas Transportation In. 1996, 7.
- Wang, M.; Daamen, W.; Hoogendoorn, S.; Van Arem, B. Estimating Acceleration, Fuel Consumption, and Emissions from Macroscopic Traffic Flow Data. Transp. Res. Rec. 2011, 123–132. [Google Scholar] [CrossRef]
- Belz, N.P.; Aultman-Hall, L. Analyzing the Effect of Driver Age on Operating Speed and Acceleration Noise. Transp. Res. Rec. 2011, 184–191. [Google Scholar] [CrossRef]
- Hu, K.; Wu, J.; Schwanen, T. Differences in Energy Consumption in Electric Vehicles: An Exploratory Real-World Study in Beijing. J. Adv. Transp. 2017. [Google Scholar] [CrossRef]
- Lenaers, G. Real Life CO2 Emission and Consumption of Four Car Powertrain Technologies Related to Driving Behaviour and Road Type. In Proceedings of the SAE Technical Papers; SAE International; 2009. [Google Scholar]
- Sentoff, K.M.; Aultman-Hall, L.; Holmén, B.A. Implications of Driving Style and Road Grade for Accurate Vehicle Activity Data and Emissions Estimates. Transp. Res. Part D Transp. Environ. 2015, 35, 175–188. [Google Scholar] [CrossRef]
- Kim, E.; Lee, J.; Shin, K.G. Real-Time Prediction of Battery Power Requirements for Electric Vehicles. 2013 ACM/IEEE Int. Conf. Cyber-Physical Syst. 2013; 20. [Google Scholar] [CrossRef]
- Thomas, J.; Huff, S.; West, B.; Chambon, P. Fuel Consumption Sensitivity of Conventional and Hybrid Electric Light-Duty Gasoline Vehicles to Driving Style. SAE Int. J. Fuels Lubr. 2017, 10. [Google Scholar] [CrossRef]
- Liu, Z.; Ivanco, A.; Filipi, Z.S. Impacts of Real-World Driving and Driver Aggressiveness on Fuel Consumption of 48V Mild Hybrid Vehicle. SAE Int. J. Altern. Powertrains 2016, 5, 249–258. [Google Scholar] [CrossRef]
- Sharer, P.; Leydier, R.; Rousseau, A. Impact of Drive Cycle Aggressiveness and Speed on HEVs Fuel Consumption Sensitivity. SAE Tech. Pap. 2007. [Google Scholar] [CrossRef]
- He, X.; Wu, X. Eco-Driving Advisory Strategies for a Platoon of Mixed Gasoline and Electric Vehicles in a Connected Vehicle System. Transp. Res. Part D Transp. Environ. 2018, 63, 907–922. [Google Scholar] [CrossRef]
- Zhang, F.; Hu, X.; Langari, R.; Cao, D. Energy Management Strategies of Connected HEVs and PHEVs: Recent Progress and Outlook. Prog. Energy Combust. Sci. 2019, 73, 235–256. [Google Scholar] [CrossRef]
- Berry, M. The Effect of Driving Style and Vehicle Performance on the Real-World Fuel Consumption of US Light - Duty Vehicles, Massachusetts Institute of Technology, 2010, Vol. 41.
- Wu, C.; Zhao, G.; Ou, B. A Fuel Economy Optimization System with Applications in Vehicles with Human Drivers and Autonomous Vehicles. Transp. Res. Part D Transp. Environ. 2021, 16, 515–524. [Google Scholar] [CrossRef]
- Barth, M.; Boriboonsomsin, K. Energy and Emissions Impacts of a Freeway-Based Dynamic Eco-Driving System. Transp. Res. Part D Transp. Environ. 2009, 14, 400–410. [Google Scholar] [CrossRef]
- Pan, C.; Huang, A.; Wang, J.; Chen, L.; Liang, J.; Zhou, W.; Wang, L.; Yang, J. Energy-Optimal Adaptive Cruise Control Strategy for Electric Vehicles Based on Model Predictive Control. Energy 2022, 241, 122793. [Google Scholar] [CrossRef]
- Carlson, R.B.; Lohse-Busch, H.; Duoba, M.; Shidore, N. Drive Cycle Fuel Consumption Variability of Plug-in Hybrid Electric Vehicles Due to Aggressive Driving. In Proceedings of the SAE Technical Papers; SAE International, April 2009; pp. 1–8. [Google Scholar]
- Rask, E.; Santini, D.; Lohse-Busch, H. Analysis of Input Power, Energy Availability, and Efficiency during Deceleration for X-EV Vehicles. SAE Int. J. Altern. Powertrains 2013, 2, 350–361. [Google Scholar] [CrossRef]
- Hayes, J.G.; De Oliveira, R.P.R.; Vaughan, S.; Egan, M.G. Simplified Electric Vehicle Power Train Models and Range Estimation. 2011 IEEE Veh. Power Propuls. Conf. VPPC 2011 2011. [Google Scholar] [CrossRef]
- Badin, F.; Le Berr, F.; Briki, H.; Dabadie, J.C.; Petit, M.; Magand, S.; Condemine, E. Evaluation of EVs Energy Consumption Influencing Factors: Driving Conditions, Auxiliaries Use, Driver’s Aggressiveness. World Electr. Veh. J. 2013, 6, 112–123. [Google Scholar] [CrossRef]
- Evtimov, I.; Ivanov, R.; Sapundjiev, M. Energy Consumption of Auxiliary Systems of Electric Cars. MATEC Web Conf. 2017, 133, 2–6. [Google Scholar] [CrossRef]
- Wang, K. Study on Low Temperature Performance of Li Ion Battery. OALib 2017, 04, 1–12. [Google Scholar] [CrossRef]
- Lv, S.; Wang, X.; Lu, W.; Zhang, J.; Ni, H. The Influence of Temperature on the Capacity of Lithium Ion Batteries with Different Anodes. Energies 2022, 15. [Google Scholar] [CrossRef]
- Wang, H.; Liu, J.; Xia, D.; Fu, Y.; Zhu, Y.; Hu, B.; Tao, Z.; Xiao, H.; Deng, S. Effect of Low Temperatures on Battery Recharge and Discharge Voltage. IOP Conf. Ser. Earth Environ. Sci. 2020, 571. [Google Scholar] [CrossRef]
- Galatro, D.; Al-Zareer, M.; Da Silva, C.; Romero, D.A.; Amon, C.H. Thermal Behavior of Lithium-Ion Batteries: Aging, Heat Generation, Thermal Management and Failure. Front. Heat Mass Transf. 2020, 14, 1–18. [Google Scholar] [CrossRef]
- Vaz, W.; Nandi, A.K.R.; Landers, R.G.; Koylu, U.O. Electric Vehicle Range Prediction for Constant Speed Trip Using Multi-Objective Optimization. J. Power Sources 2015, 275, 435–446. [Google Scholar] [CrossRef]
- Wang, J.; Besselink, I.; Nijmeijer, H. Electric Vehicle Energy Consumption Modelling and Prediction Based on Road Information. World Electr. Veh. J. 2015, 7, 447–458. [Google Scholar] [CrossRef]
- Wang, H.; Zhang, X.; Ouyang, M. Energy Consumption of Electric Vehicles Based on Real-World Driving Patterns: A Case Study of Beijing. Appl. Energy 2015, 157, 710–719. [Google Scholar] [CrossRef]
- Cui, D.; Wang, Z.; Liu, P.; Wang, S.; Zhang, Z.; Dorrell, D.G.; Li, X. Battery Electric Vehicle Usage Pattern Analysis Driven by Massive Real-World Data. Energy 2022, 250, 123837. [Google Scholar] [CrossRef]
- Wang, W.; Chen, Y.; Yang, C.; Li, Y.; Xu, B.; Xiang, C. An Enhanced Hypotrochoid Spiral Optimization Algorithm Based Intertwined Optimal Sizing and Control Strategy of a Hybrid Electric Air-Ground Vehicle. Energy 2022, 257, 124749. [Google Scholar] [CrossRef]
- Miranda, M.H.R.; Silva, F.L.; Lourenço, M.A.M.; Eckert, J.J.; Silva, L.C.A. Vehicle Drivetrain and Fuzzy Controller Optimization Using a Planar Dynamics Simulation Based on a Real-World Driving Cycle. Energy 2022, 257, 124769. [Google Scholar] [CrossRef]
- Smart, J.; Powell, W.; Schey, S. Extended Range Electric Vehicle Driving and Charging Behavior Observed Early in the EV Project. SAE Tech. Pap. 2013; 14. [Google Scholar] [CrossRef]
- Eurostat Average Distance per Person per Day (Kilometres).
- McDonald, L. Average Daily Vehicle Miles Traveled (VMT) Is a Uuseless Indicator of Required BEV Range by US Customers Available online: https://evadoption.com/.
- Yuan, X.; Zhang, C.; Hong, G.; Huang, X.; Li, L. Method for Evaluating the Real-World Driving Energy Consumptions of Electric Vehicles. Energy 2017, 141, 1955–1968. [Google Scholar] [CrossRef]
- Spalding, S. Prepared by RACQ Vehicle Technologies Department. pp. 1–9.
- Niechaj, T. Elektryczne Audi Q4 Sportback 50 E-Tron Quattro: 300 KM i Zasięg Ok. 450 Km w Mieście. (The Electric Audi Q4 Sportback 50 e-Tron Quattro: 300 Hp and a Range of Approx. 450 Km in the City.).
- Kropiwnicki, J. A Unified Approach to the Analysis of Electric Energy and Fuel Consumption of Cars in City Traffic. Energy 2019, 182, 1045–1057. [Google Scholar] [CrossRef]
- Mamala, J.; Graba, M.; Bieniek, A.; Prażnowski, K.; Augustynowicz, A.; Śmieja, M. Study of Energy Consumption of a Hybrid Vehicle in Real-World Conditions. Eksploat. i Niezawodn. 2021, 23, 636–645. [Google Scholar] [CrossRef]
Figure 1.
Mobility of people by country in Europe [47].
Figure 1.
Mobility of people by country in Europe [47].
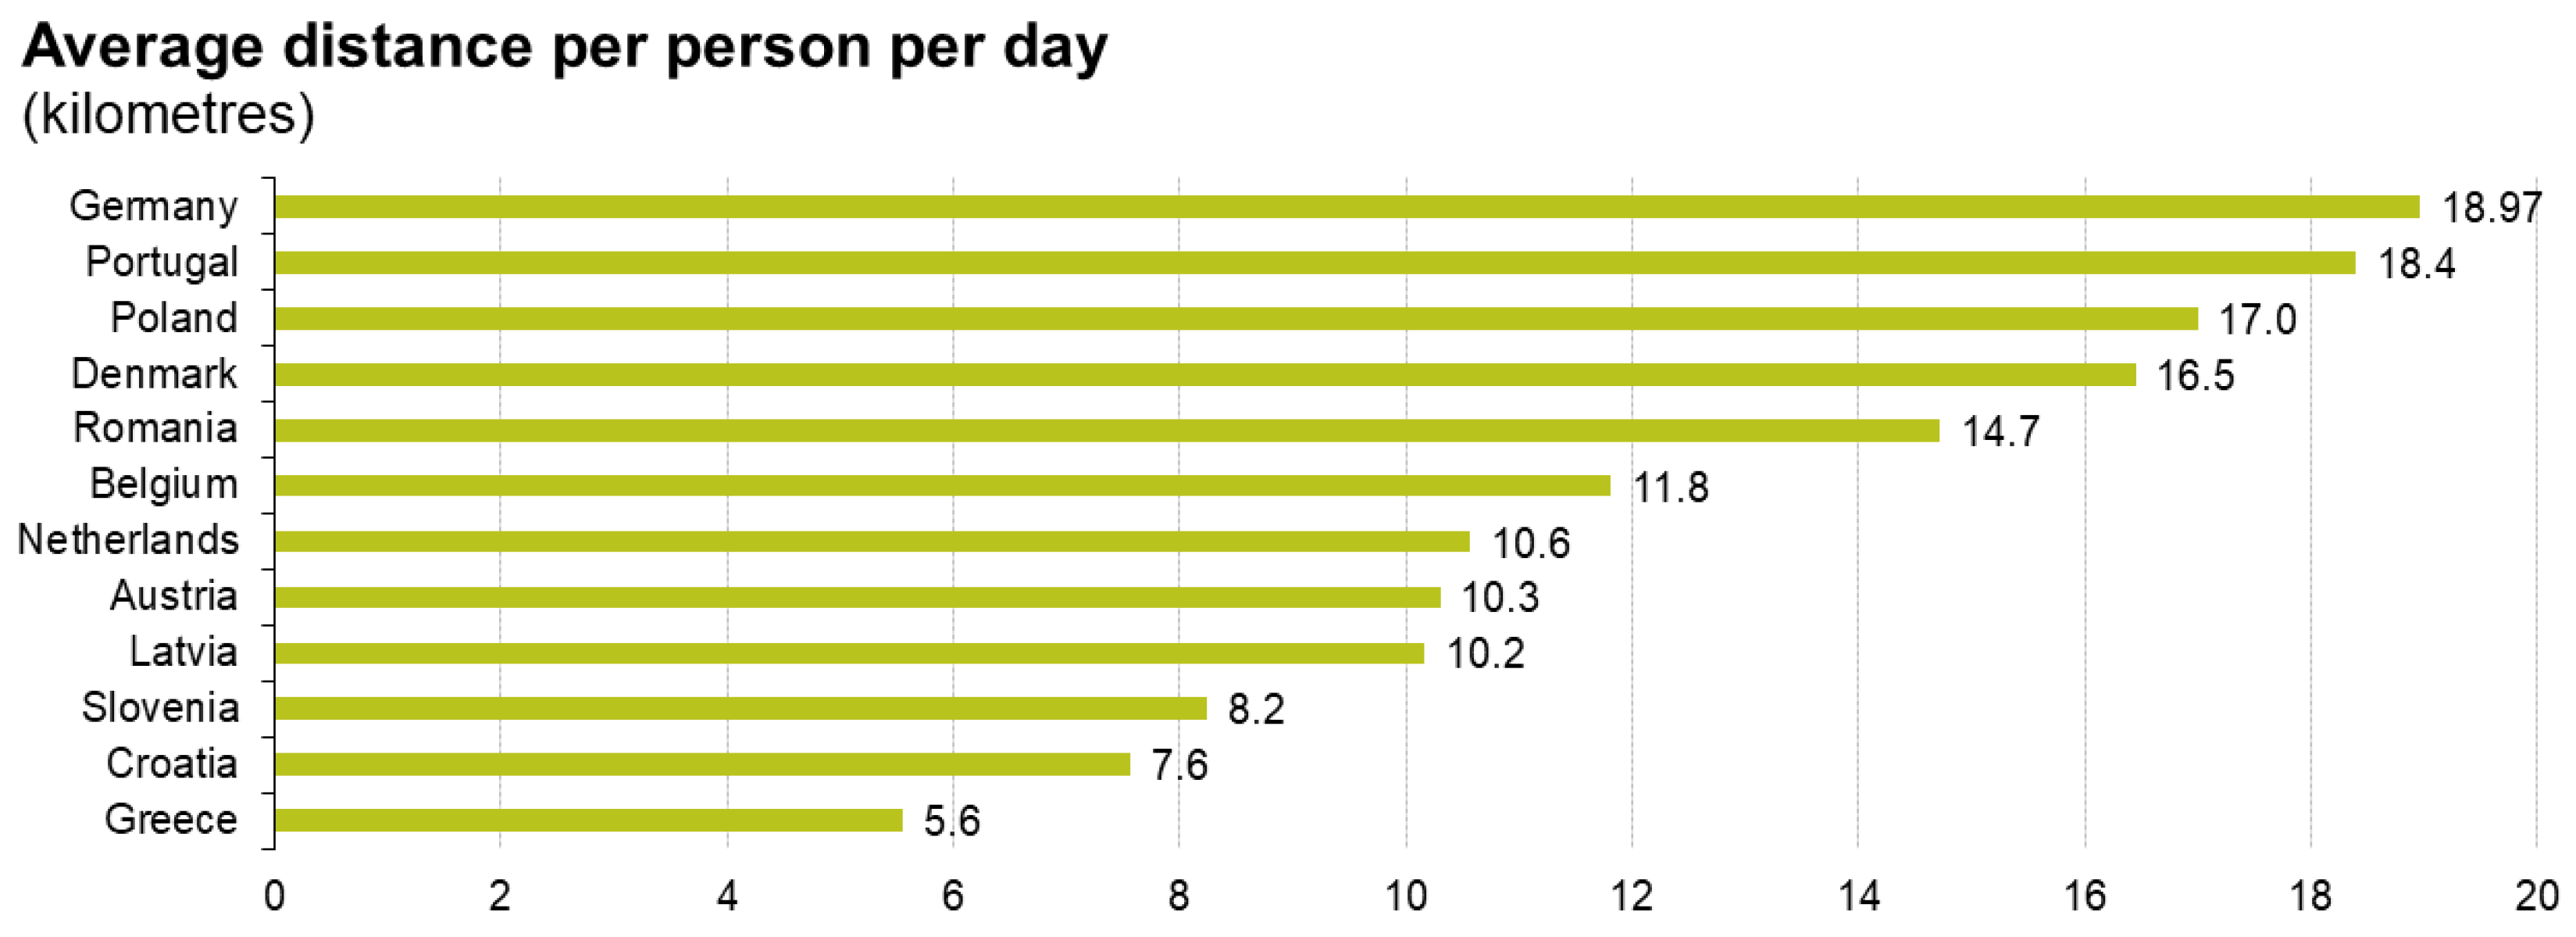
Figure 2.
Senkey diagram showing energy flow for a hybrid engine system.
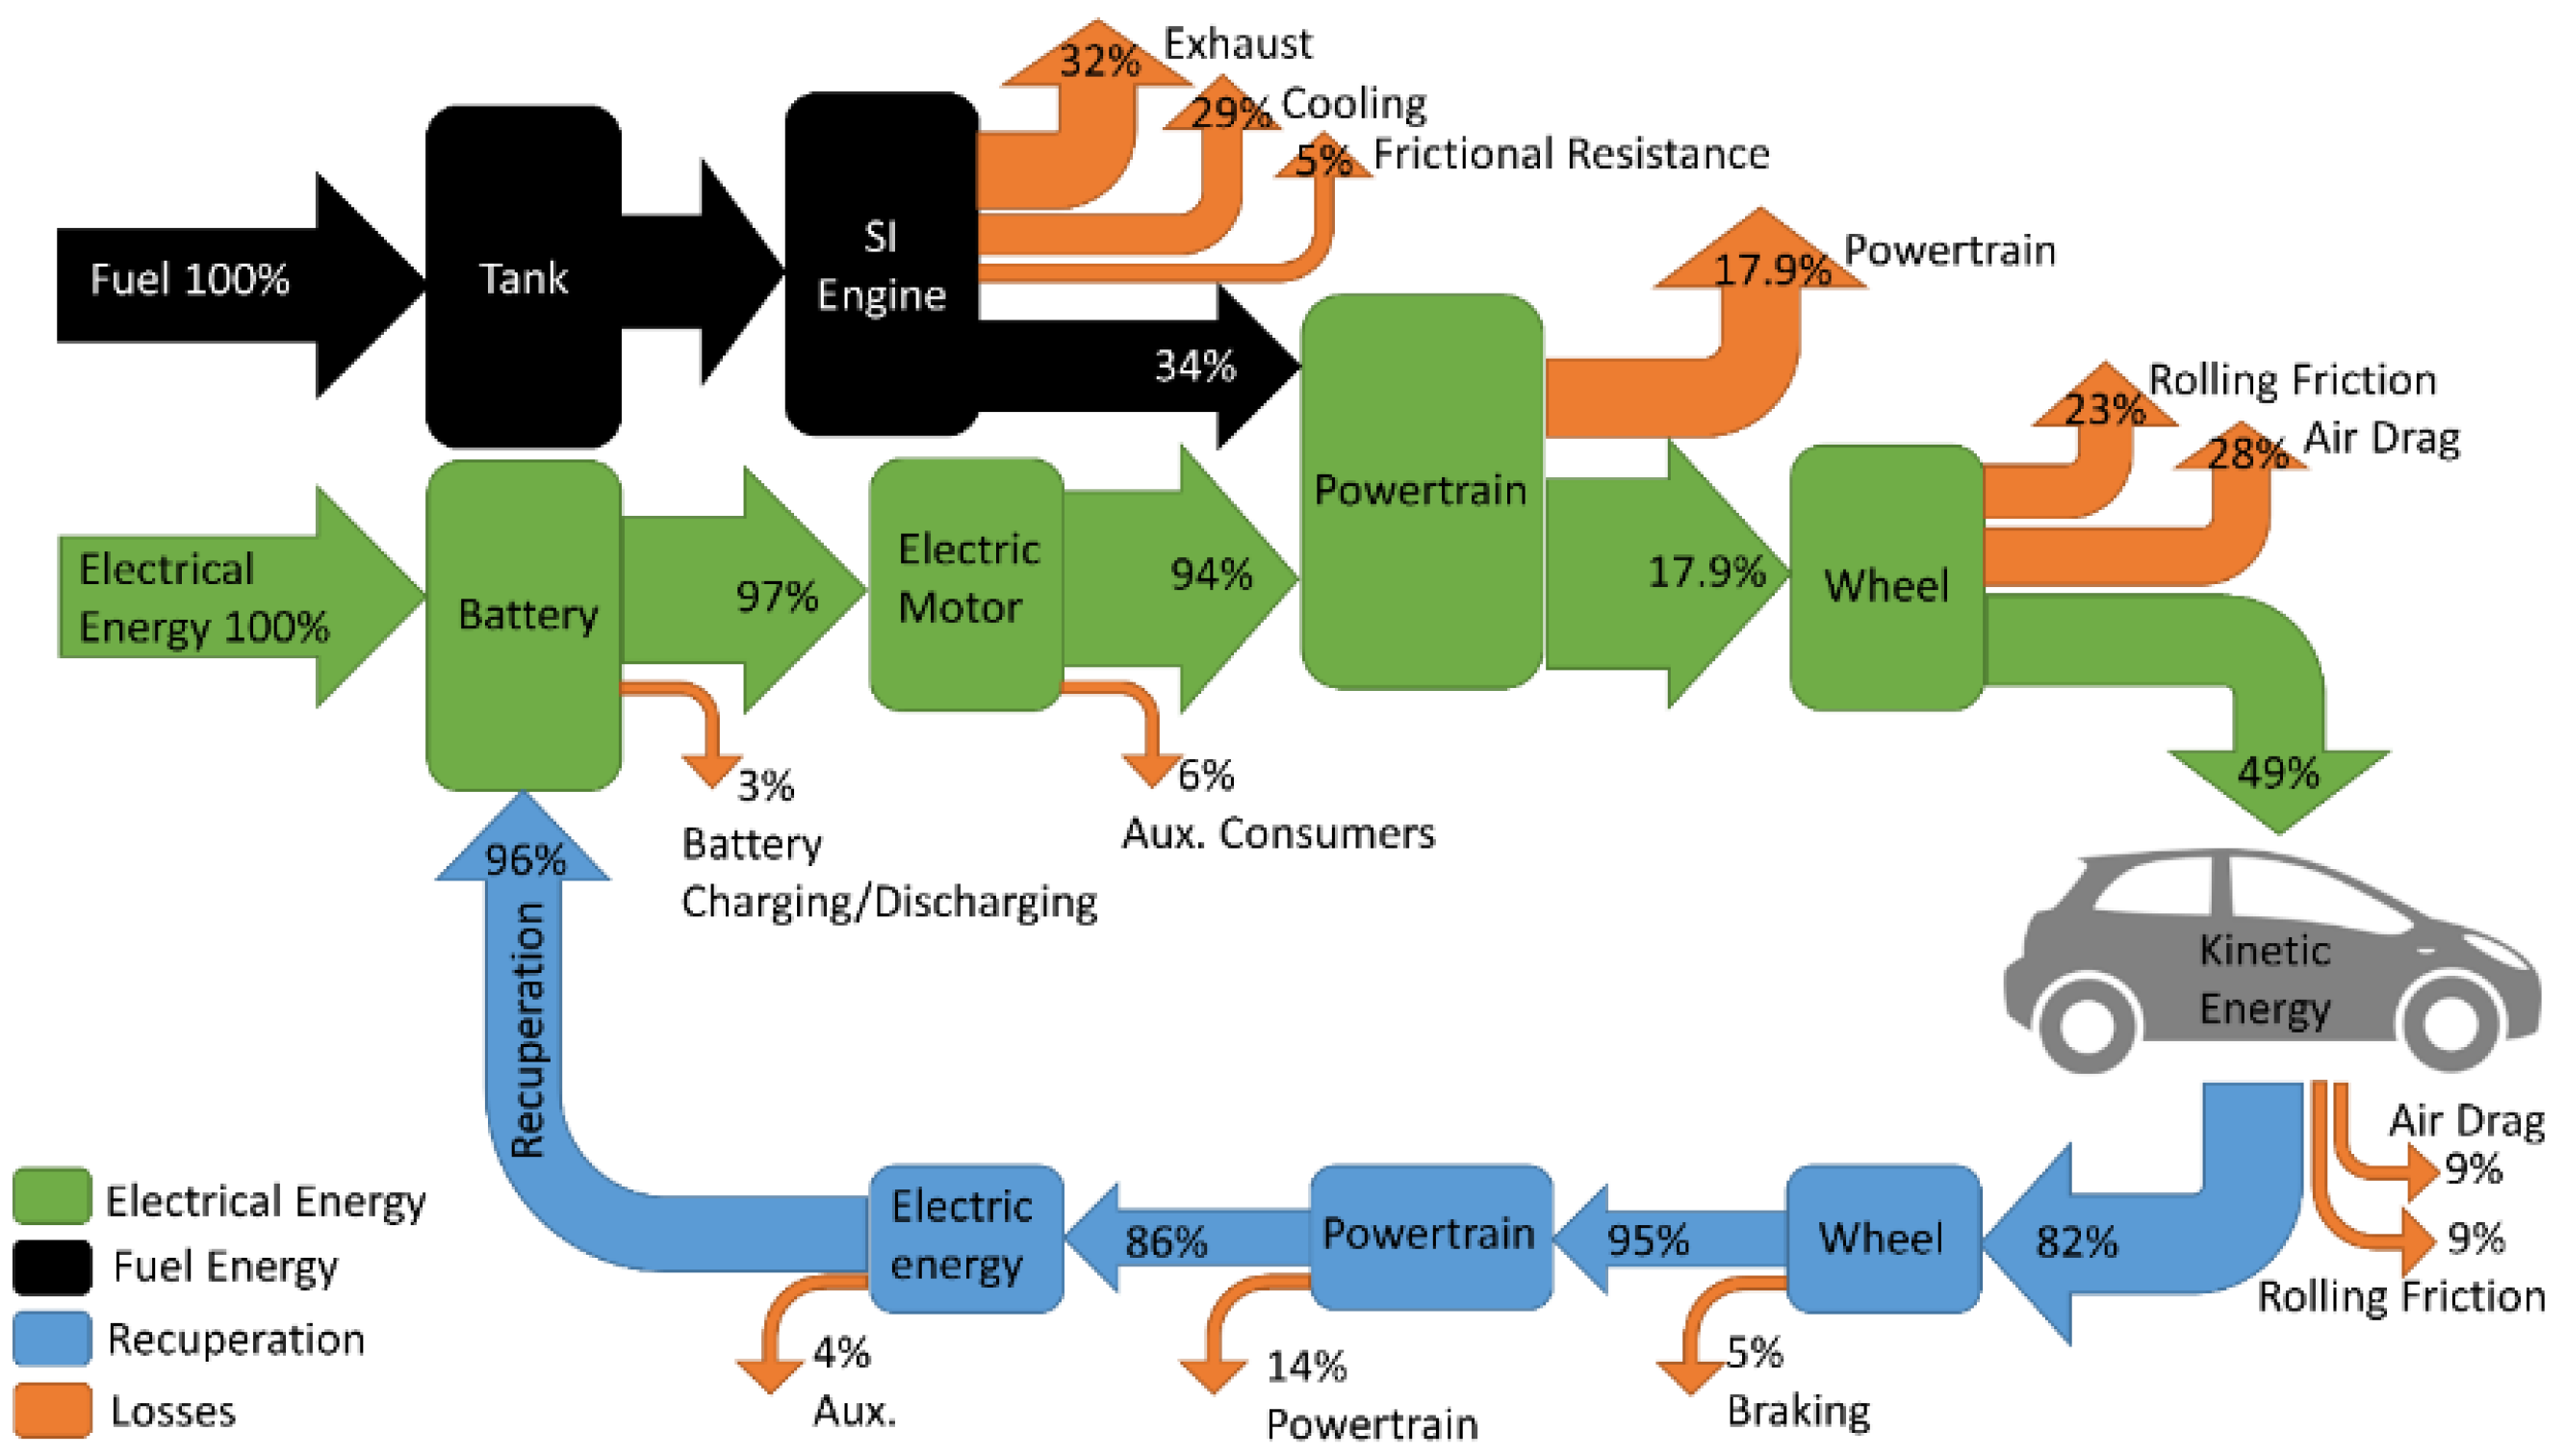
Figure 3.
Increase in energy consumption for a vehicle moving at variable speed.
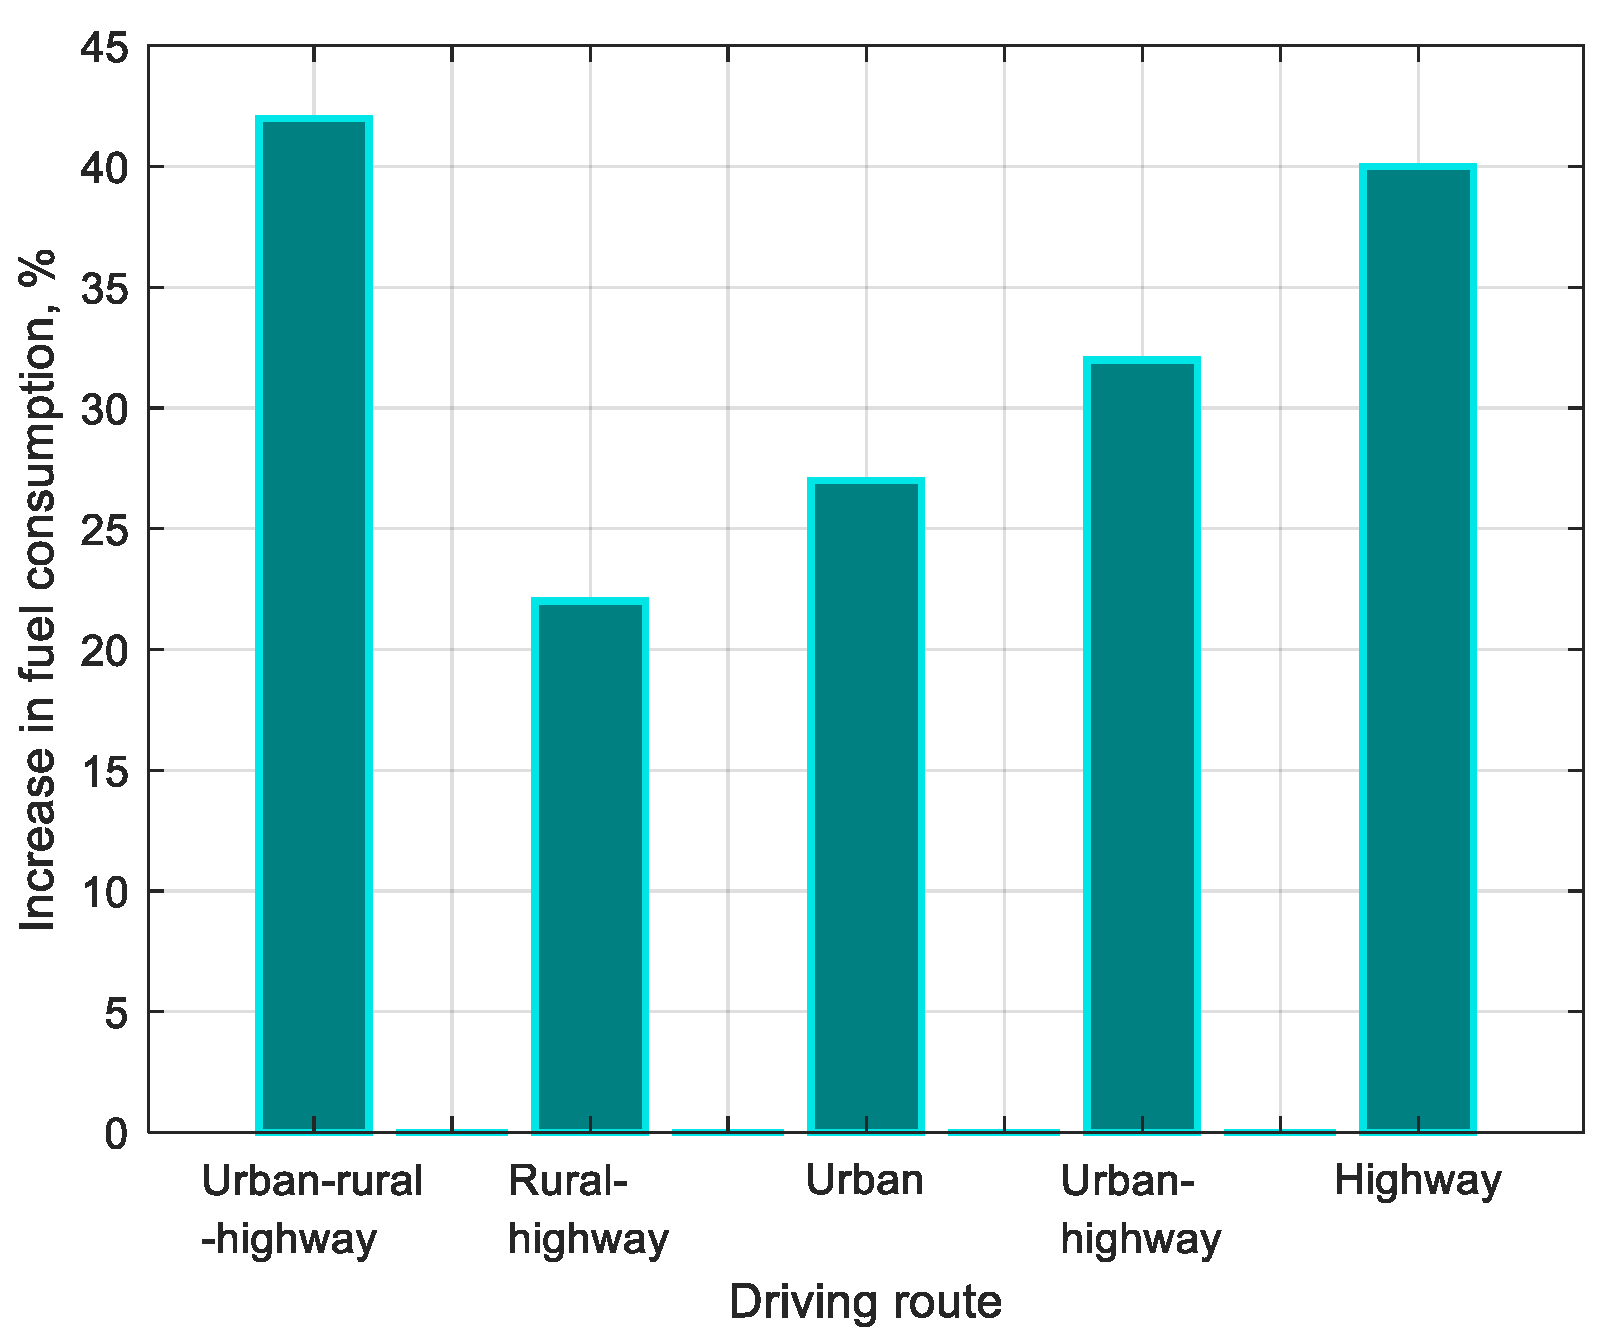
Figure 4.
Interdependencies occurring in the vehicle’s DEVS model.
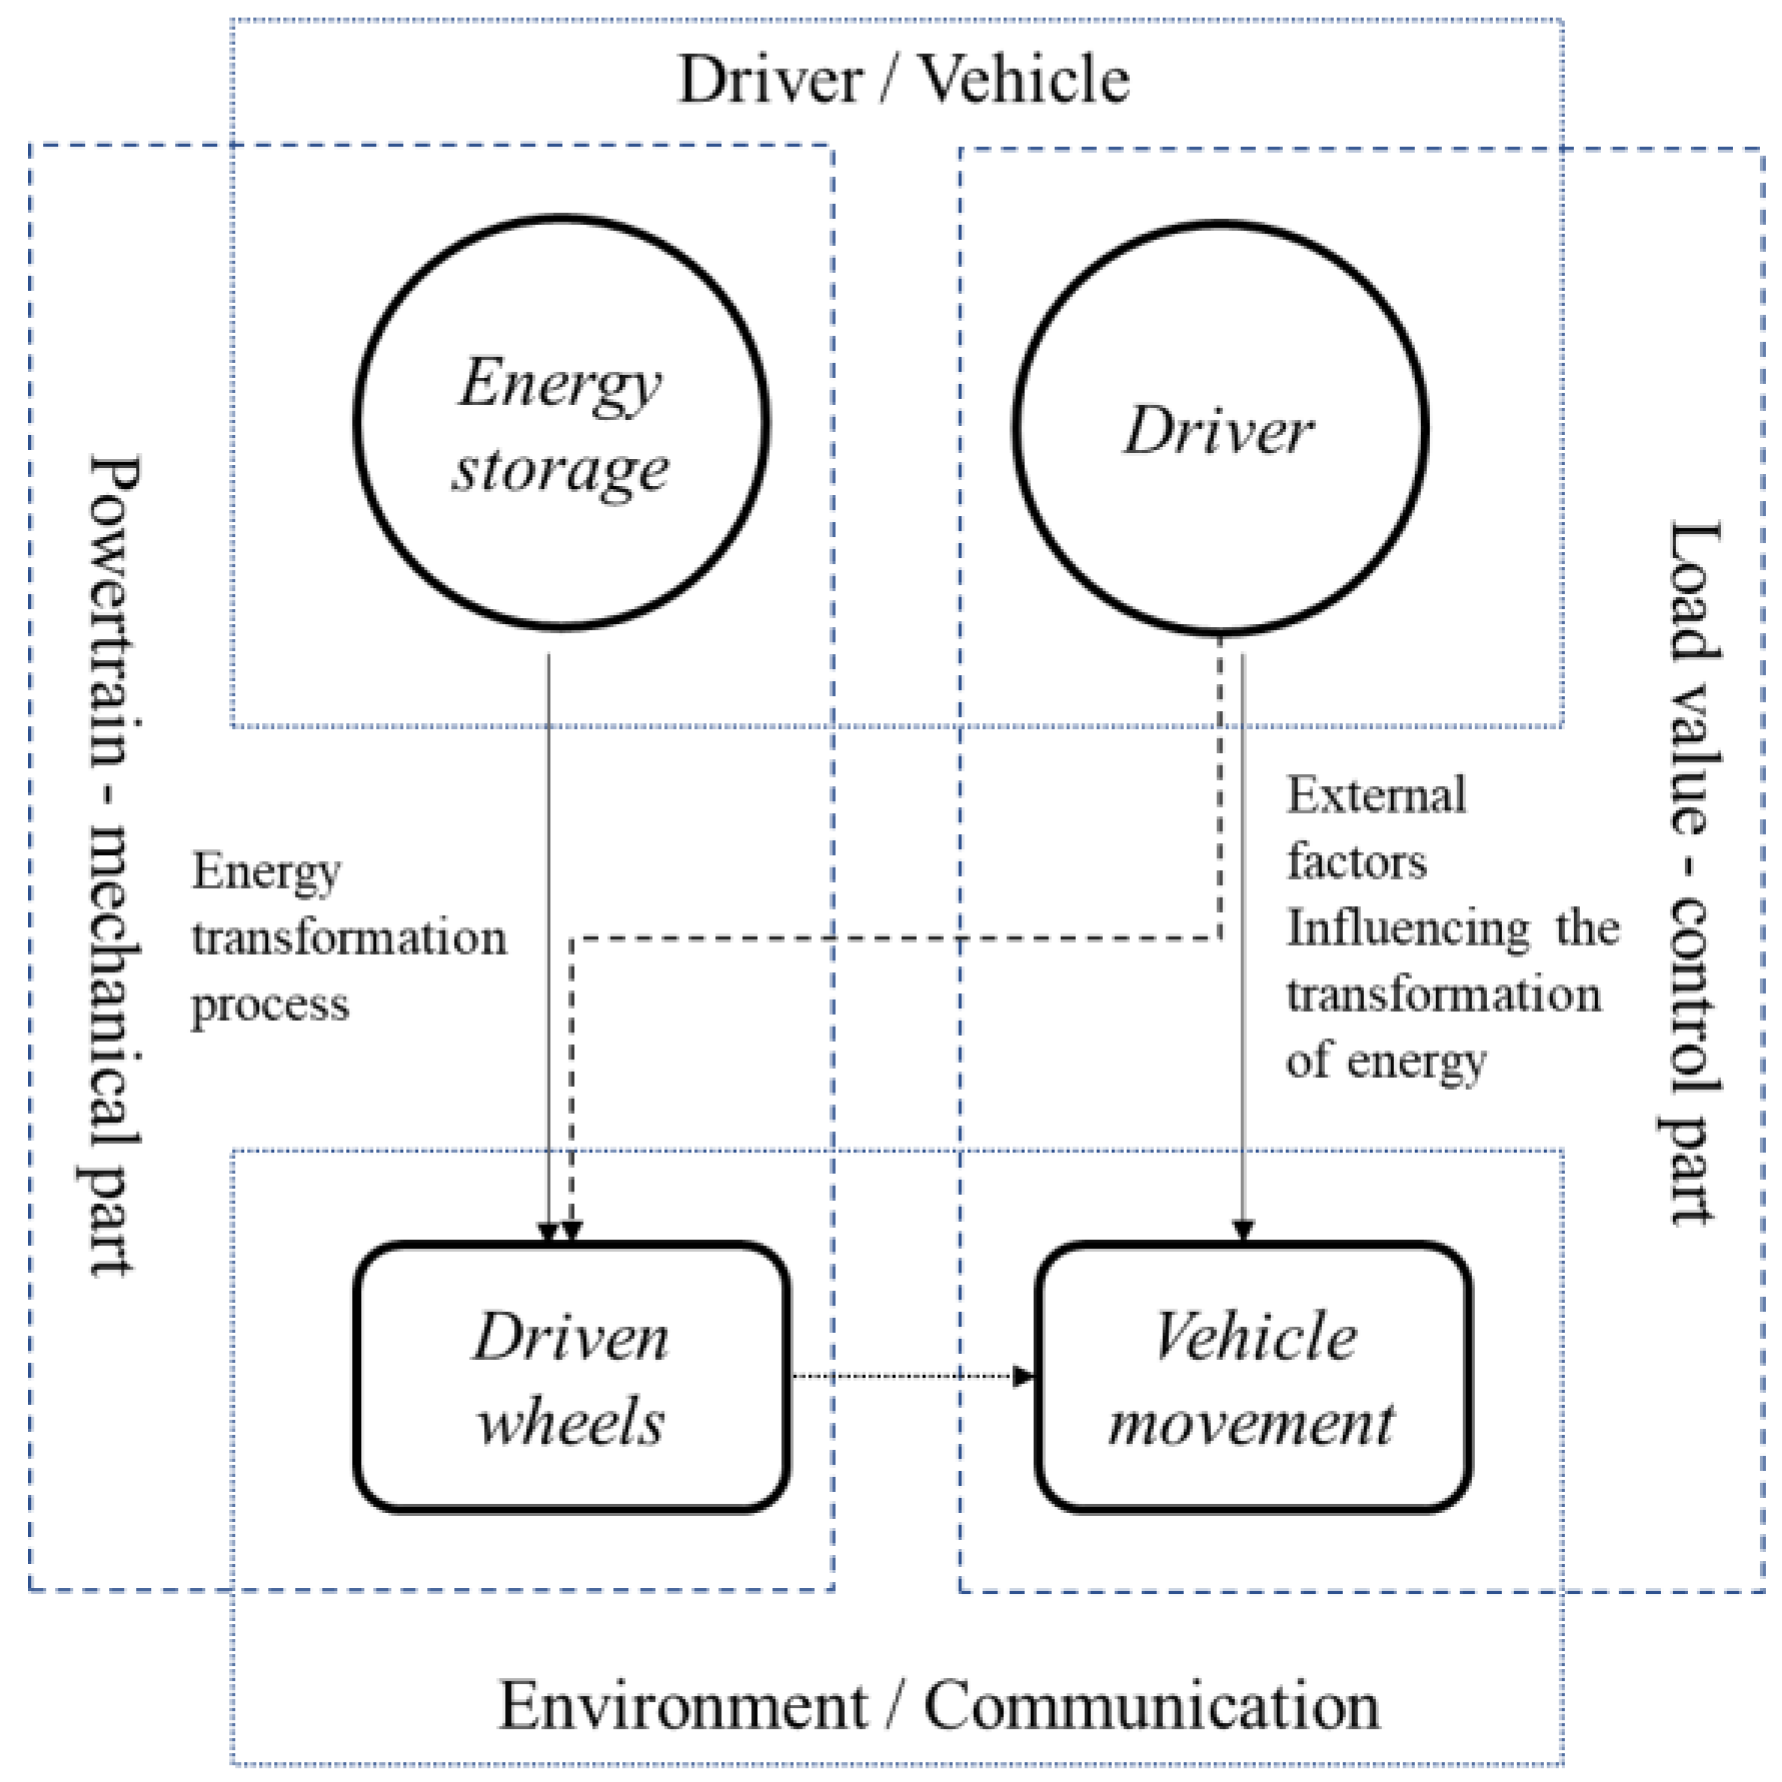
Figure 5.
Energy consumption for all-electric vehicles: a) mileage energy consumption b) unit energy consumption.
Figure 5.
Energy consumption for all-electric vehicles: a) mileage energy consumption b) unit energy consumption.
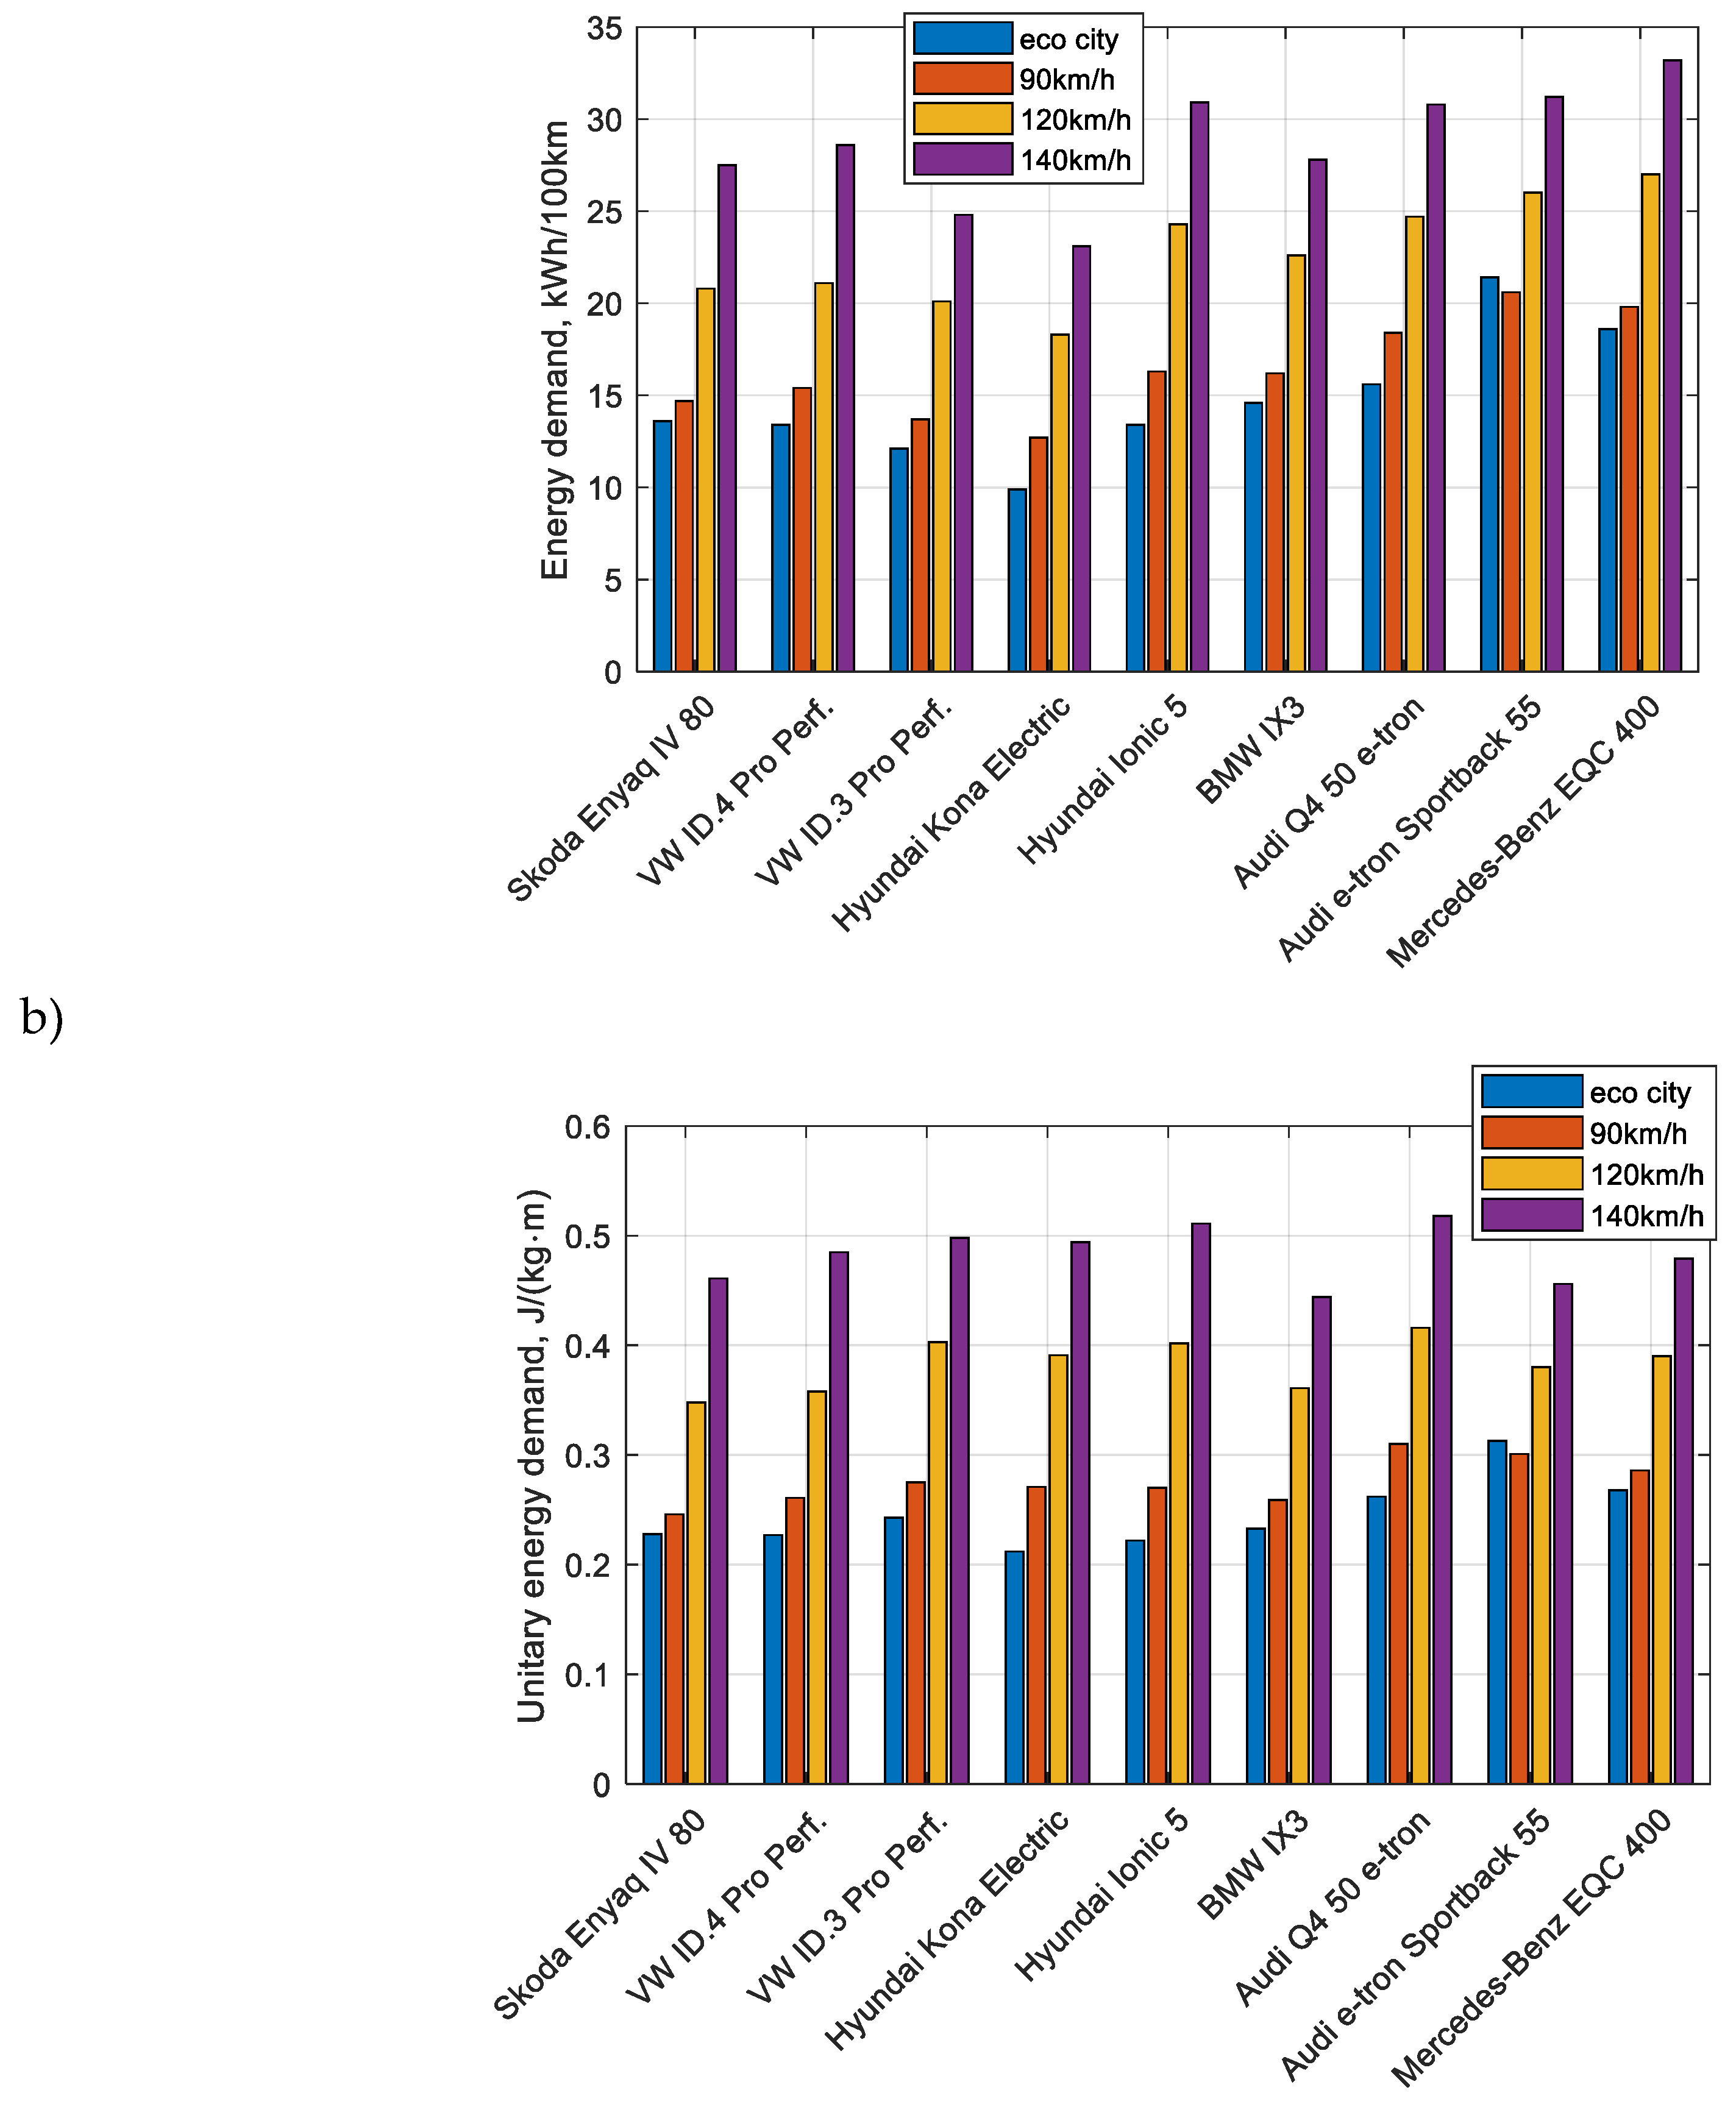
Figure 6.
Average distance traveled by PHEVs in every-day operating conditions throughout the year.
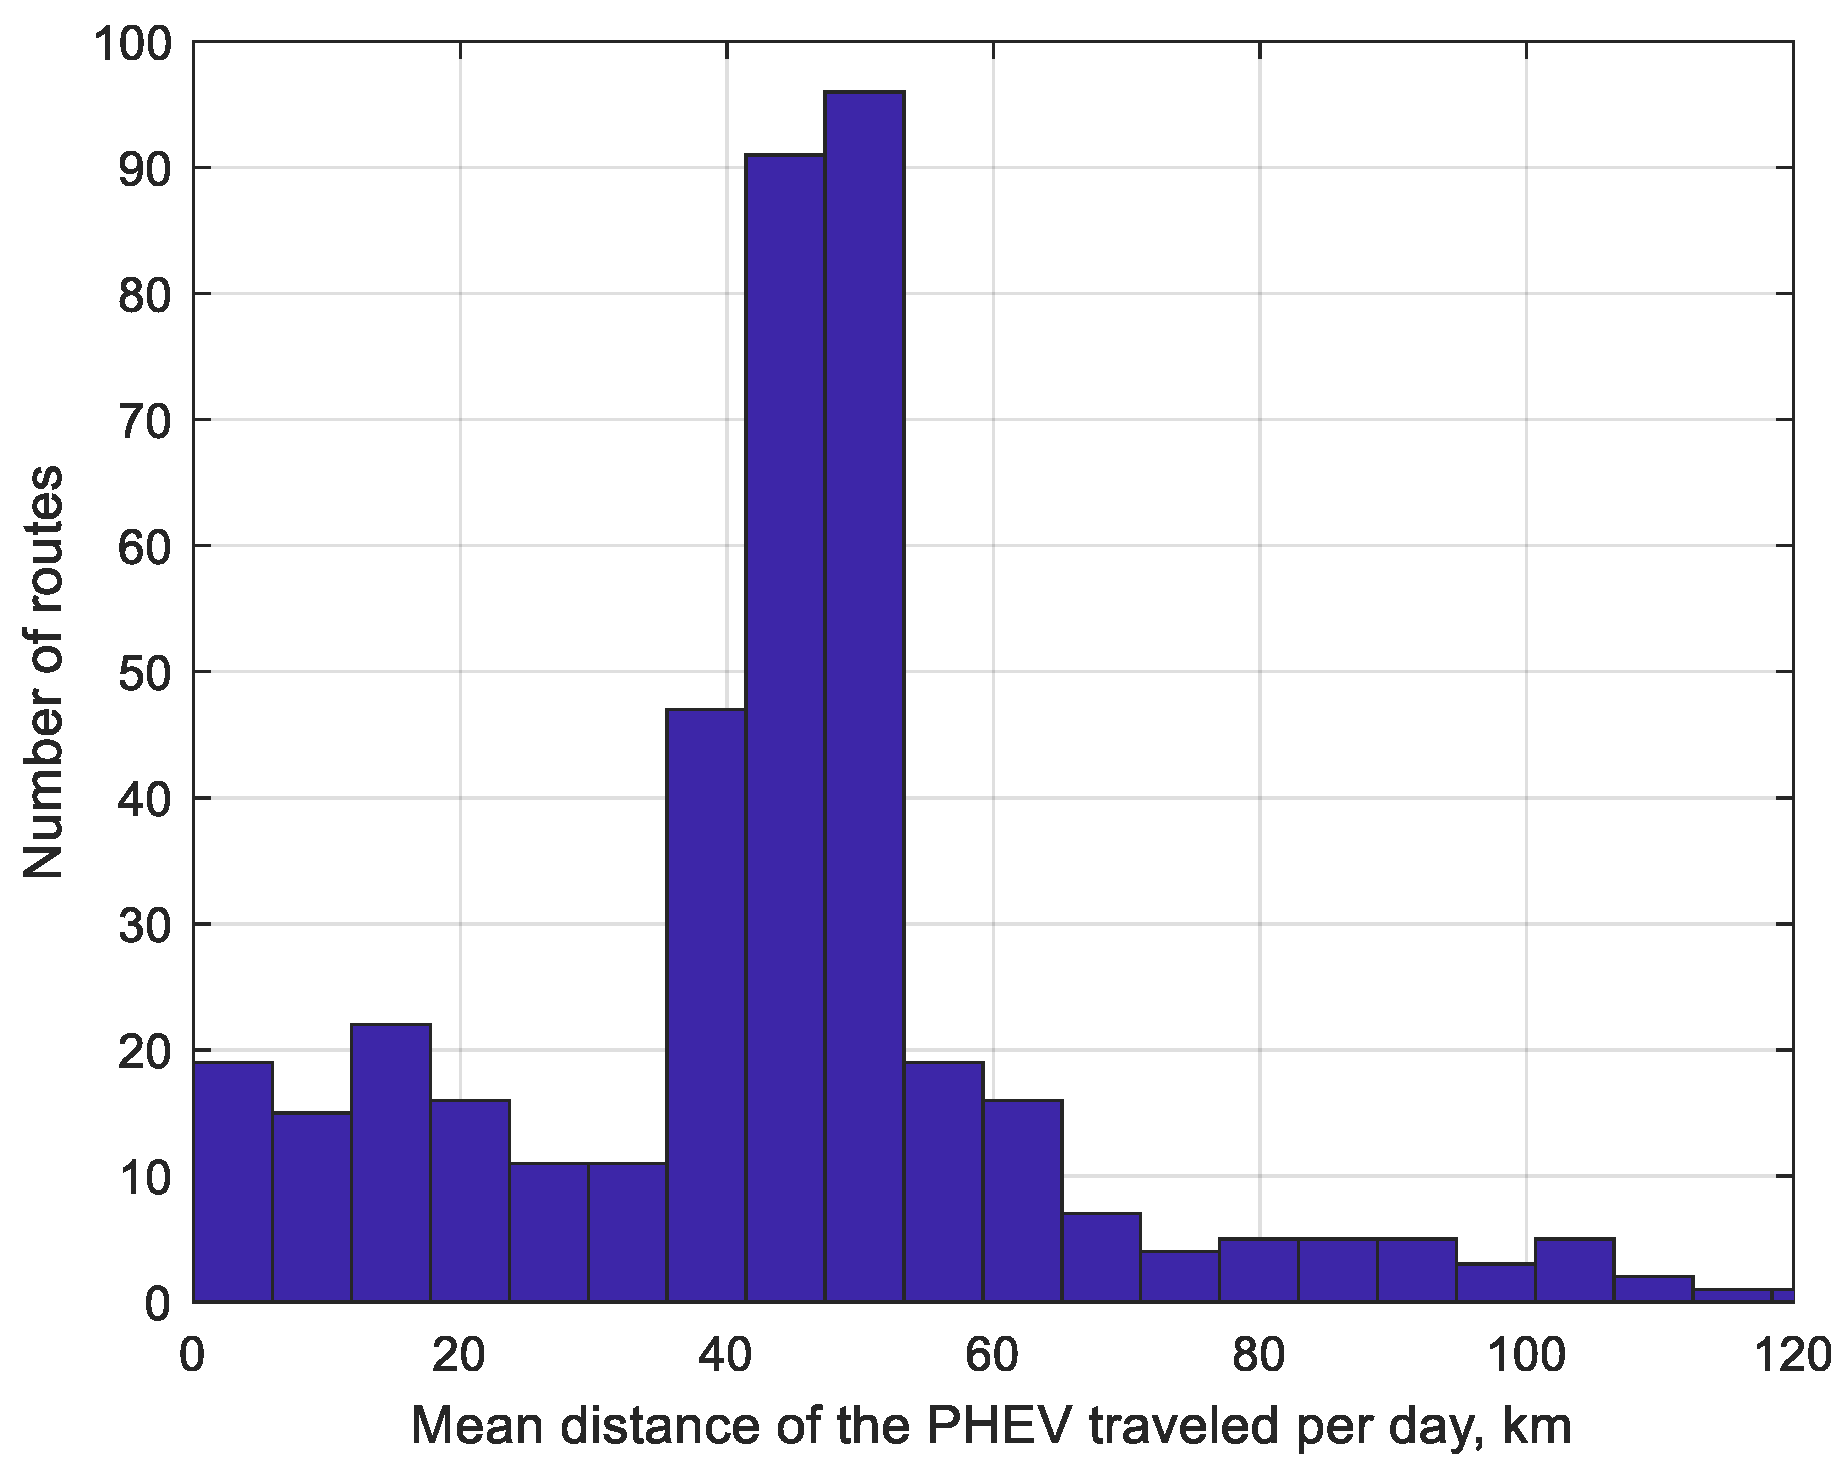
Figure 7.
Average carbon dioxide emissions for the PHEVs’ year-round operation.
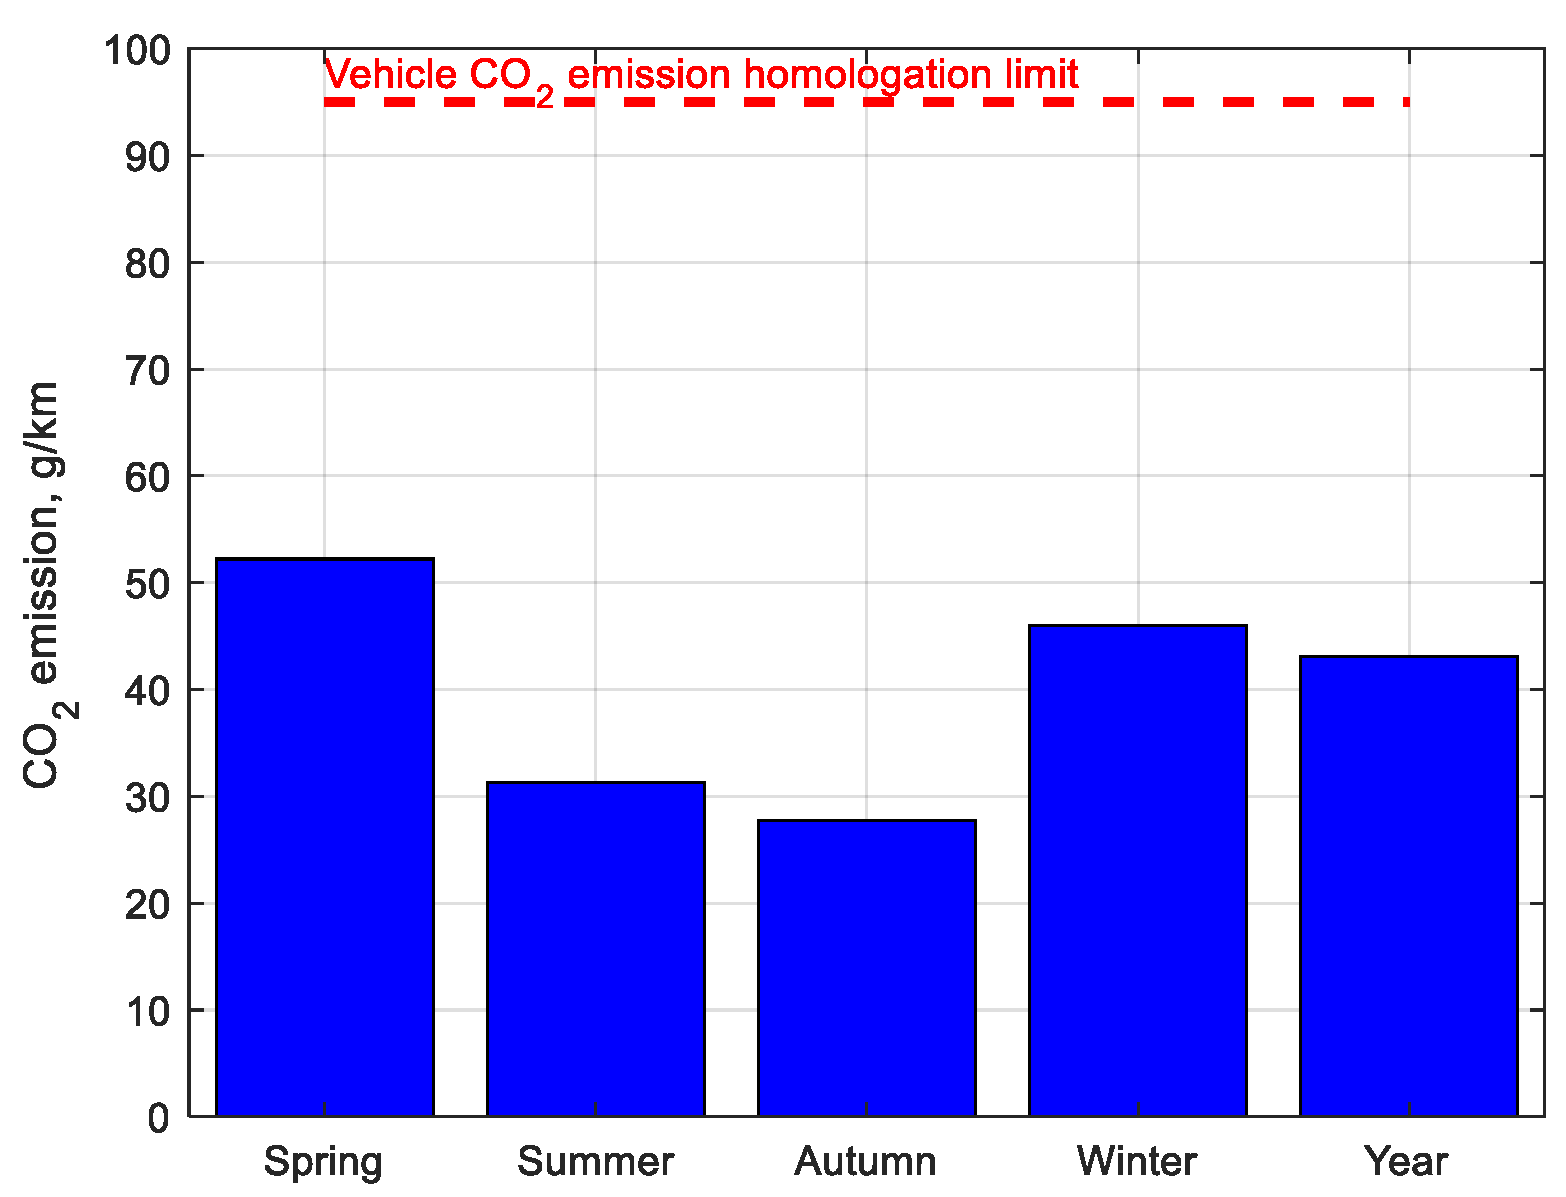
Figure 8.
Hybrid drive unit indices for the PHEVs’ year-round operation: a) distance traveled, b) energy consumption.
Figure 8.
Hybrid drive unit indices for the PHEVs’ year-round operation: a) distance traveled, b) energy consumption.
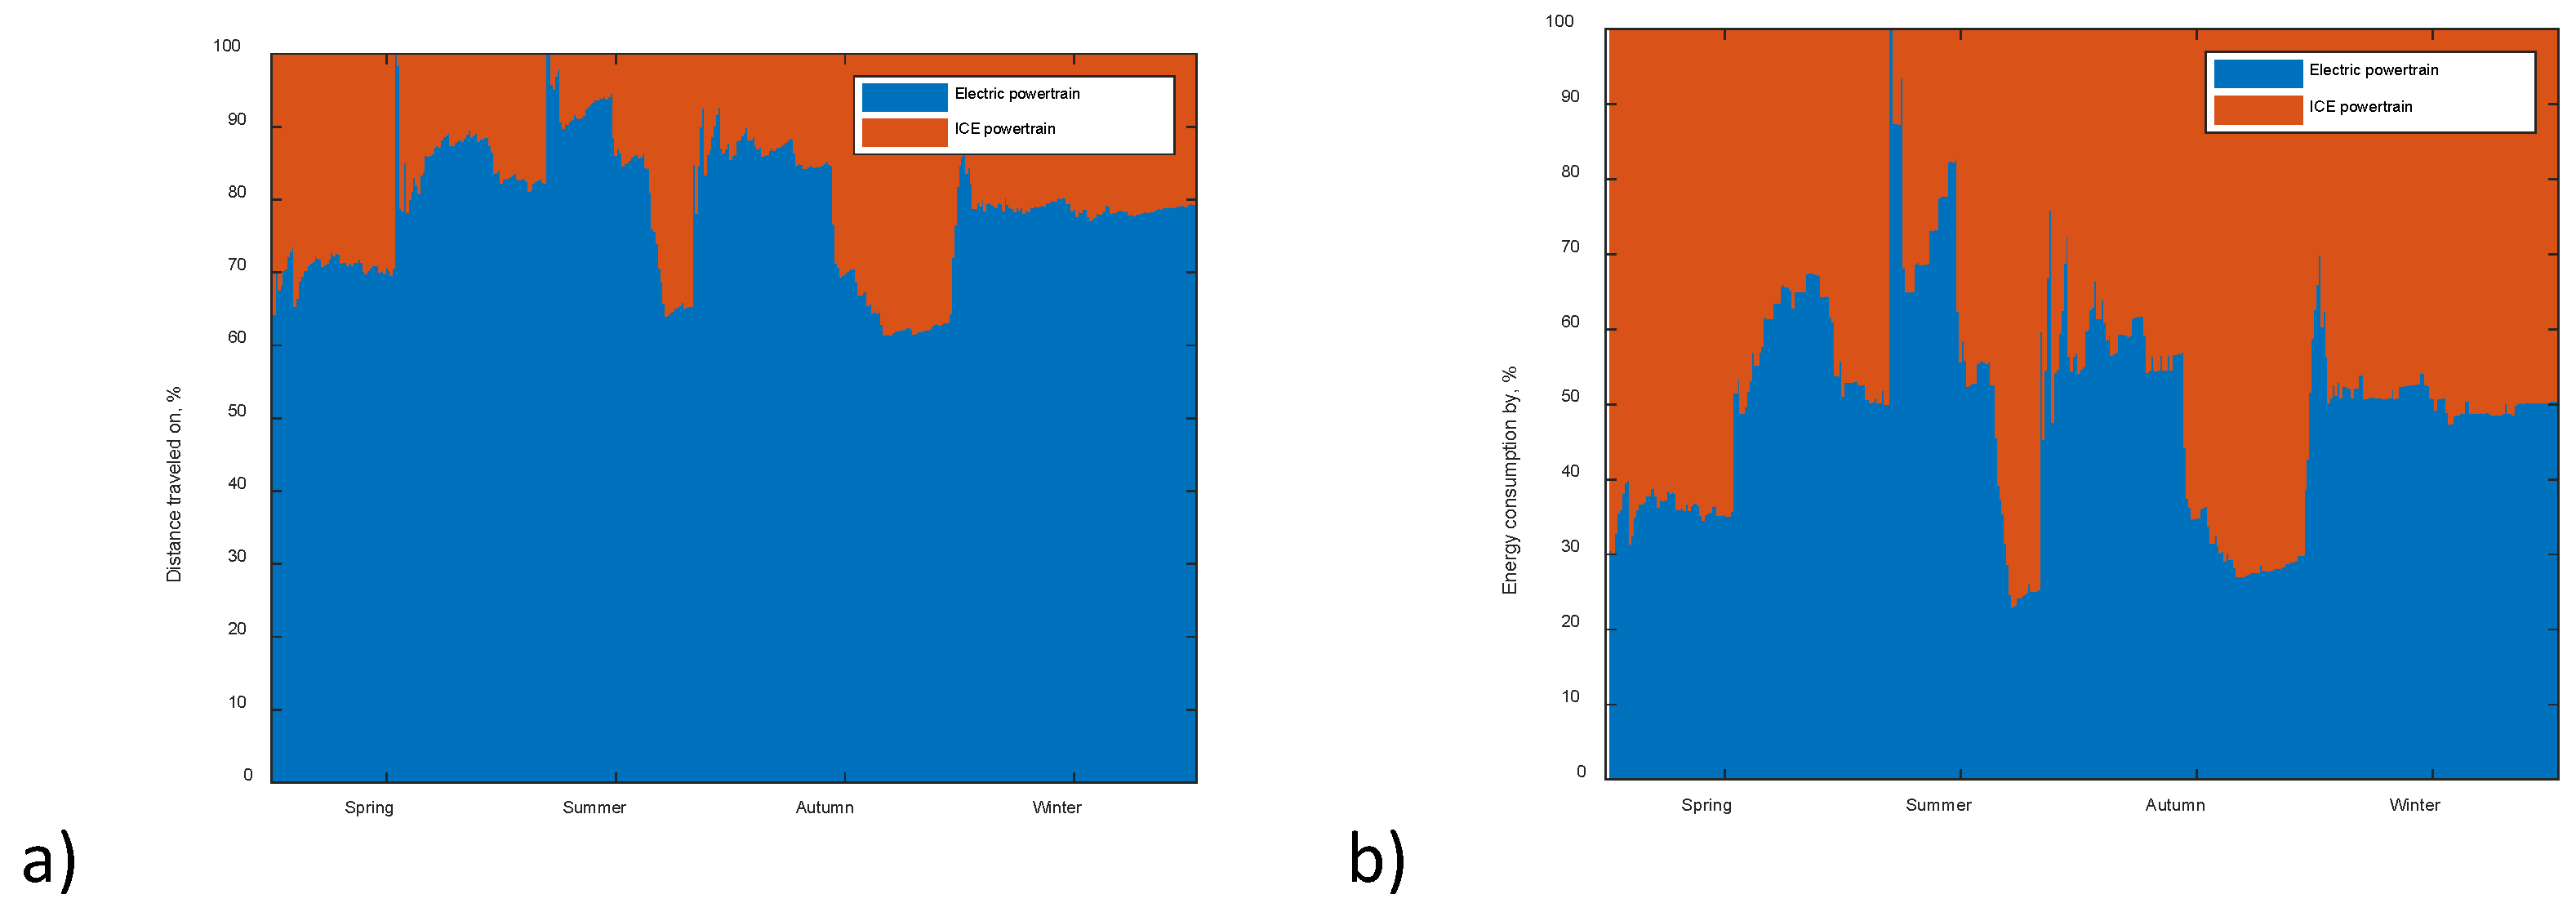
Figure 9.
Share of the engines’ use for the hybrid drive unit with distance exceeding 100 km and the following initial states of charge: (a) discharged storage SOC= 0%, (b) fully charged storage SOC=100%.
Figure 9.
Share of the engines’ use for the hybrid drive unit with distance exceeding 100 km and the following initial states of charge: (a) discharged storage SOC= 0%, (b) fully charged storage SOC=100%.
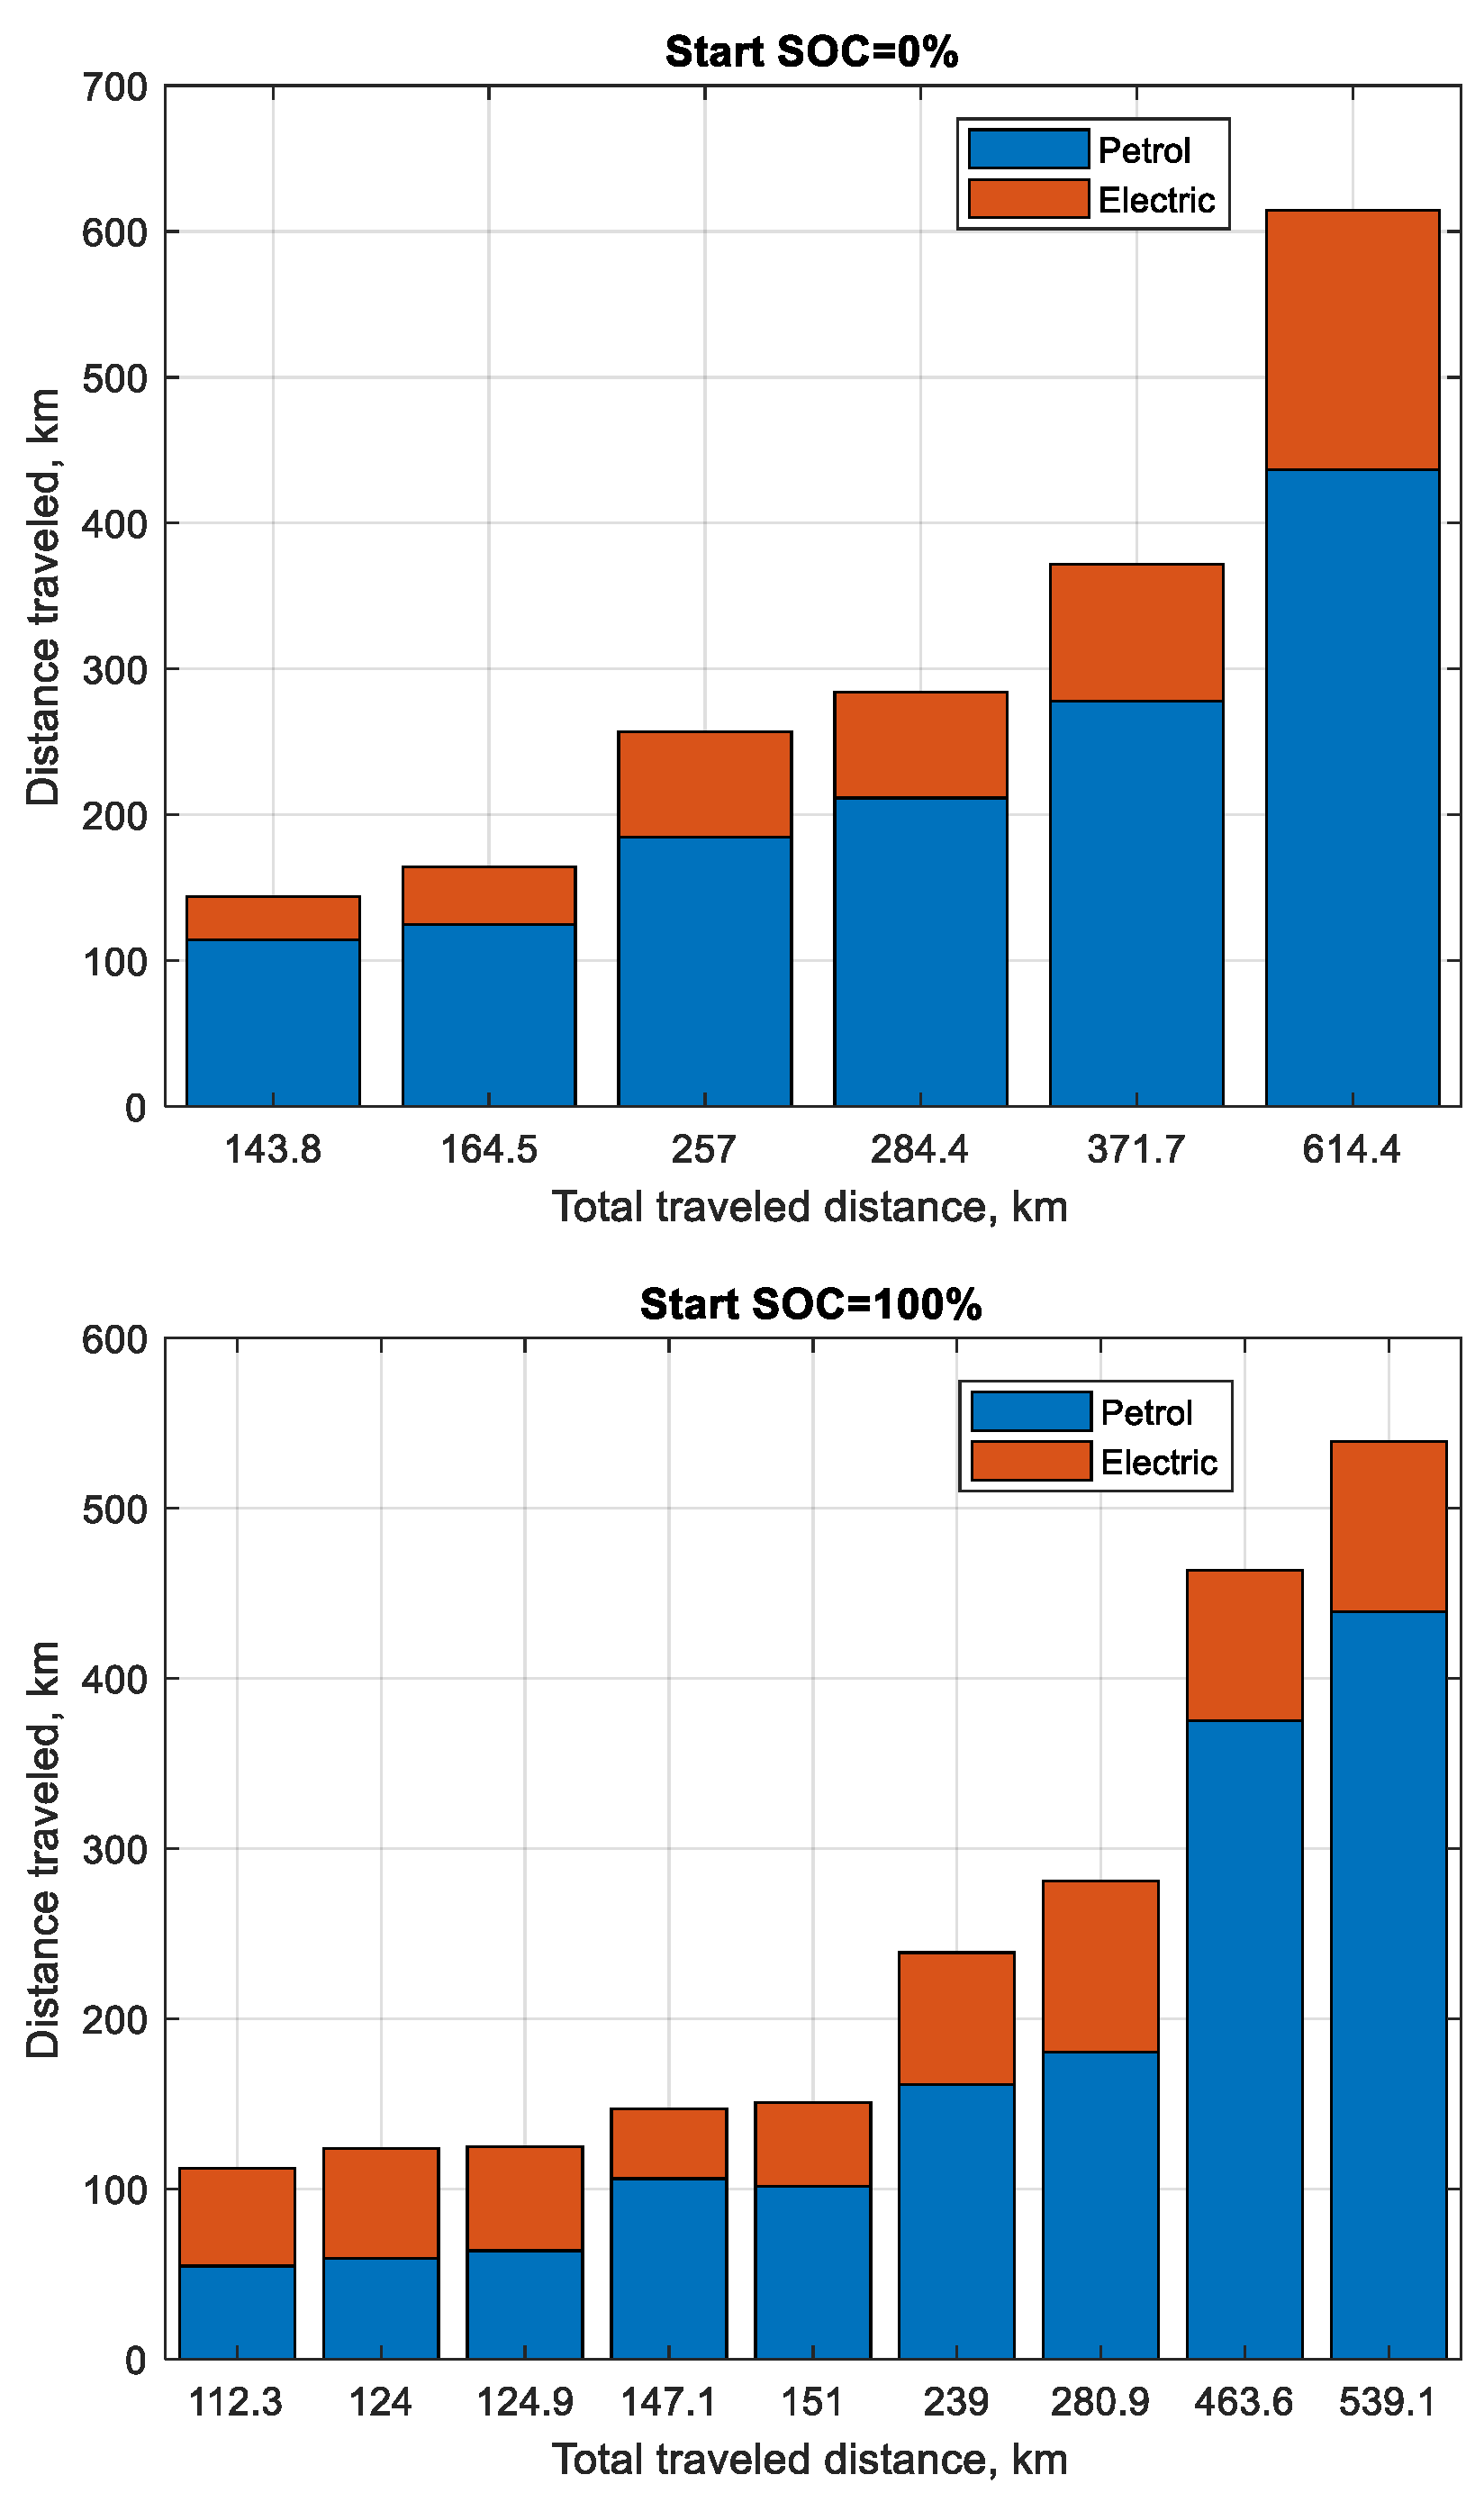
Figure 10.
The engines’ percentage shares for each trip in the given period: a) I, b) II, c) III, d) IV (yellow - internal combustion engine, green - electric engine).
Figure 10.
The engines’ percentage shares for each trip in the given period: a) I, b) II, c) III, d) IV (yellow - internal combustion engine, green - electric engine).
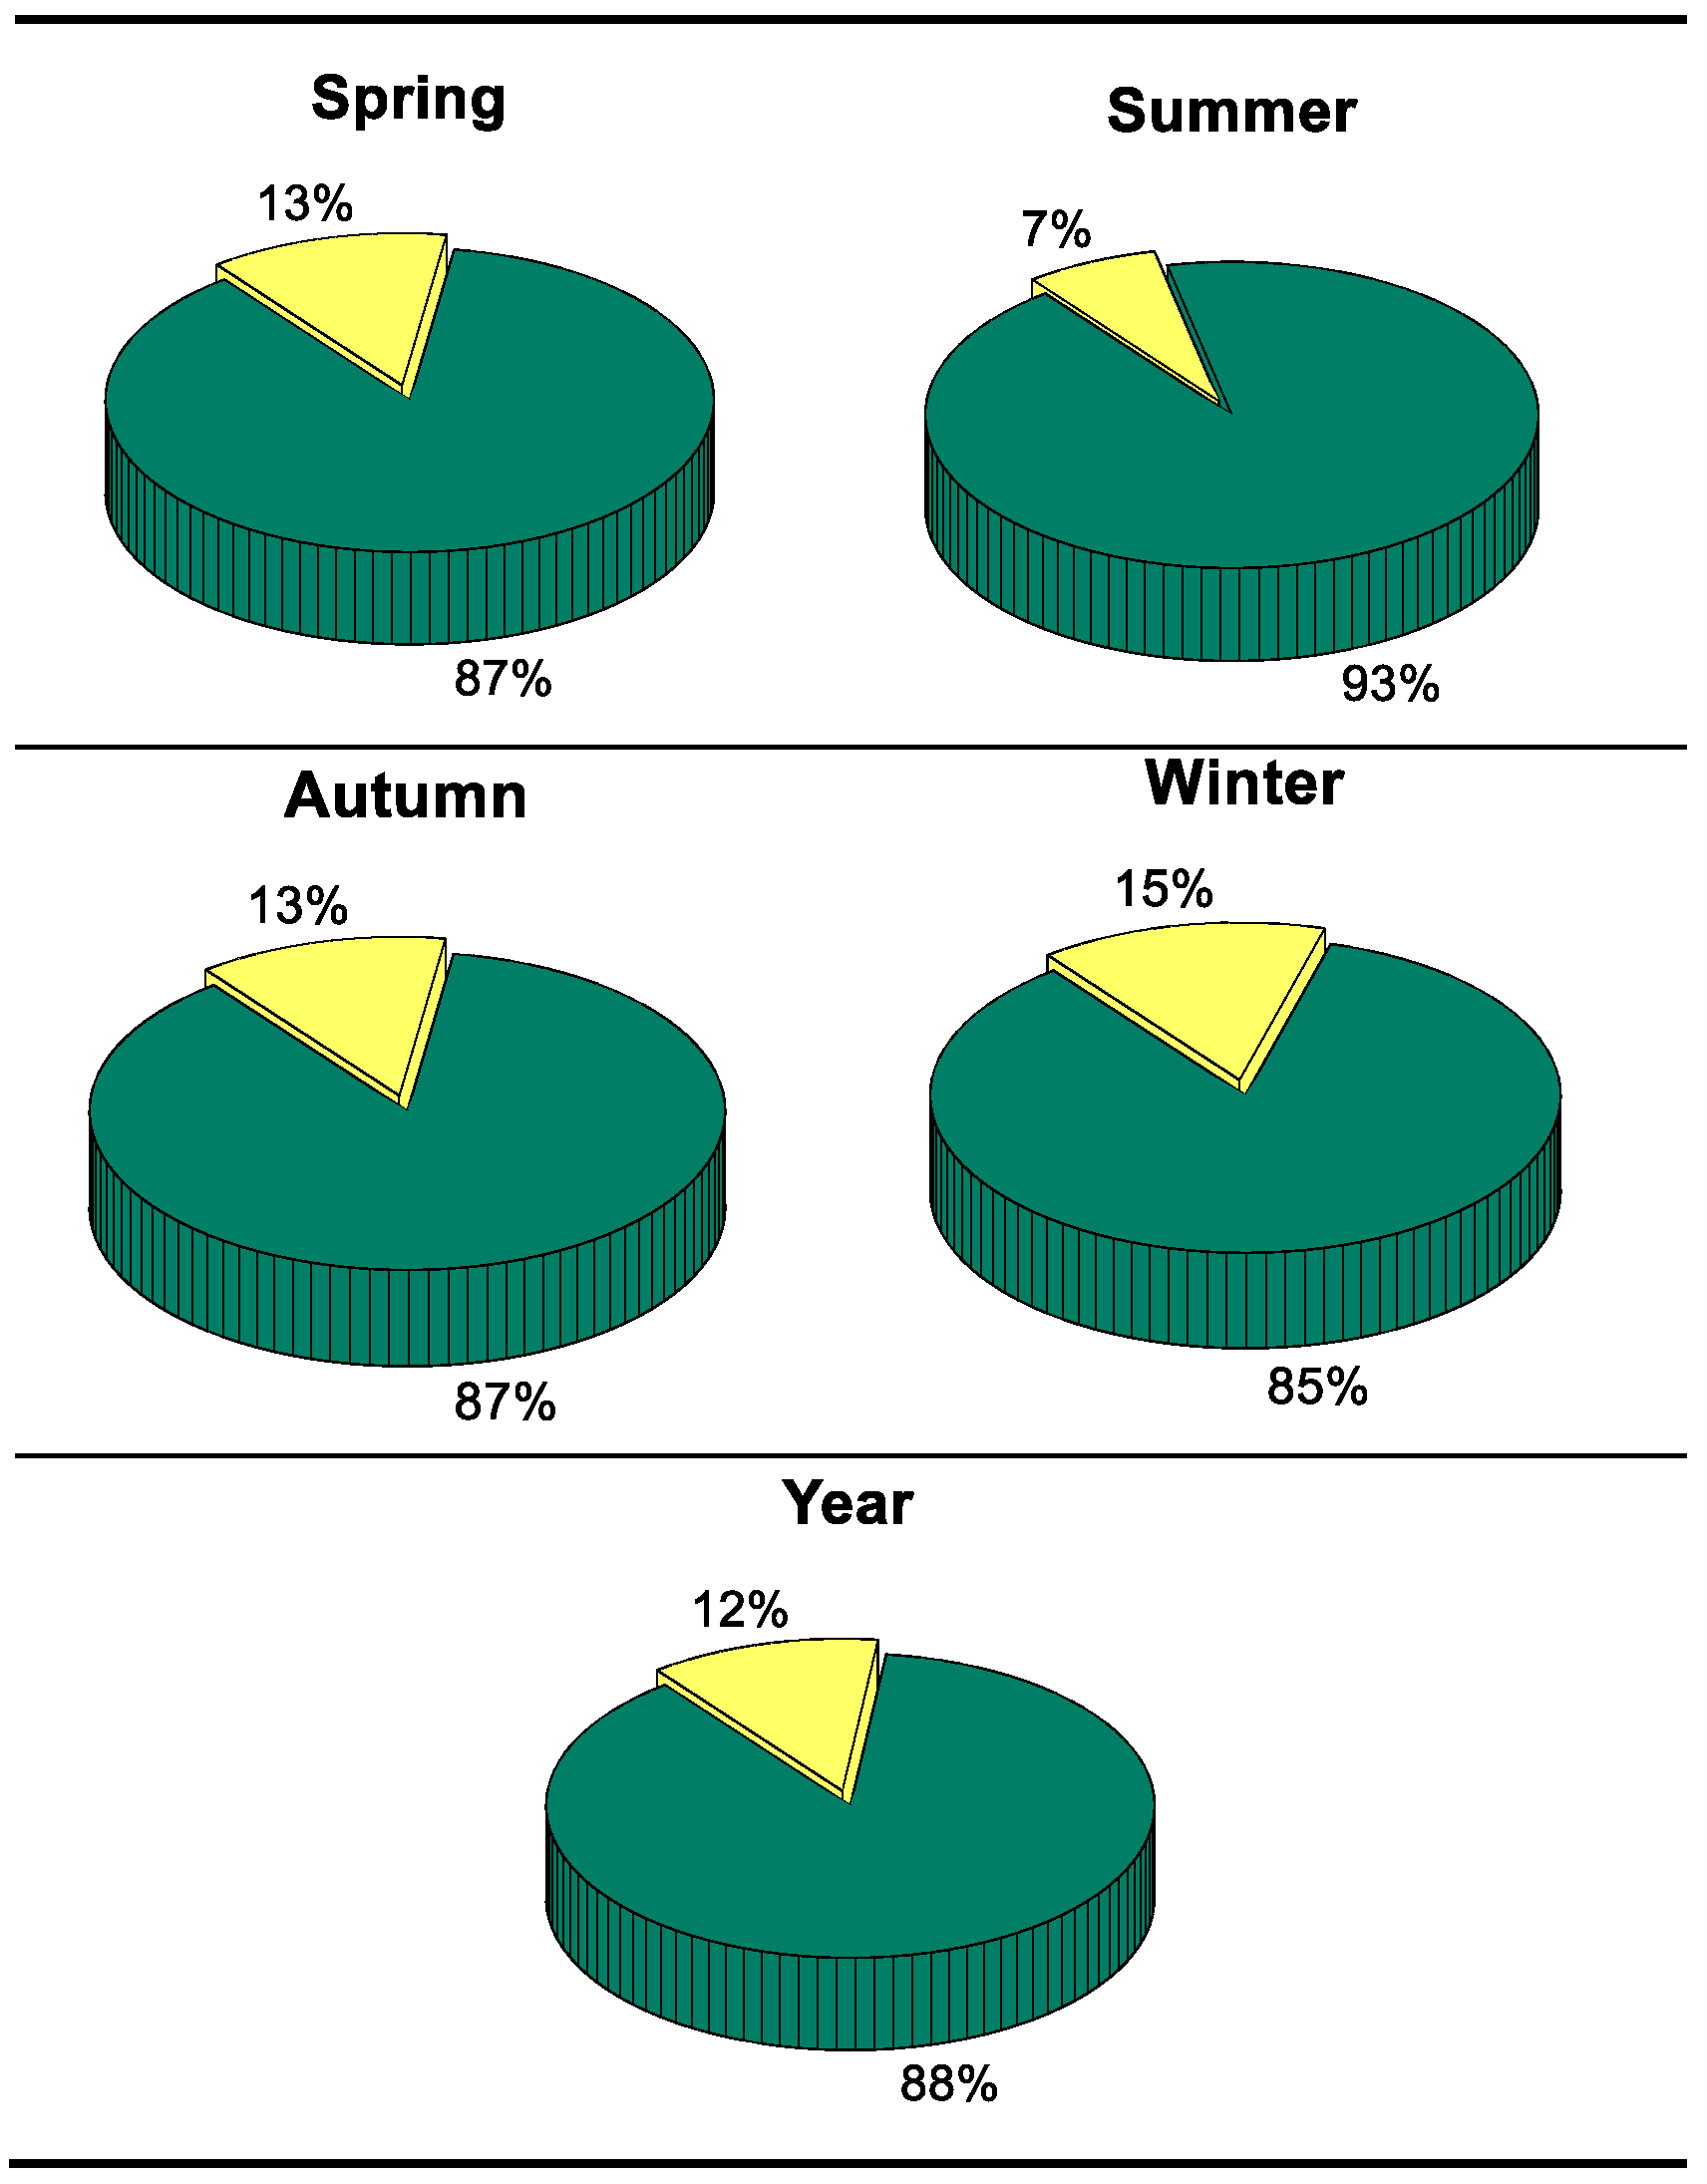
Figure 11.
Unit energy consumption index for the vehicle’s electric engine relative to outdoor temperature for each day of the year.
Figure 11.
Unit energy consumption index for the vehicle’s electric engine relative to outdoor temperature for each day of the year.
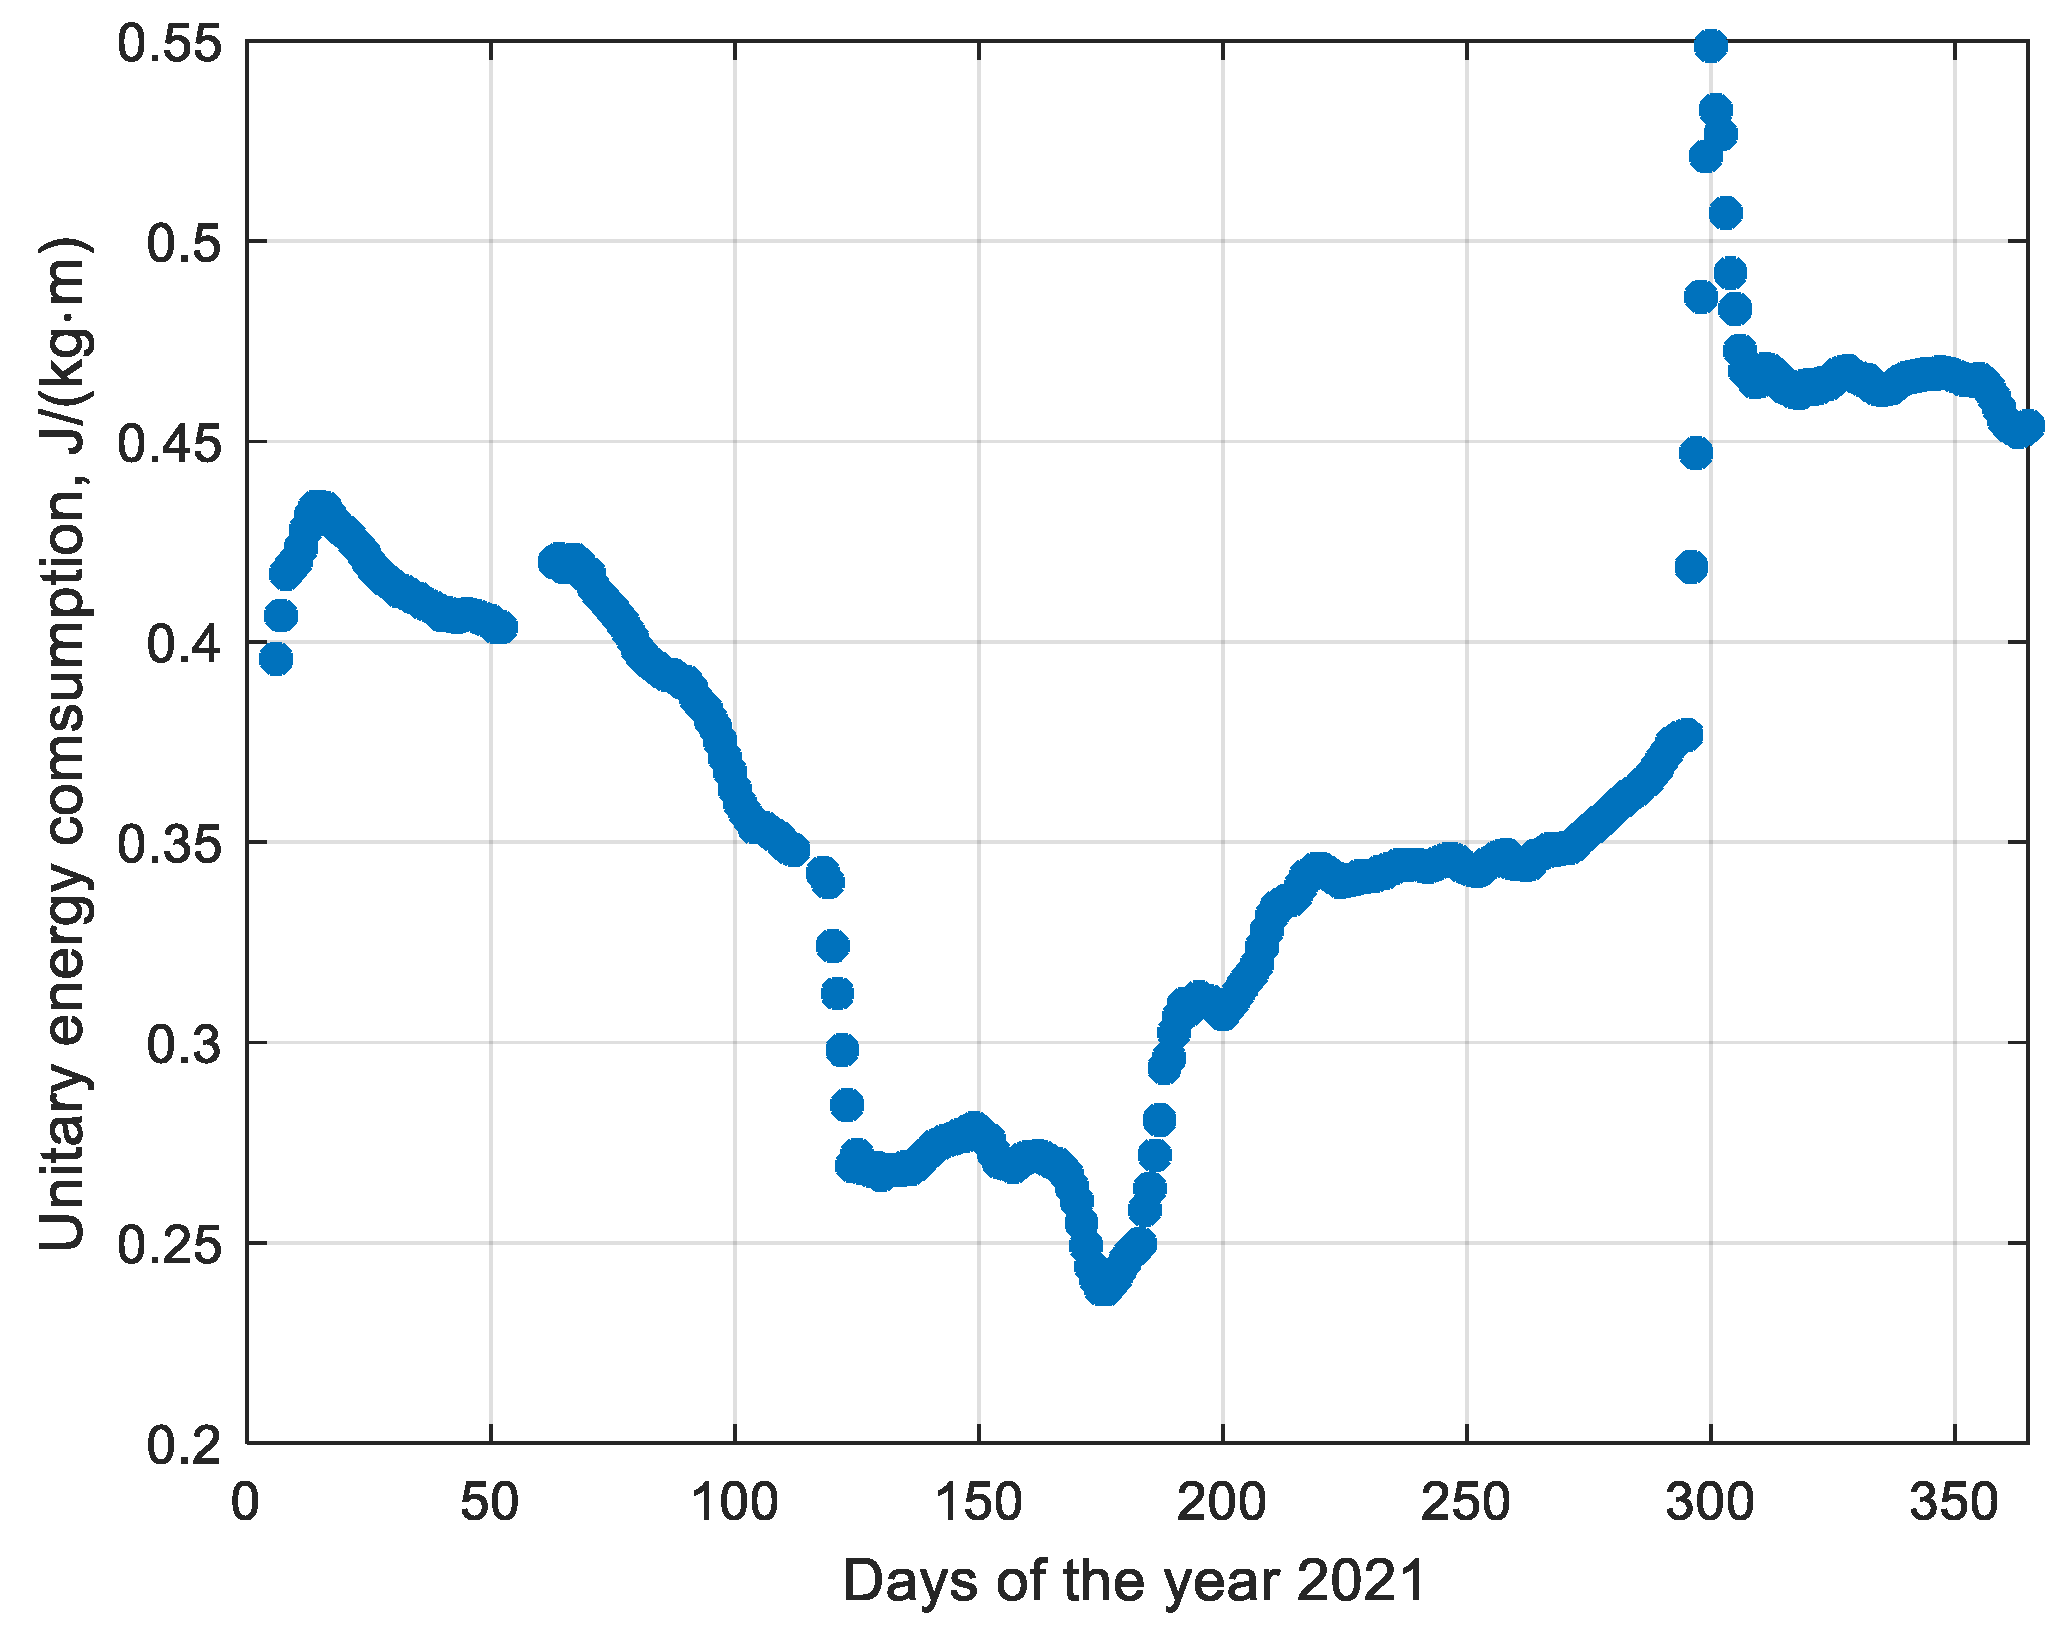
Figure 12.
PHEV’s energy consumption for different drive speeds while only using the electric engine.
Figure 12.
PHEV’s energy consumption for different drive speeds while only using the electric engine.
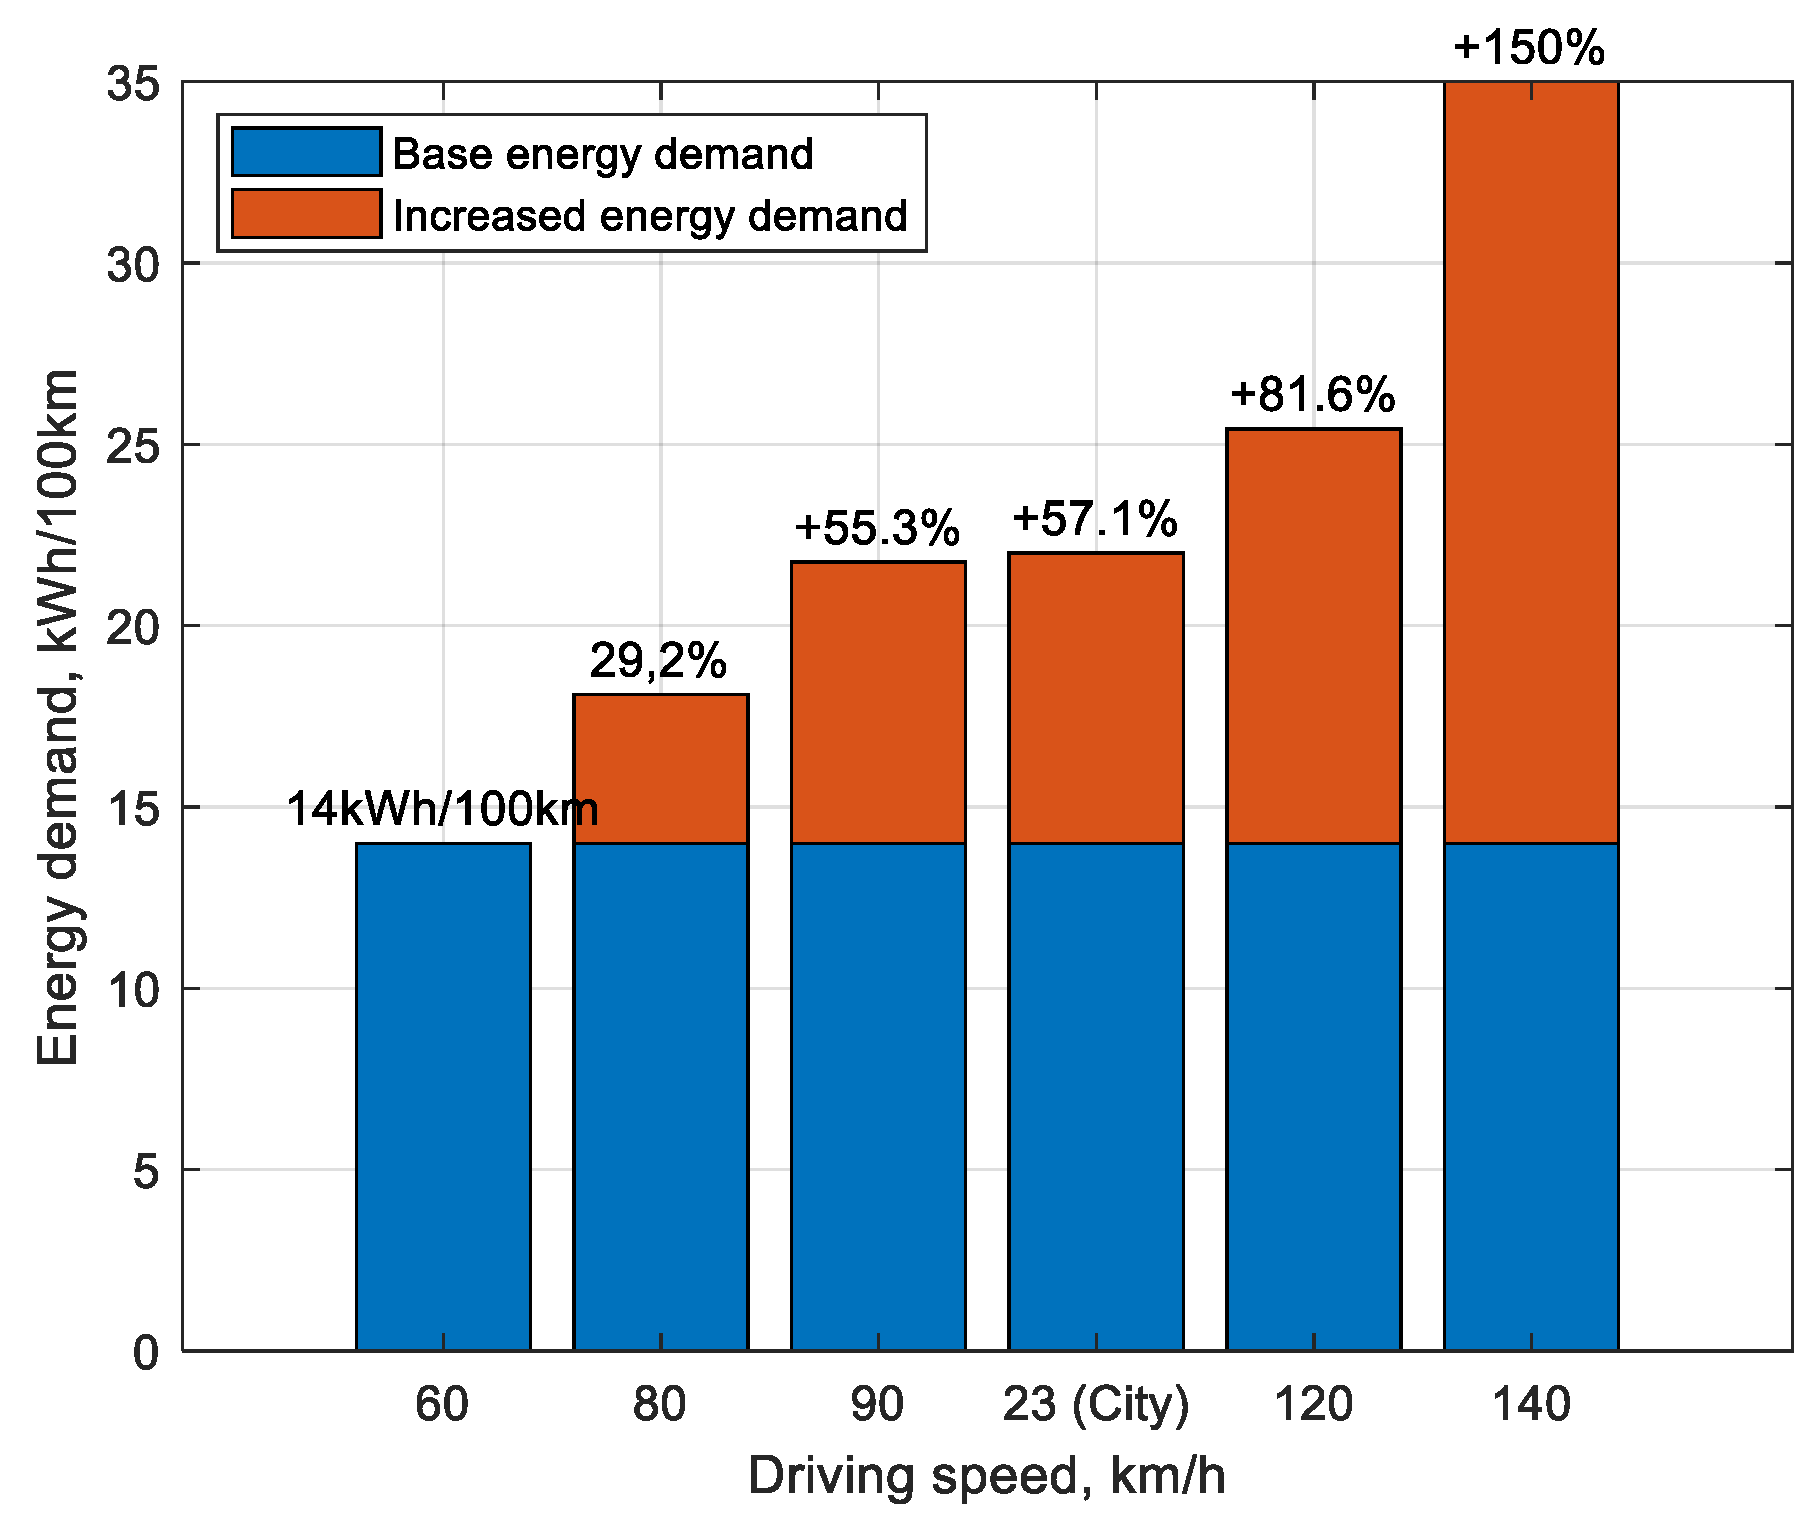
Figure 13.
Impact of vehicle speed on the reduction or increase of the vehicle’s unit energy consumption relative to the limit set by the WLTP cycle.
Figure 13.
Impact of vehicle speed on the reduction or increase of the vehicle’s unit energy consumption relative to the limit set by the WLTP cycle.
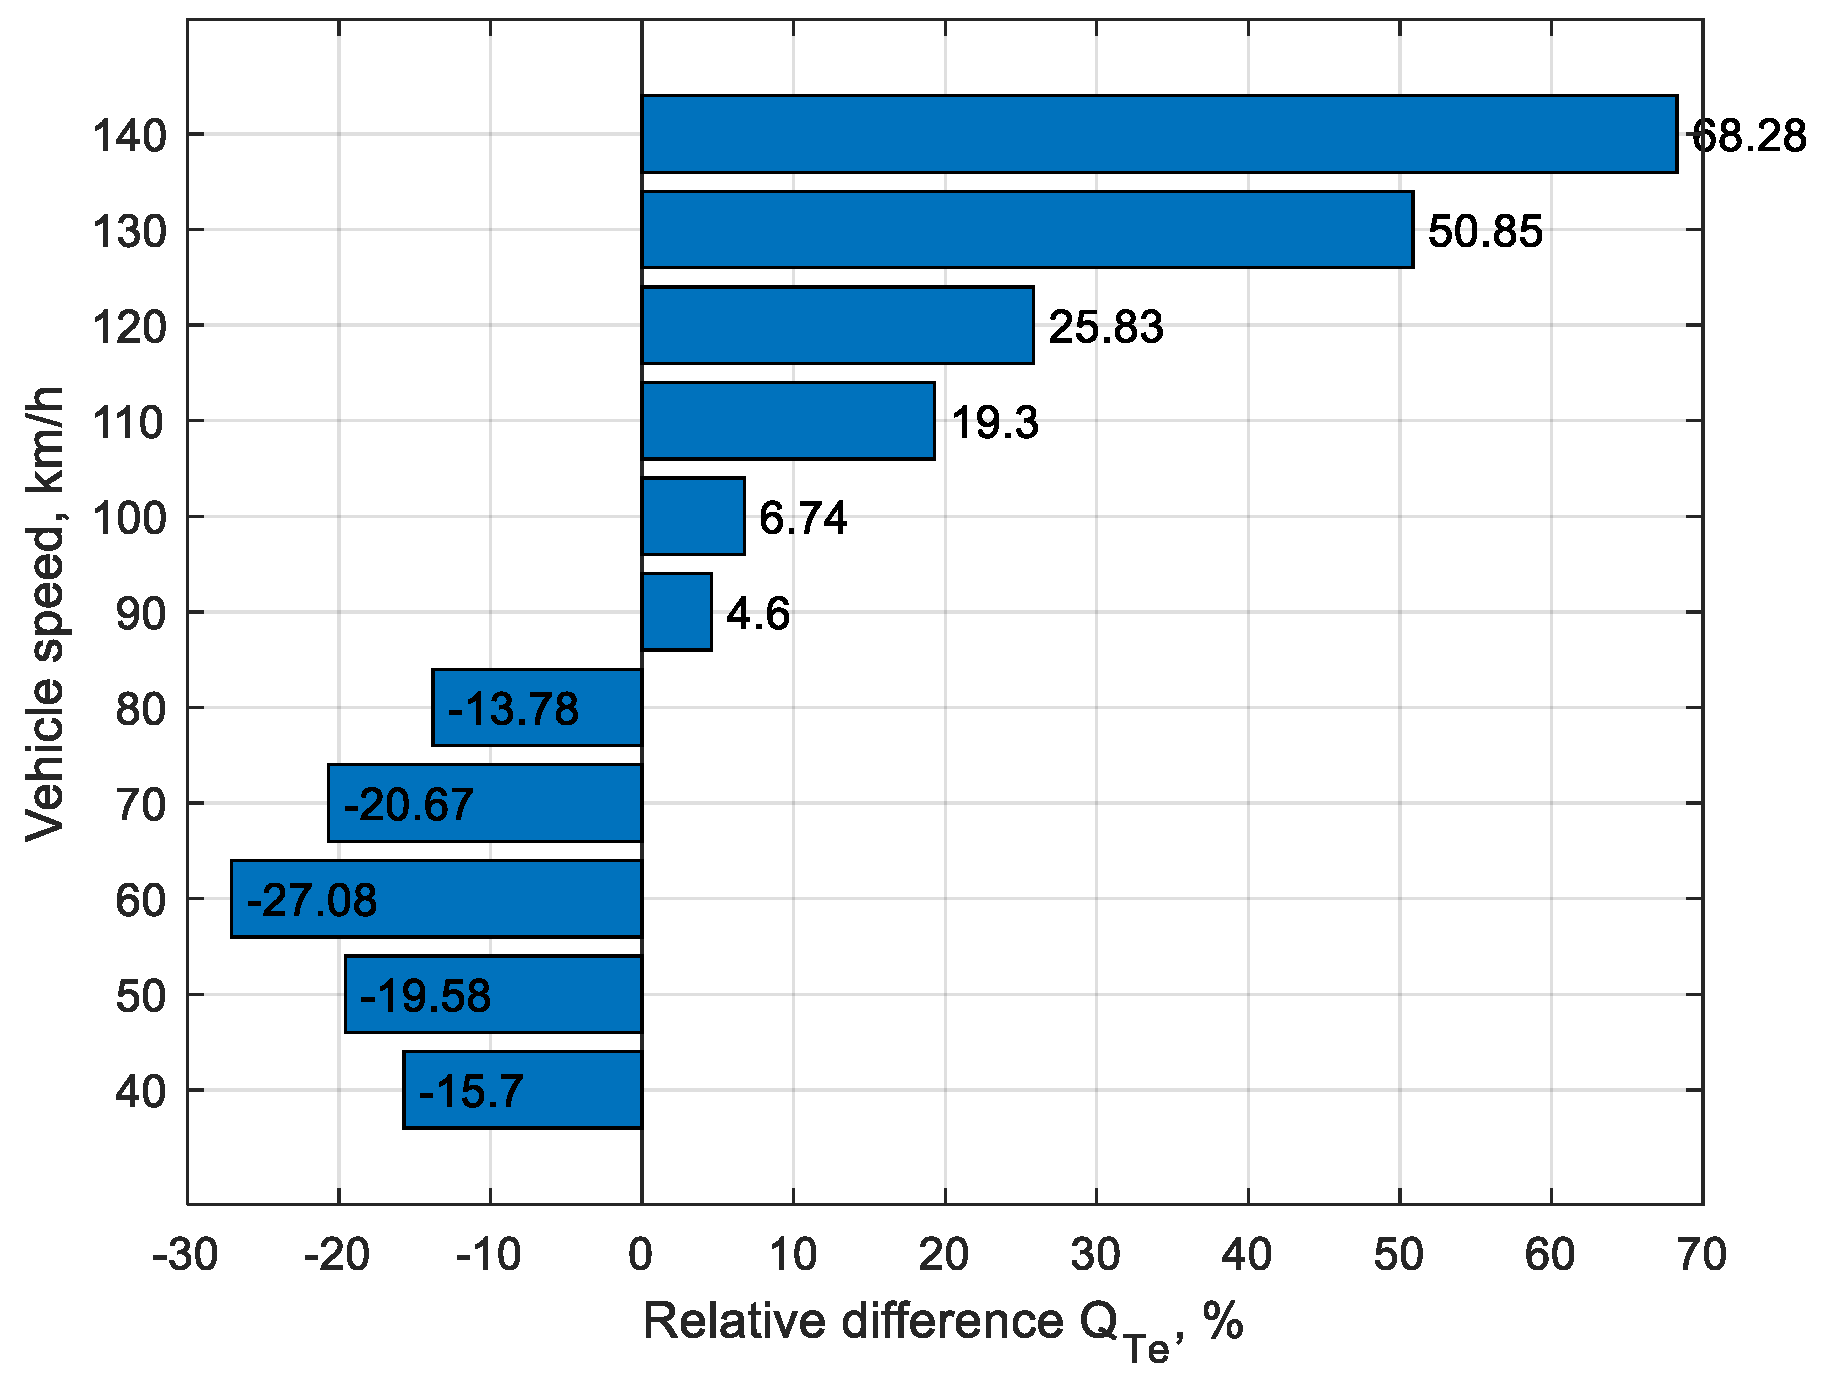
Figure 14.
Reduction in vehicle range relative to the WLTP estimated range.
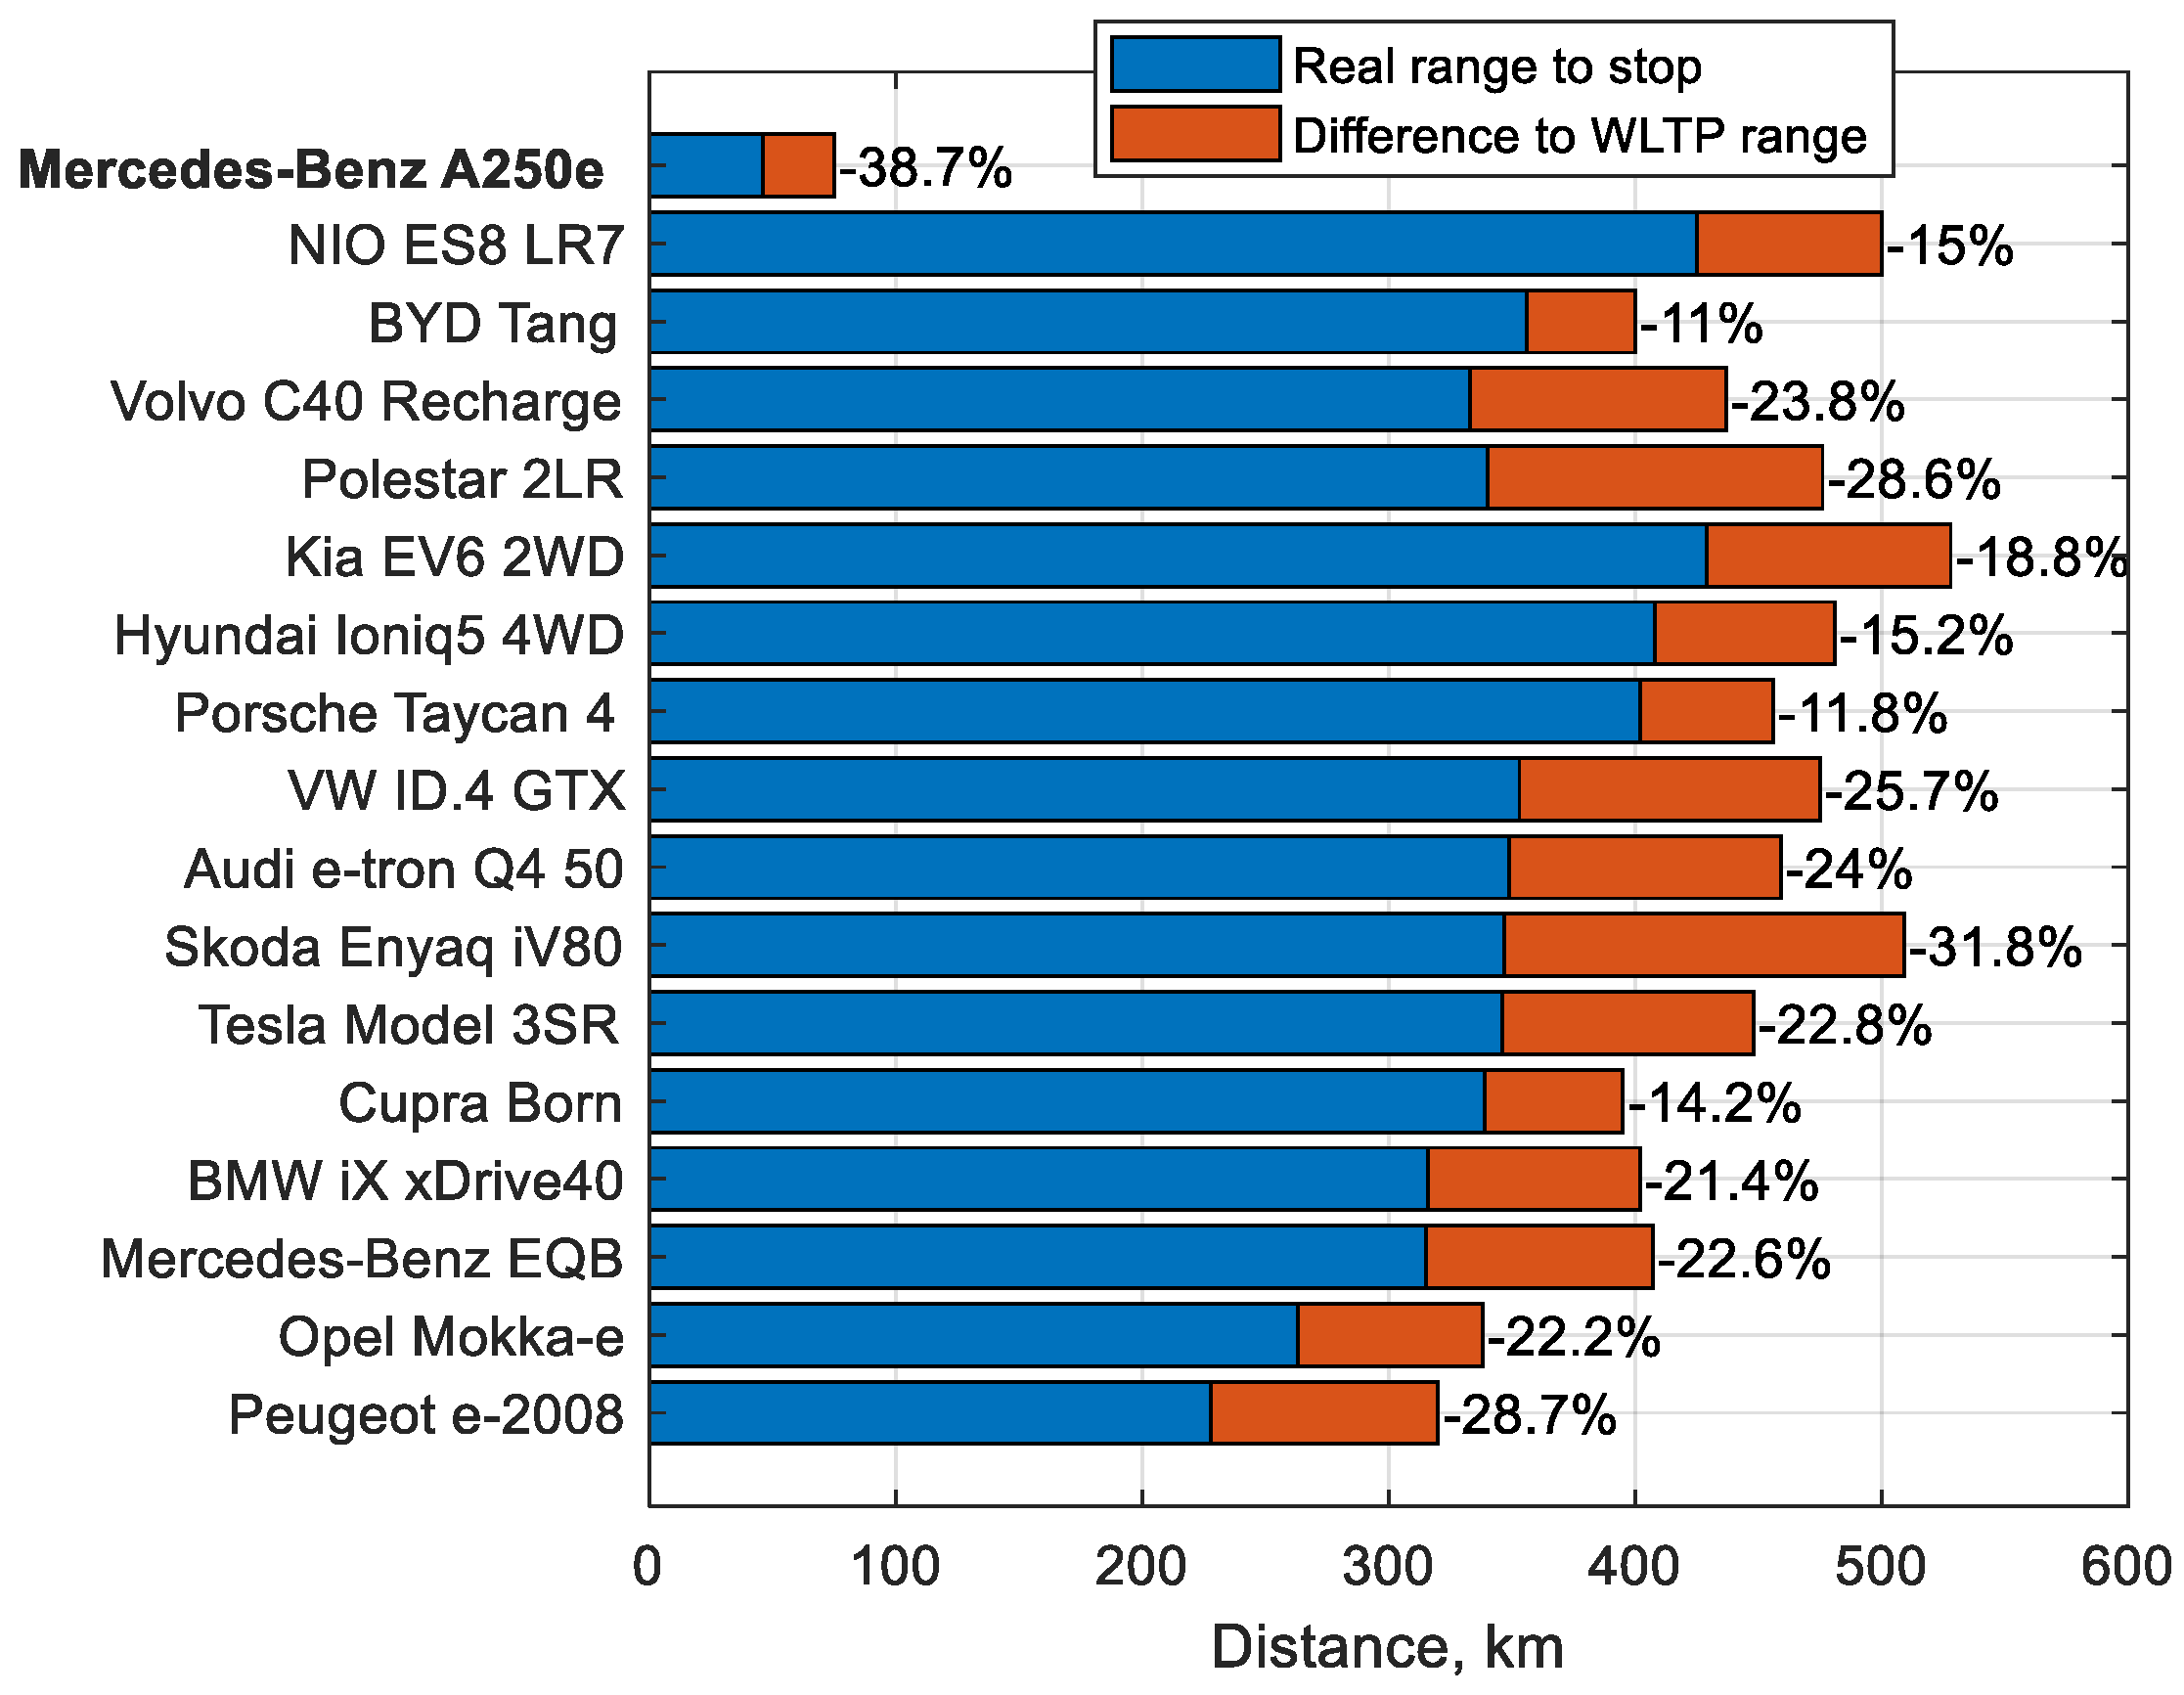
Figure 15.
Change in the test PEHV’s unit energy consumption index for a set speed and only using the electric engine: a) unit energy consumption index, b) percentage change in the electric engine.
Figure 15.
Change in the test PEHV’s unit energy consumption index for a set speed and only using the electric engine: a) unit energy consumption index, b) percentage change in the electric engine.
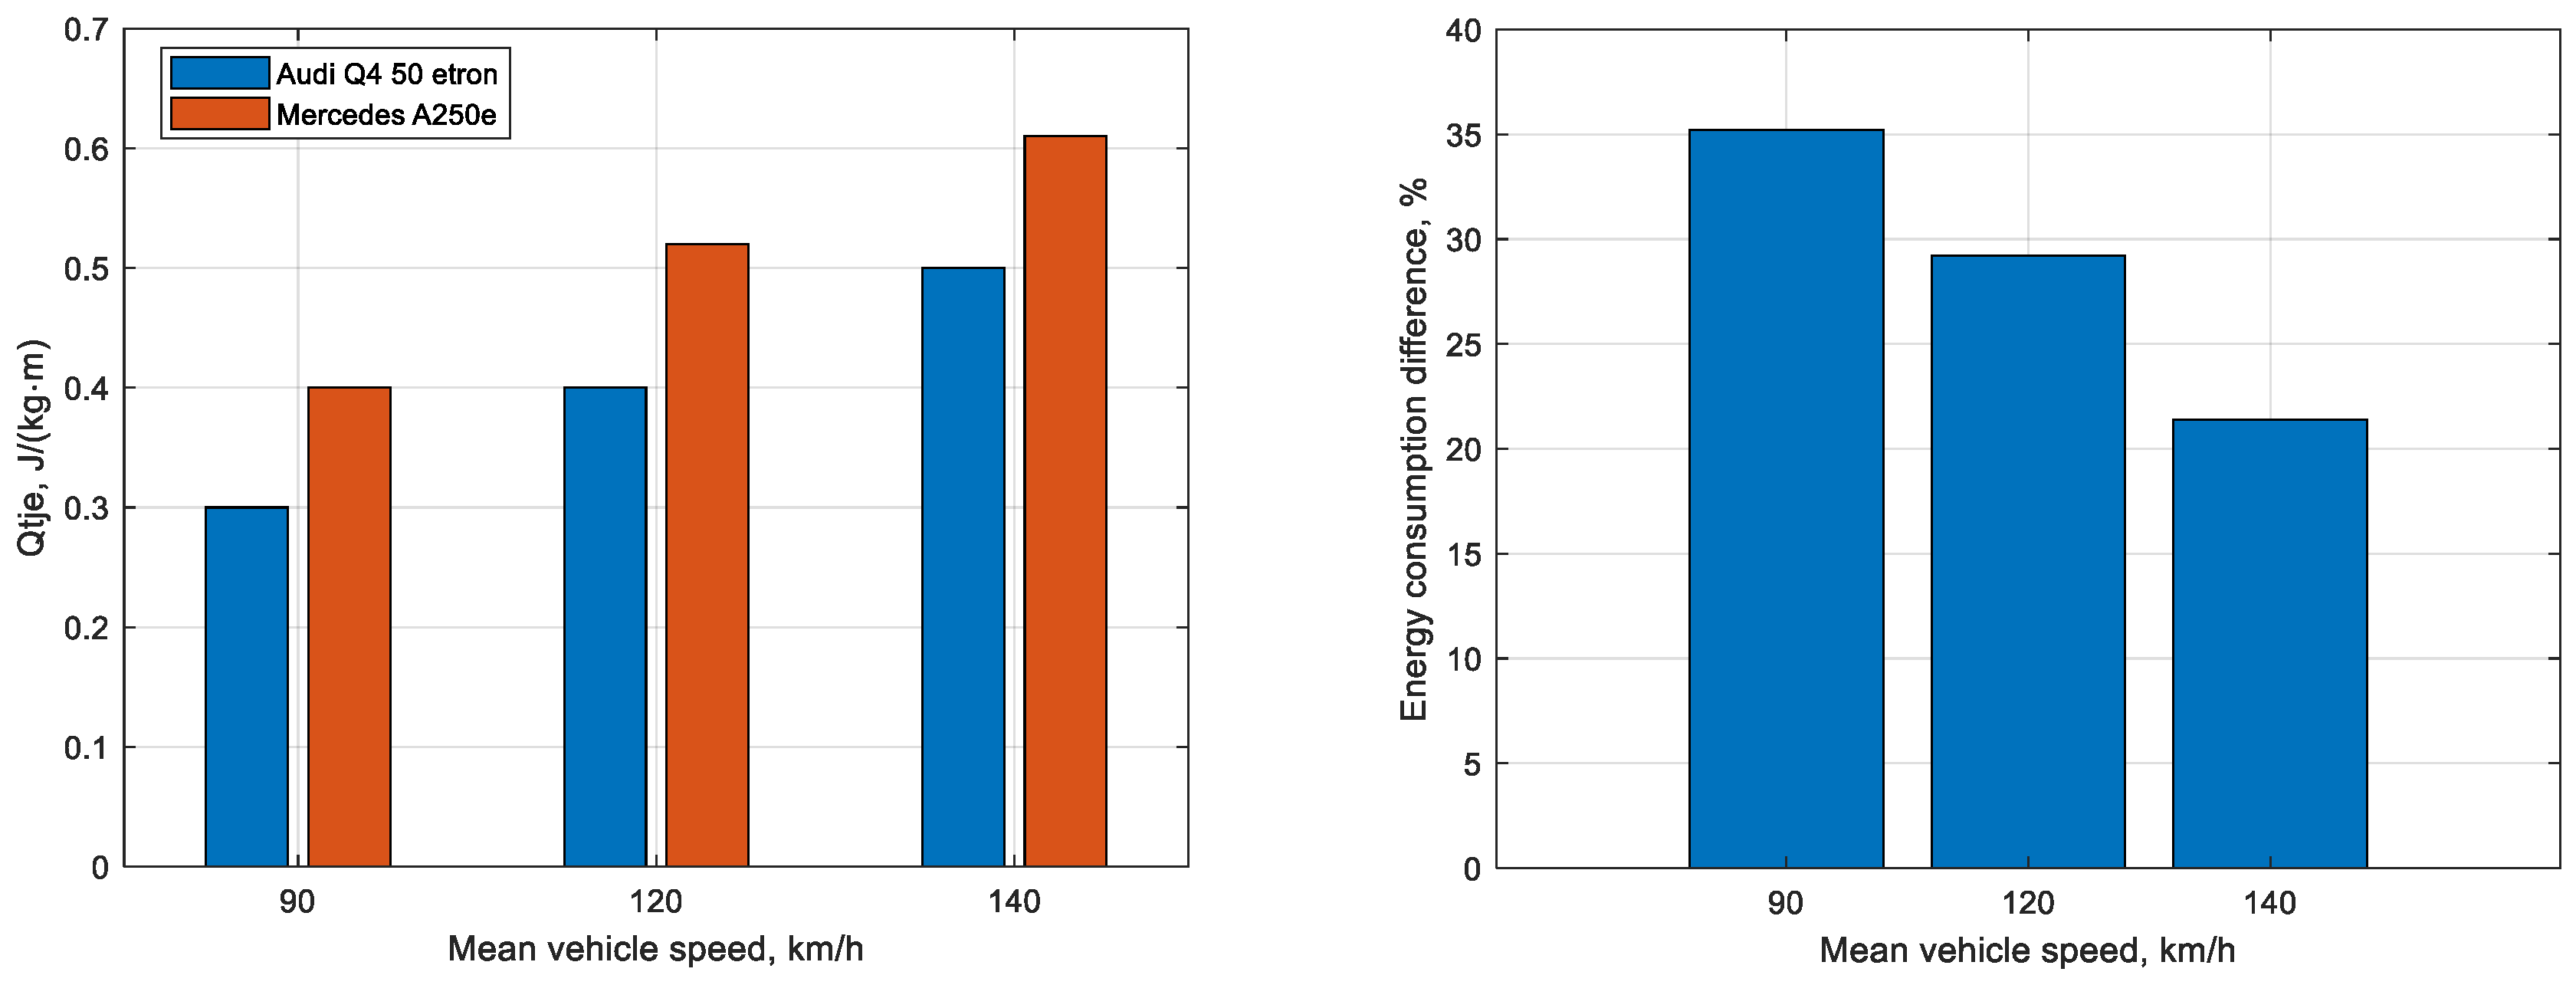

Table 1.
Audi Q4 Sportback 50 e-tron’s energy consumption during the road test.
| Test | Energy consumption [kW/h] | Difference relative to the WLTP test [%] |
|---|---|---|
| WLTP | 175 | - |
| Urban traffic (average speed of 22km/h) | 156 | -10.9 |
| Constant speed of 90 km/h | 184 | 5.1 |
| Constant speed of 120 km/h | 247 | 41.1 |
| Constant speed of 140 km/h | 308 | 76.0 |
Table 2.
Energy consumption for the Mercedes-Benz A250e during the road test.
| Test | Energy consumption kW/h |
Difference relative to the WLTP test % |
|---|---|---|
| WLTP | 209 | - |
| Urban traffic (average speed of 22km/h) | 179 | -13.78 |
| Constant speed of 90 km/h | 217.5 | 4.6 |
| Constant speed of 120 km/h | 261.7 | 25.8 |
| Constant speed of 140 km/h | 350.3 | 68.2 |
The differences between both vehicles are already significant in the WLTP cycle’s energy consumption and amount to 16%, and their energy demand at other speeds is also higher.
Table 3.
The test vehicle’s basic parameters.
| Manufacturer | Mercedes Benz |
| Model | A250e / V177 |
| Internal combustion engine displacement | 1332 cm3 |
| Internal combustion engine power | 118 kW at 5500 rpm |
| Internal combustion engine maximum torque | 210 Nm at 1750 rpm |
| Electric engine power | 75 kW |
| Long–lasting electric engine power | 55 kW |
| Electric engine maximum torque | 450 Nm |
| Drive unit’s installation location | At the front, transversely |
| Internal combustion engine supercharging | Turbocharger |
| Drive unit type | PHEV |
| Transmission | Automatic – 8 gears |
| Vehicle mass | 1817 kg |
| Emissions standard | Euro 6 (AP) |
| Gasoline range | 450 km |
| Battery range | 75 km |
| Average CO2 emissions according to WLTP | 23 g/km (1.0 dm3/100km) |
| EV system’s Energy consumption | 209 Wh/km |
| Battery capacity (electricity storage) | 15.6 kWh |
Table 4.
The drive unit’s average operating parameters during trips taken in every-day driving conditions.
Table 4.
The drive unit’s average operating parameters during trips taken in every-day driving conditions.
| Period/Season | LT, [km] | Le, [km] | tT [min] | V,[km/h]. | Qf [dm3/100km] | Qe [kWh/100km] | QTjp, [J/(kg m)] | QTje, [J/(kg m)] | QTj, [J/(kg m)] | Temp., [o C] |
| Winter (I) | 48.7 | 46.9 | 54.2 | 55.0 | 2.78 | 14.7 | 1.77 | 0.41 | 0.81 | 3.9 |
| Spring (II) | 48.2 | 47.3 | 48.2 | 57.8 | 1.22 | 16.6 | 1.57 | 0.38 | 0.55 | 11.5 |
| Summer (III) | 49.7 | 49.0 | 47.4 | 59.5 | 0.74 | 12.1 | 1.25 | 0.27 | 0.38 | 24.0 |
| Autumn (IV) | 50.5 | 46.2 | 72.2 | 47.9 | 1.77 | 13.3 | 1.53 | 0.35 | 0.61 | 7.5 |
| Year | 49.7 | 46.4 | 49.1 | 48.3 | 1.56 | 12.8 | 1.51 | 0.35 | 0.75 | 11.42 |
Disclaimer/Publisher’s Note: The statements, opinions and data contained in all publications are solely those of the individual author(s) and contributor(s) and not of MDPI and/or the editor(s). MDPI and/or the editor(s) disclaim responsibility for any injury to people or property resulting from any ideas, methods, instructions or products referred to in the content. |
© 2024 by the authors. Licensee MDPI, Basel, Switzerland. This article is an open access article distributed under the terms and conditions of the Creative Commons Attribution (CC BY) license (https://creativecommons.org/licenses/by/4.0/).
Copyright: This open access article is published under a Creative Commons CC BY 4.0 license, which permit the free download, distribution, and reuse, provided that the author and preprint are cited in any reuse.


